Preliminary Study of Olive-sided Flycatchers
37
Alaska Department of Fish and Game Division of Wildlife Conservation December 1997 Preliminary Study of Olive-sided Flycatchers John M. Wright Endangered Species Conservation Fund Federal Aid Studies SE-3-3, 4 and 5 If using information from this report, the reference may include the following: Wright, J.M. 1997. Preliminary study of olive-sided flycatchers, July 1994–April 1997. Alaska Department of Fish and Game. Final research report. Endangered species conservation fund federal aid studies SE-3-3, 4 and 5. Juneau, Alaska. 34 pp. 1 July 1994–24 April 1997 Final Research Performance Report
Transcript of Preliminary Study of Olive-sided Flycatchers

Alaska Department of Fish and Game Division of Wildlife Conservation
December 1997
Preliminary Study of Olive-sided Flycatchers
John M. Wright
Endangered Species Conservation FundFederal Aid Studies SE-3-3, 4 and 5
If using information from this report, the reference may include the following: Wright, J.M. 1997. Preliminary study of olive-sided flycatchers, July 1994–April 1997. Alaska Department of Fish and Game. Final research report. Endangered species conservation fund federal aid studies SE-3-3, 4 and 5.Juneau, Alaska. 34 pp.
1 July 1994–24 April 1997
Final Research Performance Report

i
RESEARCH FINAL REPORT
STATE: Alaska GRANT NO.: SE-3-3, SE-3-4, SE-3-5
COOPERATOR: Alaska Bird Observatory
PROJECT: Monitoring Neotropical Migratory Birds in Alaska
STUDY TITLE: Preliminary Study of Olive-Sided Flycatchers
AUTHOR: John M Wright
PERIOD: 1 July 1994-24 April 1997
SUMMARY
Singing behavior and breeding biology of olive-sided flycatchers (Contopus cooperi, recently changed from C. borealis) were studied in central Alaska from 1994 to 1996 to determine if the North American Breeding Bird Survey (BBS) and similar methods relying on detection of singing males were suitable monitoring tools. Counts of olive-sideds on individual BBS routes in Alaska vary markedly from year to year. Repeated counts on 2 routes exhibited extreme variation within 1 season. Singing rates were highest very early in the morning (0215-0330 h), then declined sharply and leveled off from 0530 through 1100 h. Males that paired sang at highest rates prior to arrival of females, low rates when pairing with females, moderate rates during incubation, and very low rates after hatching. Males that never paired sang consistently at high rates. Singing by males with failed nests was variable. Detection probabilities paralleled singing rates. Once most males arrived, around 1 June, the highest detection probabilities using 3-min listening intervals occurred in the first week of June. Five-minute intervals provided only marginally better results than 3-min intervals. Ten-minute listening intervals resulted in nearly as high detection probabilities in the second and fourth weeks of June as in the first week of June. The mean detection threshold distance for singing males was 624 m, much farther than previously reported for other passerines. Approximately 25% of males detected in late May/early June did not remain in place throughout the breeding season. In 1995, 3 of 9 territorial males did not attract a female; whereas in 1996 all 8 territorial males paired. Eight of 13 first nest attempts failed. Renesting occurred on half of the territories where first nests failed. Including first nest and renest attempts, young were fledged by 2 of 5 pairs in 1995, and 6 of 8 pairs in 1996. Three of 6 males and 2 of 3 females returned to the same territory in the year following color marking. Olive-sided territories averaged 18.4 ha (n = 16). Several males moved between 265 and 700 m to a second singing area within their territory after a first nest was established. Singing perches were prominent coniferous trees, averaging 1.4 times taller than surrounding canopy. Eighty-two percent of perches were partially or completely dead, only 18% were live trees. In contrast, nests were placed in coniferous trees that were shorter (0.9 times) than the surrounding canopy; 81% were live, 19% partially dead, and none completely dead. Territories were located in scattered

ii
woodland and open forests with ponds and streams and patches of marsh, meadow, and shrub. Surveys such as the BBS that rely on detection of singing males are generally well suited for the olive-sided flycatcher. Its distinctive song is performed loudly from prominent perches in open forest habitats, it sings at highest rates and most consistently early in the morning, and is unlikely to overload observers since it occurs at relatively low densities. However, to avoid double-counting observers should be aware of the great distances at which olive-sideds can be heard and the large size of their territories, and, if possible, schedule counts for the brief period after most males have arrived but before males pair with females. Stage of the breeding cycle and nest failures have a large effect on detectability.
Key words: breeding biology, Contopus borealis, C. cooperi, monitoring, olive-sided flycatcher, perch and nest sites, singing.
1
CONTENTS
SUMMARY......................................................................................................................... i BACKGROUND................................................................................................................. 1 OBJECTIVES ..................................................................................................................... 2 STUDY AREAS ................................................................................................................. 2 METHODS ......................................................................................................................... 2 RESULTS ........................................................................................................................... 4
VARIABILITY OF BREEDING BIRD SURVEYS IN ALASKA .................................................. 4 SINGING........................................................................................................................... 5
Daily Singing Pattern.............................................................................................. 5 Seasonal Timing ...................................................................................................... 5 Probability of Detection .......................................................................................... 6 Singing by Females ................................................................................................. 7 Other Vocalizations................................................................................................. 7 Detection Threshold Distances ............................................................................... 8
BREEDING ....................................................................................................................... 8 Establishment of Territories and Pairing ............................................................... 8 Nesting, Nest Success, Renesting, Nest Failures, Predators................................... 8 Site Fidelity ............................................................................................................. 9 Territory Dimensions and Nearest Neighbors ........................................................ 9
HABITAT........................................................................................................................ 10 Perch and Nest Trees ............................................................................................ 10 Perch, Nest, and Random Sites ............................................................................. 10 General Habitat Description................................................................................. 11
DISCUSSION ................................................................................................................... 11 CONCLUSIONS AND RECOMMENDATIONS............................................................ 15 ACKNOWLEDGMENTS................................................................................................. 16 LITERATURE CITED...................................................................................................... 16 FIGURES ............................................................................................................................. 21 TABLES .............................................................................................................................. 25 APPENDIX........................................................................................................................... 34
BACKGROUND
Declining populations of migrant landbirds breeding in the United States are a major concern of ornithologists and conservationists (e.g., Robbins et al. 1989; Terborgh 1989; Askins et al. 1990; Hagan and Johnston 1992). Among the species undergoing the largest declines are North American breeders wintering in Central and South America (i.e., neotropical migrants), including flycatchers, thrushes, vireos, and wood warblers (Finch 1991; Sauer and Droege 1992).
The olive-sided flycatcher (Contopus cooperi, recently changed from C. borealis; Banks and Browning 1995) is 1 of the neotropical migrants with a well-documented decline in numbers, consistent through the 30 years of the North American Breeding Bird Survey (BBS) and across its broad breeding distribution (Sauer et al. 1997). This species is recognized by US Fish and Wildlife Service (FWS) as a national Species of Management Concern (FWS

2
1995) and by the Alaska Department of Fish and Game as a Species of Special Concern. It was also included on the Category 2 candidate list of Federal Endangered Species until that category was eliminated. Although the olive-sided flycatcher is a conspicuous component of boreal and montane coniferous forests throughout North America, only anecdotal information on its basic biology is available.
Initiated in 1965, the BBS is the primary method of monitoring landbirds in North America. By 1995 more than 3000 routes were surveyed. In Alaska a few routes were surveyed in the late 1960s and 1970s, but it was not until 1982 that 25 or more routes were surveyed. With the growth of the Partners in Flight program in the early 1990s, the number of routes surveyed in Alaska increased to more than 70.
Many factors may influence BBS counts, including observer ability, survey date (any day within a 20- to 30-day count period is allowed), weather conditions, habitat change, road traffic levels, and noise. Singing behavior and other characteristics of individual bird species also affect detectability. The seasonal timing of arrival and singing, daily singing patterns, loudness and uniqueness of song, prominence of singing perches, size of breeding territory, vegetation structure, and other factors all influence detectability and the utility of survey methods reliant on detection of vocal signals, such as the BBS and off-road point counts.
OBJECTIVES
• Assess factors influencing the effectiveness of the North American BBS as a method to monitor olive-sided flycatcher populations.
• Gather natural history information including breeding biology, chronology, and habitat.
STUDY AREAS
Olive-sided flycatchers were studied near Fairbanks (64°50´N, 147°44´W; elevation 120–245 m) and Glennallen (Sourdough, 62°30´N, 145°30´W; elevation 425–760 m). Study areas were in the boreal forest, or taiga, that forms an extensive vegetation zone between the coastal forest and Arctic lowland tundra. Black and white spruce (Picea mariana and P. glauca) are the dominant trees of the forests and woodlands, but stands of deciduous trees (e.g., paper birch [Betula papyrifera], aspen [Populus tremuloides], and balsam poplar [P. balsamifera]) and mixed coniferous/deciduous stands are common. Intermixed with the forests are bogs, meadows and shrub thickets, often forming a complex mosaic of successional communities. The vegetation and ecology of the boreal forest are described in Viereck et al. (1992), Van Cleve et al. (1983), and Mann et al. (1995). Creamer’s Field Migratory Waterfowl Refuge in Fairbanks, where several olive-sided territories were studied from 1994 to 1996, is described in detail by Spindler (1976).
METHODS
We examined existing BBS data from Alaska to determine yearly variability of counts of olive-sided flycatchers. Routes were selected for this analysis if they had been run consistently for several years and annual counts of olive-sideds averaged 2/route or more. In 1994 we
3
repeatedly surveyed 2 established BBS routes near Glennallen to determine the seasonal variability of detection of olive-sided flycatchers. The Sourdough and Chistochina routes were each run 7 times between 18 May and 30 June.
In 1994 and 1995, singing rates were measured by following males continuously for up to 5 h and recording the number of songs given each minute. We rotated our observations of individual males to provide coverage about once each 3 to 4 days during the normal survey time period of 0300–0900 h, plus some additional coverage later in the day. In 1996 a limited number of singing rates were recorded in 10-min periods, randomly selected while we visited territories to monitor breeding activity. Information was also recorded on calls and other vocalizations; singing perch site; feeding; interactions with females, other males and other birds; weather; and other observations. Singing data were examined by date, time of day, breeding status, and stage of the breeding cycle for paired males. We also examined all singing data collected during the normal morning survey period to estimate the probability of detection (i.e., the proportion of listening intervals in which at least 1 song was produced). The probability of detecting singing males was calculated by dividing the number of 3- , 5- or 10-min intervals (corresponding to BBS and off-road point count data collection periods) when no songs were performed by the total possible number of intervals within each singing-rate observation period, and subtracting from 1. We used stepped, overlapping intervals, like those in moving averages. For example, in a 12-min block, there would be 10 3-min intervals, 8 5-min intervals, or 3 10-min intervals. In a 60-min observation period and using 3-min intervals, if there were silent blocks of 4, 6, and 9 minutes, the detection probability would be: 1-{(2+4+7)/58} = 0.78.
Detection threshold distances were determined by 1 person maintaining visual contact with a singing male while 2 “detectors” walked directly away from the singing bird, stopping each 25 to 50 m to listen as necessary (Emlen and DeJong 1981). When they reached the distance where they could no longer hear the singing bird, they back-tracked slowly until it was audible. The 2 parties communicated via radio to ensure the male was still singing from the initial site when the detectors reached their maximum detection distance. Trials were only conducted when winds were less than 3 knots and there was no precipitation. Road and other background noise was evident at most sites, and in 1 trial a 4-lane highway was crossed. Distances were measured with a 100 m tape.
We captured adults in mist nets, attracting them by playing tape recordings of olive-sided flycatcher songs and calls, and occasionally also displaying an olive-sided flycatcher wooden decoy, or by playing gray jay (scientific names of birds in Appendix A) calls and displaying a gray jay mount. Captured adults were weighed, measured, and leg-banded with FWS aluminum bands and unique combinations of colored bands. Nestlings were banded with FWS aluminum bands.
General descriptions of habitats follow the classifications of Kessel (1979) and Viereck et al. (1992). To describe the bird community with which olive-sideds were associated, on each visit to a territory, we noted the presence of other bird species incidentally to our other activities.
4
Primary singing perches (2 to 3 per territory) used by males early in the season for 10 minutes or more without interruption, or returned to 3 times during an observation period, were marked with flagging tape and revisited later to collect vegetation information. Nests were located by closely observing females and males. They were monitored every 2 to 6 days to determine clutch size, hatching date, fledging date, or other fate. To lessen the chance of causing nest failures, we usually observed the nest from a distance to determine if the female was incubating or brooding, or to note young in the nest or adults feeding young (Martin and Conway 1994). When checking nest contents, a mirror on a telescoping fiberglass pole was used, but occasionally it was necessary to use a ladder in addition to the mirror-pole. To correct for bias caused by finding nests at various stages of development, we calculated nest success using Mayfield’s method (1975). Locations of olive-sideds were marked on 1:12,000 scale aerial photos throughout the field season to delineate “territories.” At the end of the season, polygons encompassing all perch sites and nest sites of a pair were drawn by hand. This “territory” was transferred to 1:25,000 scale topographic maps and digitized to determine the area. Distances between nests and perches were measured directly from the aerial photos.
Detailed vegetation data were collected at primary perches, nests and at random “non-nest” trees following the BBIRD field protocol (Martin and Conway 1994) with a few changes. Random sites were located 50 m in a random direction from the nest tree, and centered on the nearest tree similar to a nest tree. In a 5-m-radius plot centered on the perch, nest, or random tree, we estimated ground cover (< 50 cm tall) and noted dominant species, counting shrub (50–140 cm tall) stems for each species. Within an 11.3-m-radius plot, we counted trees (> 140 cm tall) by species and snags in 3 diameter classes (< 8 cm, 8–23 cm, >23). The height and diameter of the tallest tree in each of the 4 quadrants of the 11.3-m circle was measured and species recorded to describe canopy height. Canopy cover was measured with a densiometer in each of the 4 cardinal directions facing away from the perch, nest or random tree. The number of downed dead trees (>8 cm) was counted along 2 22.5-m-transects centered at the perch, nest or random tree. For each perch and nest tree, we recorded the tree species, height, diameter, and if the tree was live, live with dead top, or dead. At nests we recorded the height of the nest, distance of nest from trunk, overall length of nest branch, diameter of nest branch at base, and percent cover over nest.
RESULTS
VARIABILITY OF BREEDING BIRD SURVEYS IN ALASKA Counts of olive-sideds on most Alaska BBS routes were highly variable (Table 1). Nearly 75% of the routes had coefficients of variation (CV; i.e., s / x ) greater than 50%. On 9 central bioregerion routes the average CV was 67%, in southcoastal the CVs on 3 routes averaged 59%, and in southeast 3 routes averaged 56%. Counts on individual routes frequently ranged from a minimum of 0 to 2 to a maximum of 6 to 12 or more.
In 1994 detections of olive-sideds were extremely variable during repeated surveys of the 2 BBS routes near Glennallen, ranging from 0 to 11 on the Sourdough route and 1 to 4 at Chistochina (Table 2). The highest count at Sourdough was recorded on 8 June and at Chistochina on 25 May. On 11 and 12 June 1994 the 2 routes were surveyed by the observer who had regularly surveyed them in previous years; 10 olive-sideds were detected on the
5
Sourdough route and 4 on the Chistochina route (T Doyle, FWS, Tetlin NWR, pers commun). Over 7 years the mean number of olive-sideds counted on the Sourdough route was 8.0 (s = 4.1; CV = 51%; range 1-14), and in 6 years on the Chistochina route the mean was 4.7 olive-sideds (s = 3.7; CV = 79%; range 0-11).
SINGING In 1995-1996 we gathered detailed information on singing rates and seasonal activities at 14 locations where olive-sideds were found in the Fairbanks area. Some additional information was collected in 1994 at 6 sites near Glennallen and 3 sites near Fairbanks. In 1994 we visited those 9 olive-sided flycatcher territories 36 times for 108 hours of observation. In 1995 we made 147 visits to territories in the Fairbanks area for 347 hours; in 1996 we made 225 visits totaling 317 hours. Unlike most other passerine studies where information on 10-30 territories is collected at a single site, we commonly commuted by vehicle 5-15 km and then 1–3 km on foot to reach a single olive-sided flycatcher territory. In our study we found 2 territories abutting one another at just 3 locations.
Daily Singing Pattern
Over the period of 25 May to 4 July, olive-sided flycatchers sang at very high rates (average >8 songs/min) from 0215–0315 h, decreasing rapidly to an average of approximately 2 songs/min or less by 0515 h, and then from 1.1 to 1.9 songs/min from 0815–1645 h (Fig 1). The proportion of silent 1-min observation periods increased rapidly from less than 0.1 at 0245 h to 0.35 by 0345 h, and then fluctuated between 0.4–0.6 from 0445 to 1645 h (sunrise in Fairbanks: 25 May, 0354 h; 1 June, 0333 h; 7 June, 0317 h; 14 June, 0303 h; 21 June, 0259 h; 30 June, 0311 h).
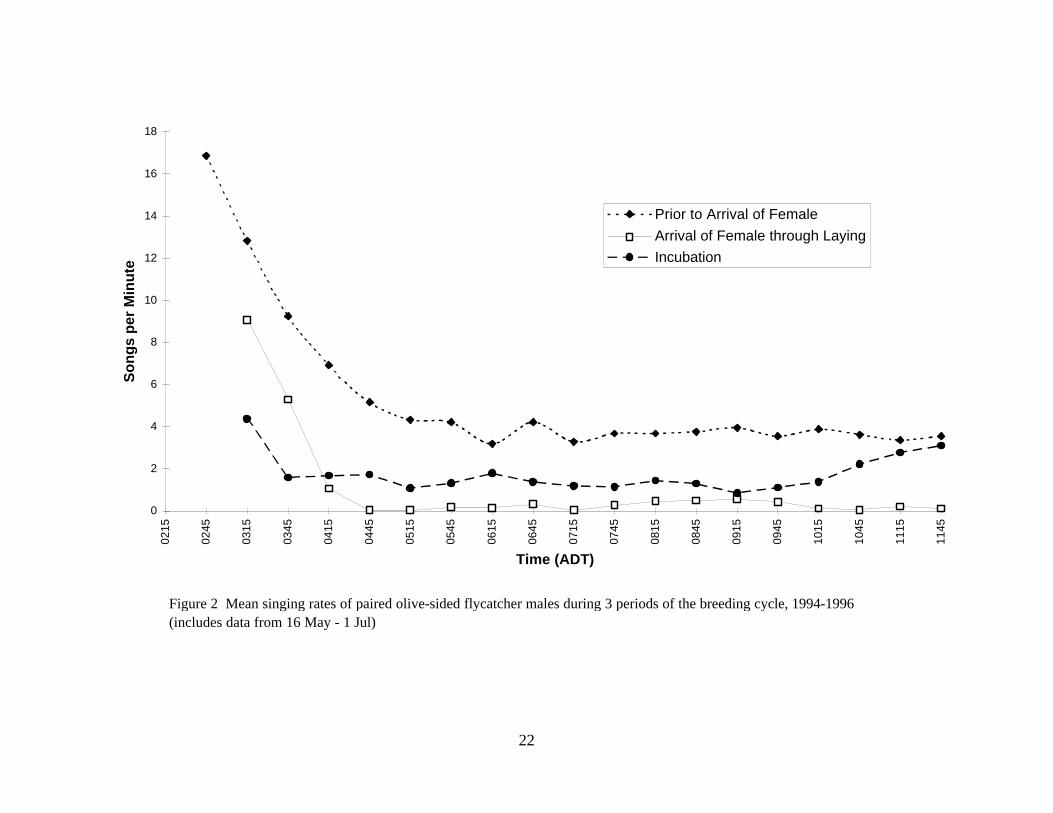
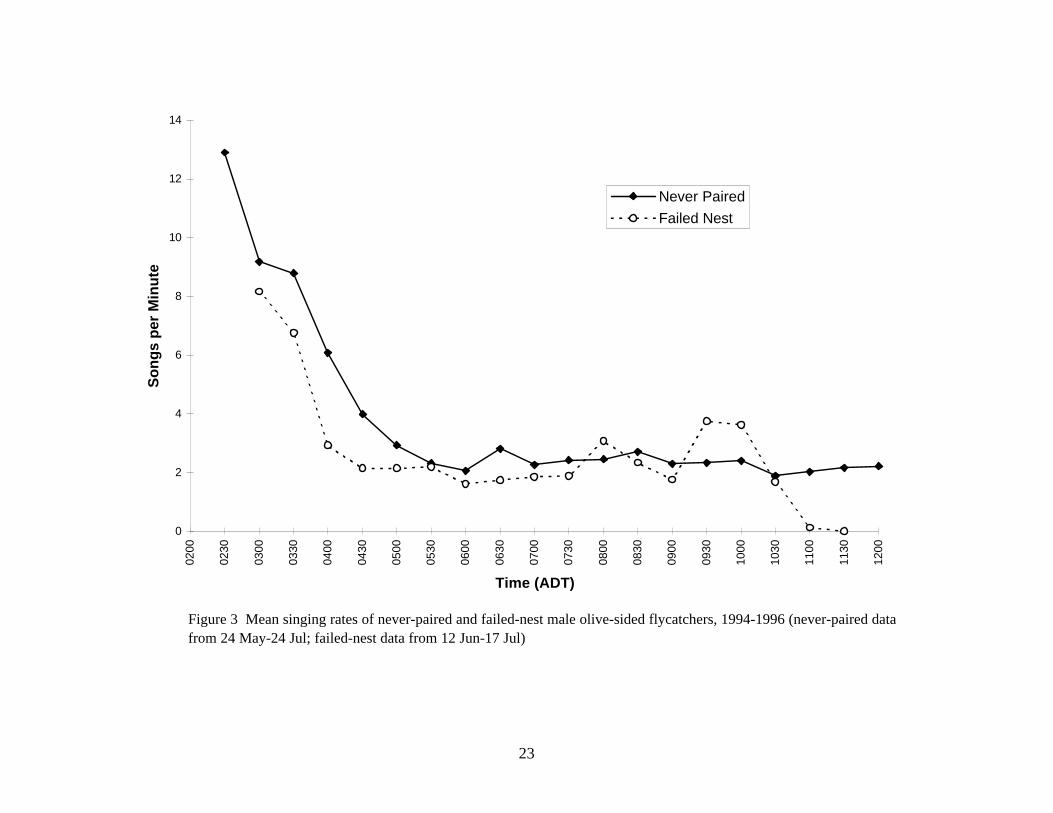
Among paired males during 3 stages of the breeding cycle (Fig 2), the same pattern was observed: highest rates in very early morning, rapidly declining, and then a relatively consistent rate from 0400–0500 h through midday. Singing by failed-nest and never-paired males followed the same general daily pattern (Fig 3), though singing by failed males was more variable.
Seasonal Timing
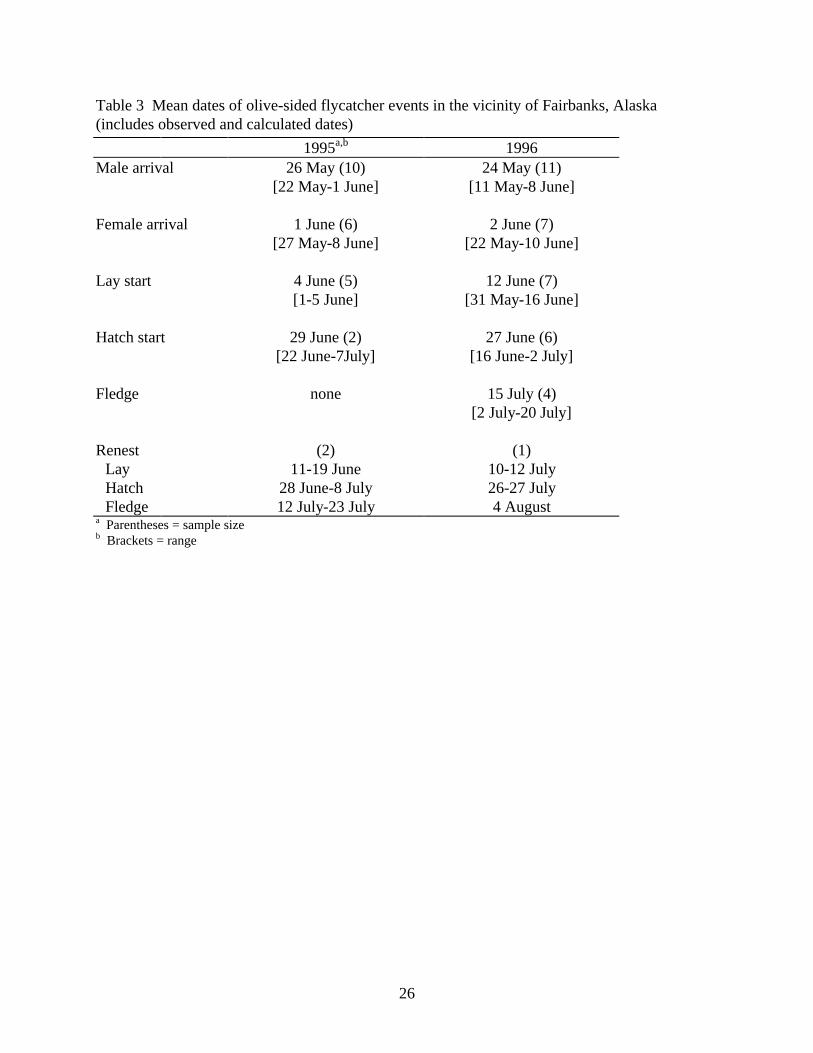
In Fairbanks the mean arrival date for males was 24-26 May (Table 3), with nearly all males arriving before the first of June. The arrival dates for 1996 are most accurate because we began checking previous years’ territories early in the season before the return of most males. In 1995 we were familiar with only 3 of the territories from experience in 1994 (mean arrival date of those 3 was 24 May 1995). In most cases the presence of arriving males was detected by hearing their songs, and males generally sang regularly from first detection. However, in a few cases, birds were found visually or by hearing just a few songs, and were not heard singing regularly until 6 or more days later.
Females generally arrived 7 to 9 days after males (n = 11, range = 1–24), and laying started 9 to 10 days later (n = 9, range = 6–14). We assumed laying of first clutches took 4 days (10 first clutches, all 4 eggs; 2 of 3 renests were 3-egg clutches, the third 4 eggs). In 2 cases incubation lasted 15 days from day last egg was laid to day last egg hatched, and was either 15

6
or 16 days in 2 other cases. Hatching usually occurred over a 2-day period (n = 6). Young fledged 19-20 days after hatching of first egg (n = 2; 4 other clutches successfully fledged at least 15 to 17 days after first hatch, but exact dates were unknown or observers precipitated premature fledging).
Territorial males sang regularly until they attracted a female (Fig 2 and 4). Singing decreased dramatically from the arrival of the female, through nest building to egg laying. During egg laying or at the start of incubation, males resumed singing, sometimes at a new location 265 to 700 m from the first nest. After eggs hatched males sang very rarely as they shared the duties of caring for the young with the female.
If a nest failed, males either reduced their singing rate while the female began searching for a new nest site and building a second nest or resumed singing if their mate departed. Males that never attracted a female sang regularly through June and into July (Fig 4).
Probability of Detection
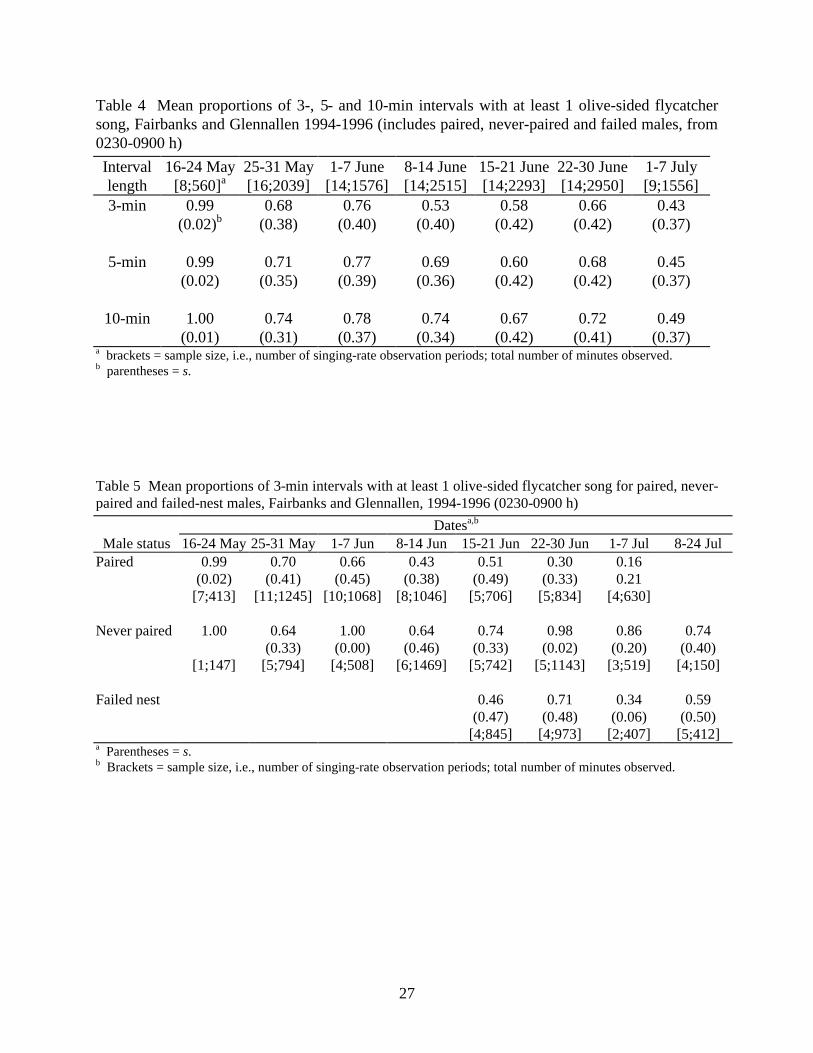
Three minutes is the standard listening interval for BBS stops, and 5- and 10-min intervals are standard for point counts. The probability of an olive-sided flycatcher singing at least once in those time intervals by date of season is presented in Table 4. The proportion of 3-min intervals with at least 1 song was 0.76 in the first week of June, declined to 0.53-0.58 in mid June, increased in late June to 0.66, and then declined to 0.43 in the first week of July.
Using a 5-min listening interval resulted in only marginal improvements (0% to 4%) over the 3-min interval, except in the second week of June when 0.69 of the 5-min intervals included at least 1 song, a 30% increase over the 3-min interval. With 10-min intervals, detectability exceeded 67% throughout May and June. The greatest improvement was in the second and third weeks of June; 16–40% higher than 3-min counts for those 2 weeks. In the rest of May and June, 10-min intervals resulted in increases of only 1–9%.
The mating status of the male had a marked effect on its detectability (Table 5). From the start of June onward, paired males were less likely to be detected than males that never paired. Never-paired males maintained a high probability of detection, though detection values dipped as low as 0.64 in the last week of May and second week of June, when some seemed to be influenced by females passing through their territories or pairing with males on nearby territories.
Males with failed nests had a greater probability of being detected than paired males, except in the third week in June (the first period with failed nesters) when their detectability was comparable to paired males (Table 5). Failed-nest males had a lower probability of detection than never-paired males. Singing by failed males was variable; some remained attached with their mates and sang infrequently in the pattern of males who had just paired with a female, while others did not retain their mates and sang at high rates like males who never paired.
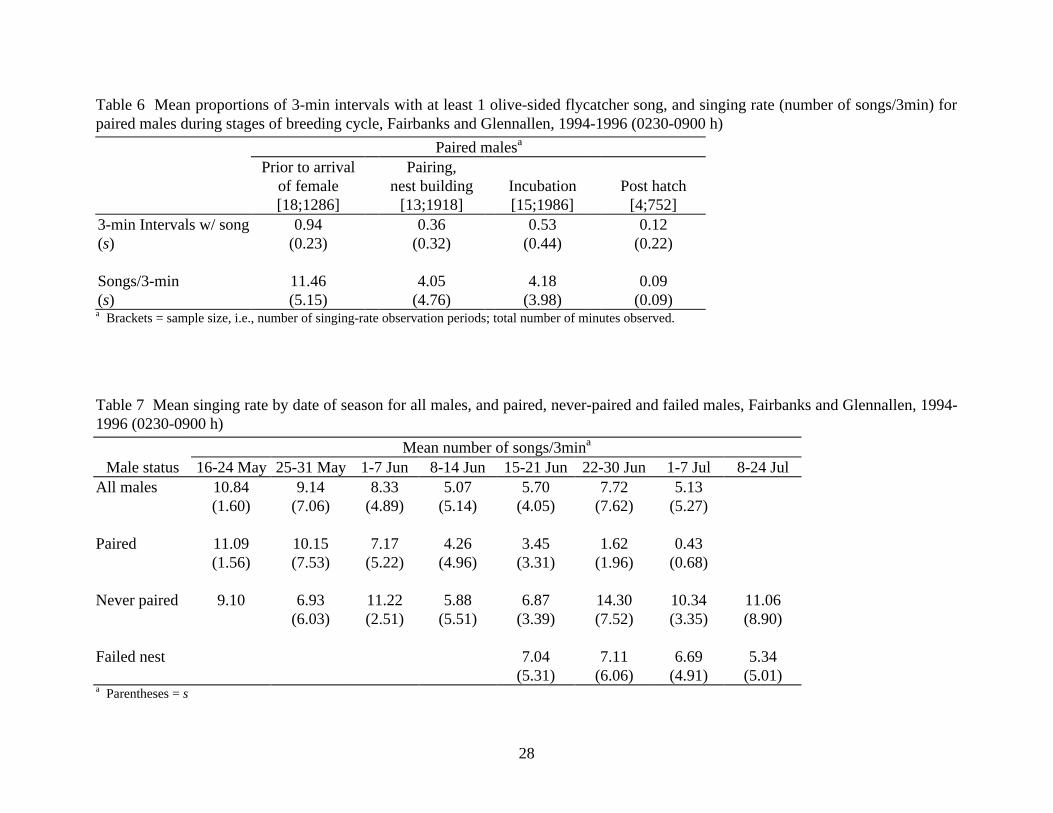
The probability of detection of paired males varied in the 4 stages of the breeding cycle (Table 6). With the arrival of the female on territory, detectability declined from 94–36%. During incubation, males sang more regularly with detectability increasing to 53%, but once young hatched detectability dropped to 12%.

7
Because breeding activities of individual males were not synchronized, this bimodal pattern is not as clear when examined by date (“paired” in Table 5) as when examined by stage of breeding cycle (Table 6). Arrival of females, a key factor in male singing behavior, spanned a 13-day period (27 May–8 Jun) in 1995 and a 20-day period (22 May–10 Jun) in 1996. Nest failures and renesting attempts also muddled the picture.
The number of songs produced in 3-min intervals by olive-sided flycatchers ranged from 0.1 to 11 during through the season (Tables 6 and 7). Paired birds sang at high rates (10 to 11 songs/3min) in late May before the arrival of many females, and then singing rates declined through the season to just 0.4 by the first week of July. However, only in the last week of June and first week of July did paired males average less than 2 songs/3-min interval. Males that never paired sang at rates of 5.9–14.3/3min from late May through mid July. Males whose first nest failed sang an average of 5.3–7.1 songs/3min from mid June to mid July.
Singing by Females
On 7 occasions in 1995–1996 while we were watching paired birds and were quite sure which was the male and female, we heard the female sing. On 1 occasion, the male was color-marked and we noted the unmarked bird gave 6 oddly slurred songs within about 3 minutes. Most of the songs we attributed to females were noted as “soft,” “lazy,” “garbled,” or “slurred.” They were most often performed close to the nest, when the female was agitated by the proximity of the male, or by us, and were associated with other signs of agitation, such as bill snapping, chasing, and calling. Six of the 7 occasions were between 7–12 June, between nest construction and completion of laying. The seventh observation was on 27 June when a pair was still attached within days after losing their first clutch at time of hatching. All observations were between 0600–1000 h, except 1 at 1300 h.
Other Vocalizations
The common call note of the olive-sided flycatcher is a “pip” or “pilt,” usually uttered in quick series of 3 notes, or less commonly 2. Both males and females pip. When females arrived and paired with a male, a regular chatter of soft pips was the most common vocalization heard. Females pipped as they moved about the territory, and males dramatically curtailed their song output. Once the clutch neared completion, the male normally resumed singing and the female incubated in silence. Olive-sideds also pipped when they were concerned, often around their nest or young. The intensity and frequency of pipping increased with the concern of the adult. Very agitated birds incessantly uttered loud, strident pips. If an observer is familiar with this call, it is useful in detecting olive-sideds, but it usually does not carry as far and is not as distinctive as the song.
Olive-sideds also uttered a throaty, growling “churr” or “purr” when agitated, often in association with male-female chases and other agonistic encounters. Other vocalizations were given uncommonly, including modified songs, combined calls (“purr-pip,” “pree-up”), and throaty “chortles.” Fledglings attempted songs with wheezy “dee deer”s and “pheww beer”s, and occasionally called “wheet.”
Two males consistently sang aberrant songs. One regularly uttered a 4-note song, as well as the normal 3-note song (“quick, 3 beers”). In its 4-note version, it added a second introductory

8
note (“quick quick”) before the final 2-note “3 beers.” This male sang in the same area from late May through mid July 1995, but never attracted a mate. The second male slurred and drew out the first note (“quick”) before finishing with the normal “3 beers.” This male was first heard on 9 July 1996 adjacent to a territory with nestlings. It consistently sang its unusual song through 24 July but was never seen in association with another olive-sided other than the pair from the neighboring territory.
Detection Threshold Distances and Observer Variation
Two field assistants (ages 28 and 34 yrs) on this project were able to hear olive-sideds singing at an average distance of 654 m (n = 6 trials on separate dates with 2 detectors together, on 4 different territories; s = 159; range = 504–828). All trials were in open coniferous forest or woodland habitats in nearly level terrain. We assumed the 2 detectors would not have equal abilities, but in each of the trials they reported nearly identical maximum detection distance. Therefore the 2 observers are treated as 1 in the results reported here.
In less rigorous measurements, such as noting when a steadily singing bird was first heard and pacing in to find it (with no assurance the bird had not moved), the author (age 48, with known hearing loss) estimated he detected singing males at ranges of 340 to 460 m on 4 occasions.
BREEDING Establishment of Territories and Pairing
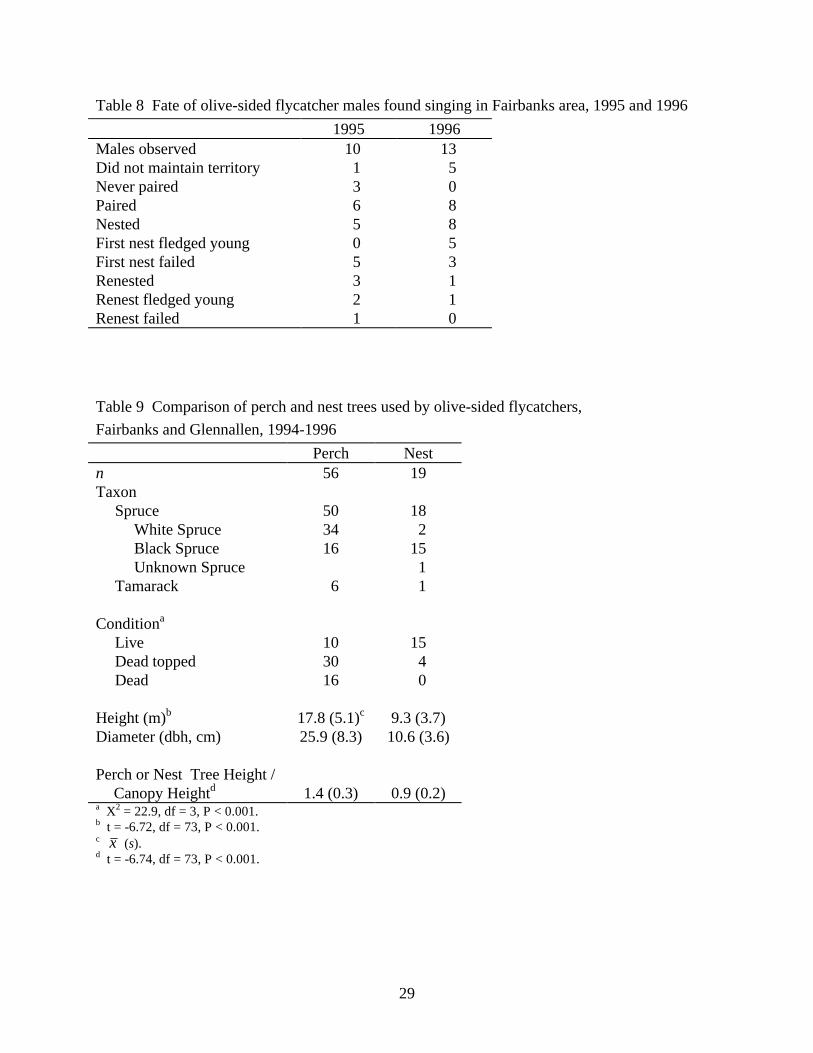
Detection of a male in May or June did not guarantee a territory had been established for the nesting season, and not all males remained in areas where they were first detected. Some males were detected singing on 1 to 2 dates in late May and early June, but were never found again at that location (Table 8). This occurred once in 1995, 3 times in 1996 near Fairbanks, and on several occasions in 1994 on the Sourdough and Chistochina BBS routes. Two other Fairbanks locations known as territories in 1995 were regularly examined from May through June 1996, but males were only detected singing once in mid June. Some territories were established late in the season, where no singing males were detected in May or early June. In 1996 at 2 locations where territories were known from previous years, no males were detected until 6 June and 2 July (though we visited the sites repeatedly in May and June); they eventually paired and fledged young. Overall, combining information from 1995 and 1996, of 23 males detected near Fairbanks, 6 (26%) were only found 1 to 2 times and did not maintain a territory through the breeding season. The remaining 17 (74%) were regularly found in the area where they were first detected.
Of the 17 males that maintained territories in 1995-1996, 3 (18%) never attracted a mate (Table 8). All of the failures to pair with a female were observed in 1995.
Nesting, Nest Success, Renesting, Nest Failures, Predators
Only 1 of 14 pairs observed in 1995-1996 failed to complete a nest and initiate laying (Table 8). Including first nest and renest attempts, young were fledged by 2 of 5 pairs in 1995, and 6 of 8 pairs in 1996.
9
Between 1995 and 1996 only 5 of 13 (38.5%) first nest attempts were successful. The Mayfield (1975) estimate of nest success for first nests was 26.6% (n = 11 nests; 187.5 nest-days). Four of 8 failed pairs relayed and 3 renests fledged young (Mayfield estimate = 72.1%, n = 4 nests; 103.5 nest-days). Two other failed pairs remained together and constructed nests, but we never observed eggs.
In 2 cases in which we had adequate records, 10 to 12 days elapsed between the loss of the first nest and initiation of laying in the renesting attempt. One of the successful renestings occurred after losing the first clutch during the first half of incubation, building a second nest and apparently never laying, and then building a third nest which was successful (assumed all by same pair of unmarked birds). Approximately 23 days elapsed between loss of the first nest and the laying of the first egg in the third nest.
Nest failures were observed throughout the breeding cycle. One of 10 failures occurred during laying, 3 within the first 5 days of incubation, 4 within the first 3 days after hatching, and 2 mid to late in the nestling period.
Although we never observed a nest being destroyed, we attributed all nesting failures but 1 to predation. In all cases but 1, nests were found in place, with little or no damage, but with eggs or young missing. Egg shell fragments were found on the ground beneath 2 of these empty nests. Once in 1994 we ascribed a nest failure to a severe storm with high winds when we found an empty nest on the ground at the base of the nest tree. We suspected red squirrels (Tamiasciurus hudsonicus) and gray jays were the most probable predators of olive-sided flycatcher eggs and nestlings because they were regularly observed on nearly all olive-sided territories, were seen being vigorously attacked by olive-sideds on many occasions, and are known nest predators of other tree and shrub nesting birds (Martin 1993; Strickland and Ouellet 1993; Sealy 1994; Matsuoka 1996). Other potential nest predators included the mew gull, common raven, marten (Martes americana), short-tailed weasel (Mustela ermina), and flying squirrel (Glaucomys sabrinus).
Site Fidelity
Two to 4 adult olive-sided flycatchers were captured and marked with color-bands on their breeding territories each year from 1994 to 1996. In the year following marking, 5 (56%) of 9 adults were observed on the same territory where they were initially captured, including 3 of 6 males and 2 of 3 females. One male returned to the same territory in 2 successive years following marking. On 2 occasions both male and female of a pair were marked, 1 pair returned the following year, while only the female returned (and mated with an unmarked male) at the second territory.
Territory Dimensions and Nearest Neighbors
The area of 16 olive-sided flycatcher territories near Fairbanks in 1994–1996 averaged 18.4 ha (s = 5.5; range = 10.5–26.4). Most olive-sided flycatcher territories mapped in our study were long and narrow, often aligned along a drainage. The maximum length of territories was 625 m (n = 17; s = 211.0; range = 360–1120), significantly greater compared to the diameter calculated from the area of the territories assuming they were circles (e.g., diameter of 18.4 ha circle = 484 m; paired sample t-test, t = 2.96, df = 14, p = 0.01).

10
On the 2 occasions olive-sideds nested on adjoining territories, nests were 720 and 1050 m apart. The distances between nests of nearest neighbors were not known for most monitored territories because the territories were isolated and we did not thoroughly search the broad areas around them. However, on Creamer’s Refuge in Fairbanks, we monitored territories each year and searched most of the 615 ha refuge. The nests of 2 isolated territories on the refuge were 3.6 to 3.8 km apart in 1995–1996.
On 4 territories in 1995 and 2 in 1996, near the onset of incubation, males began singing regularly at a considerable distance from the nest site and original singing area. These new singing areas averaged 470 m from the nest (n = 6; s = 164; range = 265–700). All were contiguous with the original singing areas. We did not observe males leap-frogging adjacent territories to establish second singing areas. However, 1 renesting pair apparently moved, from their original nest and a failed first renest attempt north of a neighboring olive-sided territory (with both adults color-marked), to the south of that neighboring territory to successfully renest. This pair was not color-marked, but we regularly visited the area and the chronology of events indicated the same pair was involved.
Four renesting attempts were located an average of 174 m (s = 98.8; range = 60–300) from the failed first nest. Nests on regulary used territories were 271 m from the previous year’s nest (n = 6; s = 240.8; range = 45–625).
HABITAT Perch and Nest Trees
Fifty-six primary singing perches were identified early in the breeding season on 17 territories from 1994 to 1996, primarily from Fairbanks (some sites visited 2 to 3 years), but including 5 territories in the Glennallen area. Olive-sided males perched in the tops of coniferous trees, predominantly white spruce (Table 9). More than 80% of perches were dead topped or completely dead trees (“dead topped” ranging from a minimum of the terminal meristem lacking green needles to a large portion of the tree dead). Perches were prominent trees, averaging 1.4 times taller than the surrounding forest canopy.
All but 1 of 19 nests were placed in a spruce tree (Table 9). In contrast to perch trees, more than 80% of nest trees were “live.” No nests were in dead trees. Nest trees were shorter than perch trees, and were also significantly shorter relative to their surrounding canopy than perches. Nest height averaged 6.4 m (s = 2.61; range 3–12 m) above the ground. On average, nests were placed 7/10ths the height of the nest tree (s = 0.13). Nests were located an average of 16.7 cm (s = 15.08) from the trunk atop live branches averaging 50.4 cm (s = 25.96) long.
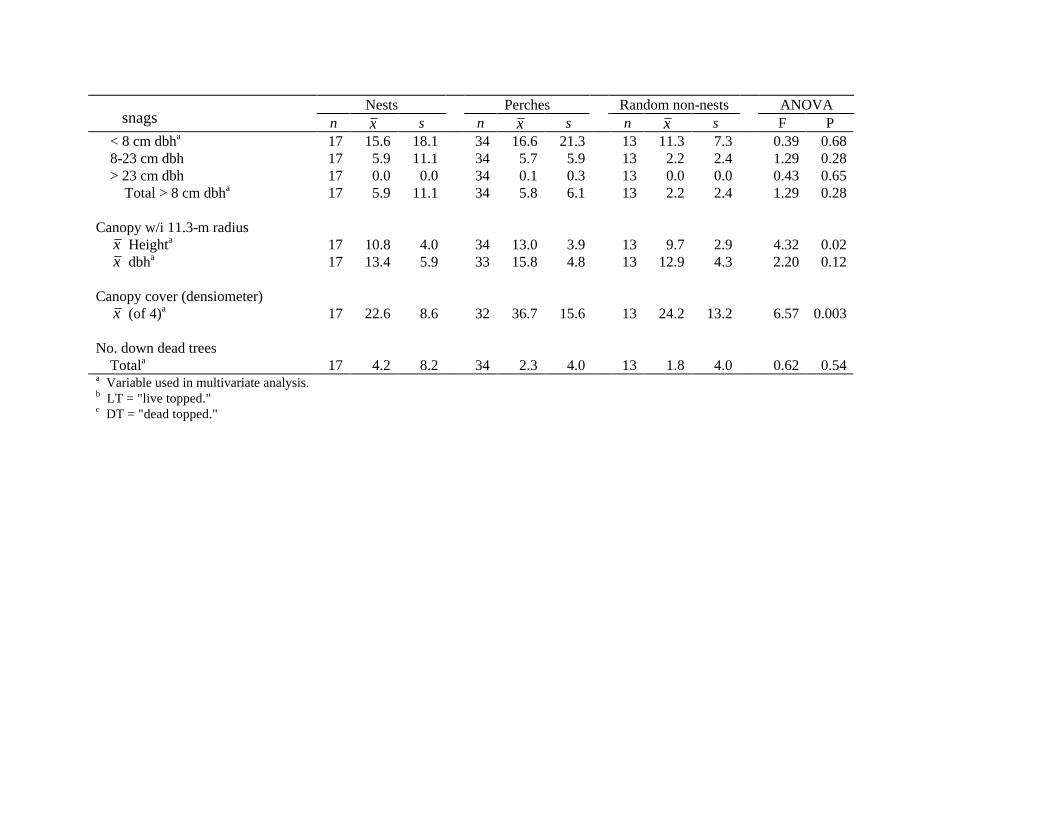
Perch, Nest, and Random Sites
Vegetation at perches, nests, and random (“non-nest”) sites was similar (Table 10). Ground cover (< 50 cm tall) was nearly complete, dominated by mosses, lichens, and dwarf shrubs. Betula nana (dwarf birch) and Ledum (Labrador tea) were the most abundant shrubs (50–140 cm tall), with small spruce saplings and Salix (willows) also common. In the small tree class (>1.4 m tall, dbh <8 cm), spruce were dominant, with Alnus (alder) and Tamarack common. Spruce were also dominant in the larger tree categories, though there were few trees
11
with diameters greater than 23 cm. The only differences detected were taller canopy height and more complete canopy cover around perches than at nest or random trees.
Attempts to distinguish between nest, perch, and random tree sites using mutivariate statistics were not successful with data collected in the 0.04 ha circular sample plots (using subset of variables identified in Table 10). Principal Component Analysis and Classification and Regression Tree (Brieman et al. 1984) techniques did not identify combinations of variables that were able to separate the 3 types of sites.
General Habitat Description
Olive-sided flycatcher territories in the Fairbanks and Glennallen areas were located within the scattered woodland/dwarf forest (VI.d.) and coniferous forest (VI.b.) habitats of Kessel (1979), comparable to the open needleleaf forest type (I.A.2.; particularly I.A.2.f,g,e.) of Viereck et al. (1992). Their territories included patches of other habitats within the primary forest type, including Kessel’s (1979) lacustrine (I.a.) and fluviatile (I.b.) waters; wet (IV.a.) and dwarf shrub (IV.b.) meadows; dwarf shrub mat (V.a.), low shrub (V.b.) and medium shrub (V.c.) thickets; and mixed deciduous-coniferous forest (VI.c.). Viereck et al.’s (1992) corresponding classifications for these patches are wet gramminoid herbaceous (II.A.3.; especially II.A.3.j,f,k.); open low scrub (II.C.2.; especially II.C.2.b,d,i.); open tall scrub (II.B.2.; especially II.B.2.f.); open mixed forest (I.C.2.) and closed mixed forest (I.C.1.c.); and also closed needleleaf forest (I.A.1.l,k,j.).
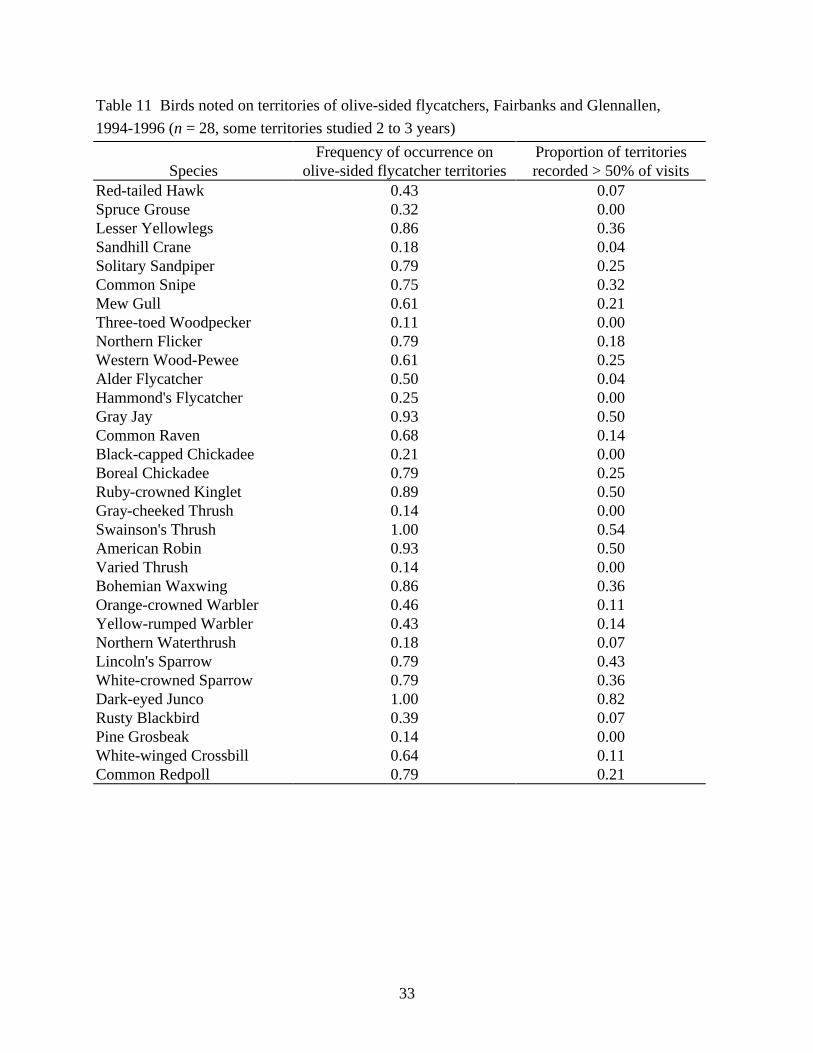
Another way of characterizing the habitat used by olive-sideds is to describe the bird community with which they associate (Table 11). Five species were noted on more than half our visits to >50% of olive-sided territories near Fairbanks and Glennallen: gray jay (forest, coniferous forest; i.e., primary and secondary habitats of landbirds assigned for central Alaska by Boreal Partners in Flight 1996), ruby-crowned kinglet (coniferous forest, forest), Swainson’s thrush (forest, tall shrub), American robin (forest, shrubs), and dark-eyed junco (forest, tall shrub). These 5 and the following 9 species were noted on ¾ or more of olive-sided territories: lesser yellowlegs (open woodland, muskeg, ponds; this and following 2 shorebirds’ habitat descriptions from Godfrey 1979), solitary sandpiper (muskeg, water edges in/near woodland), common snipe (freshwater marshes, bogs), northern flicker (deciduous forest, mixed forest), boreal chickadee (conifereous forest, forest), Bohemian waxwing (scattered woodland, coniferous forest), Lincoln’s sparrow (shrub, scattered woodland), white-crowned sparrow (shrub, scattered woodland), and common redpoll (shrub, forest). Most of these species are coniferous forest birds, but also included are birds of marsh, bog, and shrub, indicating the patchy mix of coniferous woodland with wetlands and shrub openings common to olive-sided flycatcher territories.
DISCUSSION
Although olive-sided flycatchers sing at highest rates for a short time around sunrise, in most cases their song production through the rest of the standard morning survey period is sufficient for detection. With their loud, distinctive song, it is unlikely a bird singing 2 to 3 songs per listening interval would be overlooked, and a high proportion of birds singing once would likely be detected. An indication of this is the report by Robbins (1981) that detections

12
of olive-sideds decreased just slightly after a sunrise peak. Wilson and Bart (1985) considered the relative importance of 1) probability of singing during the listening interval and 2) mean number of songs per interval and determined that probability of singing was a much better measure of change in detectability than singing rate.
Male olive-sideds that eventually paired sang at highest rates and most regularly prior to pairing, reduced singing dramatically during pairing/laying, resumed singing during incubation, and then nearly stopped singing when young hatched. A similar bimodal pattern has been documented in the prairie warbler (Nolan 1978), house wren (Wilson and Bart 1985) and pied flycatcher (Gottlander 1987), and Smith (1988) provided a general description of a similar pattern in the eastern wood-pewee, a congener of the olive-sided flycatcher. Some species stop singing almost completely after pair formation or egg laying (e.g., brown thrasher, Best 1981; bluethroat, Merila and Sorjonen 1994). The decline in singing following pairing is considered evidence that song is primarily an adaptation for attracting a mate, and males that resume singing after the first female is established on a nest are assumed to be attempting to attract a second female. Polygyny has been reported once in both the western and eastern wood-pewee (Eckhardt 1976). Although we were alert to the possibility of polygyny, we never observed a male olive-sided attracting a second mate.
In contrast to the variable singing by paired males, olive-sided males that never paired sang consistently at high rates throughout the breeding season. Reduced singing and detectability of paired males in comparison to unpaired males has been reported in a number of species (e.g., Best 1981; Hayes et al. 1985; Gibbs and Wenny 1993). This results in undercounting of paired males relative to unpaired males and may lead to errors in studies that assume all singing birds represent breeding pairs, or in studies using density based on detection of singing birds as an indicator of habitat suitability (Van Horne 1983).
The proportion of territory-maintaining Olive-sided males that paired in our study area near Fairbanks ranged from 67% in 1995 to 100% in 1996. In addition, some males sang for just a week or so and did not maintain a territory (10% of total males in 1995, 38% in 1996). Other estimates of pairing success include 19% to 82% of ovenbirds in fragmented forest and 55% to 85% in large forest plots (reviewed by Sabine et al. 1996), 62% of Kentucky warblers (Gibbs and Wenny 1993), and 59% of Kirtland’s warblers in marginal habitat and 95% in suitable habitat (Probst and Hayes 1987).
When a nest failed, males either reinitiated courtship behavior with their mate, or, if they had lost their mate, began singing in earnest to attract a new mate. Six of 8 failed-nest males remained paired and proceeded at least to nest construction in renesting. Males involved in nesting sang at reduced rates and were less detectable than advertising males. In 2 years of our study, more than half of first nests failed. A review of nest predation of tree nesting forest passerines found an average loss of 35.4% (n = 17 studies; range = 14.1–60.7; Martin 1993). Predation losses for 4 tree-nesting flycatcher species ranged from 27.9 to 42.6%. Calculated losses (following Mayfield 1975) to predation for tree nesters in 2 recent studies averaged 51.0 and 56.2% (Martin 1993). Nest failures and renesting may be important factors affecting singing and detectability.

13
We detected singing olive-sided flycatchers from suprisingly great distances. With an average detection threshold distance of 654 m, olive-sideds could potentially be heard from consecutive BBS stops (800 m apart) or off-road point count stations (250 m apart). I could not find reports of maximum detection distances for olive-sided flycatchers in the literature. One study in the coastal forest of Oregon reported “75% cumulative detection distances” (i.e., 75% of detections with an exact estimate of distance were at this distance or less), with a value of 175 m for olive-sideds (McGarigal and McComb 1995). Of 15 species associated with late-seral forests, only the red-tailed hawk was detected at greater distances (200 m), with the remaining species ranging from 55 to 160 m. Few maximum detection threshold distances have been reported. In Wisconsin deciduous forests, Emlen and DeJong (1981) found detection threshold distances for 11 species averaged 128 m (range of species’ means = 72–186), and Wolfe et al. (1995) reported an average of 151 m for 15 species. A recent study in Alaska (Paton et al., in prep) provides information from coniferous forest habitat similar to our study sites. Paton found detection threshold distances averaged 220 m for 9 species, ranging from 128 m for the Savannah sparrow to 470 m for the American robin.
The hearing ability of fieldworkers can vary substantially and has an obvious effect on the distance that individual listeners can detect even loud, distinctive singers like the olive-sided flycatcher. In our study, there was no discernible difference in the ability of 2 young field-workers (28-34 years old) to detect singing olive-sideds, but an older person (48 years old) with deficient hearing was only able to detect the same species at approximately 60% of the distance as the younger listeners. On the Kenai Peninsula, annual variation in counts of olive-sided flycatchers on 1 BBS route was attributed to differences in hearing ability of observers (R McAvinchey, US Fish and Wildlife Service, Kenai NWR). In 1982–1988 and 1992–1995, when that route was surveyed by 2 different observers with good hearing, 10.0 (n = 11; s = 1.1) olive-sideds/yr were counted; whereas only 3.3/yr (n = 3; s = 1.5) were counted from 1989–1991 when a third observer with poor hearing surveyed the route. Most adults lose appreciable hearing in critical bird song frequencies by the age of 40 to 50 (Emlen and DeJong 1992), and hearing ability has been recognized as an important factor in selection of qualified bird counters (Emlen and DeJong 1981, Ramsey and Scott 1981).
The large areas used by breeding olive-sideds could also lead to counting errors. The maximum length of territories averaged 625 m, and several males were noted moving 265–700 m from an initial singing area to a second area after incubation was underway. Movements of this extent, in combination with a detection distance of 654 m, could easily confound censuses relying on repeated visits to an area. Most other passerines breeding in the boreal forest use much smaller territories than olive-sided flycatchers. For example, territories reported for ruby-crowned kinglets ranged from 1.1 to 6 ha (Ingold and Wallace 1994) or densities of 1.2–3.4/10ha; Swainson’s thrush from 2.5 to 9.2/10 ha; yellow-rumped warbler from 0.9 to 10.8/10 ha (Theberge 1976; Spindler and Kessel 1980); and dark-eyed juncos densities ranged from 3.4 to 8.5/10ha (Spindler and Kessel 1980). The gray jay is one of the few species with territories >10 ha (range 41–146 ha, Strickland and Ouellet 1993) rather than <10 ha.
A large proportion of adult male and female olive-sided flycatchers returned to their previous year’s breeding territory. Breeding site fidelity in migratory passerines averaged 39% for
14
males and 21.6% for females in 9 species discussed by Holmes and Sherry (1992). Return rates generally vary between 20% and 60% with males returning more frequently than females. There are 2 records of fidelity to wintering sites by olive-sideds (Altman 1997). In light of this strong site fidelity, population trend information from 1 region may not be representative of all parts of their broad breeding distribution.
The general descriptions of olive-sided flycatcher habitat found in the literature (e.g., Bent 1942; Gabrielson and Jewett 1970; Peterson and Fichtel 1992) agree with our observations in central Alaska: open coniferous forest with small beaver or bog ponds, marshy streams, and bogs or meadows. Kessel (1979) lists the olive-sided as a characteristic bird of scattered woodland/dwarf forest. In Ontario, its habitat is described as semi-open coniferous or mixed forest near water, often in wetlands with standing dead conifers; spruce or tamarack bogs; forested edges of beaver ponds or rivers; and burns (Chesky 1987).
Spindler and Kessel (1980) placed the olive-sided flycatcher within their black spruce bog (subset of scattered woodland/dwarf forest), black spruce-dominant coniferous forest and mixed forest communities, dominated by the dark-eyed junco, Swainson’s thrush, white-crowned sparrow, and American robin. In a recent review of Canadian boreal forest birds, Kirk et al. (1996) included olive-sideds in a coniferous forest group characterized by the three-toed woodpecker, Bohemian waxwing, and dark-eyed junco. These bird species associations concur with those we observed in central Alaska.
Perch trees differed from nest trees in several aspects, including tree height, height relative to surrounding canopy, and condition of tree, but we could not differentiate between nest, perch and random sites. This was probably because all 3 sample types were centered on trees and were, therefore, drawn from forest patches. Other vegetation-type patches, such as wet meadows and shrubs, which may be important to olive-sideds for production of prey or as openings for foraging, were not sampled. Also, the arbitrarily selected 0.04 ha (11.3 m radius circle) sampling areas did not match the larger scale used by the birds in their choice of suitable foraging areas or total breeding territory (Petit et al. 1988; Sedgwick and Knopf 1992).
15
CONCLUSIONS AND RECOMMENDATIONS
Knowledge of the behavior and biology of an animal is a prerequisite to censusing. This initial study of the singing behavior and breeding biology of the olive-sided flycatcher provides a foundation for assessing and improving the usefulness of the BBS and other monitoring methods.
In many ways, the BBS is ideally suited for a species like the olive-sided flycatcher. Olive-sideds sing loudly from prominent perches in open forest habitats, have a distinctive and easily recognized song, sing at highest rates and most consistently in early morning hours, and are at relatively low densities and, therefore, do not overload observers (Bystrak 1981). However, observers should be aware of certain characteristics of the species so they may avoid unnecessary errors on BBS counts, or in the design of specific surveys for olive-sideds.
Detection threshold distances for olive-sided flycatchers ranged from 504–828 m, exceeding the 400 m listening radius standard for BBS counts and 50-125 m for point counts. Observers should be alert to avoid double counting with this species, especially on winding roads or meandering rivers where successive count stations may be far less than 800 m apart. If replicate counts are made during a breeding season, the potential for males shifting singing areas 265–700 m from first singing area should be considered when estimating total numbers for the season. Also, olive-sided territories averaged 18.4 ha with an average maximum dimension of 625 m, an order of magnitude larger than the territories of most other passerines in the boreal forest.
Even though olive-sideds are strong singers with a distinctive song, bird counters with deficient hearing may only be able to detect singing males at 60% or less the distance of counters with full normal hearing. All bird counters should have good hearing.
As in many other passerines, the breeding status of male olive-sideds has a dramatic effect on singing. The best time of year to census singing males is the brief period after most males have arrived and before they pair with females. Paired males are much less vocal from pairing to egg laying and following hatching of young. Unpaired males sing consistently through the season. In central Alaska, early in the first week of June is the optimal time to conduct a census of singing males. Nearly all males have arrived on territory by the first of June, while later in the month the probability of detecting paired males declines.
Singing rates are highest early in the morning. From 0215 to 0330 (approximately 0.75 h before to 0.5 h after sunrise), males sing at very high rates with few silent periods. From 0330 to 0515 singing rate declined and proportion of silent periods increased, then leveled off around 0530 and were relatively constant through 1100. However, sufficient songs are generally produced for detection throughout the standard morning survey period (0230–0900 h), except during pairing/laying and post-hatching stages of the breeding cycle.
Lengthening the listening interval from 3 to 10 minutes resulted in a marked improvement in the probability of detection during the second week of June, approaching the highest detection probabilities found in the first week of June. Little improvement was noted in 5-min versus 3-min intervals.
16
ACKNOWLEDGMENTS
This study was supported by Endangered Species funding through Federal Aid in Wildlife Restoration. I appreciate the assistance of Amal Ajmi, Paul Cotter, Eric Kelchlin, Kristian McIntyre, Derek Sands, Susan Sharbaugh, Scott Wilbor with fieldwork; Jay Ver Hoef for advice on statistical analyses; and Brad Andres and Paul Cotter for comments on a draft of this report. Philip Martin (FWS) and Pierre DeViche (UAF) and their field crews generously shared information on olive-sided flycatchers in the Fairbanks area.
LITERATURE CITED
ALTMAN B. 1997. Olive-sided Flycatcher in Western North America: status review. Prepared by Avifauna Northwest for USFWS, Oregon State Office, Portland. 59pp.
ASKINS RA, JF LYNCH, AND R GREENBERG. 1990. Population declines in migratory birds in eastern North America. Current Ornithol 7:1–57.
BANKS RC AND MR BROWNING. 1995. Comments on the status of revived old names for some North American birds. Auk 112:633–648.
BENT AC. 1942. Life histories of North American flycatchers, larks, swallows, and their allies. Smithsonian Inst., Natl Mus Bull. 179: 289–302.
BEST LB. 1981. Seasonal changes in detection of individual bird species. Studies in Avian Biology 6:252–261.
BOREAL PARTNERS IN FLIGHT. 1996. Alaska landbird data base, Central Bioregion. US Fish and Wildlife Service, Migratory Bird Management, Anchorage, AK.
BRIEMAN L, JH FREIDMAN, R OLSHEN, AND CJ STONE. 1984. Classification and Regression Trees. Wadsworth International Group, Belmont, CA.
BYSTRAK D. 1981. The North American Breeding Bird Survey. Studies in Avian Biology 6:34–41.
CHESKY T. 1987. Olive-sided Flycatcher. Pages 250-251 in MD Cadman, PFJ Eagles and FM Helleiner (eds), Atlas of the breeding birds of Ontario. Fed Ontario Nat, Univ Waterloo Press, Waterloo, Ontario.
ECKHARDT RC. 1976. Polygyny in the Western Wood Pewee. Condor 78:561–562.
EMLEN JT AND MJ DEJONG. 1981. The application of song detection threshold distance to census operations. Studies in Avian Biology 6:346–352.
—— AND ——. 1992. Counting birds: the problem of variable hearing abilities. J Field Ornithol 63:26–31.
17
FINCH DF. 1991. Population ecology, habitat requirements, and conservation of neotropical migratory birds. Gen Tech Rep RM-205. Fort Collins, CO: US Department of Agriculture, Forest Service. Rocky Mountain Forest and Range Experiment Station. 26pp.
GABRIELSON IN AND SG JEWETT. 1970. Birds of the Pacific Northwest. Dover reprint, New York. 650pp.
GIBBS JB AND DG WENNY. 1993. Song output as a population estimator: effect of male pairing status. J Field Ornithol 64:316–322.
GODFREY WE. 1979. Birds of Canada. National Museums of Canada, Bryant Press Ltd., Toronto. 428pp.
GOTTLANDER K. 1987. Variation in song rate of the male pied flycatcher Ficedula hypoleuca: causes and consequences. Anim Behav 35: 1037–1043.
HAGAN JM AND DW JOHNSTON. 1992. Ecology and conservation of Neotropical migrant landbirds; 6-9 Dec. 1989, Manomet Bird Observatory, Woods Hole, MA. Smithsonian Inst. Press, Washington D.C. 609p.
HAYES JP, JR PROBST, AND D RAKSTAD. 1985. Effects of mating status and time of day on Kirkland’s Warbler song rates. Condor 88:388–390.
HOLMES RT AND TW SHERRY. 1992. Site fidelity of migratory warblers in temperate breeding and Neotropical wintering areas: implications for population dynamics, habitat selection, and conservation. Pages 563–575 in JM Hagan and DW Johnston (eds), Ecology and Conservation of Neotropical Migrant Landbirds, Smithsonian Institution Press, Washington, D.C.
INGOLD JL AND GE WALLACE. 1994. Ruby-crowned Kinglet (Regulus calendula). No. 119 in A Poole and F Gill, eds. The Birds of North America. Acad Natl Sci., Philadelphia and American Ornithologist’s Union, Washington, D.C.
KESSEL B. 1979. Avian habitat classification for Alaska. Murrelet 60:86–94.
KIRK DA, AW DIAMOND, KA HOBSON, AND AR SMITH. 1996. Breeding bird communities of the western and northern Canadian boreal forest: relationship to forest type. Can J Zool 74: 1749–1770.
MANN DH, CL FASTIE, EL ROWLAND, AND NH BIGELOW. 1995. Spruce succession, disturbance, and geomorphology on the Tanana River floodplain, Alaska. Ecoscience 2:184–199.
MARTIN TE. 1993. Nest predation among vegetation layers and habitat types: revising the dogmas. Am Nat 141:897–913.
18
—— AND CJ CONWAY. 1994. BBird field protocol. Breeding Biology Research & Monitoring Database, Montana Coop Wildl Res Unit, Univ Montana. Missoula, MT. 39pp.
MATSUOKA SM. 1996. Habitat selection and reproductive ecology among Townsend’s Warblers (Dendroica townsendi) in southcentral Alaska. MS Thesis, Univ Alaska Fairbanks. 66pp.
MAYFIELD HF. 1975. Suggestions for calculating nest success. Wilson Bull 87:456–466.
MCGARIGAL K AND WC MCCOMB. 1995. Relationship between landscape structure and breeding birds in the Oregon Coast Range. Ecol Mono 65(3):235–260.
MERILA J AND J SORJONEN. 1994. Seasonal and diurnal patterns of singing and song-flight activity in bluethroats (Lusciana svecica). Auk 111:556–562.
NOLAN V, JR. 1978. The ecology and behavior of the Prairie Warbler Dendroica discolor. Ornith Mono 26:595.
PATON PWC, SEH PATON, A WILDMAN, AND J MASON. In prep. Detection threshold distances for birds in three habitat types in Alaska.
PETERSON JMC AND C FICHTEL. 1992. Olive-sided Flycatcher, Contopus borealis. Pages 353–367 in KJ Schneider and DM Pence (eds), Migratory nongame birds of management concern in the Northeast. US Fish and Wildl Serv, Newton Corner, MA. 400pp.
PETIT KE, DR PETIT, AND LJ PETIT. 1988. On measuring vegetation characteristics in bird territories: nest sites vs. perch sites and the effect of plot size. Am Midl Nat 199: 209–215.
PROBST JR AND JP HAYES. 1987. Pairing success of Kirtland’s Warblers in marginal vs. suitable habitat. Auk 104:234–241.
RAMSEY FL AND SCOTT JM. 1981. Tests of hearing ability. Studies in Avian Biology 6:341–345.
ROBBINS CS. 1981. Effect of time of day on bird activity. Studies in Avian Biology 6:275–286.
——, JR SAUER, RS GREENBERG, AND S DROEGE. 1989. Population declines in North American birds that migrate to the neotropics. Proc Natl Acad Sci. USA 86:7658–7662.
SABINE DL, AH BOER, AND WB BALLARD. 1996. Impacts of habitat fragmentation on pairing success of male Ovenbirds, Seiurus aurcapillus, in Southern New Brunswick. Can Field Nat 110:688–693.
SAUER JR AND S DROEGE. 1992. Geographic patterns in population trends of neotropical migrants in North America. Pages 26–42 in JM Hagan and DW Johnston (eds),
19
Ecology and Conservation of Neotropical Migrant Landbirds, Smithsonian Institution Press, Washington, D.C.
——, JE HINES, G GOUGH, I THOMAS, AND BG PETERJOHN. 1997. The North American Breeding Bird Survey Results and Analysis. Version 96.3. Patuxent Wildlife Research Center, Laurel, MD.
SEALY SG. 1994. Observed acts of egg destruction, egg removal, and predation on nests of passerine birds at Delta Marsh, Manitoba. Can Field Nat 108:41–51.
SEDGWICK JA AND FL KNOPF. 1992. Describing Willow Flycatcher habitats: scale perspectives and gender differences. Condor 94:720–733.
SMITH WJ. 1988. Patterned daytime singing of the eastern wood-pewee, Contopus virens. Anim Behav 36: 1111–1123.
SPINDLER MA. 1976. Ecological survey of the birds, mammals and vegetation of Fairbanks Wildlife Management Area. MS thesis, Univ Alaska Fairbanks. 257pp.
—— AND B KESSEL. 1980. Avian populations and habitat use in interior Alaska taiga. Syesis 13:61–104.
STRICKLAND D AND H OUELLET. 1993. Gray Jay (Perisoreus canadensis). No. 40 in A Poole and F Gill, eds. The Birds of North America. Acad. Nat. Sci., Philadelphia and American Ornithologist’s Union, Washington, D.C. 22p.
TERBORGH JW. 1989. Where have all the birds gone? Princeton Univ Press. Princeton, NJ. 205p.
THEBERGE JB. 1976. Bird populations in the Kluane Mountains, southwest Yukon, with special reference to vegetation and fire. Can J Zool 54:1346–1356.
US FISH AND WILDLIFE SERVICE. 1995. Migratory nongame birds of management concern in the United States: the 1995 list. Office of Migratory Bird Management, USFWS, Washington, D.C. 22pp.
VAN CLEVE K, CT DYRNESS, LA VIERECK, J FOX, FS CHAPIN, III AND W OECHL. 1983. Taiga ecosystems in Interior Alaska. BioScience 33: 39–44.
VAN HORNE B. 1983. Density as a misleading indicator of habitat quality. J Wildl Manage 47:893–901.
VIERECK LA, CT DYRNESS, AR BATTEN, AND KJ WENZICK. 1992. The Alaska vegetation classification. Gen Tech Rep PNW-GTR-286. USDA, Forest Service, Pacific Northwest Res Sta Portland, OR. 278pp.
WILSON DM AND J BART. 1985. Reliability of singing bird surveys: effects of song phenology during the breeding season. Condor 87:69–73.

20
WOLF AT, RW HOW, AND GJ DAVIS. 1995. Detectability of forest birds from stationary points in northern Wisconsin. Pages 19–23 in CJ Ralph, JR Sauer and S Droege (eds), Monitoring bird populations by point counts. Gen Tech Rep PSW-GTR-149. USDA For Serv, Pacific Southwest Res Sta, Albany, CA.
PREPARED BY: APPROVED BY:
John W Wright __________________________________ Wildlife Biologist III Wayne L Regelin, Director Division of Wildlife Conservation
SUBMITTED BY:
John W Wright __________________________________ Wildlife Biologist III Steven R Peterson, Senior Staff Biologist Division of Wildlife Conservation

21
Figure 1 Mean singing rates of olive-sided flycatchers, 1994-1996 (includes all data from 25 May - 4 Jul)
Songs per Minute
Proportion Silent
0.00
2.00
4.00
6.00
8.00
10.00
12.00
14.0002
15
0245
0315
0345
0415
0445
0515
0545
0615
0645
0715
0745
0815
0845
0915
0945
1015
1045
1115
1145
1215
1245
1315
1345
1415
1445
1515
1545
1615
1645
Time (ADT)
So
ng
s p
er M
inu
te
0
0.1
0.2
0.3
0.4
0.5
0.6
0.7
0.8
0.9
1
Pro
po
rtion
of O
bservatio
ns S
ilent
22
Figure 2 Mean singing rates of paired olive-sided flycatcher males during 3 periods of the breeding cycle, 1994-1996 (includes data from 16 May - 1 Jul)
0
2
4
6
8
10
12
14
16
18
0215
0245
0315
0345
0415
0445
0515
0545
0615
0645
0715
0745
0815
0845
0915
0945
1015
1045
1115
1145
Time (ADT)
So
ng
s p
er M
inu
te
Prior to Arrival of FemaleArrival of Female through LayingIncubation
23
Figure 3 Mean singing rates of never-paired and failed-nest male olive-sided flycatchers, 1994-1996 (never-paired data from 24 May-24 Jul; failed-nest data from 12 Jun-17 Jul)
0
2
4
6
8
10
12
14
0200
0230
0300
0330
0400
0430
0500
0530
0600
0630
0700
0730
0800
0830
0900
0930
1000
1030
1100
1130
1200
Time (ADT)
So
ng
s p
er M
inu
te
Never PairedFailed Nest

24
Figure 4 Mean singing rates of olive-sided flycatchers relative to arrival of females, 1994-1996 (mean singing rate by individual male by date; data from 25 May-5 Jul, 0200-1200h; average female arrival date used for upaired males)
0.0
2.0
4.0
6.0
8.0
10.0
12.0
-30 -20 -10 0 10 20 30 40 50
Day Relative to Arrival of Female
So
ng
s p
er M
inu
te
Paired
Failed
NeverPaired

25
Table 1 Olive-sided flycatcher counts on selected Breeding Bird Survey routes in Alaska, 1982-1995
Route Region Years x s Coef. Var. Min. Max. Eagle Central 4 3.5 2.38 0.68 1 6 Circle Central 7 4.0 2.45 0.61 2 8 Chatanika River Central 4 5.0 1.41 0.28 4 7 Chistochina Central 6 4.7 3.67 0.79 0 11 Northway Central 7 2.9 1.21 0.43 1 4 Chena Hot Springs Road Central 7 2.4 3.10 1.28 0 9 Sourdough Central 7 8.0 4.08 0.51 1 14 Bear Crk/Yukon Central 7 9.4 6.97 0.74 2 24 Galena/Campion Central 10 2.9 2.13 0.74 0 6 Swan Lake Road Southcoastal 14 8.6 3.06 0.36 2 12 Anchor River Southcoastal 9 2.9 1.96 0.68 0 7 Seven Lakes Southcoastal 10 4.8 3.46 0.72 1 13 Mitkof Island Southeast 9 6.6 2.64 0.40 4 12 Zimovia Strait Southeast 10 2.4 1.77 0.74 1 5 Zarembo Southeast 3 6.7 3.51 0.53 3 10 Table 2 Number of olive-sided flycatchers detected during repeated surveys of 2 Breeding Bird Survey routes near Glennallen, 1994
Date Sourdough Chistochina 18-19 May 2 1 28 May 0 4 1-2 June 0 1 8 June 11 1 16-17 June 6 2 23-24 June 2 1 29-30 June 1 1
26
Table 3 Mean dates of olive-sided flycatcher events in the vicinity of Fairbanks, Alaska (includes observed and calculated dates)
1995a,b 1996 Male arrival 26 May (10) 24 May (11) [22 May-1 June] [11 May-8 June] Female arrival 1 June (6) 2 June (7)
[27 May-8 June] [22 May-10 June]
Lay start 4 June (5) 12 June (7) [1-5 June] [31 May-16 June]
Hatch start 29 June (2) 27 June (6) [22 June-7July] [16 June-2 July]
Fledge none 15 July (4) [2 July-20 July]
Renest (2) (1) Lay 11-19 June 10-12 July Hatch 28 June-8 July 26-27 July Fledge 12 July-23 July 4 August
a Parentheses = sample size b Brackets = range
27
Table 4 Mean proportions of 3-, 5- and 10-min intervals with at least 1 olive-sided flycatcher song, Fairbanks and Glennallen 1994-1996 (includes paired, never-paired and failed males, from 0230-0900 h) Interval 16-24 May 25-31 May 1-7 June 8-14 June 15-21 June 22-30 June 1-7 July length [8;560]a [16;2039] [14;1576] [14;2515] [14;2293] [14;2950] [9;1556] 3-min 0.99 0.68 0.76 0.53 0.58 0.66 0.43
(0.02)b (0.38) (0.40) (0.40) (0.42) (0.42) (0.37)
5-min 0.99 0.71 0.77 0.69 0.60 0.68 0.45 (0.02) (0.35) (0.39) (0.36) (0.42) (0.42) (0.37)
10-min 1.00 0.74 0.78 0.74 0.67 0.72 0.49 (0.01) (0.31) (0.37) (0.34) (0.42) (0.41) (0.37)
a brackets = sample size, i.e., number of singing-rate observation periods; total number of minutes observed. b parentheses = s.
Table 5 Mean proportions of 3-min intervals with at least 1 olive-sided flycatcher song for paired, never-paired and failed-nest males, Fairbanks and Glennallen, 1994-1996 (0230-0900 h)
Datesa,b Male status 16-24 May 25-31 May 1-7 Jun 8-14 Jun 15-21 Jun 22-30 Jun 1-7 Jul 8-24 Jul
Paired 0.99 0.70 0.66 0.43 0.51 0.30 0.16 (0.02) (0.41) (0.45) (0.38) (0.49) (0.33) 0.21 [7;413] [11;1245] [10;1068] [8;1046] [5;706] [5;834] [4;630]
Never paired 1.00 0.64 1.00 0.64 0.74 0.98 0.86 0.74 (0.33) (0.00) (0.46) (0.33) (0.02) (0.20) (0.40) [1;147] [5;794] [4;508] [6;1469] [5;742] [5;1143] [3;519] [4;150]
Failed nest 0.46 0.71 0.34 0.59 (0.47) (0.48) (0.06) (0.50) [4;845] [4;973] [2;407] [5;412]
a Parentheses = s. b Brackets = sample size, i.e., number of singing-rate observation periods; total number of minutes observed.
28
Table 6 Mean proportions of 3-min intervals with at least 1 olive-sided flycatcher song, and singing rate (number of songs/3min) for paired males during stages of breeding cycle, Fairbanks and Glennallen, 1994-1996 (0230-0900 h)
Paired malesa Prior to arrival Pairing, of female nest building Incubation Post hatch [18;1286] [13;1918] [15;1986] [4;752]
3-min Intervals w/ song 0.94 0.36 0.53 0.12 (s)
(0.23) (0.32) (0.44) (0.22)
Songs/3-min 11.46 4.05 4.18 0.09 (s) (5.15) (4.76) (3.98) (0.09) a Brackets = sample size, i.e., number of singing-rate observation periods; total number of minutes observed.
Table 7 Mean singing rate by date of season for all males, and paired, never-paired and failed males, Fairbanks and Glennallen, 1994-1996 (0230-0900 h)
Mean number of songs/3mina Male status 16-24 May 25-31 May 1-7 Jun 8-14 Jun 15-21 Jun 22-30 Jun 1-7 Jul 8-24 Jul
All males 10.84 9.14 8.33 5.07 5.70 7.72 5.13 (1.60) (7.06) (4.89) (5.14) (4.05) (7.62) (5.27) Paired 11.09 10.15 7.17 4.26 3.45 1.62 0.43 (1.56) (7.53) (5.22) (4.96) (3.31) (1.96) (0.68) Never paired 9.10 6.93 11.22 5.88 6.87 14.30 10.34 11.06 (6.03) (2.51) (5.51) (3.39) (7.52) (3.35) (8.90) Failed nest 7.04 7.11 6.69 5.34 (5.31) (6.06) (4.91) (5.01) a Parentheses = s
29
Table 8 Fate of olive-sided flycatcher males found singing in Fairbanks area, 1995 and 1996 1995 1996
Males observed 10 13 Did not maintain territory 1 5 Never paired 3 0 Paired 6 8 Nested 5 8 First nest fledged young 0 5 First nest failed 5 3 Renested 3 1 Renest fledged young 2 1 Renest failed 1 0 Table 9 Comparison of perch and nest trees used by olive-sided flycatchers, Fairbanks and Glennallen, 1994-1996
Perch Nest n 56 19 Taxon
Spruce 50 18 White Spruce 34 2 Black Spruce 16 15 Unknown Spruce 1
Tamarack 6 1 Conditiona
Live 10 15 Dead topped 30 4 Dead 16 0
Height (m)b 17.8 (5.1)c 9.3 (3.7) Diameter (dbh, cm) 25.9 (8.3) 10.6 (3.6) Perch or Nest Tree Height /
Canopy Heightd
1.4 (0.3)
0.9 (0.2) a X2 = 22.9, df = 3, P < 0.001. b t = -6.72, df = 73, P < 0.001. c x (s). d t = -6.74, df = 73, P < 0.001.
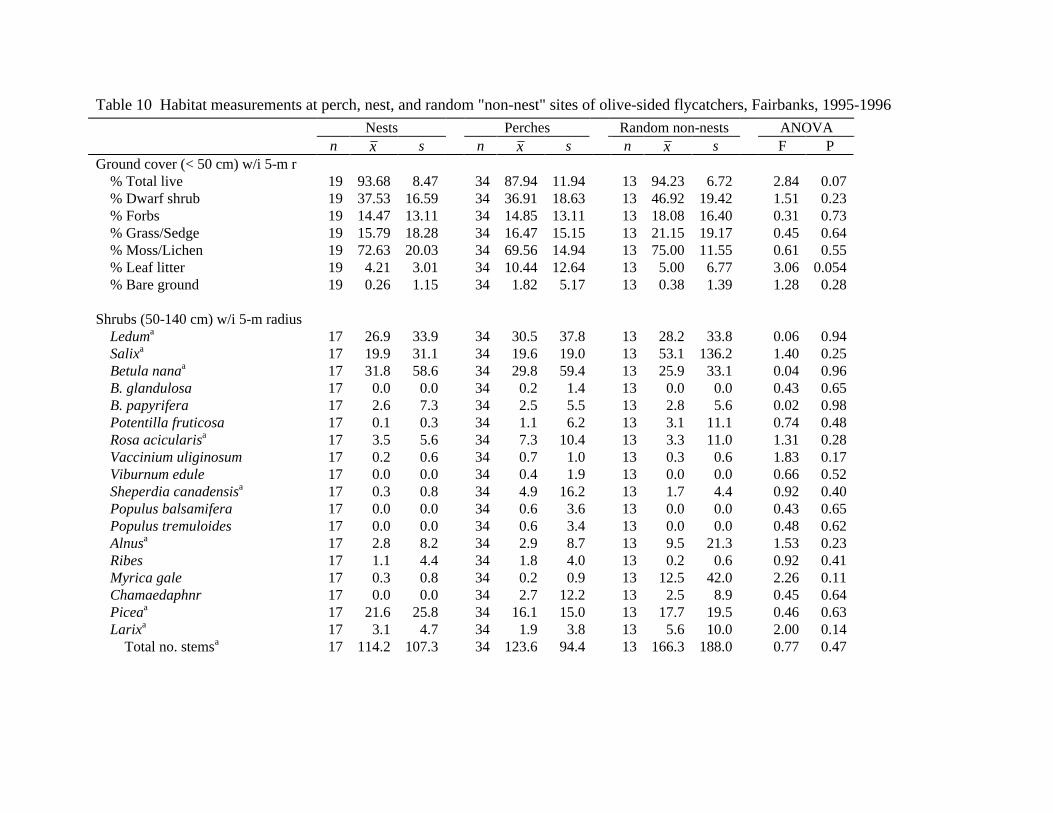
Table 10 Habitat measurements at perch, nest, and random "non-nest" sites of olive-sided flycatchers, Fairbanks, 1995-1996 Nests Perches Random non-nests ANOVA n x s n x s n x s F P
Ground cover (< 50 cm) w/i 5-m r % Total live 19 93.68 8.47 34 87.94 11.94 13 94.23 6.72 2.84 0.07 % Dwarf shrub 19 37.53 16.59 34 36.91 18.63 13 46.92 19.42 1.51 0.23 % Forbs 19 14.47 13.11 34 14.85 13.11 13 18.08 16.40 0.31 0.73 % Grass/Sedge 19 15.79 18.28 34 16.47 15.15 13 21.15 19.17 0.45 0.64 % Moss/Lichen 19 72.63 20.03 34 69.56 14.94 13 75.00 11.55 0.61 0.55 % Leaf litter 19 4.21 3.01 34 10.44 12.64 13 5.00 6.77 3.06 0.054 % Bare ground
19 0.26 1.15 34 1.82 5.17 13 0.38 1.39 1.28 0.28
Shrubs (50-140 cm) w/i 5-m radius Leduma 17 26.9 33.9 34 30.5 37.8 13 28.2 33.8 0.06 0.94 Salixa 17 19.9 31.1 34 19.6 19.0 13 53.1 136.2 1.40 0.25 Betula nanaa 17 31.8 58.6 34 29.8 59.4 13 25.9 33.1 0.04 0.96 B. glandulosa 17 0.0 0.0 34 0.2 1.4 13 0.0 0.0 0.43 0.65 B. papyrifera 17 2.6 7.3 34 2.5 5.5 13 2.8 5.6 0.02 0.98 Potentilla fruticosa 17 0.1 0.3 34 1.1 6.2 13 3.1 11.1 0.74 0.48 Rosa acicularisa 17 3.5 5.6 34 7.3 10.4 13 3.3 11.0 1.31 0.28 Vaccinium uliginosum 17 0.2 0.6 34 0.7 1.0 13 0.3 0.6 1.83 0.17 Viburnum edule 17 0.0 0.0 34 0.4 1.9 13 0.0 0.0 0.66 0.52 Sheperdia canadensisa 17 0.3 0.8 34 4.9 16.2 13 1.7 4.4 0.92 0.40 Populus balsamifera 17 0.0 0.0 34 0.6 3.6 13 0.0 0.0 0.43 0.65 Populus tremuloides 17 0.0 0.0 34 0.6 3.4 13 0.0 0.0 0.48 0.62 Alnusa 17 2.8 8.2 34 2.9 8.7 13 9.5 21.3 1.53 0.23 Ribes 17 1.1 4.4 34 1.8 4.0 13 0.2 0.6 0.92 0.41 Myrica gale 17 0.3 0.8 34 0.2 0.9 13 12.5 42.0 2.26 0.11 Chamaedaphnr 17 0.0 0.0 34 2.7 12.2 13 2.5 8.9 0.45 0.64 Piceaa 17 21.6 25.8 34 16.1 15.0 13 17.7 19.5 0.46 0.63 Larixa 17 3.1 4.7 34 1.9 3.8 13 5.6 10.0 2.00 0.14
Total no. stemsa
17 114.2 107.3 34 123.6 94.4 13 166.3 188.0 0.77 0.47

Nests Perches Random non-nests ANOVA n x s n x s n x s F P
< 8 cm dbh Picea LTa,b 17 67.8 64.3 34 65.7 46.8 13 90.5 70.6 0.94 0.40 Picea DTa,c 17 2.5 3.7 34 3.1 4.5 13 3.1 3.6 0.12 0.89 Larix LTa 17 10.6 23.2 34 4.6 13.8 13 10.5 19.6 0.89 0.42 Larix DTa 17 2.2 3.3 34 0.7 2.0 13 1.4 3.1 2.03 0.14 Betula papyriferaa 17 10.6 25.1 34 5.9 21.0 13 3.2 7.7 0.54 0.58 B. nana 17 0.3 1.0 34 0.9 5.1 13 0.5 1.7 0.18 0.84 Salixa 17 8.1 15.5 34 6.6 12.1 13 6.7 14.6 0.07 0.93 Populus tremuloides 17 0.0 0.0 34 0.2 0.8 13 0.0 0.0 0.80 0.45 P. balsamifera 17 0.0 0.0 34 0.2 0.9 13 0.0 0.0 0.61 0.55 Alnusa 17 17.3 36.5 34 14.4 31.4 13 24.2 84.7 0.20 0.82
Total < 8 cma 17 119.5 67.1 34 102.2 57.8 13 140.0 100.3 1.41 0.25 8-23 cm dbh
Picea LTa 17 15.6 21.4 34 19.7 13.5 13 17.5 19.8 1.13 0.33 Picea DTa 17 2.8 4.0 34 2.7 3.5 13 2.0 3.5 0.45 0.64 Larix LTa 17 0.6 1.5 34 0.7 1.9 13 0.5 1.2 0.10 0.91 Larix DTa 17 0.9 2.1 34 0.2 0.7 13 0.2 0.6 2.33 0.11 Betula papyriferaa 17 0.4 1.0 34 0.1 0.2 13 0.1 0.3 1.71 0.19 Salix 17 0.0 0.0 34 0.2 0.8 13 0.0 0.0 1.22 0.30 Populus tremuloides 17 0.0 0.0 34 0.1 0.3 13 0.0 0.0 1.38 0.26 P. balsamifera 17 0.1 0.2 34 0.2 1.4 13 0.0 0.0 0.43 0.65 Alnus 17 0.0 0.0 34 0.1 0.4 13 0.0 0.0 0.80 0.45
Total 8-23 cm 17 20.4 25.6 34 24.0 14.1 13 20.2 21.0 1.31 0.28 > 23 cm dbh
Picea LT 17 0.4 1.2 34 1.1 1.8 13 0.4 1.1 2.02 0.14 Picea DT 17 0.1 0.2 34 0.0 0.2 13 0.2 0.8 0.41 0.67 Populus balsamifera 17 0.0 0.0 34 0.1 0.3 13 0.0 0.0 0.43 0.65
Total > 23 cma
17 0.4 1.2 34 1.2 1.8 13 0.6 1.9 2.23 0.12
Trees (> 1.4 m) w/i 11.3-m radius
Nests Perches Random non-nests ANOVA n x s n x s n x s F P
< 8 cm dbha 17 15.6 18.1 34 16.6 21.3 13 11.3 7.3 0.39 0.68 8-23 cm dbh 17 5.9 11.1 34 5.7 5.9 13 2.2 2.4 1.29 0.28 > 23 cm dbh 17 0.0 0.0 34 0.1 0.3 13 0.0 0.0 0.43 0.65
Total > 8 cm dbha
17 5.9 11.1 34 5.8 6.1 13 2.2 2.4 1.29 0.28
Canopy w/i 11.3-m radius x Heighta 17 10.8 4.0 34 13.0 3.9 13 9.7 2.9 4.32 0.02 x dbha
17 13.4 5.9 33 15.8 4.8 13 12.9 4.3 2.20 0.12
Canopy cover (densiometer) x (of 4)a
17 22.6 8.6 32 36.7 15.6 13 24.2 13.2 6.57 0.003
No. down dead trees Totala 17 4.2 8.2 34 2.3 4.0 13 1.8 4.0 0.62 0.54
a Variable used in multivariate analysis. b LT = "live topped." c DT = "dead topped."
snags
33
Table 11 Birds noted on territories of olive-sided flycatchers, Fairbanks and Glennallen, 1994-1996 (n = 28, some territories studied 2 to 3 years)
Frequency of occurrence on Proportion of territories Species olive-sided flycatcher territories recorded > 50% of visits
Red-tailed Hawk 0.43 0.07 Spruce Grouse 0.32 0.00 Lesser Yellowlegs 0.86 0.36 Sandhill Crane 0.18 0.04 Solitary Sandpiper 0.79 0.25 Common Snipe 0.75 0.32 Mew Gull 0.61 0.21 Three-toed Woodpecker 0.11 0.00 Northern Flicker 0.79 0.18 Western Wood-Pewee 0.61 0.25 Alder Flycatcher 0.50 0.04 Hammond's Flycatcher 0.25 0.00 Gray Jay 0.93 0.50 Common Raven 0.68 0.14 Black-capped Chickadee 0.21 0.00 Boreal Chickadee 0.79 0.25 Ruby-crowned Kinglet 0.89 0.50 Gray-cheeked Thrush 0.14 0.00 Swainson's Thrush 1.00 0.54 American Robin 0.93 0.50 Varied Thrush 0.14 0.00 Bohemian Waxwing 0.86 0.36 Orange-crowned Warbler 0.46 0.11 Yellow-rumped Warbler 0.43 0.14 Northern Waterthrush 0.18 0.07 Lincoln's Sparrow 0.79 0.43 White-crowned Sparrow 0.79 0.36 Dark-eyed Junco 1.00 0.82 Rusty Blackbird 0.39 0.07 Pine Grosbeak 0.14 0.00 White-winged Crossbill 0.64 0.11 Common Redpoll 0.79 0.21

34
APPENDIX A COMMON AND SCIENTIFIC NAMES OF BIRDS. Red-tailed Hawk Buteo jamaicensis Spruce Grouse Dendropagus canadensis Sandhill Crane Grus canadensis Lesser Yellowlegs Tringa flavipes Solitary Sandpiper Tringa solitaria Common Snipe Gallinago gallinago Mew Gull Larus canus Three-toed Woodpecker Picoides tridactylus Northern Flicker Colaptes auratus Eastern Wood-Pewee Contopus virens Western Wood-Pewee Contopus sordidulus Alder Flycatcher Empidonax alnorum Hammond's Flycatcher Empidonax hammondi Gray Jay Perisoreus canadensis Common Raven Corax corax Black-capped Chickadee Parus atricapillus Boreal Chickadee Parus hudsonicus Ruby-crowned Kinglet Regulus calendula Pied Flycatcher Ficedula hypoleuca Bluethroat Lusciana svecica Gray-cheeked Thrush Catharus minimus Swainson's Thrush Catharus ustulatus American Robin Turdus migratorus Varied Thrush Ixoreus naevius Brown Thrasher Toxostoma rufum Bohemian Waxwing Bombycilla garrulus Orange-crowned Warbler Vermivora celata Yellow-rumped Warbler Dendroica coronata Kirtland’s Warbler Dendroica kirtlandi Prairie Warbler Dendroica discolor Kentucky Warbler Oporonis formosus Ovenbird Seiurus aurocapillus Northern Waterthrush Seiurus noveboracensis Savannah Sparrow Passerculus sandwichensis Lincoln's Sparrow Melospiza lincolnii White-crowned Sparrow Zonotrichia leucophrys Dark-eyed Junco Junco hyemalis Rusty Blackbird Euphagus carolinus Pine Grosbeak Pinicola enucleator White-winged Crossbill Loxia leucoptera Common Redpoll Carduelis flammea