Preliminary Engineering Report - Oregon · Preliminary Engineering Report Water Supply Expansion...
130
Preliminary Engineering Report Water Supply Expansion Prepared for: City of Port Orford Consulting Engineers & Geologists, Inc. 275 Market Avenue Coos Bay, OR 97420-2219 April 2010 541/266-9890 608040.070
Transcript of Preliminary Engineering Report - Oregon · Preliminary Engineering Report Water Supply Expansion...

Preliminary Engineering Report
Water Supply Expansion
Prepared for: City of Port Orford
Consulting Engineers & Geologists, Inc. 275 Market Avenue Coos Bay, OR 97420-2219 April 2010 541/266-9890 608040.070


\\Coosbay\projects\2008\608040-HubbardCreek\070-PreliminaryEngineeringReport\PUBS\rpts\PER-Final.doc i
Table of Contents Page
List of Illustrations ............................................................................................................................ iii
Acronyms and Abbreviations ...........................................................................................................v
1.0 Introduction .............................................................................................................................1
2.0 Study Area ...............................................................................................................................2 2.1 Physical Environment ................................................................................................2 2.2 Economic Conditions .................................................................................................2 2.3 Population Trends .......................................................................................................2
3.0 Existing Water System ............................................................................................................4 3.1 Raw Water Sources .....................................................................................................4
3.1.1 North Fork Hubbard Creek ...........................................................................4 3.1.2 Garrison Lake ..................................................................................................4 3.1.3 Gold Run Creek ...............................................................................................5
3.2 Water Rights ................................................................................................................5 3.3 Raw Water Transmission ...........................................................................................6
3.3.1 North Fork Hubbard Creek ...........................................................................6 3.3.2 Garrison Lake Intake ......................................................................................6
3.4 Water Treatment .........................................................................................................7 3.5 Treated Water Storage ................................................................................................7
3.5.1 Existing Finished Water Reservoir Capacity ..............................................8 3.5.2 Existing Reservoir Condition ........................................................................8
3.6 Distribution System ....................................................................................................8 3.6.1 Pipe Inventory .................................................................................................8 3.6.2 Pressure Zones.................................................................................................9 3.6.3 Booster Pump Stations ...................................................................................9 3.6.4 Unaccounted Water ......................................................................................10
3.7 Financial Status ..........................................................................................................11 3.7.1 Current Rate Schedule ..................................................................................11 3.7.2 Annual Operations and Maintenance (O&M) Cost .................................11 3.7.3 Capital Improvement Plan ..........................................................................12 3.7.4 Users by Category .........................................................................................12 3.7.5 Existing Debts ................................................................................................13
4.0 Need for Project .....................................................................................................................14 4.1 Hydrological Model (North Hubbard Creek) .......................................................14
4.1.1 HEC-HMS Methodology .............................................................................14 4.1.2 Model Results ................................................................................................17
4.2 Water Demands .........................................................................................................21 4.3 Storage Requirements ...............................................................................................22
4.3.1 Water Balance Scenarios ..............................................................................22

\\Coosbay\projects\2008\608040-HubbardCreek\070-PreliminaryEngineeringReport\PUBS\rpts\PER-Final.doc ii
5.0 Alternatives Evaluation ........................................................................................................27 5.1 Do Nothing ................................................................................................................27 5.2 Expand Existing Impoundment ..............................................................................27 5.3 New Impoundment ..................................................................................................28 5.4 Garrison Lake Source ...............................................................................................28
5.4.1 Intake Relocation ...........................................................................................28 5.4.2 Intake Design .................................................................................................29 5.4.3 Treatment .......................................................................................................29 5.4.4 Transmission Line .........................................................................................29 5.4.5 Source Protection ..........................................................................................30
5.5 Evaluation of Alternatives .......................................................................................30 5.5.1 Cost Comparison ...........................................................................................30 5.5.2 Evaluation Matrix .........................................................................................30
6.0 Proposed Project ....................................................................................................................32 6.1 Distribution System Improvements .......................................................................32 6.2 Reservoir Expansion .................................................................................................32
6.2.1 Earthen Dam Construction ..........................................................................32 6.2.2 Spillway Design .............................................................................................33 6.2.3 Reservoir Drain .............................................................................................33 6.2.4 Raw Water Intake Structure ........................................................................34 6.2.5 Raw Water Pump Station .............................................................................34 6.2.6 Fish Passage Structure ..................................................................................34 6.2.7 Water Rights ..................................................................................................35 6.2.8 Property Acquisition .......................................................................................35
7.0 Costs and Implementation ...................................................................................................37 7.1 Basis for Cost Estimates ...........................................................................................37
7.1.1 Construction Costs ........................................................................................37 7.1.2 Contingencies ................................................................................................37 7.1.3 Engineering ....................................................................................................37 7.1.4 Legal and Administrative ............................................................................38 7.1.5 Land Acquisition ...........................................................................................38
7.2 Distribution System Improvements Costs ............................................................38 7.3 North Fork Hubbard Creek Dam/Impoundment Expansion Costs .................39 7.4 Operation and Maintenance Costs .........................................................................40
7.4.1 Short -lived Assets and Reserve ..................................................................41 7.5 Schedule .....................................................................................................................42
Appendices
A. Summary Capital Improvements List B. Stream Flow Analyses C. Distribution System Phased Improvement Costs

\\Coosbay\projects\2008\608040-HubbardCreek\070-PreliminaryEngineeringReport\PUBS\rpts\PER-Final.doc iii
List of Illustrations Figures Follows Page
1.0 Vicinity Map ......................................................................................................................................... 1
2.0 Study Area ............................................................................................................................................ 2
3.0 Existing Water Distribution System .................................................................................................. 4
4.1 Watershed Characteristics ................................................................................................................ 14
4.2 Water Supply vs. Raw Water Demand Scenario 1 ........................................................................ 23
4.3 Water Supply vs. Raw Water Demand Scenario 2 ........................................................................ 24
4.4 Water Supply vs. Raw Water Demand Scenario 3 ........................................................................ 25
4.5 Stage Storage ....................................................................................................................................... 25
5.1 Proposed Reservoir ............................................................................................................................ 27
5.2 Upstream Reservoir Option .............................................................................................................. 28
6.1 Water Distribution System Improvements .................................................................................... 32
6.2 Plan View of Proposed Earthen Dam .............................................................................................. 32
6.3 Sectional View of Proposed Dam and Intake ................................................................................. 32
6.4 Sectional View of Proposed Dam and Primary Spillway ............................................................. 32
6.5 Water Rights ....................................................................................................................................... 35 Tables Page
Table 2.1 Population Projections For the City of Port Orford .....................................................3
Table 3.1 Water Rights Summary .....................................................................................................6
Table 3.2 Water Reservoir Data .........................................................................................................8
Table 3.3 Pipe Inventory ...................................................................................................................9
Table 3.4 Annual Water Production and Consumption .............................................................10
Table 3.5 2009-2010 Operating Budget City of Port Orford ........................................................11
Table 3.6 EDUs by Customer Class ................................................................................................13
Table 4.1 Hubbard Creek Watershed SCS Curve Numbers .......................................................15
Table 4.2 Hubbard Creek Watershed Run-off Calculations ......................................................16
Table 4.3 Intensity Duration Data Design Storms ........................................................................17
Table 4.4 Hubbard Creek Flows - Simulated ................................................................................18
Table 4.5 Statistical Estimates of North Fork Hubbard Creek Flow ..........................................19

\\Coosbay\projects\2008\608040-HubbardCreek\070-PreliminaryEngineeringReport\PUBS\rpts\PER-Final.doc iv
Table 4.6 North Fork Hubbard Creek Watershed Discharge Resulting from Design Storms .................................................................................................................................................20
Table 4.7 Monthly Average Water Demand City of Port Orford ...............................................21
Table 4.8 Raw Water Demand .........................................................................................................22
Table 4.10 Reservoir Requirements 50-year Projected Demand City Of Port Orford ............25
Table 4.11 Hubbard Creek Impoundment Preliminary Design Criteria Year 2060 ................26
Table 5.1 Water Supply Alternatives Preliminary Estimate of Cost ..........................................30
Table 5.2 Evaluation Matrix .............................................................................................................31
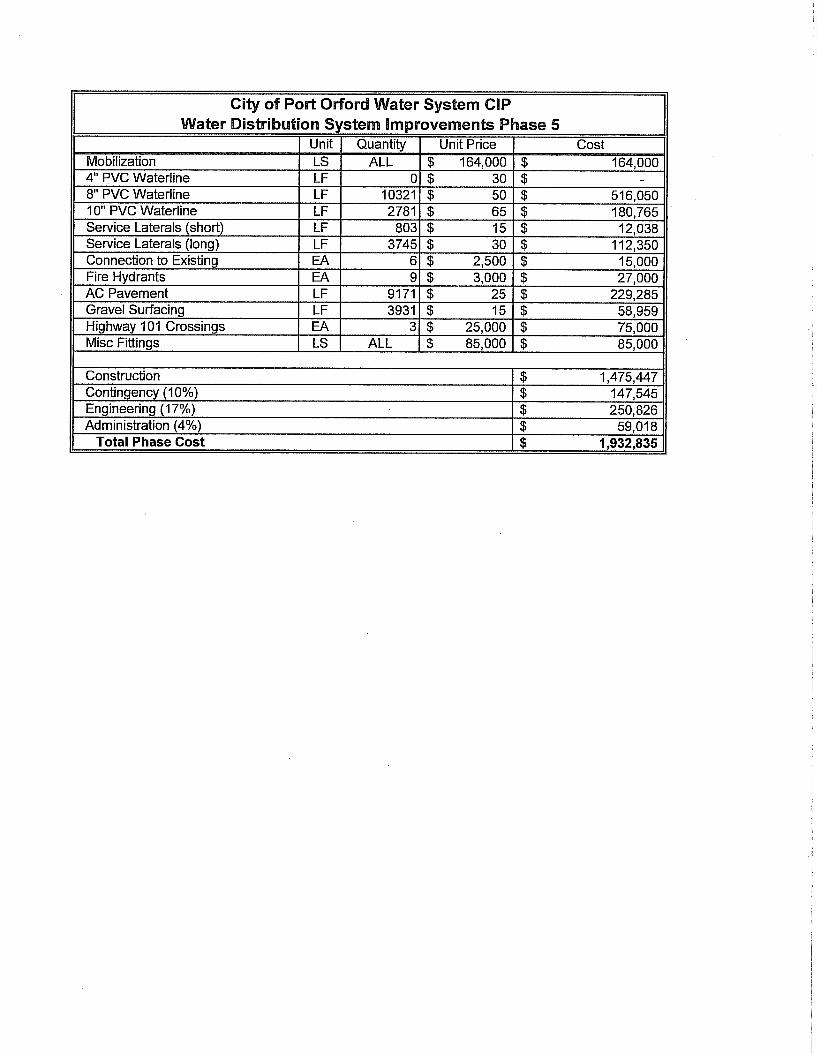
Table 7.1 North Fork Hubbard Creek Impoundment Project Opinion of Probable Costs Water Distribution System Improvements .........................................................................39

\\Coosbay\projects\2008\608040-HubbardCreek\070-PreliminaryEngineeringReport\PUBS\rpts\PER-Final.doc v
Acronyms and Abbreviations ADD Average Daily Demand cfs cubic feet per second CPE Comprehensive Performance Evaluation CIP Capital Improvement Plan DEQ Department of Environmental Quality DIP Ductile Iron Pipe EA Environmental Assessment EDU Equivalent Dwelling Unit ESWTR Enhanced Surface Water Treatment Rule gpcd gallons per capita day gpm gallons per minute MMD Maximum Monthly Demand MDD Maximum Daily Demand MG Million Gallons mgd million gallons per day NEPA National Environmental Policy Act NTU Nephelometric Turbidity Units - a measurement of turbidity OIFA Oregon Infrastructure Finance Authority OHD Oregon Health Division OWRD Oregon Water Resources Department PER Preliminary Engineering Report PHD Peak Hour Demand ppm parts per million psi pounds per square inch PVC Polyvinyl chlorine RCP Reinforced Concrete Pipe SDWA Safe Drinking Water Act SWTR Surface Water Treatment Rule UGB Urban Growth Boundary UFC Uniform Fire Code UGB Urban Growth Boundary WSDA RD United States Department of Agriculture Rural Development WS Water Surface WTP Water Treatment Plant

\\Coosbay\projects\2008\608040-HubbardCreek\070-PreliminaryEngineeringReport\PUBS\rpts\PER-Final.doc 1
1.0 Introduction The City of Port Orford is an incorporated City within the State of Oregon situated on the Southern Oregon Coast in Curry County. The City of Port Orford is located between the City of Bandon to the north and the City of Gold Beach to the south, as shown in Figure 1. The community was estimated to have a population of 1,285 in 2009 as determined by the Center for Population Research and Census at Portland State University. Port Orford owns and operates a municipal water system comprised of a raw water supply reservoir, water treatment plant, finished water storage tank, and distribution system. In February 2004 a Water Master Plan was completed and in December 2005 the Master Plan was updated and adopted by the Council. The Water Master Plan provided an engineering assessment and planning guidance for the successful management of the City’s water system over a 20 year period. The plan outlines infrastructure improvements required to maintain compliance with State and Federal standards as well as provide for anticipated growth. One primary conclusion of the Master Plan was that the City is running out of raw water supply due to the limited size of the North Fork Hubbard Creek reservoir. The plan recommended several alternatives to consider increasing the City’s water supply, including expansion of the North Fork Hubbard Creek dam, construction of a new dam upstream of the current impoundment, or improve water treatment capabilities to treat brackish water from Garrison Lake. This Preliminary Engineering Report (PER) more clearly defines these alternatives and recommends the improvements needed to provide the City with a water supply which should carry it through the next 50 years.

FigureConsulting Engineers
& Geologists, Inc.
Vicinity Map
April 2010 608040-Vicinity-Map-Fig_1
SHN 608040.070
1
Port Orford
\\C
oosb
ay\p
roje
cts\
2008
\608
040-
Hub
bard
Cre
ek\0
70-P
relim
inar
yEng
inee
ringR
epor
t\Fi
gs, S
AV
ED: 4
/5/2
010
4:05
PM
SFR
AZZ
INI,
PLO
TTED
: 4/9
/201
0 7:
59 A
M, S
HA
WN
FRA
ZZIN
I
PROJECT SITE
Hubbard Creek

\\Coosbay\projects\2008\608040-HubbardCreek\070-PreliminaryEngineeringReport\PUBS\rpts\PER-Final.doc 2
2.0 Study Area The study area related to this PER is defined by all of the lands contained within the City limits and Urban Growth Boundary (UGB) of the City. Additional limits to the study area consist of those portions of the water supply associated with the North Hubbard Creek water shed, impoundment area and transmission lines, see Figure 2.0. 2.1 Physical Environment Port Orford’s coastal climate is characterized by wet winters and relatively dry summers. Temperatures are moderated by onshore marine breezes, which keep conditions relatively cool even in the summer months. Onshore breezes from the Northwest persist during the summer, while periodic but stronger Southwesterly winds occurring during the winter. One of the most vital features in Port Orford is Highway 101, which traverses the City north to south. Commercial development is generally centralized along Highway 101. Residential development is located on both sides of the highway; extending to the west to Garrison Lake and the Pacific Ocean and extending to the east into the foothills. The topography of the City ranges from sea level to an elevation above 225 feet near the top of Coast Guard Hill. 2.2 Economic Conditions The City of Port Orford has an economy based on a small commercial fishing fleet and tourism. RV parks support a seasonal population that, combined with the influx of tourists during the summer, increases the peak water demand. Numerous community events are planned each summer, which can cause the City’s population to swell. During the winter the community settles to a more gradual pace and water consumption reflect the demands of the permanent residents. 2.3 Population Trends The Center for Population Research and Census at Portland State University (PSU) prepares annual population estimates for all incorporated cities and each county within the State of Oregon. The Port Orford certified population estimate for July 1, 2009 was 1,285 residents. This population estimate is the most current for the City and will be used as a basis for projecting future population growth. Historically (1950-2000) City growth rates have averaged approximately 1% per year1. Future projections for the 50-year planning period will be based on this historical trend. The Curry County Comprehensive Plan projects an annual growth rate of 1.2% for the City. Planning for the 20-year planning period will be based on the comprehensive plan estimates. Table 2.1 presents the population projections associated with this Preliminary Engineering Report which includes the 10-year, 20-year, and 50-year planning horizons.
1 Portland State University data.

Figure
\\C
oosb
ay\p
roje
cts\
2008
\608
040-
Hub
bard
Cre
ek\0
70-P
relim
inar
yEng
inee
ringR
epor
t\Fi
gs, S
AV
ED: 4
/5/2
010
9:59
AM
SFR
AZZ
INI,
PLO
TTED
: 4/5
/201
0 10
:15
AM
, SH
AW
N F
RAZZ
INI
Consulting Engineers& Geologists, Inc.
SHN 608040
City of Port OrfordNorth Fork Hubbard Creek Impoundment
Port Orford, Oregon
Study Area
2April 2010 608040-Study-Area-Fig_2

\\Coosbay\projects\2008\608040-HubbardCreek\070-PreliminaryEngineeringReport\PUBS\rpts\PER-Final.doc 3
Table 2.1 Population Projections For the City of Port Orford
Source Year Population Census 2000 1153 PSU Estimate 2009 1285 Projection1 2010 1298 Projection1 2020 1434 Projection1 2030 1584 Long Range Projection2 2060 2134 2
1. Based on 1.2% growth rate; Curry County Comprehensive Plan 2. Based on 1.0% growth rate.

\\Coosbay\projects\2008\608040-HubbardCreek\070-PreliminaryEngineeringReport\PUBS\rpts\PER-Final.doc 4
3.0 Existing Water System The City owns and operates a water utility consisting of supply, treatment, storage and distribution. Figure 3.0 presents a schematic layout and general service area map of the City’s water system. A detailed description of each major element of the system is provided below. 3.1 Raw Water Sources The City of Port Orford has three water sources with existing water rights including the North Fork Hubbard Creek, Garrison Lake, and Gold Run Creek. A discussion of these sources is provided below. 3.1.1 North Fork Hubbard Creek Port Orford’s primary water source is the North Fork of Hubbard Creek where the City has a 3.2 acre-foot impoundment. The watershed for this impoundment encompasses approximately 612 acres east and north of the City’s UGB. Raw water is drawn from the impoundment from a pump house located adjacent to the reservoir approximately 1 mile east of town as shown in Figure 2. Withdrawal records indicate that the City’s has relied upon this water supply as its primary source during the period from 1993-2009. Timber harvest and related road construction impacted the North Fork Hubbard Creek watershed during the early 1990’s. Siltation from runoff from harvested areas reduced the storage volume of the impoundment and had a negative impact on water quality during the years immediately following the timber harvest. Siltation of the reservoir is currently being addressed by a multi-year dredging project being conducted by the City Public Works crews. Dredging activities have provided a temporary improvement to the City’s storage needs while a long range plan to improve the City’s ownership of the watershed and improve timber harvest practices have been effective at restoring the watershed. Siltation of the impoundment is becoming less problematic as measures to improve the watershed have matured. 3.1.2 Garrison Lake The City of Port Orford also has a raw water intake on Garrison Lake that had not been used since the winter of 1993 when it was improved to supplement low quality water from the Hubbard Creek source. The Garrison Lake intake was originally (prior to 1980) located in a shallow marshy area near the discharge of an old millpond. In the late 1990’s the City constructed a new intake at the end of Pinehurst Dock in an attempt to improve water quality by drawing from a deeper point in the lake. This approach was not successful due to poor water quality (high salinity levels) causing taste and odor problems. Since that time, the City has only exercised the equipment at the intake and considers the Garrison Lake intake to be an emergency back-up. Garrison Lake continues to be impacted by salinity levels from wave run-up and overtopping of the Agate Beach berm. During wet winters Garrison Lake flooding has been a recurring problem resulting in frequent breaching of the lake outlet. Lake breaking in turn, depleted a section of the beach, potentially allowing more overtopping and increased lake salinity levels. Breaching of the

PORT
ORF
ORD
Gar
rison
Lake
Mill
GoldRun
Creek
Tich
enor
Cov
e
Nel
lies
TIC
HEN
OR
CEM
ETER
Y
Gra
veya
rdPo
int
Nel
lies
Poin
t
Fort
Poin
t
Battl
eR
ock
Creek
HWY.
ORE
GON
Klo
oque
hR
ock
Agate
Hub
bard
North
Fork
HubbardCreek
COAST
PORT
OR
FORD
HEA
DS
STA
TEPA
RK
PACIFIC OCEAN
PORT
OR
FORD
CEM
ETER
Y
US.
CO
AST
GU
ARD
STA
TIO
N
HU
BBA
RDC
REEK
RES
ERV
OIR
Beach
PARA
DIS
E PO
INT
STA
TE R
ECRE
ATI
ON
SITE
City Limits
City Limits
Figu
re
\\Coosbay\projects\2008\608040-HubbardCreek\070-PreliminaryEngineeringReport\Figs, SAVED: 4/5/2010 9:20 AM SFRAZZINI, PLOTTED: 4/5/2010 9:54 AM, SHAWN FRAZZINI
Con
sulti
ng E
ngin
eers
& G
eolo
gist
s, In
c.SH
N 6
0804
0.07
0
City
of P
ort O
rfor
dN
orth
For
k H
ubba
rd C
reek
Impo
undm
ent
Port
Orf
ord,
Ore
gon
Exis
ting
Wat
er S
yste
m
3A
pril
2010
6080
40-E
x-W
-Dis
trib
-Sys
-ALL
-Fig
_3

\\Coosbay\projects\2008\608040-HubbardCreek\070-PreliminaryEngineeringReport\PUBS\rpts\PER-Final.doc 5
sand barrier may no longer be a problem since Oregon State Parks constructed the Garrison Lake outlet in 2008. This outlet has been effective at regulating the lake level since its construction. The South Coast Watershed Association has studied the water quality of Garrison Lake during the period of lake breaching and frequent overtopping events. In the spring of 2005 a report from the Watershed Association concluded that the lake can be best characterized as a lagoon due to high salinity levels. In 2009, it was reported that salinity levels had declined significantly. Water in the deep pools of the lake may be more brackish than salty. In the future, the water quality may continue to improve which could allow the City to consider Garrison Lake a more viable back-up water supply. 3.1.3 Gold Run Creek Prior to construction of the impoundment on Hubbard Creek, residents of Port Orford obtained their water from a small impoundment on Gold Run Creek. Currently the old impoundment is completely silted in and no longer used as a raw water source. Use of Gold Run as a city water source no longer seems practical; however, the impoundment area may have use for the City as a mitigation area, potentially through a lease of its water right to the State or reservation of the area for wetlands and natural forest habitat. 3.2 Water Rights All water in Oregon is publicly owned. Because of this public ownership, a water right is generally required for anyone to use water from a source, whether surface or underground. Oregon’s water laws are based on the principal of prior application. That is, if a person obtains a water right on a particular source before someone else, the person would have a “senior” water right that would permit them first use of the water during times of lower flows or droughts. A “junior” water right is one that is, by comparison, obtained after other water rights for a particular source have been assigned. A water right may be both senior to some and junior to other water rights. During periods of low water availability, a water right holder may use as much water as their water right allows as long as the use is truly beneficial and all senior water rights are satisfied. This method of resource appropriation governs all water used until the water is exhausted. The water rights currently held by the City are “perfected” that is the City holds a certificate for each of the water rights. Typically, a permit allows an entity to remove water for a limited amount of time. When the time limit has expired, an extension must be filed for the water right. If the permit is converted to a certificate, the water right is said to be “perfected” and extensions are no longer required. The City has water rights for 1.25 cfs (0.81 MGD) from its primary water source on North Fork Hubbard Creek and a water right for an impoundment of up to 3.2-Acre ft (1.04 MG). Additional water rights include those on Garrison Lake (1.0 cfs) and Gold Run Creek (1.0) cfs.
\\Coosbay\projects\2008\608040-HubbardCreek\070-PreliminaryEngineeringReport\PUBS\rpts\PER-Final.doc 6
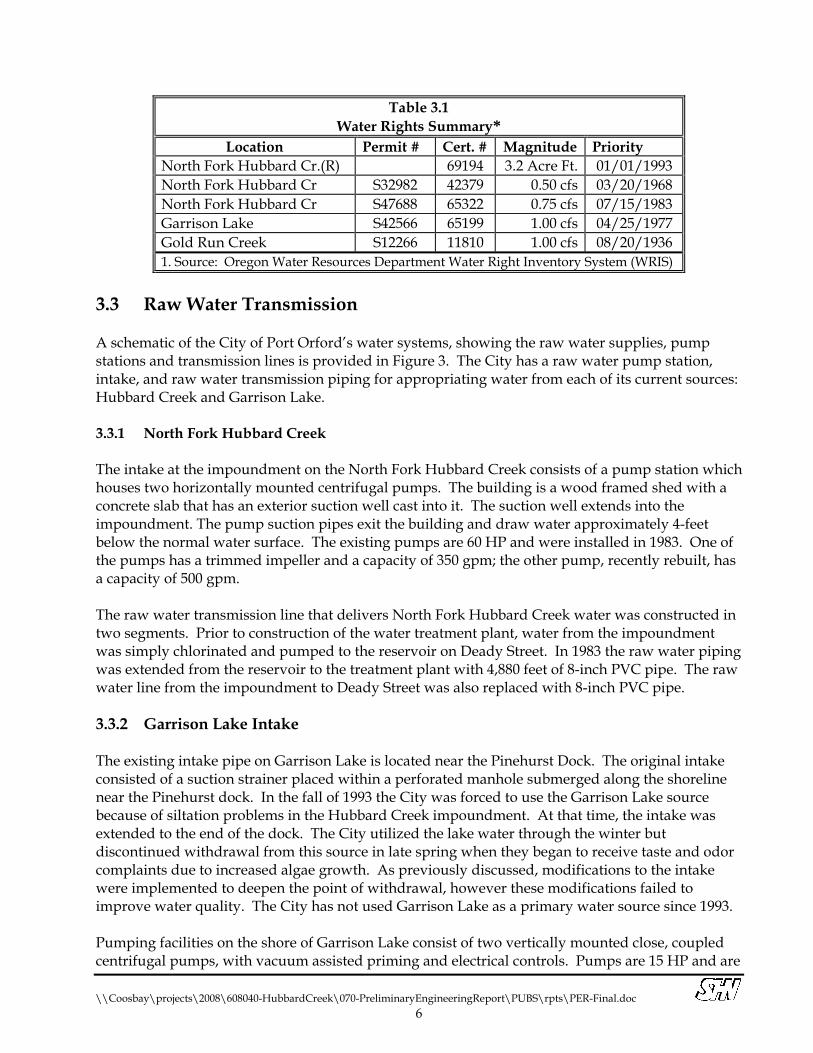
Table 3.1 Water Rights Summary*
Location Permit # Cert. # Magnitude Priority North Fork Hubbard Cr.(R) 69194 3.2 Acre Ft. 01/01/1993 North Fork Hubbard Cr S32982 42379 0.50 cfs 03/20/1968 North Fork Hubbard Cr S47688 65322 0.75 cfs 07/15/1983 Garrison Lake S42566 65199 1.00 cfs 04/25/1977 Gold Run Creek S12266 11810 1.00 cfs 08/20/1936 1. Source: Oregon Water Resources Department Water Right Inventory System (WRIS)
3.3 Raw Water Transmission A schematic of the City of Port Orford’s water systems, showing the raw water supplies, pump stations and transmission lines is provided in Figure 3. The City has a raw water pump station, intake, and raw water transmission piping for appropriating water from each of its current sources: Hubbard Creek and Garrison Lake. 3.3.1 North Fork Hubbard Creek The intake at the impoundment on the North Fork Hubbard Creek consists of a pump station which houses two horizontally mounted centrifugal pumps. The building is a wood framed shed with a concrete slab that has an exterior suction well cast into it. The suction well extends into the impoundment. The pump suction pipes exit the building and draw water approximately 4-feet below the normal water surface. The existing pumps are 60 HP and were installed in 1983. One of the pumps has a trimmed impeller and a capacity of 350 gpm; the other pump, recently rebuilt, has a capacity of 500 gpm. The raw water transmission line that delivers North Fork Hubbard Creek water was constructed in two segments. Prior to construction of the water treatment plant, water from the impoundment was simply chlorinated and pumped to the reservoir on Deady Street. In 1983 the raw water piping was extended from the reservoir to the treatment plant with 4,880 feet of 8-inch PVC pipe. The raw water line from the impoundment to Deady Street was also replaced with 8-inch PVC pipe. 3.3.2 Garrison Lake Intake The existing intake pipe on Garrison Lake is located near the Pinehurst Dock. The original intake consisted of a suction strainer placed within a perforated manhole submerged along the shoreline near the Pinehurst dock. In the fall of 1993 the City was forced to use the Garrison Lake source because of siltation problems in the Hubbard Creek impoundment. At that time, the intake was extended to the end of the dock. The City utilized the lake water through the winter but discontinued withdrawal from this source in late spring when they began to receive taste and odor complaints due to increased algae growth. As previously discussed, modifications to the intake were implemented to deepen the point of withdrawal, however these modifications failed to improve water quality. The City has not used Garrison Lake as a primary water source since 1993. Pumping facilities on the shore of Garrison Lake consist of two vertically mounted close, coupled centrifugal pumps, with vacuum assisted priming and electrical controls. Pumps are 15 HP and are

\\Coosbay\projects\2008\608040-HubbardCreek\070-PreliminaryEngineeringReport\PUBS\rpts\PER-Final.doc 7
rated at 560 gpm each @71 feet of TDH. The City periodically exercises this facility as part of the public works routine maintenance program. New facilities may be required if increased reliance on Garrison Lake is ever considered practical. 3.4 Water Treatment The City’s water treatment facilities were first constructed in 1978 to provide for chemical coagulation, flocculation, sedimentation, filtration, and disinfection of water from the Hubbard Creek impoundment or Garrison Lake. The plant was designed with a capacity of 555 gpm (0.8 MGD) though the plant has been rated by the Oregon Health Division at 450 gpm (equivalent to a filtration rate of 3 gpm/ft2). Sedimentation and filtration process occur in a pre-designed aluminum equipment basin “package” supplied by Keystone Engineering & Products Co., Inc. Upgrades to the treatment plant were performed in 1996 and included: filter to waste piping, effluent turbidity meters and chlorine analyzers, larger chemical storage tanks, improved backwash valving and electrical and control modifications. In 2009 a new on-site chlorine generation and feed system was installed, allowing the City to avoid the continued use of chlorine gas. After treatment, finished water is pumped into the Port Orford distribution system by two 25 HP centrifugal pumps. One pump operates at 290 gpm at 210 feet of dynamic head while the second pump operates between 370 gpm to 415 gpm. Both pumps normally operate independent but can operate in parallel to provide up to 550 gpm to the distribution system. Pump start/stop is controlled by the manual operation of the treatment plant. The 2 pump discharges are equipped with standard spring loaded, non-slam check valves, a flow rate control valve, and manual wafer butterfly valves for isolation. A single 2” combination air/vacuum release valve is located on the combined pump discharge pipe. Piping from the treated water pumps is also configured so that the pumps can be used for filter backwashing in an emergency. A new influent flow meter has been suggested to improve monitoring of the city’s raw water supply line. 3.5 Treated Water Storage Port Orford currently has two treated-water storage reservoirs. The main reservoir (Coast Guard Hill Reservoir) is a pre-stressed concrete 1.0 million gallon reservoir constructed in 1976. It is located midway up the Coast Guard Hill Road (See Figure 3) and has a high water level of 212 feet. The City’s other reservoir is a 0.2 million gallon rectangular concrete reservoir (Deady Street Reservoir), which was built in the early 1950’s. Originally the City pumped water from its Gold Run source and later the North Fork Hubbard Creek source directly to this reservoir. This reservoir has an estimated high water level of 217 feet. Due to the age and condition of the tank roof, the Deady Street Reservoir has not been used in recent years. The City’s Water System Master Plan recommends converting the tank into an emergency raw water storage/pretreatment facility. A third reservoir is located on Hensley Hill. This reservoir is a 50,000-gallon rectangular concrete tank which supplies water to a residential development north of the City within the UGB. The City maintains the water system in this development, including the concrete tank.

\\Coosbay\projects\2008\608040-HubbardCreek\070-PreliminaryEngineeringReport\PUBS\rpts\PER-Final.doc 8
3.5.1 Existing Finished Water Reservoir Capacity Data for each tank is summarized in Table 3.2 below.
Table 3.2 Water Reservoir Data
Coast Guard Hill Reservoir
Deady Street Reservoir
Hensley Hill Reservoir
Capacity 1 MG 0.2 MG 0.05 MG Pressure Zone Low level Low level High level Floor Elevation 183 205 296 Max. Water Surface Elevation 212 214 306 Inside Diameter/Dimension 76.5 50’ X 50’ 30’ X 20’
3.5.2 Existing Reservoir Condition In 1996, level transmitters were installed in both reservoirs to help the City manage its finished water reserves. At the same time the reservoirs were cleaned and inspected and interior crack sealing applied. The exteriors of the tanks were both painted and/or treated. The Coast Guard Hill Reservoir is in good condition, however, the exterior should be treated and cleaned on a routine basis and a new level indicator should be installed. The roofing, fascia, and sheeting on the Deady Street Reservoir exhibit significant signs of dry rot and deterioration, and the concrete needs to be inspected. Consequently, the Deady Street tank is no longer in service. As discussed in the City’s water master plan, the Deady Street tank should be converted to an online or offline raw water supply tank. 3.6 Distribution System The distribution system extends from the storage reservoirs throughout the City in a classic grid iron configuration. In general the system is well looped although some areas of the piping system are undersized. See the Master Plan for more description of the distribution system. 3.6.1 Pipe Inventory The City’s distribution system is a mixture of pipe materials and sizes comprised of approximately 78,000 feet of piping (excluding individual services). More than 70% of the system is older asbestos cement pipe installed in the 1970s. The remaining portions of the piping system are PVC pipe. Much of this PVC pipe is older “Class” PVC pipe, a version of plastic pipe that is inferior to modern C-900 or C-905 PVC pipe. An inventory of the piping system is shown in Table 3.6.1. Of the two materials, the AC pipe appears to be more susceptible to cracking and leaking than the PVC pipe, particularly in areas where ground movement occurs from seismic or unstable soil conditions. The condition of the AC pipe is believed to be contributing to high water losses in the system. Portions of the pipe have become soft or “spongy”, a condition where the outside of the pipe becomes malleable which can allow joints and service connections to weaken and separate.

\\Coosbay\projects\2008\608040-HubbardCreek\070-PreliminaryEngineeringReport\PUBS\rpts\PER-Final.doc 9
Unfortunately, portions of the PVC pipe in the system are also prone to sudden failures from ruptures. Problems with this pipe material have been associated with the older pressure class PVC pipe. Pressure class PVC is thinner than C-900 PVC pipe (commonly used today) and can become more brittle over time due to UV degradation and early formulations of polyvinyl chloride pipe.
Table 3.3 Pipe Inventory
PVC Ft.
Asbestos Ft.
Total Ft.
2-inch 1,294 -- 1,294 4-inch 2,244 13,970 16,214 6-inch 4,924 36,991 41,915 8-inch 10,417 -- 10,417 10-inch 2,199 882 3,081 Totals 19,784 53,137 72,921
3.6.2 Pressure Zones In accordance with OAR 333 residual pressures at service connections in a distribution system must never drop below 20 psi, which is approximately equivalent to a 46-foot tall column of water. Customers must be located more than 46-feet below the minimum water level in a storage tank (or effective elevation of a pressure reducing valve) to have a sufficient pressure without a booster pump. Storage tanks and pressure reducing valves are generally located to provide a pressure of less than 100 psi at the lowest service elevations in a pressure zone. Most of the City’s service area is in the main lower pressure zone, which extends from an elevation of 0 ft. (MSL) to approximate elevation 146 ft. (MSL). Users located above 146-feet elevation need to have their water pumped in order for the pressure to remain at acceptable levels during normal reservoir operating levels. There are four high pressure zones in the City’s water system, each served by a booster pump station. 3.6.3 Booster Pump Stations The water distribution system includes four booster pump stations. The largest of these, Coast Guard Hill serves approximately 50 residences. This pump station consists of three pumps and electrical controls all contained within a small building just below the Coast Guard Hill Reservoir. The pumps are part of a constant pressure package booster system provided by PACO Pump Company. With this system, pump controls sense the system pressure and, when the pressure drops due to water use, the pumps operate automatically to boost the pressure back-up to the desired set point. With all three pumps operating, this station should provide 500 gpm at a total dynamic head of 215 feet. Pump motors consist of one 15 HP jockey pump and two identical 25 HP pumps. Piping within this station is in poor condition. After many years of exposure to the marine environment, fittings are corroded and leaking and the control system is antiquated. Actual fire flow from the station is less than the rated 500 gpm due to the control system causing cycling of the pumps and surging of flows. Replacement of the package pumping system is desired by the City, unfortunately the building was not constructed to allow removal of the equipment without significant alterations to the building. A major upgrade is required for Coast Guard Hill.

\\Coosbay\projects\2008\608040-HubbardCreek\070-PreliminaryEngineeringReport\PUBS\rpts\PER-Final.doc 10
There are currently three other small service areas where small pump stations boost the water pressure to serve 2 to 10 homes. These areas are as follows: the upper ends of Deady Street (north of 9th Street above Battle Rock Park), on the north end of the system up Vista Drive east of Jefferson Street serving the Hensley Hill tank, and on the south end of the City near the intersection of Highway 101 and Cemetery Loop Road. Of these stations, the Deady Street station is in poor condition and requires replacement. Portions of this high pressure zone are noncompliant with Health Division requirements because there are residential customers with less than the required 20- psi minimum operating pressure. 3.6.4 Unaccounted Water The difference between the quantity of treated water pumped from raw water source to the distribution system and the quantity of water measured at customer meters is referred to as unaccounted water. The difference can be attributed to system leaks, inaccuracies in customer meters, unmetered services, and other unmetered use such as fire flows and system flushing. Since the City does not currently meter raw water at the source, losses in the raw water transmission line are unknown. Table 3.6.4 illustrates the recent history of unaccounted water in the City’s water distributions system. Current water losses exceed 50%-percent [one gallon out of every two gallons of treated water produced is lost to leakage]. The City is considerably over the limit of what is considered acceptable loss even without taking into account losses in the raw water transmission line. According to the Oregon Water Resources Department and Oregon Administrative Rules 690-86, all water systems should work to reduce unaccounted water levels to less than 15-percent with a ten percent water loss value being the goal for each water system. Within the last decade, the City has never had water losses below 20 percent even though they continually search for leaks, repair major line breaks, and continually replace their customer metering equipment.
Table 3.4 Annual Water Production and Consumption
Water Record Year
Raw Water Demand1
Treatment Plant Production2
Metered Consumption
System Losses
MG MG MG % 1999 50.64 45.07 35.58 21% 2000 64.39 39.16 39.16 28% 2001 75.38 66.96 39.00 42% 2002 75.57 68.70 41.55 40% 2003 67.13 61.02 37.63 38% 2004 65.61 59.65 38.42 41% 2005 74.87 38.06 36.01 47% 2006 85.03 77.30 35.43 54% 2007 83.77 69.42 33.52 52% 2008 72.18 59.74 30.04 50% 2009 77.36 62.35 29.32 53%
Average Unaccounted Water 47%
1. Metered at the water treatment plant. 2. Treated water plus 10% for backwash.

\\Coosbay\projects\2008\608040-HubbardCreek\070-PreliminaryEngineeringReport\PUBS\rpts\PER-Final.doc 11
3.7 Financial Status 3.7.1 Current Rate Schedule Water meters are read and billed every month and customers are billed for both water and sewer on the same bill. Effective July 1, 2010 rates will be as follows:
Base rate: $25.64 (which includes first 2000 gallons) Consumption rate: First 0 - 2,000 gallons included in base rate 2,001 - 5,000 gallons billed at $6.48 per thousand gallons 5,001 - 10,000 gallons billed at $8.49 per thousand gallons 10,001 - 20,000 gallons billed at $9.49 per thousand gallons Anything over 20,000 gallons billed at $10.49 per thousand gallons
Based upon water use records for the past three years, the average single family residence in Port Orford uses approximately 3,700 gallons per month. This equates to an average monthly water use bill of $37.00.
3.7.2 Annual Operations and Maintenance (O&M) Cost The following excerpts from the City of Port Orford 2009-2010 annual operating budget represent the O&M costs associated with the City’s water fund.
Table 3.5 2009-2010 Operating Budget
City of Port Orford
Account Name
Current Adopted Budget
2009 - 10
Account Name
Current Adopted Budget
2009 - 10 Personal Services Materials and Services Overtime 5,000 Supplies 12,000 City Administrator 12,225 Software Maintenance 10,975 Finance Director 12,105 Uniforms 250 Office Clerk 11,770 Fuel (Equipment and Vehicles) 3,500 Accountant Assistant 3,432 Auditing / Accounting 6,469 Recorder / Clerk 860 Engineering 4,800 P/W Superintendent 31,140 Contract Services 500 WWTP / Operator 4,476 Legal Services 500 Utility Worker 10,685 Telephone 2,000 Seasonal Worker 5,480 Postage 1,700 Maintenance Worker #2 9,555 Travel & Training 2,800

\\Coosbay\projects\2008\608040-HubbardCreek\070-PreliminaryEngineeringReport\PUBS\rpts\PER-Final.doc 12
Table 3.5, continued
Account Name
Current Adopted Budget
2009 - 10
Account Name
Current Adopted Budget
2009 - 10 Personal Services Materials and Services Public Works Tech 12,390 Insurance & Bonds 6,000 Social Security 9,110 Electricity 28,600 PERS Retirement 16,000 Repairs / Maint. - WTP 10,000 Workers Comp / Disability 3,500 Repairs / Maint. - Pump Station 5,000 Health, Dental, Life 36,720 Repairs / Maint. - Water Lines 8,000 Unemployment Insurance 3,000 Small Tools and Minor Equipment 1,264
Total Personal Services 187,448 Vehicle & Equipment Maint. 3,000 Meter Repairs 2,500 Dues & OR Statutes 400 Permits 1,500 Miscellaneous 200 Equipment Testing 500 Testing 3,500
Total Materials and Services 115,958
Total Operations and Maintenance $ 303,406
3.7.3 Capital Improvement Plan The Water Master Plan Update presents a capital improvement plan for the planned upgrade of the system components identified in need of improvements. That CIP included improvements to the City’s source, treatment, storage, and distribution system with all proposed projects totaling approximately $8.4 million in 2005. Water production and use records have indicated that unaccounted water has increased dramatically since the Master Plan was completed. It has become more apparent that more thorough and immediate attention must be given to the distribution system along with insuring a source of supply for the next fifty years. 3.7.4 Users by Category The City of Port Orford currently sells finished water through approximately 680 serviced connections associated with the following breakdown of user classification:

\\Coosbay\projects\2008\608040-HubbardCreek\070-PreliminaryEngineeringReport\PUBS\rpts\PER-Final.doc 13
3.7.5 Existing Debts The City of Port Orford’s water funds currently support three separate long term debts.
1. During the 2008-09 fiscal year, The City Council approved an internal loan agreement between the Water SDC Fund to the Water Enterprise Fund. The principal amount was $63,850 with an interest rate of 2.5% per annum. This loan is to be repaid over a period of four years. The current annual payment including principal and interest for FY 09-10 is $16,972.
2. A Water Revenue Bond in the amount of $462,181 was issued in October, 1997 for
improvements to the City’s municipal water system. Annual payments including 5.01% interest are due December each year. The current annual payment including principal and interest for FY 09-10 is $43,023.
3. In 2005 the City entered into a loan agreement with Sterling Savings Bank in association
with its purchase of a Vac-Con truck. Payments of $16,454 are made annually, including 5.50% interest, through October 2010.
Table 3.6 EDUs by Customer Class
Res & Small Com. EDUs EDU 591 MF Res User EDUs EDU 35 RV Park EDUs EDU 57 No. Res, MF, RV & Sm Com Type EDUs EDU 692 Exclusive Res Users w/o Sm Com EDU 598 No. EDUs Large Commercial EDU 129 No EDUs Small Commercial EDU 94 Total EDUs EDU 821

\\Coosbay\projects\2008\608040-HubbardCreek\070-PreliminaryEngineeringReport\PUBS\rpts\PER-Final.doc 14
4.0 Need for Project The City’s Water System Master Plan identified that raw water availability during dry weather months was insufficient during drought periods to meet the demands of the City. In addition, the high level of water losses (at that time 30 percent) would have a significant impact on the ability of the water supply system to meet future demand. It is not uncommon during the late summer months for the City to appropriate all of the flow in the North Fork of Hubbard Creek, causing the reach of stream below the dam to go dry. Additional water supply was recommended to address this issue and prevent the City from running out of water in the near future. A more focused evaluation of the City’s raw water supply needs and production within the North Fork Hubbard Creek watershed is presented in this section. A hydrological model of the existing watershed is also presented and used to analyze alternatives to address the City’s supply shortages. The City’s projected demands for water were evaluated based upon current water usage, estimated growth rate, and significant reductions of unaccounted for water. Since completion of the Water Master Plan in 2005, water production and use records indicate that unaccounted water has increased dramatically. In 2000, unaccounted water was approximately 28% of the treated water production. As represented in Table 3.6.4, unaccounted water has now reached a level of 52% of production based upon records for the past three years. 4.1 Hydrological Model (North Hubbard Creek) The North Fork Hubbard Creek watershed is an un-gauged tributary of Hubbard Creek which drains to the Pacific Ocean just south of the city. The lack of gauging data for this system required modeling expected run-off based on basin characteristics and precipitation. The Hydrological Modeling System HEC-HMS provided by the Army Corps of Engineers Hydrologic Engineering Center was employed to model the watershed and proposed impoundments. HEC-HMS is designed to simulate the precipitation-runoff process of dendritic watersheds (watersheds with tributary streams formed by erosion of sediments and taking on the pattern of the veins of leaves). The hydrographs produced by the model are used directly for determination of water availability, forecast flows, and reservoir spillway design. 4.1.1 HEC-HMS Methodology The HEC-HMS modeling system allows the user to select from multiple methods for characterizing the watershed, defining meteorological events, and calculating infiltration and run-off. To develop a model for the Hubbard Creek watershed the Soil Conservation Service (SCS) Curve number methodology was employed to define run-off and infiltration characteristics. The SCS unit hydrograph was employed to calculate the predicted surface run-off volumes. Basin Descriptions The Hubbard Creek watershed has an estimated area of 0.94 square miles (612 acres) and can be divided into three primary sub-basins. These sub-basins are delineated in Figure 4.1.

FigureConsulting Engineers
& Geologists, Inc.
\\C
oosb
ay\p
roje
cts\
2008
\608
040-
Hub
bard
Cre
ek\0
70-P
relim
inar
yEng
inee
ringR
epor
t\Fi
gs, S
AV
ED: 4
/9/2
010
8:22
AM
SFR
AZZ
INI,
PLO
TTED
: 4/9
/201
0 8:
25 A
M, S
HA
WN
FRA
ZZIN
I
City of Port OrfordHubbard Creek
Watershed Characteristics
4.1SHN 608040
April 2010 608040-Watershed Character-Fig_4-1
\\Coosbay\projects\2008\608040-HubbardCreek\070-PreliminaryEngineeringReport\PUBS\rpts\PER-Final.doc 15
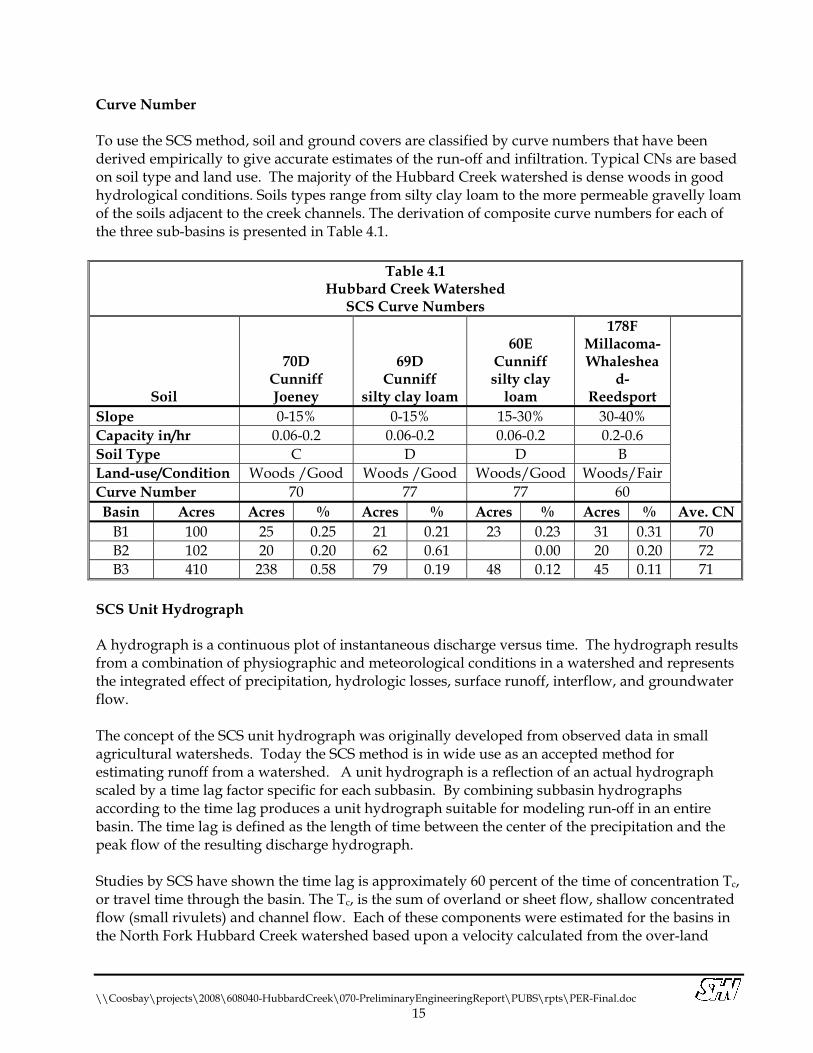
Curve Number To use the SCS method, soil and ground covers are classified by curve numbers that have been derived empirically to give accurate estimates of the run-off and infiltration. Typical CNs are based on soil type and land use. The majority of the Hubbard Creek watershed is dense woods in good hydrological conditions. Soils types range from silty clay loam to the more permeable gravelly loam of the soils adjacent to the creek channels. The derivation of composite curve numbers for each of the three sub-basins is presented in Table 4.1.
Table 4.1 Hubbard Creek Watershed
SCS Curve Numbers
Soil
70D Cunniff Joeney
69D Cunniff
silty clay loam
60E Cunniff silty clay
loam
178F Millacoma- Whaleshea
d-Reedsport
Slope 0-15% 0-15% 15-30% 30-40% Capacity in/hr 0.06-0.2 0.06-0.2 0.06-0.2 0.2-0.6 Soil Type C D D B Land-use/Condition Woods /Good Woods /Good Woods/Good Woods/Fair Curve Number 70 77 77 60 Basin Acres Acres % Acres % Acres % Acres % Ave. CN
B1 100 25 0.25 21 0.21 23 0.23 31 0.31 70 B2 102 20 0.20 62 0.61 0.00 20 0.20 72 B3 410 238 0.58 79 0.19 48 0.12 45 0.11 71
SCS Unit Hydrograph A hydrograph is a continuous plot of instantaneous discharge versus time. The hydrograph results from a combination of physiographic and meteorological conditions in a watershed and represents the integrated effect of precipitation, hydrologic losses, surface runoff, interflow, and groundwater flow. The concept of the SCS unit hydrograph was originally developed from observed data in small agricultural watersheds. Today the SCS method is in wide use as an accepted method for estimating runoff from a watershed. A unit hydrograph is a reflection of an actual hydrograph scaled by a time lag factor specific for each subbasin. By combining subbasin hydrographs according to the time lag produces a unit hydrograph suitable for modeling run-off in an entire basin. The time lag is defined as the length of time between the center of the precipitation and the peak flow of the resulting discharge hydrograph. Studies by SCS have shown the time lag is approximately 60 percent of the time of concentration Tc, or travel time through the basin. The Tc, is the sum of overland or sheet flow, shallow concentrated flow (small rivulets) and channel flow. Each of these components were estimated for the basins in the North Fork Hubbard Creek watershed based upon a velocity calculated from the over-land

\\Coosbay\projects\2008\608040-HubbardCreek\070-PreliminaryEngineeringReport\PUBS\rpts\PER-Final.doc 16
watercourse, channeled slopes, and an estimate of surface roughness. Calculated values for the time of concentration and lag time are summarized in Table 4.2
Table 4.2 Hubbard Creek Watershed Run-off Calculations
B1 B2 B3
n Slope Vel. Len. Tc Tc Tc fps Ft. Hrs. Ft Hrs Ft Hrs
Sheet Flow 0.4 0.02 NA 300 0.68 300 0.68 300 0.68 Shallow Concentrated Flow
NA 0.02 2.2 500 0.06 500 0.06 500 0.06
Channel Flow 0.05 0.03 2.0 3500 0.48 4200 0.58 9400 1.30 Total Time of Concentration (Tc) 1.22 1.32 2.04 Lag Time(Lg) 0.73 0.79 1.23
Meteorological Descriptions Several methods were utilized to examine the effects of precipitation on the predicted run-off. These includes
Input of hyetographs: time series precipitation data from neighboring gauged weather stations,
Input of hyetograph developed from statistical precipitation data, Design storms for varying return intervals based on intensity duration, and Design storms for varying return intervals using the SCS Type 1A storm.
Time-Series Precipitation Data In the first method precipitation data from a gauged weather station in Brookings, Oregon (Weather Station 351055) was input directly. Precipitation in the Hubbard Creek watershed is comparable to that in Brookings as evidenced by the fact that the City is on an equivalent isopluvial contours for typical design storms. Precipitation data was downloaded for the period from January 1975 through December 2002 and used to model the discharge over a period of one year. The time series analysis provided the following:
Daily averages providing the basis for the Annual Average Flow scenario; Daily precipitation in 1976 providing the basis for the Minimum Annual Flow scenario; and Daily precipitation in 1996 providing the basis for the Maximum Annual Flow scenario.
Statistical Precipitation Data Precipitation data based on statistical summaries of monthly rainfall data reported by National Oceanographic and Atmospheric Administration (NOAA) was used to compare model generated stream flow to flow estimates generated by WARS program for 50 percent and 80 percent exceedance levels. Exceedence is defined as the probability, or percentage of time, that a streamflow will be greater than or equal to a defined stream-flow.

\\Coosbay\projects\2008\608040-HubbardCreek\070-PreliminaryEngineeringReport\PUBS\rpts\PER-Final.doc 17
Design Storms Design storms with return intervals from 12-years to 100 years were modeled based on isopluvials of 6 -hr and 24-hr storms published by the NOAA. All storm simulations were assumed to happen in January following a period of average rainfall in December, with ground conditions saturated and the stream flowing full at an average of 10 cfs. The frequency storm method is designed to produce a design storm using statistical precipitation data for the intensity and duration of precipitation. Meteorological models for the design storms were created based upon the data available from isopluvials for the 6-hr and 24-hr storms as summarized in Table 4.3.
Table 4.3 Intensity Duration Data
Design Storms Return Interval 6 Hrs1 12 Hrs2 24 Hrs1
Years inches inches inches 2 2.2 3.0 5.0 5 2.4 3.5 5.5
10 2.8 4.1 6.5 25 3.4 6.0 8.0 50 3.6 6.2 8.5
100 4.0 6.5 9.0 500 4.8 7.0 11.0
1. Data for 6-hr , and 24-hr duration from NOAA isopluvials 2. Data for 12-hr duration extrapolated from the return period diagram
Design storms were also modeled using the SCS Type 1A 24-hr synthetic rainfall distributions developed by SCS for storms representing the Pacific maritime climate. 4.1.2 Model Results Outflow from Hubbard Creek Reservoir was modeled using simulations employing a range of meteorological events. A summary of model simulations is included in Appendix B, Stream flow Analyses. Results from these simulations of run-off and stream discharge in the North Fork Hubbard Creek Watershed will be used for two purposes:
1. Estimating the minimum stream flow to determine additional reservoir storage capacity , and
2. Simulating the maximum flow for design of hydraulic control structures for the dam. To verify reliability of the model, a minimum of one of three methodologies were employed to validate model results. The verification process included:
1. Statistical analysis of monthly flows from two small gauged watersheds with similar basin soil characteristics, area, and precipitation;

\\Coosbay\projects\2008\608040-HubbardCreek\070-PreliminaryEngineeringReport\PUBS\rpts\PER-Final.doc 18
2. Peak discharge estimates from prediction equations provided by Oregon Water Resources Department (WRD), and;
3. Estimated flows at the 50% and 80% exceedence level as calculated by the WRD water availability program, (WARS).
Average Monthly Run-off Simulation results based on recorded minimum, average, and maximum annual precipitation are summarized in Table 4.4. Results from the model are compared to minimum, average and maximum monthly average flows from the comparable gauged watersheds in the Alsea River Basin. The average run-off was obtained by averaging the daily precipitation at the Brookings weather station for the period of record, 1975 - 2000. The minimum run-off was modeled using precipitation data from Brookings for 1976, the year with the lowest annual precipitation during the 25 year period. The maximum recorded annual precipitation occurred in 1996 so precipitation data from Jan 1996 – through December 1996 was entered to simulate run-off during a wet year.
Table 4.4 Hubbard Creek Flows - Simulated
Minimum Average Maximum
HEC(1976) Gauged
WS1 HEC(AVE)2 Gauged
WS1 HEC(1996) Gauged
WS1 cfs cfs cfs cfs cfs cfs Jan 4.3 3.9 6.5 14.0 11.7 23.0 Feb 9.1 2.5 9.1 10.4 11.8 23.0 Mar. 4.6 3.1 7.2 8.7 3.6 17.0 April 3.5 2.3 5.2 5.1 5.9 9.7 May 0.9 1.1 2.9 3.0 4.6 6.2 Jun. 0.5 0.6 1.6 1.5 0.3 4.2 Jul, 1.1 0.4 0.4 0.7 0.4 1.6 Aug. 3.1 0.2 0.9 0.4 0.0 1.1 Sep. 0.4 0.2 1.6 0.6 1.0 2.1 Oct. 1.9 0.2 4.8 1.5 5.3 4.1 Nov. 3.4 1.8 9.2 7.4 14.9 13.5 Dec 1.7 5.2 10.4 11.8 14.7 25.0
1. Gauged water sheds US Geological Survey Alsea River Basin, Flynn Creek (1430689) and Deer Creek (14306810).
2. HEC Hydrological Modeling System Statistical Return Intervals The results of modeling based meterological data (monthly rainfall statistics) are summarized in Table 4.5 and compared to results obtained from WARS and from the comparative gauged sub-basins of the Alsea River Basin. The simulation assumes that stream flow will be proportional to

\\Coosbay\projects\2008\608040-HubbardCreek\070-PreliminaryEngineeringReport\PUBS\rpts\PER-Final.doc 19
rainfall and does not take base flow conditions into account. Validation of the model predictions following periods of zero rainfall appear to under-predict stream flows during dry months. Estimates of North Fork Hubbard Creek flows are based on a percentage of the flows predicted to occur at the mouth of Hubbard Creek. For simplicity, the percentage of flow was based on an equal percentage of the basin area.
Table 4.5 Statistical Estimates of North Fork Hubbard Creek Flow
50% Exceedence 80% Exceedence 95% Exceedence1
WARS2 Gauged HEC3 WARS Gauged HEC Gauged WS3 HEC Hubbard North F. WS4 Hubbard North F. WS3
cfs cfs cfs cfs cfs cfs cfs cfs cfs cfs
Oct 4.37 0.64 0.62 3.09 2.82 0.41 0.25 1.56 0.18 0.63
Nov 23.60 3.43 3.73 6.4 8.23 1.20 1.29 3.57 0.76 1.85
Dec 55.60 8.09 7.88 7.9 19.70 2.87 4.00 4.80 1.87 2.75
Jan 56.10 8.16 9.35 7.56 22.70 3.30 4.55 4.36 2.97 2.2
Feb 57.00 8.29 6.97 6.21 27.90 4.06 4.25 4.00 2.48 2.01
March 48.80 7.10 5.85 5.5 25.40 3.69 3.43 3.70 2.19 2.15
April 24.20 3.52 3.67 3.12 14.90 2.17 2.34 1.65 1.68 0.74
May 10.10 1.47 2.13 0.76 7.70 1.12 1.44 0.98 0.98 0.39
June 11.00 1.60 1.03 1.96 5.19 0.75 0.74 0.39 0.53 0.09
July 8.01 1.17 0.53 0.20 4.37 0.64 0.39 0.29 0.29 0
Aug 5.27 0.77 0.35 0.23 3.66 0.53 0.25 0.12 0.14 0
Sept 3.54 0.51 0.29 1.3 3.30 0.48 0.18 0.56 0.14 0.11
1. Values used for 95% exceedence flows are shown in bold. 2. WARS: Water Availability Reporting System, Water Resources Department. 3. HEC-HMS Modeling System, simulations based on precipitation statistics NOAA Atlas 20. 4. Gauged water sheds from the US Geological Survey for Alsea River Basin, Flynn Creek (1430689) and Deer Creek (14306810).
Storm Flow Scenarios Simulated discharge from the North Fork Hubbard Creek watershed following storm events was modeled using two different methods of creating synthetic rainfall distributions. Both methodologies were based on ispopleths of 24-hr precipitation. In the first method, described previously as the frequency storm, the intensity of precipitation during the first six hours was based on isopluvials of 6-hr storm events. The second method, the SCS Type 1A storm, uses an empirically derived rainfall distribution to describe the 24-hr storm event Simulation results for run-off from design storms are presented in Table 4.6. The rainfall distribution for a Type 1 A storm assumes that approximately 2/3 of the 24-hour precipitation occurs in the first 12 hours. The result is a high instantaneous run-off. The peak instantaneous run-off for the Type 1 A storm is sustained for approximately 1 hour, but the storm with a more evenly

\\Coosbay\projects\2008\608040-HubbardCreek\070-PreliminaryEngineeringReport\PUBS\rpts\PER-Final.doc 20
distributed precipitation event has a sustained peak of approximately 4 hours. The average daily discharge flow is similar for both methodologies.
Table 4.6 North Fork Hubbard Creek Watershed
Discharge Resulting from Design Storms Return Interval
Discharge “Frequency Storm” Type 1A Storm Peak Discharge Estimates2
Years
Peak (3-4 hrs.) Peak Day
Peak (1 hr)
Peak (3-4 hrs.)1
Peak Day
Peak Flow
Lower Limit
Upper Limit
cfs cfs cfs cfs cfs cfs cfs cfs 2 198 122 389 200 107 88.6 50.6 155 5 236 134 429 225 119 130 76.3 222 10 284 144 508 300 144 159 92.4 272 25 349 197 627 325 181 195 111 344 50 369 210 667 350 193 223 124 402
100 410 220 706 375 206 251 135 466 500 487 268 869 400 256 315 158 629 1. The four hour sustained peak estimated from graphical methods is included in Appendix B. 2. Prediction Equations from the WRD
Design Criteria Model simulations of average monthly stream discharge in the North Fork of Hubbard Creek correlated well with the WRD predictions (in WARS ), but during low flow periods following extended dry weather the model may underestimate stream flows. Since there is close approximation between the flows estimated based on the gauged watersheds tributary to the Alsea River and the flow reported in WARS, it is considered appropriate to use the gauged watersheds as a basis of predicting minimum flows in the North Fork of Hubbard Creek. The discharge resulting from the design storms will be used to design appropriate discharge control structures for the dam. Preliminary modeling of the reservoir assumed a 40 foot weir length to control the high water level. At this length the one–hour instantaneous flow for the five-hundred year storm predicted for the Type 1A Storm raised the pool depth 3.8 ft. Based on this analysis, the following assumptions will be applied for determining the dam height and hydraulic control structure design.
No dam overflow will occur during the five hundred year storm event
A five foot freeboard will be provided over the top of the spillway to account for increased water level during extreme flow events and to provide for adequate free-board to prevent wind generated overtopping

\\Coosbay\projects\2008\608040-HubbardCreek\070-PreliminaryEngineeringReport\PUBS\rpts\PER-Final.doc 21
4.2 Water Demands Water requirements were updated from the Water Master Plan projections based on an analyses performed on the past three years of water usage records provided by the City. The monthly average water requirement for the City is summarized in Table 4.7.
Table 4.7 Monthly Average Water Demand1
City of Port Orford Raw Water2
(gallons) Treated Water
(gallons) metered usage
(gallons) Jan 6,996,000 5,899,667 2,430,833 Feb 6,572,000 5,084,667 2,125,567
March 7,332,000 5,327,667 2,241,384 Apr 6,097,500 4,760,333 2,186,463
May 6,673,000 5,545,333 2,746,387 June 6,773,000 5,744,333 2,714,547 July 7,518,333 6,278,667 3,386,797 Aug 6,642,000 5,603,667 3,282,450 Sept 5,795,000 5,036,000 3,006,120 Oct 5,724,667 4,500,667 2,342,443
Nov 5,709,333 4,643,667 2,148,893 Dec 6,343,000 5,410,667 2,605,637
1. Monthly data from consumption use records from 2007-2209. 2. Raw water usage estimated from treated water records plus 10
percent for WTP plant usage. A community’s water source must be capable of meeting the City’s demand for water over a period of many years. Water rights that allow the appropriation of water are becoming more critical to small communities such as Port Orford because as the State's population and water demand increases, the number of viable water sources remains constant. Therefore, the water source(s) considered for Port Orford were evaluated to ensure enough water is available to meet the City’s water requirements 50-years into the future. Monthly raw water requirements for the City were projected 50 years into the future based upon anticipated population growth rates (1% per year). Projections were made considering; 1) no significant leak reduction in the system (52% losses), and; 2) with unaccounted water losses of 10%, pursuant to the goals of the Oregon Water Resources Department (discussed in Section 3). Water usage projections are summarized in Table 4.8.

\\Coosbay\projects\2008\608040-HubbardCreek\070-PreliminaryEngineeringReport\PUBS\rpts\PER-Final.doc 22
Table 4.8
Raw Water Demand Current Projected
52% 10% 52% 10% MGD MGD MGD MGD
Jan 0.226 0.121 0.282 0.151 Feb 0.235 0.126 0.288 0.155
March 0.237 0.127 0.303. 0.163 Apr 0.203 0.109 0.335 0.180
May 0.215 0.116 0.370 0.199 June 0.226 0.121 0.416 0.223 July 0.243 0.130 0.459 0.247 Aug 0.214 0.115 0.444 0.239 Sept 0.193 0.104 0.407 0.219 Oct 0.185 0.099 0.317 0.171
Nov 0.190 0.102 0.291 0.156 Dec 0.205 0.110 0.282 0.151
4.3 Storage Requirements Storage requirements were evaluated through the use of a water balance comparing water supply with the water demand of the City including unaccounted water. As discussed in Section 4.1, monthly water production from the North Fork of Hubbard Creek during the storage period of the 95 percent exceedence year are based upon statistical data from the two Alsea River tributaries with flow gauging stations as summarized in Table 4.5. 4.3.1 Water Balance Scenarios Water balance scenarios were created which included the following component:
Supply based on North Fork Hubbard Creek at 95% exceedence level Projected 50-year demand including unaccounted for water at 50 percent and 10 percent Losses due to evaporation Maintenance of minimum stream flow of 0.14 cfs Implementation of a conservation plan resulting in 15 percent reduction in water usage
Scenario 1 – 50 percent water losses Considering existing water usage, implementation of conservation during drought periods, 50 percent water loss rates, and release of minimum stream flows during the summer, it was estimated that a storage impoundment of 158 acre-feet would be required. An impoundment of this size would require a dam height of 50 feet or greater. Increasing the height of the existing dam to create an impoundment large enough to accommodate the City’s water demand with a 50 percent or greater water losses is not good practice. In order to economically address increasing the source of

\\Coosbay\projects\2008\608040-HubbardCreek\070-PreliminaryEngineeringReport\PUBS\rpts\PER-Final.doc 23
supply for the City, the distribution system losses need to be reduced to the WRD recommended rate of 10 percent. Scenario 2 – 10 percent water loss. Scenario 2 considers the size of the impoundment required for the 95 percent exceedence year (1 in 20 year drought) assuming leakage rates in the distribution system are reduced to 10 percent or less and conservation is not employed to curtail water usage. If water demand during the drought is not curtailed by conservation, and the available water supply is reduced by 0.14 cfs to provide minimum stream flows; it is estimated that storage of 72 acre feet would be required. This analysis is presented graphically in Figure 4.2.
0
10,000,000
20,000,000
30,000,000
40,000,000
50,000,000
60,000,000
Jan Feb March Apr May June July Aug Sept Oct Nov Dec
Gal
lon
s
Figure 4.2Water Supply v Raw Water Demand
(10% Leakage , Stream @ 95% Exceedence)
50-Year Projected Ave. Month Demand Available Supply (Not Incl Min. Stream Flow = 0.14 cfs)
Storage Required 23.41 MG (72 acre-f t)
Scenario 3 - Conservation As currently practiced by the City, it is assumed that a conservation plan will be implemented during drought years to reduce water use during the period of minimum stream flows. With this scenario, the required storage is reduced by approximately 13 acre-ft (4 MG) resulting in a more economical dam height of 38 feet and a reservoir sized to accommodate 59 acre feet of storage. Figure 4.3 represents the water balance assuming summer time water usage is reduced by 15 percent due to conservation measures, and water losses are reduced to 10 percent or less. The water balance analyses also include maintaining a minimum stream flow of 0.14 cfs.

\\Coosbay\projects\2008\608040-HubbardCreek\070-PreliminaryEngineeringReport\PUBS\rpts\PER-Final.doc 24
0
10,000,000
20,000,000
30,000,000
40,000,000
50,000,000
60,000,000
Jan Feb March Apr May June July Aug Sept Oct Nov Dec
Gal
lon
sFigure 4.3
Water Supply v Raw Water Demand(10% Leakage , Stream @ 95% Exceedence, 15% Conservation)
"50-Year Projected Ave. Month Demand" Available Supply (Not Incl. Min Steam Flow = 0.14 cfs) Raw Water Required w/Conservation
Storage Required 19.37 MG (59 acre-f t)
Scenario 4 – No Stream Flow If all of the water produced by the North Fork Hubbard Creek watershed is stored because it is not considered necessary to maintain a minimum flow in the creek downstream of the reservoir, the size of the required impoundment could be reduced to 26 acre ft. (assuming conservation practices are implemented). This analysis is shown in Figure 4.4. In this scenario, water would not be released during the late summer, consequently, impacts to down stream users may need to be mitigated.

\\Coosbay\projects\2008\608040-HubbardCreek\070-PreliminaryEngineeringReport\PUBS\rpts\PER-Final.doc 25
0
10,000,000
20,000,000
30,000,000
40,000,000
50,000,000
60,000,000
70,000,000
Jan Feb March Apr May June July Aug Sept Oct Nov Dec
Gal
lon
sFigure 4.4
Water Supply v Raw Water Demand(10% Leakage , Stream @ 95% Exceedence, 15% Conservation)
"50-Year Projected Ave. Month Demand" Watershed Production (No Min. Stream Flow) Raw Water Required w/Conservation
Storage Required 8.52 MG (26 acre-f t)
Summary of Storage Options Storage requirements for an impoundment on the North Fork Hubbard Creek will need to provide storage for average monthly flows projected for the year 2060 during a drought equal to the 95 percent exceedence (1 in 20 year event). The amount of storage considered will be affected by distribution system leakage rates, conservations practices and whether it is necessary to maintain minimum stream flows downstream of the impoundment. Resulting storage requirements for four scenarios are summarized in Table 4.10. Impoundment water surface elevations are estimated from the stage storage relationship presented in Figure 4.5.
Table 4.10 Reservoir Requirements
50-year Projected Demand City Of Port Orford
Leakage Consv. Min. Flow Required Storage
Water Surface
Reservoir Height
Percent cfs Acre -ft MG ft Ft. 51 Yes 0.14 158 51.61 45 50 10 No 0.14 72 23.41 35 40 10 Yes 0.14 59 19.37 33 38 10 Yes 0 26 8.52 26 31 10 No 0 39 12.55 30 35

³

\\Coosbay\projects\2008\608040-HubbardCreek\070-PreliminaryEngineeringReport\PUBS\rpts\PER-Final.doc 26
A new reservoir should be constructed to keep the City of Port Orford from running out of water in the North Fork Hubbard Creek Impoundment during a moderate or worse drought event. Before the reservoir is constructed, the City must make repairs to the water distribution system to achieve a leakage rate of 10 percent. Conservation measures should be considered especially during drought years. The design should also consider maintaining a minimum stream flow of 0.14 cfs. Based on these criteria, an impoundment providing 59 acre feet is recommended. Preliminary design criteria for the recommended reservoir are summarized in Table 4.11.
Table 4.11 Hubbard Creek Impoundment
Preliminary Design Criteria Year 2060 Reservoir Storage 59 Acre-ft (19.37 MG) Water Surface 33 feet Height1 38 feet Spillway and Outfall Capacity 500-Year storm Event Peak Day Flow 270 cfs (174 MGD) Sustained Peak 490 cfs (317 MGD) Peak Hour 870 cfs (572 MGD) Weir Length 40 feet
1. Includes 5 feet of freeboard

\\Coosbay\projects\2008\608040-HubbardCreek\070-PreliminaryEngineeringReport\PUBS\rpts\PER-Final.doc 27
5.0 Alternatives Evaluation The Water Master Plan Update presented three feasible alternatives for providing a long term water supply for the City of Port Orford. The three alternatives, plus the alternative of relying on the existing supply (the do nothing alternative) have been considered as part of this Preliminary Engineering Report. All alternatives are based on the assumption that major improvements to the water distribution system are required to bring the leakage rate down to 10 percent or less.
Alternative 1 Do Nothing Alternative- No new water supply, improve distribution system and in-line storage including Deady Street Reservoir.
Alternative 2 Expand Existing Impoundment – Increase storage capacity to 59 acre feet.
Alternative 3 New Impoundment – Increase storage capacity to 59 acre feet with new impoundment.
Alternative 4 Garrison Lake Source – Construct treatment facilities to allow Garrison Lake to be used as the primary source.
5.1 Do Nothing The do-nothing alternative is not acceptable as the leakage of unaccounted water in the system is excessive and promulgating unnecessarily high O&M Costs along with stressing the current water supply. In addition to tightening up the distribution system, the current water source is not adequate without adding storage to allow some stream discharge during the dry months and for assuring the City a reliable source for the next 50 years. In order for Hubbard Creek to continue to serve as the primary source of water for Port Orford system leakage needs to be addressed, additional storage would need to be provided by expanding the existing impoundment, by constructing a new impoundment, or by implementing both alternatives. 5.2 Expand Existing Impoundment Based on the analysis presented in Section 4, an impoundment of approximately 59 acre feet will be necessary to provide the storage required to assure adequate water supply during dry months while accommodating long-term growth. Estimates of staged storage based on recent survey information indicate that the water surface of Hubbard Creek Impoundment would need to be raised by approximately 26 feet to a new height of 38 feet to provide the required storage (see Figure 5.1). Raising the existing dam to the height required will require construction of a new earthen dam behind the existing dam. Allowing for 3 feet of free-board between the maximum water surface for the emergency spillway and an additional 2 feet to prevent over flow, the top of the new dam will need to be raised to 38 feet. The new elevation will be 121 feet measured from the base of dam at elevation 83 feet.1
1 The base elevation is based on Port Orford Water System Improvements, Sheet B1 which shows the bottom of impoundment 12 ft below overflow. (April 1998, HGE Architects and Engineers)

N
FigureConsulting Engineers
& Geologists, Inc.
\\C
oosb
ay\p
roje
cts\
2008
\608
040-
Hub
bard
Cre
ek\0
70-P
relim
inar
yEng
inee
ringR
epor
t\Fi
gs, S
AV
ED: 4
/2/2
010
3:30
PM
SFR
AZZ
INI,
PLO
TTED
: 4/5
/201
0 3:
45 P
M, S
HA
WN
FRA
ZZIN
I
City of Port OrfordNorth Fork Hubbard Creek Impoundment
Port Orford, Oregon
Proposed Reservoir
5.1SHN 608040.070
April 2010 608040-Proposed Reservoir-Fig_5-1

\\Coosbay\projects\2008\608040-HubbardCreek\070-PreliminaryEngineeringReport\PUBS\rpts\PER-Final.doc 28
5.3 New Impoundment Based on the topography of the North Fork Hubbard Creek basin, there is a potential new reservoir site located approximately 1/3 mile upstream from the existing impoundment (Figure 5.2). Above this location, the Canyon widens considerably prohibiting the economics of dam construction. Appropriation of water at this site will require that the City apply for a new permit to store water and a secondary right to release the water to the lower impoundment where it could be appropriated under the existing water right. It may also be feasible to increase the lower impoundment water right and thereby increase the City’s total Hubbard Creek water right. While the option appears feasible at this preliminary stage, there will be extensive permitting, geotechnical, and environmental issues that must be addressed before the City could actually implement this improvement. Based on existing topographical information a staged storage relationship was developed for the upstream site. To provide the required storage of approximately 59 acre feet, a water depth of approximately 33 feet would be required. It is estimated that the height of the required dam would be 38 feet which is comparable to the height of the dam required to expand the existing impoundment. Both dams would have a span of approximately 90 feet. When compared to expanding the existing impoundment by construction a new dam, locating the dam upstream would have some major disadvantages, which will increase construction costs relative to the cost of expanding the existing impoundment.
Lack of access will require additional construction cost for a new road access, siting of new pump station, power supply, and the new dam will require additional transmission line.
5.4 Garrison Lake Source The City has an intake on Garrison Lake that has not been used since 1993 due to poor water quality. The use of Garrison Lake to supplement the Hubbard Creek source during dry weather periods would require additional measures to improve water quality. Salinity in Garrison Lake has impacted the existing Garrison Lake source resulting in poor treated water quality and taste concerns. In recent years, conditions in the lake have deteriorated and the existing intake may not provide water that can be made potable without requiring significant and complicated treatment technologies. The Master Plan suggested relocation of the intake to the upper arm of the lake above Arizona Street and increased treatment such as ultra-filtration or reverse osmosis to remove salinity. 5.4.1 Intake Relocation SHN visited the lake’s intake site to evaluate how to relocate the intake to an area protected from salt-water intrusion. Options appear to be limited to relocating the intake to the deepest pool east of Arizona Street. In this location, salinity levels should be less due to the location being up gradient of the lower lake and isolated by the bridge and the Arizona Street roadway prism. (The

\\Coosbay\projects\2008\608040-HubbardCreek\070-PreliminaryEngineeringReport\PUBS\rpts\PER-Final.doc 29
Lake Rehabilitation Study addresses other alternatives for preventing saltwater intrusion in the lake that are beyond the scope of this PER). Relocation of the intake to a new location will involve transfer of water rights; installation of a new raw water transmission line either on-land or along the lake bottom; improvements to the raw water pump station or construction of a new raw water pumping facility; and construction of a new multi level intake. 5.4.2 Intake Design In the past algae growth in the lake has posed problems with taste and odor. The ability to withdraw water from various lake depths may eliminate this problem. Water quality sampling should be conducted at the proposed site to determine the effects of salinity and algae on water quality. The sampling and analysis should also include determination of whether there are any occurrences of blue-green algae. Access to allow isolating various intake levels will need to be considered. It may be more desirable to install several pipelines from the shore to each intake screen, allowing the City to select an intake level by modulating valves from shore. 5.4.3 Treatment Because of the high levels of organics and salinity in Garrison Lake it will be necessary to use membrane filtration to treat this source. Membrane filtration units provide clarification, softening disinfection, and organic removal, in compact automated modular units and they provide a positive physical barrier between contaminants in the feed water and the purified product water. To remove salinity Reverse Osmosis (RO) high pressure membranes will be required Since the lake can be classified as brackish due to salt-water intrusion, the removal of salt and other metal ions will require RO membrane systems. Depending on the degree of salinity it may be possible to purify a portion of the raw water source and blend it with water that has been treated using ultra-filtration membranes. Ultra-filtration will remove: viruses, bacteria, particulates, and high molecular weight compound greater than 0.01 microns but will not remove divalent ions such as salt. Micro-filtration or ultra-filtration would also be required as a pre-treatment step preceding the RO membranes. These treatment systems are feasible, but require significant operator training and skill. It is likely that a person trained for this type of plant would be paid more to work for a large city where wages would be more commiserate with their skills. 5.4.4 Transmission Line Two options for construction of the transmission line involve a submerged line running along the lake bottom or an on-land alignment constructed from Arizona Street to the 18th Street boat ramp. Both options would connect to the existing raw water intake line. Routing of the pipeline across the lake bottom is the preferred option but would require addressing several permitting and engineering issues. Another important engineering issue is how to place the line under the bridge since in water work will be difficult to construct and may not be permitted with heavy equipment. It is assumed, therefore that the work under the bridge will involve hand excavating a trench and encasing the pipe in a concrete backfill for protection from vandalism and scour. If the water line can be installed across the lake, then the existing raw water pumping facility

\\Coosbay\projects\2008\608040-HubbardCreek\070-PreliminaryEngineeringReport\PUBS\rpts\PER-Final.doc 30
will need to be upgraded to serve the new intake. The upgrade would need to address selection of pumping equipment that provided the necessary suction lift required for the extended pipeline. If the on-land route is selected, then a new raw water pump station will be required. 5.4.5 Source Protection To use Garrison Lake as a primary source of water would require that the City implement policies to protect Garrison Lake water quality and reverse problems of eutrification and water quality deterioration. These are difficult changes for the City to implement without County and State support since the northern half of Garrison Lake is under Curry County’s jurisdiction and Highway 101 crosses over the lake. As future development occurs along the lake, this issue will become more important, since invariably, lakefront property will be highly desirable. Policy issues addressing storm water discharges and potential prohibition against septic systems along the lakeshore will need to be considered. Because most of the residential development along the northern portion of the lake is located outside the City’s jurisdiction, Curry County participation would be required. 5.5 Evaluation of Alternatives 5.5.1 Cost Comparison Costs for the three supply alternatives were compared based on preliminary estimates of presented in the Water Master Plan Update. A construction cost for installing a new intake, treatment system, and transmission line for water from Garrison Lake was comparable to the estimated cost for the new dam constructed on the North Fork of Hubbard Creek. The new treatment system will be technically complex and increased costs for operation and maintenance should be anticipated.
Table 5.1 Water Supply Alternatives
Preliminary Estimate of Cost1
Garrison Lake New Dam
Existing Site New Dam
Upstream Site Construction Cost $4,492,350 $3,829,275 $4,480,252 Power costs1 $5,062 $10,124 $10,124 Additional O&M $100,000 - Present Value 0&M2 $714,662 $206,352 $206,352 $5,312,074 $4,045,751 $4,696,728 1. Power costs include estimated pumping cost for raw water and additional cost for RO pressure system 2. Present value over thirty year time period assuming federal real discount rate of 2.7%
5.5.2 Evaluation Matrix The estimated present value cost of the water supply alternatives are close enough that other project criteria may result in the preferred project having a higher cost factor than the lowest cost option . Based on the evaluation matrix presented in Table 5.2 constructing a new dam to expand the existing Hubbard Creek Impoundment is the preferred alternative, not only because it is the lowest cost project, but also because of the other values provided by the project.

\\Coosbay\projects\2008\608040-HubbardCreek\070-PreliminaryEngineeringReport\PUBS\rpts\PER-Final.doc 31
Table 5.2
Evaluation Matrix
Garrison Lake Source Expand Existing Impoundment Upstream Dam
Land Acquisition Required Some Required Not Required (1-3) 2 2 3
Water Rights Move Intake Move intake,
Increased storage New Intake, New storage
(1-3) 2 2 1
Operational Complexity Membrane water
treatment Similar to existing
Release and storage required
(1-3) 1 3 2
Quality / Reliability Potential for Taste
and Odor and Salinity High Quality
High Quality / Less Area
(1-3) 1 3 2 Environmental Considerations
Construction of intake Impacts: downstream flow, riparian areas,
fisheries (1-3) 2 1 1
Present Worth Cost (2-6) 4 6 4
Total Score 12 17 13

\\Coosbay\projects\2008\608040-HubbardCreek\070-PreliminaryEngineeringReport\PUBS\rpts\PER-Final.doc 32
6.0 Proposed Project The proposed project consists of two phases. The first phase of the project addresses the high water loss associated with the City’s distribution system. The second phase addresses the City’s need to expand its raw water storage facility. While either phase can be accomplished independent of the other, the water losses in the distribution system must be reduced before the City runs out of water during a drought year. Furthermore, it would appear to be poor planning if the City constructed a new impoundment when over half of the water stored in the facility would be lost during distribution. Based on the watershed production analyses performed for the North Fork of Hubbard Creek, the City will not have sufficient water during a year with rainfall less than the average year. 6.1 Distribution System Improvements The distribution system improvements include replacing aged and deteriorated pipe, installing new fire hydrants, valves, appurtenances, service laterals and pump stations throughout 90 percent of the existing distribution system. The project is proposed to be performed in stages to minimize disruption of service and the inconvenience of construction activities to small impact areas within the City. When one phase has been completed, the next phase would be initiated, moving construction impacts to another area of town. Phasing areas and sequencing will be determined during the design period of the project. Figure 6.1 depicts the various elements of the water system replacement project. A detailed cost estimate of for each phase of the distribution system project is provided in Appendix C 6.2 Reservoir Expansion The second phase of the project involves securing an adequate water source for the City through expanding the dam and impoundment. The new earthen dam would have a height of 38 feet from the bottom of the existing stream channel to the crest. The impoundment would expand from the existing 3.2 acre-feet storage capacity to a maximum of 59 acre-ft. This phase of the project would also involve installation of new raw water intake structure, principal spillway, bottom drain, stilling basin and a new raw water pumping and pretreatment facility. Figures 6.2 through 6.4 provide a conceptual design of the proposed new earthen dam structure and associated reservoir improvements. 6.2.1 Earthen Dam Construction Earthen dams consist primarily of the dam structure and associated hydraulic elements. The type of dam structure is primarily dictated by the foundation materials (pervious vs. semi pervious) and the type of materials available in the near vicinity for creating the embankment of the main dam structure. Published geologic literature and surficial geologic investigations indicate the proposed reservoir and dam site area is underlain by bedrock consisting of silicified sandstone, siltstone, and shale characteristic of the early crotaceous age Rocky Point Formation. Cut bank exposures and shallow test pits encountered highly to moderately weathered, moderately to highly fractured sandstone

PORT
ORF
ORD
Gar
riso
n
Lake
Mill
GoldRun
Creek
Tich
enor
Cov
e
Nel
lies
Cov
e
TIC
HEN
OR
CEM
ETER
Y
Gra
veya
rdPo
int
Nel
lies
Poin
t
Fort
Poin
t
Battl
eR
ock
Creek
HWY.
OREGON
Klo
oque
hR
ock
Agate
Hub
ba
North
Fork
HubbardCreek
COAST
PORT
OR
FORD
HEA
DS
STA
TEPA
RK
PACIFIC OCEAN
PORT
OR
FORD
CEM
ETER
Y
US.
CO
AST
GU
ARD
STA
TIO
N
HU
BBA
RDC
REEK
RES
ERV
OIR
Beach
PARA
DIS
E PO
INT
STA
TE R
ECRE
ATI
ON
SITE
City Limits
City Limits
Figu
re
\\Coosbay\projects\2008\608040-HubbardCreek\070-PreliminaryEngineeringReport\Figs, SAVED: 4/2/2010 6:32 PM RSTILLMAKER, PLOTTED: 4/5/2010 3:51 PM, SHAWN FRAZZINI
Con
sulti
ng E
ngin
eers
& G
eolo
gist
s, In
c.60
8040
City
of P
ort O
rfor
dN
orth
For
k H
ubba
rd C
reek
Impo
undm
ent P
orje
ct
Wat
er D
istr
ibut
ion
Syst
emIm
prov
emen
ts
6.1
Mar
ch 2
010
6080
40-W
-Dis
trib
-Impr
ovem
ents
-Fig
_6-1

Figure
\\Coosbay\projects\2008\608040-HubbardCreek\070-PreliminaryEngineeringReport\Figs , SAVED: 4/2/2010 5:01 PM SFRAZZINI, PLOTTED: 4/5/2010 3:53 PM, SHAWN FRAZZINI
Consulting Engineers&
Geologists, Inc.
608040-Dam
-Intake-Overflow
_figs_6A
pril 20106.2
Plan View
of Proposed Earthen Dam
City of Port O
rford, Oregon
Hubbard C
reek Reservoir
City of Port O
rford
SHN
608040.070

Figure
\\Coosbay\projects\2008\608040-HubbardCreek\070-PreliminaryEngineeringReport\Figs , SAVED: 4/2/2010 5:01 PM SFRAZZINI, PLOTTED: 4/5/2010 3:56 PM, SHAWN FRAZZINI
Consulting Engineers&
Geologists, Inc.
608040-Dam
-Intake-Overflow
_figs_6A
pril6.3
Dam
and IntakeSectional V
iew of Proposed
City of Port O
rford, Oregon
Hubbard C
reek Reservoir
City of Port O
rford
SHN
608040.070

Figure
\\Coosbay\projects\2008\608040-HubbardCreek\070-PreliminaryEngineeringReport\Figs , SAVED: 4/2/2010 5:01 PM SFRAZZINI, PLOTTED: 4/5/2010 3:58 PM, SHAWN FRAZZINI
Consulting Engineers&
Geologists, Inc.
608040-Dam
-Intake-Overflow
_figs_6A
pril 20106.4
Dam
and Primary Spillw
aySectional V
iew of Proposed
City of Port O
rford, Oregon
Hubbard C
reek Reservoir
City of Port O
rford
SHN
608040.070

\\Coosbay\projects\2008\608040-HubbardCreek\070-PreliminaryEngineeringReport\PUBS\rpts\PER-Final.doc 33
with minor sandy siltstone strata. Natural slopes were typically mantled with 2-feet to over 8-feet of loose rocky colluvial soils. Moderately hard, slightly to moderately weathered sandstone would be anticipated at relatively shallow depths beneath the abutments and foundation of the proposed dam and in the proposed embankment borrow area. The bedrock materials in the abutments and beneath the embankment cut off trench are expected to be relatively “impervious and capable of supporting the embankment loads”. On site borrow materials, weathered sandstone and colluvial soils consisting of a well graded mix of textures, are expected to be suitable for homogeneous fill embankment that incorporates internal filter and drainage structures. The foundation of the dam will be extended through the upper alluvial and loose colluvial soil layers and keyed into the weathered sandstone comprising the walls and floors of the North Fork Hubbard Creek canyon. Site specific geologic investigations that include deep borings and permeability testing will need to be performed to determine the subsurface characteristics and geotechnical construction requirements at the site. Based on preliminary investigations, there appears to be satisfactory borrow sites for the embankment fill materials located, just northeast of the proposed dam expansion (See Figure 4.6). The borrow site is in close vicinity of the project which will be beneficial to overall economics of construction. Literature research and surficial reconnaissance at and adjacent to the proposed reservoir site indicates that earthquake fault and slope failure hazards are minimal to negligible. 6.2.2 Spillway Design The primary spillway is proposed to be a drop inlet. Alternatives evaluated included the following types of spillways: Chute, gated tower, labyrinth, and side channel. Other options should be investigated further, however, site constraints may restrict the feasibility of alternatives and for purposes of this report, a drop inlet is the preferred approach. A preliminary hydraulic analysis of the drop inlet indicates that a 60” diameter pipe (minimum 25 square feet of flow area) would be required to pass the design flows. If approved by WRD, the drop inlet would serve as a spillway and also as an emergency overflow. If approved as an emergency structure, the inlet weir would also need to provide 40 feet of weir length. As proposed, the drop inlet would be able to convey approximately 700 CFS (500 year storm peak runoff), providing capacity for the emergency event. Depending upon final design considerations, the spillway will discharge in the vicinity of the existing creek channel on the downstream side of the new dam structure. The discharge area will include a stilling basin to address energy dissipation and potential scour. 6.2.3 Reservoir Drain The new impoundment should be equipped with a drain. A minimum 12-inch diameter ductile iron pipe with restrained joints and encased in concrete will be used for a bottom drain of the reservoir. The upstream inlet will be located adjacent to the raw water inlet structure and controlled with a sluice gate. The inlet should be equipped with a vent to atmosphere to allow inlet control and free drainage of the pipe when the gate is closed. The downstream end of the drain should discharge to the spillway outlet structure which could also have a gate valve installed for double isolation.

\\Coosbay\projects\2008\608040-HubbardCreek\070-PreliminaryEngineeringReport\PUBS\rpts\PER-Final.doc 34
6.2.4 Raw Water Intake Structure The proposed raw water intake system will consist of an intake level control tower which will collect water from the reservoir and deliver it through a gravity supplied pipe to the raw water pump stations wet well. One of the elements associated with design of the intake structure is the ability to draw raw water from varying depths in the reservoir. Raw water supplies associated with other reservoirs on the Oregon Coast have experienced the occurrence of taste and odor problems along with high levels of manganese during certain times of the year. Those occurrences are typically associated with algae growth, solubility of manganese, and thermocline formation within the reservoir. Raw water with high manganese levels can usually be avoided by adjusting the depth in which the raw water is taken from, however, too high of an intake level could create taste problems as more algae is introduced into the supply. Alternatively, an adjustable intake structure was evaluated including retractable suction and adjustable floating devices. The recommended intake structure is mechanically the simplest to operate of all the alternatives considered. The intake structure would consist of a stationary tower with bridge access and manually actuated sluice gates to open intake ports to the desired lake level. Adjustment every 5 feet would provide the City with access to the full vertical stratum of the impoundment. The structure would also be configured to allow maintenance access to the inlet of the bottom drain. 6.2.5 Raw Water Pump Station From the intake structure, raw water will be carried by a 12-inch diameter pipe to a pumping facility adjacent to the crest of the dam at the south west corner of the reservoir. The pumping equipment will consist of two 500 gpm vertical turbine pumps (duplex system). Raw water will be withdrawn from a wet well and discharged into the existing raw water transmission line. The new pumps will replace the existing 500 gpm pump and the existing 350 gpm pump. Each pump will be equipped with a hydraulically actuated well control valve to prevent surging and water hammer in the transmission main. In addition to raw water pumping equipment, the facility will be equipped with a new SCADA system, turbidity monitoring equipment, flow metering equipment, video surveillance, prechlorination equipment, and back-up power supply. The SCADA system will communicate equipment status, emergency conditions, real time raw water turbidity, flow data, and allow improved monitoring with the City’s existing surveillance system. Prechlorination equipment will allow the City to improve contact time at the water treatment facility, particularly during color events which seasonally impact raw water quality. The prechlorination equipment proposed would match the on-site generation equipment currently installed at the City’s water treatment facility. 6.2.6 Fish Passage Structure Considering the existing impoundment and local wildlife habitat, it is not anticipated that a fish passage structure will be installed with the new project. However, a final determination of the need for fish passage will occur through future review of the project with National Marine Fisheries and the Oregon Department of Fish and Wildlife.
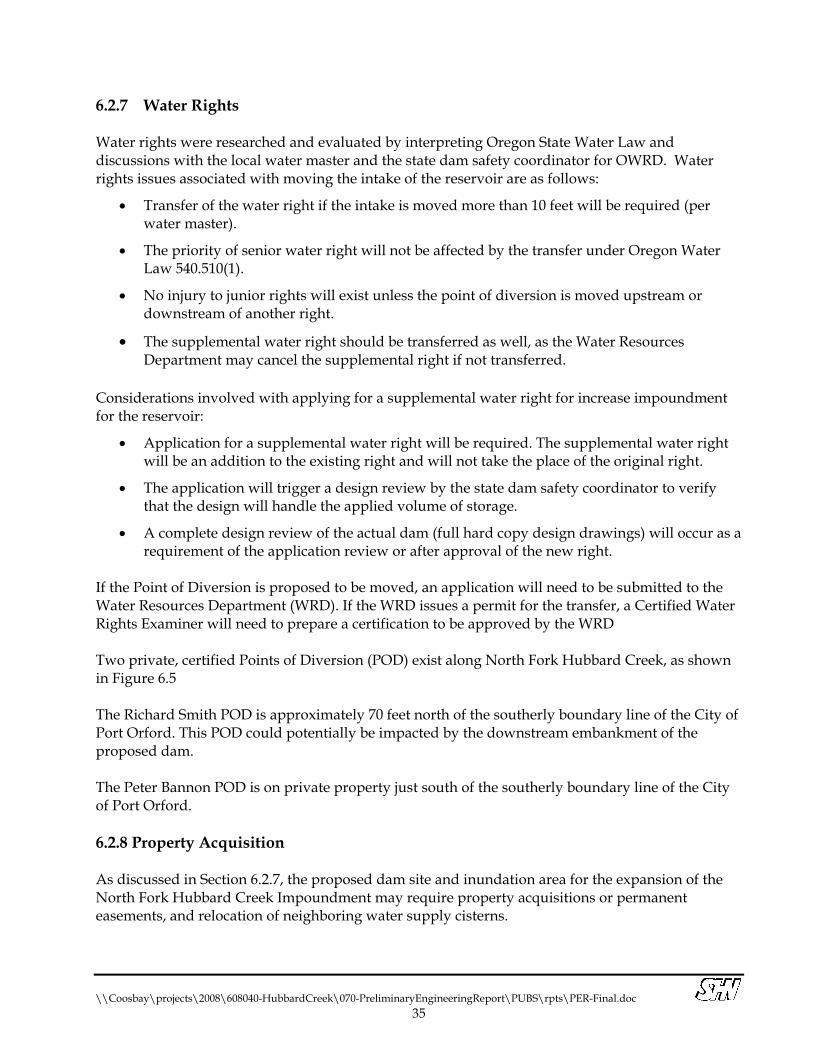
\\Coosbay\projects\2008\608040-HubbardCreek\070-PreliminaryEngineeringReport\PUBS\rpts\PER-Final.doc 35
6.2.7 Water Rights Water rights were researched and evaluated by interpreting Oregon State Water Law and discussions with the local water master and the state dam safety coordinator for OWRD. Water rights issues associated with moving the intake of the reservoir are as follows:
Transfer of the water right if the intake is moved more than 10 feet will be required (per water master).
The priority of senior water right will not be affected by the transfer under Oregon Water Law 540.510(1).
No injury to junior rights will exist unless the point of diversion is moved upstream or downstream of another right.
The supplemental water right should be transferred as well, as the Water Resources Department may cancel the supplemental right if not transferred.
Considerations involved with applying for a supplemental water right for increase impoundment for the reservoir:
Application for a supplemental water right will be required. The supplemental water right will be an addition to the existing right and will not take the place of the original right.
The application will trigger a design review by the state dam safety coordinator to verify that the design will handle the applied volume of storage.
A complete design review of the actual dam (full hard copy design drawings) will occur as a requirement of the application review or after approval of the new right.
If the Point of Diversion is proposed to be moved, an application will need to be submitted to the Water Resources Department (WRD). If the WRD issues a permit for the transfer, a Certified Water Rights Examiner will need to prepare a certification to be approved by the WRD Two private, certified Points of Diversion (POD) exist along North Fork Hubbard Creek, as shown in Figure 6.5 The Richard Smith POD is approximately 70 feet north of the southerly boundary line of the City of Port Orford. This POD could potentially be impacted by the downstream embankment of the proposed dam. The Peter Bannon POD is on private property just south of the southerly boundary line of the City of Port Orford. 6.2.8 Property Acquisition As discussed in Section 6.2.7, the proposed dam site and inundation area for the expansion of the North Fork Hubbard Creek Impoundment may require property acquisitions or permanent easements, and relocation of neighboring water supply cisterns.

N
\\Coosbay\projects\2008\608040-H
ubbardCreek\070-Prelim
inaryEngineeringReport\Figs, SA
VED
: 4/5/2010 4:03 PM SFR
AZZIN
I, PLOTTED
: 4/5/2010 4:04 PM, SH
AW
N FRA
ZZINI
FigureC
onsulting Engineers&
Geologists, Inc.
City of Port O
rfordH
ubbard Creek R
eservoirC
ity of Port Orford, O
regon
Water R
ights
6.5SH
N 608040.070
April 2010
608040-Water-Rights-Fig_6-5
\\Coosbay\projects\2008\608040-HubbardCreek\070-PreliminaryEngineeringReport\PUBS\rpts\PER-Final.doc 36
The proposed lower reservoir is located on City of Port Orford property, Tax Lot 1300 in T. 32 S., R. 15 W., Section 33D and Tax Lot 100 in T. 33 S., R. 15 W., Section 4A. The inundation area of the most easterly tributary appears to encroach on adjacent Tax Lot 300 in T. 33 S., R. 15 W., Section 3B. An agreement to release a portion of the interest in that property should be negotiated before moving forward with the design phase of the project. Also, the area proposed for construction of the dam will potientially require that the Point of Diversion certified to Richard Smith be transferred to a new location. Potential impacts to property at points of diversion are shown in Figure 6.5.

\\Coosbay\projects\2008\608040-HubbardCreek\070-PreliminaryEngineeringReport\PUBS\rpts\PER-Final.doc 37
7.0 Costs and Implementation 7.1 Basis for Cost Estimates The cost estimates presented in this Plan will typically include four components: construction cost, engineering cost, contingency, and legal and administrative costs. Each of the cost components is discussed in this section. The estimates presented herein are preliminary and are based on the level and detail of planning presented in this Study. As projects proceed and as site-specific information becomes available, the estimates may require updating. 7.1.1 Construction Costs The estimated construction costs in this Plan are based on actual construction bidding results from similar work, published cost guides, discussions with local contractors and other construction cost experience. Reference was made to the as-built drawings, and system maps of the existing facilities to determine construction quantities, elevations of the reservoirs and major components, and locations of distribution lines. Where required, estimates will be based on preliminary layouts of the proposed improvements. The cost estimates provided within this Plan assume that all projects are constructed under public contract. Future changes in the cost of labor, equipment, and materials may justify comparable changes in the cost estimates presented herein. For this reason, common engineering practices usually tie the cost estimates to a particular index that varies in proportion to long-term changes in the national economy. The Engineering News Record (ENR) construction cost index is most commonly used. It is anticipated that construction of any necessary projects will start by the summer of 2011. Cost estimates presented in this Plan for construction performed in later years should be projected with an increase of three percent per year or future yearly ENR indices can be used to calculate the cost of projects for their construction year based on the annual growth in the ENR index. It is also recommended that in the event other public works projects are being performed in the same location, (i.e., sewer, street, storm, etc.), planning priority be given to combining the water projects with the projects at hand. The City can save money by eliminating repetitive mobilization, demolition, and road patching in the same locations. 7.1.2 Contingencies A contingency factor equal to approximately 10 percent of the estimated construction cost has been added. In recognition that the cost estimates presented are based on conceptual planning, allowances must be made for variations in final quantities, bidding market conditions, adverse construction conditions, unanticipated specialized investigation and studies, and other difficulties which cannot be foreseen at this time but may tend to increase final costs. 7.1.3 Engineering The cost of engineering services for major projects typically includes special investigations, a predesign report, surveying, foundation exploration, preparation of contract drawings and

\\Coosbay\projects\2008\608040-HubbardCreek\070-PreliminaryEngineeringReport\PUBS\rpts\PER-Final.doc 38
specifications, bidding services, construction management, inspection, construction staking, start-up services, and the preparation of operation and maintenance manuals. Depending on the size and type of project, engineering costs may range from 15 to 25 percent of the contract cost when all of the above services are provided. The lower percentage applies to large projects without complicated mechanical systems. The higher percentage applies to small, complicated projects. The engineering costs for waterline and reservoir design and construction projects will average 17 percent and 20 percent of the construction cost, respectively. Additional engineering services may be required for specialized project elements. This could include geotechnical evaluations, structural evaluations, and other specialized consulting activities. Where possible, these projects have been included in the estimates. 7.1.4 Legal and Administrative An allowance of four percent (4%) of construction cost has been added for legal and administrative services. This allowance is intended to include internal project planning and budgeting, grant administration, liaison, and interest on term loan financing, legal services, review fees, legal advertising, and other related expenses associated with the project. 7.1.5 Land Acquisition Some projects may require acquisition of additional right-of-way or property for construction of specific improvement. The need and cost for such expenditures is difficult to predict and must be reviewed as a project is developed. It should be noted that the cost of land is subjective and depends on the seller, current land use practices, the size of the plot to be acquired, options available to the City, and other issues outside the common practice of engineering. Some land acquisition may be required for relocation of private property Points of Diversion and for private property east of the existing dam which will be inundated by the new reservoir. 7.2 Distribution System Improvements Costs The opinion of probable costs for the water distribution system improvements are summarized in Table 7.1 below. All phases of the project are presented in Figure 3 except where the primary loop is identified as Idaho and Jackson Street projects. Appendix C contains detailed cost breakdowns of each of the phases.

\\Coosbay\projects\2008\608040-HubbardCreek\070-PreliminaryEngineeringReport\PUBS\rpts\PER-Final.doc 39
Table 7.1
North Fork Hubbard Creek Impoundment Project Opinion of Probable Costs
Water Distribution System Improvements Breakdown by Project Phase
Idaho Street $ 602,105 Jackson Street $ 911,291 Phase 1 $ 1,330,718 Phase 2 $ 1,217,270 Phase 3 $ 1,766,519 Phase 4 $ 1,781,694 Phase 5 $ 1,932,835 Phase 6 $ 1,064,308 Phase 7 $ 696,784 Deady Street Pump Station $ 173,575 Cost Guard Hill Pump Station $ 169,645
Total Project Cost $ 11,753,142
Breakdown by Quantity & Unit price Unit Quantity Unit Price Cost
Mobilization LS All varies $ 958,000 4" PVC Waterline LF 1,557 $ 30 $ 46,710 8" PVC Waterline LF 49,836 $ 50 $ 2,491,800 10" PVC Waterline LF 23,874 $ 65 $ 1,551,810 Service Laterals (short) LF 4,890 $ 15 $ 73,350 Service Laterals (long) LF 22,820 $ 30 $ 684,600 Connection to Existing EA 75 $ 2,500 $ 187,500 Fire Hydrants EA 51 $ 3,000 $ 153,000 AC Pavement LF 52,686.9 $ 25 $ 1,317,173 Gravel Surfacing LF 22,580.1 $ 15 $ 338,702 Highway 101 Crossings EA 13 $ 25,000 $ 325,000 Misc Fittings LS All varies $ 501,000 Deady Street Pump Station $ 173,575 Coast Guard Hill Pump Station $ 169,645 Construction Cost $ 8,897,186 Contingency (10%) $ 897,186 Engineering (17%) $ 1,525,217 Administration (4%) $ 358,875 Total Project Cost $ 11,753,142
7.3 North Fork Hubbard Creek Dam/Impoundment Expansion Costs The opinion of probable costs for the Dam/Impoundment expansion project is presented in Table 7.2 on the following page.

\\Coosbay\projects\2008\608040-HubbardCreek\070-PreliminaryEngineeringReport\PUBS\rpts\PER-Final.doc 40
Table 7.2 City of Port Orford Water System CIP
North Fork Hubbard Cr. Dam/Impoundment Expansion Project Unit Quantity Unit Price Cost
Mobilization LS 100% $ 306,179 $ 306,179 Clearing and Grubbing AC 0.5 $ 40,000 $ 20,000 Haul Route Construction LF 400 $ 120 $ 48,000 Foundation Excavation CY 4,500 $ 10.40 $ 46,800 Embankment CY 170,000 $ 4.85 $ 824,500 72" Primary Spill Way LF 130 $ 535 $ 69,550 72" Inlet Structure LS 100% $ 85,000 $ 85,000 Outlet Structure/Stilling Basin LS 100% $ 145,000 $ 145,000 12" CIP Underdrain LF 150 $ 265 $ 39,750 Raw Water Inlet Structure LS 100% $ 175,000 $ 175,000 Inlet Strucure Access Bridge LS 100% $ 55,000 $ 55,000 12" Raw Water Line LF 80 $ 140 $ 11,200 Raw Water Pump Station LS 100% $ 425,000 $ 425,000 Toe Filter/Drains CY 1,611 $ 44.50 $ 71,690 Cofferdam/Temporary Source LS 100% $ 250,000 $ 250,000 Misc Fittings/Appurtenances LS 100% $ 225,000 $ 225,000 Construction $ 2,857,668 Contingency (10%) $ 285,767 Engineering (20%) $ 571,534 Administration (4%) $ 114,307 Total Cost $ 3,829,275
7.4 Operation and Maintenance Costs It is anticipated that operation and maintenance (O&M) costs currently experienced by the City, will be reduced as a direct result of the proposed projects. Current annual O&M costs are presented in Section 3 of this study. Personal services costs should remain the same since personnel changes are not required. However, annual electrical costs should be reduced by about 1/3, because of the reduction in system losses (less finished water will have to be produced through the treatment plant and pumped throughout the system). The electrical savings also reflect cost savings associated with the energy efficient pumping facilities being proposed. Additional savings should be realized due to the decrease in maintenance resulting from a replacement of the older, worn out distribution system with new. Operating and maintaining the reservoir and raw water pump station should be similar in costs as the current system. The City should not have expenses related to dredging but they would have a little more land area for landscape maintenance (trimming, mowing, etc.). The City’s current annual budget for O&M related to their water fund is $303,406. Upon reviewing line item expenditure in the O&M budget, savings, in today’s dollars, are estimated at approximately $16,500.
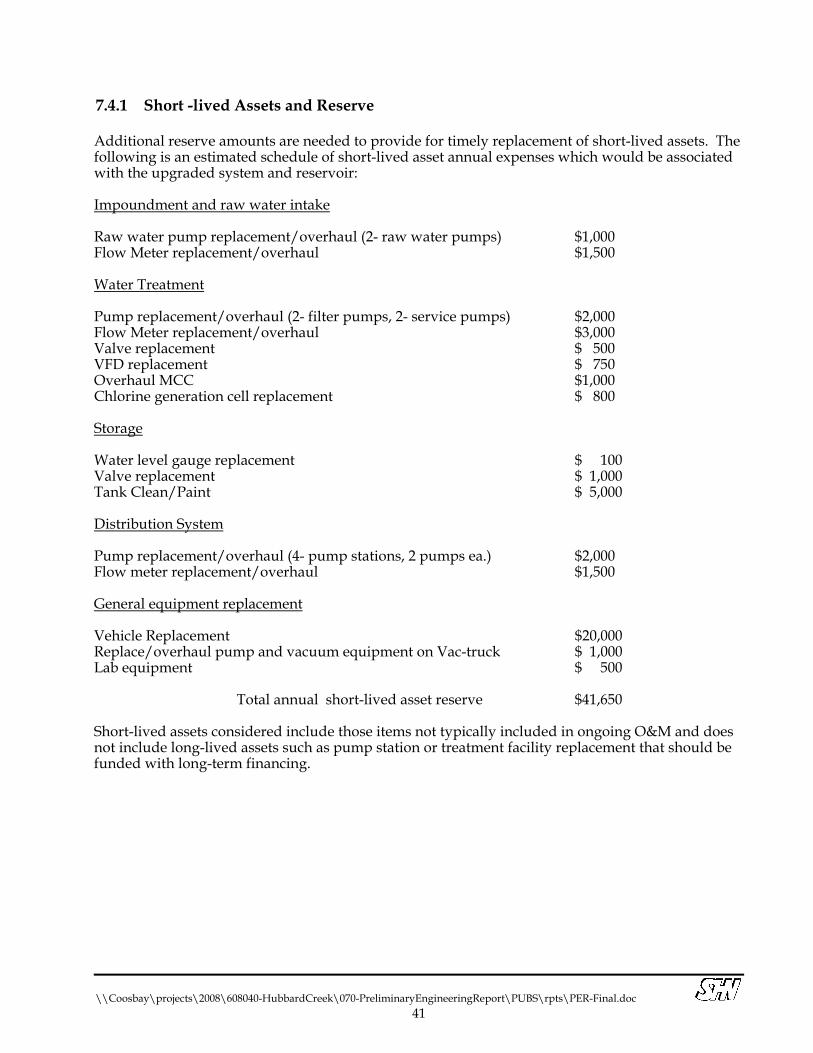
\\Coosbay\projects\2008\608040-HubbardCreek\070-PreliminaryEngineeringReport\PUBS\rpts\PER-Final.doc 41
7.4.1 Short -lived Assets and Reserve Additional reserve amounts are needed to provide for timely replacement of short-lived assets. The following is an estimated schedule of short-lived asset annual expenses which would be associated with the upgraded system and reservoir: Impoundment and raw water intake Raw water pump replacement/overhaul (2- raw water pumps) $1,000 Flow Meter replacement/overhaul $1,500 Water Treatment Pump replacement/overhaul (2- filter pumps, 2- service pumps) $2,000 Flow Meter replacement/overhaul $3,000 Valve replacement $ 500 VFD replacement $ 750 Overhaul MCC $1,000 Chlorine generation cell replacement $ 800 Storage Water level gauge replacement $ 100 Valve replacement $ 1,000 Tank Clean/Paint $ 5,000 Distribution System Pump replacement/overhaul (4- pump stations, 2 pumps ea.) $2,000 Flow meter replacement/overhaul $1,500 General equipment replacement Vehicle Replacement $20,000 Replace/overhaul pump and vacuum equipment on Vac-truck $ 1,000 Lab equipment $ 500 Total annual short-lived asset reserve $41,650 Short-lived assets considered include those items not typically included in ongoing O&M and does not include long-lived assets such as pump station or treatment facility replacement that should be funded with long-term financing.

\\Coosbay\projects\2008\608040-HubbardCreek\070-PreliminaryEngineeringReport\PUBS\rpts\PER-Final.doc 42
7.5 Schedule The projected schedule for implementation of the proposed projects is: Distribution System Improvements
TASK DATE Authorization and funding – Design May 2010 Preparation of plans/Specifications June 2010-August 2010 Authorization and funding secured for construction September 2010 Advertise for bids November 2010 Receive Bids December 2010 Award Contract February 2010 Begin Construction first phase of improvements May 2011 Completion of final phase of improvements September 2012 Project Close-out November 2012
Dam/Impoundment Expansion
TASK DATE Authorization and funding – Design/Permitting May 2010 Preparation of plans/Specifications June 2010 – August 2011 Project Permitting (WRD, DSL, COE, DEQ, NMF, ODF&W) July 2010 – July 2011 Authorization and funding secured for construction September 2011 Advertise for bids November 2011 Receive Bids January 2012 Award Contract March 2012 Begin Construction May 2012 Completion of improvements September 2014 Project Close-out December 2014

Appendix A
Summary Capital Improvements List


Appendix B
Stream Flow Analyses


STATISTICAL SUMMARIES OF
STREAMFLOW DATA IN OREGON:
VO'LUME I--MONTHL Y AND
ANNUALSTREAMFLOW,AND FLOWoDURATION VALUES
u.s. GEOLOGICAL SURVEY Open-File Report 90-118
Prepared in cooperation with the OREGON WATER RESOURCES DEPARTMENT

ALSEA RIVER BASIN
14306810 DEER CREEK NEAR SALADO, OR
LOCATION.--Lat 44°32"05", long 123"52"35", in SW 1/4 sec.1l, T.12 5., R.10 W., Lincoln County, Hydrologic Unit 17100205, Siuslaw National Forest, on right bank 1,000 ft upstream from mouth, 4.6 mi west of Salado, and,6.5 mi southeast of Toledo.
DRAINAGE AREA.--1.l7 mi', computed as 749.5 acres on basis of field survey by Oregon State University.
PERIOD OF RECORD.--September 1958 to September 1973.
GAGE.--Water-stage recorder and concrete control. Elevation of gage is 600 ft, from topographic map.
REMARKS.--No regulation or diversion upstream from station.
AVERAGE DISCHARGE.--15 years (water years 1959-73), 6.49 ft'/s, 75.33 in/yr, 4,700 acre-ft/yr.
bC, EXTREMES FOR PERIOD OF RECORD.--Maximum discharge, 201 ft /s Jan, 28, 1965, gage height, 4.21 ft; maximum gage height,
4.39 ft Jan. 20, 1972 (backwater from log); minimum discharge, 0.15 ft'/s sept. 2, 14-16, 1972.
Month
Oct Nov Dec Jan Feb Mar Apr May Jun Ju1 Aug Sep
95
0.3 1.1 2.6 3.5 2.9 2.5 2.0 1.2 0.7 0.4 0.2 0.2
0.3
STATISTICAL SUMMARIES FOR THE PERIOD 1959-1973
[n = number of values used to compute statistics; months are abbreviated; Ann = annual]
Monthly and annual statistics based on mean daily discharge, in cubic feet per second
Month n Minimum (year) MaXimum ,(year) Mean standard
deviation Percent of
annual runoff
Oct Nov Dec Jan Feb Mar Apr May Jun Ju1 Aug Sep
Ann
15 15 15 15 15 15 15 15 15 15 15 16
0.3 2.5 5.9 4.5 2.9 3.5 2.7 1.2 0,7 0.5 0.3 0.3
4.2
1973 1973 1961 1963 1973 1965 1969 1966 1966 1970 1966 1967
1973
5.0 16 30 28 27 20 11 7.0 5.1 1.9 1.2 2.7
9.1
1960 1961 1965 1965 1961 1961 1963 1960 1968 1969 1968 1959
1972
1.9 9.0
14 17 12 10 6.0 3.5 1.8 0.8 0.5 0.7
6.5
Flow duration statistics based on mean daily discharge
1.5 4.7 6.7 8.3 5.9 5.2 2.8 1.7 1.1 0.4 0.2 0.6
1.2
2.5 11. 4 18.3 22.6 14.5 13.6 7.6 4.5 2.2 1.1 0.7 0.9
100.0
Discharge, in cubic feet per second, which was equaled or exceeded for indicated percent of time
90
0.3 1.3 3.3 3.9 3.7 3.2 2.2 1.4 0.8 0.4 0.3 0.2
0.3
85
0.3 1.5 4.3 5.0 4.6 3.5 2.4 1.6 0.8 0.4 0.3 0.2
0.5
80
0.3 1.8 4.8 5.7 5.1 4.0 2.7 1.7 0.9 0.5 0.3 0.3
0.6
75
0.4 2.1 5.5 5.7 5.7 4.4 2.9 1.9 1.0 0.5 0.3 0.3
0.7
70
0.4 2.4 5.5 6.5 6.4 5.0 3.2 2.1 1.0 0.6 0.3 0.3
1.1
60
0.5 3.3 7.0 8.9 7.1 5.5 3.6 2.3 1.2 0.6 0.4 0.4
1.6
50
0.9 4.6 9.6
12 8.0 6.9 4.3 2.5 1.3 0.7 0.4 0.4
2.9
311
40
1.2 6.8
12 14 11
9.3 5.2 2.8 1.5 0.7 0.5 0.5
4.5
30
1.8 9.4
15 18 13 12
6.4 3.4 1.6 0.8 0.5 0.6
6.4
25
2.4 12 17 21 15 13 7.0 4.1 1.8 0.9 0.5 0.7
7.3
20
3.1 14 19 24 17 15
7.7 4.5 2.0 1.0 0.6 0.9
8.9
15
3.5 18 23 32 20 18
9.3 5.5 2.3 1.1 0.6 1.0
12
10
4.5 22 33 40 26 21 13
6.0 2.8 1.3 0.7 1.4
16
6.8 31 44 54 38 29 15 8.0 3.2 1.6 0.9 2.0
25
(n)
15 15 15 15 15 15 15 15 15 15 15 16
lYf.1~ ::.'11': . ,
:1,

ALSEA RIVER BASIN
14306800 FLYNN CREEK NEAR'SALADO, OR
LOCATION.--Lat 44°32'20·, long 123°51'05", in SW 1/4 sec.12, T.12 S., R.10 W., Lincoln County, Hydrologic on right bank 1,000 ft upstream from mouth, 3.4 mi west of Salado, and 6.9 mi southeast of Toledo.
DRAINAGE AREA.--0.78 mi 2, computed as 501.96 acres on basis of field survey by Oregon State UniVersity.
PERIOD OF RECORD.--September 1958 to september 1973.
GAGE.--Water-stage recorder and concrete control. Elevation of gage is 685 ft, from topographic,map.
REMARKS.--No regulation or diversion upstream from station.
AVERAGE DISCHARGE.--15 years (water years 1959-73), 4.37 ft3/s, 76.08 in/yr, 3,170 acre-ft/yr.'
EXTREMES FOR PERIOD OF
Sept. 27, 1967.
-13 RECORD.--Maximum discharge, 139 ft /s Jan. 11, 1972, gage height, 4.73 ft; minimum, 0.07 ft3/s
Month
Oct Nov Dec Jan Feb Mar Apr May Jun Jul Aug Sep
Ann
95
0.1 0.5 1.3 2.5 2.1 1.9 1.4 0.8 0.4 0.2 0.1 0.1
0.1
STATISTICAL SUMMARIES FOR THE'PERIOD 1959-1973
In = number of values used to compute statistics; months are abbreviated; Ann = annual]
Monthly and annual statistics based on mean daily discharge, in cubic feet per second
Month n Minimum (year) Maximum (year) Mean Standard
deviation Percent of
annual runoff
Oct Nov Dec Jan Feb Mar Apr May Jun Jul Aug Sep
Ann
15 15 15 15 15 15 15 15 15 15 15 16
0.2 1.0 4.4 3.2 2.0 2.7 1.8 0.9 0.5 0.3 0.1 0.1
2.7
1973 1973 1961 1963 1973 1965 1969 1966 1966 1970 1966 1965
1973
3.2 11 20 18 19 14 8.3 5.3 3.2 1.2 1.0 1.4
6.3
1960 1961 1965 1965 1961 1961 1963 1960 1968 1969 1958 1959
1972
1.0 5.7 9.6
11 8.7 7.3 4.2 2.4 1.1 0.5 0.3 0.4
Flow duration statistics based on mean daily discharge
0.9 3.3 4.7 5.5 4.1 3.6 2.0 1.3 0.7 0.2 0.1 0.3
0.8
1.9 10.6 18.5 23.0 15.3 14.0 7.9 4.7 2.1 1.0 0.5 0.7
100.0
Discharge, in cubic feet per second, which Was equaled or exceeded for indicated percent of time
90
0.1 0.6 2.5 2.9 2.8 2.4 1.5 1.0 0.5 0.3 0.2 0.1
0.2
85
0.2 0.8 2.9 3.2 3.2 2.6 1.8 1.1 0.5 0.3 0.2 0.1
0.3
80
0.2 0.9 3.3 3.6 3.5 2.9 2.0 1.2
,0.6
0.3 0.2 0.1
0.4
75
0.2 1.1 3.8 4.5 3.9 3.2 2.2 1.3 0.7 0.3 0.2 0.1
0.5
70
0.2 1.3 3.8 4.5 4.4 3.6 2.4 1.4 0.7 0.4 0.2 0.2
0.6
60
0.3 1.8 4.9 5.7 5.4 4.4 2.6 1.5 0.7 0.4 0.2 0.2
1.0
50
0.4 3.0 6.4 7.2 6.0 4.9 3.1 1.8 0.8 0.4 0.3 0.2
1.9
310
40
0.4 3.6 8.2
10 7.5 6.1 3.7 2.2 1.0 0.5 0.3 0.2
2.9
30
0.9 6.2
10 13
9.3 7.5 4.4 2.6 1.1 0.6 0.3 0.3
4.3
25
1.3 7.4
12 15 11 8.4 4.8 2.9 1.1 0.6 0.3 0.3
5.3
20
1.5 8.8
14 17 13 11 5.7 3.2 1.3 0.6 0.3 0.4
6.7
15
2.0 12 17 22 15 13
6.7 3.4 1.4 0.7 0.4 0.5
8.4
10
2.3 15 23 27 18 15 8.0 4.1 1.7 0.8 0.4 0.6
11
3.5 21 30 36 25 20 12 5.9 2.2 1.0 0.5 0.9
17


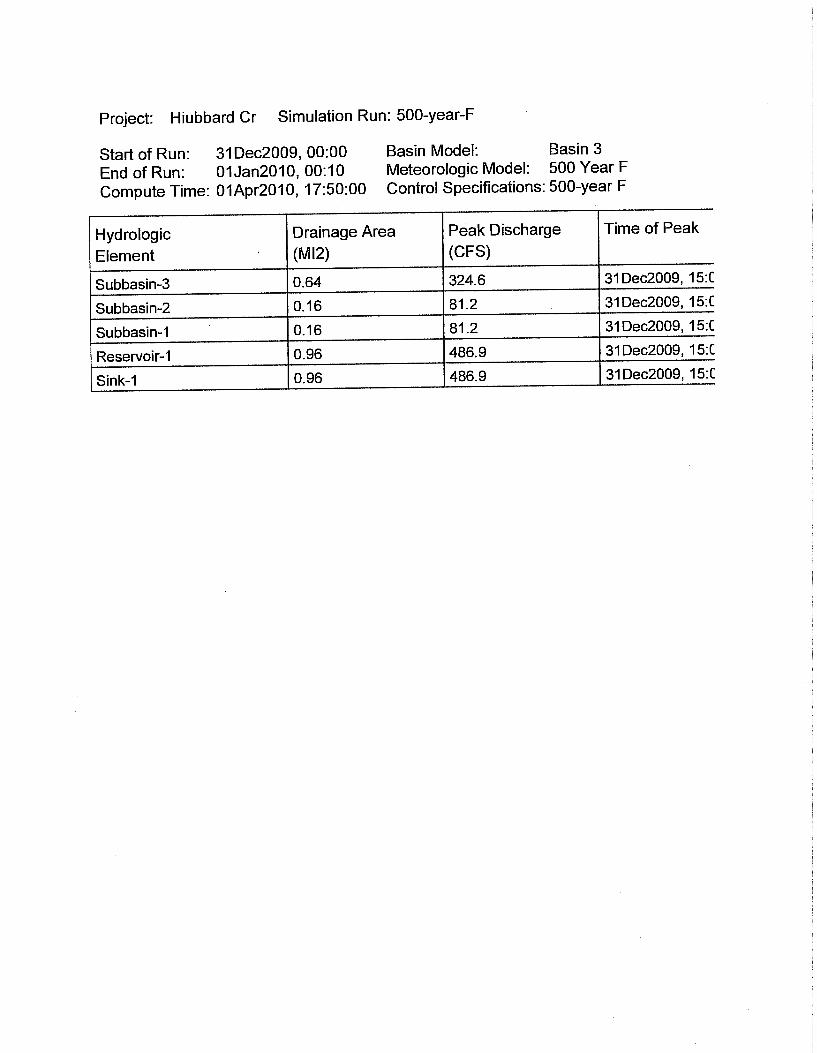

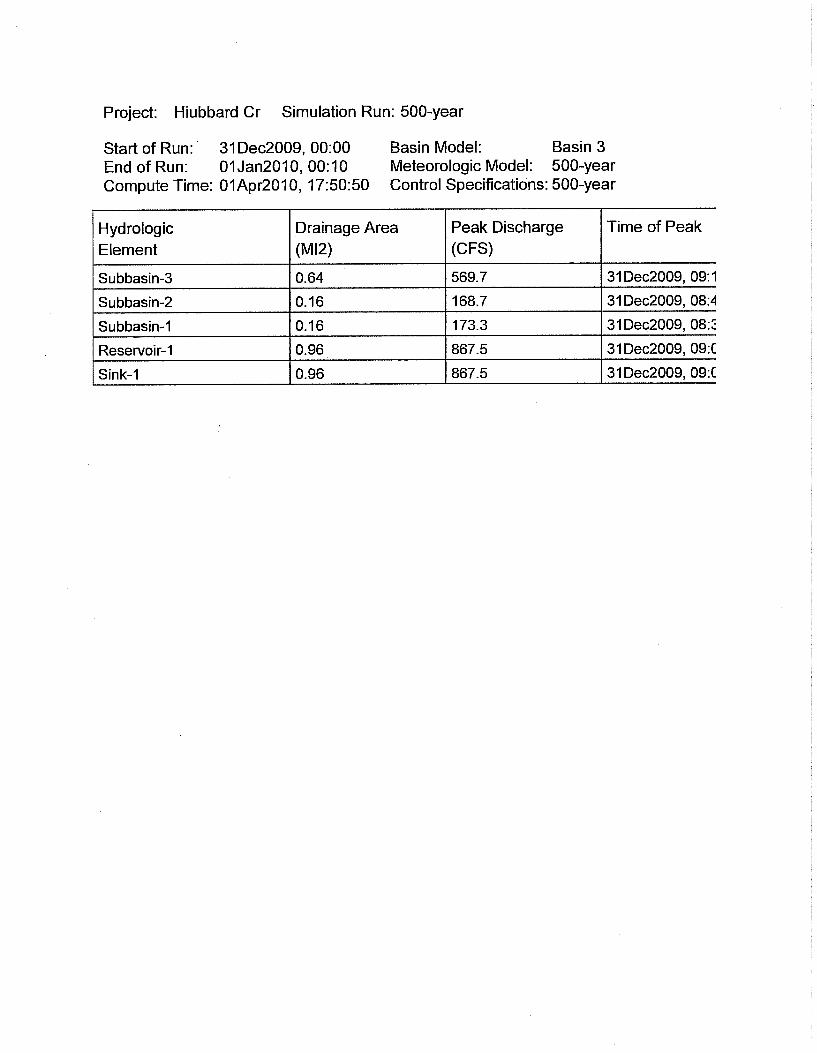


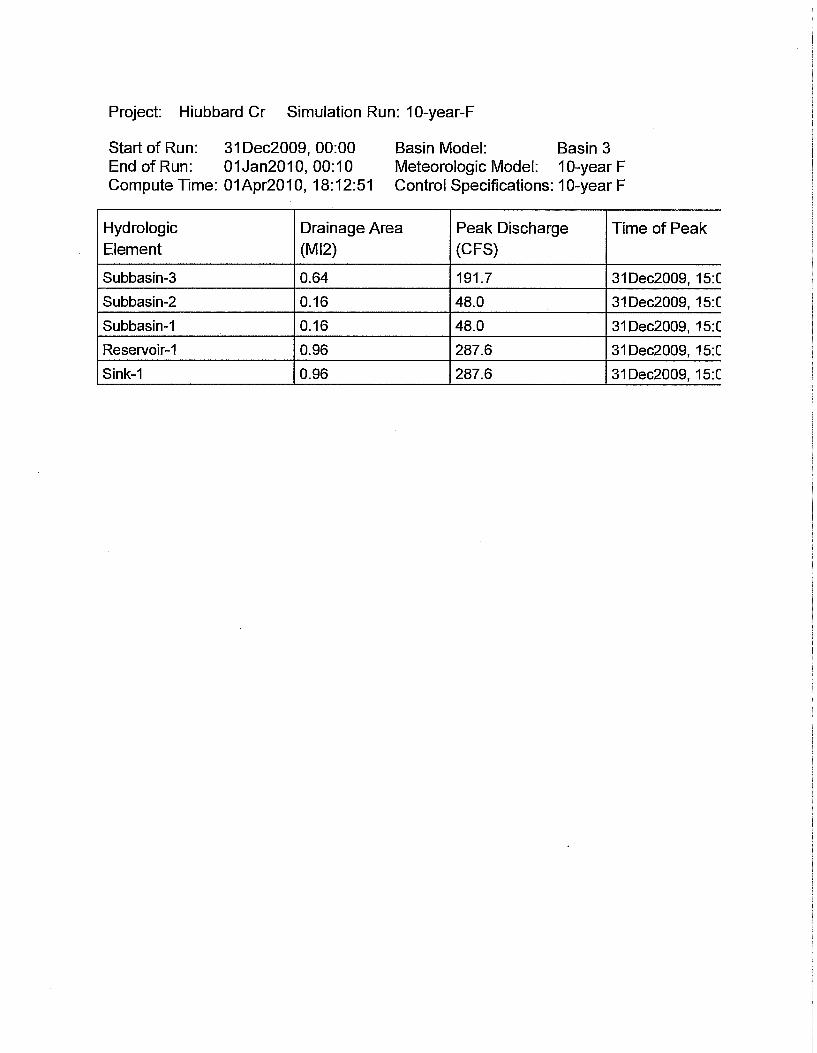


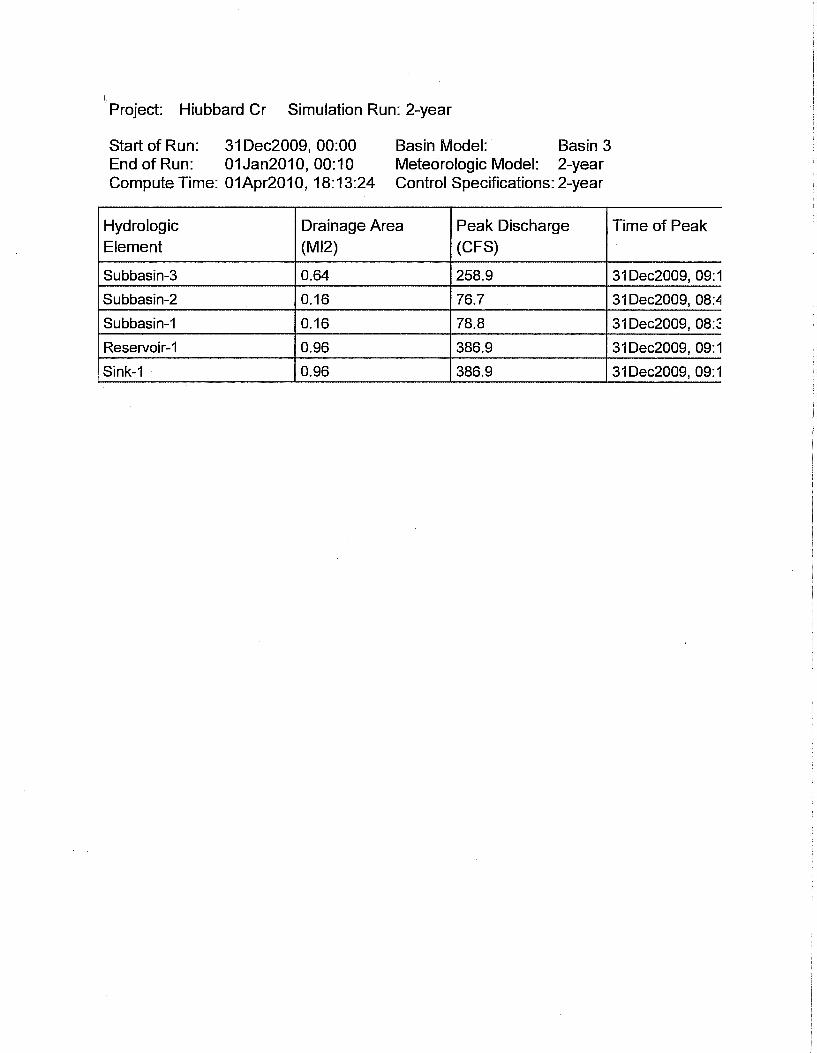


Appendix C
Distribution System Phased Improvement Costs