PRELIMINARY DRUG DEATHS REPORTmedicalexaminer.cuyahogacounty.us/pdf_medicalexaminer/en... ·...
30
PRELIMINARY DRUG DEATHS REPORT 2017 CUYAHOGA COUNTY MEDICAL EXAMINERS OFFICE DR. THOMAS P. GILSON, MD CUYAHOGA COUNTY | 11001 Cedar Ave., Cleveland, OH 44106
Transcript of PRELIMINARY DRUG DEATHS REPORTmedicalexaminer.cuyahogacounty.us/pdf_medicalexaminer/en... ·...
PRELIMINARY DRUG DEATHS REPORT
2017
CUYAHOGA COUNTY MEDICAL EXAMINERS OFFICE DR. THOMAS P. GILSON, MD
CUYAHOGA COUNTY | 11001 Cedar Ave., Cleveland, OH 44106
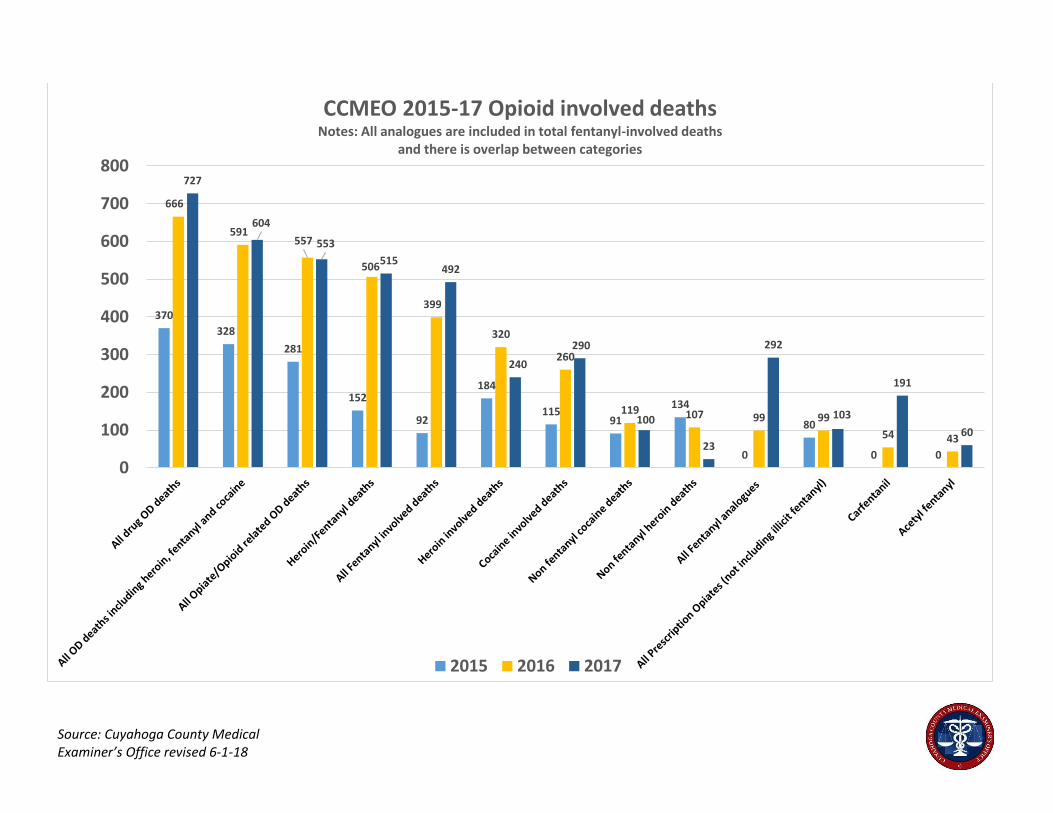
370
328
281
152
92
184
11591
134
0
80
0 0
666
591557
506
399
320
260
119 107 99 99
54 43
727
604
553
515492
240
290
100
23
292
103
191
60
0
100
200
300
400
500
600
700
800
CCMEO 2015-17 Opioid involved deathsNotes: All analogues are included in total fentanyl-involved deaths
and there is overlap between categories
2015 2016 2017
Source: Cuyahoga County Medical Examiner’s Office revised 6-1-18
Source: Cuyahoga County Medical Examiner’s Office revised 6-1-18
48
57
33
39
47
4949
28
3834
37
33
45
3
16
30
39
34
11
14
1815
2
57
69
40
53 53
60
56
41
4845
4948
69
79
52
65 6568 69
4852 51
57
52
0
10
20
30
40
50
60
70
80
90
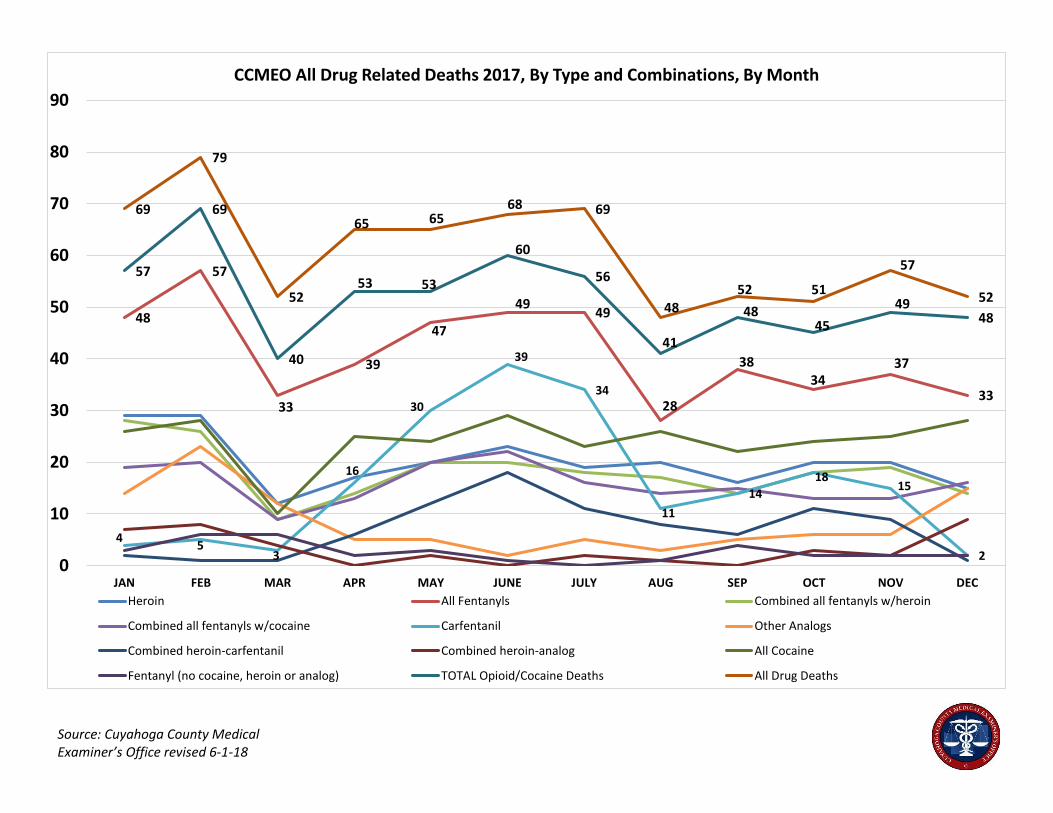
JAN FEB MAR APR MAY JUNE JULY AUG SEP OCT NOV DEC
CCMEO All Drug Related Deaths 2017, By Type and Combinations, By Month
Heroin All Fentanyls Combined all fentanyls w/heroin
Combined all fentanyls w/cocaine Carfentanil Other Analogs
Combined heroin-carfentanil Combined heroin-analog All Cocaine
Fentanyl (no cocaine, heroin or analog) TOTAL Opioid/Cocaine Deaths All Drug Deaths
Source: Cuyahoga County Medical Examiner’s Office revised 6-1-18
49 40 64 6491
107
161194 198 184
320
240
127114 107 117 103
98
111 116 124 115
260
290
00 0 0 0 0 0 0 0 0
56
191
23 11 9 7 13 8 10 537
92
399
492
81 87 87 10391
113
85 101 87 80 99102
250226
251269 267
301 310340 353 370
666
727
0
100
200
300
400
500
600
700
800
900
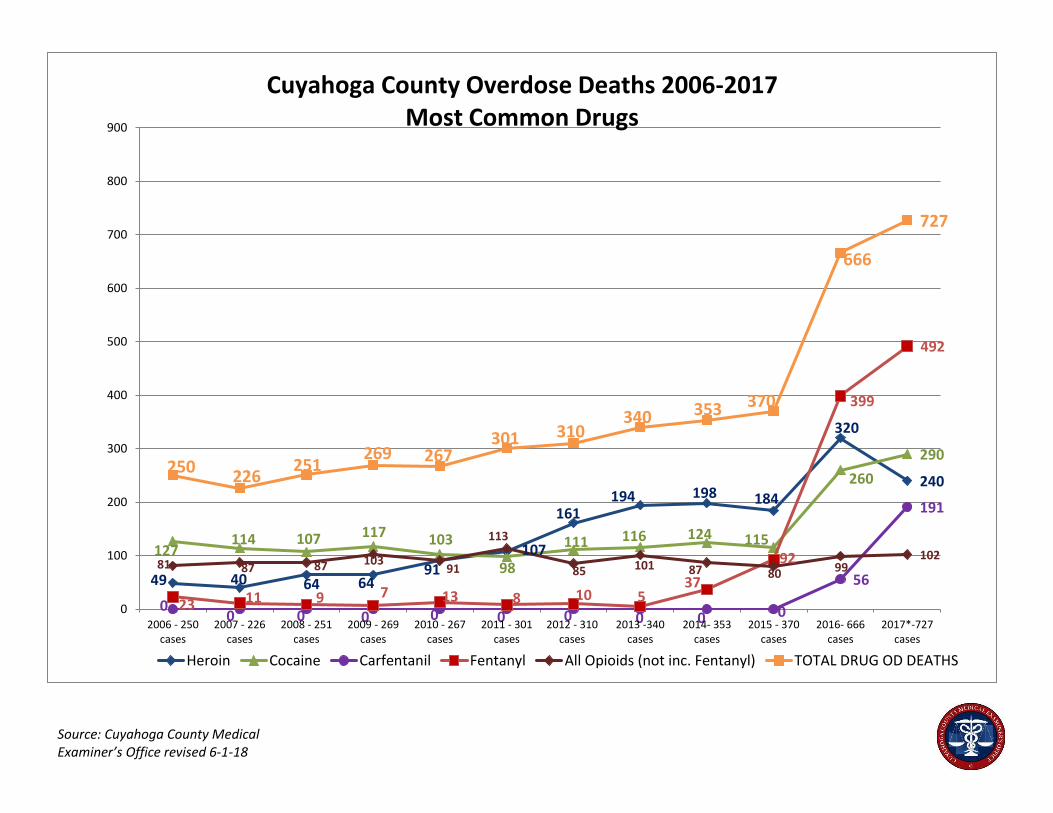
2006 - 250cases
2007 - 226cases
2008 - 251cases
2009 - 269cases
2010 - 267cases
2011 - 301cases
2012 - 310cases
2013 -340cases
2014- 353cases
2015 - 370cases
2016- 666cases
2017*-727cases
Heroin Cocaine Carfentanil Fentanyl All Opioids (not inc. Fentanyl) TOTAL DRUG OD DEATHS
Cuyahoga County Overdose Deaths 2006-2017 Most Common Drugs
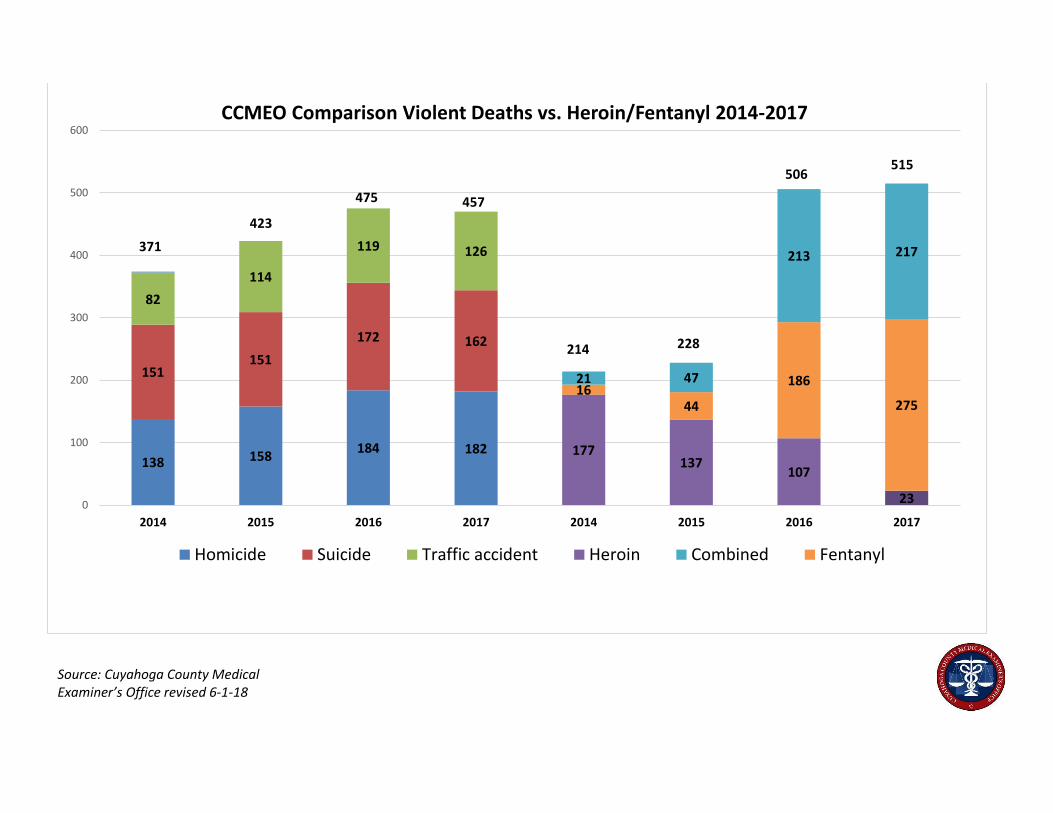
138 158184 182 177
137107
23
151151
172 162
1644
186
275
82
114
119 126
21 47
213 217
0
100
200
300
400
500
600
2014 2015 2016 2017 2014 2015 2016 2017
CCMEO Comparison Violent Deaths vs. Heroin/Fentanyl 2014-2017
Homicide Suicide Traffic accident Heroin Combined Fentanyl
371
423
475
214 228
506
457
515
Source: Cuyahoga County Medical Examiner’s Office revised 6-1-18
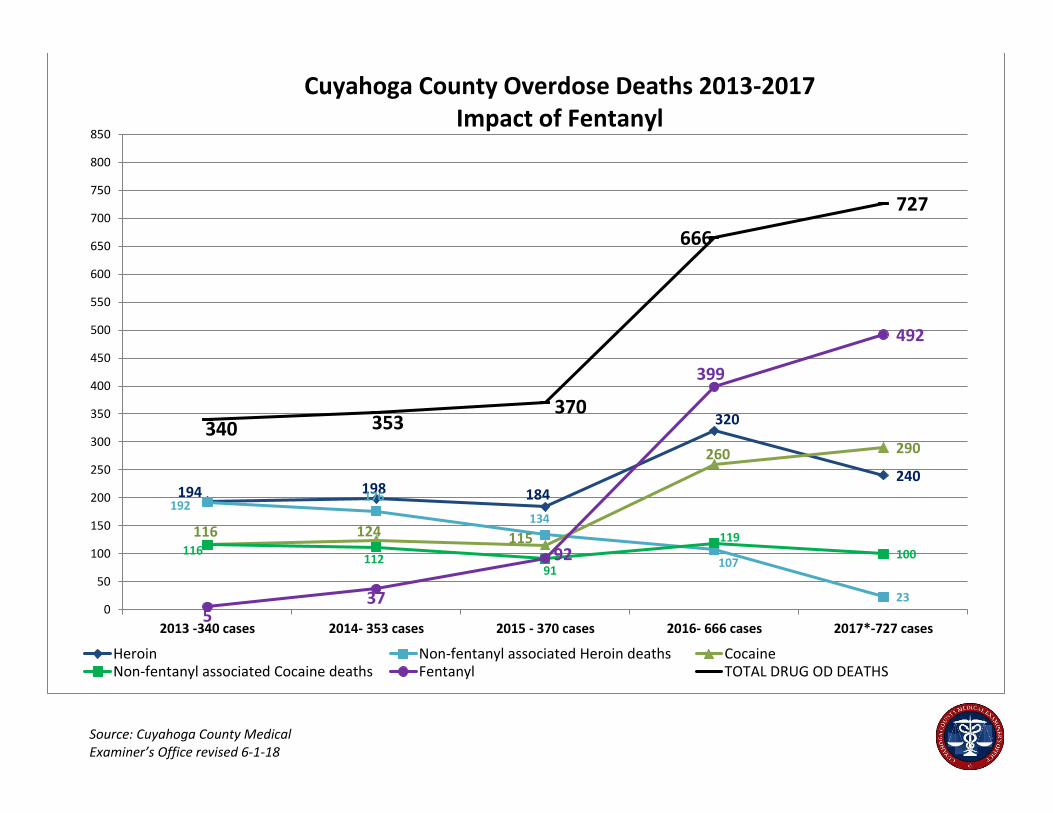
194 198 184
320
240
192176
134
107
23
116 124 115
260 290
116112
91
119
100
537
92
399
492
340 353370
666
727
0
50
100
150
200
250
300
350
400
450
500
550
600
650
700
750
800
850
2013 -340 cases 2014- 353 cases 2015 - 370 cases 2016- 666 cases 2017*-727 cases
Heroin Non-fentanyl associated Heroin deaths CocaineNon-fentanyl associated Cocaine deaths Fentanyl TOTAL DRUG OD DEATHS
Cuyahoga County Overdose Deaths 2013-2017 Impact of Fentanyl
Source: Cuyahoga County Medical Examiner’s Office revised 6-1-18
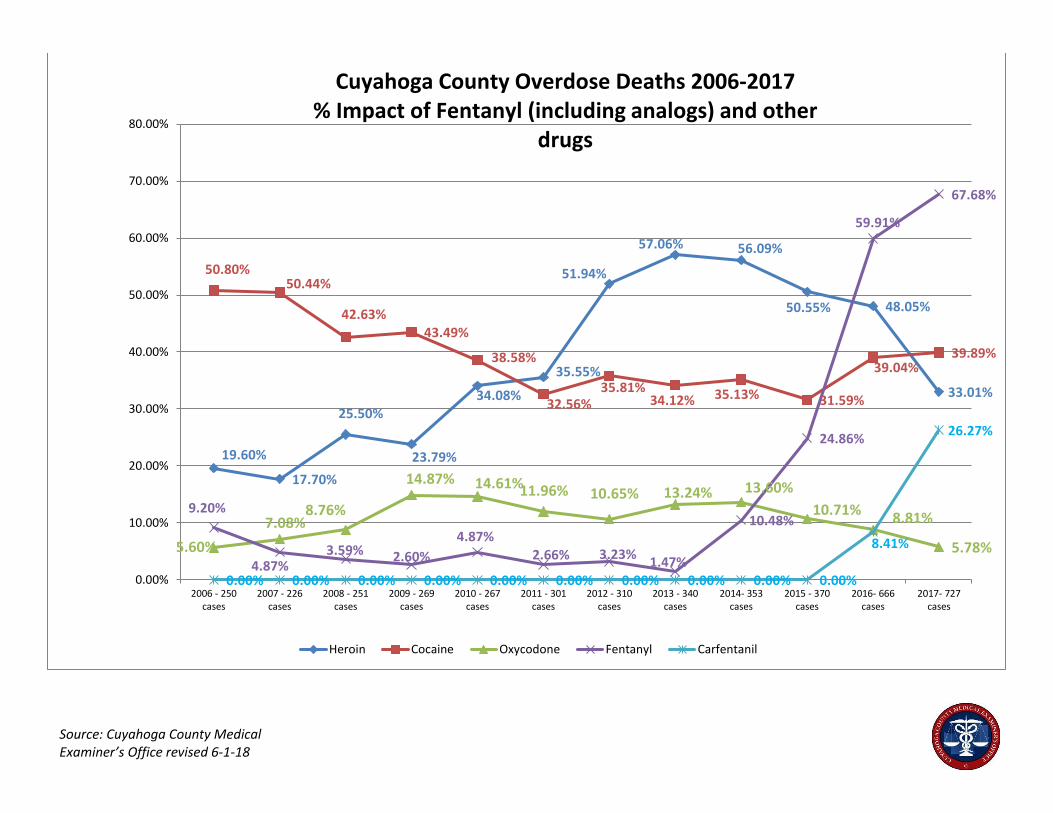
19.60%
17.70%
25.50%
23.79%
34.08%
35.55%
51.94%
57.06% 56.09%
50.55% 48.05%
33.01%
50.80%50.44%
42.63%43.49%
38.58%
32.56%35.81%
34.12% 35.13% 31.59%
39.04%39.89%
5.60%
7.08%8.76%
14.87% 14.61%11.96% 10.65% 13.24% 13.60%
10.71%8.81%
5.78%
9.20%
4.87%3.59% 2.60%
4.87%2.66% 3.23%
1.47%
10.48%
24.86%
59.91%
67.68%
0.00% 0.00% 0.00% 0.00% 0.00% 0.00% 0.00% 0.00% 0.00% 0.00%
8.41%
26.27%
0.00%
10.00%
20.00%
30.00%
40.00%
50.00%
60.00%
70.00%
80.00%
2006 - 250cases
2007 - 226cases
2008 - 251cases
2009 - 269cases
2010 - 267cases
2011 - 301cases
2012 - 310cases
2013 - 340cases
2014- 353cases
2015 - 370cases
2016- 666cases
2017- 727cases
Heroin Cocaine Oxycodone Fentanyl Carfentanil
Cuyahoga County Overdose Deaths 2006-2017% Impact of Fentanyl (including analogs) and other
drugs
Source: Cuyahoga County Medical Examiner’s Office revised 6-1-18
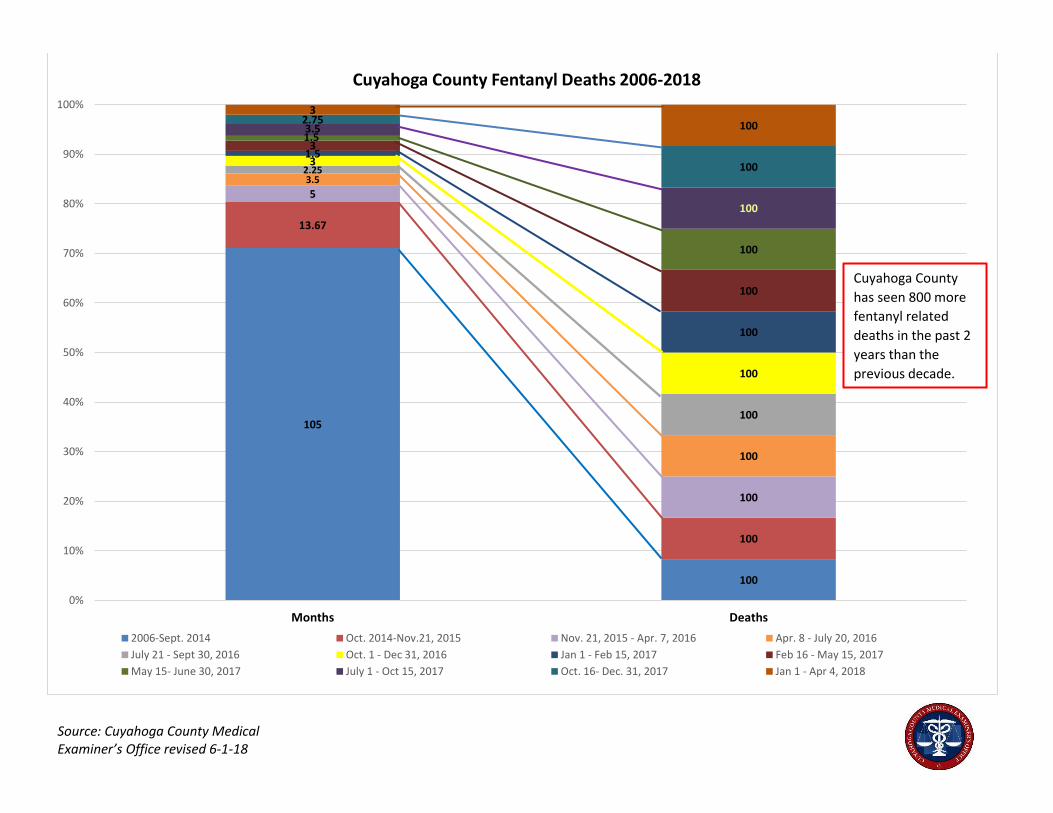
105
100
13.67
100
5
100
3.5
100
2.25
100
3
100
1.5
100
3
100
1.5
100
3.5
100
2.75
100
3
100
0%
10%
20%
30%
40%
50%
60%
70%
80%
90%
100%
Months Deaths
Cuyahoga County Fentanyl Deaths 2006-2018
2006-Sept. 2014 Oct. 2014-Nov.21, 2015 Nov. 21, 2015 - Apr. 7, 2016 Apr. 8 - July 20, 2016
July 21 - Sept 30, 2016 Oct. 1 - Dec 31, 2016 Jan 1 - Feb 15, 2017 Feb 16 - May 15, 2017
May 15- June 30, 2017 July 1 - Oct 15, 2017 Oct. 16- Dec. 31, 2017 Jan 1 - Apr 4, 2018
Cuyahoga County
has seen 800 more
fentanyl related
deaths in the past 2
years than the
previous decade.
Source: Cuyahoga County Medical Examiner’s Office revised 6-1-18
Source: Cuyahoga County Medical Examiner’s Office revised 6-1-18
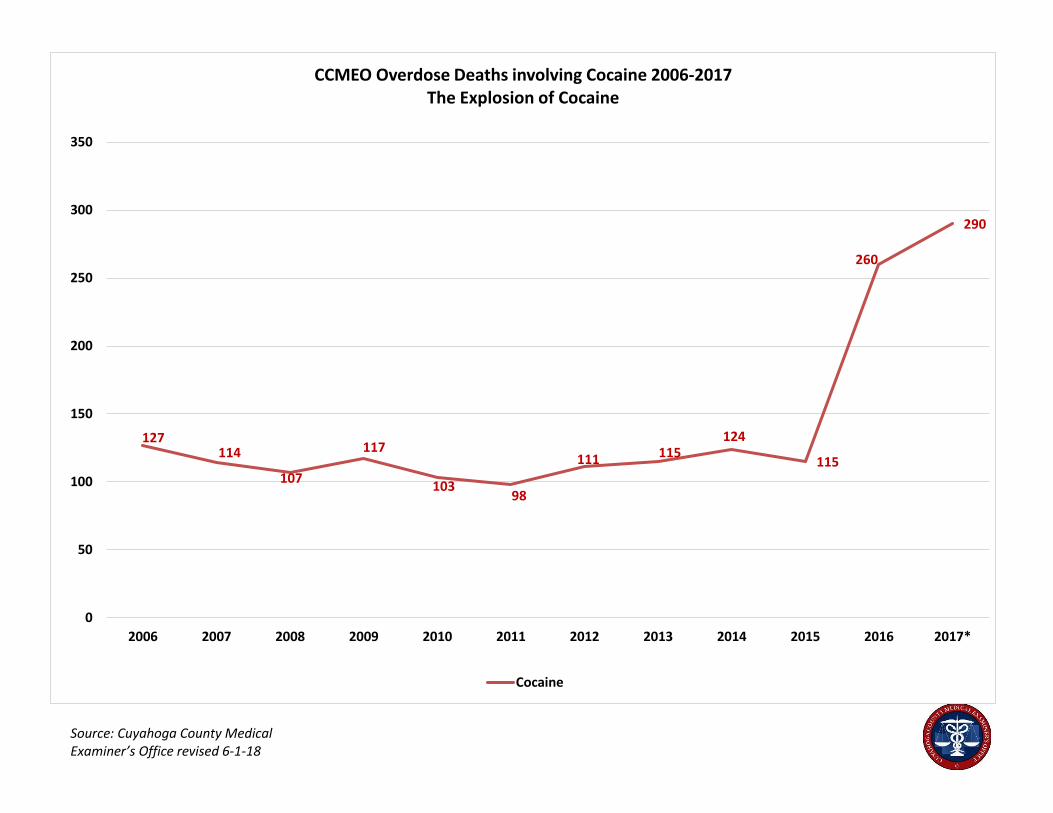
127114
107
117
10398
111 115124
115
260
290
0
50
100
150
200
250
300
350
2006 2007 2008 2009 2010 2011 2012 2013 2014 2015 2016 2017*
CCMEO Overdose Deaths involving Cocaine 2006-2017The Explosion of Cocaine
Cocaine
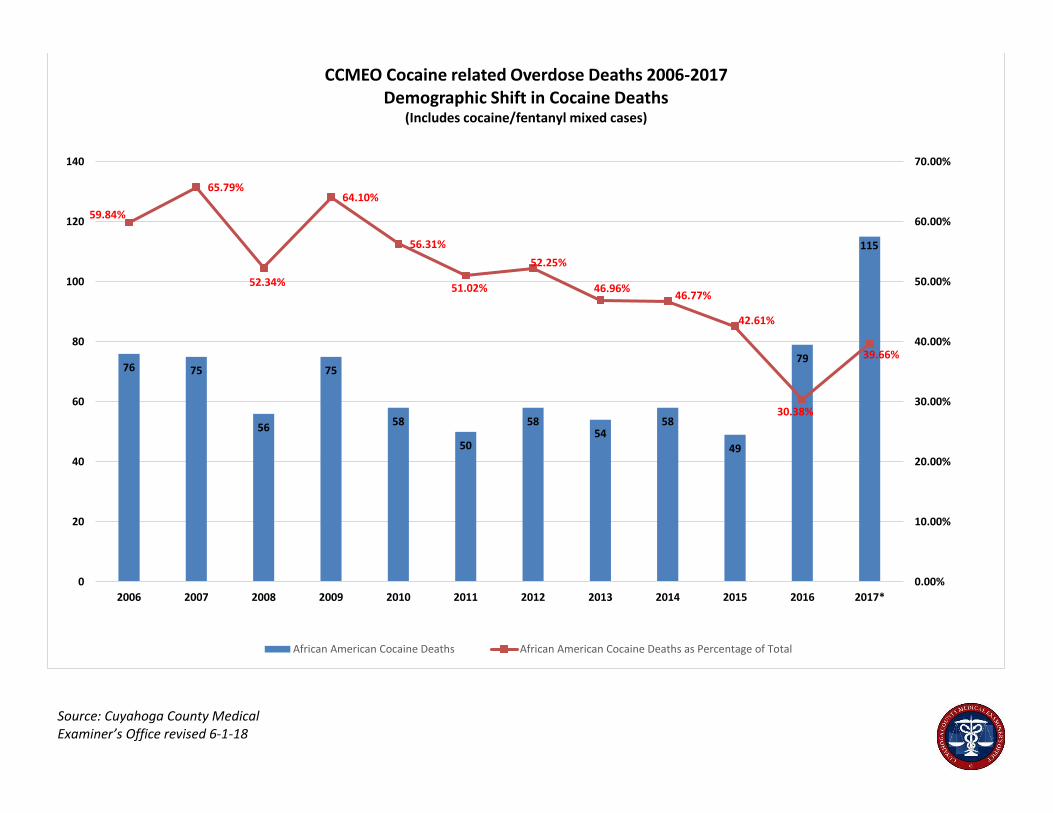
76 75
56
75
58
50
5854
58
49
79
115
59.84%
65.79%
52.34%
64.10%
56.31%
51.02%
52.25%
46.96%46.77%
42.61%
30.38%
39.66%
0.00%
10.00%
20.00%
30.00%
40.00%
50.00%
60.00%
70.00%
0
20
40
60
80
100
120
140
2006 2007 2008 2009 2010 2011 2012 2013 2014 2015 2016 2017*
CCMEO Cocaine related Overdose Deaths 2006-2017Demographic Shift in Cocaine Deaths
(Includes cocaine/fentanyl mixed cases)
African American Cocaine Deaths African American Cocaine Deaths as Percentage of Total
Source: Cuyahoga County Medical Examiner’s Office revised 6-1-18
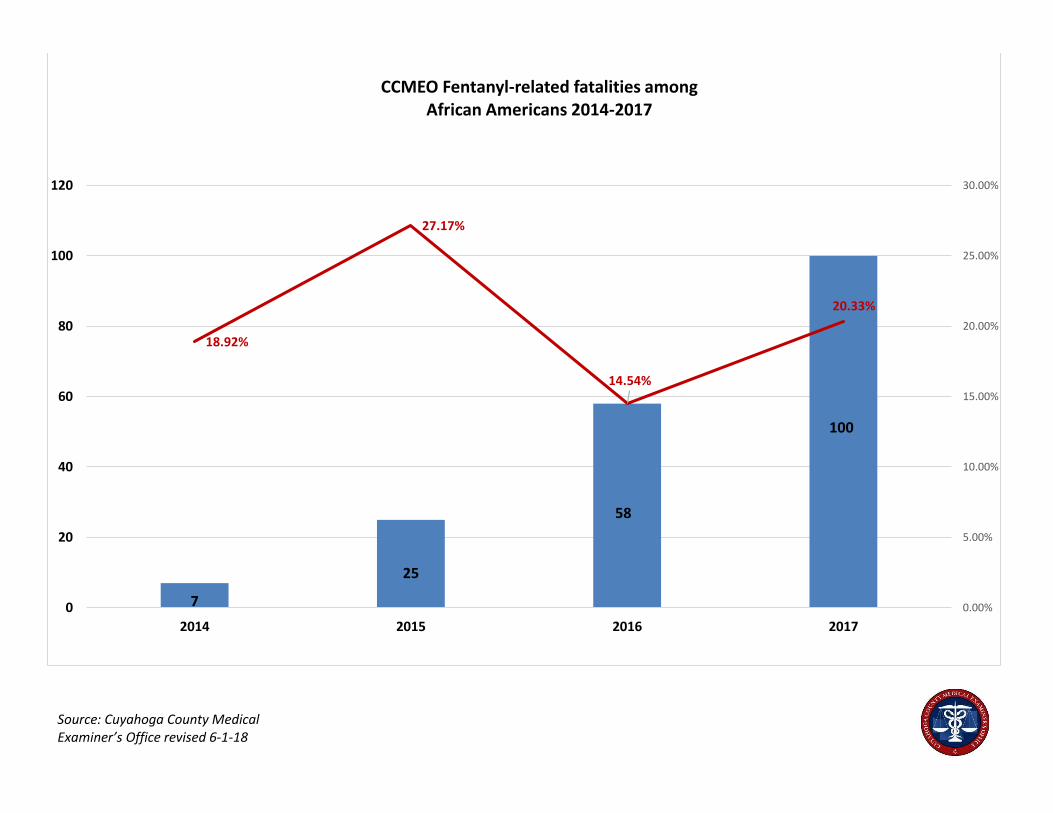
7
25
58
100
18.92%
27.17%
14.54%
20.33%
0.00%
5.00%
10.00%
15.00%
20.00%
25.00%
30.00%
0
20
40
60
80
100
120
2014 2015 2016 2017
CCMEO Fentanyl-related fatalities among African Americans 2014-2017
Source: Cuyahoga County Medical Examiner’s Office revised 6-1-18
Source: Cuyahoga County Medical Examiner’s Office revised 6-1-18
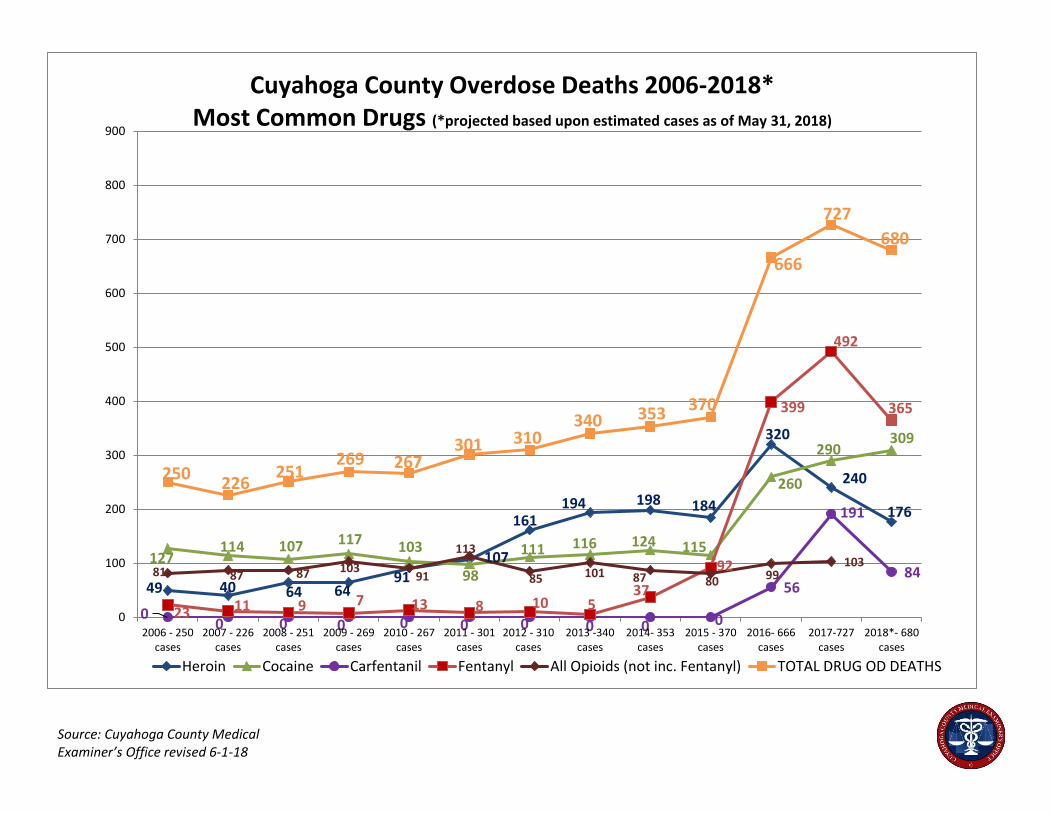
49 40 64 6491
107
161194 198 184
320
240
176
127114 107 117 103
98
111 116 124 115
260
290309
00 0 0 0 0 0 0 0 0
56
191
84
23 11 9 7 13 8 10 537
92
399
492
365
81 87 87 10391
113
85 101 87 80 99103
250226
251269 267
301 310340 353 370
666
727
680
0
100
200
300
400
500
600
700
800
900
2006 - 250cases
2007 - 226cases
2008 - 251cases
2009 - 269cases
2010 - 267cases
2011 - 301cases
2012 - 310cases
2013 -340cases
2014- 353cases
2015 - 370cases
2016- 666cases
2017-727cases
2018*- 680cases
Heroin Cocaine Carfentanil Fentanyl All Opioids (not inc. Fentanyl) TOTAL DRUG OD DEATHS
Cuyahoga County Overdose Deaths 2006-2018* Most Common Drugs (*projected based upon estimated cases as of May 31, 2018)
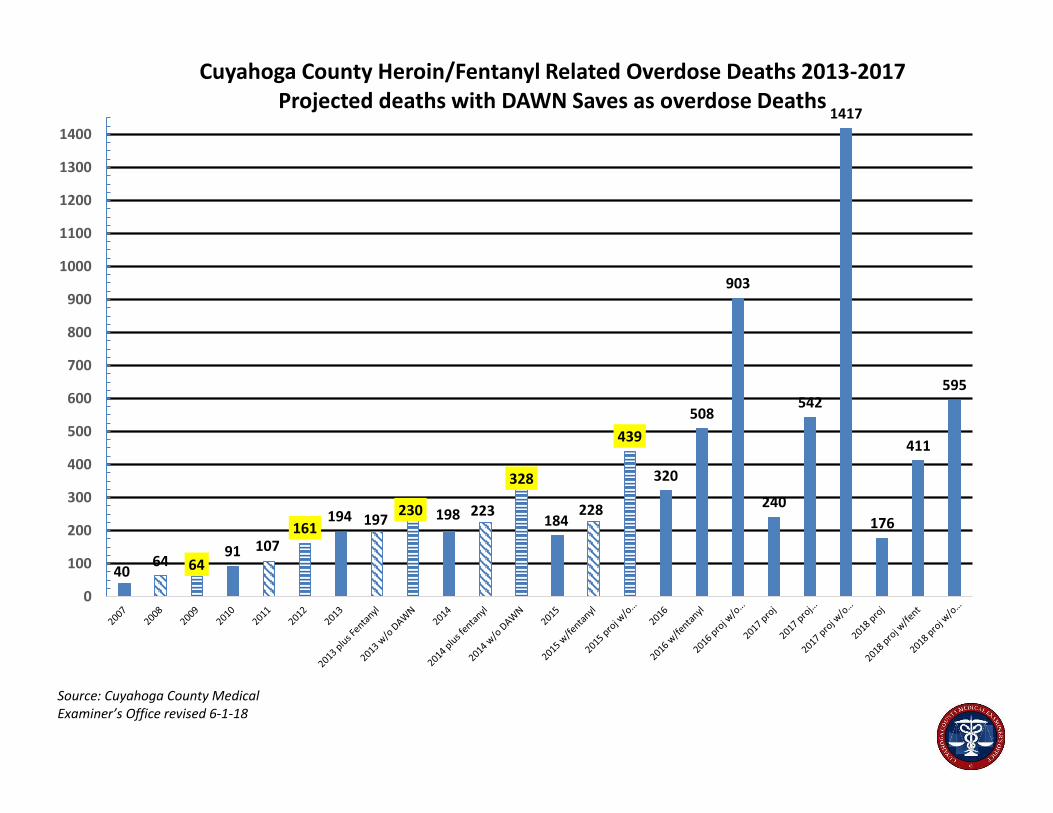
4064 64
91 107161
194 197230 198 223
328
184228
439
320
508
903
240
542
1417
176
411
595
0
100
200
300
400
500
600
700
800
900
1000
1100
1200
1300
1400
Cuyahoga County Heroin/Fentanyl Related Overdose Deaths 2013-2017Projected deaths with DAWN Saves as overdose Deaths
Source: Cuyahoga County Medical Examiner’s Office revised 6-1-18
2017 DEMOGRAPHIC ANALYSIS – SUMMARY (PENDING)
FENTANYL TOTAL Fentanyl
Fentanyl +
Heroin
Fentanyl +
Cocaine
Fentanyl +
Heroin +
Cocaine
399 117 141 68 73
29.32% 35.34% 17.04% 18.30%
Res Inc Age
Male Female White Black Other Hispanic CLE Sub OU CLE Sub OU ? <18 19-29 30-44 45-60 60+
292 107 337 61 1 11 181 172 46 187 157 9 46 3 89 150 125 32
73.18% 26.82% 84.46% 15.29% 0.25% 2.76% 45.36% 43.11% 11.53% 46.87% 39.35% 2.26% 11.53% 0.75% 22.31% 37.59% 31.33% 8.02%
HEROIN TOTAL Heroin
Heroin +
Fentanyl
Heroin +
Cocaine
Heroin +
Cocaine +
Fentanyl
320 72 141 34 73
22.50% 44.06% 10.63% 22.81%
Res Inc Age
Male Female White Black Other Hispanic CLE Sub OU CLE Sub OU ? <18 19-29 30-44 45-60 60+
228 92 283 36 1 8 138 145 37 136 128 6 38 3 68 116 102 31
71.25% 28.75% 88.44% 11.25% 0.31% 2.60% 44.81% 47.08% 12.01% 44.16% 41.56% 1.95% 12.34% 0.97% 22.08% 37.66% 33.12% 10.06%
COCAINE TOTAL Cocaine
Cocaine +
Heroin
Fentanyl +
Cocaine
Cocaine +
Fentanyl +
Heroin
260 85 34 68 73
32.69% 13.08% 26.15% 28.08%
Res Inc Age
Male Female White Black Other Hispanic CLE Sub OU CLE Sub OU ? <18 19-29 30-44 45-60 60+
184 76 181 79 0 4 145 82 33 141 79 5 35 5 42 77 104 32
70.77% 29.23% 69.62% 30.38% 0.00% 1.54% 55.77% 31.54% 12.69% 54.23% 30.38% 1.92% 13.46% 1.92% 16.15% 29.62% 40.00% 12.31%
Source: Cuyahoga County Medical Examiner’s Office revised 6-1-18
2017 DEMOGRAPHIC ANALYSIS – FENTANYL (PENDING)
FENTANYL TOTAL Fentanyl
Fentanyl +
Heroin
Fentanyl +
Cocaine
Fentanyl +
Heroin +
Cocaine
399 117 141 68 73
29.32% 35.34% 17.04% 18.30%
Res Inc Age
Male Female White Black Other Hispanic CLE Sub OU CLE Sub OU ? <18 19-29 30-44 45-60 60+
292 107 341 58 0 11 177 175 47 182 160 11 46 3 89 150 125 32
73.18% 26.82% 85.46% 14.54% 0.00% 2.76% 44.36% 43.86% 11.78% 45.61% 40.10% 2.76% 11.53% 0.75% 22.31% 37.59% 31.33% 8.02%
Res Inc Age
Male Female White Black Other Hispanic CLE Sub OU CLE Sub OU ? <18 19-29 30-44 45-60 60+
Fentanyl 93 24 100 17 0 5 44 62 11 50 51 5 11 0 26 44 37 10
79.49% 20.51% 85.47% 14.53% 0.00% 4.27% 37.61% 52.99% 9.40% 42.74% 43.59% 4.27% 9.40% 0.00% 22.22% 37.61% 31.62% 8.55%
Fentanyl +
Heroin 101 40 128 13 0 5 54 71 16 57 65 3 16 1 32 55 44 9
71.63% 28.37% 90.78% 9.22% 0.00% 3.55% 38.30% 50.35% 11.35% 40.43% 46.10% 2.13% 11.35% 0.71% 22.70% 39.01% 31.21% 6.38%
Fentanyl +
Cocaine 49 19 53 15 0 1 42 14 12 41 17 3 7 1 10 28 20 9
72.06% 27.94% 77.94% 22.06% 0.00% 1.47% 61.76% 20.59% 17.65% 60.29% 25.00% 4.41% 10.29% 1.47% 14.71% 41.18% 29.41% 13.24%
Fentanyl +
Heroin +
Cocaine 49 24 60 13 0 0 37 28 8 34 27 0 12 1 21 23 24 4
67.12% 32.88% 82.19% 17.81% 0.00% 0.00% 50.68% 38.36% 10.96% 46.58% 36.99% 0.00% 16.44% 1.37% 28.77% 31.51% 32.88% 5.48%
Source: Cuyahoga County Medical Examiner’s Office revised 6-1-18
2017 DEMOGRAPHIC ANALYSIS – HEROIN (PENDING)
HEROIN TOTAL Heroin
Heroin +
Fentanyl
Heroin +
Cocaine
Heroin +
Cocaine +
Fentanyl
320 72 141 34 73
22.50% 44.06% 10.63% 22.81%
Res Inc Age
Male Female White Black Other Hispanic CLE Sub OU CLE Sub OU ? <18 19-29 30-44 45-60 60+
228 92 283 36 1 8 138 145 37 136 128 6 38 3 68 116 102 31
71.25% 28.75% 88.44% 11.25% 0.31% 2.60% 44.81% 47.08% 12.01% 44.16% 41.56% 1.95% 12.34% 0.97% 22.08% 37.66% 33.12% 10.06%
Res Inc Age
Male Female White Black Other Hispanic CLE Sub OU CLE Sub OU ? <18 19-29 30-44 45-60 60+
Heroin 53 19 63 8 1 1 31 33 8 35 24 3 10 1 9 28 19 15
73.61% 26.39% 87.50% 11.11% 1.39% 1.39% 43.06% 45.83% 11.11% 48.61% 33.33% 4.17% 13.89% 1.39% 12.50% 38.89% 26.39% 20.83%
Heroin +
Fentanyl 101 40 128 13 0 5 54 71 16 57 65 3 16 1 32 55 44 9
71.63% 28.37% 90.78% 9.22% 0.00% 3.55% 38.30% 50.35% 11.35% 40.43% 46.10% 2.13% 11.35% 0.71% 22.70% 39.01% 31.21% 6.38%
Heroin +
Cocaine 25 9 32 2 0 2 16 14 4 18 14 0 2 0 6 10 15 3
73.53% 26.47% 94.12% 5.88% 0.00% 5.88% 47.06% 41.18% 11.76% 52.94% 41.18% 0.00% 5.88% 0.00% 17.65% 29.41% 44.12% 8.82%
Heroin +
Cocaine +
Fentanyl 49 24 60 13 0 0 37 28 8 34 27 0 12 1 21 23 24 4
67.12% 32.88% 82.19% 17.81% 0.00% 0.00% 50.68% 38.36% 10.96% 46.58% 36.99% 0.00% 16.44% 1.37% 28.77% 31.51% 32.88% 5.48%
Source: Cuyahoga County Medical Examiner’s Office revised 6-1-18
2017 DEMOGRAPHIC ANALYSIS – COCAINE (PENDING)
COCAINE TOTAL Cocaine
Cocaine +
Heroin
Fentanyl +
Cocaine
Cocaine +
Fentanyl +
Heroin
260 85 34 68 73
32.69% 13.08% 26.15% 28.08%
Res Inc Age
Male Female White Black Other Hispanic CLE Sub OU CLE Sub OU ? <18 19-29 30-44 45-60 60+
184 76 181 79 0 4 145 82 33 141 78 4 37 5 42 77 104 32
70.77% 29.23% 69.62% 30.38% 0.00% 1.54% 55.77% 31.54% 12.69% 54.23% 30.00% 1.54% 14.23% 1.92% 16.15% 29.62% 40.00% 12.31%
Res Inc Age
Male Female White Black Other Hispanic CLE Sub OU CLE Sub OU ? <18 19-29 30-44 45-60 60+
Cocaine 61 24 36 49 0 1 50 26 9 48 20 1 16 2 5 16 46 16
71.76% 28.24% 42.35% 57.65% 0.00% 1.18% 58.82% 30.59% 10.59% 56.47% 23.53% 1.18% 18.82% 2.35% 5.88% 18.82% 54.12% 18.82%
Cocaine +
Heroin 25 9 32 2 0 2 16 14 4 18 14 0 2 1 6 10 14 3
73.53% 26.47% 94.12% 5.88% 0.00% 5.88% 47.06% 41.18% 11.76% 52.94% 41.18% 0.00% 5.88% 2.94% 17.65% 29.41% 41.18% 8.82%
Fentanyl +
Cocaine 49 19 53 15 0 1 42 14 12 41 17 3 7 1 10 28 20 9
72.06% 27.94% 77.94% 22.06% 0.00% 1.47% 61.76% 20.59% 17.65% 60.29% 25.00% 4.41% 10.29% 1.47% 14.71% 41.18% 29.41% 13.24%
Fentanyl +
Heroin +
Cocaine 49 24 60 13 0 0 37 28 8 34 27 0 12 1 21 23 24 4
67.12% 32.88% 82.19% 17.81% 0.00% 0.00% 50.68% 38.36% 10.96% 46.58% 36.99% 0.00% 16.44% 1.37% 28.77% 31.51% 32.88% 5.48%
Source: Cuyahoga County Medical Examiner’s Office revised 6-1-18
2017 DEMOGRAPHIC ANALYSIS – CARFENTANIL (PENDING)
COCAINE TOTAL Cocaine
Cocaine +
Heroin
Fentanyl +
Cocaine
Cocaine +
Fentanyl +
Heroin
260 85 34 68 73
32.69% 13.08% 26.15% 28.08%
Res Inc Age
Male Female White Black Other Hispanic CLE Sub OU CLE Sub OU ? <18 19-29 30-44 45-60 60+
184 76 181 79 0 4 145 82 33 141 78 4 37 5 42 77 104 32
70.77% 29.23% 69.62% 30.38% 0.00% 1.54% 55.77% 31.54% 12.69% 54.23% 30.00% 1.54% 14.23% 1.92% 16.15% 29.62% 40.00% 12.31%
Res Inc Age
Male Female White Black Other Hispanic CLE Sub OU CLE Sub OU ? <18 19-29 30-44 45-60 60+
Cocaine 61 24 36 49 0 1 50 26 9 48 20 1 16 2 5 16 46 16
71.76% 28.24% 42.35% 57.65% 0.00% 1.18% 58.82% 30.59% 10.59% 56.47% 23.53% 1.18% 18.82% 2.35% 5.88% 18.82% 54.12% 18.82%
Cocaine +
Heroin 25 9 32 2 0 2 16 14 4 18 14 0 2 1 6 10 14 3
73.53% 26.47% 94.12% 5.88% 0.00% 5.88% 47.06% 41.18% 11.76% 52.94% 41.18% 0.00% 5.88% 2.94% 17.65% 29.41% 41.18% 8.82%
Fentanyl +
Cocaine 49 19 53 15 0 1 42 14 12 41 17 3 7 1 10 28 20 9
72.06% 27.94% 77.94% 22.06% 0.00% 1.47% 61.76% 20.59% 17.65% 60.29% 25.00% 4.41% 10.29% 1.47% 14.71% 41.18% 29.41% 13.24%
Fentanyl +
Heroin +
Cocaine 49 24 60 13 0 0 37 28 8 34 27 0 12 1 21 23 24 4
67.12% 32.88% 82.19% 17.81% 0.00% 0.00% 50.68% 38.36% 10.96% 46.58% 36.99% 0.00% 16.44% 1.37% 28.77% 31.51% 32.88% 5.48%
Source: Cuyahoga County Medical Examiner’s Office revised 6-1-18
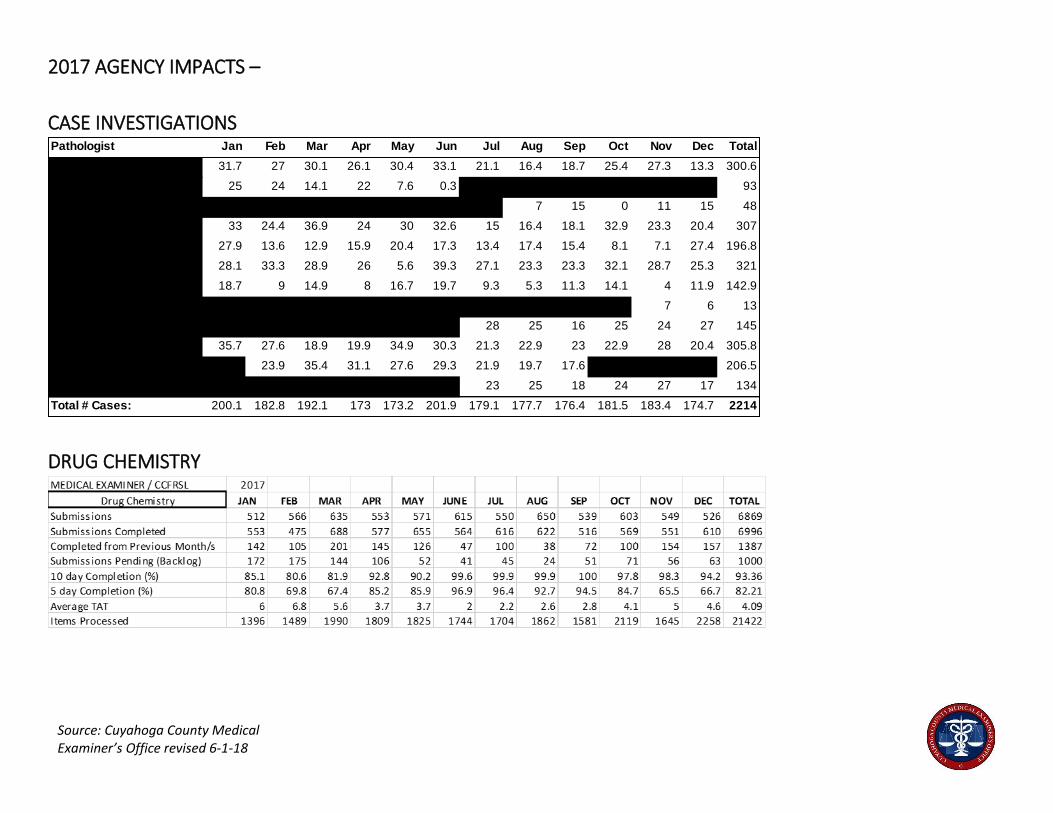
2017 AGENCY IMPACTS –
CASE INVESTIGATIONS
DRUG CHEMISTRY
Jan Feb Mar Apr May Jun Jul Aug Sep Oct Nov Dec Total
31.7 27 30.1 26.1 30.4 33.1 21.1 16.4 18.7 25.4 27.3 13.3 300.6
25 24 14.1 22 7.6 0.3 0 0 0 0 0 0 93
0 0 0 0 0 0 0 7 15 0 11 15 48
33 24.4 36.9 24 30 32.6 15 16.4 18.1 32.9 23.3 20.4 307
27.9 13.6 12.9 15.9 20.4 17.3 13.4 17.4 15.4 8.1 7.1 27.4 196.8
28.1 33.3 28.9 26 5.6 39.3 27.1 23.3 23.3 32.1 28.7 25.3 321
18.7 9 14.9 8 16.7 19.7 9.3 5.3 11.3 14.1 4 11.9 142.9
0 0 0 0 0 0 0 0 0 0 7 6 13
0 0 0 0 0 0 28 25 16 25 24 27 145
35.7 27.6 18.9 19.9 34.9 30.3 21.3 22.9 23 22.9 28 20.4 305.8
0 23.9 35.4 31.1 27.6 29.3 21.9 19.7 17.6 0 0 0 206.5
0 0 0 0 0 0 23 25 18 24 27 17 134
200.1 182.8 192.1 173 173.2 201.9 179.1 177.7 176.4 181.5 183.4 174.7 2214
McCollom M.D., Andrea
Mooney D.O., Elizabeth
Spencer D.O., Amanda
Total # Cases:
Felo D.O., Joseph A.
Galita M.D., Dan A.
Gilson M.D., Thomas P.
Keep M.D., David
Magguilli M.D., Michael
Armstrong M.D., Erica J.
Barr M.D., Todd
Catanese M.D., Charles
Dolinak M.D., David
Pathologist
Source: Cuyahoga County Medical Examiner’s Office revised 6-1-18
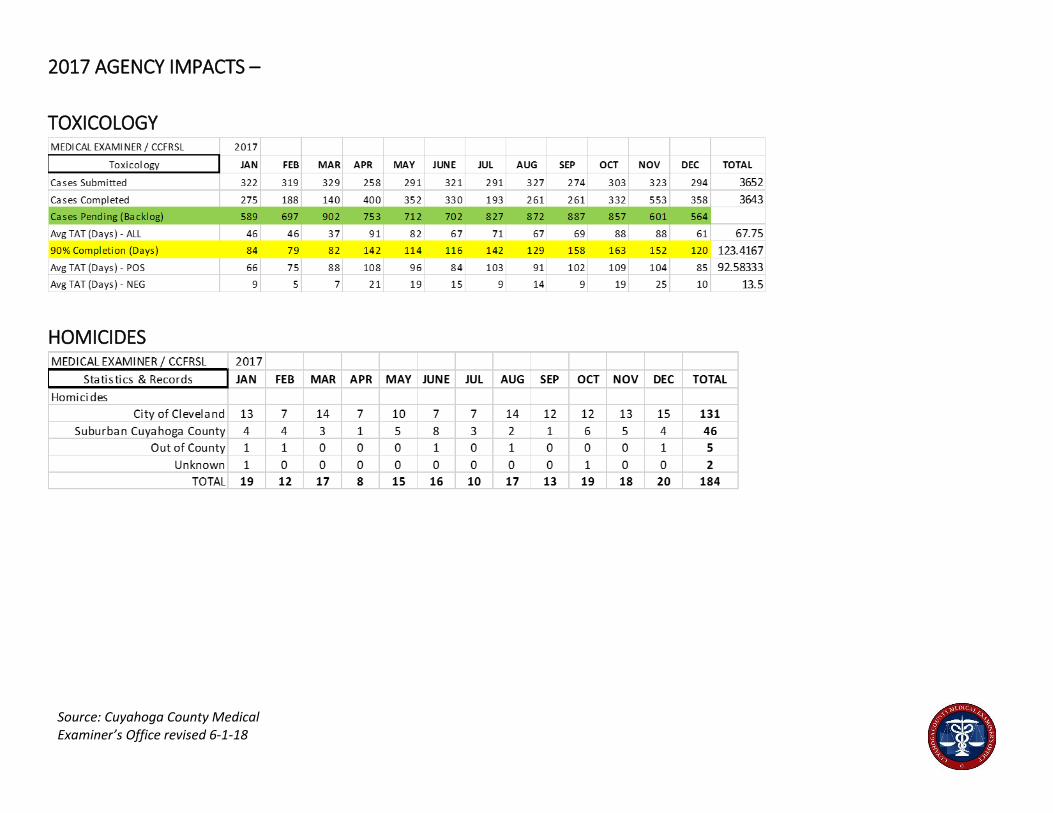
2017 AGENCY IMPACTS –
TOXICOLOGY
HOMICIDES
Source: Cuyahoga County Medical Examiner’s Office revised 6-1-18
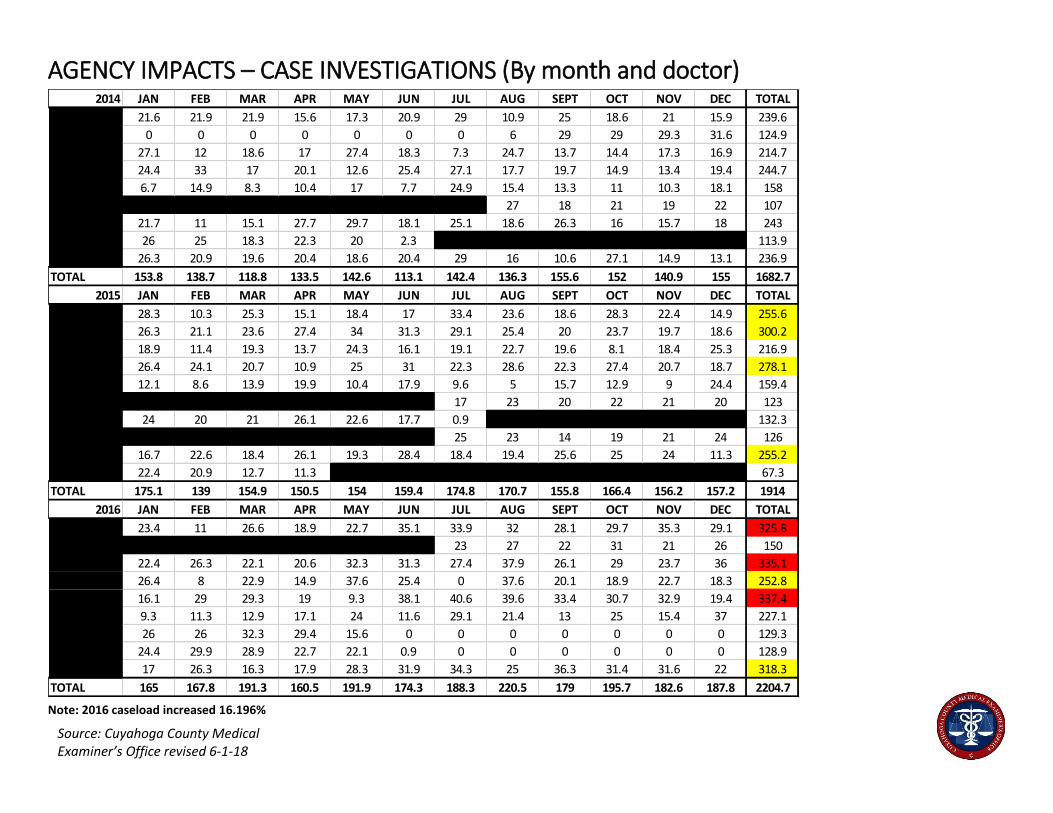
2014 JAN FEB MAR APR MAY JUN JUL AUG SEPT OCT NOV DEC TOTAL
Armstrong 21.6 21.9 21.9 15.6 17.3 20.9 29 10.9 25 18.6 21 15.9 239.6
Dolinak 0 0 0 0 0 0 0 6 29 29 29.3 31.6 124.9
Felo 27.1 12 18.6 17 27.4 18.3 7.3 24.7 13.7 14.4 17.3 16.9 214.7
Galita 24.4 33 17 20.1 12.6 25.4 27.1 17.7 19.7 14.9 13.4 19.4 244.7
Gilson 6.7 14.9 8.3 10.4 17 7.7 24.9 15.4 13.3 11 10.3 18.1 158
Keep 0 0 0 0 0 0 0 27 18 21 19 22 107
McCollom 21.7 11 15.1 27.7 29.7 18.1 25.1 18.6 26.3 16 15.7 18 243
Niblo 26 25 18.3 22.3 20 2.3 0 0 0 0 0 0 113.9
Timm 26.3 20.9 19.6 20.4 18.6 20.4 29 16 10.6 27.1 14.9 13.1 236.9
TOTAL 153.8 138.7 118.8 133.5 142.6 113.1 142.4 136.3 155.6 152 140.9 155 1682.7
2015 JAN FEB MAR APR MAY JUN JUL AUG SEPT OCT NOV DEC TOTAL
Armstrong 28.3 10.3 25.3 15.1 18.4 17 33.4 23.6 18.6 28.3 22.4 14.9 255.6
Dolinak 26.3 21.1 23.6 27.4 34 31.3 29.1 25.4 20 23.7 19.7 18.6 300.2
Felo 18.9 11.4 19.3 13.7 24.3 16.1 19.1 22.7 19.6 8.1 18.4 25.3 216.9
Galita 26.4 24.1 20.7 10.9 25 31 22.3 28.6 22.3 27.4 20.7 18.7 278.1
Gilson 12.1 8.6 13.9 19.9 10.4 17.9 9.6 5 15.7 12.9 9 24.4 159.4
Hansma 0 0 0 0 0 0 17 23 20 22 21 20 123
Keep 24 20 21 26.1 22.6 17.7 0.9 0 0 0 0 0 132.3
Maskovyak 0 0 0 0 0 0 25 23 14 19 21 24 126
McCollom 16.7 22.6 18.4 26.1 19.3 28.4 18.4 19.4 25.6 25 24 11.3 255.2
Timm 22.4 20.9 12.7 11.3 0 0 0 0 0 0 0 0 67.3
TOTAL 175.1 139 154.9 150.5 154 159.4 174.8 170.7 155.8 166.4 156.2 157.2 1914
2016 JAN FEB MAR APR MAY JUN JUL AUG SEPT OCT NOV DEC TOTAL
Armstrong 23.4 11 26.6 18.9 22.7 35.1 33.9 32 28.1 29.7 35.3 29.1 325.8
Barr 23 27 22 31 21 26 150
Dolinak 22.4 26.3 22.1 20.6 32.3 31.3 27.4 37.9 26.1 29 23.7 36 335.1
Felo 26.4 8 22.9 14.9 37.6 25.4 0 37.6 20.1 18.9 22.7 18.3 252.8
Galita 16.1 29 29.3 19 9.3 38.1 40.6 39.6 33.4 30.7 32.9 19.4 337.4
Gilson 9.3 11.3 12.9 17.1 24 11.6 29.1 21.4 13 25 15.4 37 227.1
Hansma 26 26 32.3 29.4 15.6 0 0 0 0 0 0 0 129.3
Maskovyak 24.4 29.9 28.9 22.7 22.1 0.9 0 0 0 0 0 0 128.9
McCollom 17 26.3 16.3 17.9 28.3 31.9 34.3 25 36.3 31.4 31.6 22 318.3
TOTAL 165 167.8 191.3 160.5 191.9 174.3 188.3 220.5 179 195.7 182.6 187.8 2204.7
AGENCY IMPACTS – CASE INVESTIGATIONS (By month and doctor)
Note: 2016 caseload increased 16.196%
Source: Cuyahoga County Medical Examiner’s Office revised 6-1-18
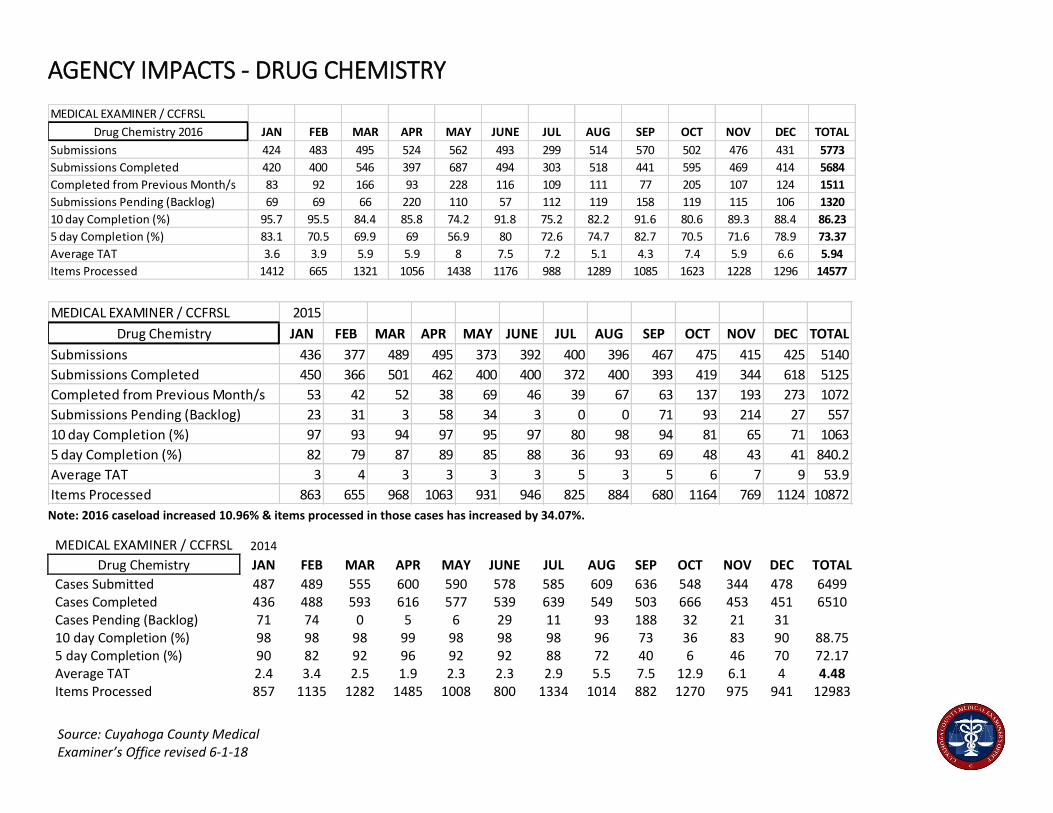
MEDICAL EXAMINER / CCFRSL
Drug Chemistry 2016 JAN FEB MAR APR MAY JUNE JUL AUG SEP OCT NOV DEC TOTAL
Submissions 424 483 495 524 562 493 299 514 570 502 476 431 5773
Submissions Completed 420 400 546 397 687 494 303 518 441 595 469 414 5684
Completed from Previous Month/s 83 92 166 93 228 116 109 111 77 205 107 124 1511
Submissions Pending (Backlog) 69 69 66 220 110 57 112 119 158 119 115 106 1320
10 day Completion (%) 95.7 95.5 84.4 85.8 74.2 91.8 75.2 82.2 91.6 80.6 89.3 88.4 86.23
5 day Completion (%) 83.1 70.5 69.9 69 56.9 80 72.6 74.7 82.7 70.5 71.6 78.9 73.37
Average TAT 3.6 3.9 5.9 5.9 8 7.5 7.2 5.1 4.3 7.4 5.9 6.6 5.94
Items Processed 1412 665 1321 1056 1438 1176 988 1289 1085 1623 1228 1296 14577
MEDICAL EXAMINER / CCFRSL 2015
Drug Chemistry JAN FEB MAR APR MAY JUNE JUL AUG SEP OCT NOV DEC TOTAL
Submissions 436 377 489 495 373 392 400 396 467 475 415 425 5140
Submissions Completed 450 366 501 462 400 400 372 400 393 419 344 618 5125
Completed from Previous Month/s 53 42 52 38 69 46 39 67 63 137 193 273 1072
Submissions Pending (Backlog) 23 31 3 58 34 3 0 0 71 93 214 27 557
10 day Completion (%) 97 93 94 97 95 97 80 98 94 81 65 71 1063
5 day Completion (%) 82 79 87 89 85 88 36 93 69 48 43 41 840.2
Average TAT 3 4 3 3 3 3 5 3 5 6 7 9 53.9
Items Processed 863 655 968 1063 931 946 825 884 680 1164 769 1124 10872
AGENCY IMPACTS - DRUG CHEMISTRY
Note: 2016 caseload increased 10.96% & items processed in those cases has increased by 34.07%.
MEDICAL EXAMINER / CCFRSL 2014
Drug Chemistry JAN FEB MAR APR MAY JUNE JUL AUG SEP OCT NOV DEC TOTAL
Cases Submitted 487 489 555 600 590 578 585 609 636 548 344 478 6499 Cases Completed 436 488 593 616 577 539 639 549 503 666 453 451 6510 Cases Pending (Backlog) 71 74 0 5 6 29 11 93 188 32 21 31 10 day Completion (%) 98 98 98 99 98 98 98 96 73 36 83 90 88.75 5 day Completion (%) 90 82 92 96 92 92 88 72 40 6 46 70 72.17 Average TAT 2.4 3.4 2.5 1.9 2.3 2.3 2.9 5.5 7.5 12.9 6.1 4 4.48 Items Processed 857 1135 1282 1485 1008 800 1334 1014 882 1270 975 941 12983
Source: Cuyahoga County Medical Examiner’s Office revised 6-1-18
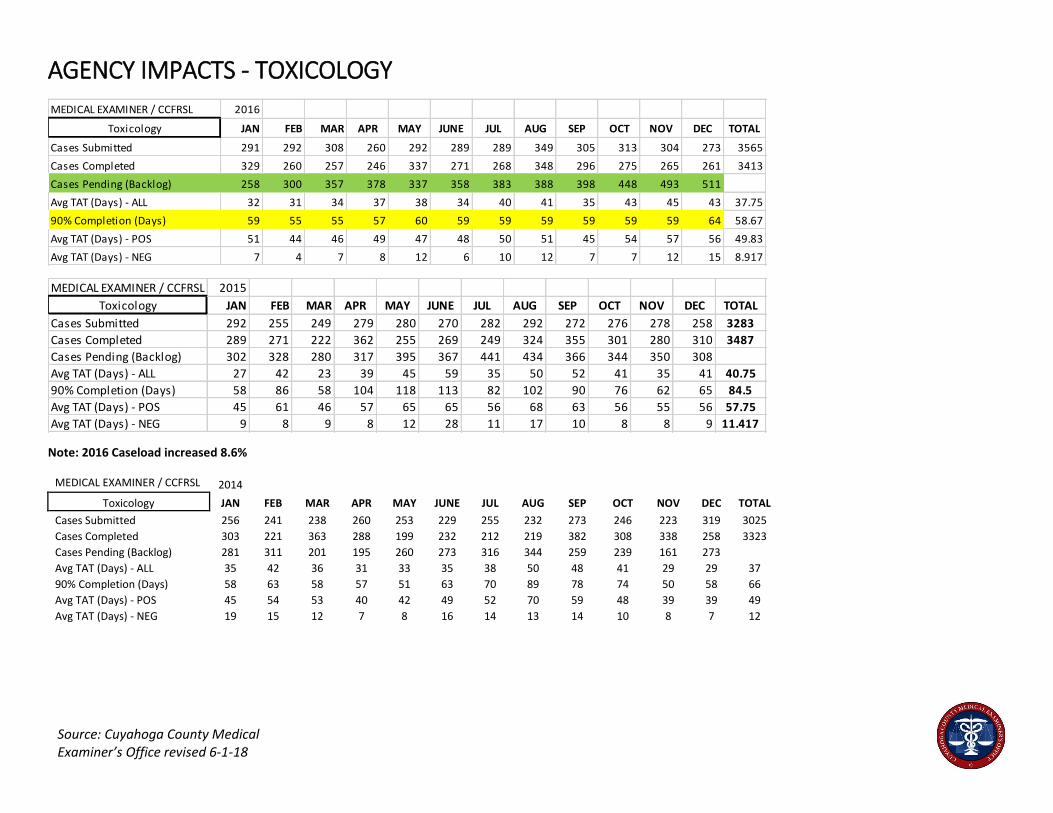
MEDICAL EXAMINER / CCFRSL 2016
Toxicology JAN FEB MAR APR MAY JUNE JUL AUG SEP OCT NOV DEC TOTAL
Cases Submitted 291 292 308 260 292 289 289 349 305 313 304 273 3565
Cases Completed 329 260 257 246 337 271 268 348 296 275 265 261 3413
Cases Pending (Backlog) 258 300 357 378 337 358 383 388 398 448 493 511
Avg TAT (Days) - ALL 32 31 34 37 38 34 40 41 35 43 45 43 37.75
90% Completion (Days) 59 55 55 57 60 59 59 59 59 59 59 64 58.67
Avg TAT (Days) - POS 51 44 46 49 47 48 50 51 45 54 57 56 49.83
Avg TAT (Days) - NEG 7 4 7 8 12 6 10 12 7 7 12 15 8.917
AGENCY IMPACTS - TOXICOLOGY
Note: 2016 Caseload increased 8.6%
MEDICAL EXAMINER / CCFRSL 2015
Toxicology JAN FEB MAR APR MAY JUNE JUL AUG SEP OCT NOV DEC TOTAL
Cases Submitted 292 255 249 279 280 270 282 292 272 276 278 258 3283
Cases Completed 289 271 222 362 255 269 249 324 355 301 280 310 3487
Cases Pending (Backlog) 302 328 280 317 395 367 441 434 366 344 350 308
Avg TAT (Days) - ALL 27 42 23 39 45 59 35 50 52 41 35 41 40.75
90% Completion (Days) 58 86 58 104 118 113 82 102 90 76 62 65 84.5
Avg TAT (Days) - POS 45 61 46 57 65 65 56 68 63 56 55 56 57.75
Avg TAT (Days) - NEG 9 8 9 8 12 28 11 17 10 8 8 9 11.417
MEDICAL EXAMINER / CCFRSL 2014
Toxicology JAN FEB MAR APR MAY JUNE JUL AUG SEP OCT NOV DEC TOTAL
Cases Submitted 256 241 238 260 253 229 255 232 273 246 223 319 3025
Cases Completed 303 221 363 288 199 232 212 219 382 308 338 258 3323
Cases Pending (Backlog) 281 311 201 195 260 273 316 344 259 239 161 273 Avg TAT (Days) - ALL 35 42 36 31 33 35 38 50 48 41 29 29 37
90% Completion (Days) 58 63 58 57 51 63 70 89 78 74 50 58 66
Avg TAT (Days) - POS 45 54 53 40 42 49 52 70 59 48 39 39 49
Avg TAT (Days) - NEG 19 15 12 7 8 16 14 13 14 10 8 7 12
Source: Cuyahoga County Medical Examiner’s Office revised 6-1-18
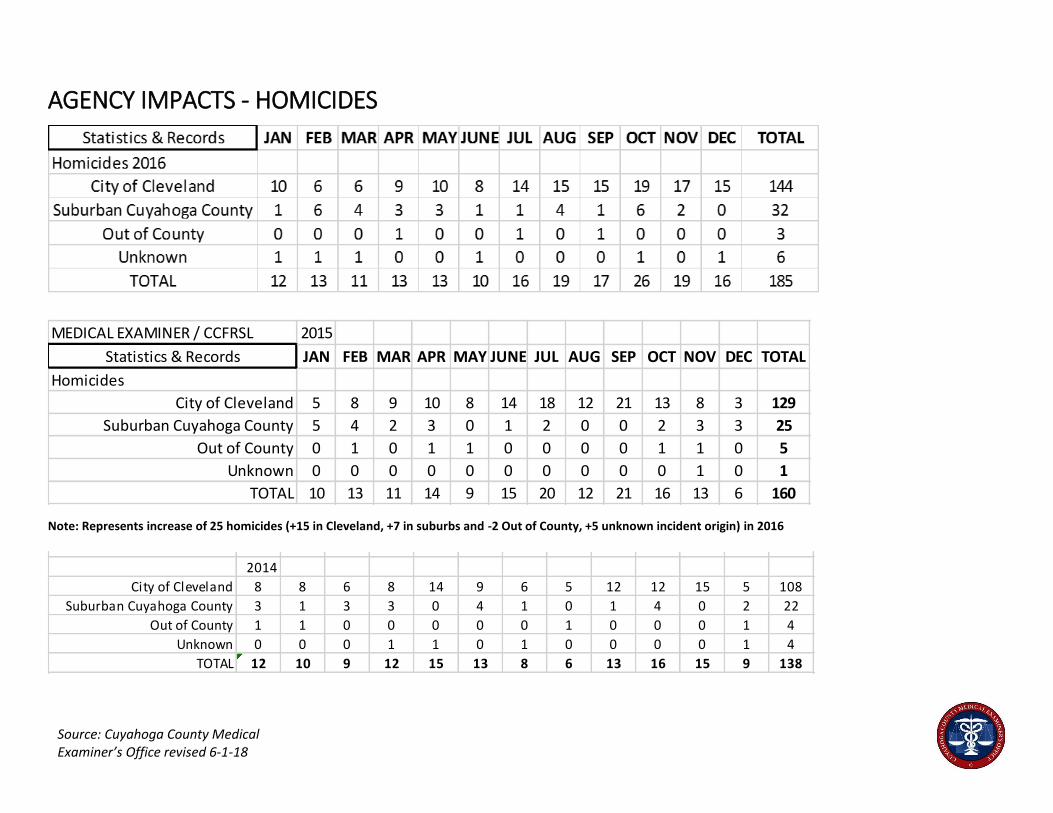
MEDICAL EXAMINER / CCFRSL 2015
Statistics & Records JAN FEB MAR APR MAY JUNE JUL AUG SEP OCT NOV DEC TOTAL
City of Cleveland 5 8 9 10 8 14 17 12 21 12 9 125
Suburban Cuyahoga County 5 4 2 3 0 1 2 0 0 2 3 22
Out of County 0 1 0 1 1 0 0 0 0 1 1 5
Unknown 0 0 0 0 0 0 0 0 0 0 0 0
TOTAL 10 13 11 14 9 15 19 12 21 15 13 152
2014
City of Cleveland 8 8 6 8 14 9 6 5 12 12 15 5 108
Suburban Cuyahoga County 3 1 3 3 0 4 1 0 1 4 0 2 22
Out of County 1 1 0 0 0 0 0 1 0 0 0 1 4
Unknown 0 0 0 1 1 0 1 0 0 0 0 1 4
TOTAL 12 10 9 12 15 13 8 6 13 16 15 9 138
AGENCY IMPACTS - HOMICIDES
Note: Represents increase of 25 homicides (+15 in Cleveland, +7 in suburbs and -2 Out of County, +5 unknown incident origin) in 2016
MEDICAL EXAMINER / CCFRSL 2015
Statistics & Records JAN FEB MAR APR MAY JUNE JUL AUG SEP OCT NOV DEC TOTAL
Homicides
City of Cleveland 5 8 9 10 8 14 18 12 21 13 8 3 129
Suburban Cuyahoga County 5 4 2 3 0 1 2 0 0 2 3 3 25
Out of County 0 1 0 1 1 0 0 0 0 1 1 0 5
Unknown 0 0 0 0 0 0 0 0 0 0 1 0 1
TOTAL 10 13 11 14 9 15 20 12 21 16 13 6 160
Source: Cuyahoga County Medical Examiner’s Office revised 6-1-18
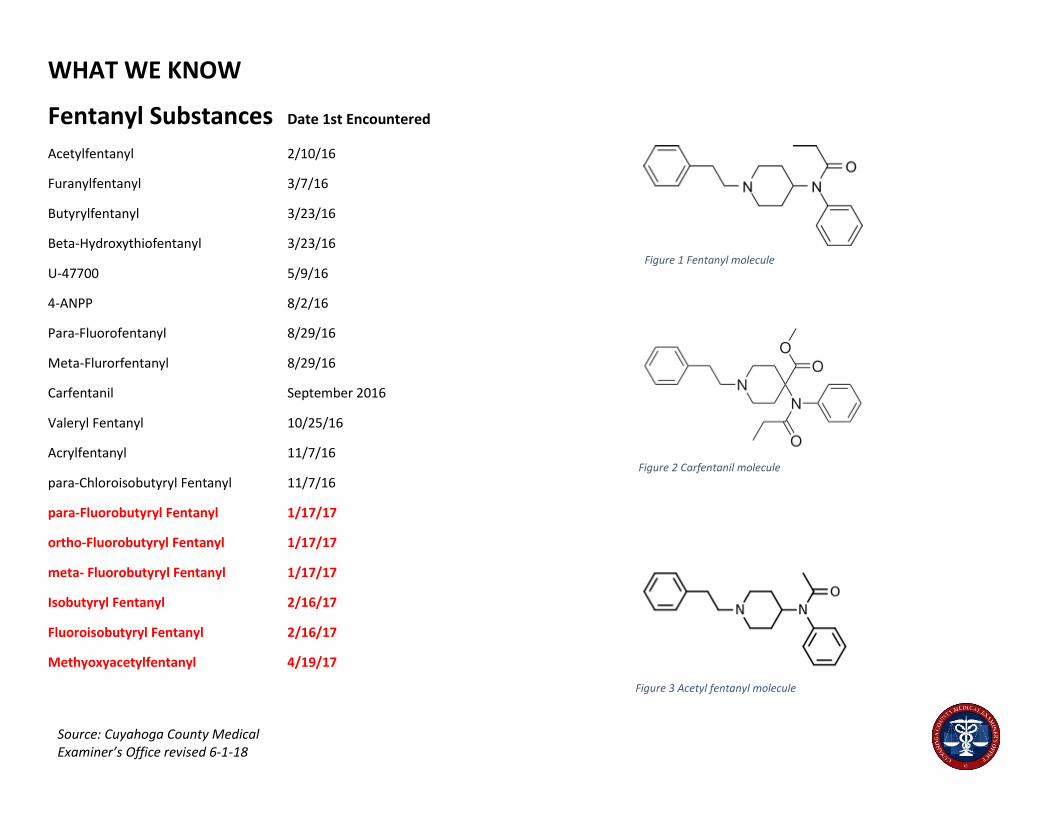
WHAT WE KNOW
Fentanyl Substances Date 1st Encountered
Acetylfentanyl 2/10/16
Furanylfentanyl 3/7/16
Butyrylfentanyl 3/23/16
Beta-Hydroxythiofentanyl 3/23/16
U-47700 5/9/16
4-ANPP 8/2/16
Para-Fluorofentanyl 8/29/16
Meta-Flurorfentanyl 8/29/16
Carfentanil September 2016
Valeryl Fentanyl 10/25/16
Acrylfentanyl 11/7/16
para-Chloroisobutyryl Fentanyl 11/7/16
para-Fluorobutyryl Fentanyl 1/17/17
ortho-Fluorobutyryl Fentanyl 1/17/17
meta- Fluorobutyryl Fentanyl 1/17/17
Isobutyryl Fentanyl 2/16/17
Fluoroisobutyryl Fentanyl 2/16/17
Methyoxyacetylfentanyl 4/19/17
Figure 1 Fentanyl molecule
Figure 2 Carfentanil molecule
Figure 3 Acetyl fentanyl molecule
Source: Cuyahoga County Medical Examiner’s Office revised 6-1-18
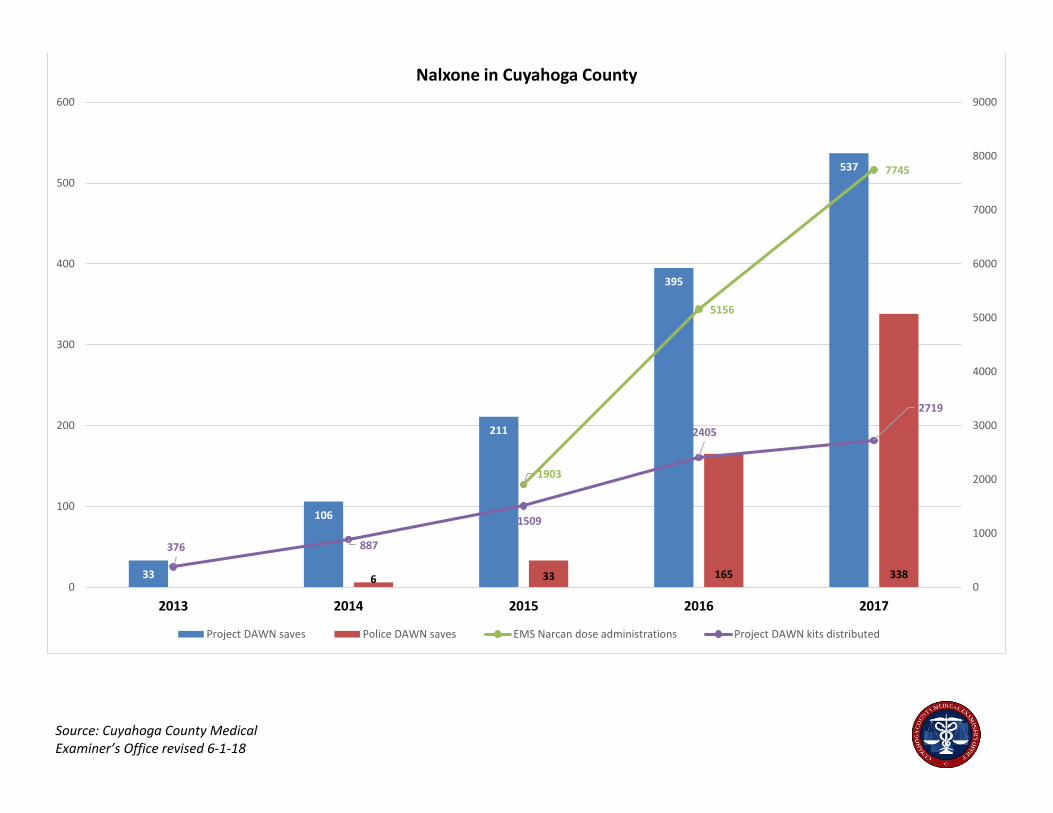
33
106
211
395
537
6 33 165 338
1903
5156
7745
376 887
1509
2405
2719
0
1000
2000
3000
4000
5000
6000
7000
8000
9000
0
100
200
300
400
500
600
2013 2014 2015 2016 2017
Nalxone in Cuyahoga County
Project DAWN saves Police DAWN saves EMS Narcan dose administrations Project DAWN kits distributed
Source: Cuyahoga County Medical Examiner’s Office revised 6-1-18
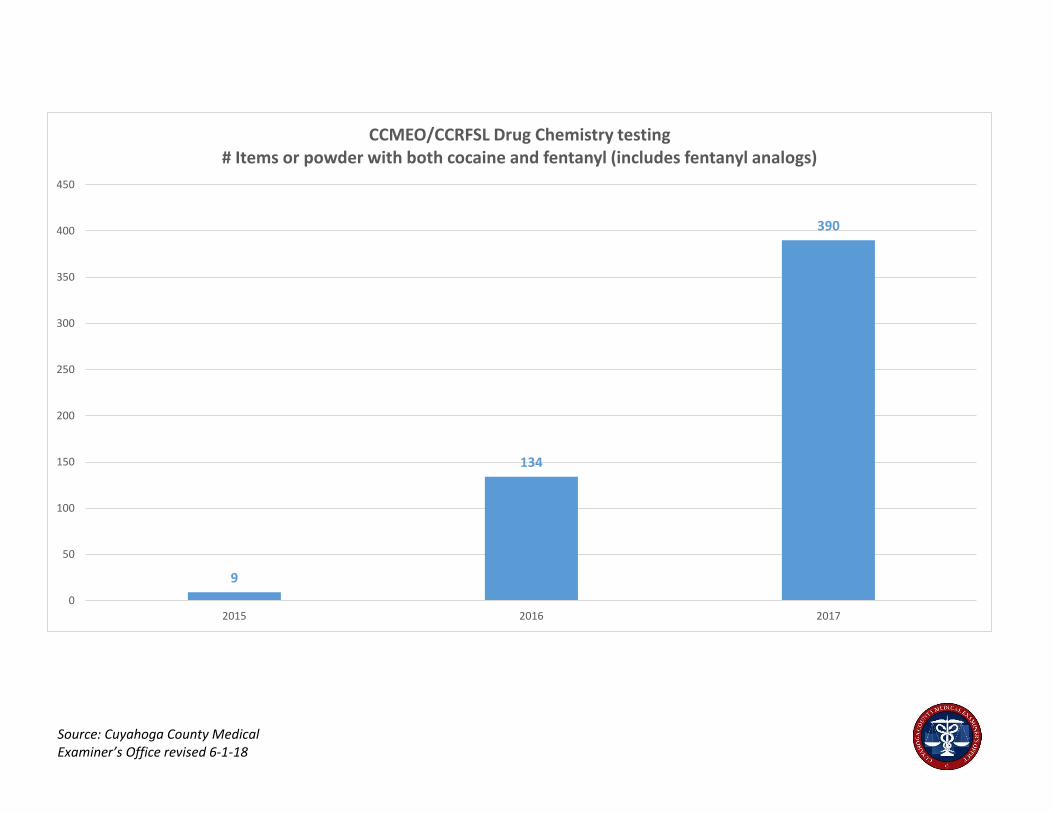
9
134
390
0
50
100
150
200
250
300
350
400
450
2015 2016 2017
CCMEO/CCRFSL Drug Chemistry testing# Items or powder with both cocaine and fentanyl (includes fentanyl analogs)
Source: Cuyahoga County Medical Examiner’s Office revised 6-1-18
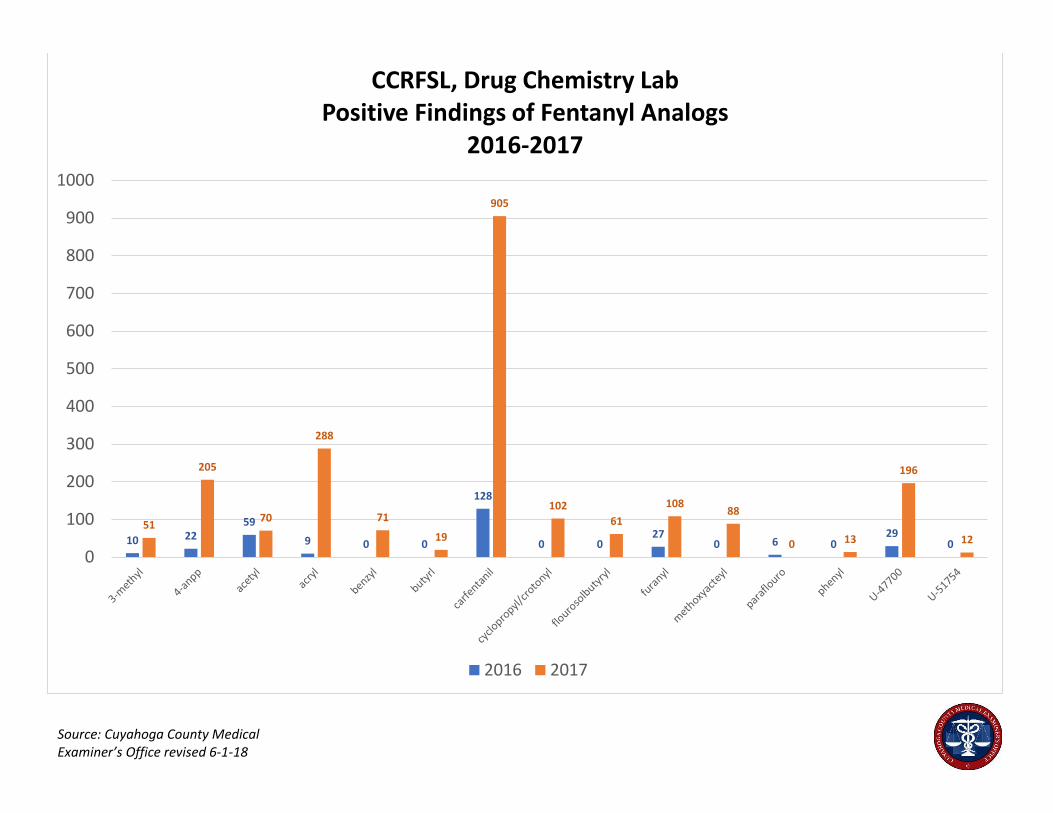
10 2259
9 0 0
128
0 027
0 6 029
0
51
205
70
288
71
19
905
102
61
10888
0 13
196
12
0
100
200
300
400
500
600
700
800
900
1000
CCRFSL, Drug Chemistry LabPositive Findings of Fentanyl Analogs
2016-2017
2016 2017
Source: Cuyahoga County Medical Examiner’s Office revised 6-1-18
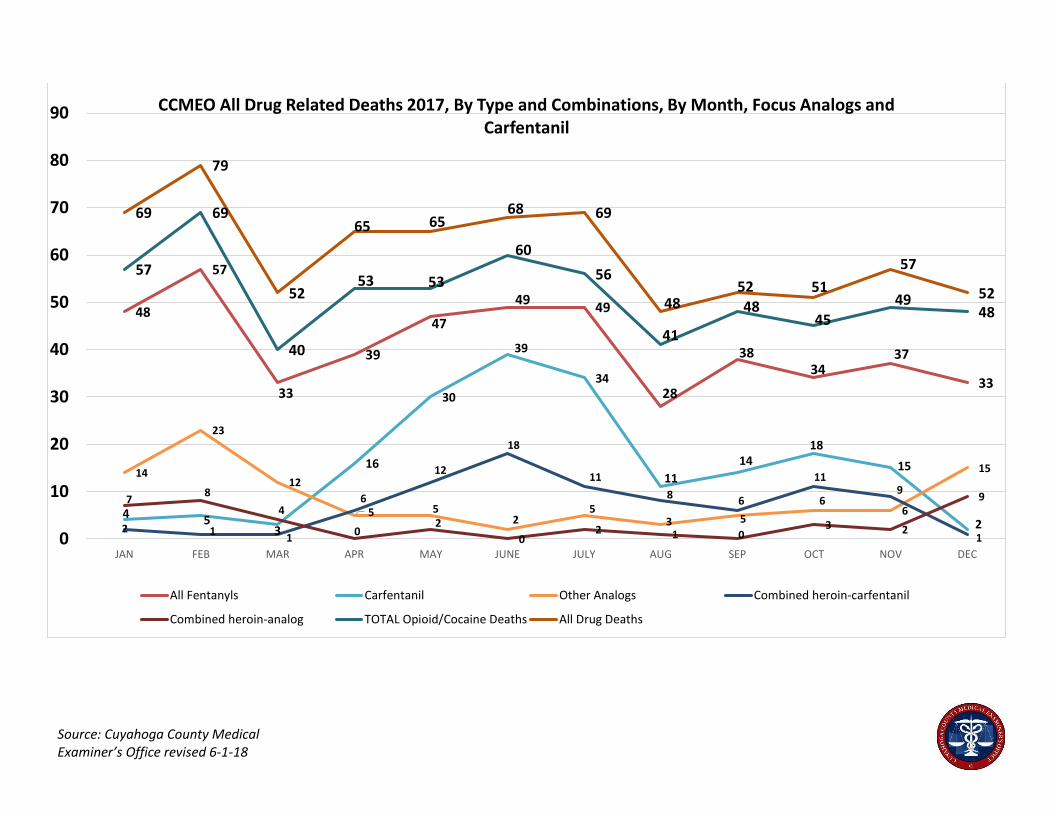
48
57
33
39
47
4949
28
3834
37
33
4 53
16
30
39
34
11
1418
15
2
14
23
12
5 52
53 5
66
15
2 11
6
12
18
11
86
119
1
78
4
02
02 1 0
3 2
9
57
69
40
53 53
60
56
41
4845
4948
69
79
52
65 6568 69
4852 51
57
52
0
10
20
30
40
50
60
70
80
90
JAN FEB MAR APR MAY JUNE JULY AUG SEP OCT NOV DEC
CCMEO All Drug Related Deaths 2017, By Type and Combinations, By Month, Focus Analogs and Carfentanil
All Fentanyls Carfentanil Other Analogs Combined heroin-carfentanil
Combined heroin-analog TOTAL Opioid/Cocaine Deaths All Drug Deaths
Source: Cuyahoga County Medical Examiner’s Office revised 6-1-18
0
10
20
30
40
50
60
70
80
90
100
0
40
80
120
160
200
240
280
320
360
400
Jan
Feb
Mar
Ap
r
May Jun
July
Au
g
Sep
Oct
No
v
De
c
Jan
Feb
Mar
Ap
r
May Jun
July
Au
g
Sep
Oct
No
v
De
c
Jan
Feb
Mar
Ap
r
May Jun
July
Au
g
Sep
Oct
No
v
De
c
Jan
Feb
Mar
Ap
r
May Jun
July
Au
g
Sep
Oct
No
v
De
c
Jan
Feb
Mar
Ap
r
2014 2015 2016 2017 2018
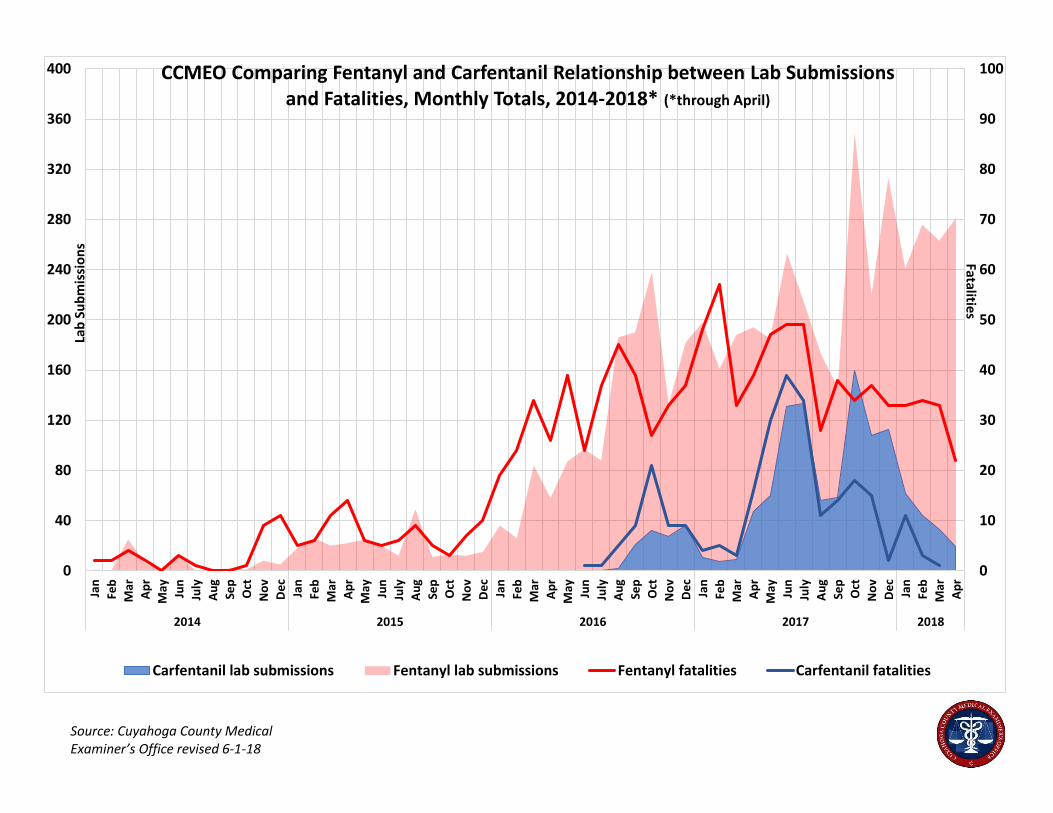
CCMEO Comparing Fentanyl and Carfentanil Relationship between Lab Submissions and Fatalities, Monthly Totals, 2014-2018* (*through April)
Carfentanil lab submissions Fentanyl lab submissions Fentanyl fatalities Carfentanil fatalities
Lab
Su
bm
issi
on
sFatalitie
s
Source: Cuyahoga County Medical Examiner’s Office revised 6-1-18