Prefeasibility Report on WMS implementation - … · Electronic Database: Implementing a real time...
60
-
Upload
nguyenmien -
Category
Documents
-
view
223 -
download
0
Transcript of Prefeasibility Report on WMS implementation - … · Electronic Database: Implementing a real time...

Prefeasibility Report on WMS implementation
i
Disclaimer
The information in this Report has been prepared based on information collected from secondary
sources. Wherever information was not readily available, reasonable assumptions have been made, in
good faith to draw meaningful inferences and these have been mentioned in the respective sections of
the report. All such assumptions are subject to further corroboration based on availability of
information. The information and analysis presented in this Report is not and does not purport to be
comprehensive or to have been independently verified. This report has been prepared by Feedback
Infrastructure Private Limited for its client, Infrastructure Development Department (IDD) for its use for
furthering the project. No external agency shall use any part of this report without the prior permission
from IDD.
The information contained in this Report is selective and is subject to updating, expansion, revision and
amendment. It does not, and does not purport to, contain all the information that may be required.
This Report includes certain statements, estimates, projections and forecasts. Such statements,
estimates, projections, targets and forecasts are based on reasonable assumptions made by the
management, officer and employees of Feedback Infrastructure Private Limited. Assumptions and the
base information on which they are made may or may not prove to be correct. No representation or
warranty is given as to the reasonableness of forecasts or the assumptions on which they may be based
and nothing in this Report is, or should be relied on as, a promise, representation or warranty.

Prefeasibility Report on WMS implementation
ii
Table of Contents
1 EXECUTIVE SUMMARY ................................................................................................................................... 1
2 INTRODUCTION ............................................................................................................................................. 9
2.1 STRUCTURE OF THE REPORT .............................................................................................................................. 10
2.2 APPROACH & METHODOLOGY ........................................................................................................................... 11
3 SECTOR PROFILE .......................................................................................................................................... 13
3.1 INDUSTRY OVERVIEW ....................................................................................................................................... 13
3.2 WAREHOUSING IN INDIA .................................................................................................................................. 13
3.3 KARNATAKA STATE WAREHOUSING CORPORATION (KSWC) ................................................................................... 14
3.4 AGRICULTURE IN KARNATAKA ............................................................................................................................ 15
3.5 PPP INITIATIVES IN WAREHOUSING-PRIVATE ENTREPRENEURS GODOWNS SCHEME 2008 ............................................ 15
4 PROJECT ...................................................................................................................................................... 18
4.1 DESCRIPTION OF THE PROJECT ........................................................................................................................... 18
4.2 BEST CASE STUDIES FOR SIMILAR PROJECTS IN INDIA .............................................................................................. 23
4.2.1 Passport Seva Kendras in India – A PPP initiative .................................................................................. 23
4.2.2 Issue of smart cards by RTOs in Karnataka ............................................................................................ 25
4.3 PROJECT STRUCTURE ....................................................................................................................................... 27
5 MARKET ASSESSMENT ................................................................................................................................. 29
5.1 WAREHOUSE MANAGEMENT SYSTEMS ................................................................................................................ 29
5.2 RELEVANCE OF WMS TO KSWC ........................................................................................................................ 30
5.2.1 Advantages for KSWC ............................................................................................................................ 32
5.3 SITE FEATURES................................................................................................................................................ 34
5.4 PROJECT DESIGN ............................................................................................................................................. 38
6 PROJECT FINANCIALS ................................................................................................................................... 40
6.1 COST ASSUMPTIONS ........................................................................................................................................ 40
6.1.1 Capital expenditure assumptions ........................................................................................................... 40
6.1.2 Financing assumptions........................................................................................................................... 41
6.1.3 Depreciation assumptions ..................................................................................................................... 41
6.2 REVENUE ASSUMPTIONS ................................................................................................................................... 41
6.3 OPERATING EXPENSE ASSUMPTIONS .................................................................................................................... 42
6.4 VIABILITY ASSESSMENT (NPV, PROJECT IRR, EQUITY IRR) ..................................................................................... 43
6.5 VALUE FOR MONEY ......................................................................................................................................... 45
7 STATUTORY & LEGAL FRAMEWORK ............................................................................................................. 46
7.1. LEGAL & REGULATORY FRAMEWORK ...................................................................................................... 46
8 INDICATIVE ENVIRONMENTAL AND SOCIAL IMPACTS ................................................................................. 48
8.1 ENVIRONMENTAL IMPACT ................................................................................................................................. 48
8.2 SOCIAL IMPACT ............................................................................................................................................... 48
9 OPERATING FRAMEWORK ........................................................................................................................... 49

Prefeasibility Report on WMS implementation
iii
9.1 RISKS & MITIGATION ....................................................................................................................................... 49
9.2 INDICATIVE PROJECT STRUCTURE ........................................................................................................................ 50
10 WAY AHEAD ................................................................................................................................................ 51
10.1 NEXT STEPS ................................................................................................................................................... 51
10.2 RECOMMENDATIONS ....................................................................................................................................... 52
11 ANNEXURE .................................................................................................................................................. 53
11.1 CASH-FLOW STATEMENT FOR THE PROJECT .......................................................................................................... 53

Prefeasibility Report on WMS implementation
iv
List of Figures
Figure 1: Project Status ................................................................................................................................ 9
Figure 2: Methodology for the study ......................................................................................................... 11
Figure 3: Benefits of a WMS in the operation of warehouses ..................................................................... 31

Prefeasibility Report on WMS implementation
v
List of Tables
Table 1: Progress of KSWC projects under PEG-2008 Scheme as on October 2011................................... 16
Table 2: Warehouse clusters for WMS implementation ............................................................................ 18
Table 3: District-wise crops grown .............................................................................................................. 19
Table 4: Capacity, occupancy and loans availed at the 17 warehouses identified for WMS roll-out ........ 21
Table 5: Business turnover during 2010-11 ................................................................................................ 22
Table 6: Commodities handled by Gulbarga-II............................................................................................ 34
Table 7: Origin-Destination ......................................................................................................................... 35
Table 8: Stock of commodities at Bagalkote ............................................................................................... 36
Table 9: Year-wise cumulative capacity of Bagalkote warehouse .............................................................. 36
Table 10: Origin destination of goods in the warehouse ............................................................................ 37
Table 11 : Cluster-wise capital expenditure ................................................................................................ 40
Table 12 : Financing assumptions – Private Partner ................................................................................... 41
Table 13: Depreciation Assumptions .......................................................................................................... 41
Table 14: Basic assumptions for the project .............................................................................................. 42
Table 15: Assumed annuity payments for the year 2013-2014 .................................................................. 42
Table 16: Operating expense assumptions ................................................................................................. 43
Table 17: Sensitivity to changes in operating expenses ............................................................................. 43
Table 18: Sensitivity to changes in annuities .............................................................................................. 44
Table 19: NPV of annuity payments ............................................................................................................ 44
Table 20: Associated Risks and Mitigation Measures ................................................................................. 49
Table 21: Indicative project structure ......................................................................................................... 50
Table 22: Cash-flow statement ................................................................................................................... 53

Prefeasibility Report on WMS implementation
1
1 Executive Summary
Background
Government of Karnataka (GoK) envisages development of infrastructure through Public Private Partnership (PPP) and intends to attract investments in various sectors in Karnataka.
The report details out the prefeasibility study done for ‘Implementation of Warehouse Management Systems in KSWC warehouses’.
The project aims to implement real time Warehouse Management Systems on a PPP basis across 17 warehouses in the state, identified by the KSWC.
Sector profile- Logistics
Logistics is a significant part of economy, accounting for 8-10% of the national GDP. Transportation and
storage are two main functions within Logistics, dealing with movement and storage of goods,
respectively.
Indian warehousing space has a strong presence of public sector entities, with Central Warehousing
Corporation and other State-level warehousing Corporations contributing a large share of overall
capacity.
In Karnataka, KSWC was established in November 1957 under the Agricultural Produce (Development
and Warehousing) Corporations Act 1956, later repealed by the Warehousing Corporations Act 1962.
With 123 warehouses and 446 employees on its rolls, the total storage capacity in godowns owned and
hired by KSWC, was around 9.59 Lac metric tons as of January 2011. CWC and the state government
each have 50% stake in KSWC, having contributed INR 3.9 crores apiece as paid-up capital. KSWC has
consistently been a profit making entity over the past decade.
The objectives of KSWC are outlined below.
To acquire and build godowns and Warehouses within the state of Karnataka.
To run Warehouses in the state for the storage of Agricultural Produce, Seeds, Manures,
Fertilizers, Agriculture implements and other notified commodities.
To arrange facilities for the Transport of Agricultural Produce, Seeds, Manure, Fertilizers,
etc.
To arrange for disinfestations service to the farmers, Government offices, Public libraries,
Hostels, Theaters, Public buildings, Private establishments, Apartments etc., Rodent
control, Insect control, Cockroach control are a few specialized services undertaken.

Prefeasibility Report on WMS implementation
2
PPPs in the warehousing sector
The most significant PPP scheme in the warehousing sector is the PEG scheme 2008. The main idea
behind this Food Corporation of India initiative is to facilitate construction of storage godowns for
Central Warehousing Corporation (CWC) and State Warehousing Corporations (SWCs) through the
involvement of private entrepreneurs. Under this scheme, the private partners receive fixed lease
payments from the Government warehousing agencies in return for building, owning and operating
storage godowns.
Implementation of this scheme in the state of Karnataka has been in 3 phases. Phase 1 covers an
addition of 37500 MTs to the storage capacity at Hassan, Bagalkot, Belgaum and Mandya. Phase 2
envisages addition of 60250 MTs capacity at Mysore-III, Chitradurga, Harihara, Raichur- II and
Chikamaglur. Phase 3 targets an addition of 41000 MTs at Chamarajnagar and Bagalkot.
Project Description
Even though Karnataka has 123 warehouses across the state, they are basic storage spaces. Given the
large scale of operations, there is a need for an integrated approach to streamline operations and
monitor activities at all warehouses from a central level on a real time basis. Today, Warehouse
Management Systems play a pivotal role in integrating the functioning of scattered warehouses and
aiding in efficient operations for the managing agency as a whole.
In this context, it was decided to explore the option of rolling out Warehouse Management System for
KSWC warehouses on a pilot basis for 17 warehouses. These warehouses were selected in consultation
with KSWC, with large warehouses being taken up for the pilot project.
The consultants have divided the 17 warehouses into 3 clusters based on geographical location of the
warehouses. Cluster I covers the northern regions of the state, Cluster II consists of warehouses in the
central region and Cluster III consists of warehouses in the southern part of Karnataka.
Cluster I
Cluster II
Cluster III
Gulbarga-I
Raichur-I
Koralur
Gulbarga-II
Raichur-II
Tumkur -II
Bidar
Sindhanur
Mysore-III
Bijapur-II
Hospet
Hassan
Bagalkote Machenahalli
Mandya
Gadag
Chitradurga
These 17 warehouses together account for 40% of the storage capacity of KSWC warehouses and
contributed to 56.32% of the total deposits and 52.18% of the total withdrawals across all warehouses in
the state during the financial year 2010-11.
On an average, 200 metric tons of commodities are deposited and 160 metric tons withdrawn every day
at these warehouses. Hence, given the storage capacity and the large transactions that take place at

Prefeasibility Report on WMS implementation
3
these warehouses every day, it is important that a warehouse management system is in place to
streamline KSWC functioning.
Market assessment:
Warehouse management deals with receipt, storage and movement of goods; normally finished goods;
to intermediate storage locations or to final customer. Through an advanced software program, it tracks
the movement of a commodity through the entire supply chain.
By streamlining inbound and outbound shipments, implementation of WMS at KSWC warehouses would
bring the following specific tangible benefits to the corporation.
Real-time Stock Management: The location, condition and amount of goods in all the
warehouses can be monitored at one place by KSWC since all the warehouses with WMS would
in a way become a part of a connected material and information network.
Slotting and Optimization: WMS helps in determining the optimal slot for the stock keeping Unit
based on user defined criteria like size, expiry date, seasonality etc. The criteria can be fine
tuned using the past data that gets recorded in the WMS system. Optimal slotting helps in
minimizing unnecessary moves and stocking grains of similar quality together.
Electronic Database: Implementing a real time WMS can considerably reduce paper work as all
records can be maintained electronically. Further, past data would be extremely useful in
predicting the buffer space requirements for a particular year once information regarding the
monsoon is available. This would also help finalize plans on the capacity to be immediately
added by hiring extra godowns.
Agro-marketing centres: Centralizing operations at least at the division level would enable KSWC
to create agro-marketing centres at main locations in its divisions; WMS will facilitate real time
monitoring of commodities i.e. the stage of processing—be it grading, sorting, labeling, storage
etc. at central and warehouse level. Such real time updates of data will help in co-ordination
with the suppliers and buyers at multiple locations in an efficient manner from one location.
Automated Report Generation: WMS system can also be customized to generate reports, if
certain processes are not being followed, they can be monitored at the central level.
NCDEX accreditation: Accreditation of warehouses from NCDEX is possible only a when a WMS
system is in place. This could be a potential diversification path for KSWC in the future.
Moreover, with storage capacity at the warehouses increasing every year the present manual system of
entry would simply become unsustainable beyond a point. Therefore, it is imperative that while
expansion of storage initiatives are on, KSWC starts creating an information backbone to carry out its
activities efficiently.
Prefeasibility Report on WMS implementation
4
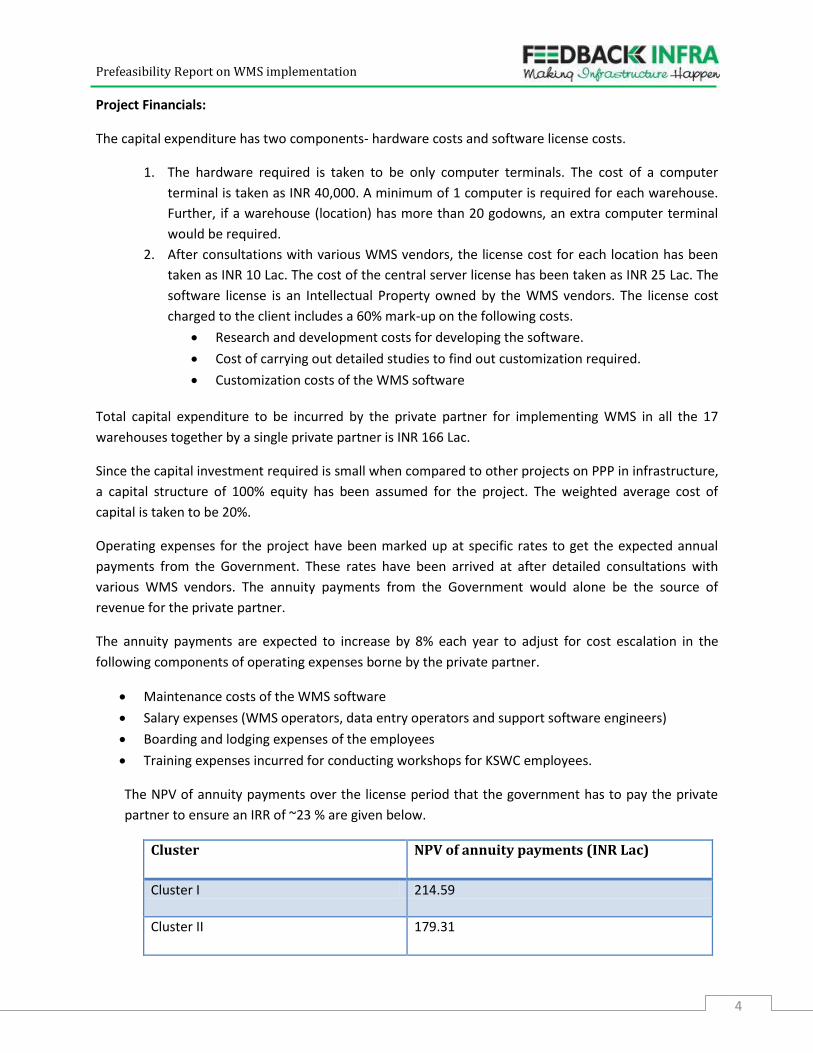
Project Financials:
The capital expenditure has two components- hardware costs and software license costs.
1. The hardware required is taken to be only computer terminals. The cost of a computer
terminal is taken as INR 40,000. A minimum of 1 computer is required for each warehouse.
Further, if a warehouse (location) has more than 20 godowns, an extra computer terminal
would be required.
2. After consultations with various WMS vendors, the license cost for each location has been
taken as INR 10 Lac. The cost of the central server license has been taken as INR 25 Lac. The
software license is an Intellectual Property owned by the WMS vendors. The license cost
charged to the client includes a 60% mark-up on the following costs.
Research and development costs for developing the software.
Cost of carrying out detailed studies to find out customization required.
Customization costs of the WMS software
Total capital expenditure to be incurred by the private partner for implementing WMS in all the 17
warehouses together by a single private partner is INR 166 Lac.
Since the capital investment required is small when compared to other projects on PPP in infrastructure,
a capital structure of 100% equity has been assumed for the project. The weighted average cost of
capital is taken to be 20%.
Operating expenses for the project have been marked up at specific rates to get the expected annual
payments from the Government. These rates have been arrived at after detailed consultations with
various WMS vendors. The annuity payments from the Government would alone be the source of
revenue for the private partner.
The annuity payments are expected to increase by 8% each year to adjust for cost escalation in the
following components of operating expenses borne by the private partner.
Maintenance costs of the WMS software
Salary expenses (WMS operators, data entry operators and support software engineers)
Boarding and lodging expenses of the employees
Training expenses incurred for conducting workshops for KSWC employees.
The NPV of annuity payments over the license period that the government has to pay the private
partner to ensure an IRR of ~23 % are given below.
Cluster NPV of annuity payments (INR Lac)
Cluster I 214.59
Cluster II 179.31

Prefeasibility Report on WMS implementation
5
Cluster III 159.39
All clusters with different project partners
553.49
All clusters with the same project partner 482.92
It can be seen that the government would save INR 70 Lac in terms of payments it makes to the private
partner when all the three clusters of warehouses are taken up a single partner for implementation of
WMS. This saving can be attributed to the fact that each private partner would need to be compensated
for a server license when three partners exist. Therefore, it is recommended that one qualified WMS
vendor takes up the entire project.
Statutory and Legal Framework:
With regard to the policies to be followed by the KSWC, the Warehousing Corporations Act stipulates
that the Board of directors shall act on business principles having regard to public interest and shall be
guided by such instruction on questions of policy as may be given to them by the State Government or
the Central Warehousing Corporation.
The Warehousing Corporations Act of 1962, while mentioning the terms and conditions for issue,
renewal and suspensions of licenses, does not prohibit any initiatives by the KSWC to be taken up under
Public Private Partnerships (PPP).
Indicative environmental and social impacts:
The implementation of WMS in KSWC warehouses has no visible environmental impact.
Implementation of Warehouse Management Systems in the state warehouses would streamline the
movement of food-grains from the producers (farmers) to the consumers (market) either directly or
through the Government (PDS scheme).
This would help the government forecast storage space requirements in the state, during extreme
conditions of bumper harvest and drought.
Therefore, the entire project would bring about efficiencies in storing agricultural commodities and
allow the warehouses to become terminal agro-market centres in the long run by facilitating real time
monitoring of commodities at central and warehouse level. This would help in co-ordinating among the
suppliers and buyers, immensely benefitting farmers and consumers across the state.
Operating framework:
The potential risks and mitigation measures for the PPP project are outlined below.

Prefeasibility Report on WMS implementation
6
Risks Mitigation measures
Delay in implementation and roll-out of WMS across the 17 identified warehouses
Strong Service Level Agreements specifying timeframe for each phase need to be signed with the private partner.
Piracy of installed software
Only qualified WMS vendors having well-defined valid IPs for their licenses need to be allowed for bidding. Such measures should be a part of contractual obligation of the vendor.
Delay in annuity payments from the Government
An escrow account where an independent trusted third party receives and disburses money and/or documents for the transacting parties needs to be in place. The timing of such disbursements by the third party would be dependent on the fulfillment of contractually-agreed conditions by the private partner and KSWC.
Resistance by KSWC employees for the project, leading to a non-conducive working environment for operators provided by private partner
Measures to sensitize KSWC employees are required. KSWC would need to convince its employees on the benefits of WMS, making it clear that it would supplement rather than substitute human capital requirements.
Project Structure:
An indicative project structure is given below.
Component Description
Structure
PPP project, annuity model.
Private partner owns hardware during license period, sells it to
KSWC at the end of five years.
WMS vendor quoting the lowest annuity bid gets the project.
WMS vendor maintains and operates the software, provides
other services at the 17 warehouses during the entire license
period.
License Period 5 years

Prefeasibility Report on WMS implementation
7
Component Description
Payment from Concession
Authority
Predetermined annuity payments.
Total base year annuity amount to be quoted be bidder
Annuity increases by 8% every year.
Annuity components include software license and
maintenance cost, operators’ salaries and boarding and
lodging expenses, salary of software engineers, migration of 3
year transaction data to WMS, training KSWC employees on
WMS.
Role of Concession
Authority
KSWC provides a central server to host the WMS license.
KSWC ensures that internet connectivity is provided to the 17
warehouses identified for WMS roll-out.
Data to be migrated to WMS is provided as per the pre-format
suggested by the vendor.
Role of Private Partner
Understand the customization required for KSWC in core
WMS; responsible for implementation and roll-out across 17
warehouses within a period mentioned in the tender.
Provide operators and software engineers to maintain and
operate the WMS at the 17 warehouses for the license period.
Provide data entry operators to migrate data in the suggested
pre-format to WMS software.
Arrange workshops once every 2 months for KSWC employees
for training them on WMS.
Way ahead
The immediate milestone for the Project would be
Preparation of Tender Documents for Selection of Transaction Advisor for the
Project
Tender documents will be prepared for selection of Transaction Advisors which would include the
following:
Detailed Scope of Work including deliverables and timelines for submission.
Outlining the minimum eligibility criteria, which the bidders would necessarily have
to meet before their bids are evaluated in detail.
Description of Evaluation process elaborating the various evaluation parameters and
their respective weightages.

Prefeasibility Report on WMS implementation
8
The transaction advisor would come up with a draft Agreement which would spell out the following:
The Obligations and Scope of Work for the private partner.
Progress Reporting Mechanism.
Dispute Resolution Mechanisms.
Termination of Contracts by either of the parties.
Defining conditions and events leading up to a default in obligations.
Conditions construing Force Majeure
Conditions leading up to a termination of Contract and invoking of the Performance
Guarantee.
Strong specific Service Level Agreements mentioning timeframes for all services that are
a part of the contract with the private partner.
Capacity Building Workshops will be conducted for officials who are identified as PPP Cell personnel
by the department.
Recommendations
Keeping in mind the nature of the project, the following recommendations are made.
KSWC should go for WMS implementation in the 17 warehouses identified, as it will bring
with it a host of benefits including efficiency in operations that will improve service
delivery to end users
A single private player for implementation and roll-out of the project in all 17 warehouses
is preferable. As per the analysis done by the Consultant, the overall cost of the WMS to
the Government will be ~13 % lesser in this scenario than in the situation where each
cluster is given to a separate player
o Operationally too, it is easier to work with one central server license rather than
integrating 3 server licenses together.
It is necessary that the transaction advisor chosen for this project has sufficient expertise
in the field of IT. This will ensure that deliverables and other requirements are clearly
defined and leave no scope for ambiguity.

Prefeasibility Report on WMS implementation
9
2 Introduction
Karnataka’s competitiveness from a natural and human resources standpoint makes it the
destination of choice for investors. Making use of this, Government of Karnataka (GoK) envisages
development of infrastructure across various sectors in the state through Public Private Partnership
(PPP) projects.
The Infrastructure Development Department (IDD) of Government of Karnataka has selected
consultants for Sector Specific Inventory & Institutional Strengthening for mainstreaming of PPP for
various departments related to infrastructure development in the state. Feedback Infrastructure
Services Private Limited (FISPL) was selected to assist Infrastructure Development Department
(IDD) to fulfill the above objective.
The Inception Report, comprising of preliminary information on the sectors covered under
Infrastructure Development Department (IDD) and the inventory of the projects finalized in
consultation with IDD, was submitted by the consultants on February 22, 2012. The figure below
summarizes the progress of the assignment, in reference to the defined objectives.
Figure 1: Project Status

Prefeasibility Report on WMS implementation
10
The report details out the prefeasibility study done for ‘Development of Warehouse Management
Systems in Karnataka State Warehousing Corporation’. 17 sites were finalized in consultation with IDD
and Karnataka State Warehousing Corporation.
2.1 Structure of the Report
This project report has been structured along the following in a chapter-wise format.
Chapter 2: Introduction
The chapter includes the background of the project and introduction about the study that is being
undertaken.
Chapter 3: Warehouses in Karnataka and the need for WMS
The chapter includes details of various warehouses in Karnataka and prior PPP initiatives of the
KSWC.
Chapter 4: Project Detail
The chapter includes the details and description of the project and project components. The best
Case Studies have been reviewed in this chapter and relevant points have been applied in the
design of the project in focus.
Chapter 5: Market Assessment
The chapter details out the necessity for warehouses in Karnataka to implement Warehouse
Management Systems and the possible types of companies that would be interested in the PPP
initiative.
Chapter 6: Project Financials
Based on market assessment and project details, financial parameters for the project have been
calculated. The chapter includes the cost & revenue assessment and the projected tariff rate for
the project facilities. Thus a project viability report has been prepared to assess the funding
requirement for the project.
Chapter 7: Statutory & Legal Framework
Based on the above analysis a legal & regulatory framework has been developed for the project.
Chapter 8: Indicative environmental and social impacts
This chapter specifies the possible environmental and social impacts of the WMS project.

Prefeasibility Report on WMS implementation
11
Chapter 9: Operating Framework
The Chapter covers risk assessment for the project & mitigation measures for the same. An
indicative project structure has been prepared for the development of the project
Chapter 10: Way Ahead
The chapter includes the procurement plan timelines for further development of the project.
2.2 Approach & Methodology
The approach and methodology adopted for the study is as outlined in the figure below.
Figure 2: Methodology for the study
Stage I: Input
The first stage involved the study of the project site to understand its suitability for the defined activity.
Various factors influencing the need for the proposed project were analysed.
Simultaneously, this stage also involved collection of data, both primary and secondary, to carry out the
requisite financial assessment in later stages.
Stage II: Analysis

Prefeasibility Report on WMS implementation
12
This stage involved review and analysis of data, collected in the previous stages, in order to assess the
financial feasibility of the project, as well as its environmental & social impacts.
This stage also involved assessment of the legal and statutory framework along with identification of
issues and mitigation measures.
Stage III: Output
Based upon the results of the analysis, the final stage defines the framework and the procurement plan
for further development of the project.

Prefeasibility Report on WMS implementation
13
3 Sector Profile
3.1 Industry Overview
Logistics is a significant part of economy, accounting for 8-10% of Indian national GDP. Logistics costs
include cost of transport by various modes, warehousing and storage activities,
consolidation/deconsolidation activities and database management. Transportation and storage costs
contributes significantly to the total logistics cost.
India is ranked 47th on the World Logistics Performance Indicator 2011, indicating that India’s logistics
infrastructure is still at a developing stage and a lot needs to be done to improve its efficiency.
According to a CRISIL research report that forecasts the logistics scenario for the five year period from
2009-10 to 2013-14, the logistics industry in India is pegged to grow at around 11 per cent CAGR and is
expected to reach INR 4.6 trillion in 2013-14
Logistics includes two major components:
a) Transportation
Transportation has the largest share in the overall logistics cost. Transportation is required at each
step in the entire logistics supply chain.
An efficient and well-connected network of roads, railway lines, ports and airports is pivotal for the
development of the transport sector.
b) Storage
There are various stages at which storage of goods is required in the logistics supply chain. Storage
spaces also work as the nodal centres for consolidation, stuffing and de-stuffing of bulk material to
be transported further. Similarly, to provide efficient and quick supply to various regions, storage is
required at various levels.
Warehouses are commercial buildings for storage of goods used by manufacturers, importers,
exporters, wholesalers, transport business and customs. Warehouses usually have loading docks to
load and unload goods from trucks, sometimes directly from railways, airports, or seaports.
3.2 Warehousing in India
According to Cargotalk, a leading South Asian cargo monthly magazine, India has a total
warehousing space of 1.8 billion square feet out of which 8% (around 144 million square feet) is in
the organized sector. This paucity of warehousing space results in a colossal waste of farm output.
For the manufacturing sector, warehousing plays a crucial role in bridging demand supply gaps
and keeps a check on the time required for a product to reach the consumer. Technologically
enabled state-of-the-art warehouses with proper support infrastructure and trained manpower
maintain product sanctity, reduce cost and improve overall efficiency. With the imminent

Prefeasibility Report on WMS implementation
14
implementation of the GST, a shift towards large mother warehouses with superior technology
and infrastructure to feed distribution centers is expected.
Warehousing sector in India is dominated by small unorganized sector players. One of the main
players in the organized sector is the public sector Central Warehousing Corporation (CWC),
which operates 464 warehouses across the country. Having a storage capacity of 100 million
tonnes, the CWC provides warehousing services for a wide range of products ranging from
agricultural produce to sophisticated industrial goods. Its warehousing activities range from food-
grain warehousing and industrial warehousing to custom bonded warehousing, container-freight
stations, inland clearance depots and air-cargo complexes. Voice technology (to enable workers
to communicate with warehouse management systems using speech analysis) and RFID
technology have simplified warehouse distribution operations to a large extent.
3.3 Karnataka State Warehousing Corporation (KSWC)
While CWC dominates warehousing sector at the central level, at state level it is the state
warehousing corporations that have extensive warehouse networks. In Karnataka, KSWC was
established in November 1957 under the Agricultural Produce (Development and Warehousing)
Corporations Act 1956 later repealed by the Warehousing Corporations Act 1962. With 123
warehouses and 446 employees on its rolls, the total storage capacity in owned and hired
godowns for KSWC was around 9.59 Lac metric tons as of January 2011. The CWC and the state
government each have 50% stake in KSWC, having contributed INR 3.9 crores apiece as paid-up
capital. Further, the state warehousing corporation has consistently been a profit making entity
over the past decade.
Scientific storage facilities for food grains, pulses, oilseeds, spices, sugar, fertilizer, manure and
other notified commodities through a network of 120 Warehouse centres throughout Karnataka
are provided for by KSWC. The beneficiaries mainly include local depositors like farmers, traders,
merchants and bulk depositors like Food Corporation of India, fertilizer companies, sugar factories
and other government organizations.
The Corporation, apart from storage facilities also provides for handling and transportation of
stocks to and from the warehouse centres to its major bulk depositors. Keeping in view the
demand for storage, the Corporation constructs additional godowns and adds capacity every year.
The objectives of KSWC are outlined below.
To acquire and build godowns and Warehouses within the state of Karnataka.
To run Warehouses in the state for the storage of Agricultural Produce, Seeds, Manures,
Fertilizers, Agriculture implements and other notified commodities.
To arrange facilities for the Transport of Agricultural Produce, seeds Manures, Fertilizers
etc.

Prefeasibility Report on WMS implementation
15
To arrange for Disinfestations service to the farmers, Government offices, Public libraries,
Hostels, Theaters, Public buildings, Private establishments, Apartments etc., Rodent
control, Insect control, Cockroach control are a few specialized services undertaken.
3.4 Agriculture in Karnataka
As the state warehousing corporation’s prime objective is to provide storage facilities to the
agricultural sector, it is important to look at the agricultural profile of the state. In fact, the
agricultural profile in various regions of Karnataka also governs the kind of commodities being
handled at KSWC warehouses located there.
Karnataka's soil conditions and climate jointly contribute in growing crops in the state. Agriculture
as an occupation covers 12.31 million hectares of land which is 64.6 percent of the total area. In
2008-09, Karnataka produced 99.71 Lac tones of cereal, 307 Lac bales of cotton and 130.26 Lac
tones of horticulture crops. Karnataka ranks fourth in the country in terms of sugarcane
production with 221.86 Lac tons of sugarcane production in 2008-09.
Pulses, being rich sources of proteins occupy an important place in the state’s agricultural
economy and constitute 10 to 15 per cent of India’s food grain diet. In Karnataka, Red-gram, the
dominant pulse, is grown is an area of 475,396 ha (production of 2.96 Lac tonnes) mainly in the
northern parts of the state including Gulbarga and Raichur districts.
3.5 PPP Initiatives in Warehousing-Private Entrepreneurs Godowns Scheme
2008
In 2008, due to the increased procurement of food-grains the Food Corporation of India (FCI)
formulated a scheme for construction of storage godowns for Central Warehousing Corporation
(CWC) and State Warehousing Corporations (SWCs) through the involvement of private
entrepreneurs.
Under this scheme, tenders have been invited from land-owners or those who hold land under
lease for at least 13 years to construct godowns to satisfy FCI storage requirements. The minimum
land area required for storing the first 5000 tonnes is 2 acres; for every additional 5000 tonnes of
storage, an extra 1.7 acres would be needed.
The scheme specifies guaranteed lease payments from FCI to the private partner for a period of
10 years in return for constructing and operating the godowns. The project is to be developed on
a Build, Own & Operate (Lease, Preservation and Maintenance) (BOO) basis.
Assessment of additional storage needs under the scheme is based on the overall
procurement/consumption and the storage space already available.

Prefeasibility Report on WMS implementation
16
Under this scheme, creation of 416,500 metric tons of storage space has been ear-marked for the
state of Karnataka.
The implementation of the scheme in the state has been through 3 phases. Phase 1 covers an
addition of 37500 MTs to the storage capacity at Hassan, Bagalkot, Belgaum and Mandya. Phase 2
envisages addition of 60250 MTs in the warehouses at Mysore-III, Chitradurga, Harihara, Raichur-
II and Chikamaglur. Phase 3 targets an addition of 41000 MTs at Chamarajnagar and Bagalkot. The
table below shows the progress of the scheme in the state.
Table 1: Progress of KSWC projects under PEG-2008 Scheme as on October 2011
Centre Capacity (Tons)
Commencement of construction
Completion Physical progress
Bagalkot 6500 27/4/2011 26/1/2012 Footing work under progress
Belgaum 10000 10/5/2011 9/2/2012 Plinth level and PEB erection works under progress
Hassan 4500
5/5/2011
4/2/2012
Column upto Basement under progress
Hassan 1600
5/5/2011
4/2/2012
Brick work under progress
Hassan
2900 5/5/2011
4/2/2012
Roof Level
Mandya/
Maddur
6500
5/5/2011
4/2/2012
Column & SSM works under progress
Mandya/
Maddur
5500 5/5/2011
4/2/2012
Column & SSM works under progress
Chitradurga 10000
4/7/2011
3/7/2012
Column, Plinth Beam, Grade Beam & BBM works under progress
Chitradurga 600
14/7/2011
13/7/2012
Earth work, footing, Grade Beam, Skin wall work under progress
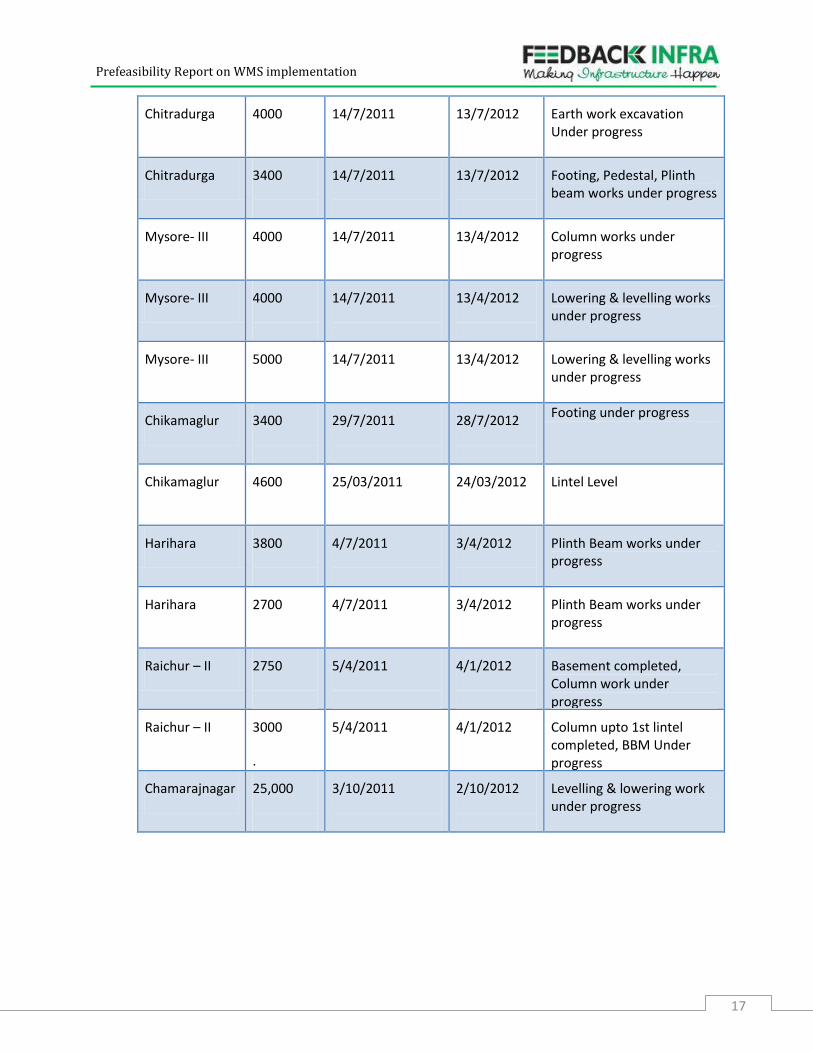
Prefeasibility Report on WMS implementation
17
Chitradurga 4000
14/7/2011
13/7/2012
Earth work excavation Under progress
Chitradurga 3400
14/7/2011
13/7/2012
Footing, Pedestal, Plinth beam works under progress
Mysore- III 4000
14/7/2011
13/4/2012
Column works under progress
Mysore- III 4000
14/7/2011
13/4/2012
Lowering & levelling works under progress
Mysore- III 5000 14/7/2011
13/4/2012
Lowering & levelling works under progress
Chikamaglur 3400
29/7/2011
28/7/2012
Footing under progress
Chikamaglur 4600
25/03/2011
24/03/2012
Lintel Level
Harihara 3800
4/7/2011
3/4/2012
Plinth Beam works under progress
Harihara 2700
4/7/2011
3/4/2012
Plinth Beam works under progress
Raichur – II 2750
5/4/2011
4/1/2012
Basement completed, Column work under progress
Raichur – II 3000
.
5/4/2011
4/1/2012
Column upto 1st lintel completed, BBM Under progress
Chamarajnagar 25,000
3/10/2011
2/10/2012
Levelling & lowering work under progress

Prefeasibility Report on WMS implementation
18
4 Project
4.1 Description of the Project
Even though Karnataka has 123 warehouses across the state, the warehouses are basic storage
spaces. Given the large scale of operations, there is a need for an integrated approach to
managing these warehouses to streamline operations and also monitor the activities at all
warehouses from a central level on a real time basis. In the modern warehousing scenario,
Warehouse Management Systems play a pivotal role in integrating the functioning of scattered
warehouses and aiding in efficient operations for the managing agency as a whole.
In this context, it was decided to explore the option of rolling out Warehouse Management
System for KSWC warehouses on a pilot basis for 17 warehouses. These warehouses were
selected in consultation with KSWC, with large warehouses being taken up for the pilot project.
As KSWC has the crucial role of making space available for food grains for Public Distribution
System, it would be difficult for it to give operations in the hands of private player. Hence, the
WMS project can be given as a PPP project on management contract basis with the private player
getting an annuity payment to cover the cost of services provided. The bidding can be on the basis
of quoted annuity payments. The services to be provided, and the advantages that the WMS
system will bring, will be explained in detail later.
The consultants have divided the 17 warehouses into 3 clusters based on geographical location of
the warehouses. Cluster I covers the northern regions of the state, cluster II consists of
warehouses in the central region and cluster III consists of warehouses in the southern part of
Karnataka.
Table 2: Warehouse clusters for WMS implementation
Cluster I
Cluster II
Cluster III
Gulbarga-I
Raichur-I
Koralur
Gulbarga-II
Raichur-II
Tumkur -II
Bidar
Sindhanur
Mysore-III
Bijapur-II
Hospet
Hassan
Bagalkote Machenahalli
Mandya
Gadag
Chitradurga
This section gives brief profiles of the regions where the clusters of warehouses are located. As
KSWC warehouses mainly handle agricultural commodities, the agricultural profiles of these
regions are discussed to give an idea of kind of commodities that are expected to be stored in
the respective regions.

Prefeasibility Report on WMS implementation
19
The table below summarizes the major crops grown in the districts where the 17 warehouses
are located.
Table 3: District-wise crops grown
Cluster District Major crops
Cluster I
Gulbarga Tur, pulses, sugarcane and cotton
Bidar Jowar, wheat, pulses, oilseeds and sugarcane
Bijapur Jowar, wheat, Bengal-gram and sugarcane
Dharwad Paddy, maize, tur and Bengal-gram
Cluster II
Raichur Rice, jowar, sunflower and groundnut
Shimoga Paddy
Chitradurga Maize, jowar, ragi and bajra
Cluster III
Mysore Rice, maize, jowar and ragi
Hassan Ragi, paddy, wheat, jowar and pulses
Mandya Ragi
Tumkur Ragi, groundnut, paddy
Cluster I
Cluster I warehouses - Gulbarga-I, Gulbarga-II, Bidar and Bijapur-II in Gulbarga region and
Bagalkote and Gadag in Hubli region are located in the northern parts of the state. The
warehouses identified come under Gulbarga (Gulbarga-I and Gulbarga-II), Bidar (Bidar), Bijapur
(Bijapur –II) and Dharwad (Bagalkote and Gadag) districts.
Agriculture in Gulbarga district is a moderately developed economic activity. The district is
known as the ‘Tur Basket of the State’ and has major concentration in cultivation of pulses.
Sugarcane and cotton are the other thrust areas in the district.
Dharwad district has a high potential for agriculture and allied industries with the presence of 3
agro-climatic zones, high end research based agriculture universities and testing labs. There is
immense scope for enhancing productivity and organic farming for all kinds of crops.
Bidar, the northernmost district in the state is known as the ‘Pulse Bowl’ of Karnataka with 51%
of total cultivable land being used for growing pulses. Average farm size in the district is quite
high, around 1.63 ha per family. Jowar and wheat are the major cereals grown in the district.
Black gram, Bengal gram, Green gram and Red gram are the major pulses grown in the district.

Prefeasibility Report on WMS implementation
20
Groundnut, Sunflower, Soybean, Safflower, Sesame are the major oilseeds. Sugarcane is the
major commercial crop.
In Bijapur district, jowar, wheat, Black gram, Bengal gram, Green gram and Red gram are major
cereals and pulses grown in the district. Again, sugarcane is the major commercial crop. The per
capita availability of cultivable land is one of the highest at around 3.2 ha per capital. The region
falls under northern dry zone of the agro climatic classification.
Cluster II
Cluster II warehouses – Raichur-I, Raichur-II, Sindhanur, Hospet (Raichur region), Chitradurga
(Davanagere region) and Machenahalli (Shimoga region) fall in the central regions of the state.
These warehouses are located in Raichur (Raichur-I, Raichur-II, Sindhanur), Bellary (Hospet),
Chitradurga (Chitradurga) and Shimoga (Machenahalli) districts.
Agriculture in Raichur district is a moderately developed economic activity with the major area
of concentration being improvement in productivity of the crops and subsequent expansion of
area under production.
The major crops cultivated in Chitradurga are maize, ragi, jowar, bajra and minor millets such as
Red gram, cowpea, Green gram, groundnut and sunflower. Castor and cotton are the important
commercial crops. The potential for improving agricultural productivity in the region is
enormous.
Agriculture-wise Bellary is one of the least affluent areas of the state. Increased mining and
industrialization has led to decrease in the cultivable land in this district. The focus in this district
is to revitalize the sector and create forward and backward linkages.
Paddy is the major crop grown in Shimoga district, being cultivated on 66% of the total
agricultural area. Area under pulses and oilseeds is very low and can be greatly increased by
crop diversification. Considering water availability and soil suitability, there is scope for
introducing high value crops along with food processing units.
Cluster III
Cluster III consists of warehouses –Mysore-III, Mandya, Hassan (Mysore region), Koralur and
Tumkur-II (Bangalore region) - in the southern part of the state. These warehouses are located
in Hassan (Hassan), Mandya (Mandya), Mysore (Mysore – III) and Bangalore districts.
Agriculture in Mysore district is a well-developed economic activity with rice, maize, jowar, ragi,
cowpeas, pulses, oilseeds & cotton the major agricultural crops in the region. The district has
been also identified for setting up organic villages with export oriented cultivation.
Prefeasibility Report on WMS implementation
21
Hassan district has total 3,93,500 Hectares of land under cultivation with the share of irrigated
area being only 20% of total area. Cereals, chiefly ragi, paddy, wheat and jowar and pulses are
the major crops grown in the district. The thrust areas in agriculture currently include,
monitoring timely availability of agricultural inputs to the farmers, ensuring timely credit facility,
and timely suggestions through mass media.
In Mandya district area under agriculture is 0.25 million hectares, with a total of 48% under
irrigation. 92% of the farmers in the district are small and marginal land-owners. Cereals, mainly
ragi, are the main crops grown in the district.
Agriculture is a moderately developed industry in Tumkur. Ragi and groundnut are the major
crops of the district. About 30 percent of the area previously under cereals has been diverted to
oilseeds. Hybrids in paddy are the ruling varieties in the district. Area under Maize has been
increasing every year.
A table showing the average storage capacity, occupancy and loans availed by depositors by
pledging warehouse receipts in the 17 warehouses are detailed below.
Table 4: Capacity, occupancy and loans availed at the 17 warehouses identified for WMS roll-out
Centre
Average
capacity
owned and
hired (Tons)
Occupancy
including
reservation(T
ons)
Average %
occupancy
Loans availed
by depositors
(In INR
Crores)
Gulbarga-I
39228 32607 83.12 69.25
Gulbarga-II
61929 48212 77.85 89.07
Bidar
48435 46353 95.70 29.80
Bijapur-II
17600 15421 87.62 2.40
Bagalkote 12000 9793 81.61 7.70
Gadag
8295 5549 66.89 4.18
Raichur-I
38914 29240 75.14 12.51
Raichur-II
20960 14650 69.89 4.98
Sindhanur
28144 23335 82.91 14.66
Hospet
24346 18140 74.51 0.35
Machenahalli
14309 16375 114.44 1.12

Prefeasibility Report on WMS implementation
22
Chitradurga
14905 14862 100.39 0
Koralur
33000 31655 95.92 0
Tumkur -II
16167 14127 87.38 6.38
Mysore-III
15000 14006 93.37 1.60
Hassan
44801 37260 83.17 1.70
Mandya
28931 25812 89.22 9.33
Total (121 warehouses
across the state)
1163873 919217 78.89 519.44
It can be seen that the average occupancy levels are more than 80% in most of the warehouses,
which indicate that the warehouses are full throughout the year and would require efficient
means for allocating space to new consignments being brought in for storage.
Details of the business turnover at the 17 warehouses during the financial year 2010-2011 are
given below. It can be seen that these warehouses are among the largest ones in each region
and on an average, have a huge turn-over rate.
Table 5: Business turnover during 2010-11
Centre No. of Godowns Share of deposits
in total deposits
across 121
warehouses
Share of total
Withdrawals in
total withdrawal
across 121
warehouses
Gulbarga-I
25 5.76% 5.70%
Gulbarga-II
38 5.30% 4.62%
Bidar
24 6.26% 5.78%
Bijapur-II
4 3.18% 2.71%
Bagalkote 8 0.96% 0.92%
Gadag
3 0.61% 0.64%
Raichur-I
29 2.34% 2.28%
Raichur-II
19 1.20% 1.12%
Sindhanur
14 1.50% 1.51%
Hospet
5 0.46% 1.15%
Machenahalli
3 1.19% 1.24%

Prefeasibility Report on WMS implementation
23
Chitradurga
12 2.98% 3.22%
Koralur
6 6.97% 5.90%
Tumkur -II
6 1.80% 1.77%
Mysore-III
5 2.45% 1.99%
Hassan
29 9.44% 8.52%
Mandya
11 3.96% 3.56%
Total (17 warehouses)
241 56.32% 52.18%
From the above two tables, it is observed that these 17 warehouses together account for 40% of
the storage capacity of KSWC warehouses across the state. Further, these 17 warehouses alone
contributed to 56.32% of the total deposits and 52.18% of the total withdrawals across all
warehouses in the state during the financial year 2010-2011.
It can be further inferred that on an average, 200 metric tons of commodities are deposited and
160 metric tons withdrawn every day at these warehouses. Hence, given the storage capacity
and the large transactions that take place at these warehouses every day, it is important that a
warehouse management system is in place to streamline the processes.
4.2 Best Case Studies for similar projects in India
There are no prior examples of implementation of Warehouse Management System on PPP basis
across warehouses on this scale in any of the state warehousing corporations. However, there are
cases in e-governance on PPP basis where the software provider is a service partner. One such
successful initiative is the establishment of Passport Seva Kendras across the country and upgrade
of existing passport offices in partnership with a private player.
4.2.1 Passport Seva Kendras in India – A PPP initiative
Faced by an exponential demand for passports since 2002 in an extremely bureaucratic
environment where the entire process of obtaining passports was tedious and time-consuming
for citizens, the Ministry of External Affairs decided to outsource passport processing in year
2008. Tata Consultancy Services, Wipro, 3i infotech, Spanco, ECIL and BEL were the pre-
qualifiers. TCS bid the lowest amount per passport (INR 200).
Prefeasibility Report on WMS implementation
24
Project Structure
The project was structured in such a manner that all processing work related to issuance of
passports including police verification is expected to be done through TCS with printing of
passports alone to be done by MEA. The project envisaged upgrading the existing 37 passport
offices and acting as service partner in 77 new passport offices.
The suite of services to be offered by the selected private partner included development and roll
out of software for provision of passports in 3 days, provision of technology backbone, training
and providing call center services. The private player would, in return, get a specified amount for
each passport issued. The amount asked for issuance of each passport was the bid variable.
With the demand for passports expected to touch 10 million passports a year by 2015, total
worth of the deal supposed to be around 10 billion rupees for complete end-to-end
maintenance. The PPP also made it mandatory for process and delivery of passports in 3
working days by the authorities with Tatkaal passports delivered on the same day.
On the whole, the entire project was in the fore-front of a technology-led, service oriented
approach to issue and renewal of passports simultaneously ensuring security, safety and
maintenance of safe-guards and proving to be of immense value to the citizens.
The partnership enabled digitizing passport services and online filing of passport applications.
With citizens able to submit details online and make appointments for submission of required
documents at the Passport Seva Kendras, the long queues at the Regional Passport Offices were
expected to come down.
Benefits to TCS
The size and complexity of the project made the PPP a very lucrative for TCS. In a way, it was an
affirmation of the company’s standing as the biggest IT player in the industry.
Further, various aspects of the deal were seen as precursors towards similar projects that
featured implementation of e-governance in developing countries. There was a potentially huge
opportunity for the company to learn from experience and implementing similar projects in
overseas markets.
Besides, the project would help achieve corporate social responsibility objectives and would
reinforce meaningful and valuable contributions of the Tata group to the Indian society.
Actual implementation
The project went live in June 2009 having been delayed by a year due to glitches in the software
developed by TCS to process passports.

Prefeasibility Report on WMS implementation
25
Initially, the roll-out was characterized by complete chaos caused by slow servers and
unsatisfactory grievance redressal forums. This resulted in TCS being fined INR 48 Lac by MEA
for delay and problems in implementation.
However, after subsequent stabilization of the system, in 6 months 70 of the 77 proposed
Passport Seva Kendras became operational (as of April 2012). Given the success till date, PSKs
are expected to deal with demand of 1 crore passports per year in 2015 easily.
Furthermore, the success of the project has meant that Indian embassies worldwide would be
integrated with Passport Seva Kendras soon.
4.2.2 Issue of smart cards by RTOs in Karnataka
One of the biggest revenue-earners for the State with revenue of more than INR 1,800 crores
per year, the Transport department in Karnataka through its 57 Regional Transport offices
across the state is mainly responsible for issuing licenses, registration of new vehicles, collection
of motor vehicle taxes and fines, issuing permits, recording fitness of vehicles. Therefore, these
RTOs hold, maintain and process large volumes of data annually.
By 2008, RTOs in Karnataka had issued 65 Lac driving licenses and registration certificates to 76
Lac vehicles.
Structure of the project
The tender for the project was floated in 2008. It set out the method for identifying the winning
bid as follows:
Bidders needed to specify the price per issued smart card. The overall quoted price
was to be arrived at after including the prices specified by a bidder for a driving license
smart card and a vehicle registration certificate smart card. The weights assigned to
driving license smart card and vehicle registration smart cards were 0.4 and 0.6
respectively.
The bidder with the lowest weighted quoted price per smart card was to be awarded
the project.
The winning bidder was a consortium of 3 companies- Rosemarta Technology, Mynd Solutions
and Team Computers. The bid quoted by the winner was INR 49 for a driving license smart card
and INR 63 for a vehicle registration smart card.
Under the terms of the project, the private partner had to provide all the necessary hardware
including Computer Terminals, UPS, Servers, Printers, Smart Card facilities and support facilities
at all the 57 offices.

Prefeasibility Report on WMS implementation
26
The completion of the project was to be marked by the private player issuing 1 crore smart card
Driving Licenses and 1 crore vehicle RC books or issuing smart cards for a period of 15 years,
whichever is earlier. Further, the Smart Card fee of INR 200, levied for each smart card could not
be changed by private partner under any circumstance, unless the Transport Department itself
notified a change in law or statutory provisions.
Insurance cover to the drivers needed to be provided by the private partner from a reputed
insurance company to incentivize citizens to switch to smart card licenses immediately. The
private partner was also responsible for technical assistance, and providing data entry operators
& personnel for maintenance of the updated software systems.
Finally, the private partner was also supposed to provide training to officers and systems
administrators of the Transport Department on operational and functional aspects of the
software.
Benefits to the citizens
The project has been structured so that both the private player and the Government could
mutually benefit from the association.
For the citizens, it was a step towards efficient, transparent, quick and hassle-free Government
services. In fact, the project drew a lot of praise from various sections of the society, for the
way this initiative had made the entire process of interacting with Government officials a
pleasant one.
Besides smart cards, on an average, cost cheaper than the then existing PVC cards.
Today, these computerization measures further enable citizens to pay Motor Vehicle Taxes
anywhere in the state and most importantly have contributed to the elimination of middlemen
in RTO offices, making issuance of driving license and vehicle registration a completely
transparent one. It has also ensured better accessibility of registration and license data through
both web and mobile services. Finally, smart cards have helped in easier transfer of vehicle
ownership, with complete information about previous owners of vehicles.
Benefits to the Government
The biggest deliverable through the PPP project for the Government was the possibility of real-
time accounting and monitoring of fees and taxes.
It helped the Transport Department gain quick access to vehicle ownerships, fitness certificates
and permits. This keeps a check on violations by monitoring of records on traffic violations,
convictions and road accidents involving both driver and vehicles.

Prefeasibility Report on WMS implementation
27
Through this project, update and maintenance of huge volumes of data has been made easier
for officials in the RTOs. Significantly, this goes a long way towards prevention of forgery and
manipulation of data in driver licenses and vehicle registration certificates.
Key lessons
Well defined Service Level Agreements need to be signed with the private partner
during a PPP project. Any ambiguity creates hassles for the citizens. The fiasco with
TCS during the initial roll-out could have been avoided if the expectations and
deliverables in terms of the quality of service required from the private partner were
had been clearly mentioned.
Foresight and accurate knowledge of ground reality is required. In this case, an
erroneous assumption that everyone in Bangalore would only file online applications
led to the government closing down all other agencies that accepted passports,
bringing down processing ability by 50%. This resulted in long queues at the newly
opened Passport Seva Kendras during the pilot phase.
Measures to sensitize Government employees need to be in place. The Union
Government here had to deal with protests from the Passport Office employees, allay
fears of down-sizing and clarify that Passport Seva Kendras would function
independent of the Regional Passport Offices.
Coordination among stakeholders during design and rollout is pivotal. The government
agencies need to work in tandem with the private partners during the roll out stage. A
lack of co-ordination between the Government and TCS resulted in passport delivery
taking up to 30 days.
Ensuring that genuine software is installed by the private player at the computer
terminals is important. In the PPP between Karnataka RTO and the Rosemerta, it was
found that pirated Windows operating systems were installed by the private player.
Microsoft made a formal complaint with the Chief Minister of Karnataka in June 2011,
when 35 Lac smart cards had already been issued.
4.3 Project Structure
While the above case studies offer valuable lessons for a PPP project that involves mainly
technology infrastructure, it will be difficult to replicate the project structure completely for the
proposed WMS project.
In the projects described in the case studies above, the private partner was to recover
investments in terms of per transaction (per passport/smart card it issued). But in case of the
proposed WMS project, the private partner will not be responsible for any of the operational
functions of the warehouses where the WMS will be introduced. First, it is difficult to quantify the
benefits of WMS in terms of per transaction, as the software system streamlines the operations of
the warehouse as a whole. Second, it will be difficult for KSWC to hand over operations to private

Prefeasibility Report on WMS implementation
28
players, as it handles goods for Public Distribution System also and giving the rights to operations
to a private party can be a sensitive issue.
Thus, it is suggested that the project be implemented on annuity basis, where the private partner
recovers its investment through pre-determined annuity payments. The bidding happens on the
lowest quoted amount of annuity. The private player will be responsible for the rollout of the
WMS software in the warehouses, maintaining it for a specified license period, providing training
to the KSWC staff on operation of the WMS software and other support functions that will be
specified later.
This is not a new model and has been used extensively in road sector for the ambitious National
Highway Development Program. Under this model, the private player invests in providing the
requisite infrastructure and in return the government pays an annuity every year. The annuity is
decided in a transparent manner through a bidding process.
Further, as this is essentially a project involving roll out of software infrastructure with support
services that will be needed only for a few years before KSWC staff becomes familiar with its
operations, the concession period is not recommended to be very long. Even in case of TCS
Passport Seva Kendra project, once the rollout of software in all the centers is completed, TCS
would be responsible for maintenance of the centers for 7 years.
Thus, for the proposed WMS project a total license period of 5 years is considered.
Prefeasibility Report on WMS implementation
29
5 Market Assessment
Market assessment generally analyses the demand for a particular infrastructure to be provided on
PPP basis. However, in context of this project, the market is limited to Karnataka State
Warehousing Corporation. Thus, this section concentrates on dwelling on the need for WMS
system for KSWC warehouses by analyzing the benefits such a system will offer.
5.1 Warehouse Management Systems
Before analyzing the benefits that a Warehouse Management System will offer KSWC, it is
important to understand the basic features of the system.
Warehouse management deals with receipt, storage and movement of goods, normally finished
goods, to intermediate storage locations or to final customer. Through an advanced software
program, it tracks movement of a commodity through the supply chain from deposition at the
warehouse to allocation of storage space to storage to finally delivery to the final customer.
Another advantage of WMS is reduction of paper work. Implementing a real time WMS can
considerably reduce paper work as all records can be maintained electronically.
In effect, Warehouse Management System (WMS) programs enable centralized management of
tasks such as tracking inventory levels and stock locations. Warehouse Management System has
several modules and can be customized as per the requirements of the warehousing entity.
Some major modules include:
a. Inventory Management: Identifies and track inventory at a detailed level to allocate, fill, and
deliver orders accurately. The location, condition and amount of goods in all the warehouses
can be monitored at one place.
b. Slotting and Optimization: Helps in determining the optimal slot for the Stock keeping Unit
based on user defined criteria like size, delivery date, seasonality etc. The criteria can be fine
tuned given the past data that gets recorded in the WMS system. Optimal slotting helps in
minimizing extra moves by equipment
c. Managing Billing and Dispatches: Records raising of invoice raising with their amount and
delivery getting fed into the system. This can be viewed in one go and be used as an effective
tool for monitoring operations at various warehouses
d. Bar-coding: Bar-coding is an advanced WMS procedure, whereby all units in the warehouse
are assigned barcodes. Scanning of bar codes at each stage of warehouse processing stage
automatically feeds the data into the system and updates the system. However, such
advanced processes are generally used in retail scenario, where the sales to the end
consumers have to be tracked.
Warehouse Management Systems offers several insights to the management. The officials at the
decision making level get an instant picture of:

Prefeasibility Report on WMS implementation
30
a. Stock levels and available space in the warehouses from a remote location
b. Orders being dispatched at any given point of time
c. Staff Productivity details
d. Better management of space by efficiently locating items in relation to their receiving,
assembly and dispatch points
Presently, deposits and withdrawals in the warehouses owned and hired by KSWC are entered
manually. The existing level of computerization in the warehouses across KSWC warehouses is
quite low. With only basic storage facilities available as a part of the infrastructure at these
warehouses, a lot needs to be done to achieve KSWC’s vision to provide scientific storage for the
produce, minimize storage losses and prevent volatile market prices of essential commodities.
One of the primary steps towards achieving this would be through having Warehouse
Management systems.
5.2 Relevance of WMS to KSWC
To understand the benefits WMS will offer KSWC, it is important to first understand how the state
warehouses function.
Each of the 128 warehouses owned by KSWC comprises certain number of godowns located in a
10-15 km radius. The number of godowns under a warehouse centre varies greatly, from 3 in
Machenahalii (Shimoga) to 38 in Gulbarga -II. The entire structure can be visualized as a hub and
spoke arrangement wherein usually a large godown acts as a hub and the smaller godowns
around it form the spokes.
The depositor generally approaches the main warehouse and then is directed to the godown
where space is available. The loading and unloading of commodities in that warehouse is done by
a private contractor in the presence of a KSWC employee.
The receipt for storage is then issued by the KSWC. If the depositor wishes to avail a loan from a
bank against the stock deposited, the KSWC issues a receipt mentioning the market value of the
commodities deposited. Before sanctioning the loan, the bank sends a note informing the KSWC
to lock the specific commodities against which the loan is taken. Only on the receipt of the
acknowledgement of the note from the KSWC does the bank disburse any amount. To unlock the
commodities, the KSWC would require an authorization letter from the bank, which is issued only
after the loan is repaid.
Following flow chart gives a detailed illustration of how WMS can benefit KSWC at each stage of
its operation.

Prefeasibility Report on WMS implementation
31
Figure 3: Benefits of a WMS in the operation of warehouses
As indicated in the diagram, a warehouse management system would help in integrating
processes of KSWC at each stage of a warehouse’s value chain.
KSWC’s major functions can be classified into Inbound, Warehousing and Outbound. Each major
function has several components, where WMS system can be used for more efficient
operations.
1. Inbound Functions:
a. Receipts tracking: KSWC warehouses issue receipts on storage of commodities in
godowns. Tracking of receipts is of utmost importance when perishable food grains are
stored in warehouses. If a particular consignment is past its expiry period in a
warehouse, WMS will enable sending of a mail regarding this will be sent to concerned
officials for required action in case the goods are meant for distribution through PDS or
the particular depositor would be contacted and asked to move the goods away. Easier
and quicker receipt tracking is only possible when a warehouse management system is
in place.

Prefeasibility Report on WMS implementation
32
b. Customizable information capture upon receiving goods: This would include details of
loan availed by depositor, which would require the respective deposits to be locked.
Once a warehouse management system is in place, removal or movement of the stock
against which a loan has been taken would be automatically blocked. This would bring
down the possibility of human error to zero.
c. Rule-driven and space-driven put away methods: Using a warehouse management
system, put-away rules based on configurable parameters like dwell time, volume and
material classifications rules can be used to minimize fragmentation, enforce storage
policies, reduce obsolescence or implement other storage restrictions. This is especially
useful when a particular portion in a warehouse has been reserved for PDS food-grain
storage. Also, this would help in effective slotting and optimization when a large number
of transactions are required to be processed at a given location.
d. Cross-docking – Cross docking mainly refers to Hub and spoke arrangements, where
materials are brought in to one central location and then sorted for delivery to a variety
of destinations, without being stored there. While this may not be relevant for KSWC
immediately, cross-docking would be useful while KSWC decides to make its warehouses
function as terminal market centers. WMS can identify cross-docking opportunities in
the warehouse by matching expected receipts with outbound shipments using flexible
cross-dock rules. This would minimize the product wait time in outbound staging areas
before getting cross-docked and ensure greater space availability for goods with a longer
dwell time. It is important that the WMS system at present should be scalable to achieve
this function in future.
2. Warehouse Function
Stocktaking: Continuous stock-taking, possible only through a warehouse management system,
would ensure that stock discrepancies be brought to the notice and corrected much earlier than
under the manual system. It would simplify the process of making yearly accounts and also
provide real-time occupancy and storage space utilization details.
3. Outbound Function
Managing Billing and Dispatches: A WMS records invoice-raising, their amount and delivery that
gets fed into a system and be viewed in one go. Integration with accounting software would
provide a picture of real-time warehouse profitability and staff productivity at the central level.
5.2.1 Advantages for KSWC
By streamlining inbound and outbound shipments, implementation of WMS at KSWC
warehouses would bring the following specific tangible benefits to the corporation.

Prefeasibility Report on WMS implementation
33
1. Real-time Stock Management: The location, condition and amount of goods in all the
warehouses can be monitored at one place by KSWC. This would give an accurate picture of
the demand, supply and buffer stock of food grains at the godowns. This, in turn would
enable quick decision making at the central level on matters like hiring extra godowns.
Thus all the warehouses with WMS would in a way become a part of a connected material
and information network.
In a warehouse management system, all events would have to be logged in order to have
detailed historical information and complete visibility of the warehouse activities. Based on
this data, dynamic real-time management dashboards tracking Key Performance Indicators
(KPI) can be used to ensure proactive control.
2. Slotting and Optimization: WMS helps in determining the optimal slot for the stock keeping
Unit based on user defined criteria like size, expiry date, seasonality etc. The criteria can be
fine tuned given the past data that gets recorded in the WMS system. Optimal slotting helps
in minimizing extra moves by equipment and stocking grains of similar quality together. In
addition to reducing safety-stock requirements (needed when Govt. decides to increase
supply of a particular commodity to bring down its price), a WMS can often increase
available warehouse space by more efficiently locating items in relation to receiving and
shipping needs.
3. Electronic Database: Implementing a real time WMS can considerably reduce paper work as
all records can be maintained electronically. Further, past data would be extremely useful in
predicting the buffer space requirements for a particular year once information regarding
the monsoon is available. This would also help finalize plans on the capacity to be
immediately added by hiring extra godowns.
4. Agro-marketing centres: Centralizing operations at least at the division level would enable
KSWC to create agro-marketing centres at main locations in its divisions; the WMS will
facilitate real time monitoring of commodities i.e. the stage of processing—be it grading,
sorting, labeling, storage etc. at central and warehouse level. Such real time updates of data
will help in co-ordination with the suppliers and buyers at multiple locations in an efficient
manner from one location
5. Automated Report Generation: WMS system can also be customized to generate reports, if
certain processes are not being followed, they can be monitored at the central level.
6. NCDEX accreditation: Accreditation of warehouses from NCDEX is possible only a when a
WMS system is in place. This could be a potential source of revenue in the future.
Above all, with storage capacity at the warehouses increasing every year and beyond a point the
present manual system of entry would simply become unsustainable. It must also be pointed
out that WMS would not have adverse impact on the employees but would facilitate their work.

Prefeasibility Report on WMS implementation
34
A WMS would simplify manual labour, eliminate redundancy and reduce data entry, storage,
and retrieval costs.
Thus, from the impact gauged on its operations, it makes sense for KSWC to introduce WMS and
automate its entire operations. To start with, it can execute a pilot project after which it can roll
out this system for all its warehouses. It is imperative that while expansion of storage initiatives
are on, KSWC starts creating an information backbone to carry out its activities efficiently.
5.3 Site Features
Of the 17 warehouses chosen for the pilot phase of implementing WMS, the consultants visited
two warehouses - Gulbarga-II in Gulbarga district and Bagalkote in Dharwad district for a study on
their operations and the kind of goods handled. These are the two major warehouses in the
Northern Karnataka and it is expected that other warehouses would be similar to these two in
operation. A brief note on the two warehouses is explained below.
1. Gulbarga-II warehouse
Gulbarga- II is the largest warehouse in the Gulbarga region. The region includes Gulbarga,
Yadgiri, Bidar and Bijapur districts.
Commodities Handled: Fertilizer and Food Grains (Rice, Wheat and Pulses)
Capacity of Warehouse: 75,000 MT (24000 MT owned, 51000 MT hired). Rented warehouses
are present within 15 kms of the warehouse. Space for 5000 MT (30000 sq.ft) in the warehouse
is reserved for PDS food-grains. Following table gives the major commodities and their
quantities
Goods-wise Distribution:
Table 6: Commodities handled by Gulbarga-II
Commodity Present Stock (Tons)
Fertilizer 25000-30000
Food Grains 45000-50000
Capacity Utilization: 100%
Change in capacity over time: The capacity was increased from 25,000 MTs to 75,000 MTs in
2009-2010. Before the capacity increase, the warehouse was working on little over 100%
capacity utilization.

Prefeasibility Report on WMS implementation
35
Origin-Destination
Additional details regarding the origin and destination of commodities stored in the warehouse
are summarized below. The table also specifies the loading and unloading rates and the storage
charges for various commodities.
Table 7: Origin-Destination
Commodity Origin Destination
Fertilizer Manufacturing Units &
Imports (Mangalore,
Kandla,
Trombay,Chennai,Tuticor
in, Thal, etc.)
Consumed locally within the district
(no exports)
Food Grains (Rice &
Wheat)
Haryana and Punjab Consumed locally within the district
(no exports)
Food Grains (Pulses) From Gulbarga (pulses
processing industries)
Consumed locally within the district
(no exports)
It is the owner’s responsibility to ensure that all the goods required to be stored in the
warehouse reach Gulbarga by rail. These goods are then are transported to the warehouse by a
private contractor appointed by the warehouse.
However, the warehouse is not responsible for transport from the warehouse to the final
destination of the goods. In case of Pulses and Fertilizer, the buyer transports the goods from
the warehouse to the final destination and in case of Rice and Wheat (Food Corporation of
India’s products for Public Distribution), a contractor appointed by the Government of
Karnataka (Krishna Enterprises for Gulbarga-II) transports the goods from the Warehouse to the
Wholesale Depot.
The Contractor appointed by the Warehouse is hence responsible for incoming transportation,
loading and unloading. The same would be the responsibility of the private player, if the
warehouse is to be privatized.
Loading and unloading charges are paid by the customer to the warehouse, which in-turn, is
paid directly to the private contractor by the warehouse. Out of the total loading-unloading
charge, the private contractor pays 8% to the warehouse as supervision charges.
Prefeasibility Report on WMS implementation
36
Dwell Time: Dwell time for the goods stored in the warehouse ranges from 1 day to 3 years.
While fertilizer movements are difficult to predict, pulses, on an average are stored in the
warehouse for a period of one year.
Interactions with the warehouse manager indicate that computerization through warehouse
management systems for optimization of operations remains the top priority for the manager in
terms of modernization schemes sought.
2. Bagalkote Warehouse
Bagalkote warehouse, in Dharwad district has a capacity of 20000 Metric Tonnes. The
warehouse is the third largest in the region that comprises of 24 warehouses in total. Situated in
an area of 10 acres, the warehouse mainly stores fertilizers and food-grains.
Commodities Handled: Fertilizer and Food Grains (Maize, Jowar, Pulses, Rice and Wheat) are
the major commodities handled by the warehouse. Rice and Wheat are FCI commodities for the
PDS, rest are grown/processed locally.
Table 8: Stock of commodities at Bagalkote
Commodity Present Stock (Metric Tonnes)
Fertilizer 3000
Food Grains 17000
Capacity Utilization: 100% of the space available is being currently utilized.
Change in capacity over time: The old site in Bagalkote had 3 buildings of 660 tonnes capacity
each. Operations shifted from old warehouse to the present one in 2005 when construction of
first building of capacity 2,000 tonnes was completed. Following table shows the increase of
capacity of the warehouse with time:
Table 9: Year-wise cumulative capacity of Bagalkote warehouse
Year Capacity of
Building
Constructed
(tonnes)
Number of
Buildings
constructed
Cumulative
Capacity (tonnes)
2004 5,000 1 5,000 2005 2,000 1 7,000
2005 3,000 1 10,000

Prefeasibility Report on WMS implementation
37
Year Capacity of
Building
Constructed
(tonnes)
Number of
Buildings
constructed
Cumulative
Capacity (tonnes)
2011 5,000 2 20,000
2012 (expected) 6,500 1 26,500
Expansion Plans: At present, there is a 6,500 Metric Tonne capacity building being constructed
in the same 10 acre complex. The construction is expected to finish within 3 months and an
MOU has been signed by the Head Office (KSWC) and FCI for guarantee of storage commodity
for 9 years. After this construction, there would be space remaining for a 3,000 MT warehouse
building, for which there are presently no plans. KSWC has plans to acquire another 10 acres of
land across the road for further expansion once the capacity on the current parcel of land has
been exhausted. The land has been notified for the same, but not yet registered.
Origin-Destination of the goods in the warehouse:
Table 10: Origin destination of goods in the warehouse
Commodity Origin Destination
Fertilizer Manufacturing Units &
Imports (Mangalore, Kandla,
Trombay, Chennai, Tuticorin,
Thal, etc.)
Consumed locally within the
district (no exports)
Food Grains (Rice & Wheat) Haryana, Andhra Pradesh
and Punjab (and other FCI
locations)
NA
Food Grains (Others) From Nearby Places NA
The incoming & outgoing transportation as well as loading & unloading are done by the 3rd
party itself and the warehouse does not have any role to play in the same. The warehouse does
not even collect supervision charges for loading/unloading. Contractors of FCI and Karnataka
Food and Civil Supplies Corporation do the incoming transport & unloading and loading &
outgoing transport respectively.
Dwell Time: Dwell time for the goods stored in the warehouse ranges from 1 month to more
than a year. However, the warehouse does not take any responsibility for goods that are stored
for a period greater than 3 months.

Prefeasibility Report on WMS implementation
38
From above two site visits following conclusions can be drawn:
1. Foodgrains, pulses and fertilizers are the main commodities handled at KSWC warehouses.
2. KSWC warehousing functions are basic in nature, with depositors being responsible for
delivering goods at its doorstep and despatches being handled by customers themselves.
Further, majority of delivery is local. Thus, advanced software systems that enable tracking
of consignments, barcodes etc are not required for KSWC as of now.
3. Even large warehouses of KSWC are undergoing expansion, which indicates large demand
for warehousing space and hence economizing on space becomes more important for
KSWC. WMS system optimizes space by dividing warehouses into designated areas and
utilizing the space in the most efficient way
5.4 Project Design The identified private partner would be responsible for providing the required licenses and the
associated services for the successful implementation of WMS across the 17 identified
warehouses. The services required and the time frame necessary for each service are detailed
below.
Thorough study of warehouses and KSWC operations: Even though most WMS vendors
would have a core WMS license, it needs to be customized for each client, for which a
complete understanding of the operations is required. This phase might take up to 45
days, at the end of which the private player would have the knowledge of customization
requirements for KSWC warehouses.
Customization: This phase would translate the results of the first phase into software
customizations that would suit KSWC. Depending on the level of customization required,
this phase might take 1-2 months.
Integration with other software and User Acceptance Testing: If necessary, the WMS
would have to be integrated with other software that the client uses on his existing
terminals. This might not be applicable for KSWC. This normally takes about one month.
Implementation and roll out: The final phase involves installation of WMS licenses at
each terminal, configuration and removing glitches that might occur in real-time, when
simultaneous access from up to 20 users would be required. This could take up to 3
months.
Thus, implementation of a warehouse management system, under PPP, would have the following
features.
Computer terminals: The computer terminals present would have the requirements to
run WMS on their systems. The operating system that would be needed is Windows XP or
higher versions
Licensed WMS software: There are two kinds of licenses, if the WMS network is built on a
web-based architecture. One would be a central server license, that would run on the

Prefeasibility Report on WMS implementation
39
main server at the KSWC headquarters or a convenient location and the other would be a
location license, at each of the 17 warehouses identified for roll-out.
Creation of a 3 year electronic database of warehouse deposits and withdrawals: This
would help estimate the total warehousing space needed for the season, once details
regarding the monsoon of a particular year are known. For instance, a good monsoon
season would result in a rich harvest, increasing the demand for warehousing space. In
that case, the capacity can be augmented by hiring additional godowns.
In this context, it is essential to point out that the 17 warehouses need to be connected
through internet to the central server. KSWC needs to do one of the following- buy its
own server, use NIC servers on which most government websites are hosted or hire a
server through the private partner.
Maintenance of the system by the private player over the concession period:
Maintenance is provided by all WMS vendors to ensure the smooth functioning of the
software. This would take care of fixing bugs in the software, additional customization
that may be required and keeping the WMS upgraded and compatible with the latest
operating systems in the market.
Skilled professionals to operate WMS during this concession period: It is assumed that
one operator would be required for smaller warehouses i.e. for those warehouses which
comprise of 3- 20 godowns and two operators would be required for larger warehouses
that contain more than 20 godowns. These skilled operators would be responsible for
operating WMS throughout the concession period.
Training of the KSWC employees at the warehouses to operate the WMS: It is proposed
that the private partner would conduct a workshop every two months throughout the
license period for the benefit of KSWC employees, who would operate the WMS after the
license period. The private partner would be responsible for arranging WMS software
professionals to conduct these workshops.
Flexibility for other customizations: NCDEX accreditation is not sought by KSWC
currently. However, if KSWC decides to go for NCDEX accreditation at some point in the
future, the software would need to be customized so that it is compatible with the
trading platform. Customization would also be required if the WMS would need to include
features like cross docking to allow warehouses become agro-marketing centres. The
software offered will be customizable for the same.

Prefeasibility Report on WMS implementation
40
6 Project Financials
Financial analysis is done for the six year period, starting 2011-12. It is assumed that the concession
period with the private partner would be for five years, starting 2013-2014.
6.1 Cost Assumptions
6.1.1 Capital expenditure assumptions
Following are some of the capital cost assumptions for the project.
The total capital cost has two components – hardware and software costs.
1. The hardware required is taken to be only computer terminals. The cost of a computer
terminal is taken as INR 40000. A minimum of 1 computer is required for each warehouse.
Further, if a warehouse (location) has more than 20 godowns, an extra computer terminal
would be required.
2. After consultations with various WMS vendors, the license cost for each location has been
taken as INR 10 Lac. The cost of the central server license has been taken as INR 25 Lac. The
software license is an Intellectual Property owned by the WMS vendors. The license cost
charged to the client includes a 60% mark-up on the following costs.
Research and development costs for developing the software.
Cost of carrying out detailed studies to find out customization required.
Customization costs of the WMS software.
3. It is also further assumed that the capital expenditure will be equally split in the initial two
years i.e. 2012-13 and 2013-14.
The total capital expenditure for each cluster is given below.
Table 11 : Cluster-wise capital expenditure
Cluster Number of warehouses Capital cost (INR Lac)
Cluster I 6 77.20 Cluster II 6 63.56
Cluster III 5 56.91
All clusters 17 165.97
It can be seen that the cost of implementing WMS across all three clusters would be lesser
than the sum of individual cluster costs since only a single server license would be required
irrespective of the number of warehouses.

Prefeasibility Report on WMS implementation
41
6.1.2 Financing assumptions
The following table gives the financing assumptions that have been used for the project.
Table 12 : Financing assumptions – Private Partner
Financing Assumptions
Equity 100.00%
Debt 0.00%
Cost of Debt 12.00%
Cost of Equity 20.00%
WACC 20.00%
6.1.3 Depreciation assumptions
Depreciation assumptions for the project are as follows.
Table 13: Depreciation Assumptions
Depreciation Rate
WDV for Income Tax Assumptions
Computers and other Hardware 40% p.a.
SLM for P&L
Computers and other hardware 16.67% p.a.
6.2 Revenue assumptions
Revenue to the private player is assumed to be in the form of annuity payments from the
government for the various components including software license, maintenance, salary of the
WMS operators and software engineers, boarding and lodging expenses for the operators and re-
sale value of the hardware at the concession period. Basic assumptions and annuity payments are
detailed below.

Prefeasibility Report on WMS implementation
42
Table 14: Basic assumptions for the project
Employees required Number
WMS Operators Minimum of 1 operator per warehouse. An extra operator if a warehouse has more than 20 godowns.
Software engineers One software engineer per cluster
Data entry operators for migration of 3 year transaction data into WMS
1.25 operator months assumed for each warehouse. Salary: INR 12000 per month
Annuity payments for the first year of the license period (2013-2014) are shown below. These
annuity payments have been assumed in such a manner that the private player gets sufficient
returns over the license period.
Table 15: Assumed annuity payments for the year 2013-2014
Cluster Cluster I Cluster II Cluster III All clusters
Annuity payment (INR Lac)
58.22 48.65 43.26 131.03
Income from the sale of computers and other hardware devices to KSWC is a one –time
payment in the year 2017-18.
The project is structured in such a way that the annuity actually paid by the government to the
private partner would be increasing at 8 % each year. This rate has been arrived after taking into
account the escalation cost of each component of the operating expense of the private player,
the details of which are given in the following section.
6.3 Operating expense assumptions
Each annuity component is determined by marking-up the operating expense for that
component by a certain rate as shown in the previous table. To determine the actual operating
expense for each component, some assumptions have been made based on primaries with
WMS vendors. These are detailed below.

Prefeasibility Report on WMS implementation
43
Table 16: Operating expense assumptions
Assumptions Amount
Annual Salary assumptions Annual salary per operator (In INR Lac) 1.44
Annual salary per software engineer (In INR Lac) 4.50
% annual increase in salary of employees 5%
Training expenses assumptions
Number of workshops per year 6
Number of WMS experts for each workshop 5
Hiring cost per expert per workshop (In INR Lac) 0.08
Annual % increase in training costs 5%
Boarding and lodging expenses assumptions
Annual boarding and lodging expenses per operator
(In INR Lac)
0.96
% increase in boarding expenses each year 5%
6.4 Viability Assessment (NPV, Project IRR, Equity IRR)
The NPV, Project IRR and equity IRR have been calculated for the case when an annuity payment
of INR 131 Lac was considered for all the clusters together. The dependence of each of these
parameters has been studied when operating expenses and annuity payments are varied.
Table 17: Sensitivity to changes in operating expenses
% Change in Operating expense
NPV for the private partner (INR Lac)
Project IRR Equity IRR
0% 7.40 22.94% 22.94%
25% (27.36) 8.81% 8.81%
20% (20.41) 11.71% 11.71%
15% (13.45) 14.57% 14.57%
10% (6.50) 17.39% 17.39%
5% 0.45 20.18% 20.18%
0% 7.40 22.94% 22.94%
-5% 14.35 25.67% 25.67%
-10% 21.30 28.38% 28.38%
-15% 28.25 31.07% 31.07%
-20% 35.20 33.75% 33.75%
-25% 42.15 36.41% 36.41%

Prefeasibility Report on WMS implementation
44
Table 18: Sensitivity to changes in annuities
% Change in income earned
NPV for the private partner (INR Lac)
Project IRR Equity IRR
0% 7.40 22.94% 22.94%
25% 267.98 86.87% 86.87%
20% 202.90 74.92% 74.92%
15% 144.93 62.72% 62.72%
10% 93.43 50.14% 50.14%
5% 47.78 37.00% 37.00%
0% 7.40 22.94% 22.94%
-5% (28.25) 7.21% 7.21%
-10% (59.65) -12.41% -12.41%
-15% (87.26) - -
-20% (111.49) - -
-25% (132.73) - -
The NPV of annuity payments over the license period that the government has to pay the private
partner to ensure an IRR of ~23 % are given below.
Table 19: NPV of annuity payments
Cluster NPV of annuity payments (INR Lac)
Cluster I 214.59
Cluster II 179.31
Cluster III 159.39
All clusters with different project partners
553.49
All clusters with the same project partner 482.92
It can be seen that the government would save INR 70 Lac in terms of payments it makes to the
private partner when all the three clusters of warehouses are taken up a single partner for
implementation of WMS. This saving can be attributed to the fact that each private partner would
need to be compensated for a server license when three partners exists. Therefore, it is
recommended that one qualified WMS vendor takes up the entire project.

Prefeasibility Report on WMS implementation
45
6.5 Value for Money
Value for Money (VFM) analysis is essentially a cost-benefit analysis, where it is examined if the
benefits of the project are positive as compared to alternative procurement method. A PPP
project is said to achieve value for money if it costs less than the best realistic public sector
project alternative which would deliver the same services.
However, in case of this project, the public sector will not be able to execute the project on its
own due to lack of required expertise. Thus, the project being implemented on PPP basis holds
Value for Money for the government for creating infrastructure that will bring about efficiency
gains in the warehousing operations of KSWC, which otherwise could not have been implemented
if executed by public sector alone.

Prefeasibility Report on WMS implementation
46
7 Statutory & Legal Framework
7.1. Legal & Regulatory Framework
The Karnataka State Warehousing Corporation was established during November 1957
under the Agricultural Produce (Development and Warehousing) Corporations Act 1956
later repealed by the Warehousing Corporations Act 1962. The Government of Karnataka
and the Central Warehousing Corporation are the two share holders of the Corporation
having 50:50 basis equity shares.
The board of directors of KSWC, apart from the Chairman and the Managing Director,
consist of
Five directors nominated by the Central Warehousing Corporation of whom one
shall be nominated in consultation with the State Bank and one at least shall be a
non-official.
Five directors, nominated by the state government.
A Managing Director, appointment by the state government.
With regard to the policies to be followed by the KSWC, the act stipulates that the Board of
directors shall act on business principles having regard to public interest and shall be guided
by such instruction on questions of policy as may be given to them by the State Government
or the Central Warehousing Corporation.
The state is divided into seven regions- Mysore, Davanagere, Hubli, Bangalore, Gulbarga,
Raichur and Shimoga, each headed by a Regional Manager.
The act also authorizes the warehouses under KSWC to store the following commodities:
Fibres –Cotton, San hemp, Agave, coir and their products.
Cereals.
Pulses.
Oilseeds including copra and their products.
Cashewnuts, coconuts.
Jaggery, Sugar and Khandasari.
Fruits.
Vegetables, potatoes, onions.
Animal Husbandry Products - Wool, Butter, Ghee, Milk, Eggs.
Fish.
Condiments, spices and others - Coriander, Chillies Turmeric ,Garlic, Ginger,
Cummin, Tamarind, Cardamom, Pepper, Soap-nut, Areca, Coffee.

Prefeasibility Report on WMS implementation
47
Cattle fodder.
Tobacco.
Fertilizers.
The duties of the officials of the KSWC, as mentioned under the Warehousing
Corporations Act, state that the General Manager would be responsible for matters
relating to Expansion and Diversification of Activities of the Corporation and fixing
storage charges, studying the costing and suggesting improvement in the economics of
warehousing.
It must be clearly pointed out that the Warehousing Corporations Act of 1962, while
mentioning the terms and conditions for issue, renewal and suspensions of licenses,
does not prohibit any initiatives by the KSWC to be taken up under Public Private
Partnerships (PPP). However, gaining NCDEX accreditation for the state warehouses, if
required later would come under business policies and would therefore require a clear
policy directive from the state government.

Prefeasibility Report on WMS implementation
48
8 Indicative Environmental And Social Impacts
8.1 Environmental Impact
The implementation of WMS in KSWC warehouses has no visible environmental impact, as it is
mainly a software implementation and rollout project.
8.2 Social Impact
Implementation of Warehouse Management Systems in the state warehouses would streamline
the movement of food-grains from the producers (farmers) to the consumers (market) either
directly or through the Government (PDS scheme).
This would help the government to forecast storage space requirements in the state, during
extreme conditions of bumper harvest and drought.
Therefore, the entire project would bring about efficiencies in storing agricultural commodities.
This will be highly beneficial in the long run as it will allow the warehouses to become terminal
agro-market centres by facilitating real time monitoring of commodities at central and warehouse
level. This would help in bringing about co-ordination among the suppliers and buyers immensely
benefitting farmers and consumers across the state.

Prefeasibility Report on WMS implementation
49
9 Operating Framework
9.1 Risks & Mitigation
The potential risks and the mitigation measures for the proposed PPP project are detailed below.
Table 20: Associated Risks and Mitigation Measures
Risks Mitigation measures
Delay in implementation and roll-out of WMS across the 17 identified warehouses
Strong Service Level Agreements specifying timeframe for each phase need to be signed with the private partner.
Piracy of installed software
Only qualified WMS vendors having well-defined valid IPs for their licenses need to be allowed for bidding. Such measures should be a part of contractual obligation of the vendor.
Delay in annuity payments from the Government
An escrow account where an independent trusted third party receives and disburses money and/or documents for the transacting parties needs to be in place. The timing of such disbursements by the third party would be dependent on the fulfillment of contractually-agreed conditions by the private partner and KSWC.
Resistance by KSWC employees for the project, leading to a non-conducive working environment for operators provided by private partner
Measures to sensitize KSWC employees are required. KSWC would need to convince its employees on the benefits of WMS, making it clear that it would supplement rather than substitute human capital requirements.

Prefeasibility Report on WMS implementation
50
9.2 Indicative Project Structure
Table 21: Indicative project structure
Component Description
Structure
PPP project, annuity model.
Private partner owns hardware during license period, sells it to
KSWC at the end of five years.
WMS vendor quoting the lowest annuity bid gets the project.
WMS vendor maintains and operates the software at the 17
warehouses during the entire license period
License Period 5 years
Payment from Concession
Authority
Predetermined annuity payments.
Total base year annuity amount to be quoted be bidder
Annuity increases by 8% every year.
Annuity components include software license and
maintenance cost, operators’ salaries and boarding and
lodging expenses, salary of software engineers, migration of 3
year transaction data to WMS, training KSWC employees on
WMS.
Role of Concession
Authority
KSWC provides a central server to host the WMS license.
KSWC ensures that internet connectivity is provided to the 17
warehouses identified for WMS roll-out.
Data to be migrated to WMS is provided as per the pre-format
suggested by the vendor.
Role of Private Partner
Understand the customization required for KSWC in core
WMS; responsible for implementation and roll-out across 17
warehouses within a period mentioned in the tender.
Provide operators and software engineers to maintain and
operate the WMS at the 17 warehouses for the license period.
Provide data entry operators to migrate data in the suggested
pre-format to WMS software.
Arrange workshops once every 2 months for KSWC employees
for training them on WMS.

Prefeasibility Report on WMS implementation
51
10 Way Ahead
10.1 Next Steps
The immediate milestone for the Project would be
Preparation of Tender Documents for Selection of Transaction Advisor for the
Project
Tender documents will be prepared for selection of Transaction Advisors which would include
the following:
Detailed Scope of Work including deliverables and timelines for submission.
Outlining the minimum eligibility criteria, which the bidders would necessarily have
to meet before their bids are evaluated in detail.
Description of Evaluation process elaborating the various evaluation parameters and
their respective weightages.
Further, it is essential that the Transaction Advisor is competent in the field of Information
Technology. The scope of work, the eligibility criteria and most importantly the evaluation
process of the implementation would all be different from usual PPP projects; therefore prior
experience for the Transaction Advisor as an IT consultant would help structure this project and
the Service Level Agreements in a better way.
The transaction advisor would come up with a draft Agreement which would spell out the
following:
The Obligations and Scope of Work for the private partner.
Progress Reporting Mechanism.
Dispute Resolution Mechanisms.
Termination of Contracts by either of the parties.
Defining conditions and events leading up to a default in obligations.
Conditions construing Force Majeure
Conditions leading up to a termination of Contract and invoking of the Performance
Guarantee.
Strong specific Service Level Agreements mentioning timeframes for all services that are
a part of the contract with the private partner.
Capacity Building of PPP Cell Personnel
Capacity Building Workshops will be conducted for officials who are identified as PPP Cell
personnel by the department. These workshops will be conducted in order to enable these

Prefeasibility Report on WMS implementation
52
personnel in understanding the concept of PPP, model procedures and documents related to
implementation of PPP projects, key issues related to PPP etc. Three training sessions will be
organised as a part of capacity building. Various techniques of effective communication like
audio-visual media in form of PowerPoint presentations, videos, notes, interaction dialogues etc
will be used for these capacity building sessions.
10.2 Recommendations
Keeping in mind the nature of the project, the following recommendations are made.
KSWC should go for WMS implementation in the 17 warehouses identified, as it will bring
with it a host of benefits including efficiency in operations that will improve service
delivery to end users
A single private player for implementation and roll-out of the project in all 17 warehouses
is preferable. As per the analysis done by the Consultant, the overall cost of the WMS to
the Government will be ~13 % lesser in this scenario than in the situation where each
cluster is given to a separate player
o Operationally too, it is easier to work with one central server license rather than
integrating 3 server licenses together.
It is necessary that the transaction advisor chosen for this project has sufficient expertise
in the field of IT. This will ensure that deliverables and other requirements are clearly
defined and leave no scope for ambiguity.

Prefeasibility Report on WMS implementation
53
11 Annexure
11.1 Cash-flow Statement for the Project
An indicative cash-flow statement for the license period of the WMS project is given below. It has been
prepared under the assumption that the implementation of the project is for all the 17 warehouses
together with the annuity payment for the year 2013-2014 being INR 141.51 Lac.
Table 22: Cash-flow statement
Cash flows (In INR Lakhs) 2012-13 2013-14 2014-15 2015-16 2016-17 2017-18
Cash Inflows
Equity 80.96 85.01 0.00 0.00 0.00 0.00
Debt 0.00 0.00 0.00 0.00 0.00 0.00
Income 0.00 141.51 152.83 165.06 178.26 192.53
Total cash inflow 80.96 226.52 152.83 165.06 178.26 192.53
Cash Outflows
Capital expenditure 80.96 85.01 0.00 0.00 0.00 0.00
Interest expenses 0.00 0.00 0.00 0.00 0.00 0.00
Principal repayment 0.00 0.00 0.00 0.00 0.00 0.00
Operating expenditure 0.00 75.37 79.52 83.93 88.60 93.55
Taxes 0.00 21.22 23.30 25.83 28.60 31.63
Total cash outflows 80.96 181.60 102.82 109.76 117.20 125.17
Post-tax Cash flows 0.00 44.92 50.01 55.30 61.06 67.35
Project IRR (In INR Lakhs) 2012-13 2013-14 2014-15 2015-16 2016-17 2017-18
Capex 80.96 85.01 0.00 0.00 0.00 0.00
PBT 0.00 65.41 71.80 79.63 88.16 97.47
Depreciation 0.00 0.73 1.50 1.50 1.50 1.50
Interest 0.00 0.00 0.00 0.00 0.00 0.00
Tax 0.00 21.22 23.30 25.83 28.60 31.63
Pre Tax Cashflow (80.96) (18.86) 73.31 81.13 89.67 98.98
Post Tax Cashflow (80.96) (40.09) 50.01 55.30 61.06 67.35
Project IRR 22.94%
Project NPV (In INR Lakhs) 7.40

Prefeasibility Report on WMS implementation
54
Equity Cash Flows 2012-13 2013-14 2014-15 2015-16 2016-17 2017-18
Equity 80.96 85.01 0.00 0.00 0.00 0.00
PAT 0.00 44.19 48.51 53.79 59.56 65.85
Book Depreciation 0.00 0.73 1.50 1.50 1.50 1.50
Principal Repayment 0.00 0.00 0.00 0.00 0.00 0.00
Equity Cash Flow (80.96) (40.09) 50.01 55.30 61.06 67.35
Equity IRR 22.94%
Equity NPV (In INR Lakhs) 7.40