Predictive Risk Modelling in Aviation Incident
18
Predictive Risk Modelling in Aviation Incident The 10 th Montreal Industry Problem Solving Workshop Global Aviation Data Management, IATA Hyuntae Jung Andrea Mulone Yuval Yakubov
Transcript of Predictive Risk Modelling in Aviation Incident

Predictive Risk Modelling in Aviation Incident
The 10th Montreal Industry Problem Solving Workshop
Global Aviation Data Management, IATA
Hyuntae Jung
Andrea Mulone
Yuval Yakubov

Overview
1. Aviation Safety Data Management
2. Problem for the Workshop
3. Case Study
4. Data for the Workshop
10 August 2020

Global trade association for the world’s airlines founded in 1945, representing 82% of global traffic.
To represent, lead and serve the airline industry.
International Air Transport Association
IATA in brief
Predictive Risk Modelling in Aviation Incident – The 10th IPSW3
Global Aviation Data Management (GADM) is IATA Safety Data and Analytics program.
GADM is a unique global aviation safety database with IATA serving as a custodian trusted by the industry to do this.
ADXAccidents
FDXFlight Data eXchange
IDXIncident Data
eXchange
10 August 2020

4
Aviation, an engine for the economy
65.5million
jobs supported
35%of
global trade
57%of world tourists
Facilitatinginternationalsupply chain and business
Predictive Risk Modelling in Aviation Incident – The 10th IPSW4 10 August 2020
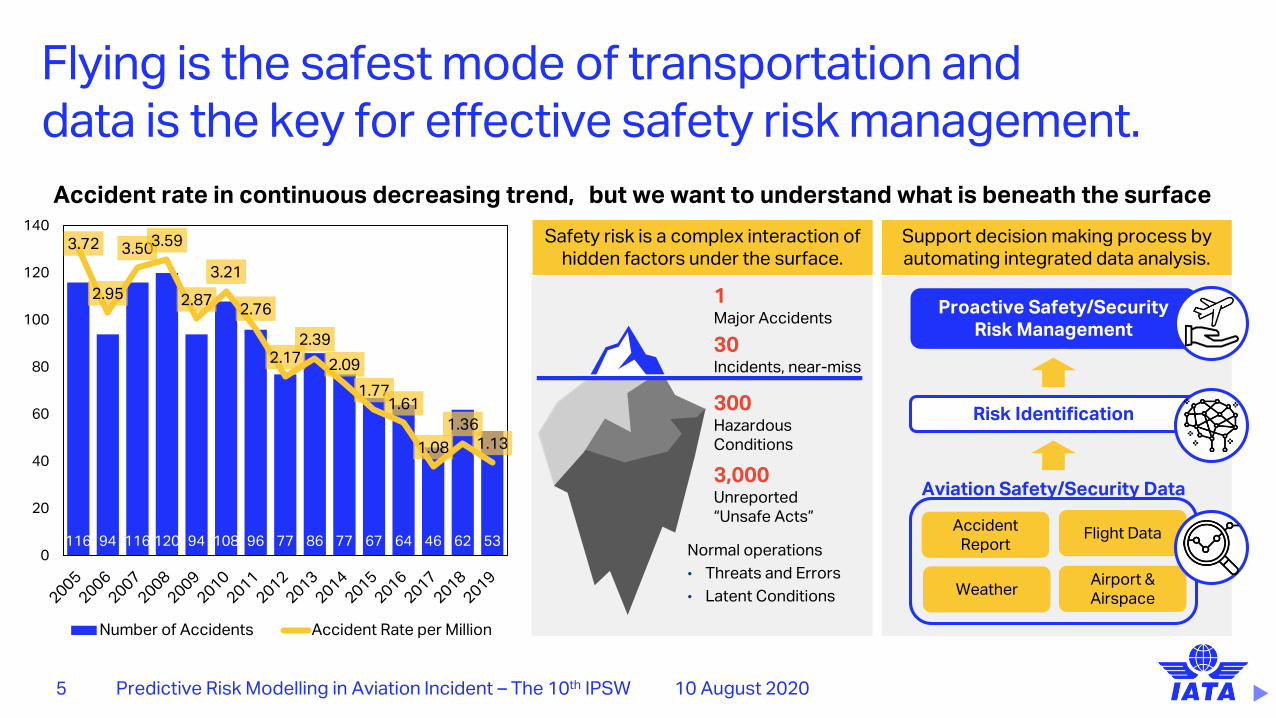
Flying is the safest mode of transportation anddata is the key for effective safety risk management.
116 94 116 120 94 108 96 77 86 77 67 64 46 62 53
3.72
2.95
3.50 3.59
2.87
3.21
2.76
2.17 2.39
2.09
1.77 1.61
1.08
1.36 1.13
0
0.5
1
1.5
2
2.5
3
3.5
4
0
20
40
60
80
100
120
140
Number of Accidents Accident Rate per Million
Accident rate in continuous decreasing trend,
1Major Accidents
30Incidents, near-miss
300Hazardous Conditions
3,000Unreported “Unsafe Acts”
Normal operations
• Threats and Errors
• Latent Conditions
Safety risk is a complex interaction of hidden factors under the surface.
but we want to understand what is beneath the surface
10 August 2020Predictive Risk Modelling in Aviation Incident – The 10th IPSW5
Risk Identification
Proactive Safety/Security Risk Management
Accident Report
Flight Data
WeatherAirport &Airspace
Aviation Safety/Security Data
Support decision making process by automating integrated data analysis.

Turbulence Aware
Data Analytic Use Case in Aviation Safety and Security
Risk Identification
Proactive Safety/Security Risk Management
Accident Report
Flight Data
WeatherAirport &Airspace
Aviation Safety/Security Data
Support decision making process by automating integrated data analysis.
10 August 2020Predictive Risk Modelling in Aviation Incident – The 10th IPSW6
Accident / Incident Data DashboardFlight Data Analytic

Challenges for Global Aviation Safety Data Analysis
Risk Identification
Proactive Safety/Security Risk Management
Accident Report
Flight Data
WeatherAirport &Airspace
Aviation Safety/Security Data
Support decision making process by automating integrated data analysis.
Data Qualityand Standardization
Time-consuming and expensive integration of unstructured data – collected from voluntary reporting programs.
No Automation Support in Continuous Monitoring
Lack of automated anomaly detection makes data-driven risk identification challenging especially in a global scale.
Not Achieving Proactive Safety Risk Management
Limited capability of delivering the “right message at the right time” – challenge for proactive risk management.
10 August 2020Predictive Risk Modelling in Aviation Incident – The 10th IPSW7

Challenges for Global Aviation Safety Data Analysis
Risk Identification
Proactive Safety/Security Risk Management
Accident Report
Flight Data
WeatherAirport &Airspace
Aviation Safety/Security Data
Support decision making process by automating integrated data analysis.
10 August 2020Predictive Risk Modelling in Aviation Incident – The 10th IPSW8
Analytics Maturity
Co
mp
eti
tiv
e A
dv
an
tag
e
Sense & Respond Predict & Act
Raw Data
CleanedData
StandardReports
Ad HocReports
InferentialAnalysis
PredictiveModeling
Optimization
“What happened?”
Why did it happen?
What’s likely to be happened?
What is the best that could happen?

Challenges for Global Aviation Safety Data Analysis
10 August 2020Predictive Risk Modelling in Aviation Incident – The 10th IPSW9
“We don’t know what can be the problem until we face the problem.”

Challenges for Global Aviation Safety Data Analysis
10 August 2020Predictive Risk Modelling in Aviation Incident – The 10th IPSW10
“COVID-19 is brining up the new risk area – we want to detect anomalies to closely monitor the situation”
IATA’s Problem for the 10th Montreal IPSWPredictive Risk Modelling in Aviation Incidents
10 August 2020Predictive Risk Modelling in Aviation Incident – The 10th IPSW11

10 August 2020Predictive Risk Modelling in Aviation Incident – The 10th IPSW12
IPSW Challenge Target
The goal for this challenge is to define the safety risk model, which can detect the potential precursors or anomalies compared to the previous trends by drilling down into multiple subsets of attributes.
First, we want to be able to assign risk for the
certain attribute or the combination of multiple
attributes.
For example, whether a certain aircraft type or
airport may have significantly different risk
pattern than the others. This is to raise a flag to
human analyst to have a deeper look.
Also, we want a way to be able to predict how
much events will happen in a month for a certain
descriptor. The goal of this is not to just provide a
point estimate but also a confidence interval.
For example, If the dataset contains a certain
number of incidents for February which falls
outside this confidence interval, then this should
be flagged.
1. Anomaly Detection 2. Predictive Analysis

10 August 2020Predictive Risk Modelling in Aviation Incident – The 10th IPSW13
IPSW Challenge Target – (1) Anomaly Detection
3
4
5
6
7
Example: Global Aggregated Hard Landing Rate
Global Rate
3
4
5
6
7
Example: Hard Landing Rate by Aircraft Type
Global Rate Aircraft Type A Aircraft Type B
The model examines the set of incidents by
drilling down into specific aircraft type, finding:
• Aircraft Type A does not show significant
difference to the global rate
• Aircraft Type B shows a spike over the global
rate (green flag), which may indicate
prominent safety risk.
Once the model automatically identify such
“anomaly” with statistical evidence, the flag will
be raised, so that human safety analysts can
perform deeper investigation.
Model to give hints to safety analysts where to look before querying every criteria one-by-one.
Slicing the data with combinations of multiple attributes
• Events(e.g. Hard Landing, Engine Overheat, etc.)
• Date of Occurrence(e.g. Seasonal factors)
• Geographic (Region, Country, Airport Level)
• Aircraft Type
• Flight Phase

10 August 2020Predictive Risk Modelling in Aviation Incident – The 10th IPSW14
IPSW Challenge Target – (2) Predictive Analysis
0
1
2
3
4
5
6
7
Example: Monthly rate of Event A (with the seasonal pattern)
In this example, the historical data for Event A shows
seasonal pattern – higher rate in the winter season and
lower rate in the summer season.
After trained by the 2 years of historical incident data,
the model makes a prediction for January 2019, with
given interval of confidence. However, the actual data
from January 2019 was out of the boundary.
If the actual rate of the certain incident is out of the
boundary, this may mean there might be significant
change in the risk profile. The model will flag this
finding, so that human safety analysts can perform
deeper analysis.
Model to predict event rate based on historical records, and flag if the actual rate is exceptional.

10 August 2020Predictive Risk Modelling in Aviation Incident – The 10th IPSW15
Data – Incident Reports
We prepared 621K reports from 2013 Q1 to 2018 Q2 from IATA aviation safety incident database exportedin Excel format. For deidentification purpose, we removed and masked sensitive columns.
Each column represents the following information:
• Report ID: unique # of report
• Year
• Month
• Fleet Family: (deidentified) the reported aircraft type.
• Location: (deidentified) the reported airport.
• Location Country: (deidentified) the country of the
airport reported.
• Phase: The phase of flight of the aircraft when the
event occurred.
• Event: the reported type of incident
(632 different events)
For example, one report contains the following values:
• Report ID: 7723515
• Year: 2017
• Month: October
• Fleet Family: ACType1
• Location: Airport162
• Location Country: Country256
• Phase: Approach
• Event: Weather - Windshear

10 August 2020Predictive Risk Modelling in Aviation Incident – The 10th IPSW16
Data – Sector (Flight Segments)Sector data is the number of flight segments flown of the contributors to incident dataset by quarter, aircraft type,departure and arrival airport. This sector data is used in IATA to normalize the incident rate in a global, country and airportlevel as below:
For example, one records from Sector contains values:
• Quarter: 2018 Q2
• Fleet Family: ACType5
• Departure: Airport162
• Departure Country: Country256
• Arrival: Airport359
• Arrival Country: Country26
• Sectors: 3,631
STEADES Sectors CalculationLet 𝐽𝑐 be the set of airports in the State 𝑐 and 𝐼𝑗,𝑞 be the set of
operators operated in the airport 𝑗 ∈ 𝐽𝑐 in the quarter 𝑞.𝛿 𝑖, 𝑞 = 1 if the airline 𝑖 submitted one report or more than onereports successfully to STEADES database in the quarter 𝑞 and 𝛿 𝑖, 𝑞 = 0 else. Then the STEADES sector 𝑆𝑐,𝑞 of the State 𝑐 in the
quarter 𝑞 is calculated as below:
𝑆𝑐,𝑞 =
𝑗
𝑖
0.5 ∙ 𝑑𝑒𝑝𝑖,𝑗 + 𝑎𝑟𝑟𝑖,𝑗 ∙ 𝛿 𝑖, 𝑞 , ∀𝑖 ∈ 𝐼𝑗,𝑞 , ∀𝑗 ∈ 𝐽𝑐
Based on the STEADES sectors, the rate per 1,000 STEADES flights 𝑟𝑐,𝑞 of the State 𝑐 in the quarter 𝑞 is calculated as below:
𝑟𝑐,𝑞 =1000 ∙ 𝐴(𝑥)
𝑆𝑐,𝑞, 𝐴(𝑥) = 𝑥 ∈ 𝑋 𝑥𝑗 ∈ 𝐽𝑐 ∧ 𝑥𝑞 = 𝑞
Where 𝑋 denotes the set of queried STEADES reports, 𝑥𝑗 and 𝑥𝑞represents the airport of occurrence and the quarter of occurrence in report 𝑥 respectively.

10 August 2020Predictive Risk Modelling in Aviation Incident – The 10th IPSW17
Case Study – Incident Rate Prediction
Generalized Linear Model (GLM)
• As an internal experiment, we
focused primarily on GLM models
because incidence rate ratio and
odds ratio can be extracted from
these models, and then used for risk
modelling.
• Poisson regression was not a
feasible model: Cameron – Trivedi
dispersion test failed.
• Failure to reject the null hypothesis in
the C-T test indicates that an
assumption is violated, and our
model is either under dispersed or
over dispersed.
Negative Binomial Model
The final model that we used was the Negative
Binomial model, this model passed the chai squared
test as well as the Cameron Trivedi dispersion test.
Given the previous experiments that we
did, some of our observations are:
1) Find risk metrics for attributes in our
data that aren’t odds ratio
2) Find better times series predication
models. GLM’s can provide times
series predictions but in most of the
cases will not perform as well as
seasonal time series, or deep
learning models.
Observation & Suggestion
[1] F. Bati and L. Withington. 2019. “Application of Machine Learning for Aviation Safety Risk Metric.” Paper presented at the 17th IEEE International Conference on Dependable, Automatic and Secure Computing (DASC 2019), Fukuoka, 2019[2] F. Famoye, J. T. Wulu and K. P. Singh. 2004 “On the Generalized Poisson regression model with an application to accident data.” Journal of Data Science 2: 287-295.
Question and Answer
10 August 2020Predictive Risk Modelling in Aviation Incident – The 10th IPSW18