
Predator driven changes in prey size distribution stabilize … · 2016-11-23 · Predator driven...
14
Predator driven changes in prey size distribution stabilize secondary production in lacustrine food webs Thomas M. Detmer,* James H. McCutchan Jr., William M. Lewis Jr. Cooperative Institute for Research in Environmental Sciences, University of Colorado Boulder, Boulder, Colorado Abstract Data from 12 Colorado mountain lakes, some containing invertivorous fish and some without fish, show that fish suppressed biomass of benthic invertebrates and zooplankton and reduced their mean and maxi- mum body size, but did not alter invertebrate production. Resilience of invertebrate production occurred because the smaller body size of invertebrates in lakes with fish raised the community P/B ratio and simulta- neously caused an increase in abundance of small invertebrates (<10 mm benthic invertebrates; < 1.5 mm zooplankton), probably by releasing small invertebrates from competition with large invertebrates. Together, these two changes in the invertebrate communities stabilized secondary production even though total inver- tebrate biomass was reduced. Compensatory stability of herbivore production in response to size selective predation by fish may be a common phenomenon in aquatic food webs. Because it involves both an increase in P/B ratio and an increase in biomass of invertebrates with high P/B ratio, compensation may to some degree explain the commonly observed failure of predation pressure by primary consumers to cause an increase in biomass of primary producers for trophic cascades with three levels, even when invertebrate bio- mass is reduced by predation. Addition of a fourth trophic level consisting of piscivorous fish would likely have less predictable effects because piscivores produce offspring that are invertivorous predators, thus poten- tially adding a qualitatively different compensatory mechanism to the trophic cascade. Fish are an organizing feature of lake food webs (Brooks and Dodson 1965; Carpenter et al. 1985; Northcote 1988). The trophic cascade concept predicts that predators such as fish have alternating and opposite effects on the biomass of successively lower trophic levels down to primary producers (Hairston et al. 1960; Paine 1980; Carpenter and Kitchell 1993; Terbough and Estes 2010). Thus, if invertivorous fish are introduced in a fishless lake, invertebrate biomass and body size should decrease (Brooks and Dodson 1965) and algal biomass should increase (Carpenter and Kitchell 1993). Some studies of trophic cascades show that fish substan- tially suppress biomass of invertebrate grazers and increase the abundance of primary producers (e.g., Carpenter et al. 1987; Leavitt et al. 1989; Jeppesen et al. 1999; Schindler and Vallentyne 2008), but other studies show that changes in primary producer biomass are weak or undetectable despite reductions in invertebrate biomass (e.g., Brett and Goldman 1996; Parker et al. 2001; Lake et al. 2011; Demi et al. 2012). Trophic cascades appear to be strongest in nutrient poor environments, possibly because of increased abundance of unpalatable algae in nutrient enriched lakes (Sarnelle 1992; Jeppesen et al. 2003), and in ecosystems with low species diversity of primary consumers, for reasons not yet fully explained (Power 1990; Polis 1999). It is not clear why tro- phic cascades vary in strength when environmental condi- tions appear to be similar for lakes with and without fish, even if diversity of primary consumers is low. Explanations connected to trophic status or diversity could lie in seldom quantified effects of predation (e.g., varied size distributions of fish, DeLong et al. 2015; behaviorally mediated changes in predation, Schmitz et al. 1997; intraspecific competition of predators, Jones and Post 2013). Rocky Mountain National Park (RMNP), the location of this study, is an ideal location for analysis of trophic cascades, as it offers a high density of lakes with and without fish. Fur- thermore, these lakes have been maintained with or without fish for several decades during which the food webs likely have reached equilibrium with respect to presence or absence of fish (Knapp et al. 2001; Schabetsberger et al. 2009). The purpose of the present study is to quantify the effect of fish on body size, biomass, and production of both benthic and planktonic invertebrates in physically similar lakes of RMNP. *Correspondence: [email protected] This is an open access article under the terms of the Creative Commons Attribution License, which permits use, distribution and reproduction in any medium, provided the original work is properly cited. 1 LIMNOLOGY and OCEANOGRAPHY Limnol. Oceanogr. 00, 2016, 00–00 V C 2016 The Authors Limnology and Oceanography published by Wiley Periodicals, Inc. on behalf of Association for the Sciences of Limnology and Oceanography doi: 10.1002/lno.10446
Transcript of Predator driven changes in prey size distribution stabilize … · 2016-11-23 · Predator driven...
Predator driven changes in prey size distribution stabilize secondaryproduction in lacustrine food webs
Thomas M Detmer James H McCutchan Jr William M Lewis JrCooperative Institute for Research in Environmental Sciences University of Colorado Boulder Boulder Colorado
Abstract
Data from 12 Colorado mountain lakes some containing invertivorous fish and some without fish show
that fish suppressed biomass of benthic invertebrates and zooplankton and reduced their mean and maxi-
mum body size but did not alter invertebrate production Resilience of invertebrate production occurred
because the smaller body size of invertebrates in lakes with fish raised the community PB ratio and simulta-
neously caused an increase in abundance of small invertebrates (lt10 mm benthic invertebrateslt15 mm
zooplankton) probably by releasing small invertebrates from competition with large invertebrates Together
these two changes in the invertebrate communities stabilized secondary production even though total inver-
tebrate biomass was reduced Compensatory stability of herbivore production in response to size selective
predation by fish may be a common phenomenon in aquatic food webs Because it involves both an increase
in PB ratio and an increase in biomass of invertebrates with high PB ratio compensation may to some
degree explain the commonly observed failure of predation pressure by primary consumers to cause an
increase in biomass of primary producers for trophic cascades with three levels even when invertebrate bio-
mass is reduced by predation Addition of a fourth trophic level consisting of piscivorous fish would likely
have less predictable effects because piscivores produce offspring that are invertivorous predators thus poten-
tially adding a qualitatively different compensatory mechanism to the trophic cascade
Fish are an organizing feature of lake food webs (Brooks
and Dodson 1965 Carpenter et al 1985 Northcote 1988)
The trophic cascade concept predicts that predators such as
fish have alternating and opposite effects on the biomass of
successively lower trophic levels down to primary producers
(Hairston et al 1960 Paine 1980 Carpenter and Kitchell
1993 Terbough and Estes 2010) Thus if invertivorous fish
are introduced in a fishless lake invertebrate biomass and
body size should decrease (Brooks and Dodson 1965) and
algal biomass should increase (Carpenter and Kitchell 1993)
Some studies of trophic cascades show that fish substan-
tially suppress biomass of invertebrate grazers and increase
the abundance of primary producers (eg Carpenter et al
1987 Leavitt et al 1989 Jeppesen et al 1999 Schindler and
Vallentyne 2008) but other studies show that changes in
primary producer biomass are weak or undetectable despite
reductions in invertebrate biomass (eg Brett and Goldman
1996 Parker et al 2001 Lake et al 2011 Demi et al 2012)
Trophic cascades appear to be strongest in nutrient poor
environments possibly because of increased abundance of
unpalatable algae in nutrient enriched lakes (Sarnelle 1992
Jeppesen et al 2003) and in ecosystems with low species
diversity of primary consumers for reasons not yet fully
explained (Power 1990 Polis 1999) It is not clear why tro-
phic cascades vary in strength when environmental condi-
tions appear to be similar for lakes with and without fish
even if diversity of primary consumers is low Explanations
connected to trophic status or diversity could lie in seldom
quantified effects of predation (eg varied size distributions
of fish DeLong et al 2015 behaviorally mediated changes
in predation Schmitz et al 1997 intraspecific competition
of predators Jones and Post 2013)
Rocky Mountain National Park (RMNP) the location of
this study is an ideal location for analysis of trophic cascades
as it offers a high density of lakes with and without fish Fur-
thermore these lakes have been maintained with or without
fish for several decades during which the food webs likely
have reached equilibrium with respect to presence or absence
of fish (Knapp et al 2001 Schabetsberger et al 2009) The
purpose of the present study is to quantify the effect of fish
on body size biomass and production of both benthic and
planktonic invertebrates in physically similar lakes of RMNP
Correspondence ThomasDetmercoloradoedu
This is an open access article under the terms of the Creative Commons
Attribution License which permits use distribution and reproduction inany medium provided the original work is properly cited
1
LIMNOLOGYand
OCEANOGRAPHYLimnol Oceanogr 00 2016 00ndash00
VC 2016 The Authors Limnology and Oceanography published by Wiley Periodicals Incon behalf of Association for the Sciences of Limnology and Oceanography
doi 101002lno10446
The fish of interest here are trout (Oncorhynchus clarkii and
Salvelinus fontinalis) no other fish were present Given that
fish can suppress the mean size of invertebrates in lakes
(Schielke et al 2011 Jones and Post 2013 DeLong et al
2015) one hypothesis is that fish cause reductions in mean
body size and lower total biomass of invertebrates of the
RMNP lakes A corollary hypothesis which is the main basis
of this study is that fish do not suppress invertebrate produc-
tion in lakes to the extent that they suppress biomass Differ-
ential response of invertebrate biomass and production may
to some extent explain why suppression of invertivorous fish
by piscivores does not consistently suppress biomass of prima-
ry producers in lakes
Methods
The study area is the headwaters of the North St Vrain Creek
(Wild Basin) of RMNP (Fig 1) Lakes in the study vary in eleva-
tion watershed area and depth but the two groups of lakes
(six without fish six with fish) did not differ significantly in
any of these physical characteristics (pgt005) Relevant
anthropogenic influence on the lakes is limited to nitrogen
enrichment by atmospheric deposition (Lewis and Grant 1980
Baron et al 2009) and introduction of fish to some lakes (Table
1)
Field studies were conducted on the 12 lakes during the
2009ndash2012 ice-free season (JulyndashOctober) All lakes were sam-
pled on multiple dates for at least 1 yr and five lakes were
sampled multiple times in multiple years (Table 1) Samples
were collected three or four times per year from the time of
spring ice melt to onset of ice cover at intervals averaging 31
d (SE 6 41) and again the following spring after ice melt
Records provided by the US Fish and Wildlife Service
indicate that of the six fishless lakes two were never stocked
and four were stocked but became fishless because of inade-
quate spawning habitat The four lakes that were stocked but
are now fishless have not contained fish for at least 30 yr
and therefore likely show no residual effects of having been
stocked (Knapp et al 2005)
On each sampling date at each lake temperature Secchi
depth and outlet discharge were measured Two liters of
water were collected just below the surface filtered through
0 2500 50001250 Meters
LegendLakeswithFish_FeatureToPolyg
LakesNoFish_FeatureToPolygon
Lakes with fish Lakes without fish
0 1250 2500 5000 Meters
gennnnnnnnnnnnnnnnnnnnnddddddddddddddddddddLakeswwwwwwwwwwwwwiiiiiiiiiiiiiiittttttttthFFFFFFFFFFFFFFFFiiiiiiiiiiiiiiiisssssssssssssh_____________FeatureeeeeeeeeeeeeeeeTTTTTTTTTTTTTTTToooooooooooooooTTTTTTTTTT PPPPPPPPPPPPPPPPoooooooooooooolllllllyyyyyyyggggggggggg
LakkkkkkkkkkkkkkkkkeeeeeeeeeeeeeeeesssssssssssssssssNNNNNNNNNNNNNNNNNNNoooooooooooooooooooFish________FeatureTTTTTTTTTTTTTTTTTTToTT Polyyyyyggggggonnnnnnnnnnnnn
Fig 1 Study area and lake locations in Rocky Mountain National Park Colorado The bottom left corner of the map is 4016968 latitude and210566588 longitude
Detmer et al Predators affect food webs
2
a Whatman GFC filter and analyzed for dissolved organic
carbon with a TOC analyzer (combustion with catalytic oxi-
dation and nondispersive infrared CO2 analysis) total dis-
solved nitrogen (Valderrama 1981 Davi 1993) total
dissolved phosphorus (Murphy and Riley 1962 Valderrama
1981 Langner and Hendrix 1982) and chlorophyll a (Chl a)
of phytoplankton (Marker et al 1980 Nusch 1980) For each
lake periphyton was collected from four depths (15 cm 30
cm 45 cm and 60 cm) at two or three arbitrarily selected
locations for analysis of Chl a At each lake for each of these
depths periphyton was scraped from a fixed area of the top
surface of two rocks Periphyton chlorophyll was analyzed
by ethanol extraction with sonication followed by spectro-
photometric analysis (Lewis and McCutchan 2010)
Benthic invertebrates were sampled from the littoral zone
which is defined for this study as 0ndash3 m depth rather than
from the entire lake Similarity among lakes in littoral ben-
thic habitat favors inter-lake comparisons whereas offshore
habitat ranges considerably among lakes (eg maximum
depth range is 3ndash17 m)
Large motile epibenthic invertebrates (eg Ephemerop-
tera Hirudinea Odonata) were collected with a benthic sled
similar to the one described by Hessler and Sanders (1967
mesh size 5 250 lm mouth 5 20 cm) A piston corer
(576 cm2) was used to collect infauna (eg Pisidium sp
Chironomidae Oligochaeta Gillespie et al 1985) Both devi-
ces were used at 6ndash12 arbitrarily selected sites around each
lake At each site three sled tows (3 m or more in length
05 m s21) were taken perpendicular to the shoreline
pooled and stored in 70 ethanol and two sediment core
samples were collected pooled and stored in a similar man-
ner All benthic invertebrate samples were taken at
depths3 m within 7 m of shore and at least 50 m from
the inlet or outlet
Benthic invertebrates were separated and identified to the
lowest practicable taxonomic unit (typically genus or species
Thorp and Covich 1991 Merritt et al 2008) For rare taxa all
individuals from each sample were measured with an optical
micrometer For abundant taxa body lengths of at least 100
organisms were measured appendages such as cerci and
antennae were not included in the measurements The rela-
tionship of length (L) to individual dry mass (M) was assumed
to be M 5 aLb where values of constants a and b were taken
from Benke et al (1999) Miserendino (2001) Baumgartner
and Rothaupt (2003) and Johnston and Cunjak (1999)
Zooplankton were sampled from a raft with vertical tows
of a conical zooplankton net (20 cm diameter 53 lm
mesh) from near the bottom to the surface at a rate of about
05 m s21 Filtered volumes for zooplankton samples were
assumed to reflect a filtration efficiency of 50 (Walters and
Vincent 1973 Lewis 1979) One tow was taken at the deep-
est location in the lake and at least three other tows were
taken at arbitrary locations at depths greater than one meter
Samples were fixed in 95 ethanol and transferred to 70
ethanol for storage (Black and Dodson 2003)
Zooplankton samples were concentrated and subsampled
with a Hensen-Stempel pipette Zooplankton were identified
to genus or species according to Pennak (1989) Thorp and
Covich (1991) and Stemberger (1979) and were enumerated
in a 1 mL Sedgewick-Rafter cell or 20 mL modified Bogorov
cell depending on the abundance of the taxon Between 5
and 100 of each sample was evaluated depending on abun-
dance Abundances were corrected for tow depth For rare
taxa all individuals were measured for length for abundant
taxa at least 100 organisms of each taxon were measured for
length Dry mass (DM) was calculated from equations for
crustaceans rotifers and Chaoborus trivittatus (Dumont and
Balvay 1979 EPA Great Lakes National Program Office 2003)
Table 1 Overview of lakes included in the study NF 5 no fish BT 5 brook trout CT 5 cutthroat trout
Fish Elevation Lake area Max depth Mean depth Watershed area Years
Lake Present (m) (ha) (m) (m) (ha) Sampled
Bluebird NF 3341 50 93 34 317 2010 2012
Falcon NF 3377 11 77 25 72 2011
Finch NF 3021 26 26 13 27 2010
Lion Lake 1 NF 3373 18 28 06 325 2009
Lion Lake 2 NF 3469 15 128 43 230 2011 2012
Twin NF 2991 13 26 09 13 2009
Mean 3262 6 83 22 6 06 63 6 18 22 6 06 164 6 59
Box BT 3266 16 93 39 28 2012
L Hutcheson CT 3304 17 76 29 396 2011
Ouzel CT BT 3052 20 27 07 1028 2009
Pear CT 3225 60 168 62 182 2011 2012
Sandbeach CT 3135 48 79 24 67 2011 2012
Thunder CT 3225 59 129 43 321 2009 2010
Mean 3201 6 38 37 6 09 95 6 20 34 6 08 337 6 150
Detmer et al Predators affect food webs
3
For taxa with distinct cohorts that could be followed over
time (eg Siphlonurus occidentalis) production was estimated
for each taxonomic group over each interval between sam-
pling dates by the increment-summation method (Benke and
Huryn 2006) The estimate over the interval between two
sampling dates for a given taxon is P5 N DW
=t where P is
daily production over an interval of t days N is the mean
abundance between two dates spanning the interval and DW
is the change in mean individual mass over the interval for a
taxon Annual production is the summation of P over all days
of the year when growth occurs (growing season)
For taxa without distinct cohorts (eg Chironomidae)
the instantaneous growth method was used to estimate pro-
duction of benthic invertebrates (Benke and Huryn 2006)
The estimate for a particular taxon over an interval of length
t is P5 g B where P is daily production g is daily instanta-
neous growth rate B is the mean interval biomass and t is
the length of the interval (days) Annual production is the
sum of production for each taxon across all intervals in a
growing season
For benthic invertebrates growth rates (g) were estimated
by use of a multiple regression equation that relates growth
rate to body mass and temperature The equation was cali-
brated with data from all sampling intervals for all taxa that
could be followed as cohorts (N 5 83 plt0001 R2 5 028
Huryn and Wallace 1986 Hauer and Benke 1987 McCutchan
and Lewis 2002) The equation is log g 5 222 1 0065 T ndash
019 log m where g is growth rate per day T is the mean tem-
perature for the interval (8C) and m is mean dry mass for the
interval in mg For copepods cladocera and rotifers the mod-
el of Shuter and Ing (1997) was used log P 5 ataxon 1 log
(Bt) 1 0045 Tt 1 06 log (t) where P is production ataxon is a
taxon specific correction Bt is the mean growing season pop-
ulation biomass Tt is the mean growing season temperature
(8C) and t is the growing season length in days
Quantification of P for individual invertebrate taxa based
on field data and standardized equations as conducted for
the present analysis is subject to a high degree of error vari-
ance This defect in computation of P for individual taxa is
offset to some degree for present purposes by pooling of P at
the community level for comparisons of lake categories (fish
no fish) as shown in the results section Also the very large
contrast in composition and size distribution of invertebrates
across lake categories for this study greatly reduces the likeli-
hood that general conclusions based on pooled P values are
qualitatively incorrect
When the water temperature islt48C (NovemberndashJune)
the instantaneous growth rate of freshwater invertebrates is
near zero and sampling for the purpose of measuring produc-
tion is unnecessary (Pennak 1968 Makarewicz and Likens
1979 McCutchan and Lewis 2002) Growing season produc-
tion for zooplankton is here assumed to equal annual zoo-
plankton production (Pennak 1968 Shuter and Ing 1997)
For lakes that were sampled in more than 1 yr body
mass biomass and production of invertebrates chemical
constituents and concentrations of Chl a for phytoplankton
and periphyton did not differ among years (ANOVA
pgt005) Interannual averages were used for lakes that were
sampled in multiple years
Contrasts between lakes with and without fish for chemi-
cal constituents concentrations of phytoplankton and
periphyton and invertebrate biomass were based on a
repeated measures ANOVA test Data were log transformed
for analysis when data violated the assumption of equal vari-
ance and the Greenhouse-Geisser correction was used when
the assumption of sphericity was violated
Data for the two groups of lakes also allow comparisons of
community diversity Diversity was contrasted between the
two groups by mean taxonomic richness and Shannon Diver-
sity Index (Shannon and Weaver 1948) Because the literature
Table 2 Comparisons of mean annual species richness Shannon diversity index individual dry body mass community biomassand community production for lakes with and without fish Individual dry body mass is shown in mg for benthic invertebrates andlg for zooplankton Significant differences between categories are depicted with an asterisk (plt005) Small taxa are those with amean annual body size oflt1 mg for benthic macroinvertebrates andlt1 lg for zooplankton
Benthic invertebrates Zooplankton
Lakes without fish Lakes with fish Lakes without fish Lakes with fish
Metric Mean 6 SE Mean 6 SE p Mean 6 SE Mean 6 SE p
Species richness (n) 18 6 3 14 6 1 017 15 6 1 16 6 2 034
Shannon diversity 149 6 014 108 6 018 009 153 6 011 140 6 016 052
Body size (mgDM lg) 019 6 006 003 6 001 lt001 267 6 057 049 6 047 003
Biomass (mgDM m22) 705 6 72 364 6 76 lt001 71 6 14 41 6 9 004
Production (mgDM m22 yr21) 1871 6 280 1544 6 356 049 451 6 103 308 6 113 037
PB 292 6 020 454 6 022 004 710 6 068 1372 6 202 002
Small taxa biomass (mgDM m22) 175 6 32 353 6 71 003 4 6 3 297 6 123 002
Small taxa production (mgDM m22 yr21) 812 6 180 1447 6 231 004 75 6 49 202 6 65 003
Small taxa PB 487 6 052 560 6 056 066 2544 6 378 2046 6 470 045
Detmer et al Predators affect food webs
4
shows varied responses of diversity to fish predation (eg Car-
lisle and Hawkins 1998 Knapp et al 2001 Schilling et al
2009) the basis for statistical testing is the null hypothesis
ie no effect of fish predation on diversity Alpha diversity
(diversity for individual lakes) was compared between lake cat-
egories with Studentrsquos t-test Beta diversity (diversity for all
lakes of a given category) was quantified with the Sorensen
Similarity Index (Sorensen 1948) Similarity values were aver-
aged for each pairwise category (fishless-fishless fishless-fish
and fish-fish) and groups were compared with a Tukey-Kramer
HSD test
A Studentrsquos t-test was used to test the hypotheses that
mean annual benthic invertebrate body mass end of grow-
ing season biomass and annual production were higher in
the absence of fish because of predation The same test was
used for the hypothesis that production of small invertebrate
taxa is greater in the presence of fish because elimination of
large invertebrates by fish reduces competition (eg food
availability) for small invertebrates The Studentrsquos t-test also
was used to test similar hypotheses for zooplankton For all
contrasts data were log transformed prior to analysis when
variances for the groups were not equal
Results
None of the abiotic measurements differed between lakes
with and without fish over the growing season (pgt005) and
no interaction for time was found for any abiotic variables
(pgt005) Mean annual phytoplankton Chl a concentrations
did not differ statistically between lakes with fish (26 6 08
lg L21) and without fish (17 6 04 lg L21) over the growing
season (repeated measures ANOVA data log transformed
F(110) 5 158 p 5 024) The quantity of periphyton Chl a
also did not differ between lakes with (57 6 11 lg cm22)
and without fish (54 6 07 lg cm22 repeated measures
ANOVA F(110) 5 008 p 5 078)
Forty-eight benthic invertebrate taxa and 36 zooplankton
taxa were collected in the 12 lakes Mean taxonomic richness
(number of taxa) and Shannon Diversity Index were not sig-
nificantly different for benthic invertebrates and zooplank-
ton in the two lake categories (Table 2) Mean annual
individual body mass and community biomass for benthic
invertebrates and zooplankton were lower in lakes contain-
ing fish than in lakes without fish (Table 2) Despite signifi-
cant differences in community biomass production of
benthic invertebrate and zooplankton did not differ between
Mea
n B
ody
Mas
s m
g
0
01
02
03
04
Jul Aug Sep Oct Jul Aug Sep Oct
Em
erge
nce
0
200
400
600
800
Em
erge
nce
Bio
mas
s m
g m
2B
iom
ass
mg
m2
Lakes without fish
Small
Large
Small
Large
Lakes with fish
Fig 2 Mean dry body mass (6 SE) of individual benthic invertebrates for lakes with and without fish (gray area indicates peak emergence of S occi-dentalis) Mean (6 SE) monthly benthic invertebrate dry biomass per unit area for lakes without and with fish (gray area indicates peak emergence of
S occidentalis)
Detmer et al Predators affect food webs
5
lake categories because of (1) higher PB ratio in lakes with
fish than lakes without fish and (2) higher biomass of small
invertebrates in lakes with fish (Table 2)
Benthic invertebrates
Sorensen similarity was slightly but significantly lower
among lakes without fish (054 6 003) than among lakes
with fish (067 6 002 plt001) Several taxa were present in
all or nearly all lakes Chironomids Mollusca (Pisidium sp)
Hemiptera (Corisella sp) oligochaetes ostracods trombidi-
forms and Trichoptera (Limnephilus) Twenty-two taxa
including six odonate genera and four beetle genera were
present in fishless lakes and absent in lakes with fish but
most of these were present in only one or two lakes All taxa
in lakes with fish were also found in lakes without fish
Mean benthic invertebrate body size was much lower in
lakes with fish for the majority of the growing season (Fig 2
July September and October plt005) but not so in August
following emergence of Siphlonurus Siphlonurus and
Psychoglypha were smaller in lakes with fish (Table 3) because
of the low abundance of late instar individuals in lakes with
fish
Invertebrate biomass in lakes without fish reached a post
emergence plateau in SeptemberndashOctober similar to the pre-
emergence plateau in July (Fig 2) Invertebrate biomass in
lakes containing fish increased slightly from July to Septem-
ber without any detectable emergence suppression probably
because of temporally dispersed emergence of dominant taxa
and the near absence of Siphlonurus
Fish suppressed the biomass of caddisfly taxa over the
growing season One taxon (Hesperophylax) however showed
low suppression during the growing season but was greatly
suppressed in lakes with fish just after ice out when its mean
body size was greatest
Four of the five largest abundant benthic invertebrate
taxa were greatly suppressed in biomass per unit area by fish
(Table 3) No small taxa (taxa with a mean annual body
sizelt01 mg) differed significantly in biomass per unit area
Table 3 Annual mean dry body mass and population biomass in order of decreasing size for individuals of the most abundant ben-thic invertebrate taxa in lakes with and without fish (mean 6 SE) Significant differences between lake categories for mean annual drybody mass are shown in the first column In the last column significance of biomass differences is shown for the end of the growingseason (September and October pooled)
Taxonomic group
Mean body mass
(mg individual21)
Population biomass (mgDM m22)
July August September October p
Lakes without fish
Limnephilus1 898 6 200 100 6 47 89 6 41 68 6 27 80 6 21 lt001
Siphlonurus occidentalis2 713 6 229 282 6 119 58 6 26 202 6 69 331 6 105 lt001
Ameletus velox2 486 6 051 6 6 5 32 6 22 75 6 52 79 6 56 004
Hesperophylax sp1 385 6 080 117 6 58 25 6 25 3 6 2 11 6 11 072
Psychoglypha subborealis1 170 6 052 0 6 0 0 6 0 18 6 13 37 6 32 005
Amphiagrion abbreviatum3 083 6 024 7 6 4 15 6 9 53 6 38 18 6 13 012
Callibaetis ferrugineus2 054 6 017 43 6 29 26 6 17 48 6 32 37 6 23 032
Chironomidae4 007 6 002 120 6 41 137 6 43 218 6 47 197 6 40 025
Ostracoda 007 6 002 21 6 17 8 6 5 20 6 16 19 6 15 071
Pisidium sp5 002 6 001 14 6 6 10 6 5 37 6 28 26 6 16 020
Oligochaeta 001 6 001 16 6 13 16 6 7 21 6 12 12 6 4 013
Lakes with fish
Limnephilus1 851 6 404 8 6 5 9 6 9 6 6 5 1 6 1
Siphlonurus occidentalis2 108 6 005 8 6 6 0 6 0 1 6 1 0 6 0
Ameletus velox2 - 6 - 0 6 0 0 6 0 0 6 0 0 6 0
Hesperophylax sp1 353 6 108 24 6 14 28 6 16 4 6 2 4 6 2
Psychoglypha subborealis1 085 6 017 0 6 0 1 6 1 3 6 2 4 6 2
Amphiagrion abbreviatum3 - 6 - 0 6 0 0 6 0 0 6 0 0 6 0
Callibaetis ferrugineus2 083 6 - 8 6 8 7 6 7 21 6 21 17 6 17
Chironomidae4 005 6 002 144 6 46 206 6 70 332 6 92 237 6 69
Ostracoda 009 6 002 26 6 16 32 6 19 52 6 49 7 6 5
Pisidium sp5 003 6 001 24 6 21 19 6 11 59 6 30 86 6 55
Oligochaeta 002 6 001 21 6 7 19 6 12 43 6 14 51 6 23
1Trichoptera 2Ephemeroptera 3Odonata 4Diptera 5Veneroida
plt005
Detmer et al Predators affect food webs
6
between lake categories Collectively however the biomass
of small taxa was more variable (Levene test p 5 004) and
much greater in lakes with fish than lakes without fish
(Table 2) Siphlonurus had highest mean annual biomass in
lakes without fish (Table 3 25 of mean annual benthic
invertebrate biomass) Chironomids contributed proportion-
ately more to the benthic invertebrate biomass of lakes with
fish (58 6 8) than without fish (24 6 5 plt001)
For the two largest abundant taxa S occidentalis and Limne-
philus lakes with fish hadlt10 of the production that
occurred in lakes without fish (Table 4) Collectively the pro-
duction of small taxa was greater in lakes with fish than in
lakes without fish (Table 2 p5 004) and contributed propor-
tionately more to benthic invertebrate production of lakes with
fish (84 6 9) than lakes without fish (49 6 7 p5 002)
Small benthic invertebrates (taxa with mean annual body
sizelt1 mg) accounted for a higher proportion of production
in lakes with fish than in lakes without fish (Fig 3A) In
lakes with fish because few large bodied taxa survived to
late instars production was skewed toward small organisms
In lakes without fish production was more evenly distribut-
ed across size classes
Pro
duct
ion
mg
DM
m-2 y
r-1
0
250
500
750
1000
1250No Fish Fish
Benthic Invertebrates
Zooplankton
lt 01 01-1 1-10 gt 10 lt 01 01-1 1-10 gt 10
Mean dry body mass
Pro
duct
ion
μg D
M m
-2 y
r-1
0
50
100
150
200
250
300
Sm
all
Larg
e
Sm
all
Larg
e
Fig 3 Production for size classes of benthic invertebrates (mg) and zooplankton (lg) in lakes with and without fish
Table 4 Annual production in decreasing order of body massfor dominant benthic invertebrate taxa in lakes with and with-out fish (mg DM m22 yr21 mean 6 SE plt005)
Taxonomic
group
Lakes
without fish
Lakes
with fish p
Limnephilus 159 6 31 14 6 13 lt001
Siphlonurus occidentalis 249 6 87 5 6 3 004
Ameletus velox 63 6 40 0 6 0 017
Hesperophylax sp 73 6 37 49 6 18 058
Psychoglypha subborealis 18 6 12 1 6 1 022
Amphiagrion abbreviatum 56 6 36 0 6 0 018
Callibaetis ferrugineus 122 6 78 45 6 45 042
Chironomidae 754 6 165 976 6 277 051
Ostracoda 34 6 19 88 6 60 042
Pisidium sp 96 6 35 163 6 72 044
Oligochaeta 100 6 26 127 6 38 057
Total production 1871 6 280 1544 6 356 049
plt005
Detmer et al Predators affect food webs
7
Zooplankton
The Sorensen similarity index did not differ significantly
between lakes without fish (062 6 005) and with fish
(054 6 003) Several taxa were present in all or most of the
lakes Diaptomus sp Chydorus sphaericus Conochilus sp Diac-
yclops sp Epischura sp and Keratella cochlearis C trivittatus
a large predaceous dipteran was present in two lakes with-
out fish and in no lakes with fish Although some taxa were
found only in a single lake with fish no taxa were present in
two or more lakes with fish that were not also present in
lakes without fish
In lakes without fish mean zooplankton body size
increased during the growing season but in lakes with fish it
remained constant (Fig 4) The body size of taxa did not dif-
fer between lakes with and without fish except for two of
the largest taxa Diaptomus sp and Daphnia middendorffiana
(Table 5) These species were smaller in lakes with fish
where large individuals were rare
Lakes with and without fish had similarly low zooplank-
ton biomass per unit area at the start of the growing season
Zooplankton biomass per unit area increased in lakes with-
out fish from July to September In lakes with fish zooplank-
ton biomass per unit area also increased from July to
September but at a lower rate (Fig 4)
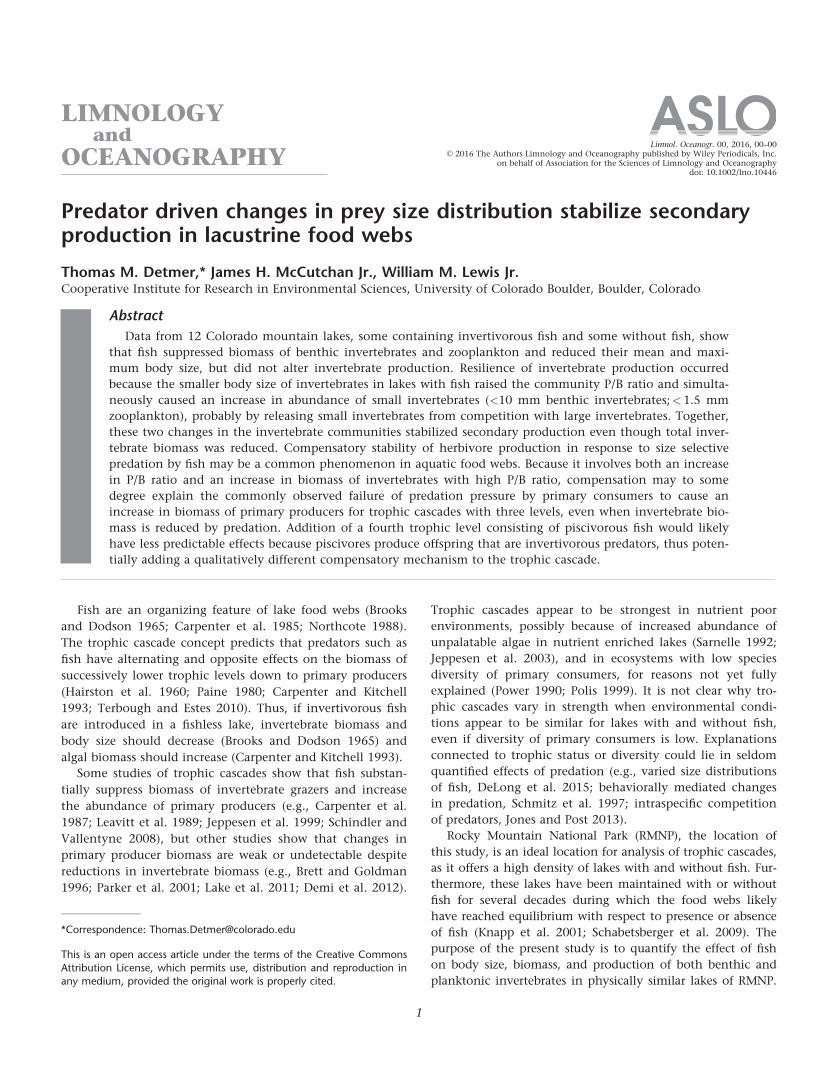
Two of the three abundant large zooplankton Diaptomus
sp and D middendorffiana were very abundant in lakes
without fish but undetected or rare in lakes with fish (Table
5) C trivittatus was moderately abundant in two lakes with-
out fish but absent from all lakes with fish Diacyclops sp a
small copepod and the small Daphnia rosea had low abun-
dance in lakes without fish but moderate abundance in lakes
with fish Holopedium gibberum which showed similar abun-
dance in lakes with and without fish contributed a higher
proportion of total biomass in lakes with fish Small taxa
(lt1 lg) were collectively much more abundant (nearly 7x)
in lakes with fish than in lakes without fish (Table 2)
Although total zooplankton production did not differ
between lakes with and without fish the ratio of production
by large zooplankton to production by small zooplankton did
(Fig 3B) The majority of zooplankton production occurred in
0
1
2
3
4
5
Jul Aug Sep Oct Jul Aug Sep Oct
Mea
n B
ody
Mas
s μ
g
0
50
100
Bio
mas
s m
g m
2B
iom
ass
mg
m2
Lakes without fish
Large
Small
Large
Small
Lakes with fish
Fig 4 Mean dry body mass (6 SE) of individual zooplankton for lakes with and without fish Mean (6 SE) monthly zooplankton dry biomass perunit area for lakes without and with fish
Detmer et al Predators affect food webs
8
small zooplankton for lakes with fish and in large zooplank-
ton for lakes without fish (Table 6)
Discussion
The present study shows as have other studies that
invertivorous fish change the composition and reduce the
biomass of invertebrate communities in lakes through size
selective removal of large invertebrates (eg Carlisle and
Hawkins 1998 Knapp et al 2001 Parker and Schindler 2006
Schilling et al 2009) The present study also shows for two
types of communities (benthos zooplankton) that second-
ary production of invertebrates can remain constant even
though invertebrate biomass is suppressed by the presence of
fish Homeostatic secondary production in trophic cascades
also has been shown in one study of benthic invertebrates
(Northington et al 2010) and one study of zooplankton
(Tronstad et al 2011)
The mechanism for stability of invertebrate production in
response to fish predation as documented here consists of two
interacting factors First invertivorous fish feed selectively on
large invertebrates leading to dominance of small inverte-
brates Second small invertebrates become more abundant in
the absence of large invertebrates which suggests that they
respond to release from competition when large invertebrates are
removed (Figs 2 4) Greater abundance of small invertebrates in
the absence of large invertebrates may be a general feature
of foodwebs as it is documented also for terrestrial vertebrates
(eg Palmer et al 2015) In lakes of RMNP the increased domi-
nance of small invertebrates causes a compensatory response of
secondary production through an increase in community PB
ratio (Banse and Mosher 1980 Schwinghamer et al 1986) and
an increase in abundance of small invertebrates that augments
Table 5 Annual mean dry body mass and biomass in order of decreasing size for individuals of the most abundant zooplanktontaxa in lakes with and without fish (mean 6 SE) Significant differences between lake categories for mean annual dry body mass areshown in the first column In the last column biomass differences are shown for the end of the growing season (September andOctober pooled)
Mean body mass
(lg individual21)
Population biomass (mg m22)
pJuly August September October
Lakes without fish
Daphnia middendorffiana 1040 6 261 27 6 13 335 6 303 265 6 174 252 6 181 003
Holopedium gibberum 555 6 061 10 6 03 37 6 37 104 6 101 49 6 49 044
Diaptomus sp 505 6 064 95 6 36 280 6 89 670 6 341 359 6 158 001
Daphnia rosea 115 6 022 21 6 15 36 6 22 14 6 05 12 6 06 007
Diacyclops sp 048 6 012 01 6 00 01 6 01 01 6 00 00 6 00 004
Epischura sp 035 6 006 03 6 02 05 6 03 02 6 01 01 6 01 008
Collotheca sp 021 6 005 01 6 01 126 6 125 01 6 00 00 6 00 033
Conochilus sp 007 6 003 00 6 00 04 6 02 00 6 00 00 6 00 009
Lakes with fish
Daphnia middendorffiana 412 6 020 54 6 54 00 6 00 01 6 01 00 6 00
Holopedium gibberum 746 6 241 05 6 04 58 6 38 265 6 214 86 6 81
Diaptomus sp 282 6 066 01 6 01 11 6 08 10 6 10 15 6 15
Daphnia rosea 099 6 010 59 6 37 87 6 77 145 6 90 159 6 108
Diacyclops sp 052 6 019 64 6 41 165 6 105 24 6 17 36 6 27
Epischura sp 032 6 008 10 6 05 04 6 02 79 6 51 78 6 48
Collotheca sp 018 6 006 03 6 02 01 6 01 01 6 01 01 6 01
Conochilus sp 008 6 003 00 6 00 34 6 34 59 6 39 46 6 33
plt005
Table 6 Annual production of the most abundant zooplank-ton taxa for lakes without and with fish (mg DM m22 yr21mean 6 SE plt005)
Taxonomic group
Lakes
without fish
Lakes
with fish p
Daphnia middendorffiana 102 6 42 2 6 2 lt001
Holopedium gibberum 43 6 43 97 6 64 030
Diaptomus sp 164 6 42 7 6 4 lt001
Daphnia rosea 21 6 11 61 6 35 029
Diacyclops sp 2 6 1 38 6 15 001
Epischura sp 5 6 2 16 6 8 021
Collotheca sp 46 6 44 4 6 3 039
Conochilus sp 4 6 2 32 6 20 021
Total production 451 6 103 308 6 113 037
plt005
Detmer et al Predators affect food webs
9
invertebrate production through partial restoration of biomass
lost to selective predation loss of large invertebrates
Evidence from RMNP lakes for compensatory response
that suppresses the inverse cascade relationships of primary
consumers and primary producers suggests that the cascade
model proposed by Carpenter et al (1985) here referred to
as the Static Size Distribution (SSD) Model would be
enhanced by incorporation of changes in community PB
and increase in abundance of small invertebrates in response
to removal of large invertebrates
When applied to lakes with three trophic levels the SSD
Model which does not take compensatory mechanisms into
account predicts that at the lowest abundances for invertiv-
orous fish invertebrate biomass will be high and biomass of
primary producers will be suppressed by invertebrate herbi-
vores (Fig 5) Increasing biomass of invertivorous fish which
causes increased predation on invertebrates is matched in a
uniform way by decreasing specific growth rate of invertivo-
rous fish reflecting suppression of invertebrate abundance
caused by predation Production of the invertivorous fish
population (Pf) is calculated as the product of biomass and
growth rate Pf 5 Bf gf The calculation produces a yield (pro-
duction) curve for Pf that shows initial increase in produc-
tion leading to peak yield followed by overharvesting
which suppresses invertebrate biomass and production
Depression of invertebrate biomass through the cascade
causes an increase in algal biomass through reduced grazing
intensity Primary producers move toward a peak biomass
that reflects limiting nutrient concentrations or reduced
availability of PAR irradiance at high biomass Net primary
production progressively increases as removal of biomass by
herbivores declines
When modified by the inclusion of body size leading to
compensatory change in community PB and increase in
abundance of small invertebrates when large invertebrates
are removed the SSD Model becomes a Compensatory Size
Distribution Model (CSD Model Fig 5) As invertivorous fish
become more abundant increase in invertebrate PB ratio
Invertivorouspredators
Invertebrateherbivores
Algae
Bio
mas
sG
row
th ra
tePr
oduc
tion
Invertebrate herbivores
Body
siz
e
Bio
mas
sG
row
th ra
tePr
oduc
tion
Gro
wth
rate
Gro
wth
rate
Body
siz
e
Predator abundance
Algae Invertebrate herbivores
Predator abundance Predator abundance Predator abundance
Predator abundance Predator abundance Predator abundance Predator abundance
Invertivorouspredators
Invertebrateherbivores
Static Size Distribution Model
Compensatory Size Distribution Model
Fig 5 Comparison of a three-level trophic cascade based on a Static Size Distribution Model for invertebrate herbivores (redrawn from Carpenteret al 1985) with a Compensatory Size Distribution Model that includes a shift toward smaller invertebrates and an increase in numeric abundance ofinvertebrates All graphs show biomass (B) and instantaneous growth rate (g) production is calculated as P 5 Bg Factors that would govern the abun-
dance of invertivorous predators (variation along the x axis) are not specified but could include a fourth trophic level or other factors
Detmer et al Predators affect food webs
10
and increase in abundance of small invertebrates progressive-
ly compensate invertebrate production for reduction in total
biomass of invertebrates caused by selective removal of large
invertebrates A decline in biomass occurs however even
though biomass reduction through loss of large invertebrates
is partially offset by increase in small invertebrates These
changes suppress the response of invertebrate production
and biomass to increasing fish abundance In addition stable
invertebrate production stabilizes production of algae by
removal of algae biomass at a steady rate corresponding to
invertebrate production At the highest intensities of preda-
tion however efficiency of fish in consuming invertebrates
is impaired because of constraints involving physical limita-
tions of fish in consuming the smallest invertebrates (eg
gillraker spacing weak capacity for capture of infauna etc)
Fish biomass remains high but fish production (growth)
declines Invertebrate biomass persists in reduced amounts
through increasing dominance of the smallest least vulnera-
ble taxa Because grazers persist even at the highest levels of
predation grazing by invertebrates contributes to suppres-
sion of algal biomass even though abundance of invertebrate
predators is high
The CSD Model shows how compensation for predation by
invertebrates can disrupt a trophic cascade through mecha-
nisms that are documented for RMNP lakes Degrees of disrup-
tion weaker than observed in RMNP may be possible as may
cascades that show negligible compensation ie as predicted
by the SSD Model Whether most lakes show SSD cascades or
CSD cascades is not clear but some CSD compensation seems
inevitable for three trophic levels in large lakes because inver-
tivorous fish are size selective (Carpenter et al 1985)
Cascades with four trophic levels also could be derived by
addition of piscivores to SSD and CSD models with three tro-
phic levels In fact the SSD Model as presented by Carpenter
et al (1985) assumes linear suppression of invertivorous fish
by hypothetically increasing biomass of piscivores which
reverses all of the cascade responses that would apply in the
absence of piscivores Figure 5 assumes no piscivory reflecting
conditions in RMNP lakes Cascades involving piscivorous fish
are qualitatively different than those involving only invertivo-
rous fish in that piscivores (level 4) continually reinforce the
third trophic level through reproductive output of young fish
which are invertivorous (level 3) during early development
The extent to which invertivorous predation is compensated
by this mechanism is not well documented however For
example Post et al (1992) showed for Lake Mendota MN
that invertivory was only modestly reinforced by offspring of
piscivores but they cite literature showing that the typical
reinforcement effect is larger in most lakes than it was in
Lake Mendota at the time of their study The interpretation
of piscivory through SSD and CSD Models is still unclear
Further studies may focus more explicitly on compensatory
mechanisms which will clarify their overall significance The
potential for compensatory mechanisms does show however
that cascade structure is a weaker a priori predictor of cascade
dynamics than it seemed to be originally (Carpenter et al
1985) Compensatory mechanisms may also explain along
with other factors such as those modeled by DeLong et al
(2015 body size) or Gilbert et al (2014 temperature) why
empirical studies often fail to follow predictions of the SSD
Model for trophic cascades (Brett and Goldman 1996)
While community characteristics dictate the significance
of predation to invertebrate size distribution and abundance
a few species show anomalous responses to size selective pre-
dation In the present study H gibberum did not respond to
size selective predation (see also Carpenter and Kitchell
1993 Carlisle and Hawkins 1998 Drouin et al 2009) The
large gelatinous mantle of this species (approximately 60
longer than the body length excluding the mantle) may
reduce vulnerability of Holopedium to fish predation because
the mantle is transparent body length of Holopedium with-
out the mantle (mantle length 5 088 6 003 mm n 5 166) is
below the size range suppressed by fish in this study The vis-
ible (non-gelatinous) portion of Holopedium while below the
consumption threshold for invertivorous fish also would
physically impede predation by smaller predators because of
the large mantle (juvenile fish invertebrate carnivores) H
gibberum also may be resistant to predation by fish because
the gelatinous mantle is distasteful to fish (McNaught 1978
Balcer et al 1984)
Developmental changes in body size also preclude bina-
ry classification of all taxa as either vulnerable or not vul-
nerable to fish predation Small body size of S occidentalis
and Psychoglypha sp in lakes with fish is explained by selec-
tive elimination of late instars Among pelagic taxa D mid-
dendorffiana and Diaptomus sp showed a pattern similar to
that of Siphlonurus and Psychoglypha in that small individu-
als are much less vulnerable to fish predation than large
individuals
Conclusions
Because fish are size selective predators invertebrate com-
munities subject to increasing degrees of fish predation often
will show a reduction in PB ratio and increased abundance
of small taxa and thereby will have some degree of resil-
ience in production in response to fish predation This ten-
dency can be reinforced by compensatory increase in
abundance of small invertebrates when large invertebrates
are removed by predation as shown in both zooplankton
and invertebrate communities of RMNP lakes Changes in P
B ratio and abundance of small primary consumers are likely
to affect trophic cascades generally and may explain wholly
or in part why cascade responses to presence of invertivo-
rous fish often are inconsistent with the SSD Model for tro-
phic cascades Because juvenile piscivores are likely to be
invertivorous yet another type of compensatory effect
caused by negative feedback affecting primary consumers
Detmer et al Predators affect food webs
11
may disrupt cascades that involve piscivorous fish Recogni-
tion of compensatory effects in general will clarify the
dynamics of trophic cascades
References
Balcer M D N L Korda and S I Dodson 1984 Zooplank-
ton of the great lakes Univ of Wisconsin Press
Banse K and S Mosher 1980 Adult body mass and annual
productionbiomass relationships of field populations
Ecol Monogr 50 355ndash379 doi1023072937256
Baron J S T M Schmidt and M D Hartman 2009 Climate-
induced changes in high elevation stream dynamics Glob
Change Biol 15 1777ndash1789 doi10111j1365-2486200901847x
Baumgartner D and K O Rothaupt 2003 Predictive
length-dry mass regressions for freshwater invertebrates in
a pre-alpine lake littoral Int Rev Hydrobiol 88 453ndash
463 doi101002iroh200310632
Benke A C A D Huryn L A Smock and J B Wallace
1999 Length-mass relationships for freshwater macroin-
vertebrates in North America with particular reference to
the southeastern United States J North Am Benthol
Soc 18 308ndash343 doi1023071468447
Benke A C and A D Huryn 2006 Secondary production of
macroinvertebrates p 691ndash710 In F R Hauer and DG
Lamberti [eds] Methods in stream ecology 2nd ed Elsevier
Black A R and S I Dodson 2003 Ethanol A better preser-
vation technique for Daphnia Limnol Oceanogr Meth-
ods 1 45ndash50 doi104319lom2003145
Brett M T and C R Goldman 1996 A meta-analysis of
the freshwater trophic cascade Proc Natl Acad Sci USA
93 7723ndash7726 doi101073pnas93157723
Brooks J L and S I Dodson 1965 Predation body size
and composition of plankton Science 150 28ndash35 doi
101126science150369228
Carlisle D M and C P Hawkins 1998 Relationships
between invertebrate assemblage structure 2 trout species
and habitat structure in Utah mountain lakes J North
Am Benthol Soc 17 286ndash300 doi1023071468332
Carpenter S R J F Kitchell and J R Hodgson 1985 Cas-
cading trophic interaction and lake ecosystem productivi-
ty Bioscience 35 635ndash639 doi1023071309989
Carpenter S R and others 1987 Regulation of lake prima-
ry productivity by food web structure Ecology 68 1863ndash
1876 doi1023071939878
Carpenter S R and J F Kitchell [eds] 1993 The trophic
cascade in lakes Cambridge Univ Press
Davi M L 1993 Determination of nitrate in surface waters
by ion exchange chromatography after oxidation of total
organic nitrogen to nitrate J Chromatogr 644 345ndash348
doi1010160021-9673(93)80718-N
DeLong J P and others 2015 The body size dependence
of trophic cascades Am Nat 185 354ndash366 doi101086
679735
Demi L M K S Simon S M Coghlan R Sanders and
D Anderson 2012 Anadromous alewife in linked lake-
stream ecosystems Do trophic interactions in lakes influ-
ence stream invertebrate communities Freshw Sci 31
978ndash985 doi10189911-1241
Drouin A P Sirois and P Archambault 2009 Discriminating
zooplankton communities in lakes with brook trout (Salveli-
nus fontinalis) and in fishless lakes Ecoscience 16 271ndash281
doi10298016-3-3152
Dumont H J and G Balvay 1979 The dry weight estimate
of Chaoborus flavicans (Meigen) as a function of length
and instars Hydrobiologia 64 139ndash145 doi101007
BF00023189
EPA Great Lakes National Office 2003 Standard operating
procedure for zooplankton analysis US Environmental
Protection Agency
Gilbert B and others 2014 A bioenergetic framework for
the temperature dependence of trophic interactions Ecol
Lett 17 902ndash914 doi101111ele12307
Gillespie D M D L Stites and A C Benke 1985 An inex-
pensive core sampler for use in sandy substrate Freshw
Inv Biol 5 147ndash151 doi101007BF01704665
Hairston N G F E Smith and L B Slobodkin 1960 Com-
munity structure population control and competition
Am Nat 94 421ndash425 doi1086282146
Hauer F R and A C Benke 1987 Influence of temperature
and river hydrograph on black fly growth rates in a sub-
tropical blackwater river J North Am Benthol Soc 6
251ndash261 doi1023071467312
Hessler R R and H L Sanders 1967 Faunal diversity in the
deep sea Deep-Sea Res 14 65ndash78 doi1010160011-
7471(67)90029-0
Huryn A D and J B Wallace 1986 A method for obtaining
in situ growth rates of larval Chironomidae (Diptera) and
its application to studies of secondary production Limnol
Oceanogr 31 216ndash222 doi104319lo19863110216
Jeppesen E T L Lauridsen S F Mitchell K Christoffersen
and C W Burns 1999 Trophic structure in the pelagial
of 25 shallow New Zealand lakes Changes along nutrient
and fish gradients J Plankton Res 22 951ndash968 doi
101093plankt225951
Jeppesen E and others 2003 The impact of nutrient state
and lake depth on top-down control in the pelagic zone
of lakes A study of 466 lakes from the temperate zone
to the Arctic Ecosystems 6 313ndash325 doi101007
PL0021503
Johnston T A and R A Cunjak 1999 Dry mass-length
relationships for benthic insects A review with new data
from Catamaran Brook New Brunswick Canada Freshw
Biol 41 653ndash674 doi101046j1365-2427199900400x
Jones A W and D M Post 2013 Consumer interaction
strength may limit the diversifying effect of intraspecific
competition A test in alewife (Alosa pseudoharengus) Am
Nat 181 815ndash826 doi101086670197
Detmer et al Predators affect food webs
12
Knapp R A K R Matthews and O Sarnelle 2001 Resis-
tance and resilience of alpine lake fauna to fish introduc-
tions Ecol Monogr 71 401ndash421 doi1018900012-
9615(2001)071[0401RAROAL]20CO2
Knapp R A C P Hawkins J Ladau and J G McClory
2005 Fauna of Yosemite National Park lakes has low resis-
tance but high resilience to fish introductions Ecol Appl
15 835ndash847 doi10189004-0619
Lake B A C R Wigdahl K E Strock J E Saros and A
Amirbahman 2011 Multi-proxy paleolimnological assess-
ment of biogeochemical versus food web controls on the
trophic states of two shallow mesotrophic lakes J Paleo-
limnol 46 45ndash57 doi101007s10933-011-9513-1
Langner C L and P F Hendrix 1982 Evaluation of persul-
fate digestion method for particulate nitrogen and phos-
phorus Water Res 16 1451ndash1454 doi1010160043-
1354(82)90243-3
Leavitt P R S R Carpenter and J F Kitchell 1989
Whole-lake experiments The annual record of fossil pig-
ments and zooplankton Limnol Oceanogr 34 700ndash717
doi104319lo19893440700
Lewis W M 1979 Zooplankton community analysis Stud-
ies on a tropical system Springer-Verlag
Lewis W M and M C Grant 1980 Acid precipitation in
the Western United States Science 206 176ndash177 doi
101126science2074427176
Lewis W M and J H McCutchan 2010 Ecological
responses to nutrients in streams and rivers of the Colora-
do mountains and foothills Freshw Biol 55 1973ndash1983
doi101111j1365-2427201002431x
Makarewicz J A and G L Likens 1979 Structure and function
of the zooplankton community of Mirror Lake New Hamp-
shire Ecol Monogr 49 109ndash127 doi1023071942575
Marker A F E A Nusch H Rai and B Reimann 1980
The measurements of photosynthetic pigments in fresh-
waters and standardization of methods Conclusions and
recommendations Arch Hydrobiol 14 91ndash106
McCutchan J H and W M Lewis 2002 Relative impor-
tance of carbon sources for macroinvertebrates in a Rocky
Mountain Stream Limnol Oceanogr 47 742ndash752 doi
104319lo20024730742
McNaught D C 1978 Spatial heterogeneity and niche dif-
ferentiation in zooplankton of Lake Huron Verh Inter-
nat Verein Limnol 20 341ndash346
Merritt RW KW Cummins and MB Berg [eds] 2008
An introduction to aquatic insects of North America 4th
ed KendallHunt Publishing Company
Miserendino M L 2001 Length-mass relationships for
macroinvertebrates in freshwater environments of Patago-
nia (Argentina) Ecol austral 11 3ndash8
Murphy J and J P Riley 1962 A modified single solution
method for the determination of phosphate in natural
waters Anal Chim Acta 27 31ndash36 doi101016S0003-
2670(00)88444-5
Northcote T G 1988 Fish in the structure and function of
freshwater ecosystems A ldquotop-downrdquo view Can J Fish
Aquat Sci 45 2347ndash2360 doi101139f88-044
Northington R M M D Keyse S R Beaty S C Whalen
E R Sokol and A E Hershey 2010 Benthic secondary
production in eight oligotrophic arctic Alaskan lakes J
North Am Benthol Soc 29 465ndash479 doi10189909-
0261
Nusch E A 1980 Comparison of different methods for
chlorophyll and phaeopigment determination Arch
Hydrobiol 14 14ndash36
Paine R T 1980 Food webs Linkage interaction strength
and community infrastructure J Anim Ecol 49 666ndash
685 doi1023074220
Palmer G P A Stephens A I Ward and S G Willis
2015 Nationwide trophic cascades Changes in avian
community structure driven by ungulates Sci Rep 5
15601 doi101038srep15601
Parker B R D W Schindler D B Donald and R S
Anderson 2001 The effects of stocking and removal of a
nonnative salmonid on the plankton of an alpine lake
Ecosystems 4 334ndash345 doi101007s10021-001-0015-2
Parker B R and D W Schindler 2006 Cascading trophic
interactions in an oligotrophic species-poor alpine lake
Ecosystems 9 157ndash166 doi101007s10021-004-0016-z
Pennak R W 1968 Field and experimental winter limnolo-
gy of three Colorado mountain lakes Ecology 49 505ndash
520 doi1023071934117
Pennak R W 1989 Fresh-water invertebrates of the United
States Protozoa to mollusca Wiley
Polis G A 1999 Why are parts of the world green Multiple
factors control productivity and the distribution of bio-
mass Oikos 89 3ndash15 doi1023073546565
Post J R L G Rudstam D M Schael and C Leucke
1992 Pelagic planktivory by larval fishes in Lake Mendota
in food web management p 303ndash317 In J F Kitchell
[ed] Food web management a case study of Lake Men-
dota Springer-Verlag
Power M E 1990 Effects of fish in river food webs Science
250 811ndash814 doi101126science2504982811
Sarnelle O 1992 Nutrient enrichment and grazer effects on
phytoplankton in lakes Ecology 75 551ndash560 doi
1023071940761
Schabetsberger R M Luger G Drozdowski and A Jagsch
2009 Only the small survive Monitoring long-term
changes in the zooplankton community of an alpine lake
after fish introductions Biol Invasions 11 1335ndash1345
doi101007s10530-008-9341-z
Schielke E G E P Palkovacs and D M Post 2011 Eco-
evolutionary feedbacks drive niche differentiation in the
alewife Biol Theory 6 211ndash219 doi101007s13752-012-
0031-9
Schilling E G C S Loftin and A D Huryn 2009 Effects
of introduced fish on macroinvertebrate communities in
Detmer et al Predators affect food webs
13
historically fishless headwater and kettle lakes Biol Con-
serv 142 3030ndash3038 doi101016jbiocon200908003
Schindler D W and J R Vallentyne 2008 Algal bowl
Overfertilization of the worldrsquos freshwaters and estuaries
Univ of Alberta Press
Schmitz O J A P Beckerman and K M OrsquoBrien 1997
Behaviorally mediated trophic cascades Effects of preda-
tion risk on food web interactions Ecology 78 1388ndash1399
doi1018900012-9658(1997)078[1388BMTCEO]20CO2
Schwinghamer P B Hargrave D Peer and C M Hawkins
1986 Partitioning of production and respiration among
size groups of organisms in an intertidal benthic commu-
nity Mar Ecol 31 131ndash142 doi103354meps031131
Shannon C E and W Weaver 1948 A mathematical theo-
ry of communication Bell Syst Tech J 27 379ndash423 and
623ndash656 doi101002j1538-73051948tb01338x
Shuter B J and K K Ing 1997 Factors affecting the pro-
duction of zooplankton in lakes Can J Fish Aquat Sci
54 359ndash377 doi101139f96-270
Sorensen T 1948 A method of establishing groups of equal
amplitude in plant sociology based on similarity of spe-
cies content Kongelige Danske Videnskabernes Selskab 5
1ndash34
Stemberger R S 1979 A guide to rotifers of the Laurentian
great lakes US Environmental Protection Agency
Terbough J and J A Estes 2010 Trophic cascades Preda-
tors prey and the changing dynamics of nature Island
Press
Thorp J H and A P Covich 1991 Ecology and classifica-
tion of North American freshwater invertebrates Academ-
ic Press
Tronstad L M R O Hall T M Koel and K G Gerow
2011 Introduced lake trout produced a four level trophic
cascade in Yellowstone Lake Trans Am Fish Soc 135
1536ndash1550 doi101577T09-1511
Valderrama J C 1981 The simultaneous analysis of total
nitrogen and total phosphorus in natural water Mar
Chem 10 109ndash122 doi1010160304-4203(81)90027-X
Walters C J and R E Vincent 1973 Potential productivity
of an alpine lake as indicated by removal and reintroduc-
tion of fish Trans Am Fish Soc 102 675ndash697 doi
1015771548-8659(1973)102lt675PPOAALgt20CO2
Conflict of Interest
None declared
Submitted 01 February 2016
Revised 26 May 2016
Accepted 12 August 2016
Associate editor Robert Sterner
Detmer et al Predators affect food webs
14

The fish of interest here are trout (Oncorhynchus clarkii and
Salvelinus fontinalis) no other fish were present Given that
fish can suppress the mean size of invertebrates in lakes
(Schielke et al 2011 Jones and Post 2013 DeLong et al
2015) one hypothesis is that fish cause reductions in mean
body size and lower total biomass of invertebrates of the
RMNP lakes A corollary hypothesis which is the main basis
of this study is that fish do not suppress invertebrate produc-
tion in lakes to the extent that they suppress biomass Differ-
ential response of invertebrate biomass and production may
to some extent explain why suppression of invertivorous fish
by piscivores does not consistently suppress biomass of prima-
ry producers in lakes
Methods
The study area is the headwaters of the North St Vrain Creek
(Wild Basin) of RMNP (Fig 1) Lakes in the study vary in eleva-
tion watershed area and depth but the two groups of lakes
(six without fish six with fish) did not differ significantly in
any of these physical characteristics (pgt005) Relevant
anthropogenic influence on the lakes is limited to nitrogen
enrichment by atmospheric deposition (Lewis and Grant 1980
Baron et al 2009) and introduction of fish to some lakes (Table
1)
Field studies were conducted on the 12 lakes during the
2009ndash2012 ice-free season (JulyndashOctober) All lakes were sam-
pled on multiple dates for at least 1 yr and five lakes were
sampled multiple times in multiple years (Table 1) Samples
were collected three or four times per year from the time of
spring ice melt to onset of ice cover at intervals averaging 31
d (SE 6 41) and again the following spring after ice melt
Records provided by the US Fish and Wildlife Service
indicate that of the six fishless lakes two were never stocked
and four were stocked but became fishless because of inade-
quate spawning habitat The four lakes that were stocked but
are now fishless have not contained fish for at least 30 yr
and therefore likely show no residual effects of having been
stocked (Knapp et al 2005)
On each sampling date at each lake temperature Secchi
depth and outlet discharge were measured Two liters of
water were collected just below the surface filtered through
0 2500 50001250 Meters
LegendLakeswithFish_FeatureToPolyg
LakesNoFish_FeatureToPolygon
Lakes with fish Lakes without fish
0 1250 2500 5000 Meters
gennnnnnnnnnnnnnnnnnnnnddddddddddddddddddddLakeswwwwwwwwwwwwwiiiiiiiiiiiiiiittttttttthFFFFFFFFFFFFFFFFiiiiiiiiiiiiiiiisssssssssssssh_____________FeatureeeeeeeeeeeeeeeeTTTTTTTTTTTTTTTToooooooooooooooTTTTTTTTTT PPPPPPPPPPPPPPPPoooooooooooooolllllllyyyyyyyggggggggggg
LakkkkkkkkkkkkkkkkkeeeeeeeeeeeeeeeesssssssssssssssssNNNNNNNNNNNNNNNNNNNoooooooooooooooooooFish________FeatureTTTTTTTTTTTTTTTTTTToTT Polyyyyyggggggonnnnnnnnnnnnn
Fig 1 Study area and lake locations in Rocky Mountain National Park Colorado The bottom left corner of the map is 4016968 latitude and210566588 longitude
Detmer et al Predators affect food webs
2
a Whatman GFC filter and analyzed for dissolved organic
carbon with a TOC analyzer (combustion with catalytic oxi-
dation and nondispersive infrared CO2 analysis) total dis-
solved nitrogen (Valderrama 1981 Davi 1993) total
dissolved phosphorus (Murphy and Riley 1962 Valderrama
1981 Langner and Hendrix 1982) and chlorophyll a (Chl a)
of phytoplankton (Marker et al 1980 Nusch 1980) For each
lake periphyton was collected from four depths (15 cm 30
cm 45 cm and 60 cm) at two or three arbitrarily selected
locations for analysis of Chl a At each lake for each of these
depths periphyton was scraped from a fixed area of the top
surface of two rocks Periphyton chlorophyll was analyzed
by ethanol extraction with sonication followed by spectro-
photometric analysis (Lewis and McCutchan 2010)
Benthic invertebrates were sampled from the littoral zone
which is defined for this study as 0ndash3 m depth rather than
from the entire lake Similarity among lakes in littoral ben-
thic habitat favors inter-lake comparisons whereas offshore
habitat ranges considerably among lakes (eg maximum
depth range is 3ndash17 m)
Large motile epibenthic invertebrates (eg Ephemerop-
tera Hirudinea Odonata) were collected with a benthic sled
similar to the one described by Hessler and Sanders (1967
mesh size 5 250 lm mouth 5 20 cm) A piston corer
(576 cm2) was used to collect infauna (eg Pisidium sp
Chironomidae Oligochaeta Gillespie et al 1985) Both devi-
ces were used at 6ndash12 arbitrarily selected sites around each
lake At each site three sled tows (3 m or more in length
05 m s21) were taken perpendicular to the shoreline
pooled and stored in 70 ethanol and two sediment core
samples were collected pooled and stored in a similar man-
ner All benthic invertebrate samples were taken at
depths3 m within 7 m of shore and at least 50 m from
the inlet or outlet
Benthic invertebrates were separated and identified to the
lowest practicable taxonomic unit (typically genus or species
Thorp and Covich 1991 Merritt et al 2008) For rare taxa all
individuals from each sample were measured with an optical
micrometer For abundant taxa body lengths of at least 100
organisms were measured appendages such as cerci and
antennae were not included in the measurements The rela-
tionship of length (L) to individual dry mass (M) was assumed
to be M 5 aLb where values of constants a and b were taken
from Benke et al (1999) Miserendino (2001) Baumgartner
and Rothaupt (2003) and Johnston and Cunjak (1999)
Zooplankton were sampled from a raft with vertical tows
of a conical zooplankton net (20 cm diameter 53 lm
mesh) from near the bottom to the surface at a rate of about
05 m s21 Filtered volumes for zooplankton samples were
assumed to reflect a filtration efficiency of 50 (Walters and
Vincent 1973 Lewis 1979) One tow was taken at the deep-
est location in the lake and at least three other tows were
taken at arbitrary locations at depths greater than one meter
Samples were fixed in 95 ethanol and transferred to 70
ethanol for storage (Black and Dodson 2003)
Zooplankton samples were concentrated and subsampled
with a Hensen-Stempel pipette Zooplankton were identified
to genus or species according to Pennak (1989) Thorp and
Covich (1991) and Stemberger (1979) and were enumerated
in a 1 mL Sedgewick-Rafter cell or 20 mL modified Bogorov
cell depending on the abundance of the taxon Between 5
and 100 of each sample was evaluated depending on abun-
dance Abundances were corrected for tow depth For rare
taxa all individuals were measured for length for abundant
taxa at least 100 organisms of each taxon were measured for
length Dry mass (DM) was calculated from equations for
crustaceans rotifers and Chaoborus trivittatus (Dumont and
Balvay 1979 EPA Great Lakes National Program Office 2003)
Table 1 Overview of lakes included in the study NF 5 no fish BT 5 brook trout CT 5 cutthroat trout
Fish Elevation Lake area Max depth Mean depth Watershed area Years
Lake Present (m) (ha) (m) (m) (ha) Sampled
Bluebird NF 3341 50 93 34 317 2010 2012
Falcon NF 3377 11 77 25 72 2011
Finch NF 3021 26 26 13 27 2010
Lion Lake 1 NF 3373 18 28 06 325 2009
Lion Lake 2 NF 3469 15 128 43 230 2011 2012
Twin NF 2991 13 26 09 13 2009
Mean 3262 6 83 22 6 06 63 6 18 22 6 06 164 6 59
Box BT 3266 16 93 39 28 2012
L Hutcheson CT 3304 17 76 29 396 2011
Ouzel CT BT 3052 20 27 07 1028 2009
Pear CT 3225 60 168 62 182 2011 2012
Sandbeach CT 3135 48 79 24 67 2011 2012
Thunder CT 3225 59 129 43 321 2009 2010
Mean 3201 6 38 37 6 09 95 6 20 34 6 08 337 6 150
Detmer et al Predators affect food webs
3
For taxa with distinct cohorts that could be followed over
time (eg Siphlonurus occidentalis) production was estimated
for each taxonomic group over each interval between sam-
pling dates by the increment-summation method (Benke and
Huryn 2006) The estimate over the interval between two
sampling dates for a given taxon is P5 N DW
=t where P is
daily production over an interval of t days N is the mean
abundance between two dates spanning the interval and DW
is the change in mean individual mass over the interval for a
taxon Annual production is the summation of P over all days
of the year when growth occurs (growing season)
For taxa without distinct cohorts (eg Chironomidae)
the instantaneous growth method was used to estimate pro-
duction of benthic invertebrates (Benke and Huryn 2006)
The estimate for a particular taxon over an interval of length
t is P5 g B where P is daily production g is daily instanta-
neous growth rate B is the mean interval biomass and t is
the length of the interval (days) Annual production is the
sum of production for each taxon across all intervals in a
growing season
For benthic invertebrates growth rates (g) were estimated
by use of a multiple regression equation that relates growth
rate to body mass and temperature The equation was cali-
brated with data from all sampling intervals for all taxa that
could be followed as cohorts (N 5 83 plt0001 R2 5 028
Huryn and Wallace 1986 Hauer and Benke 1987 McCutchan
and Lewis 2002) The equation is log g 5 222 1 0065 T ndash
019 log m where g is growth rate per day T is the mean tem-
perature for the interval (8C) and m is mean dry mass for the
interval in mg For copepods cladocera and rotifers the mod-
el of Shuter and Ing (1997) was used log P 5 ataxon 1 log
(Bt) 1 0045 Tt 1 06 log (t) where P is production ataxon is a
taxon specific correction Bt is the mean growing season pop-
ulation biomass Tt is the mean growing season temperature
(8C) and t is the growing season length in days
Quantification of P for individual invertebrate taxa based
on field data and standardized equations as conducted for
the present analysis is subject to a high degree of error vari-
ance This defect in computation of P for individual taxa is
offset to some degree for present purposes by pooling of P at
the community level for comparisons of lake categories (fish
no fish) as shown in the results section Also the very large
contrast in composition and size distribution of invertebrates
across lake categories for this study greatly reduces the likeli-
hood that general conclusions based on pooled P values are
qualitatively incorrect
When the water temperature islt48C (NovemberndashJune)
the instantaneous growth rate of freshwater invertebrates is
near zero and sampling for the purpose of measuring produc-
tion is unnecessary (Pennak 1968 Makarewicz and Likens
1979 McCutchan and Lewis 2002) Growing season produc-
tion for zooplankton is here assumed to equal annual zoo-
plankton production (Pennak 1968 Shuter and Ing 1997)
For lakes that were sampled in more than 1 yr body
mass biomass and production of invertebrates chemical
constituents and concentrations of Chl a for phytoplankton
and periphyton did not differ among years (ANOVA
pgt005) Interannual averages were used for lakes that were
sampled in multiple years
Contrasts between lakes with and without fish for chemi-
cal constituents concentrations of phytoplankton and
periphyton and invertebrate biomass were based on a
repeated measures ANOVA test Data were log transformed
for analysis when data violated the assumption of equal vari-
ance and the Greenhouse-Geisser correction was used when
the assumption of sphericity was violated
Data for the two groups of lakes also allow comparisons of
community diversity Diversity was contrasted between the
two groups by mean taxonomic richness and Shannon Diver-
sity Index (Shannon and Weaver 1948) Because the literature
Table 2 Comparisons of mean annual species richness Shannon diversity index individual dry body mass community biomassand community production for lakes with and without fish Individual dry body mass is shown in mg for benthic invertebrates andlg for zooplankton Significant differences between categories are depicted with an asterisk (plt005) Small taxa are those with amean annual body size oflt1 mg for benthic macroinvertebrates andlt1 lg for zooplankton
Benthic invertebrates Zooplankton
Lakes without fish Lakes with fish Lakes without fish Lakes with fish
Metric Mean 6 SE Mean 6 SE p Mean 6 SE Mean 6 SE p
Species richness (n) 18 6 3 14 6 1 017 15 6 1 16 6 2 034
Shannon diversity 149 6 014 108 6 018 009 153 6 011 140 6 016 052
Body size (mgDM lg) 019 6 006 003 6 001 lt001 267 6 057 049 6 047 003
Biomass (mgDM m22) 705 6 72 364 6 76 lt001 71 6 14 41 6 9 004
Production (mgDM m22 yr21) 1871 6 280 1544 6 356 049 451 6 103 308 6 113 037
PB 292 6 020 454 6 022 004 710 6 068 1372 6 202 002
Small taxa biomass (mgDM m22) 175 6 32 353 6 71 003 4 6 3 297 6 123 002
Small taxa production (mgDM m22 yr21) 812 6 180 1447 6 231 004 75 6 49 202 6 65 003
Small taxa PB 487 6 052 560 6 056 066 2544 6 378 2046 6 470 045
Detmer et al Predators affect food webs
4
shows varied responses of diversity to fish predation (eg Car-
lisle and Hawkins 1998 Knapp et al 2001 Schilling et al
2009) the basis for statistical testing is the null hypothesis
ie no effect of fish predation on diversity Alpha diversity
(diversity for individual lakes) was compared between lake cat-
egories with Studentrsquos t-test Beta diversity (diversity for all
lakes of a given category) was quantified with the Sorensen
Similarity Index (Sorensen 1948) Similarity values were aver-
aged for each pairwise category (fishless-fishless fishless-fish
and fish-fish) and groups were compared with a Tukey-Kramer
HSD test
A Studentrsquos t-test was used to test the hypotheses that
mean annual benthic invertebrate body mass end of grow-
ing season biomass and annual production were higher in
the absence of fish because of predation The same test was
used for the hypothesis that production of small invertebrate
taxa is greater in the presence of fish because elimination of
large invertebrates by fish reduces competition (eg food
availability) for small invertebrates The Studentrsquos t-test also
was used to test similar hypotheses for zooplankton For all
contrasts data were log transformed prior to analysis when
variances for the groups were not equal
Results
None of the abiotic measurements differed between lakes
with and without fish over the growing season (pgt005) and
no interaction for time was found for any abiotic variables
(pgt005) Mean annual phytoplankton Chl a concentrations
did not differ statistically between lakes with fish (26 6 08
lg L21) and without fish (17 6 04 lg L21) over the growing
season (repeated measures ANOVA data log transformed
F(110) 5 158 p 5 024) The quantity of periphyton Chl a
also did not differ between lakes with (57 6 11 lg cm22)
and without fish (54 6 07 lg cm22 repeated measures
ANOVA F(110) 5 008 p 5 078)
Forty-eight benthic invertebrate taxa and 36 zooplankton
taxa were collected in the 12 lakes Mean taxonomic richness
(number of taxa) and Shannon Diversity Index were not sig-
nificantly different for benthic invertebrates and zooplank-
ton in the two lake categories (Table 2) Mean annual
individual body mass and community biomass for benthic
invertebrates and zooplankton were lower in lakes contain-
ing fish than in lakes without fish (Table 2) Despite signifi-
cant differences in community biomass production of
benthic invertebrate and zooplankton did not differ between
Mea
n B
ody
Mas
s m
g
0
01
02
03
04
Jul Aug Sep Oct Jul Aug Sep Oct
Em
erge
nce
0
200
400
600
800
Em
erge
nce
Bio
mas
s m
g m
2B
iom
ass
mg
m2
Lakes without fish
Small
Large
Small
Large
Lakes with fish
Fig 2 Mean dry body mass (6 SE) of individual benthic invertebrates for lakes with and without fish (gray area indicates peak emergence of S occi-dentalis) Mean (6 SE) monthly benthic invertebrate dry biomass per unit area for lakes without and with fish (gray area indicates peak emergence of
S occidentalis)
Detmer et al Predators affect food webs
5
lake categories because of (1) higher PB ratio in lakes with
fish than lakes without fish and (2) higher biomass of small
invertebrates in lakes with fish (Table 2)
Benthic invertebrates
Sorensen similarity was slightly but significantly lower
among lakes without fish (054 6 003) than among lakes
with fish (067 6 002 plt001) Several taxa were present in
all or nearly all lakes Chironomids Mollusca (Pisidium sp)
Hemiptera (Corisella sp) oligochaetes ostracods trombidi-
forms and Trichoptera (Limnephilus) Twenty-two taxa
including six odonate genera and four beetle genera were
present in fishless lakes and absent in lakes with fish but
most of these were present in only one or two lakes All taxa
in lakes with fish were also found in lakes without fish
Mean benthic invertebrate body size was much lower in
lakes with fish for the majority of the growing season (Fig 2
July September and October plt005) but not so in August
following emergence of Siphlonurus Siphlonurus and
Psychoglypha were smaller in lakes with fish (Table 3) because
of the low abundance of late instar individuals in lakes with
fish
Invertebrate biomass in lakes without fish reached a post
emergence plateau in SeptemberndashOctober similar to the pre-
emergence plateau in July (Fig 2) Invertebrate biomass in
lakes containing fish increased slightly from July to Septem-
ber without any detectable emergence suppression probably
because of temporally dispersed emergence of dominant taxa
and the near absence of Siphlonurus
Fish suppressed the biomass of caddisfly taxa over the
growing season One taxon (Hesperophylax) however showed
low suppression during the growing season but was greatly
suppressed in lakes with fish just after ice out when its mean
body size was greatest
Four of the five largest abundant benthic invertebrate
taxa were greatly suppressed in biomass per unit area by fish
(Table 3) No small taxa (taxa with a mean annual body
sizelt01 mg) differed significantly in biomass per unit area
Table 3 Annual mean dry body mass and population biomass in order of decreasing size for individuals of the most abundant ben-thic invertebrate taxa in lakes with and without fish (mean 6 SE) Significant differences between lake categories for mean annual drybody mass are shown in the first column In the last column significance of biomass differences is shown for the end of the growingseason (September and October pooled)
Taxonomic group
Mean body mass
(mg individual21)
Population biomass (mgDM m22)
July August September October p
Lakes without fish
Limnephilus1 898 6 200 100 6 47 89 6 41 68 6 27 80 6 21 lt001
Siphlonurus occidentalis2 713 6 229 282 6 119 58 6 26 202 6 69 331 6 105 lt001
Ameletus velox2 486 6 051 6 6 5 32 6 22 75 6 52 79 6 56 004
Hesperophylax sp1 385 6 080 117 6 58 25 6 25 3 6 2 11 6 11 072
Psychoglypha subborealis1 170 6 052 0 6 0 0 6 0 18 6 13 37 6 32 005
Amphiagrion abbreviatum3 083 6 024 7 6 4 15 6 9 53 6 38 18 6 13 012
Callibaetis ferrugineus2 054 6 017 43 6 29 26 6 17 48 6 32 37 6 23 032
Chironomidae4 007 6 002 120 6 41 137 6 43 218 6 47 197 6 40 025
Ostracoda 007 6 002 21 6 17 8 6 5 20 6 16 19 6 15 071
Pisidium sp5 002 6 001 14 6 6 10 6 5 37 6 28 26 6 16 020
Oligochaeta 001 6 001 16 6 13 16 6 7 21 6 12 12 6 4 013
Lakes with fish
Limnephilus1 851 6 404 8 6 5 9 6 9 6 6 5 1 6 1
Siphlonurus occidentalis2 108 6 005 8 6 6 0 6 0 1 6 1 0 6 0
Ameletus velox2 - 6 - 0 6 0 0 6 0 0 6 0 0 6 0
Hesperophylax sp1 353 6 108 24 6 14 28 6 16 4 6 2 4 6 2
Psychoglypha subborealis1 085 6 017 0 6 0 1 6 1 3 6 2 4 6 2
Amphiagrion abbreviatum3 - 6 - 0 6 0 0 6 0 0 6 0 0 6 0
Callibaetis ferrugineus2 083 6 - 8 6 8 7 6 7 21 6 21 17 6 17
Chironomidae4 005 6 002 144 6 46 206 6 70 332 6 92 237 6 69
Ostracoda 009 6 002 26 6 16 32 6 19 52 6 49 7 6 5
Pisidium sp5 003 6 001 24 6 21 19 6 11 59 6 30 86 6 55
Oligochaeta 002 6 001 21 6 7 19 6 12 43 6 14 51 6 23
1Trichoptera 2Ephemeroptera 3Odonata 4Diptera 5Veneroida
plt005
Detmer et al Predators affect food webs
6
between lake categories Collectively however the biomass
of small taxa was more variable (Levene test p 5 004) and
much greater in lakes with fish than lakes without fish
(Table 2) Siphlonurus had highest mean annual biomass in
lakes without fish (Table 3 25 of mean annual benthic
invertebrate biomass) Chironomids contributed proportion-
ately more to the benthic invertebrate biomass of lakes with
fish (58 6 8) than without fish (24 6 5 plt001)
For the two largest abundant taxa S occidentalis and Limne-
philus lakes with fish hadlt10 of the production that
occurred in lakes without fish (Table 4) Collectively the pro-
duction of small taxa was greater in lakes with fish than in
lakes without fish (Table 2 p5 004) and contributed propor-
tionately more to benthic invertebrate production of lakes with
fish (84 6 9) than lakes without fish (49 6 7 p5 002)
Small benthic invertebrates (taxa with mean annual body
sizelt1 mg) accounted for a higher proportion of production
in lakes with fish than in lakes without fish (Fig 3A) In
lakes with fish because few large bodied taxa survived to
late instars production was skewed toward small organisms
In lakes without fish production was more evenly distribut-
ed across size classes
Pro
duct
ion
mg
DM
m-2 y
r-1
0
250
500
750
1000
1250No Fish Fish
Benthic Invertebrates
Zooplankton
lt 01 01-1 1-10 gt 10 lt 01 01-1 1-10 gt 10
Mean dry body mass
Pro
duct
ion
μg D
M m
-2 y
r-1
0
50
100
150
200
250
300
Sm
all
Larg
e
Sm
all
Larg
e
Fig 3 Production for size classes of benthic invertebrates (mg) and zooplankton (lg) in lakes with and without fish
Table 4 Annual production in decreasing order of body massfor dominant benthic invertebrate taxa in lakes with and with-out fish (mg DM m22 yr21 mean 6 SE plt005)
Taxonomic
group
Lakes
without fish
Lakes
with fish p
Limnephilus 159 6 31 14 6 13 lt001
Siphlonurus occidentalis 249 6 87 5 6 3 004
Ameletus velox 63 6 40 0 6 0 017
Hesperophylax sp 73 6 37 49 6 18 058
Psychoglypha subborealis 18 6 12 1 6 1 022
Amphiagrion abbreviatum 56 6 36 0 6 0 018
Callibaetis ferrugineus 122 6 78 45 6 45 042
Chironomidae 754 6 165 976 6 277 051
Ostracoda 34 6 19 88 6 60 042
Pisidium sp 96 6 35 163 6 72 044
Oligochaeta 100 6 26 127 6 38 057
Total production 1871 6 280 1544 6 356 049
plt005
Detmer et al Predators affect food webs
7
Zooplankton
The Sorensen similarity index did not differ significantly
between lakes without fish (062 6 005) and with fish
(054 6 003) Several taxa were present in all or most of the
lakes Diaptomus sp Chydorus sphaericus Conochilus sp Diac-
yclops sp Epischura sp and Keratella cochlearis C trivittatus
a large predaceous dipteran was present in two lakes with-
out fish and in no lakes with fish Although some taxa were
found only in a single lake with fish no taxa were present in
two or more lakes with fish that were not also present in
lakes without fish
In lakes without fish mean zooplankton body size
increased during the growing season but in lakes with fish it
remained constant (Fig 4) The body size of taxa did not dif-
fer between lakes with and without fish except for two of
the largest taxa Diaptomus sp and Daphnia middendorffiana
(Table 5) These species were smaller in lakes with fish
where large individuals were rare
Lakes with and without fish had similarly low zooplank-
ton biomass per unit area at the start of the growing season
Zooplankton biomass per unit area increased in lakes with-
out fish from July to September In lakes with fish zooplank-
ton biomass per unit area also increased from July to
September but at a lower rate (Fig 4)
Two of the three abundant large zooplankton Diaptomus
sp and D middendorffiana were very abundant in lakes
without fish but undetected or rare in lakes with fish (Table
5) C trivittatus was moderately abundant in two lakes with-
out fish but absent from all lakes with fish Diacyclops sp a
small copepod and the small Daphnia rosea had low abun-
dance in lakes without fish but moderate abundance in lakes
with fish Holopedium gibberum which showed similar abun-
dance in lakes with and without fish contributed a higher
proportion of total biomass in lakes with fish Small taxa
(lt1 lg) were collectively much more abundant (nearly 7x)
in lakes with fish than in lakes without fish (Table 2)
Although total zooplankton production did not differ
between lakes with and without fish the ratio of production
by large zooplankton to production by small zooplankton did
(Fig 3B) The majority of zooplankton production occurred in
0
1
2
3
4
5
Jul Aug Sep Oct Jul Aug Sep Oct
Mea
n B
ody
Mas
s μ
g
0
50
100
Bio
mas
s m
g m
2B
iom
ass
mg
m2
Lakes without fish
Large
Small
Large
Small
Lakes with fish
Fig 4 Mean dry body mass (6 SE) of individual zooplankton for lakes with and without fish Mean (6 SE) monthly zooplankton dry biomass perunit area for lakes without and with fish
Detmer et al Predators affect food webs
8
small zooplankton for lakes with fish and in large zooplank-
ton for lakes without fish (Table 6)
Discussion
The present study shows as have other studies that
invertivorous fish change the composition and reduce the
biomass of invertebrate communities in lakes through size
selective removal of large invertebrates (eg Carlisle and
Hawkins 1998 Knapp et al 2001 Parker and Schindler 2006
Schilling et al 2009) The present study also shows for two
types of communities (benthos zooplankton) that second-
ary production of invertebrates can remain constant even
though invertebrate biomass is suppressed by the presence of
fish Homeostatic secondary production in trophic cascades
also has been shown in one study of benthic invertebrates
(Northington et al 2010) and one study of zooplankton
(Tronstad et al 2011)
The mechanism for stability of invertebrate production in
response to fish predation as documented here consists of two
interacting factors First invertivorous fish feed selectively on
large invertebrates leading to dominance of small inverte-
brates Second small invertebrates become more abundant in
the absence of large invertebrates which suggests that they
respond to release from competition when large invertebrates are
removed (Figs 2 4) Greater abundance of small invertebrates in
the absence of large invertebrates may be a general feature
of foodwebs as it is documented also for terrestrial vertebrates
(eg Palmer et al 2015) In lakes of RMNP the increased domi-
nance of small invertebrates causes a compensatory response of
secondary production through an increase in community PB
ratio (Banse and Mosher 1980 Schwinghamer et al 1986) and
an increase in abundance of small invertebrates that augments
Table 5 Annual mean dry body mass and biomass in order of decreasing size for individuals of the most abundant zooplanktontaxa in lakes with and without fish (mean 6 SE) Significant differences between lake categories for mean annual dry body mass areshown in the first column In the last column biomass differences are shown for the end of the growing season (September andOctober pooled)
Mean body mass
(lg individual21)
Population biomass (mg m22)
pJuly August September October
Lakes without fish
Daphnia middendorffiana 1040 6 261 27 6 13 335 6 303 265 6 174 252 6 181 003
Holopedium gibberum 555 6 061 10 6 03 37 6 37 104 6 101 49 6 49 044
Diaptomus sp 505 6 064 95 6 36 280 6 89 670 6 341 359 6 158 001
Daphnia rosea 115 6 022 21 6 15 36 6 22 14 6 05 12 6 06 007
Diacyclops sp 048 6 012 01 6 00 01 6 01 01 6 00 00 6 00 004
Epischura sp 035 6 006 03 6 02 05 6 03 02 6 01 01 6 01 008
Collotheca sp 021 6 005 01 6 01 126 6 125 01 6 00 00 6 00 033
Conochilus sp 007 6 003 00 6 00 04 6 02 00 6 00 00 6 00 009
Lakes with fish
Daphnia middendorffiana 412 6 020 54 6 54 00 6 00 01 6 01 00 6 00
Holopedium gibberum 746 6 241 05 6 04 58 6 38 265 6 214 86 6 81
Diaptomus sp 282 6 066 01 6 01 11 6 08 10 6 10 15 6 15
Daphnia rosea 099 6 010 59 6 37 87 6 77 145 6 90 159 6 108
Diacyclops sp 052 6 019 64 6 41 165 6 105 24 6 17 36 6 27
Epischura sp 032 6 008 10 6 05 04 6 02 79 6 51 78 6 48
Collotheca sp 018 6 006 03 6 02 01 6 01 01 6 01 01 6 01
Conochilus sp 008 6 003 00 6 00 34 6 34 59 6 39 46 6 33
plt005
Table 6 Annual production of the most abundant zooplank-ton taxa for lakes without and with fish (mg DM m22 yr21mean 6 SE plt005)
Taxonomic group
Lakes
without fish
Lakes
with fish p
Daphnia middendorffiana 102 6 42 2 6 2 lt001
Holopedium gibberum 43 6 43 97 6 64 030
Diaptomus sp 164 6 42 7 6 4 lt001
Daphnia rosea 21 6 11 61 6 35 029
Diacyclops sp 2 6 1 38 6 15 001
Epischura sp 5 6 2 16 6 8 021
Collotheca sp 46 6 44 4 6 3 039
Conochilus sp 4 6 2 32 6 20 021
Total production 451 6 103 308 6 113 037
plt005
Detmer et al Predators affect food webs
9
invertebrate production through partial restoration of biomass
lost to selective predation loss of large invertebrates
Evidence from RMNP lakes for compensatory response
that suppresses the inverse cascade relationships of primary
consumers and primary producers suggests that the cascade
model proposed by Carpenter et al (1985) here referred to
as the Static Size Distribution (SSD) Model would be
enhanced by incorporation of changes in community PB
and increase in abundance of small invertebrates in response
to removal of large invertebrates
When applied to lakes with three trophic levels the SSD
Model which does not take compensatory mechanisms into
account predicts that at the lowest abundances for invertiv-
orous fish invertebrate biomass will be high and biomass of
primary producers will be suppressed by invertebrate herbi-
vores (Fig 5) Increasing biomass of invertivorous fish which
causes increased predation on invertebrates is matched in a
uniform way by decreasing specific growth rate of invertivo-
rous fish reflecting suppression of invertebrate abundance
caused by predation Production of the invertivorous fish
population (Pf) is calculated as the product of biomass and
growth rate Pf 5 Bf gf The calculation produces a yield (pro-
duction) curve for Pf that shows initial increase in produc-
tion leading to peak yield followed by overharvesting
which suppresses invertebrate biomass and production
Depression of invertebrate biomass through the cascade
causes an increase in algal biomass through reduced grazing
intensity Primary producers move toward a peak biomass
that reflects limiting nutrient concentrations or reduced
availability of PAR irradiance at high biomass Net primary
production progressively increases as removal of biomass by
herbivores declines
When modified by the inclusion of body size leading to
compensatory change in community PB and increase in
abundance of small invertebrates when large invertebrates
are removed the SSD Model becomes a Compensatory Size
Distribution Model (CSD Model Fig 5) As invertivorous fish
become more abundant increase in invertebrate PB ratio
Invertivorouspredators
Invertebrateherbivores
Algae
Bio
mas
sG
row
th ra
tePr
oduc
tion
Invertebrate herbivores
Body
siz
e
Bio
mas
sG
row
th ra
tePr
oduc
tion
Gro
wth
rate
Gro
wth
rate
Body
siz
e
Predator abundance
Algae Invertebrate herbivores
Predator abundance Predator abundance Predator abundance
Predator abundance Predator abundance Predator abundance Predator abundance
Invertivorouspredators
Invertebrateherbivores
Static Size Distribution Model
Compensatory Size Distribution Model
Fig 5 Comparison of a three-level trophic cascade based on a Static Size Distribution Model for invertebrate herbivores (redrawn from Carpenteret al 1985) with a Compensatory Size Distribution Model that includes a shift toward smaller invertebrates and an increase in numeric abundance ofinvertebrates All graphs show biomass (B) and instantaneous growth rate (g) production is calculated as P 5 Bg Factors that would govern the abun-
dance of invertivorous predators (variation along the x axis) are not specified but could include a fourth trophic level or other factors
Detmer et al Predators affect food webs
10
and increase in abundance of small invertebrates progressive-
ly compensate invertebrate production for reduction in total
biomass of invertebrates caused by selective removal of large
invertebrates A decline in biomass occurs however even
though biomass reduction through loss of large invertebrates
is partially offset by increase in small invertebrates These
changes suppress the response of invertebrate production
and biomass to increasing fish abundance In addition stable
invertebrate production stabilizes production of algae by
removal of algae biomass at a steady rate corresponding to
invertebrate production At the highest intensities of preda-
tion however efficiency of fish in consuming invertebrates
is impaired because of constraints involving physical limita-
tions of fish in consuming the smallest invertebrates (eg
gillraker spacing weak capacity for capture of infauna etc)
Fish biomass remains high but fish production (growth)
declines Invertebrate biomass persists in reduced amounts
through increasing dominance of the smallest least vulnera-
ble taxa Because grazers persist even at the highest levels of
predation grazing by invertebrates contributes to suppres-
sion of algal biomass even though abundance of invertebrate
predators is high
The CSD Model shows how compensation for predation by
invertebrates can disrupt a trophic cascade through mecha-
nisms that are documented for RMNP lakes Degrees of disrup-
tion weaker than observed in RMNP may be possible as may
cascades that show negligible compensation ie as predicted
by the SSD Model Whether most lakes show SSD cascades or
CSD cascades is not clear but some CSD compensation seems
inevitable for three trophic levels in large lakes because inver-
tivorous fish are size selective (Carpenter et al 1985)
Cascades with four trophic levels also could be derived by
addition of piscivores to SSD and CSD models with three tro-
phic levels In fact the SSD Model as presented by Carpenter
et al (1985) assumes linear suppression of invertivorous fish
by hypothetically increasing biomass of piscivores which
reverses all of the cascade responses that would apply in the
absence of piscivores Figure 5 assumes no piscivory reflecting
conditions in RMNP lakes Cascades involving piscivorous fish
are qualitatively different than those involving only invertivo-
rous fish in that piscivores (level 4) continually reinforce the
third trophic level through reproductive output of young fish
which are invertivorous (level 3) during early development
The extent to which invertivorous predation is compensated
by this mechanism is not well documented however For
example Post et al (1992) showed for Lake Mendota MN
that invertivory was only modestly reinforced by offspring of
piscivores but they cite literature showing that the typical
reinforcement effect is larger in most lakes than it was in
Lake Mendota at the time of their study The interpretation
of piscivory through SSD and CSD Models is still unclear
Further studies may focus more explicitly on compensatory
mechanisms which will clarify their overall significance The
potential for compensatory mechanisms does show however
that cascade structure is a weaker a priori predictor of cascade
dynamics than it seemed to be originally (Carpenter et al
1985) Compensatory mechanisms may also explain along
with other factors such as those modeled by DeLong et al
(2015 body size) or Gilbert et al (2014 temperature) why
empirical studies often fail to follow predictions of the SSD
Model for trophic cascades (Brett and Goldman 1996)
While community characteristics dictate the significance
of predation to invertebrate size distribution and abundance
a few species show anomalous responses to size selective pre-
dation In the present study H gibberum did not respond to
size selective predation (see also Carpenter and Kitchell
1993 Carlisle and Hawkins 1998 Drouin et al 2009) The
large gelatinous mantle of this species (approximately 60
longer than the body length excluding the mantle) may
reduce vulnerability of Holopedium to fish predation because
the mantle is transparent body length of Holopedium with-
out the mantle (mantle length 5 088 6 003 mm n 5 166) is
below the size range suppressed by fish in this study The vis-
ible (non-gelatinous) portion of Holopedium while below the
consumption threshold for invertivorous fish also would
physically impede predation by smaller predators because of
the large mantle (juvenile fish invertebrate carnivores) H
gibberum also may be resistant to predation by fish because
the gelatinous mantle is distasteful to fish (McNaught 1978
Balcer et al 1984)
Developmental changes in body size also preclude bina-
ry classification of all taxa as either vulnerable or not vul-
nerable to fish predation Small body size of S occidentalis
and Psychoglypha sp in lakes with fish is explained by selec-
tive elimination of late instars Among pelagic taxa D mid-
dendorffiana and Diaptomus sp showed a pattern similar to
that of Siphlonurus and Psychoglypha in that small individu-
als are much less vulnerable to fish predation than large
individuals
Conclusions
Because fish are size selective predators invertebrate com-
munities subject to increasing degrees of fish predation often
will show a reduction in PB ratio and increased abundance
of small taxa and thereby will have some degree of resil-
ience in production in response to fish predation This ten-
dency can be reinforced by compensatory increase in
abundance of small invertebrates when large invertebrates
are removed by predation as shown in both zooplankton
and invertebrate communities of RMNP lakes Changes in P
B ratio and abundance of small primary consumers are likely
to affect trophic cascades generally and may explain wholly
or in part why cascade responses to presence of invertivo-
rous fish often are inconsistent with the SSD Model for tro-
phic cascades Because juvenile piscivores are likely to be
invertivorous yet another type of compensatory effect
caused by negative feedback affecting primary consumers
Detmer et al Predators affect food webs
11
may disrupt cascades that involve piscivorous fish Recogni-
tion of compensatory effects in general will clarify the
dynamics of trophic cascades
References
Balcer M D N L Korda and S I Dodson 1984 Zooplank-
ton of the great lakes Univ of Wisconsin Press
Banse K and S Mosher 1980 Adult body mass and annual
productionbiomass relationships of field populations
Ecol Monogr 50 355ndash379 doi1023072937256
Baron J S T M Schmidt and M D Hartman 2009 Climate-
induced changes in high elevation stream dynamics Glob
Change Biol 15 1777ndash1789 doi10111j1365-2486200901847x
Baumgartner D and K O Rothaupt 2003 Predictive
length-dry mass regressions for freshwater invertebrates in
a pre-alpine lake littoral Int Rev Hydrobiol 88 453ndash
463 doi101002iroh200310632
Benke A C A D Huryn L A Smock and J B Wallace
1999 Length-mass relationships for freshwater macroin-
vertebrates in North America with particular reference to
the southeastern United States J North Am Benthol
Soc 18 308ndash343 doi1023071468447
Benke A C and A D Huryn 2006 Secondary production of
macroinvertebrates p 691ndash710 In F R Hauer and DG
Lamberti [eds] Methods in stream ecology 2nd ed Elsevier
Black A R and S I Dodson 2003 Ethanol A better preser-
vation technique for Daphnia Limnol Oceanogr Meth-
ods 1 45ndash50 doi104319lom2003145
Brett M T and C R Goldman 1996 A meta-analysis of
the freshwater trophic cascade Proc Natl Acad Sci USA
93 7723ndash7726 doi101073pnas93157723
Brooks J L and S I Dodson 1965 Predation body size
and composition of plankton Science 150 28ndash35 doi
101126science150369228
Carlisle D M and C P Hawkins 1998 Relationships
between invertebrate assemblage structure 2 trout species
and habitat structure in Utah mountain lakes J North
Am Benthol Soc 17 286ndash300 doi1023071468332
Carpenter S R J F Kitchell and J R Hodgson 1985 Cas-
cading trophic interaction and lake ecosystem productivi-
ty Bioscience 35 635ndash639 doi1023071309989
Carpenter S R and others 1987 Regulation of lake prima-
ry productivity by food web structure Ecology 68 1863ndash
1876 doi1023071939878
Carpenter S R and J F Kitchell [eds] 1993 The trophic
cascade in lakes Cambridge Univ Press
Davi M L 1993 Determination of nitrate in surface waters
by ion exchange chromatography after oxidation of total
organic nitrogen to nitrate J Chromatogr 644 345ndash348
doi1010160021-9673(93)80718-N
DeLong J P and others 2015 The body size dependence
of trophic cascades Am Nat 185 354ndash366 doi101086
679735
Demi L M K S Simon S M Coghlan R Sanders and
D Anderson 2012 Anadromous alewife in linked lake-
stream ecosystems Do trophic interactions in lakes influ-
ence stream invertebrate communities Freshw Sci 31
978ndash985 doi10189911-1241
Drouin A P Sirois and P Archambault 2009 Discriminating
zooplankton communities in lakes with brook trout (Salveli-
nus fontinalis) and in fishless lakes Ecoscience 16 271ndash281
doi10298016-3-3152
Dumont H J and G Balvay 1979 The dry weight estimate
of Chaoborus flavicans (Meigen) as a function of length
and instars Hydrobiologia 64 139ndash145 doi101007
BF00023189
EPA Great Lakes National Office 2003 Standard operating
procedure for zooplankton analysis US Environmental
Protection Agency
Gilbert B and others 2014 A bioenergetic framework for
the temperature dependence of trophic interactions Ecol
Lett 17 902ndash914 doi101111ele12307
Gillespie D M D L Stites and A C Benke 1985 An inex-
pensive core sampler for use in sandy substrate Freshw
Inv Biol 5 147ndash151 doi101007BF01704665
Hairston N G F E Smith and L B Slobodkin 1960 Com-
munity structure population control and competition
Am Nat 94 421ndash425 doi1086282146
Hauer F R and A C Benke 1987 Influence of temperature
and river hydrograph on black fly growth rates in a sub-
tropical blackwater river J North Am Benthol Soc 6
251ndash261 doi1023071467312
Hessler R R and H L Sanders 1967 Faunal diversity in the
deep sea Deep-Sea Res 14 65ndash78 doi1010160011-
7471(67)90029-0
Huryn A D and J B Wallace 1986 A method for obtaining
in situ growth rates of larval Chironomidae (Diptera) and
its application to studies of secondary production Limnol
Oceanogr 31 216ndash222 doi104319lo19863110216
Jeppesen E T L Lauridsen S F Mitchell K Christoffersen
and C W Burns 1999 Trophic structure in the pelagial
of 25 shallow New Zealand lakes Changes along nutrient
and fish gradients J Plankton Res 22 951ndash968 doi
101093plankt225951
Jeppesen E and others 2003 The impact of nutrient state
and lake depth on top-down control in the pelagic zone
of lakes A study of 466 lakes from the temperate zone
to the Arctic Ecosystems 6 313ndash325 doi101007
PL0021503
Johnston T A and R A Cunjak 1999 Dry mass-length
relationships for benthic insects A review with new data
from Catamaran Brook New Brunswick Canada Freshw
Biol 41 653ndash674 doi101046j1365-2427199900400x
Jones A W and D M Post 2013 Consumer interaction
strength may limit the diversifying effect of intraspecific
competition A test in alewife (Alosa pseudoharengus) Am
Nat 181 815ndash826 doi101086670197
Detmer et al Predators affect food webs
12
Knapp R A K R Matthews and O Sarnelle 2001 Resis-
tance and resilience of alpine lake fauna to fish introduc-
tions Ecol Monogr 71 401ndash421 doi1018900012-
9615(2001)071[0401RAROAL]20CO2
Knapp R A C P Hawkins J Ladau and J G McClory
2005 Fauna of Yosemite National Park lakes has low resis-
tance but high resilience to fish introductions Ecol Appl
15 835ndash847 doi10189004-0619
Lake B A C R Wigdahl K E Strock J E Saros and A
Amirbahman 2011 Multi-proxy paleolimnological assess-
ment of biogeochemical versus food web controls on the
trophic states of two shallow mesotrophic lakes J Paleo-
limnol 46 45ndash57 doi101007s10933-011-9513-1
Langner C L and P F Hendrix 1982 Evaluation of persul-
fate digestion method for particulate nitrogen and phos-
phorus Water Res 16 1451ndash1454 doi1010160043-
1354(82)90243-3
Leavitt P R S R Carpenter and J F Kitchell 1989
Whole-lake experiments The annual record of fossil pig-
ments and zooplankton Limnol Oceanogr 34 700ndash717
doi104319lo19893440700
Lewis W M 1979 Zooplankton community analysis Stud-
ies on a tropical system Springer-Verlag
Lewis W M and M C Grant 1980 Acid precipitation in
the Western United States Science 206 176ndash177 doi
101126science2074427176
Lewis W M and J H McCutchan 2010 Ecological
responses to nutrients in streams and rivers of the Colora-
do mountains and foothills Freshw Biol 55 1973ndash1983
doi101111j1365-2427201002431x
Makarewicz J A and G L Likens 1979 Structure and function
of the zooplankton community of Mirror Lake New Hamp-
shire Ecol Monogr 49 109ndash127 doi1023071942575
Marker A F E A Nusch H Rai and B Reimann 1980
The measurements of photosynthetic pigments in fresh-
waters and standardization of methods Conclusions and
recommendations Arch Hydrobiol 14 91ndash106
McCutchan J H and W M Lewis 2002 Relative impor-
tance of carbon sources for macroinvertebrates in a Rocky
Mountain Stream Limnol Oceanogr 47 742ndash752 doi
104319lo20024730742
McNaught D C 1978 Spatial heterogeneity and niche dif-
ferentiation in zooplankton of Lake Huron Verh Inter-
nat Verein Limnol 20 341ndash346
Merritt RW KW Cummins and MB Berg [eds] 2008
An introduction to aquatic insects of North America 4th
ed KendallHunt Publishing Company
Miserendino M L 2001 Length-mass relationships for
macroinvertebrates in freshwater environments of Patago-
nia (Argentina) Ecol austral 11 3ndash8
Murphy J and J P Riley 1962 A modified single solution
method for the determination of phosphate in natural
waters Anal Chim Acta 27 31ndash36 doi101016S0003-
2670(00)88444-5
Northcote T G 1988 Fish in the structure and function of
freshwater ecosystems A ldquotop-downrdquo view Can J Fish
Aquat Sci 45 2347ndash2360 doi101139f88-044
Northington R M M D Keyse S R Beaty S C Whalen
E R Sokol and A E Hershey 2010 Benthic secondary
production in eight oligotrophic arctic Alaskan lakes J
North Am Benthol Soc 29 465ndash479 doi10189909-
0261
Nusch E A 1980 Comparison of different methods for
chlorophyll and phaeopigment determination Arch
Hydrobiol 14 14ndash36
Paine R T 1980 Food webs Linkage interaction strength
and community infrastructure J Anim Ecol 49 666ndash
685 doi1023074220
Palmer G P A Stephens A I Ward and S G Willis
2015 Nationwide trophic cascades Changes in avian
community structure driven by ungulates Sci Rep 5
15601 doi101038srep15601
Parker B R D W Schindler D B Donald and R S
Anderson 2001 The effects of stocking and removal of a
nonnative salmonid on the plankton of an alpine lake
Ecosystems 4 334ndash345 doi101007s10021-001-0015-2
Parker B R and D W Schindler 2006 Cascading trophic
interactions in an oligotrophic species-poor alpine lake
Ecosystems 9 157ndash166 doi101007s10021-004-0016-z
Pennak R W 1968 Field and experimental winter limnolo-
gy of three Colorado mountain lakes Ecology 49 505ndash
520 doi1023071934117
Pennak R W 1989 Fresh-water invertebrates of the United
States Protozoa to mollusca Wiley
Polis G A 1999 Why are parts of the world green Multiple
factors control productivity and the distribution of bio-
mass Oikos 89 3ndash15 doi1023073546565
Post J R L G Rudstam D M Schael and C Leucke
1992 Pelagic planktivory by larval fishes in Lake Mendota
in food web management p 303ndash317 In J F Kitchell
[ed] Food web management a case study of Lake Men-
dota Springer-Verlag
Power M E 1990 Effects of fish in river food webs Science
250 811ndash814 doi101126science2504982811
Sarnelle O 1992 Nutrient enrichment and grazer effects on
phytoplankton in lakes Ecology 75 551ndash560 doi
1023071940761
Schabetsberger R M Luger G Drozdowski and A Jagsch
2009 Only the small survive Monitoring long-term
changes in the zooplankton community of an alpine lake
after fish introductions Biol Invasions 11 1335ndash1345
doi101007s10530-008-9341-z
Schielke E G E P Palkovacs and D M Post 2011 Eco-
evolutionary feedbacks drive niche differentiation in the
alewife Biol Theory 6 211ndash219 doi101007s13752-012-
0031-9
Schilling E G C S Loftin and A D Huryn 2009 Effects
of introduced fish on macroinvertebrate communities in
Detmer et al Predators affect food webs
13
historically fishless headwater and kettle lakes Biol Con-
serv 142 3030ndash3038 doi101016jbiocon200908003
Schindler D W and J R Vallentyne 2008 Algal bowl
Overfertilization of the worldrsquos freshwaters and estuaries
Univ of Alberta Press
Schmitz O J A P Beckerman and K M OrsquoBrien 1997
Behaviorally mediated trophic cascades Effects of preda-
tion risk on food web interactions Ecology 78 1388ndash1399
doi1018900012-9658(1997)078[1388BMTCEO]20CO2
Schwinghamer P B Hargrave D Peer and C M Hawkins
1986 Partitioning of production and respiration among
size groups of organisms in an intertidal benthic commu-
nity Mar Ecol 31 131ndash142 doi103354meps031131
Shannon C E and W Weaver 1948 A mathematical theo-
ry of communication Bell Syst Tech J 27 379ndash423 and
623ndash656 doi101002j1538-73051948tb01338x
Shuter B J and K K Ing 1997 Factors affecting the pro-
duction of zooplankton in lakes Can J Fish Aquat Sci
54 359ndash377 doi101139f96-270
Sorensen T 1948 A method of establishing groups of equal
amplitude in plant sociology based on similarity of spe-
cies content Kongelige Danske Videnskabernes Selskab 5
1ndash34
Stemberger R S 1979 A guide to rotifers of the Laurentian
great lakes US Environmental Protection Agency
Terbough J and J A Estes 2010 Trophic cascades Preda-
tors prey and the changing dynamics of nature Island
Press
Thorp J H and A P Covich 1991 Ecology and classifica-
tion of North American freshwater invertebrates Academ-
ic Press
Tronstad L M R O Hall T M Koel and K G Gerow
2011 Introduced lake trout produced a four level trophic
cascade in Yellowstone Lake Trans Am Fish Soc 135
1536ndash1550 doi101577T09-1511
Valderrama J C 1981 The simultaneous analysis of total
nitrogen and total phosphorus in natural water Mar
Chem 10 109ndash122 doi1010160304-4203(81)90027-X
Walters C J and R E Vincent 1973 Potential productivity
of an alpine lake as indicated by removal and reintroduc-
tion of fish Trans Am Fish Soc 102 675ndash697 doi
1015771548-8659(1973)102lt675PPOAALgt20CO2
Conflict of Interest
None declared
Submitted 01 February 2016
Revised 26 May 2016
Accepted 12 August 2016
Associate editor Robert Sterner
Detmer et al Predators affect food webs
14
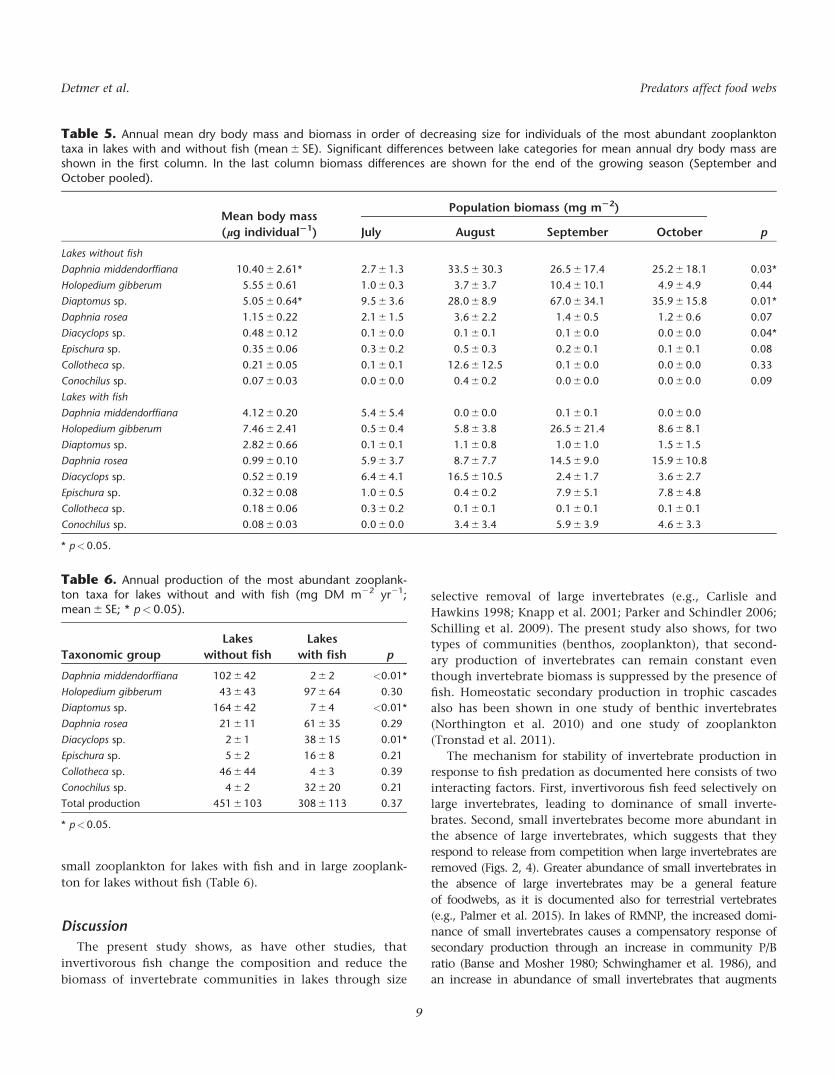


