PRE RECESSION STUDY ON FINANCIAL LEVERAGE IN REAL...
42
Asia Pacific Journal of Marketing & Management Review__________________________________________ ISSN 2319-2836 Vol.2 (8), August (2013) Online available at indianresearchjournals.com 77 PRE RECESSION STUDY ON FINANCIAL LEVERAGE IN REAL ESTATE INDUSTRY AND ITS RELATIVE IMPACT ON SHAREHOLDERS RETURN DR S.M.TARIQ ZAFAR*; DR ADEEL MAQBOOL** *DIRECTOR, CHARAK INSTITUTE OF BUSINESS MANAGEMENT, LUCKNOW, U.P **ASSOCIATE PROFESSOR & HEAD, INTEGRAL UNIVERSITY, LUCKHNOW ABSTRACT In this present dynamic and unpredictable business environment companies’ performance changes day by day. To meet out its commitment of growth and return to its shareholders companies require regular flow of funds which can be obtained in form of debt. Thus leverages are debt fund used judiciously by the companies in futuristic hope of multiplying and maximizing shareholder’s return EPS and ROE. It is a systematic fixed obligation with fixed cost. It is generated through the goodwill produced by the company by utilizing its overall resources efficiently and effectively. Generally investors like to invest in those companies which may give them maximum return with lesser risk. In business world from an operational point of view, earning per share are perhaps the most important and trusted index of financial performance. Thus it is very much imperative that real estate companies must realize the importance of leverages, Cost of Capital, EPS and ROE and their collective impact on shareholder return. This paper aims to know the effect of various financial rations upon the bearing of shareholder’s return and to analyze the impact of real asset ownership on the systematic risk (beta) and the risk-adjusted return of corporations. In addition study will examine that if real assets provide diversification benefit, then can firms with real assets will be in position to achieve a higher rate-of-return for a given level of risk or a lower level of risk for a given rate-of-return during the period. The study as a whole is categorized into understanding of study, methodology adopted and learning’s from the study. The first part gives an insight about the financial ratios and its understandings. And also how many ratios are applied, in order to find out the relationship among them. Second part signifies the kind of method and model adopted in order to understand the study. For this reason we have analyzed thirty companies of real estate industry on the basis of ratios and model like regression, so that it would help the investor to choose the right company for the purpose of investment. In last finding and conclusive remarks are given. Jel Classifications: G20, G22, G28, G29, G33, G39 KEY WORDS: Investors; Rational; ROCE; DPR; GS; ICR; GEPS; GDPS; GTA;ROE; EPS; Risk; EBIT; DFL; _____________________________________________________________________________________
Transcript of PRE RECESSION STUDY ON FINANCIAL LEVERAGE IN REAL...

Asia Pacific Journal of Marketing & Management Review__________________________________________ ISSN 2319-2836 Vol.2 (8), August (2013) Online available at indianresearchjournals.com
77
PRE RECESSION STUDY ON FINANCIAL LEVERAGE IN REAL
ESTATE INDUSTRY AND ITS RELATIVE IMPACT ON
SHAREHOLDERS RETURN
DR S.M.TARIQ ZAFAR*; DR ADEEL MAQBOOL**
*DIRECTOR,
CHARAK INSTITUTE OF BUSINESS MANAGEMENT,
LUCKNOW, U.P
**ASSOCIATE PROFESSOR & HEAD,
INTEGRAL UNIVERSITY, LUCKHNOW
ABSTRACT
In this present dynamic and unpredictable business environment companies’ performance
changes day by day. To meet out its commitment of growth and return to its shareholders
companies require regular flow of funds which can be obtained in form of debt. Thus leverages
are debt fund used judiciously by the companies in futuristic hope of multiplying and
maximizing shareholder’s return EPS and ROE. It is a systematic fixed obligation with fixed
cost. It is generated through the goodwill produced by the company by utilizing its overall
resources efficiently and effectively. Generally investors like to invest in those companies which
may give them maximum return with lesser risk. In business world from an operational point of
view, earning per share are perhaps the most important and trusted index of financial
performance. Thus it is very much imperative that real estate companies must realize the
importance of leverages, Cost of Capital, EPS and ROE and their collective impact on
shareholder return. This paper aims to know the effect of various financial rations upon the
bearing of shareholder’s return and to analyze the impact of real asset ownership on the
systematic risk (beta) and the risk-adjusted return of corporations. In addition study will examine
that if real assets provide diversification benefit, then can firms with real assets will be in
position to achieve a higher rate-of-return for a given level of risk or a lower level of risk for a
given rate-of-return during the period. The study as a whole is categorized into understanding of
study, methodology adopted and learning’s from the study. The first part gives an insight about
the financial ratios and its understandings. And also how many ratios are applied, in order to find
out the relationship among them. Second part signifies the kind of method and model adopted in
order to understand the study. For this reason we have analyzed thirty companies of real estate
industry on the basis of ratios and model like regression, so that it would help the investor to
choose the right company for the purpose of investment. In last finding and conclusive remarks
are given.
Jel Classifications: G20, G22, G28, G29, G33, G39
KEY WORDS: Investors; Rational; ROCE; DPR; GS; ICR; GEPS; GDPS; GTA;ROE; EPS;
Risk; EBIT; DFL; _____________________________________________________________________________________

Asia Pacific Journal of Marketing & Management Review__________________________________________ ISSN 2319-2836 Vol.2 (8), August (2013) Online available at indianresearchjournals.com
78
INTRODUCTION For the survival in competitive economic environment and to maintain growth companies induct
debts (leverages) in their capital structure. Thus it became paramount for the companies to define
the risk undertaken by the shareholders which in general arise due to variability of EBIT
(Operating Risk, due to variability of sales and variability of expenses) and Variability of EPS or
ROE (Financial Risk, due to the impact of interest charges). Generally leverage means, meeting
out fixed assets or paying out fixed return for employing borrowed resources or funds for high
profitability to shareholders trading on thin equity. It is a reliable device to force the company to
generate and pay out cash through use of fixed charge securities raised on the strength of net
worth. It work as an instrument to reduce the agency costs and is generally used by business
firms to quantify the risk–return relationship of different alternative capital structures. When
companies include securities with fixed cost (debt) in its capital structure along with other source
of funds (equity) and pay fixed financial charges, it is considered that company is working on
leverage. These fixed financial charges do not vary but are to be paid irrespective of any level of
EBIT. Degree of financial leverages depends on the magnitude of interest and fixed financial
charges. DFL will be high if costs of financial charges are high and company will be in risk if it
continued for long period and vice-versa. It measures the impact of change in EBIT on EPS, and
an increase in EBIT lead to a higher percentage increase in EPS. It is considered favorable when
it earns more on its total investment than what it pays towards debt capital, means ROCE should
be greater than fixed financial charges or rate of interest on debt. It is also termed as ―Trading on
Equity‖. Shareholders will be in advantage if the company earns a high rate of return and pays a
lower rate of return to the supplier of long term debt funds. Their earning enhance with positive
difference between the return (EBIT) and the cost of debt funds. In addition, in case of debt
funds the interest cost is also tax deductible. Return from DFL increases due to excess of return
on investment over effective cost of debt and reduction in the number of shares issued due to the
use of debt funds.
Objective of the Study:
The research work aims to examine the effect of various financial ratios upon the bearing of
shareholder’s return in real estate industry. To determine the factors that have a bearing on firm’s
financial leverage, to determine the relationship between leverage and cost of capital and to find
out the effect of financial leverage on shareholder’s return.
Methodology: The study is based on the secondary data collected from various government records and
published national document, websites of respective companies, moneycontrol and adopts
analytical and descriptive research design with random sampling technique. Thirty BSE listed
companies from various categories have been selected for the purpose. Pre recession period
from 2001 to 2008 is taken for study and all the data have been well analyzed with the help of
ratios and regression model.
Method of analysis: To achieve the above stated objectives, Firstly ratios were calculated like financial leverage,
return on capital employed, interest coverage ratio, dividend payout ratio, growth in sales,
growth in earning per share, cost of capital. Secondly, model was adopted which on individually

Asia Pacific Journal of Marketing & Management Review__________________________________________ ISSN 2319-2836 Vol.2 (8), August (2013) Online available at indianresearchjournals.com
79
company data as well as compositely apply the regression model. And thus further analysis was
conducted.
The Model
The classical regression model is used for the study to formulate the differences in the behavior
of the cross-section elements is
yit =X’it β+z’itα+εit
The firm does not wish to change dramatically its capital structure. Given the capital structure of
the previous year, the firm adjusts this year’s leverage in order to accomplish a long run target
capital structure. The hypothesis that will be tested in this paper is that each year’s financial
leverage depends upon the return on capital employed, dividend per share, interest coverage
ratio, growth in sales, growth in earning per share, growth in dividend per share and growth in
total assets.
F.Lit = α i+ β1 ROCEit +β2 DPR it +β3 GSit + β ICRit + β4 GEPSit + β5 GDPSit + β7 GTAit
+εit.
Where:
ROCEit = return on capital employed of the firm I at time t.
DPR it = dividend payout ration of the firm I at time t.
ICRit = interest coverage ratio of the firm I at time t.
GS it = growth in sales of the firm I at time t.
GEPSit = growth in earning per share of the firm I at time t.
GDPSit = growth in dividend per share of the firm I at time t.
GTA it = growth in total assets of the firm I at time t.
Εit =the error term.
Hypothesis of the study
1. There exists strong relationship between dividend policy and financial leverage.
2. There exists strongly negative relationship between debt service capacity and financial
leverage.
3. There exists a weak relationship between growth of sales and financial leverage.
4. There is a weak and insignificant relationship between growth in EPS and financial
leverage.
5. There is a weak and insignificant relationship between growth in DPS and financial
leverage.
6. There is weak and insignificant relationship between growth in total assets and financial
leverage.
7. There is a strong and positive relationship between shareholder’s return and financial
leverage.
8. There is a strong and negative relationship between cost of capital and financial leverage.

Asia Pacific Journal of Marketing & Management Review__________________________________________ ISSN 2319-2836 Vol.2 (8), August (2013) Online available at indianresearchjournals.com
80
LITERATURE REVIEW Infrastructure and real estate industry are always dear to all nations, and play significant role in
nation overall growth and development. It play strategic role for overall employment in the
nation. Their modernization, advancement and development reflect the nation’s growth. Being a
strategic economic instrument it require massive investment which are largely borrowed funds.
With inducting debt (leverage financing) it have obligation to satisfy the investor in respect to
risk and return. Real estate industry in India have been experiencing positive growth in its
different sectors with the development of urbanization and increasing involvement of foreign
investments in this field. A home is the ultimate security that every individual wants. Before
recession prices of house were on it zenith but soon economic slowdown forced the price to
come down. Due to economic decline, the Indian real estate sector undergone massive change
following the crash in the stock market and the financial slowdown in June 2008. It gave
investors an EPS strokes, and due to this unprecedented decline BSE Realty Index became the
year’s worst performer. It is found that India’s and world largest property firm DLF lost 54 per
cent of its stock value during the period. Unitech shed 64 per cent, Parsvnath and Omaxe lost 68
per cent each, Satyam stock price fall 30%. The ultimate loser in this entire economic slowdown
melodrama was the consumer and people who had invested their hard earned money in the realty
sector.
A survey of literature shows that throughout the world large numbers of financial analysts,
research scholars and academicians, like Ezra Solomon, Barnes, Baumo, David Durand, Miller
&Modglini, J.V. Elliot Haley and Schell, I.M.Pandey, S.M.Tariq Zafar have carried out extensive
research in the field of Capital Structure, Cost of Capital, and Cost of Financial Leverages and
explored the obscure truth and came up with diversified assumptions and important findings
which became paramount in this arena. However most of the studies are carried out in advance
and capitalist economies like UK, USA, etc. It is also been found that most of the studies are
insignificant in Asian environment and no organized and systematic study has yet been carried
out in India to test the authentic validity of these important concepts and thus the present paper
seeks to make a humble beginning in these respects.
Shell and Haley, define Financial Leverage as, ―the effect of debt financing on shareholder’s
income or financing the firm’s development projects with outside debt, James E Walter‖
Leverage may be defined as percentage return on equity to percentage return on capitalization.
Modigliani and Miller in (1963) proposes firms should use as much debt capital as possible in
order to maximize their value along with corporate taxation and its advantages. ―Solomon, June
(1963) revealed that‖ Leverage is the ratio of the net rate of return on shareholders, equity and
the net rate of return on total capitalization. Modigliani and Miller (1985) conclude that the
theory of ―capital structure irrelevance‖ where financial leverage does not affect the firm’s
market value. Weston & Brigham‖ In general usage, the leverage is defined as the ratio of total
debt on total assets. Nourse (1987) defines There are many ways to invest. But the investor
should be prudent enough to select a proper area; DiLuia, Shlaes and Tapajna (1991), in their
study found that the ownership of significant amounts of real estate by corporations in the United
States is well documented. Johnson and Keasler, (1993), and Rodriguez and Sirmans, (1996), in
their study tried to examine the effect of real asset ownership (including real estate, but also plant
and equipment) on the market performance of these same companies. Generally modern
portfolio theory produce that real assets must provide a diversified opportunity when it is held in
a portfolio since real estate’s major portion of assets generally has a low correlation with
common stock returns. Conversely, it could be hypothesized that real assets may not offer a

Asia Pacific Journal of Marketing & Management Review__________________________________________ ISSN 2319-2836 Vol.2 (8), August (2013) Online available at indianresearchjournals.com
81
diversification benefit because the economic risk of the business may be incorporated into the
returns from them, Thomas E. McCue and Jhon L. King (1994), in his study examines the
relationship between macroeconomic and real estate returns. For the study equity REIT data are
used as a proxy for real estate returns. The outcome of the study shows that prices, nominal rates,
output and investment all directly influence the real estate series. Nominal interest rate,
moreover, explain the majority of the variation in the real estate series. ―Charles Ellis‖ observes
that a favorable financial leverage occurs when a firm earns more by investing the borrowed
fund in the business than the fixed paid for their use, Steven R. Grendier (1995), in his study
tried to explain the underlying causes of the prolonged cycles observed in real estate markets. In
addition characterizes the features that make some property types more prone to such boom- and
bust behavior. Stephen A. Pyhrr, Stephen E. Roulac and Waldo L. Born (1999),in their study
synthesizes relevant research and commentary on real estate cycles in a micro- decision making
context and discusses their strategic implications for investors and portfolio manners. Peter M.
Mazonas et al- Patent, (2000), in his study tried to determine an appropriate balance of credit
parameters associated with the issuance of Reverse Equity Mortgage Financing. Myers (2001)
points out ―perfect alignment is implausible in theory and impossible in practice‖. David C. Ling
and Andy Naranjo (2003), in their study examine that whether commercial real estate markets
are integrated with stock markets using multifactor asset pricing models. The result of the study
support the hypothesis that the market for exchange traded real estate companies, include REITs,
is integrated with the for exchange traded non real estate stocks. However when appraisal based
returns are used to construct real estate portfolio returns, the results fail to support the integration
hypothesis. Chun-Chang Lee, Shu-Zhange Lin, Shu-Man You and Jui-Kou Shang
(2012), in their
study tried to analyze the operating efficiency of Taiwan’s real estate brokerage firms and
provides a reference for inefficient firms.
Growing population and business has created tremendous opportunities in real estate sector.
Under the shadow of economic downfall investment has became complex phenomena and
require technically and fundamentally expert investment advisors. It is a sector which requires
massive investment and contrary the sale of property requires a long time comply with the legal
requirements like verification of land use according to existing local laws, floor area ratio, time
to time restriction on sale for some period, and many more laws, rules, etc, depending upon the
socio - political environment. Thus with changing infra scenario new studies are to be carried out
in order to compensate the real estate sector and to console the investors and consumers.
Financial Risk on Shareholders Return
Generally real estate needs massive investment which requires balance capital structure
depending upon industry and market situation. Financial Leverage is an important component of
the capital structure and is an approach of financial valuation of a firm as well as of investor. It is
the additional risk placed on the common stockholders as a result of the decision to finance with
debt. If a firm obtains the fixed charges securities at a cost higher than the rate of return on the
company’s investments, EPS or ROE will fall and vice versa. Conceptually, real estate
stockholders face a certain explicit and implicit amount of risk that is inherent in a firm’s
operations. Unpredictable tax rules and rates, which change every year, annual property tax
which increased every year by self-assessment or capital based assessment. Rental income also
subject to annual tax; sale and purchase of property subject to capital gains and attracts stamp
duty and registration charges. Property tax and stamp duty which vary from state to state,
verification and use of land according to local laws, floor area ratio, unexpected restriction on

Asia Pacific Journal of Marketing & Management Review__________________________________________ ISSN 2319-2836 Vol.2 (8), August (2013) Online available at indianresearchjournals.com
82
sale for some period, and many more laws, rules, etc, depending upon the socio- political
environment. This is its business risk, which is defined as the uncertainty inherent in projections
of future operating income. If a firm uses debt, this concentrates the business risk on common
stockholders. This concentration of business risk occurs because debt holders, who receive fixed
interest payment, bear none of the business risk. Further leverage will reduce the amount of
possible remaining cash flows, after the investment decisions, debt presupposes interest
payments which are compulsory and ultimately results in cash outflows. Typically, financing
with debt increases the expected rate of return for an investment, but debt also increases the risk
ness of the investment to the common stockholders. It is essential to define the risk undertaken
by the shareholders. Critically it is observed that earnings available to shareholders fluctuate on
account of two risks. Firstly ―Variability of EBIT‖ it is because operating risk arises due to
variability of sales and variability of expenses. Secondly ―Variability of EPS or ROE‖ it is
because financial risk arises due to the impact of interest charges. In real estate return fluctuates
according to the type of assets thus the yield in the real estate market has to be calculated on the
capital invested and annual rental returns, less property tax, income tax and annual maintenance
charges. The risk of demand and supply position of each sector needs to be minutely evaluated.
Real estate sector specifically offers two types of returns monthly rentals, or the returns on the
lease amount invested in bank, securities or in business. The other type is returns on sale of the
property, thus required efficient valuation and evaluation to minimize the uncertain risk. In real
estate the optimal capital structure will be derived by the balance between the costs of debt
against the benefits of debt; the firm has to choose amount of debt which will minimizes its total
agency costs which arises when there is a risk of default to a void dissatisfaction among the
investors.
Sales does not give a clear picture of operating efficiency when price of real estate are rising or
decreasing on account of inflation or trade depression. It is possible that profits may be more or
less not because of efficiency or inefficiency but because inflation or trade depression How ever
earning per share get influenced by changes in output or revenues through change and
implementation of positive efforts and by available obligatory defensive finance. To understand
this complicated relationship we have to analyze the leverages found in financial statements.
Calculation of Ratios and Their Results:
For the study ratios are calculated and their analysis is follows.
Study reveled that financial leverage ratio of simplex realty shows the highest average
among all of the companies. Whereas can fin financials, jmc project, DB intt are there in
the line subsequently.
Study reveled that Return on Capital Employed ratio of canfin financials shows the
highest average among all of the companies. Whereas cholamandulum, UB engg,
alfalaval are there in the line subsequently.
Study reveled that idfc have highest average Dividend Payout Ratio among of all the
companies. Whereas ivrcl reflects second highest, A.K capital, can fin financial are in the
line subsequently.
Study reveled that bajaj holdings have the highest average Interest Coverage Ratio among
all of the companies. Whereas unitech reflects second highest, then A.K capital, GG
dandekar are in the line subsequently

Asia Pacific Journal of Marketing & Management Review__________________________________________ ISSN 2319-2836 Vol.2 (8), August (2013) Online available at indianresearchjournals.com
83
Study reveled that IVRCL and Ansal buildwell have the highest average Earning Per
Share among all of the companies. Whereas rest of the companies reflects near to 1 and
slightly above.
Study reveled that ace integration have the highest average Growth In Sales whereas basil
infra reflects second highest, era infra are there in the line subsequently.
Study reveled that A.K capital have the highest average Growth in Earning Per Share jost
engg shows second highest. Similarly geojits, arihant, basil infra, simplex are in the line
subsequently.
Study reveled that simplex have highest average Growth in Dividend per Share among all
of the companies, DB intt, geojits financial are in the line subsequently.
Study reveled that pratibha infrastructure have the highest average Growth in Total
Assets, followed by era infrastructure, geojits financials subsequently.
Study reveled that UB engg, geojits, simplex Cost of Capital are in the line
consecutively.
Analyzing Financial Leverage and Its Relative Impact through Regression
MODEL BUILDING AND TESTING
1. ARIHANT CAPITAL
Model Summary
Model R R Square Adjusted R
Square
Std. Error of the Estimate
1 .924 .854 -.168 .1988606
a Predictors: (Constant), DP, ICR, GTA, GEPS, ROCE, GDPS, GS
ANOVA
Model Sum of
Squares
df Mean Square F Sig.
1 Regression .231 7 3.306E-02 .836 .690
Residual 3.955E02- 1 3.955E-02
Total .271 8
A. Predictors: (Constant), DP, ICR, GTA, GEPS, ROCE, GDPS, GS
B Dependent Variable: F.L

Asia Pacific Journal of Marketing & Management Review__________________________________________ ISSN 2319-2836 Vol.2 (8), August (2013) Online available at indianresearchjournals.com
84
Coefficients
Unstandardiz
ed
Coefficients
Standardize
d
Coefficients
t Sig.
Model B Std.
Error
Beta
1 (Constant) 1.085 .271 3.997 .156
ROCE 2.713E-03 .010 .221 .265 .835
ICR -2.385E-03 .002 -1.882 -1.494 .376
GS 1.090E-02 .007 5.854 1.566 .362
GEPS -2.169E-03 .001 -4.565 -1.556 .364
GDPS -4.553E-03 .004 -1.418 -1.044 .486
GTA -4.653E-03 .003 -2.054 -1.739 .332
DP -2.808E-02 .017 -.946 -1.678 .342
a Dependent Variable: F.L
MODEL
F.L = 2.713+ (-2.385)+1.090+(-2.169)+(-4.55)+(-4.65)+(-2.808)
The above model shows that none of the variable contributes significantly in determining the
value of financial leverage. The value of each variable lies within the range of 1.55 to -1.739.
Whereas value of R2
Square is .854 which is strong, but then also none of the variable
significantly contributes.
2. CHOLAMANDALAM
Model Summary
Model R R Square Adjusted R
Square
Std. Error of the
Estimate
1 .919 .844 -.249 1.6661783
a Predictors: (Constant), DP, ROCE, ICR, GDPS, GEPS, GTA, GS
ANOVA
Model Sum of
Squares
df Mean
Square
F Sig.
1 Regressio
n
15.003 7 2.143 .772 .707
Residual 2.776 1 2.776
Total 17.779 8
a Predictors: (Constant), DP, ROCE, ICR, GDPS, GEPS, GTA, GS
b Dependent Variable: F.L
Asia Pacific Journal of Marketing & Management Review__________________________________________ ISSN 2319-2836 Vol.2 (8), August (2013) Online available at indianresearchjournals.com
85
Coefficients
Unstandardized
Coefficients
Standardized
Coefficients
t Sig.
Model B Std.
Error
Beta
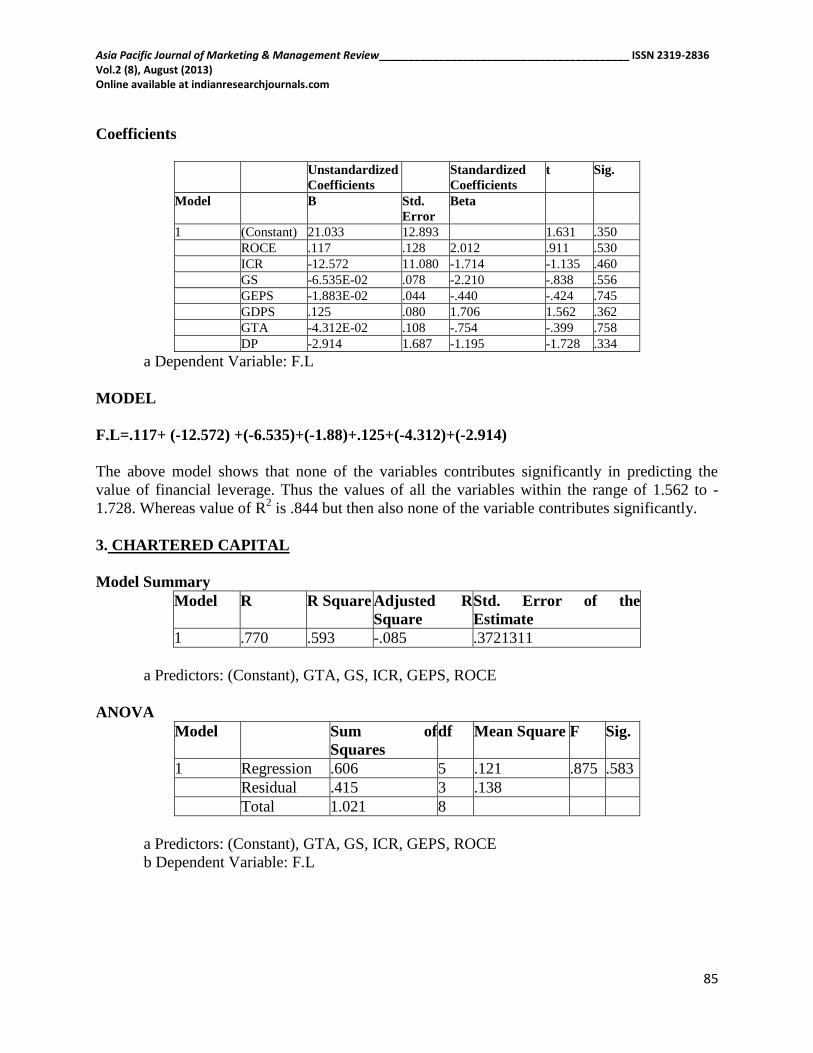
1 (Constant) 21.033 12.893 1.631 .350
ROCE .117 .128 2.012 .911 .530
ICR -12.572 11.080 -1.714 -1.135 .460
GS -6.535E-02 .078 -2.210 -.838 .556
GEPS -1.883E-02 .044 -.440 -.424 .745
GDPS .125 .080 1.706 1.562 .362
GTA -4.312E-02 .108 -.754 -.399 .758
DP -2.914 1.687 -1.195 -1.728 .334
a Dependent Variable: F.L
MODEL
F.L=.117+ (-12.572) +(-6.535)+(-1.88)+.125+(-4.312)+(-2.914)
The above model shows that none of the variables contributes significantly in predicting the
value of financial leverage. Thus the values of all the variables within the range of 1.562 to -
1.728. Whereas value of R2 is .844 but then also none of the variable contributes significantly.
3. CHARTERED CAPITAL
Model Summary
Model R R Square Adjusted R
Square
Std. Error of the
Estimate
1 .770 .593 -.085 .3721311
a Predictors: (Constant), GTA, GS, ICR, GEPS, ROCE
ANOVA
Model Sum of
Squares
df Mean Square F Sig.
1 Regression .606 5 .121 .875 .583
Residual .415 3 .138
Total 1.021 8
a Predictors: (Constant), GTA, GS, ICR, GEPS, ROCE
b Dependent Variable: F.L

Asia Pacific Journal of Marketing & Management Review__________________________________________ ISSN 2319-2836 Vol.2 (8), August (2013) Online available at indianresearchjournals.com
86
Coefficients
Unstandardized
Coefficients
Standardized
Coefficients
t Sig.
Model B Std. Error Beta
1 (Constant) .692 .171 4.060 .027
ROCE -7.130E-02 .077 -3.374 -.924 .424
ICR 9.965E-03 .014 .956 .699 .535
GS 2.107E-03 .003 .531 .722 .522
GEPS -.186 .358 -1.673 -.519 .640
GTA 2.109E-02 .088 1.141 .239 .827
a Dependent Variable: F.L
MODEL
F.L=(-7.13)+9.965+2.107+(-.186)+2.109
The above model shows that none of the variables contributes significantly in predicting the
value of financial leverage. Thus the values of all the variables within the range of .722 to-.924,
whereas, value of R2 is .593 which is not so strong and does show perfect model
4. PATEL ENGINEERING
Model Summary
Model R R Square Adjusted R
Square
Std. Error of the
Estimate
1 1.000 1.000 1.000 .
a Predictors: (Constant), DP, GEPS, GS, GTA, ICR, GDPS, ROCE
ANOVA
Model Sum of
Squares
df Mean Square F Sig.
1 Regressio
n
.209 7 2.986E-02 . .
Residual 2.321E-
17
0 .
Total .209 7
a Predictors: (Constant), DP, GEPS, GS, GTA, ICR, GDPS, ROCE
b Dependent Variable: F.L

Asia Pacific Journal of Marketing & Management Review__________________________________________ ISSN 2319-2836 Vol.2 (8), August (2013) Online available at indianresearchjournals.com
87
Coefficients
Unstandardized
Coefficients
Standardized
Coefficients
t Sig.
Model B Std. Error Beta
1 (Constant) .525 .000 . .
ROCE 2.114E-02 .000 2.769 . .
ICR .184 .000 1.336 . .
GS -1.063E-03 .000 -.148 . .
GEPS -1.142E-03 .000 -.325 . .
GDPS 1.990E-03 .000 .442 . .
GTA -8.113E-03 .000 -1.896 . .
DP -4.684 .000 -2.180 . .
a Dependent Variable: F.L
MODEL
F.L=2.114+.184+ (-1.063) + (-1.142) +1.990+ (-8.11) + (-4.684)
The above model shows that none of the variables contributes significantly in predicting the
value of financial leverage. Whereas value of R2
is 1.00 which says that model is perfect in
predicting the value of financial leverage. Which is rare to find in practical scenario?
5. ACE INTEGRATED FINANCIAL
Model Summary
Model R R Square Adjusted
R Square
Std. Error of the
Estimate
1 .701 .491 -.188 3.0492749
a Predictors: (Constant), GTA, GEPS, ROCE, GS
ANOVA
Model Sum of
Squares
df Mean
Square
F Sig.
1 Regressio
n
26.906 4 6.726 .723 .631
Residual 27.894 3 9.298
Total 54.800 7
a Predictors: (Constant), GTA, GEPS, ROCE, GS
b Dependent Variable: F.L

Asia Pacific Journal of Marketing & Management Review__________________________________________ ISSN 2319-2836 Vol.2 (8), August (2013) Online available at indianresearchjournals.com
88
Coefficients
Unstandardized
Coefficients
Standardize
d
Coefficients
t Sig.
Model B Std. Error Beta
1 (Constant) -.714 1.179 -.606 .588
ROCE 1.178 .811 .893 1.453 .242
GS 5.410E-03 .005 1.267 1.197 .317
GEPS 1.298E-03 .005 .125 .274 .802
GTA -.583 .482 -1.415 -1.21 .313
a Dependent Variable: F.L
MODEL
F.L=1.178+5.410+1.298 + (-.583)
The above model shows that none of the variables contributes significantly in predicting the
value of financial leverage. Thus the values of all the variables within the range of 1.453 to
.274.Whereas value of R2 is .493 which is not significant rather weak in predicting the value of
financial leverage.
6. ANEON INVESTMENT
Model Summary
Model R R Square Adjusted R
Square
Std. Error of the
Estimate
1 .639 .409 -1.365 .7260636
a Predictors: (Constant), DP, GTA, GS, GEPS, GDPS, ROCE
ANOVA
Model Sum of
Squares
df Mean Square F Sig.
1 Regression .729 6 .121 .230 .932
Residual 1.054 2 .527
Total 1.783 8
a Predictors: (Constant), DP, GTA, GS, GEPS, GDPS, ROCE
b Dependent Variable: F.L

Asia Pacific Journal of Marketing & Management Review__________________________________________ ISSN 2319-2836 Vol.2 (8), August (2013) Online available at indianresearchjournals.com
89
Coefficients
Unstandardized
Coefficients
Standardized
Coefficients
T Sig.
Model B Std. Error Beta
1 (Constant) .249 1.778 .140 .901
ROCE 5.604E-02 .304 1.213 .184 .871
GS 2.985E-04 .009 .112 .035 .975
GEPS -5.027E-04 .006 -.329 -.081 .943
GDPS 7.236E-04 .012 .234 .061 .957
GTA -3.043E-02 .280 -.578 -.109 .923
DP 2.467E-02 .951 .018 .026 .982
a Dependent Variable: F.L
MODEL
F.L = 5.604+2.985+ (-5.027)+7.236+(-3.043)+2.467
The above model shows that none of the variables contributes significantly in predicting the
value of financial leverage. Thus the values of all the variables within the range of 0.184 to -
.081. Whereas value of R2 is .409 which is not significant rather weak in predicting the value of
financial leverage
7. BAJAJ HOLDINGS
Model Summary
Model R R Square Adjusted R
Square
Std. Error of the
Estimate
1 .980 .960 .678 7.022277E-02
a Predictors: (Constant), DP, ICR, GDPS, ROCE, GTA, GEPS, GS
ANOVA
Model Sum of
Squares
df Mean Square F Sig.
1 Regression .117 7 1.677E-02 3.402 .395
Residual 4.931E-03 1 4.931E-03
Total .122 8
a Predictors: (Constant), DP, ICR, GDPS, ROCE, GTA, GEPS, GS
b Dependent Variable: F.L

Asia Pacific Journal of Marketing & Management Review__________________________________________ ISSN 2319-2836 Vol.2 (8), August (2013) Online available at indianresearchjournals.com
90
Coefficients
Unstandardized
Coefficients
Standardized
Coefficients
t Sig.
Model B Std. Error Beta
1 (Constant) 1.277 .345 3.700 .168
ROCE -2.887E-02 .012 -1.887 -2.505 .242
ICR -1.704E-05 .000 -.224 -.659 .629
GS -8.640E-04 .003 -.270 -.249 .845
GEPS -1.185E-03 .002 -.479 -.633 .641
GDPS 2.006E-03 .002 .726 1.180 .448
GTA 1.607E-02 .006 3.142 2.859 .214
DP 9.887E-04 .000 1.020 1.979 .298
a Dependent Variable: F.L
MODEL
F.L= (-2.887+(-1.704)+(-8.640)+(-1.185)+2.006+1.607+9.887
The above model shows that ROCE and GTA of the variables contribute significantly in
predicting the value of financial leverage. Thus the values of all the variables within the range -
2.505 and 2.859. Whereas value of R2 is .960 which is significant in predicting the value of
financial leverage
8. AD MANUM FINANCIALS
Model Summary
Model R R Square Adjusted R
Square
Std. Error of the
Estimate
1 .770 .593 -.629 .9609588
a Predictors: (Constant), DP, GTA, ICR, GEPS, ROCE, GS
ANOVA
Model Sum of
Squares
df Mean
Square
F Sig.
1 Regression 2.687 6 .448 .485 .792
Residual 1.847 2 .923
Total 4.534 8
a Predictors: (Constant), DP, GTA, ICR, GEPS, ROCE, GS
b Dependent Variable: F.L

Asia Pacific Journal of Marketing & Management Review__________________________________________ ISSN 2319-2836 Vol.2 (8), August (2013) Online available at indianresearchjournals.com
91
Coefficients
Unstandardized
Coefficients
Standardized
Coefficients
t Sig.
Model B Std. Error Beta
1 (Constant) 3.211 1.937 1.658 .239
ROCE -3.776E-02 .063 -.802 -.595 .612
ICR -.237 .304 -.475 -.780 .517
GS 3.722E-02 .059 1.213 .634 .591
GEPS -3.097E-03 .005 -.403 -.646 .584
GTA -2.700E-02 .039 -1.091 -.697 .558
DP .202 .244 1.200 .830 .494
a Dependent Variable: F.L
MODEL
F.L= (-3.776) + (-.237) + 3.722 + (-3.097) + (2.700) +.202
The above model shows that none of the variables contributes significantly in predicting the
value of financial leverage. Thus the values of all the variables within the range of -.780 to .830.
Whereas value of R2 is .593 which is not significant rather weak in predicting the value of
financial leverage
9 A .K CAPITAL
Model Summary
Model R R Square Adjusted R
Square
Std. Error of the
Estimate
1 1.000 1.000 1.000 .
a Predictors: (Constant), GTA, GS, DP, ICR, GDPS, ROCE, GEPS
ANOVA
Model Sum of
Squares
df Mean Square F Sig.
1 Regression 1.171 7 .167 . .
Residual .000 0 .
Total 1.171 7
a Predictors: (Constant), GTA, GS, DP, ICR, GDPS, ROCE, GEPS
b Dependent Variable: F.L

Asia Pacific Journal of Marketing & Management Review__________________________________________ ISSN 2319-2836 Vol.2 (8), August (2013) Online available at indianresearchjournals.com
92
Coefficients
Unstandardized
Coefficients
Standardized
Coefficients
t Sig.
Model B Std. Error Beta
1 (Constant) .439 .000 . .
ROCE 3.696 .000 1.262 . .
DP -.001 .000 -.228 . .
ICR .000 .000 -.031 . .
GS .003 .000 .506 . .
GEPS .001 .000 12.365 . .
GDPS .003 .000 .333 . .
GTA -.033 .000 -12.693 . .
a Dependent Variable: F.L
MODEL
F.L =1.262+ (-.228) + (-.031) +.506+12.365+.333+ (-12.693)
The above model shows that none of the variables contributes significantly in predicting the
value of financial leverage. Whereas value of R2 is 1.00 which is significant in predicting the
value of financial leverage
10. ALFA LAVAL
Model Summary
Model R R Square Adjusted R
Square
Std. Error of the
Estimate
1 1.000 1.000 1.000 .
a Predictors: (Constant), GDPS, ROCE, GEPS, DP, ICR, GA, GS
ANOVA
Model Sum of
Squares
Df Mean Square F Sig.
1 Regression .126 7 .018 . .
Residual .000 0 .
Total .126 7
a Predictors: (Constant), GDPS, ROCE, GEPS, DP, ICR, GA, GS
b Dependent Variable: F.L

Asia Pacific Journal of Marketing & Management Review__________________________________________ ISSN 2319-2836 Vol.2 (8), August (2013) Online available at indianresearchjournals.com
93
Coefficients
Unstandardized
Coefficients
Standardized
Coefficients
t Sig.
Model B Std. Error Beta
1 (Constant) .198 .000 . .
ROCE .010 .000 .617 . .
DP .005 .000 .909 . .
ICR -.007 .000 -.945 . .
GS -.001 .000 -.095 . .
GEPS .000 .000 -.027 . .
GA .003 .000 .160 . .
GDPS .001 .000 .242 . .
a Dependent Variable: F.L
MODEL
F.L=.010+.005 + (-.007)+(-.001)+.000+.003+.001
The above model shows that none of the variables contributes significantly in predicting the
value of financial leverage. Whereas the value of R2 is 1.0 which is significant and strong in
predicting the value
11. GGDANDEKAR
Model Summary
Model R R Square Adjusted R
Square
Std. Error of the
Estimate
1 .944 .892 .136 .36266157
a Predictors: (Constant), GTA, DP, ICR, GDPS, ROCE, GS, GEPS
ANOVA
Model Sum of
Squares
df Mean Square F Sig.
1 Regression 1.087 7 .155 1.181 .612
Residual .132 1 .132
Total 1.218 8
a Predictors: (Constant), GTA, DP, ICR, GDPS, ROCE, GS, GEPS
b Dependent Variable: F.L
Asia Pacific Journal of Marketing & Management Review__________________________________________ ISSN 2319-2836 Vol.2 (8), August (2013) Online available at indianresearchjournals.com
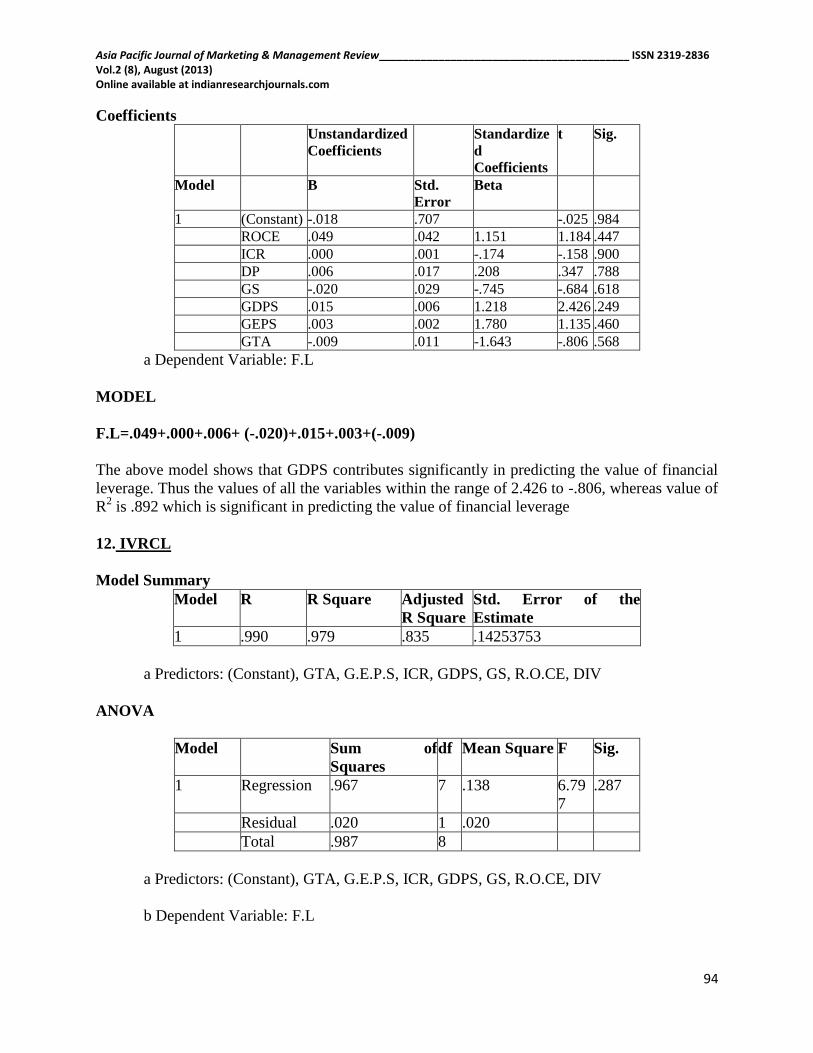
94
Coefficients
Unstandardized
Coefficients
Standardize
d
Coefficients
t Sig.
Model B Std.
Error
Beta
1 (Constant) -.018 .707 -.025 .984
ROCE .049 .042 1.151 1.184 .447
ICR .000 .001 -.174 -.158 .900
DP .006 .017 .208 .347 .788
GS -.020 .029 -.745 -.684 .618
GDPS .015 .006 1.218 2.426 .249
GEPS .003 .002 1.780 1.135 .460
GTA -.009 .011 -1.643 -.806 .568
a Dependent Variable: F.L
MODEL
F.L=.049+.000+.006+ (-.020)+.015+.003+(-.009)
The above model shows that GDPS contributes significantly in predicting the value of financial
leverage. Thus the values of all the variables within the range of 2.426 to -.806, whereas value of
R2 is .892 which is significant in predicting the value of financial leverage
12. IVRCL
Model Summary
Model R R Square Adjusted
R Square
Std. Error of the
Estimate
1 .990 .979 .835 .14253753
a Predictors: (Constant), GTA, G.E.P.S, ICR, GDPS, GS, R.O.CE, DIV
ANOVA
Model Sum of
Squares
df Mean Square F Sig.
1 Regression .967 7 .138 6.79
7
.287
Residual .020 1 .020
Total .987 8
a Predictors: (Constant), GTA, G.E.P.S, ICR, GDPS, GS, R.O.CE, DIV
b Dependent Variable: F.L

Asia Pacific Journal of Marketing & Management Review__________________________________________ ISSN 2319-2836 Vol.2 (8), August (2013) Online available at indianresearchjournals.com
95
Coefficients
Unstandardize
d Coefficients
Standardize
d
Coefficients
t Sig.
Model B Std.
Error
Beta
(Constant) 3.315 .974 3.404 .182
R.O.CE .005 .006 .268 .883 .540
DIV .001 .003 .097 .211 .868
ICR -.795 .362 -.998 -2.198 .272
GS .001 .005 .082 .227 .858
G.E.P.S .000 .002 .041 .126 .920
GDPS -.001 .002 -.078 -.301 .814
GTA .002 .003 .160 .737 .596
a Dependent Variable: F.L
MODEL
F.L=.005+.001+ (-.795) +.001+.000+ (-.001) +.002
The above model shows that ICR contributes significantly in predicting the value of financial
leverage. Thus the values of all the variables within the range of -2.198 to .883, whereas value of
R2 is .979 which is not significant rather weak in predicting the value of financial leverage
13. JOST ENGINEERS
Model Summary
Model R R Square Adjusted R
Square
Std. Error of the
Estimate
1 1.000 1.000 1.000 .
a Predictors: (Constant), GTA, GEPS, GDPS, DP, ROCE, ICR, GS
ANOVA
Model Sum of
Squares
df Mean Square F Sig.
1 Regression 14.921 7 2.132 . .
Residual .000 0 .
Total 14.921 7
a Predictors: (Constant), GTA, GEPS, GDPS, DP, ROCE, ICR, GS
b Dependent Variable: F.L
Asia Pacific Journal of Marketing & Management Review__________________________________________ ISSN 2319-2836 Vol.2 (8), August (2013) Online available at indianresearchjournals.com
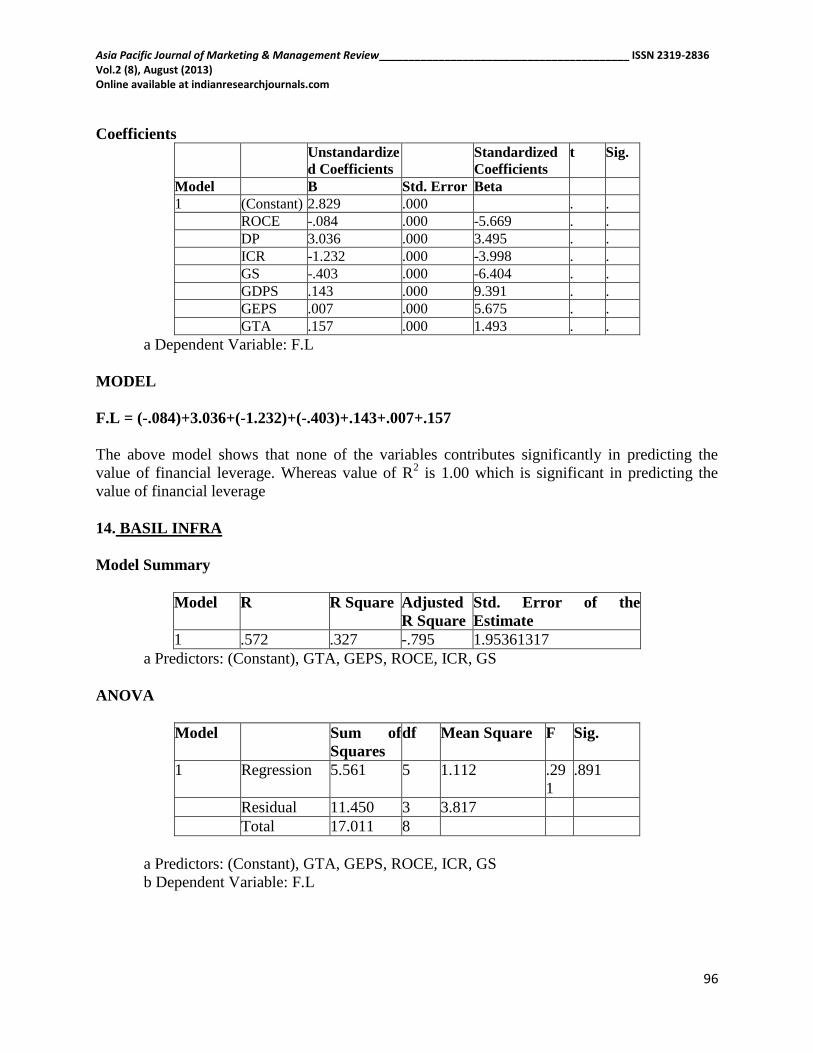
96
Coefficients
Unstandardize
d Coefficients
Standardized
Coefficients
t Sig.
Model B Std. Error Beta
1 (Constant) 2.829 .000 . .
ROCE -.084 .000 -5.669 . .
DP 3.036 .000 3.495 . .
ICR -1.232 .000 -3.998 . .
GS -.403 .000 -6.404 . .
GDPS .143 .000 9.391 . .
GEPS .007 .000 5.675 . .
GTA .157 .000 1.493 . .
a Dependent Variable: F.L
MODEL
F.L = (-.084)+3.036+(-1.232)+(-.403)+.143+.007+.157
The above model shows that none of the variables contributes significantly in predicting the
value of financial leverage. Whereas value of R2 is 1.00 which is significant in predicting the
value of financial leverage
14. BASIL INFRA
Model Summary
Model R R Square Adjusted
R Square
Std. Error of the
Estimate
1 .572 .327 -.795 1.95361317
a Predictors: (Constant), GTA, GEPS, ROCE, ICR, GS
ANOVA
Model Sum of
Squares
df Mean Square F Sig.
1 Regression 5.561 5 1.112 .29
1
.891
Residual 11.450 3 3.817
Total 17.011 8
a Predictors: (Constant), GTA, GEPS, ROCE, ICR, GS
b Dependent Variable: F.L

Asia Pacific Journal of Marketing & Management Review__________________________________________ ISSN 2319-2836 Vol.2 (8), August (2013) Online available at indianresearchjournals.com
97
Coefficients
Unstandardize
d Coefficients
Standardize
d
Coefficients
t Sig.
Model B Std.
Error
Beta
1 (Constant) .014 1.155 .012 .991
ROCE .009 .046 .100 .193 .860
ICR .031 .046 .391 .676 .547
GS -.007 .010 -1.687 -.655 .559
GEPS .002 .003 .535 .764 .501
GTA .046 .087 1.339 .531 .632
a Dependent Variable: F.L
MODEL
F.L=.009+.031+ (-.007) +.002+.046
The above model shows that none of the variables contributes significantly in predicting the
value of financial leverage. Thus the values of all the variables within the range of -.655 to .764.
Whereas value of R2 is .327 which is not significant rather very weak in predicting the value of
financial leverage
15. ERA INFRA
Model Summary
Model R R Square Adjusted R
Square
Std. Error of the
Estimate
1 1.000 1.000 1.000 .00200744
a Predictors: (Constant), GTA, ROCE, GEPS, DP, ICR, GDPS, GS
ANOVA
Model Sum of
Squares
df Mean Square F Sig.
1 Regression 1.576 7 .225 55881.252 .003
Residual .000 1 .000
Total 1.576 8
a Predictors: (Constant), GTA, ROCE, GEPS, DP, ICR, GDPS, GS
b Dependent Variable: F.L

Asia Pacific Journal of Marketing & Management Review__________________________________________ ISSN 2319-2836 Vol.2 (8), August (2013) Online available at indianresearchjournals.com
98
Coefficients
Unstandardized
Coefficients
Standardized
Coefficients
t Sig.
Model B Std. Error Beta
1 (Constant) 3.994 .009 435.988 .001
ROCE -.021 .000 -.643 -73.781 .009
ICR -.562 .002 -1.434 -297.390 .002
DP -.006 .001 -.105 -9.158 .069
GS .009 .000 .971 87.545 .007
GEPS .003 .000 .461 108.203 .006
GDPS .012 .000 .877 105.730 .006
GTA -.004 .000 -1.160 -69.358 .009
a Dependent Variable: F.L
MODEL
F.L= (-.021)+(-562)+(-.006)+.009+.003+.012+(-.004)
The above model shows that all of the variables contribute significantly in predicting the value of
financial leverage. Thus the values of all the variables within the range of 108.203 to -297.390
Whereas value of R2 is 1.0 which is significant rather very strong in predicting the value of
financial leverage. Hence it is a perfect model.
16 .JMC PROJECT
Model Summary
Model R R Square Adjusted R
Square
Std. Error of the
Estimate
1 .968 .937 .497 1.88699371
a Predictors: (Constant), gta, ROCE, GDPS, DP, GEPS, ICR, GS
ANOVA
Model Sum of
Squares
df Mean Square F Sig.
1 Regression 53.075 7 7.582 2.12
9
.485
Residual 3.561 1 3.561
Total 56.635 8
a Predictors: (Constant), gta, ROCE, GDPS, DP, GEPS, ICR, GS
b Dependent Variable: F.L

Asia Pacific Journal of Marketing & Management Review__________________________________________ ISSN 2319-2836 Vol.2 (8), August (2013) Online available at indianresearchjournals.com
99
Coefficients
Unstandardize
d Coefficients
Standardize
d
Coefficients
t Sig.
Model B Std. Error Beta
1 (Constant) 5.407 2.550 2.121 .280
ROCE .007 .044 .067 .167 .895
ICR -2.911 1.637 -1.669 -1.779 .326
DP .285 .112 1.080 2.554 .238
GS -.129 .076 -4.427 -1.695 .339
GEPS .019 .008 1.907 2.247 .267
GDPS .015 .026 .313 .588 .662
GTA .206 .190 2.701 1.086 .474
a Dependent Variable: F.L
MODEL:
F.L = .167 + (-1.779)+2.554+(-1.695)+2.247+.588+1.086
The above model shows that Dividend payout ratio and GEPS contributes significantly in
predicting the value of financial leverage. Thus, the values of all the variables are within the
range of 2.554 to -1.779. Whereas value of R2 is .937 which is not significant rather weak in
predicting the value of financial leverage
17. PBA INFRA
Model Summary
Model R R Square Adjusted R
Square
Std. Error of the
Estimate
1 1.000 .999 .995 .64402715
a Predictors: (Constant), GTA, ROCE, GS, GDPS, GEPS, ICR, DP
ANOVA
Model Sum of
Squares
df Mean Square F Sig.
1 Regression 641.734 7 91.676 221.029 .052
Residual .415 1 .415
Total 642.148 8
a Predictors: (Constant), GTA, ROCE, GS, GDPS, GEPS, ICR, DP
b Dependent Variable: F.L

Asia Pacific Journal of Marketing & Management Review__________________________________________ ISSN 2319-2836 Vol.2 (8), August (2013) Online available at indianresearchjournals.com
100
Coefficients
Unstandardize
d Coefficients
Standardized
Coefficients
t Sig.
Model B Std.
Error
Beta
(Constant) 50.485 1.991 25.355 .025
ROCE -.197 .033 -.171 -6.013 .105
ICR -12.568 .899 -.605 -13.980 .045
DP -.537 .052 -.637 -10.320 .061
GS .039 .010 .237 3.932 .159
GEPS -.009 .001 -.666 -11.998 .053
GDPS .101 .021 .207 4.911 .128
GTA -.051 .026 -.112 -1.942 .303
a Dependent Variable: F.L
MODEL
F.L=(-.197)+(-12.568)+(-.537)+.039+(-.009)+.101+(-.051)
The above model shows that, all the variables contribute significantly in predicting the value of
financial leverage. Thus, the values of all the variables are within the range of -13.980 to 4.911.
Whereas the value of R2 is 0.993, which is significant rather very strong in predicting the value
of financial leverage. Hence the model is perfect.
18. SIMPLEX REALTY
Model Summary
Model R R Square Adjusted R
Square
Std. Error of the
Estimate
1 .989 .979 .916 5.48335565
a Predictors: (Constant), GTA, R.O.CE, GS, DIV, G.E.P.S, ICR
ANOVA
Model Sum of
Squares
df Mean Square F Sig.
1 Regressio
n
2806.448 6 467.741 15.557 .062
Residual 60.134 2 30.067
Total 2866.583 8
a Predictors: (Constant), GTA, R.O.CE, GS, DIV, G.E.P.S, ICR
b Dependent Variable: F.L
Asia Pacific Journal of Marketing & Management Review__________________________________________ ISSN 2319-2836 Vol.2 (8), August (2013) Online available at indianresearchjournals.com
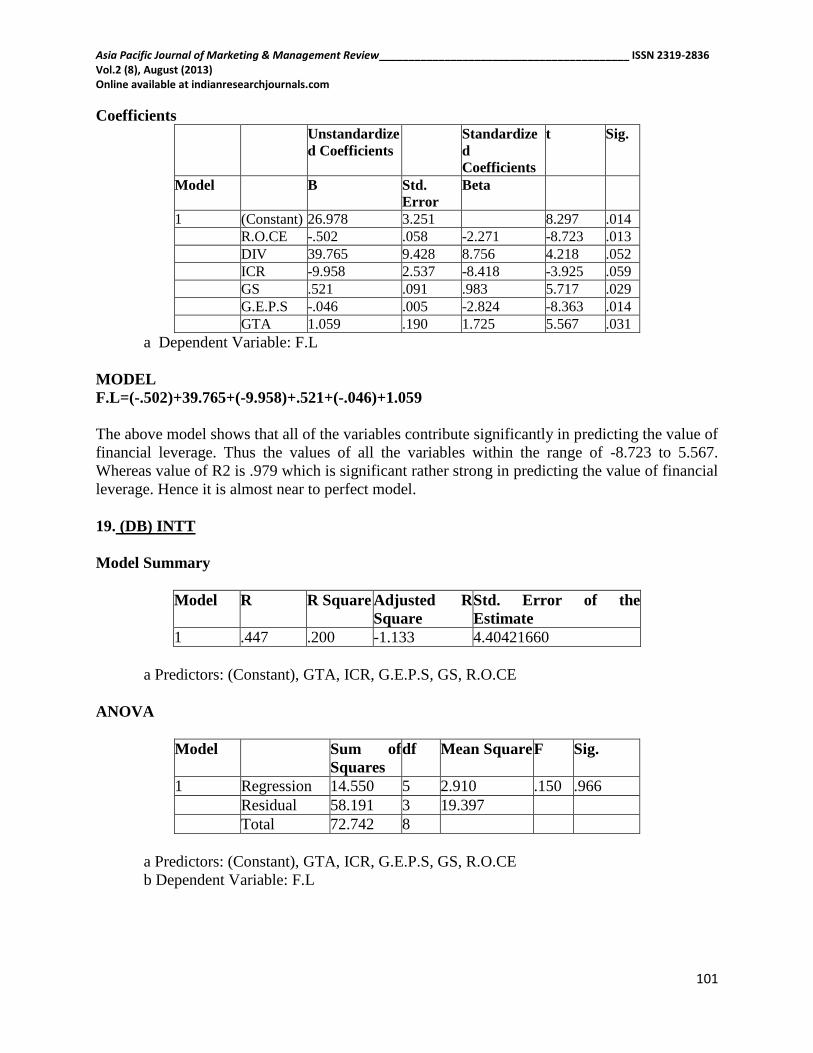
101
Coefficients
Unstandardize
d Coefficients
Standardize
d
Coefficients
t Sig.
Model B Std.
Error
Beta
1 (Constant) 26.978 3.251 8.297 .014
R.O.CE -.502 .058 -2.271 -8.723 .013
DIV 39.765 9.428 8.756 4.218 .052
ICR -9.958 2.537 -8.418 -3.925 .059
GS .521 .091 .983 5.717 .029
G.E.P.S -.046 .005 -2.824 -8.363 .014
GTA 1.059 .190 1.725 5.567 .031
a Dependent Variable: F.L
MODEL
F.L=(-.502)+39.765+(-9.958)+.521+(-.046)+1.059
The above model shows that all of the variables contribute significantly in predicting the value of
financial leverage. Thus the values of all the variables within the range of -8.723 to 5.567.
Whereas value of R2 is .979 which is significant rather strong in predicting the value of financial
leverage. Hence it is almost near to perfect model.
19. (DB) INTT
Model Summary
Model R R Square Adjusted R
Square
Std. Error of the
Estimate
1 .447 .200 -1.133 4.40421660
a Predictors: (Constant), GTA, ICR, G.E.P.S, GS, R.O.CE
ANOVA
Model Sum of
Squares
df Mean Square F Sig.
1 Regression 14.550 5 2.910 .150 .966
Residual 58.191 3 19.397
Total 72.742 8
a Predictors: (Constant), GTA, ICR, G.E.P.S, GS, R.O.CE
b Dependent Variable: F.L

Asia Pacific Journal of Marketing & Management Review__________________________________________ ISSN 2319-2836 Vol.2 (8), August (2013) Online available at indianresearchjournals.com
102
Coefficients
Unstandardiz
ed
Coefficients
Standardize
d
Coefficients
t Sig.
Model B Std.
Error
Beta
(Constant
)
2.652 2.522 1.052 .370
R.O.CE .065 .286 .585 .228 .834
ICR -.014 .037 -.293 -.369 .736
GS -.029 .057 -.609 -.514 .643
G.E.P.S -.001 .011 -.052 -.065 .952
GTA -.020 .189 -.249 -.107 .921
a Dependent Variable: F.L
MODEL
F.L=.065+(-.014)+(-.029)+(-.001)+(-.020)
The above model shows that none of the variables contributes significantly in predicting the
value of financial leverage. Thus the values of all the variables within the range of .228 to -
.514.Whereas value of R2 is .222 which is not significant rather weak in predicting the value of
financial leverage.
20. PRATIBHA INFRA
Model Summary
Model R R Square Adjusted R
Square
Std. Error of the
Estimate
1 1.000 1.000 1.000 .
a Predictors: (Constant), GTA, GDPS, GS, GEPS, ICR, DP, ROCE
ANOVA
Model Sum
of
Squar
es
df Mean Square F Sig.
1 Regression .584 7 .083 . .
Residual .000 0 .
Total .584 7
a Predictors: (Constant), GTA, GDPS, GS, GEPS, ICR, DP, ROCE
b Dependent Variable: F.L
Asia Pacific Journal of Marketing & Management Review__________________________________________ ISSN 2319-2836 Vol.2 (8), August (2013) Online available at indianresearchjournals.com
103
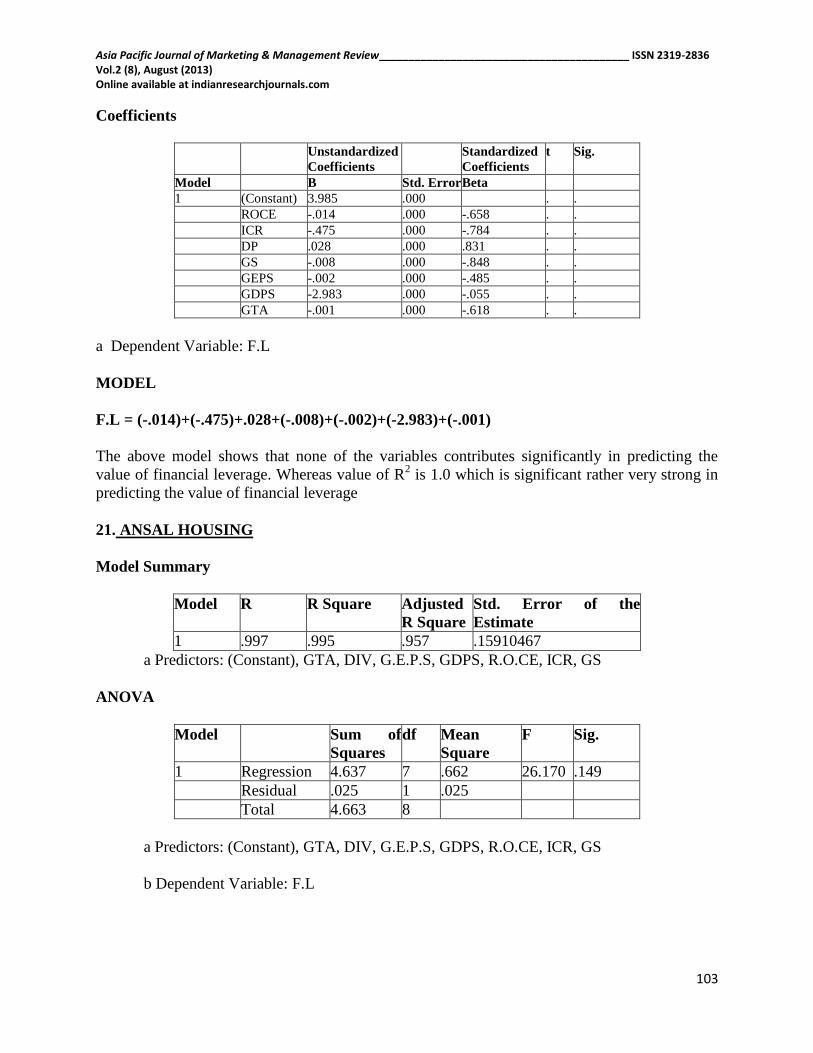
Coefficients
Unstandardized
Coefficients
Standardized
Coefficients
t Sig.
Model B Std. Error Beta
1 (Constant) 3.985 .000 . .
ROCE -.014 .000 -.658 . .
ICR -.475 .000 -.784 . .
DP .028 .000 .831 . .
GS -.008 .000 -.848 . .
GEPS -.002 .000 -.485 . .
GDPS -2.983 .000 -.055 . .
GTA -.001 .000 -.618 . .
a Dependent Variable: F.L
MODEL
F.L = (-.014)+(-.475)+.028+(-.008)+(-.002)+(-2.983)+(-.001)
The above model shows that none of the variables contributes significantly in predicting the
value of financial leverage. Whereas value of R2 is 1.0 which is significant rather very strong in
predicting the value of financial leverage
21. ANSAL HOUSING
Model Summary
Model R R Square Adjusted
R Square
Std. Error of the
Estimate
1 .997 .995 .957 .15910467
a Predictors: (Constant), GTA, DIV, G.E.P.S, GDPS, R.O.CE, ICR, GS
ANOVA
Model Sum of
Squares
df Mean
Square
F Sig.
1 Regression 4.637 7 .662 26.170 .149
Residual .025 1 .025
Total 4.663 8
a Predictors: (Constant), GTA, DIV, G.E.P.S, GDPS, R.O.CE, ICR, GS
b Dependent Variable: F.L

Asia Pacific Journal of Marketing & Management Review__________________________________________ ISSN 2319-2836 Vol.2 (8), August (2013) Online available at indianresearchjournals.com
104
Coefficients
Unstandardize
d Coefficients
Standardized
Coefficients
t Sig.
Model B Std. Error Beta
1 (Constant) 2.076 .418 4.971 .126
R.O.CE .051 .028 .514 1.815 .321
DIV .063 .039 .802 1.641 .348
ICR -1.529 .341 -2.399 -4.480 .140
GS -.068 .043 -2.109 -1.573 .361
G.E.P.S -.007 .003 -.744 -2.126 .280
GDPS .068 .025 1.467 2.683 .227
GTA .048 .019 2.170 2.478 .244
a Dependent Variable: F.L
MODEL
F.L=.051+.063+(-1.529)+(-.068)+(-.007)+.068+.048
The above model shows that ICR ,GEPS,GDPS,GTA contributes significantly in predicting the
value of financial leverage. Thus the values of all the variables within the range of -4.480 to -
2.126. Whereas value of R2 is .993 which is significant rather very strong in predicting the value
of financial leverage. Hence the model is perfect.
22. GEOJIT FINANCIALS
Model Summary
Model R R Square Adjusted
R Square
Std. Error of the
Estimate
1 .970 .941 .525 .72142948
a Predictors: (Constant), GTA, GEPS, ICR, ROCE, GS, DP, GDPS
ANOVA
Model Sum of
Squares
df Mean Square F Sig.
Regression 8.239 7 1.177 2.261 .473
Residual .520 1 .520
Total 8.760 8
a Predictors: (Constant), GTA, GEPS, ICR, ROCE, GS, DP, GDPS
b Dependent Variable: F.L

Asia Pacific Journal of Marketing & Management Review__________________________________________ ISSN 2319-2836 Vol.2 (8), August (2013) Online available at indianresearchjournals.com
105
Coefficients
Unstandardized
Coefficients
Standardized
Coefficients
t Sig.
Model B Std. Error Beta
1 (Constant) 3.905 .823 4.744 .132
ROCE -.038 .013 -1.130 -2.932 .209
ICR .004 .005 .314 .775 .580
DP -.006 .002 -1.627 -2.665 .229
GS -.038 .024 -1.556 -1.585 .358
GDPS .033 .017 4.787 1.957 .301
GEPS -.003 .002 -2.933 -1.980 .298
GTA .012 .007 1.412 1.731 .333
a Dependent Variable: F.L
MODEL
F.L=-.038+.004+(-.006)+(-.038)+.033+(-.003)+.012
The above model shows that ROCE, DP contributes significantly in predicting the value of
financial leverage. Thus the values of all the variables within the range of -2.932 to 1.731.
Whereas value of R2 is .941 which is not significant rather weak in predicting the value of
financial leverage.
23. UNITECH
Model Summary
Model R R Square Adjusted R
Square
Std. Error of the
Estimate
1 1.000 1.000 .996 .02421515
a Predictors: (Constant), GTA, GDPS, DP, GEPS, GS, ICR, ROCE
ANOVA
Model Sum of
Squares
df Mean Square F Sig.
1 Regression 1.331 7 .190 324.269 .043
Residual .001 1 .001
Total 1.332 8
a Predictors: (Constant), GTA, GDPS, DP, GEPS, GS, ICR, ROCE
b Dependent Variable: FL
Asia Pacific Journal of Marketing & Management Review__________________________________________ ISSN 2319-2836 Vol.2 (8), August (2013) Online available at indianresearchjournals.com
106
Coefficients
Unstandardized
Coefficients
Standardized
Coefficients
t Sig.
Model B Std. Error Beta
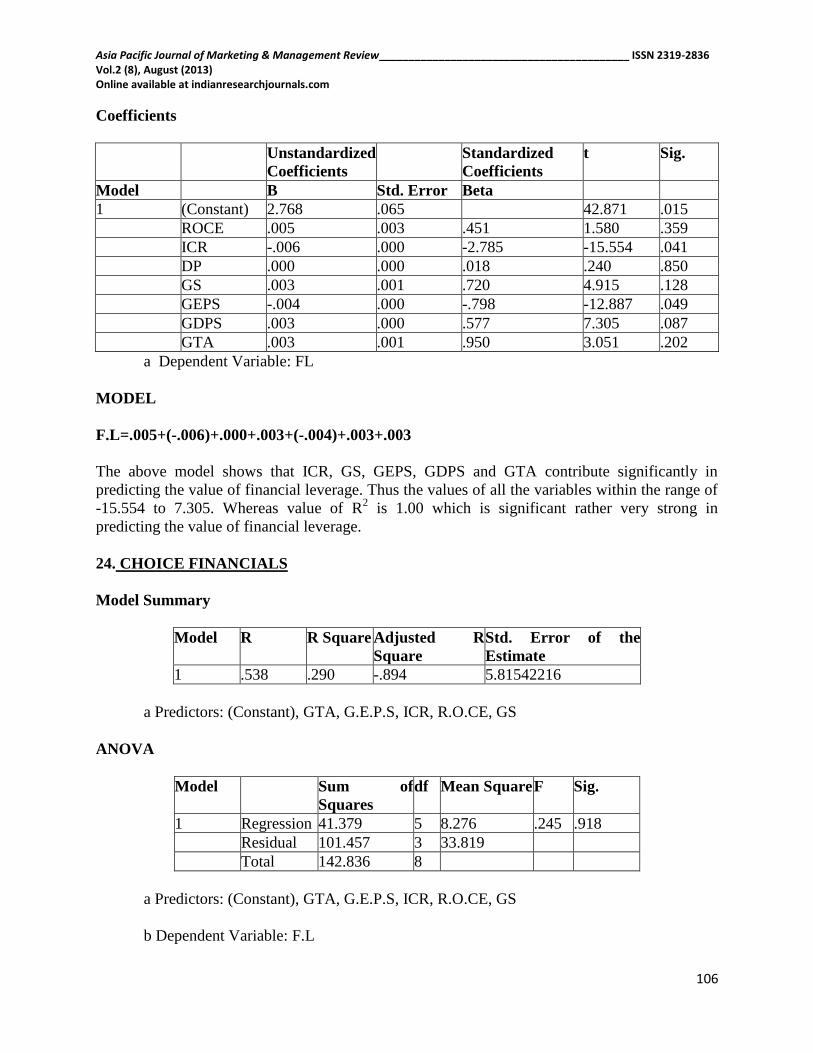
1 (Constant) 2.768 .065 42.871 .015
ROCE .005 .003 .451 1.580 .359
ICR -.006 .000 -2.785 -15.554 .041
DP .000 .000 .018 .240 .850
GS .003 .001 .720 4.915 .128
GEPS -.004 .000 -.798 -12.887 .049
GDPS .003 .000 .577 7.305 .087
GTA .003 .001 .950 3.051 .202
a Dependent Variable: FL
MODEL
F.L=.005+(-.006)+.000+.003+(-.004)+.003+.003
The above model shows that ICR, GS, GEPS, GDPS and GTA contribute significantly in
predicting the value of financial leverage. Thus the values of all the variables within the range of
-15.554 to 7.305. Whereas value of R2 is 1.00 which is significant rather very strong in
predicting the value of financial leverage.
24. CHOICE FINANCIALS
Model Summary
Model R R Square Adjusted R
Square
Std. Error of the
Estimate
1 .538 .290 -.894 5.81542216
a Predictors: (Constant), GTA, G.E.P.S, ICR, R.O.CE, GS
ANOVA
Model Sum of
Squares
df Mean Square F Sig.
1 Regression 41.379 5 8.276 .245 .918
Residual 101.457 3 33.819
Total 142.836 8
a Predictors: (Constant), GTA, G.E.P.S, ICR, R.O.CE, GS
b Dependent Variable: F.L

Asia Pacific Journal of Marketing & Management Review__________________________________________ ISSN 2319-2836 Vol.2 (8), August (2013) Online available at indianresearchjournals.com
107
Coefficients
Unstandardiz
ed
Coefficients
Standardize
d
Coefficients
t Sig.
Model B Std. Error Beta
1 (Constant
)
.290 2.540 .114 .916
R.O.CE .641 .613 .598 1.045 .373
ICR 44.110 60.748 1.160 .726 .520
GS .030 .048 1.063 .632 .572
G.E.P.S -.002 .003 -.334 -.503 .650
GTA -.009 .060 -.070 -.141 .897
a Dependent Variable: F.L
MODEL
F.L = .641+44.110+.030+(-.002)+(-.009)
The above model shows that none of the variables contributes significantly in predicting the
value of financial leverage. Thus the values of all the variables within the range of 1.045 to -
.503. Whereas value of R2 is .493 which is not significant rather weak in predicting the value of
financial leverage.
25. UB ENGG
Model Summary
Model R R Square Adjusted R
Square
Std. Error of the
Estimate
1 .712 .507 -.315 12.92378839
a Predictors: (Constant), GTA, GEPS, GS, ICR, ROCE
ANOVA
Model Sum of
Squares
df Mean
Square
F Sig.
1 Regression 514.900 5 102.980 .617 .703
Residual 501.073 3 167.024
Total 1015.972 8
a Predictors: (Constant), GTA, GEPS, GS, ICR, ROCE
b Dependent Variable: FL

Asia Pacific Journal of Marketing & Management Review__________________________________________ ISSN 2319-2836 Vol.2 (8), August (2013) Online available at indianresearchjournals.com
108
Coefficients
Unstandardize
d Coefficients
Standardized
Coefficients
t Sig.
Model B Std. Error Beta
1 (Constant) 4.415 5.804 .761 .502
ROCE .046 .075 .850 .611 .585
ICR -9.216 10.183 -1.124 -.905 .432
GS -.196 .209 -.755 -.937 .418
GEPS -.001 .004 -.141 -.332 .762
GTA .548 .497 1.718 1.103 .350
a Dependent Variable: FL
MODEL
F.L=.046+(-9.216)+(-.196)+(-.001)+.548
The above model shows that none of the variables contributes significantly in predicting the
value of financial leverage. Thus the values of all the variables within the range of 1.103 to -
.905. whereas value of R2 is .507 which is not significant rather weak in predicting the value of
financial leverage.
26. CAN FIN FINANCE
Model Summary
Model R R Square Adjusted
R Square
Std. Error of the
Estimate
1 .993 .986 .892 .20605767
a Predictors: (Constant), GTA, DIV, GDPS, GS, G.E.P.S, ICR, R.O.CE
ANOVA
Model Sum of
Squares
df Mean
Square
F Sig.
1 Regression 3.093 7 .442 10.406 .234
Residual .042 1 .042
Total 3.135 8
a Predictors: (Constant), GTA, DIV, GDPS, GS, G.E.P.S, ICR, R.O.CE
b Dependent Variable: F.L

Asia Pacific Journal of Marketing & Management Review__________________________________________ ISSN 2319-2836 Vol.2 (8), August (2013) Online available at indianresearchjournals.com
109
Coefficients
Unstandardized
Coefficients
Standardized
Coefficients
t Sig.
Model B Std. Error Beta
1 (Constant) 7.899 4.762 1.659 .345
R.O.CE .005 .048 .133 .101 .936
DIV -.002 .053 -.034 -.042 .973
ICR -12.652 9.867 -.981 -1.282 .422
GS .000 .026 -.003 -.007 .995
G.E.P.S -.008 .047 -.145 -.175 .889
GDPS -.020 .062 -.094 -.324 .801
GTA .011 .038 .193 .300 .814
a Dependent Variable: F.L
MODEL
F.L = .101+(-.042)+(-1.282)+(-.007)+(-.175)+(-.324)+.300
The above model shows that none of the variables contributes significantly in predicting the
value of financial leverage. Thus the values of all the variables within the range of 1.562 to -
1.728. Whereas value of R2 is .986 which is strong significant rather in predicting the value of
financial leverage.
27. RAJESHWARI GRAPHICS
Model Summary
Model R R Square Adjusted R
Square
Std. Error of the
Estimate
1 .629 .396 -1.416 10.42336860
a Predictors: (Constant), GTA, ICR, ROCE, GEPS, GS, DP
ANOVA
Model Sum of
Squares
df Mean
Square
F Sig.
1 Regressio
n
142.462 6 23.744 .219 .938
Residual 217.293 2 108.647
Total 359.755 8
a Predictors: (Constant), GTA, ICR, ROCE, GEPS, GS, DP
b Dependent Variable: F.L

Asia Pacific Journal of Marketing & Management Review__________________________________________ ISSN 2319-2836 Vol.2 (8), August (2013) Online available at indianresearchjournals.com
110
Coefficients
Unstandard
ized
Coefficients
Standardized
Coefficients
t Sig.
Model B Std.
Error
Beta
1 (Constant
)
-9.869 14.359 -.687 .563
ROCE .360 1.112 .381 .324 .777
ICR .278 .428 .556 .651 .582
DP -.009 .396 -.029 -.023 .983
GS -.020 .138 -.139 -.142 .900
GEPS -.011 .011 -.677 -.993 .426
GTA .125 .417 .269 .300 .792
a Dependent Variable: F.L
MODEL
F.L=.360+.278+(-.009)+(-.020)+(-.011)+.125
The above model shows that none of the variables contributes significantly in predicting the
value of financial leverage. Thus the values of all the variables within the range of .654 to -.677.
Whereas value of R2 is .396 which is not significant rather very weak in predicting the value of
financial leverage
28. CENLUB
Model Summary
Model R R Square Adjusted R
Square
Std. Error of the
Estimate
1 .713 .509 -.310 2.17356333
a Predictors: (Constant), GTA, GS, G.E.P.S, ICR, R.O.CE
ANOVA
Model Sum of
Squares
df Mean
Square
F Sig.
1 Regressio
n
14.682 5 2.936 .622 .701
Residual 14.173 3 4.724
Total 28.855 8
a Predictors: (Constant), GTA, GS, G.E.P.S, ICR, R.O.CE
b Dependent Variable: F.L

Asia Pacific Journal of Marketing & Management Review__________________________________________ ISSN 2319-2836 Vol.2 (8), August (2013) Online available at indianresearchjournals.com
111
Coefficients
Unstanda
rdized
Coefficie
nts
Standard
ized
Coefficie
nts
t Sig.
Model B Std.
Error
Beta
1 (Constant
)
.303 1.533 .198 .856
R.O.CE .042 .215 .237 .198 .856
ICR -.003 .273 -.013 -.011 .992
GS .037 .040 .644 .926 .423
G.E.P.S -.003 .004 -.337 -.684 .543
GTA -.052 .142 -.318 -.369 .736
a Dependent Variable: F.L
MODEL
F.L= .042+ (-.003) +.037+ (-.003) + (-.052)
The above model shows that none of the variables contributes significantly in predicting the
value of financial leverage. Thus the values of all the variables within the range of .926 to -.013.
Whereas value of R2 is .509 which is not significant rather weak in predicting the value of
financial leverage.
29. IDFC
Model Summary
Model R R Square Adjusted R
Square
Std. Error of the
Estimate
1 1.000 1.000 1.000 .
a Predictors: (Constant), GTA, R.O.CE, GDPS, GS, ICR, G.E.P.S, DIV
ANOVA
Model Sum of
Squares
df Mean Square F Sig.
1 Regression .845 7 .121 . .
Residual .000 0 .
Total .845 7
a Predictors: (Constant), GTA, R.O.CE, GDPS, GS, ICR, G.E.P.S, DIV
b Dependent Variable: F.L

Asia Pacific Journal of Marketing & Management Review__________________________________________ ISSN 2319-2836 Vol.2 (8), August (2013) Online available at indianresearchjournals.com
112
Coefficients
Unstandardiz
ed
Coefficients
Standardize
d
Coefficients
t Sig.
Model B Std.
Error
Beta
1 (Constant) 21.001 .000 . .
R.O.CE -420.723 .000 -3.918 . .
DIV -.004 .000 -11.266 . .
ICR 3.287 .000 2.619 . .
GS -.026 .000 -9.093 . .
G.E.P.S .064 .000 3.149 . .
GDPS -.088 .000 -3.998 . .
GTA -.074 .000 -4.515 . .
a Dependent Variable: F.L
MODEL
F.L= (-420.723) + (-.004) + 3.287 + (-.026) +.064+ (-.088) + (-.074)
The above model shows that none of the variables contributes significantly in predicting the
value of financial leverage. Thus the values of all the variables within the range of 1.562 to -
1.728. Whereas value of R2 is 1.0 which is significant rather strong in predicting the value of
financial leverage.
30 ANSAL BUILDWELL
Model Summary
Model R R Square Adjusted
R Square
Std. Error of the
Estimate
1 1.000 1.000 1.000 .
a Predictors: (Constant), GTA, DIV, GS, G.E.P.S, R.O.CE, GDPS, ICR
ANOVA
Model Sum of
Squares
df Mean Square F Sig.
1 Regression 14.114 7 2.016 . .
Residual .000 0 .
Total 14.114 7
a Predictors: (Constant), GTA, DIV, GS, G.E.P.S, R.O.CE, GDPS, ICR
b Dependent Variable: F.L
Asia Pacific Journal of Marketing & Management Review__________________________________________ ISSN 2319-2836 Vol.2 (8), August (2013) Online available at indianresearchjournals.com
113
Coefficients
Unstandardiz
ed
Coefficients
Standardize
d
Coefficients
t Sig.
Model B Std.
Error
Beta
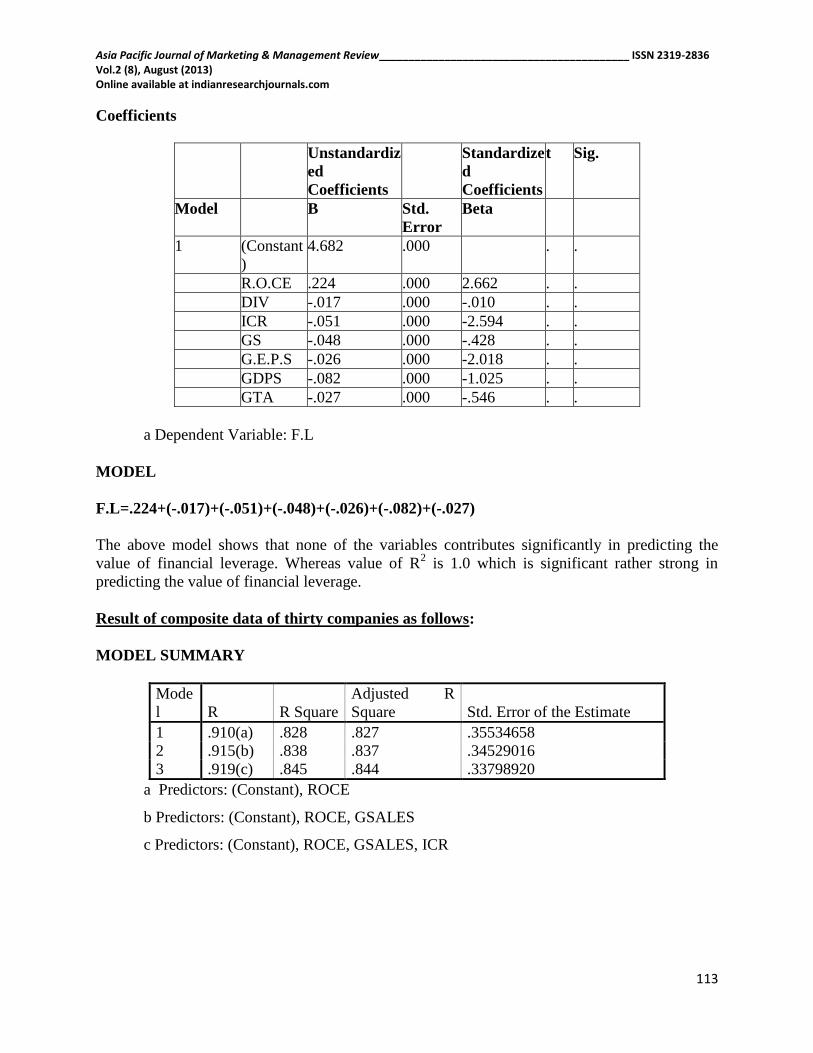
1 (Constant
)
4.682 .000 . .
R.O.CE .224 .000 2.662 . .
DIV -.017 .000 -.010 . .
ICR -.051 .000 -2.594 . .
GS -.048 .000 -.428 . .
G.E.P.S -.026 .000 -2.018 . .
GDPS -.082 .000 -1.025 . .
GTA -.027 .000 -.546 . .
a Dependent Variable: F.L
MODEL
F.L=.224+(-.017)+(-.051)+(-.048)+(-.026)+(-.082)+(-.027)
The above model shows that none of the variables contributes significantly in predicting the
value of financial leverage. Whereas value of R2 is 1.0 which is significant rather strong in
predicting the value of financial leverage.
Result of composite data of thirty companies as follows:
MODEL SUMMARY
Mode
l R R Square
Adjusted R
Square Std. Error of the Estimate
1 .910(a) .828 .827 .35534658
2 .915(b) .838 .837 .34529016
3 .919(c) .845 .844 .33798920
a Predictors: (Constant), ROCE
b Predictors: (Constant), ROCE, GSALES
c Predictors: (Constant), ROCE, GSALES, ICR
Asia Pacific Journal of Marketing & Management Review__________________________________________ ISSN 2319-2836 Vol.2 (8), August (2013) Online available at indianresearchjournals.com
114
ANOVA (d)
Model
Sum of
Squares Df
Mean
Square F Sig.
1 Regressi
on 204.411 1 204.411
1618.82
8 .000(a)
Residual 42.553 337 .126
Total 246.965 338
2 Regressi
on 206.905 2 103.453 867.706 .000(b)
Residual 40.060 336 .119
Total 246.965 338
3 Regressi
on 208.695 3 69.565 608.956 .000(c)
Residual 38.269 335 .114
Total 246.965 338
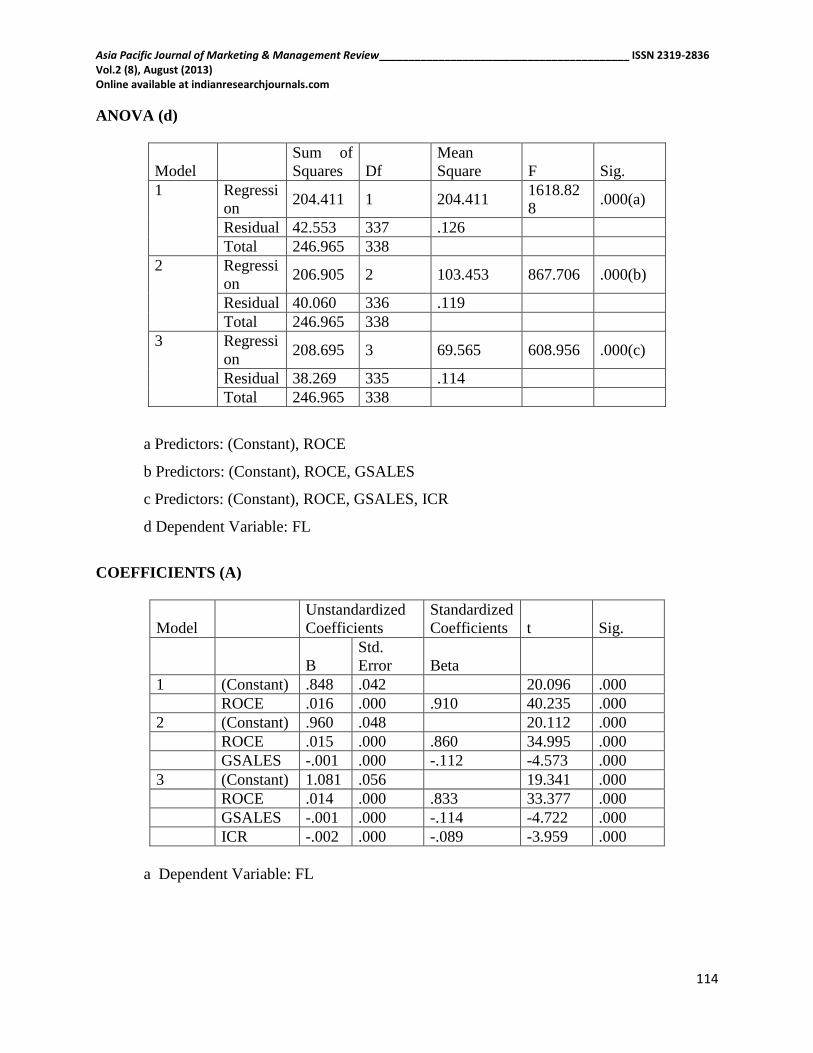
a Predictors: (Constant), ROCE
b Predictors: (Constant), ROCE, GSALES
c Predictors: (Constant), ROCE, GSALES, ICR
d Dependent Variable: FL
COEFFICIENTS (A)
Model
Unstandardized
Coefficients
Standardized
Coefficients t Sig.
B
Std.
Error Beta
1 (Constant) .848 .042 20.096 .000
ROCE .016 .000 .910 40.235 .000
2 (Constant) .960 .048 20.112 .000
ROCE .015 .000 .860 34.995 .000
GSALES -.001 .000 -.112 -4.573 .000
3 (Constant) 1.081 .056 19.341 .000
ROCE .014 .000 .833 33.377 .000
GSALES -.001 .000 -.114 -4.722 .000
ICR -.002 .000 -.089 -3.959 .000
a Dependent Variable: FL

Asia Pacific Journal of Marketing & Management Review__________________________________________ ISSN 2319-2836 Vol.2 (8), August (2013) Online available at indianresearchjournals.com
115
EXCLUDED VARIABLES (D)
Model Beta In T Sig.
Partial
Correlation
Collinearity
Statistics
Tolerance
1 ICR -.088(a) -3.781 .000 -.202 .915
DP -.015(a) -.644 .520 -.035 .998
GSAL
ES -.112(a) -4.573 .000 -.242 .800
GDPS -.041(a) -1.162 .246 -.063 .408
GEPS -.032(a) -.728 .467 -.040 .262
GTA .067(a) 1.445 .149 .079 .234
2 ICR -.089(b) -3.959 .000 -.211 .915
DP -.019(b) -.860 .390 -.047 .997
GDPS -.040(b) -1.153 .250 -.063 .408
GEPS .016(b) .360 .719 .020 .247
GTA .113(b) 2.461 .014 .133 .225
3 DP -.023(c) -1.056 .292 -.058 .995
GDPS -.042(c) -1.256 .210 -.069 .408
GEPS -.017(c) -.391 .696 -.021 .238
GTA .078(c) 1.673 .095 .091 .214
a Predictors in the Model: (Constant), ROCE
b Predictors in the Model: (Constant), ROCE, GSALES
c Predictors in the Model: (Constant), ROCE, GSALES, ICR
d Dependent Variable: FL
The results shown in the above table, reflects the composite results of thirty companies
chosen for the study. It can be inferred from the results that the entire three model has its
value of R2 above .8 and thus the last model is the perfect model with the value of R
2
0.845 as the highest among all. And among all of the variables, only return on capital
employed, growth in sales and interest coverage ratio contribute significantly in
predicting the value of financial leverage.
Finding of the analysis:
For the purpose of the study, balance sheet and profit & loss account from (2000-2008) of thirty
real estate companies listed on BSE has been taken. Calculation of various financial ratios like
return on capital employed (ROCE), interest coverage ratio and cost of capital has been taken
into consideration .The investor reaction to market and non market events and subsequent
investor’s reaction. To test the relationship of thirty companies and their reaction to the model
applied. The results of all ratios are then grouped together and the average of respective company
is calculated. Thus a comparison among all the companies with regard to single ratios has been
done. As per the results, company with the highest average is ranked one and vice-versa. To

Asia Pacific Journal of Marketing & Management Review__________________________________________ ISSN 2319-2836 Vol.2 (8), August (2013) Online available at indianresearchjournals.com
116
understand the impact on return’s the regression model has been applied in to two parts. Firstly
model is applied to each company’s compiled data of nine years. And secondly, model is applied
to whole composite data. Therefore analysis has been done on both the parts; from there we
inferred that few ratios of all contribute significantly in predicting the value of financial leverage.
The study found that entire three model has its value of R2 above .8 and the last model is the
perfect model with the value of R2 0.845 as the highest among all. It is also been found that only
return on capital employed, growth in sales and interest coverage ratio has contributed
significantly in predicting the value of financial leverage. The study also produced the fact that
financial leverage impacts its shareholder’s return.
Conclusion:
Consumers saving and investor risk taking appetite will direct the growth and development of
Real Estate Industry. During the period financial market was on boom and due to globalization
earning of common man has increased and led to extra saving and investment accordingly. In the
study develop model explains how the financial leverage of the Real Estate Industry is
determined by some factors. The data used is derived by the financial statement of thirty BSE
listed firms; regression analysis has been used to analyze the extracted data of respective
competitive real estate companies. The dependent variable is financial leverage.
The finding of the study revealed that the leverage ratio is positively related to its profitability
and growth parameters of the firms and simultaneously the findings of the study reflect that the
profitability of the firm is positively related to its financial leverage. The profitability of the
firms has been measured as the ratio of earnings before taxes dividend by total assets. The study
produced significant fact and it can be considered as a judicious indication for future course of
action that firms generally finance their activities following the financing procedure implied by
pecking order theory. It is also been found that firms with higher profitability ratios tend to use
less debt than firms that do not generate high profits. The study found that among the selected
firms those who have high profitability have generated high internal cash flows and have used
generated cash flow primarily to finance their investments. Therefore, they have not used much
debt capital in comparison with firms that are not so profitable. Debt funds are justified only
when ROCE is more than rate of interest. Companies with high ROCE due to efficient use of
financial resources supported by effective capital structure with leverage must adopt liberal
dividend policy to encourage and intact their present and future investors
References
A.I Scott, J.J, ―Bankruptcy, Secured Debt and Optimal capital Structure‖, Journal of
Finance (March, 1977)
Barnes, A. James ―A Pedagogic Note on Cost of Capital.‖ Journal of Finance (March
1964)
Baumo, William and Durton G. Michael. ―The Firm’s Optimal Debt Equity Combination
and the Cost of Capital‖. Quarterly Journal of Economics (November, 1967)
Chun-Chang Lee, Shu-Zhange Lin, Shu-Man You
and Jui-Kou Shang
(2012), A
comparison of regular and franchise systems in the real estate brokerage industry in terms
of operating efficiency—Application of the data envelopment analysis, African Journal

Asia Pacific Journal of Marketing & Management Review__________________________________________ ISSN 2319-2836 Vol.2 (8), August (2013) Online available at indianresearchjournals.com
117
of Business Management Vol. 6(25), pp. 7431-7438, 27 June, 2012, ISSN 1993-8233
©2012 Academic Journals
David C. Ling and Andy Naranjo (2003), The Integration of Commercial Real Estate
Markets and Stock Markets, Vol. 27, Issue 3, page 483-515
David Durand, The use of Debt and Equity Fund in Business: Trends and problems of
measurement‖, (ED) The Management of Corporate Capital. New York, The Free Press
of Glencoe, 1960 pp.230-45‖
Ezra Solomon, ‖Leverage and the Cost of Capital: Journal of Finance (may,
1963)pp,330-65,
Eugene F.Brigham, Michael C.Ehrhardt, ―Financial Management, Theory and Practice
10th
Edition
Haley, Charles W., ―A Note on the Cost of Debt‖, Journal of Finance and statically
Analysis (December, 1966)
International Journal of management Science (December 2008)
J.V. Elliot, Elliot, J.., ―The cost of Capital and U.S Capital Investment: A test of
Alternative Concepts, ―Journal of Finance (September, 1980)
Kulkarni, ―P.N.Financial Management Bombay: Himalaya Publishing House, 1985
Miller &Modglini, ―Corporate Income Taxes and the Cost of Capital: A correction,‖
American Economic Review 53, June 1963
Peter M. Mazonas et al- Patent, (2000), Reverse mortgage processing system, Issue Date-
Jan 4- 2000
Steven R. Grendier (1995), The Journal of Real Estate Finance and Economics, Volume
10, Issue 2, pp 95-119
Sharma, M.Y Khans and P.K Jain. ―Financial Management. New Delhi, Tata Mc-Graw-
Hill Publishing Co Ltd, 1986
Stephen A. Pyhrr, Stephen E. Roulac and Waldo L. Born (1999), Real Estate Cycles and
Their Strategic Implications for Investors and Portfolio Managers in the Global
Economy, Journal of Real Estate Research, Vol. 18, Issue 1, pp 7-68
Thomas E. McCue and Jhon L. Kling, (1994), Real Estate Returns and the
Macroeconomy: Some Emperical Evidence from Real Estate Investment Trust, Volume
9, Issue 3, pp- 277-288.
Books
Ravi. M. Kishore (Tax Man Publication 2008 edition)
I.M Panday (Vidya Prakashan 2008)
Khan & Jain (Tata MaCgrahills 2008)
Lal Bagwan (Toppers Publication, Daryagan, N.D, 2008)

Asia Pacific Journal of Marketing & Management Review__________________________________________ ISSN 2319-2836 Vol.2 (8), August (2013) Online available at indianresearchjournals.com
118
Website
www.moneycontrol.com
www.bseindia.com
www.nseindia.com
Each company’s respective website
December 2, 2008 – 8:30 am,WWW.INDIANREALTYNEWS.COM).
December 4, 2008 – 12:40 am Banks want RBI to ease realty NPA norms
December 5, 2008 – 6:10 am Sahara to defy realty slowdown
December 6, 2008 – 1:42 am What makes India a good investment hub?
December 9, 2008 – 12:51 am Unitech is close to finalizing hotel deal
December 8, 2008 – 2:08 am RBI cuts repo to help Real Estate
December 9, 2008 – 5:41 am Transparency in Real Estates is improving
December 11, 2008 – 6:05 am Indian investment property show gets new date
December 11, 2008 – 6:08 am Govt to miss indirect tax collection targets
December 11, 2008 – 11:48 pm Dubai is showing symptoms of acute financial strain
December 12, 2008 – 5:58 am Mumbai rental market hit hard
December 13, 2008 – 12:17 am Rate-cut campaign in full swing
December 15, 2008 – 4:28 am Realty stocks in demand on special home loan plan
December 16, 2008 – 2:33 am Real estate cos hope govt help will revive demand
December 17, 2008 – 2:56 am December 18, 2008 – 2:04 am NBO to launch housing
index by March’09
December 18, 2008 – 2:04 am Investors ask Satyam to call off acquisitions