Prairie Valley School Division #208 2015-16 Annual Report · 2019-01-16 · 2015-16 Annual Report ....
95
Prairie Valley School Division #208 2015-16 Annual Report
Transcript of Prairie Valley School Division #208 2015-16 Annual Report · 2019-01-16 · 2015-16 Annual Report ....

Prairie Valley School Division #208 2015-16 Annual Report

Prairie Valley Board of Education Annual Report – 2015-16 – Page i
Table of Contents Table of Contents ............................................................................................................................. i
School Division Contact Information ...............................................................................................ii
Letter of Transmittal ....................................................................................................................... 1
Introduction .................................................................................................................................... 2
School Division Profile..................................................................................................................... 3
Governance ..................................................................................................................................... 7
School Division in the Community ................................................................................................ 10
Strategic Direction and Reporting ................................................................................................ 12
Demographics ............................................................................................................................... 33
Facilities Infrastructure Projects and Transportation ................................................................... 37
Financial Overview ........................................................................................................................ 42
Summary of Revenue and Expenses ......................................................................................... 42
Budget to Actual Revenue, Expenses and Variances ................................................................ 44
Appendices .................................................................................................................................... 45
Appendix A – Payee List ............................................................................................................ 45
Board Remuneration ............................................................................................................. 45
Personal Services ................................................................................................................... 45
Transfers ................................................................................................................................ 53
Supplier Payments ................................................................................................................. 54
Other Expenditures................................................................................................................ 55
Appendix B – Management Report and Audited Financial Statements ................................... 56

Prairie Valley Board of Education Annual Report – 2015-16 – Page ii
School Division Contact Information
Prairie Valley School Division #208 Physical Address: RM of Sherwood, 3080 Albert Street North Mailing Address: Box 1937 Phone: 306-949-3366 Toll-free: 1-877-266-1666 Fax: 306-543-1771 Website: www.pvsd.ca Email: [email protected] An electronic copy of this report is available at www.pvsd.ca/Publication/PlansReporting.

Prairie Valley Board of Education Annual Report – 2015-16 – Page 1
Letter of Transmittal
Honourable Don Morgan Q.C. Minister of Education Dear Minister Morgan: The Board of Education of Prairie Valley School Division #208 is pleased to provide you and the residents of the school division with the 2015-16 annual report. This report outlines activities and accomplishments of the school division and provides audited financial statements for the fiscal year September 1, 2015 to August 31, 2016.
Respectfully submitted
Janet Kotylak

Prairie Valley Board of Education Annual Report – 2015-16 – Page 2
Introduction This annual report presents an overview of the Prairie Valley School Division’s goals, activities and results for the fiscal year September 1, 2015 to August 31, 2016. This report provides a snapshot of Prairie Valley School Division, its governance structures, students, staff, programs and facilities. It includes information such as an organizational chart, school list, and payee list. In addition to detailing the school division’s outcomes, activities and results, this report outlines how the division has integrated the Education Sector Strategic Plan and the school division plan. The report provides a financial overview and financial statements that have been audited by an independent auditor following Public Sector Accounting Board standards.

Prairie Valley Board of Education Annual Report – 2015-16 – Page 3
School Division Profile
About Us Prairie Valley School Division is one of 28 school divisions in Saskatchewan. It is located in the southeast area of the province and encompasses 27,000 square kilometres, spanning a geographic area from Regina Beach and Bethune to the west, Kelliher and Lipton to the north, Milestone, Sedley and Montmartre to the south and Whitewood and Kennedy-Langbank to the east. Our geography greatly impacts our service delivery and cost models. Prairie Valley has 39 schools located in 32 communities. It is unique in that it is entirely rural, consisting of towns, villages, resort villages and rural municipalities, with no urban centre. There are two Hutterite colony schools in the division: Arm River and Lajord. Fifteen First Nations are within or are in close proximity to the division: Piapot, Muscowpetung, Pasqua, Standing Buffalo, Little Black Bear, Okanese, Star Blanket, Peepeekisis, Muskowekwan, Carry-the-Kettle, Sakimay, Cowessess, Kahkewistahaw, Ochapowace and Pheasant Rump.
Map of Prairie Valley School Division #208

Prairie Valley Board of Education Annual Report – 2015-16 – Page 4

Prairie Valley Board of Education Annual Report – 2015-16 – Page 5
Division Philosophical Foundation
The mission of Prairie Valley School Division is:
To Inspire and Empower One Another
The vision of Prairie Valley School Division is: Leadership in Learning and Life
Prairie Valley School Division is guided by seven statements that describe what the division
believes about student learning:
• A school division culture that focuses on maximizing student engagement, student learning and student achievement.
• Maximizing student contact time with regularly assigned staff. • Valuing learning opportunities for students both inside and outside of the classroom and
school. • Honouring the diversity of individual schools and communities within the unifying
framework of a culture of learning. • A culture of learning to maximize the quality of teaching and learning. • Continuous blocks of instructional days are critical to effective teaching and learning. • Accountability for learning by all stakeholders.
Prairie Valley School Division Values:
• Realize learning potential • Establish clear direction and high expectations • Celebrate achievement • Open and transparent communication • Share information, express ideas and understand others • Diversity and uniqueness • Equitable environments • Mutual respect, understanding and cooperation • Integrity and ethical behaviour, professionalism through honesty, respect, commitment
and dedication • Holistic learning • Meaningful, creative and innovative learning opportunities for all • Cooperative and collaborative relationships • Responsible leadership

Prairie Valley Board of Education Annual Report – 2015-16 – Page 6
Program Overview In 2015-2016, Prekindergarten was offered at 10 of the 30 schools offering elementary grades. Fort Qu’Appelle Elementary Community School ran two programs. Balcarres Community School ran one Prekindergarten program rather than two due to lower than projected enrolments. Broadview and Lipton schools each operated a combined Kindergarten/Prekindergarten program for four- and five-year-olds. Students in Prairie Valley School Division follow the Ministry of Education Saskatchewan Core Curriculum, which is intended to provide all Saskatchewan students with an education that will prepare them for their choices after finishing Grade 12. Core curriculum is developmental in nature and based on a Kindergarten to Grade 12 (K-12) continuum. In recognition of the stages of child growth and development, the grades are grouped into four levels:
• Kindergarten • Elementary (Grades 1-5) • Middle Years (Grades 6-9) • Secondary (Grades 10-12)
In addition, some schools offer specialized programming such as:
• Magnet programming • English as an additional language • Alternative programming for vulnerable students • Community school programming • Distance education • Language programming including core and enriched French and French immersion • Music/band programming • Nutrition programs
The division offers additional services and supports of specialized staff including:
• Career counselors • Child and family support workers and social workers • Curriculum consultants for specific subject areas • Literacy teachers • First Nations and Métis enhancement consultant and liaison worker • Occupational therapists • Psychologists • Speech-language pathologists

Prairie Valley Board of Education Annual Report – 2015-16 – Page 7
Governance
The Board of Education The Board of Education provides governance for Prairie Valley School Division as a whole and school community councils support student learning and community involvement at the school level. Prairie Valley School Division is governed by an eleven-member elected Board of Education. The Education Act, 1995 gives the Board of Education the authority to “administer and manage the educational affairs of the school division” and to “exercise general supervision and control over the schools in the school division.”
The school division is organized into 11 subdivisions for the purpose of elections, but once elected, the members of the Board of Education represent all students in the division and are committed to providing the very best education possible for each and every student. The Board of Education believes that all Saskatchewan students should experience equitable opportunities to learn and grow. In pursuing this goal, the Board is guided by the Saskatchewan School Boards Association (SSBA) definition of education equity:
For students, equity goes beyond providing all students with the same opportunities. Equity means ensuring that students who experience barriers to learning have the supports they need to achieve the same benefits and successes as all other students. Equity is about outcomes, results, and opportunities. For boards of education, education equity means equity of resources. Education equity means funding models that recognize it costs more to deliver the K-12 education program in some situations than in others and provide appropriate and adequate dollars so all boards of education can offer a comparable, equitable, high-quality program to their students.
Source: Responding to Diversity: Examining Education Equity in Saskatchewan, SSBA, 2011.
In doing its work, the Board listens to the voices of students. In 2015-2016, the Board held three student senates involving almost 150 students and endorsed follow up action plans to respond to what students told us. The senates covered a range of issues related to transitioning to high school, post-secondary education and the workforce, barriers to student achievement and graduation, respecting diversity, and other topics impacting the daily lives of students.

Prairie Valley Board of Education Annual Report – 2015-16 – Page 8
Elections for the Board of Education were held in October 2012 and the term of office is four years. Board of Education members as at August 31, 2016 were:
Subdivision 1 Bert de Gooijer (Vice Chair) Subdivision 2 Sandi Urban Subdivision 3 Kent Esplin Subdivision 4 Deanna Fjestad Subdivision 5 Jay Jenkins Subdivision 6 Terry Berglund Subdivision 7 Janet Kotylak (Chair) Subdivision 8 Judy Bradley Subdivision 9 Frank Thauberger Subdivision 10 Kenton Emery Subdivision 11 Rachel Sangwais
Back row: Terry Berglund, Bert de Gooijer, Janet Kotylak, Kent Esplin and Deanna Fjestad. Front row: Jay Jenkins, Kenton Emery, Judy Bradley, Sandi Urban and Frank Thauberger. Missing: Rachel Sangwais.

Prairie Valley Board of Education Annual Report – 2015-16 – Page 9
School Community Councils (SCCs) Prairie Valley School Division had 36 SCCs serving all schools in the division. There were no amalgamations or separations of SCCs. The board provided all SCCs with an operating grant of $2,000 at the beginning of the school year.
The Education Regulations, 1986 require school divisions to undertake orientation, training and development and networking opportunities for SCC members. In January 2016, Prairie Valley School Division held an SCC appreciation supper prior to the annual meeting as an opportunity for networking. A second opportunity to meet occurred in April 2016 when the board hosted two SCC celebration evenings and parent workshops. SCC members had an opportunity to network before a presentation on changes to SCC supporting documents. These changes included updating and increasing consistency among the Board Policy Manual, Administrative Procedures and the School Community Council Operations Manual as well as introducing a series of information sheets, templates and a new website page to assist SCCs in carrying out their duties. SCCs were also invited to attend a parent information session on mental health and substance abuse, which followed the presentation. The regulations also mandate SCCs to work with school staff to develop an annual learning improvement plan. In 2015-2016, SCCs endorsed school learning improvement plans. SCCs provided input into division-level planning through consultations on the new Board policy, “Respecting Human Diversity”. Board members attended SCC meetings regularly and engaged with SCCs through regional meetings with the board. SCCs worked diligently to promote and encourage parent and community involvement in schools. They participated in and supported student learning and student initiatives, communicated with their school’s parents and community members and promoted, organized and supported activities and events in the schools. One of the key challenges that SCCs faced was recruiting new members and difficulty making time to meet on a regular basis given busy schedules. While many SCCs noted that Prairie Valley School Division provided more networking opportunities, a few SCCs requested dedicated networking opportunities that are not tied to information sessions. We will be determining a course of action to help SCCs address these challenges in the 2016-2017 school year.

Prairie Valley Board of Education Annual Report – 2015-16 – Page 10
School Division in the Community
Community and Parent Involvement Prairie Valley School Division is an important part of the communities we serve. The division encourages parent and community consultations, engagement and partnerships with schools to achieve a close connection with all stakeholders and to ensure we are always working in the best interests of our students. Schools had a variety of programs and initiatives to encourage parent and community involvement. All schools in Prairie Valley School Division share a belief in the importance of SCCs in connecting the school with the larger community. SCCs play a role in governance (which is outlined in the section above) and most have established processes to foster community and parent involvement. Prairie Valley schools invited parent involvement in graduation activities, nutrition programs, preschool programs and literacy programs. Parents were engaged through communication books, classroom blogs, home visits, family days, parent nights (math and reading nights, etc.), parent volunteers and other activities to bridge home and school. Here are some examples of specific community involvement in events and initiatives:
The community was invited to attend the grand opening celebration at the Kipling Athletic Field.
Various First Nations and Métis community members were invited as leaders and knowledge keepers to support students in the annual production of the magazine Kitoskâyiminakwak Pîkiskwêwak – Our Young People Speak: The Holistic Edition.
In connection with the community, Milestone School and SCC raised funds to install new playground structures at the school.
Lumsden High School SCC sponsored a “Parents’ Night Out” evening. Parents brought their children to the school for students to babysit and funds collected for babysitting went to a program to feed 48 children for a year in a developing nation.
North Valley Elementary School invited First Nations community members to be guest speakers at their annual “Education Extravaganza” and share their history and culture.
Emerald Ridge Elementary School SCC and Administration struck a Safe Travel Planning Committee coordinated through Saskatchewan In Motion’s Active and Safe Routes to work with the Town of White City. The goal of the committee is to develop and enhance safe routes to and from school for students who walk, ride their bicycles, or otherwise transport themselves to school from within the Emerald Ridge Walk Zone.

Prairie Valley Board of Education Annual Report – 2015-16 – Page 11
Community Partnerships
Prairie Valley School Division places a high priority on developing relationships and meaningful partnerships that support the academic achievement and physical, social and emotional well-being of students. Prairie Valley works with community-based organizations, First Nations and Métis communities, community businesses and human service providers. Prairie Valley partnered with the Regina Trades and Skills Centre and Habitat for Humanity Regina to offer the Trades and Skills Carpentry Apprenticeship Program (TASCAP). Twenty-three Grade 11 students acquired skills and earned high school credits through hands-on experience in the housing construction industry. This real life experience also provided an opportunity for personal growth, as students learned about the value of teamwork and how meaningful it is to build a home for a family. Several schools partnered with community playschools and daycares to provide space for their programming needs. Our early learning classrooms engage with the regional health authorities, dental health organizations and optometrists to provide services or support family engagement in attaining services. Over 500 students who reside in First Nations communities attended Prairie Valley schools in 2015-2016. Services are provided under Education Services Agreements that specify educational services to be provided, accountability and reporting requirements and tuition fee arrangements. Prairie Valley School Division is committed to renewing Education Service Agreements with area First Nations and Indigenous and Northern Affairs Canada. Up-to-date agreements ensure a common understanding among the parties and consistent language and terms and provide the foundation for a strong partnership among First Nations and the school division.

Prairie Valley Board of Education Annual Report – 2015-16 – Page 12
Strategic Direction and Reporting
The Education Sector Strategic Plan Members of the education sector have worked together to develop an Education Sector Strategic Plan (ESSP) for 2014-2020. The ESSP describes the strategic direction of the education sector and its priorities and outcomes align the work of school divisions and the Ministry of Education. The plan is expected to shape a new direction in education for the benefit of all Saskatchewan students. 2015-16 was the second year of deployment of the 2014-2020 ESSP.
Enduring Strategies The Enduring Strategies in the ESSP are:
Culturally relevant and engaging curriculum; Differentiated, high quality instruction; Culturally appropriate and authentic assessment; Targeted and relevant professional learning; Strong family, school and community partnerships; Alignment of human, physical and fiscal resources.

Prairie Valley Board of Education Annual Report – 2015-16 – Page 13
Improving First Nations and Métis Student Engagement and Graduation Rates and Following Their Voices OUTCOME: By June 30, 2020, collaboration between First Nations and Métis and non-First Nations and Métis partners will result in significant improvement in First Nations and Métis student engagement and will increase the three-year graduation rate from 35% in June 2012 to at least 65%. PRIORITY: In partnership with First Nations and Métis stakeholders implement the Following Their Voices Initiative (Phase 1).
School division goals aligned with the First Nations and Métis Student Engagement and Graduation Rates outcome and the Following Their Voices priority
FNM students will achieve a 65% three-year graduation rate. o Actual: We achieved 57%, up from 42% the previous year. See
page 23 for details.
FNM and non-FMN students will achieve parity on the OurSCHOOL/Tell Them From Me engagement measures.
o Actual: Overall, the engagement measures indicate that students are able to find friendly, supportive, welcoming and intellectually challenging educational environments at school. The differences between FNM and non-FNM student responses range from 13 percentage points in Positive Relationships at school to four percentage points in Intellectual Engagement. As a system, we work to reduce and eliminate the gaps between FNM and non-FNM students and to strengthen engagement responses from all students. School administrators and staff encourage respectful, caring environments, develop ways to meaningfully connect each student with a caring adult in the school and seek student input into high school course offerings and extra-curricular opportunities. Specific information is included in each school's Learning Improvement Plan.
School division actions taken during the 2015-16 school year to achieve the targets and outcomes of the First Nations and Métis Student Engagement and Graduation Rates outcome and the Following Their Voices priority
Bert Fox Community High School completed the first year of Following Their Voices implementation with a cohort of ten teachers participating.
o The Ministry of Education implementation team collected data to gauge the success of the implementation process using three school-based surveys, on-site visits and targeted professional development.
o The data showed a decrease in negative student behaviour as indicated by fewer office discipline referrals and an increase in positive student perceptions of school climate as indicated in Our SCHOOL/Tell Them From Me data.
o In addition, increased student attendance over the last five months of the school year was attributed to focused academic, behaviour and attendance supports and programs.
o However, while student attendance increased, overall student enrolment decreased by 45 students from the beginning of the year to the end of the year.

Prairie Valley Board of Education Annual Report – 2015-16 – Page 14
The First Nations and Métis education consultant and school principals actively worked to engage education coordinators in schools with high populations of Aboriginal students through visits to Band offices and invitations to school events.
The Board hosted a First Nations and Métis Student Senate on November 20, 2015 at the Treaty 4 Tipi with 42 students from 16 schools. Students shared a wide range of messages which included:
o Gratitude for positive teacher-student relationships o A desire for equitable opportunities to access programming and
supports when needed o The need for teachers to maintain high expectations for all
students o A request for help in transitioning to provincial schools from First
Nations schools.
Deployed the First Nations and Métis Education Enhancement Consultation in Balcarres Community School to support students struggling with attendance, behaviour and academics.
Measures for Improving First Nations and Métis Student Engagement and Graduation Rates and Following Their Voices
Average Final Marks
Teacher-assigned marks are important indicators of student performance in school. Classroom marks are used for grade promotion and graduation decisions, to meet entrance requirements for postsecondary education, to determine eligibility for scholarships and awards and by some employers when hiring.
The following displays average final marks in selected secondary-level courses for all students, and by non-FNMI and FNMI student subpopulations in the division, along with provincial results for each category.
Notes: Results for populations of fewer than 10 students have not been reported to avoid identifying individuals or very small groups of students (nr). FNMI students are those who choose to self-identify as First Nations (Registered/Treaty/Status Indian, Non-Status Indian), Métis, or Inuit/Inuk. Non-FNMI students are those who do not identify as FNM or I, however this category may include FNMI students who choose not to self-identify. Source: Ministry of Education, 2016
Province Prairie Valley Province Prairie Valley Province Prairie Valley
English Language Arts A 10 (Eng & Fr equiv) 73.0 72.1 76.1 75.1 61.1 60.6
English Language Arts B 10 (Eng & Fr equiv) 73.4 74.7 76.2 77.4 62.5 62.4
Science 10 (Eng & Fr equiv) 72.0 75.7 75.1 78.5 59.6 64.4
Math: Workplace and Apprenticeship 10 (Eng & Fr equiv) 72.8 71.9 76.1 77.1 60.8 55.5
Math: Foundations and Pre-calculus 10 (Eng & Fr equiv) 72.4 72.2 74.8 75.8 60.3 55.7
English Language Arts 20 (Eng & Fr equiv) 74.4 72.9 76.3 74.9 64.7 63.8
Math: Workplace and Apprenticeship 20 (Eng & Fr equiv) 66.9 65.2 69.3 69.6 61.3 54.2
Math: Foundations 20 (Eng & Fr equiv) 73.6 73.5 75.3 75.3 63.6 62.5
Average Final Marks in Selected Secondary-Level Courses, 2015-16
SubjectAll Students Non-FNMI FNMI

Prairie Valley Board of Education Annual Report – 2015-16 – Page 15
Analysis of results
The average final marks for all students were generally on par with provincial averages, exceeding the provincial results in two of eight subject areas and slightly lower than the provincial results in six areas. Average marks of self-identified FNMI students were generally comparable to the FNMI provincial results in four of eight areas, lower in three areas, and higher in one. Like the provincial results, there was a difference between FNMI and non-FNMI achievement, ranging from 11 to 22 percentage points, which is consistent with last year’s results and about the same gap in Prairie Valley School Division. We recognize the need to focus continually on FNMI achievement, using approaches that are proven effective in our division in improving student achievement.

Prairie Valley Board of Education Annual Report – 2015-16 – Page 16
Credit Attainment Credit attainment provides a strong predictive indicator of a school system’s on-time graduation rate. Students receiving eight or more credits per year are more likely to graduate within three years of beginning Grade 10 than those who do not achieve eight or more credits per year. The following displays the credit attainment of secondary students attaining eight or more credits per year for all students, and by non-FNMI and FNMI student subpopulations in the division, along with provincial results for each category.
Notes: Proportions are calculated as the percentage of students enrolled at the secondary level on September 30 attaining eight or more credits yearly. Results for populations of fewer than 10 students have not been reported to avoid identifying individuals or very small groups of students (nr). FNMI students are those who choose to self-identify as First Nations (Registered/Treaty/Status Indian, Non-Status Indian), Métis, or Inuit/Inuk. Non-FNMI students are those who do not identify as FNM or I, however this category may include FNMI students who choose not to self-identify. Source: Ministry of Education, 2016

Prairie Valley Board of Education Annual Report – 2015-16 – Page 17
Analysis of results
Overall, credit attainment rates are slightly lower, with 71% of students receiving eight or more credits per year in 2015-16, down from 74% in 2014-15. The rate is lower than last year for FNMI students, with 45% receiving eight or more credits in 2015-16, down from 49%, and lower for non-FNMI students at 79%, down from 81%. In comparison to provincial results, Prairie Valley’s results are significantly higher in all three groups: for all students at 71% compared to the provincial rate of 61%, for non-FNMI students at 79% compared to the provincial rate of 71% and for FNMI students at 45% compared to the provincial rate of 31%. While our FNMI rates exceed provincial averages, we recognize the need to continue our focus on the FNMI subpopulation using approaches that are proven effective in our division. Prairie Valley will continue to provide engaging and flexible programming options, proven credit recovery processes, and instructional supports for schools with vulnerable populations.

Prairie Valley Board of Education Annual Report – 2015-16 – Page 18
Reading, Writing, Math at Grade Level and Saskatchewan Reads OUTCOME: By June 30, 2020, 80% of students will be at grade level or above in reading, writing and math. PRIORITY: Implement a refined set of provincial high impact reading assessment, instruction and intervention strategies (Saskatchewan Reads).
School division goals aligned with Reading, Writing and Math at Grade Level outcome and the Saskatchewan Reads priority
83% of Grades 1-8 students will be at grade level or above in reading. o Actual: We achieved 74%.
83% of Grades 6-10 students will be at grade level or above in reading. o Actual: We achieved 76%.
86% of Grades 3-9 students will be at grade level or above in math. o Actual: We achieved 84%.
School division actions taken during the 2015-16 school year to achieve the targets and outcomes of the Reading, Writing, Math at Grade Level outcome and the Saskatchewan Reads priority
Continued with a K-3 Reading strategy, which included: o Providing Saskatchewan Reads professional development to
Grades 1 to 6 teachers, including training for new teachers in the early years (Grades 1 to 3) and offering this training as an option to Grades 4 to 6 teachers and administrators.
o Rolling out year two of Leveled Literacy Intervention (LLI) kits and purchasing year three LLI resources a year ahead of the original schedule.
o Providing each elementary school a 0.25 FTE allocation specifically dedicated to LLI and math support.
o Providing English language arts and literacy support to individual schools as requested and hiring additional literacy teachers at Balcarres Community School and Bert Fox Community School using Ministry of Education grant funding under the First Nations and Métis Education Achievement Fund.
Focused on common writing assessments, which included: o Developing Grades 4 and 7 writing assessments and aligning them
with the sector writing assessment objectives and support tools. o Using the writing assessment tools to inform instruction based on
a pre-assessment. o Providing English language arts and literacy support to individual
schools as requested.
Continued with and expanded math assessment and instructional strategies, which included:
o Developing common numeracy assessment for Grades 1 and 2 and piloting them in seven schools to ensure that common strategies, proven practices and effective assessment are used to inform instruction. (Division-wide rollout will occur in 2016-17.)
o Creating additional resources in SMART Notebook to support computational fluency and number sense.
o Adding Math Fundamental modules(s) to Prairie Valley School Division’s Moodle, accessible to all staff and students, to address

Prairie Valley Board of Education Annual Report – 2015-16 – Page 19
the needs of diverse middle years and Grade 10 students.
Developed modular courses in mathematics and revised and refined Workplace and Apprenticeship 10, adding audio-visual explanations of all concepts as well as detailed answer keys for all assignments.
Represented Prairie Valley School Division on the Southern Saskatchewan working group of math consultants working on part of the Education Sector Strategic Plan to develop a learning scope and sequence based on curricular outcomes to define “at grade level”.

Prairie Valley Board of Education Annual Report – 2015-16 – Page 20
Measures for Reading, Writing and Math at Grade Level and Saskatchewan Reads
Proportion of Grade 3 Students Reading At or Above Grade Level Grade 3 reading levels are considered a leading indicator of future student performance. The following bar graph displays the percentage of Grade 3 students (FNMI, non-FNMI, all) by reading level grouping. The charts below the graph indicate the percentage of Grade 3 students in the province reading at or above grade level, as well as the proportion of Grade 3 students with reported reading levels.
Notes: Reading level groupings are based on provincially developed benchmarks. The percentages of students in each of the reading level groupings were found using the number of students with reported reading levels as the denominator in the calculations. Students who were excluded or who did not participate in the reading assessment were not included in the denominator for these calculations. Results for populations of fewer than 10 students have not been reported to avoid identifying individuals or very small groups of students. FNMI students are those who choose to self-identify as First Nations (Registered/Treaty/Status Indian, Non-Status Indian), Métis, or Inuit/Inuk. Non-FNMI students are those who do not identify as FNM or I, however this category may include FNMI students who choose not to self-identify. Source: Ministry of Education, 2016.

Prairie Valley Board of Education Annual Report – 2015-16 – Page 21
Analysis of results
Overall in our division, 75.6% of Grade 3 students are reading at or above the reading level benchmark, which is above the provincial average of 73.3% but below the provincial target of 78%. Note that Prairie Valley’s results include both Fountas and Pinnell reading assessment numbers for students in English programming and the GB+ assessment results students in French Immersion programming. When results are disaggregated, 47.9% of First Nations, Métis and Inuit (FNMI) Grade 3 students are reading at or above the benchmark, whereas 80.7% of non-FNMI students are reading at or above grade level. For FNMI students, 32% are reading more than one full grade below the benchmark. This is significantly higher than the percentage of non-FNMI students at 6.5% scoring more than one full grade level below. Prairie Valley recognizes the gap between FNMI and non-FNMI reading levels. The division will continue with a K to 3 Reading strategy, which includes further implementation of Saskatchewan Reads, year three rollout of Leveled Literacy Intervention (LLI), increased monitoring and support for Grade 1 to 3 students, and instructional supports for schools with vulnerable populations. In addition, Prairie Valley will continue to monitor reading levels for all Grade 1 to 8 students.

Prairie Valley Board of Education Annual Report – 2015-16 – Page 22
Graduation Rates Outcome: By June 30, 2020, Saskatchewan will achieve an 85% three-year graduation rate.
School Division goals aligned with the Graduation Rates outcome
Achieve an 87% three-year graduation rate. o Actual: We achieved 85%, compared to 84% in the previous year. See
page 23 for details.
75% of students will report high levels of intellectual engagement and sense of belonging as measured by OurSCHOOL/Tell Them From Me.
o Actual: We achieved 63%, up from 55% in the previous year.
School division actions taken during the 2015-16 school year to achieve the targets and outcomes of the Graduation Rates outcome
Offered opportunities for students to access flexible and engaging high school programming options, such as magnet programming, Trades and Skills Construction and Apprenticeship Program (TASCAP), Living on the Land and Outdoor School.
Career counsellors: o Met with Grade 9 to 12 students and created and monitored online
graduation plans, using the Career Cruising website. o Provided parent/guardian/student information sessions about
transitioning to high school and post-secondary and about university admissions and scholarships.
o Provided opportunities for students to attend “test a career” fairs and visit post-secondary institutions.
o Promoted dual credit opportunities, UR Accelerated and Saskatchewan Youth Apprenticeship programs.
o Assisted students in finding information and gaining understanding about careers, employment fields, resume writing, registrations, applications to jobs, post-secondary institutions, programs and scholarships.
o Counselled students in their day-to-day lives. o Provided resources and support to middle years teachers on career
guidance curricula. o Administered the student course interest survey and/or hosted student
course selection meetings along with corresponding parent meetings.

Prairie Valley Board of Education Annual Report – 2015-16 – Page 23
Measures for Graduation Rates
Grade 12 Graduation Rate: On-Time To graduate within the typical three year period after beginning Grade 10, students must accumulate an average of eight credits per year to achieve the minimum requirement of 24 required secondary level credits at the end of Grade 12. On-time graduation rates are one measure of the efficiency of a school system. The following displays the percentage of students (all students, non-FNMI and FNMI) in the division who graduated within three years of entering Grade 10, along with provincial results in each of these categories.
Notes: On-time graduation rates are calculated as the percentage of students who complete Grade 12 within 3 years of ‘starting’ Grade 10. Results for populations of fewer than 10 students have not been reported to avoid identifying individuals or very small groups of students (nr). FNMI students are those who choose to self-identify as First Nations (Registered/Treaty/Status Indian, Non-Status Indian), Métis, or Inuit/Inuk. Non-FNMI students are those who do not identify as FNM or I, however this category may include FNMI students who choose not to self-identify. Source: Ministry of Education, 2016

Prairie Valley Board of Education Annual Report – 2015-16 – Page 24
Analysis of results
In June 2009, 83% of Prairie Valley students graduated within three years of entering Grade 10 (91% of non-FNMI students and 50% of FNMI students). In June 2016, the graduation rate increased to 85% (92% for non-FNMI students and 57% for FNMI students). Prairie Valley School Division’s results are higher than the provincial average for all students (85% compared to 76%). The disaggregated rates also exceed the provincial averages with non-FNMI students at 92% compared to 85% for the province and for FNMI students at 57% compared to 42% for the province. While three years is the traditional period of time for achieving the 24 credits required for graduation, students face many different circumstances, and our objective is to support all students to successfully complete high school, regardless of how much time it takes.

Prairie Valley Board of Education Annual Report – 2015-16 – Page 25
Grade 12 Graduation Rate: Extended-Time Some students need more time to complete all the courses necessary to graduate so they remain in school longer than the typical three years after beginning Grade 10. Extended-time graduation rates are one measure of the responsiveness of the school system. For students who may not have achieved graduation within the typical three year period, Prairie Valley School Division encourages these students to continue in order to successfully graduate.
The following displays the percentage of students (all students, non-FNMI and FNMI) in the division who graduated within five years of entering Grade 10, which includes those who graduated on-time, along with provincial results in each of these categories.
Notes: Extended-time graduation rates are calculated as the percentage of students who complete Grade 12 within 5 years of ‘starting’ Grade 10 (and include those who graduate on-time). Results for populations of fewer than 10 students have not been reported to avoid identifying individuals or very small groups of students (nr). FNMI students are those who choose to self-identify as First Nations (Registered/Treaty/Status Indian, Non-Status Indian), Métis, or Inuit/Inuk. Non-FNMI students are those who do not identify as FNM or I, however this category may include FNMI students who choose not to self-identify. Source: Ministry of Education, 2016

Prairie Valley Board of Education Annual Report – 2015-16 – Page 26
Analysis of results
In comparison to provincial results, Prairie Valley School Division’s extended-time graduation rates (i.e., within 5 years of beginning Grade 10) are higher for all students (89% compared to 83%), for non-FNMI students (95% compared to 89%) and for FNMI students (65% compared to 60%). Between 2009 and 2016, the extended-time graduation rate has increased overall and for non-FNMI students. In 2009, 86% of the total student population graduated within five years of beginning Grade 10; by 2016 that number increased to 89%. The non-FNMI population graduating within five years increased from 92% to 95% between 2009 and 2016. Since 2009, the FNMI rate has been trending upwards, between 59% and 73%. We will continue to offer the array of programs and services that support students in attaining graduation requirements.

Prairie Valley Board of Education Annual Report – 2015-16 – Page 27
Grade 9 to 10 Transition
The transition from Grades 9 to 10 can be difficult for some students for many different reasons, including not having mastered all outcomes from each subject area in the elementary grades. This measure is intended to show how well Grade 9 students adjust in the transition to Grade 10. Achieving eight or more credits a year is important for steady progress towards graduating on-time.
The following displays the percentage of Grade 9 students (all students and the FNMI subpopulation) in the division who achieved eight or more credits the following school year, along with provincial results for the past eight years and the eight year average.
Notes: Percentages are calculated as the number of students attaining eight or more credits in the year immediately following their Grade 9 year divided by the number of students in the Grade 9 cohort. Results for populations of fewer than five have not been reported to avoid identifying individuals or very small groups of students. FNMI students are those who choose to self-identify as First Nations (Registered/Treaty/Status Indian, Non-Status Indian), Métis, or Inuit/Inuk. Non-FNMI students are those who do not identify as FNM or I, however this category may include FNMI students who choose not to self-identify. Source: Ministry of Education, 2016
Analysis of results
Overall, 88.9% of students enrolled in Grade 10 for the first time in 2015-16 achieved 8 or more credits; of those students who are FNMI, 68.8% achieved 8 or more credits. Our division’s results are significantly higher than the provincial average results of 69.0% for all students and 38.2% for FNMI students. Prairie Valley School Division is proud our efforts to provide a wide variety of engaging programming options to high school students, regardless of location, school size, or school configuration. The eight-year results displayed on the left side of the chart show similar trends.
38.2%
69.0%

Prairie Valley Board of Education Annual Report – 2015-16 – Page 28
Operational Spending Outcome: By August 31, 2020, implement a sector-wide approach to find efficiencies and increase value add in order for the sector to be responsive to the challenges of student needs.
School division goals aligned with the Operational Spending outcome
Achieve an accumulated savings of $6.84M. o Actual: We achieved $7.59M cumulative savings since 2012-
2013, up from $4.26M cumulative last year.
School division actions taken during the 2015-16 school year to achieve the targets and outcomes of the Operational Spending outcome
Achieved savings of $1.75M during 2015-2016. Significant areas of cost savings included: deferring the rollout of teacher laptops by one year ($700,000), savings in the annual technology refresh as a result of refining system standards ($394,000), holding Education Centre positions vacant ($225,000), consolidating six bus routes ($150,000) and reducing staff travel ($54,000).
Completed a Human Resources-Payroll Interface continuous improvement event that identified issues and improvements to reduce the payroll error rate, improve service to staff and reduce frustrations.
Completed a Role of Educational Assistants event to understand parents’ expectations in supporting students with intensive needs and developed a new, streamlined job description based on feedback from parents, educational assistants, teachers and administrators.
Developed an action plan following up on a project called “A Week in the Life…” (of an administrator, teacher, educational assistant) to reduce the distractions, impediments and frustrations encountered regularly in instructional work by looking at our system processes to ensure we are giving teachers the maximum time and best structures to do their jobs.
Continued to monitor, report and follow up on previous continuous improvement initiatives to ensure anticipated results are being realized:
o Invoices were processed more quickly o Learning supports were deployed faster o Spring staffing was faster and more equitable o Learning resources got to teachers and students more quickly o Facility maintenance requests were responded to faster o Time spent on bus parts was reduced o Record keeping improved

Prairie Valley Board of Education Annual Report – 2015-16 – Page 29
Early Years Outcome: By June 30, 2020, children aged 0-6 years will be supported in their development to ensure that 90% of students exiting Kindergarten are ready for learning in the primary grades.
School division goals aligned with the Early Years outcome
In the Early Years Evaluation, children aged 0-6 will achieve: - 98% in awareness of self
o Actual: We achieved 98%. - 95% in social skills
o Actual: We achieved 93%. - 95% in cognitive skills
o Actual: We achieved 91%. - 95% in language
o Actual: We achieved 95%. - 98% in physical development
o Actual: We achieved 95%.
100% of K and PreK educators will participate in early childhood education professional learning opportunities as reported through the Prekindergarten and Kindergarten Annual Report.
o Actual: We achieved 100% of Prekindergarten and 77% of Kindergarten educators.
School division actions taken during the 2015-16 school year to achieve the targets and outcomes of the Early Years outcome
Supported children aged 0 to 6 years in their development by delivering targeted professional development:
o All Prekindergarten teachers received Hanen Learning Language and Loving It training.
o Nine of 12 Prekindergarten teachers received Prekindergarten Basics workshop and seven received Phase 1 Play and Exploration training.
o All Kindergarten teachers completed the Making Learning Visible in Kindergarten workshop.
o Twenty-nine of 38 Kindergarten teachers completed at least two Literacy Practices in Kindergarten online modules.
Measures for Early Years
Early Years Evaluation The Early Years Evaluation-Teacher Assessment (EYE-TA) is a readiness screening tool that provides information about each child’s development and learning with a focus on reading readiness skills. Results from the EYE-TA allow educators and school-based interdisciplinary teams to quickly identify children most likely to require extra support during the Kindergarten year, based on their levels of skill development in five key domains at school entry. In addition to results for specific domains, children are also assigned a comprehensive score known as a Responsive Tiered Instruction (RTI) level. Responsive Tiered Instruction (RTI) is a preventive approach that allows educators, school teams and divisions to allocate resources early and continuously, rather than waiting until after children have experienced failure before responding. The following displays the percentage of students by RTI tiers at the end of Kindergarten in 2015-16, as well as the provincial results for each category.

Prairie Valley Board of Education Annual Report – 2015-16 – Page 30

Prairie Valley Board of Education Annual Report – 2015-16 – Page 31
Notes: Research shows early identification followed by a responsive, tiered approach to instruction from Kindergarten to Grade 3 can substantially reduce the prevalence of reading problems. Children who have Tier 2 or Tier 3 needs at Kindergarten entry are re-assessed before Kindergarten exit, allowing school divisions to measure the impact of their supports and responses. Spring RTI data also serves as a leading indicator of the population of students who may need Tier 2 or Tier 3 instructional supports as they transition from Kindergarten to Grade 1. Results reported previously for division EYE RTI Tiers at Kindergarten exit in 2014-15 may vary from results reported here. This is due to a change in reporting methodology. Prior to 2015-16, EYE results at Kindergarten exit omitted results for children who were assessed in spring post-screens only. The amended reporting methodology now includes results for all children screened in a division, regardless of whether or not they were enrolled and present during fall pre-screens. Source: Ministry of Education, Early Years Branch, 2016
Analysis of results
The EYE-TA results at Kindergarten exit for Prairie Valley School Division show:
88% of students scored as Tier 1 showing their learning and development is typical for children the same age.
10% of students scored as Tier 2 showing they are experiencing some difficulty and would benefit from additional opportunities and experiences for learning.
2% of students scored as Tier 3 showing they are experiencing significant difficulty and would benefit from additional opportunities and experiences for learning, as well as target instruction and programming.
Prairie Valley School Division results are above the provincial averages in Tier 1 (88% for Prairie Valley compared to 80% for the province) and are slightly higher than the previous year (88% in 2015-16 compared to 84% in 2014-15).

Prairie Valley Board of Education Annual Report – 2015-16 – Page 32
School Division Local Priority Area Prairie Valley School Division had nine local priorities unique to our school division relating to academic areas such as science and Treaty Essential Learnings, extra-curricular opportunities for students and high quality transportation, finance, facilities and technology support services. For results information, see our 2015-2016 Community Report on our website at www.pvsd.ca under Publications.

Prairie Valley Board of Education Annual Report – 2015-16 – Page 33
Demographics Prairie Valley School Division closely monitors demographics for students and staff throughout the year, producing short- and long-term projections for staffing, programming, facility and technology planning purposes.
Students
For student demographics and enrolments, the division uses Baragar Demographic Dynamics combined with local knowledge and annually analyzes actual enrolments compared to projections and the reasons for variances. Enrolments in recent years have slightly increased, particularly in the areas around the City of Regina. As of September 30, 2015, 8,159 students were enrolled in Prairie Valley School Division, an increase from 2014 (8,090 students) and 2013 (8,039 students).
The population of Kindergarten students decreased compared to previous years, but the number of students from Grades 1 to 5 was higher than previous years. Grades 6 to 9 remained generally consistent with last year while Grade 10 decreased by 60 students and Grades 11 and 12 increased slightly. Enrollment by Grade – September 30

Prairie Valley Board of Education Annual Report – 2015-16 – Page 34
Enrollment by Grade-level Groupings – September 30

Prairie Valley Board of Education Annual Report – 2015-16 – Page 35
Staff The division employed 1,138 full-time equivalent positions as of August 31, 2016. About half of these employees were teachers. The other half includes a wide range of occupations including superintendents, supervisors, managers, educational assistants, social workers, occupational therapists, speech-language pathologists, psychologists, administrative support staff, information technology staff, finance and human resources staff, caretakers, bus drivers, mechanics and facility technicians who collectively worked to provide a quality educational experience for students.
School Division Staff as of August 31, 2016
Job Category FTEs
Classroom teachers 500.53
Principals, vice-principals 41.43
Other educational staff (positions that support educational programming) –
e.g., superintendents of education, psychologists, educational assistants,
school community coordinators, speech language pathologists
256.60
Administrative and financial staff – e.g., accountants, Information Technology
people, supervisors, managers, administrative assistants, clerks 92.64
Plant operations and maintenance – e.g., caretakers, handypersons,
carpenters, plumbers, electricians, gardeners, supervisors66.00
Transportation – e.g., bus drivers, mechanics, parts persons, bus cleaners,
supervisors177.90
Senior management team (as described below) – e.g., director of education,
deputy directors, chief financial officer3.00
Total Full-Time Equivalent (FTE) Staff 1138.10
Notes: • The numbers shown above represent full-time equivalents (FTEs). The number of employees is higher because some people work part-time or seasonally. • Some individuals are counted in more than one category. For example, a teaching principal might be counted as 0.4 as a classroom teacher and 0.6 as a principal. Source: Prairie Valley School Division Human Resource System

Prairie Valley Board of Education Annual Report – 2015-16 – Page 36
Senior Management Team The Director of Education, Ben J. Grebinski, was the Chief Executive Officer of the school division and reports to the elected board. The Director of Education/CEO was responsible for the administration of the division, supported by a Deputy Director of Instruction and School Operations (filled on a rotational basis by the Superintendents of Education) and a Deputy Director of Division Services/CFO, Naomi Mellor. In the 2015-2016 school year, four instructional superintendents responsible for instruction and school operations, one superintendent responsible for learning supports and one superintendent responsible for project management reported to a member of the senior management team:
Patty Brady, Superintendent of Education – School Operations
Mike Embury, Superintendent of Education – School Operations
Dale Reed, Superintendent of Education – School Operations
Derek Smith, Superintendent of Education – School Operations
Lorrie Anne Harkness, Superintendent of Education – Learning Supports
Lyle Stecyk, Superintendent of Project Management Five supervisors and two managers reported to a member of the senior management team:
Ashton Calder, Supervisor of Communication, Information and Technology
Lola Correia, Supervisor of Finance
Keith Harkness, Supervisor of Learning, Assessment and Data Systems
Cindy Laturnas, Supervisor of Transportation
Megan Rich, Supervisor of Human Resources
Devin Jones, Manager of Human Resources
Sheena August, Manager of Communications

Prairie Valley Board of Education Annual Report – 2015-16 – Page 37
Facilities Infrastructure Projects and Transportation Prairie Valley School Division’s facilities include:
Thirty-nine schools located in 32 communities. o The average age of schools within the division is 52 years. o The oldest school in the division is Lipton School, which is 66 years old and
was originally constructed in 1950. o See below for a complete list of schools.
The division’s Education Centre (head office), located in the Rural Municipality of Sherwood just north of Regina, provides workspace for office-based and itinerant staff.
o The core of the building is 29 years old and was constructed for a division that at the time operated 12 schools and offered significantly fewer services.
o An addition and renovation completed in 2014 sized and equipped the building adequately for present needs and allowed for consolidation of staff into one location.
A central maintenance shop attached to Emerald Ridge Elementary School in White City.
A satellite maintenance shop located in Broadview, which services schools on the east side of the school division.
The primary bus maintenance shop located at the Education Centre.
A satellite bus shop in Grenfell. Prairie Valley School Division sets a high standard for school building maintenance, cleanliness and functionality. The division is committed to high quality caretaking services to ensure healthy, safe and functional schools and grounds for students and staff. Maintenance and operations inspections are completed twice per year at each building.

Prairie Valley Board of Education Annual Report – 2015-16 – Page 38
School List 2015-16
School Grades Location Arm River Colony School K-12 Arm River Colony Balcarres Community School PreK-12 Balcarres Balgonie Elementary School K-8 Balgonie Bert Fox Community High School 8-12 Fort Qu’Appelle Broadview School PreK-12 Broadview Clive Draycott School K-8 Bethune Cupar School K-12 Cupar Dr. Isman Elementary School K-6 Wolseley École White City School K-8 White City Edenwold School K-6 Edenwold Emerald Ridge Elementary School K-8 White City Fort Qu’Appelle Elementary Community School
PreK-7 Fort Qu’Appelle Greenall High School 9-12 Balgonie Grenfell Elementary Community School PreK-6 Grenfell Grenfell High Community School 7-12 Grenfell Indian Head Elementary School PreK-6 Indian Head Indian Head High School 7-12 Indian Head James Hamblin School K-9 Qu’Appelle Kelliher School PreK-12 Kelliher Kennedy-Langbank School K-8 Kennedy Kipling School K-12 Kipling Lajord Colony School K-12 Lajord Colony Lipton School PreK-12 Lipton Lumsden Elementary School PreK-8 Lumsden Lumsden High School 9-12 Lumsden McLean School K-8 McLean Milestone School K-12 Milestone Montmartre School K-12 Montmartre North Valley Elementary School K-6 Neudorf North Valley High School 7-12 Lemberg Pense School K-8 Pense Pilot Butte School PreK-8 Pilot Butte Robert Southey K-12 Southey Sedley School K-8 Sedley South Shore School K-8 Regina Beach Stewart Nicks School K-8 Grand Coulee Vibank Regional School K-12 Vibank Whitewood School PreK-12 Whitewood Wolseley High School 7-12 Wolseley

Prairie Valley Board of Education Annual Report – 2015-16 – Page 39
Infrastructure Projects 2015-16 Several schools in Prairie Valley School Division were modernized and/or renovated during 2015-2016. A list of significant infrastructure projects above $200,000 appears below.
School Project Description 2015-2016 Cost
Capital Project Expenditures
Lumsden Elementary
Relocatables Add two relocatable classrooms to address capacity and French Immersion programming requirements.
639,392
*Greenall High Servery Renovate and modernize the PAA Foods, PAA Commercial Cooking and servery spaces to address programming, operating and nutrition deficiencies (cost Includes equipment)
528,259
Pilot Butte Water Local improvements which provided central water supply from the Town of Pilot Butte.
246,283
Subtotal 1,167,651
Busses and Other Vehicles 1,988,797
Furniture and Equipment 1,041,367
Computer Hardware and Audio/Visual Equipment 2,037,621
Total Capital Expenditures $6,481,719
Non-Capital Project Expenditures
Lumsden High New Servery Development of new servery space to address programming, operating and nutrition deficiencies (cost includes equipment)
401,973

Prairie Valley Board of Education Annual Report – 2015-16 – Page 40
School Project Description 2015-2016 Cost
Dr. Isman Building Efficiency
This renovation addressed accessibility, safety, supervision, programming, a student support workspace shortage, bathroom renovations and overall building efficiency (relocated resource centre and primary years instructional space).
267,655
Milestone Site Drainage
The school site had negative drainage causing water to flow back to the school building, primarily at the main entrance. This was corrected by engineering re-landscaping and directing water away from the school.
200,591
Bert Fox Gym Floor The gym flooring system was end of life with ongoing excessive maintenance costs.
108,202
Cupar Gym Change Room
The gym change rooms, washrooms and fixtures were end of life and required modernization.
115,643
Robert Southey Life Safety Fire Alarm, Exit and Emergency Lighting Replacement.
55,205
Lipton School Life Safety Fire Alarm, Exit and Emergency Lighting Replacement.
43,105
Various schools Painting and flooring
Annual painting and flooring refreshes.
200,986
Various schools Various projects Various maintenance and small renovations projects.
99,745
Various schools Roof Repairs Roof repairs were completed at Dr. Isman, Indian Head High, Education Centre and Pense.
115,181
Total Non-Capital Project Expenditures $1,608,286
Total $8,090,005

Prairie Valley Board of Education Annual Report – 2015-16 – Page 41
Transportation
Given the size and the geographic dispersion of Prairie Valley School Division, the transportation of 4,500 students to and from school each day is a significant operational challenge. Prairie Valley School Division operates its own transportation service with a fleet of 212 buses. As a result of historical arrangements due to geographic proximity to Regina and access to various programming options, the division transports 137 students into 19 Regina schools from nearby communities using a combination of nine bus routes and taxicabs to ensure that students get to school in a timely manner. Professional transportation staff use up-to-date technology to refine and improve transportation services. Collaboration and communication between the central transportation office, schools, students, families and communities ensures a culture of safety throughout the school division.
Student Transportation Statistics
Number of students transported daily* 4505
In-town students transported (included in above) 837
Number of transportation routes 164
Number of buses 212
Kilometres travelled daily 26,886
Average age of bus 7.2 years
Capacity utilized on buses 88%
Average one-way ride time 25 min.
Longest one-way ride time 84 min.
Cost per student per year $2,040
Cost per kilometre traveled $2.09 *Statistics are for daily transportation of students to and from school. Extra-curricular trips are not included. Source: Prairie Valley Transportation Services, 2016

Prairie Valley Board of Education Annual Report – 2015-16 – Page 42
Financial Overview Summary of Revenue and Expenses The Division’s leadership is committed to responsible stewardship of the public funding allocated to the Division by the Ministry of Education and other sources. In 2015-2016, Prairie Valley School Division recorded an actual surplus of $2.4 million, $1.8 million higher than the budgeted surplus due to internal restraint measures. The surplus was placed into an internal operating reserve. Revenues The Division received revenues totalling $106.7M in 2015-2016, an increase of 1.3 per cent over 2014-2015 actual revenues and an increase of $3M over the 2015-2016 budgeted revenue. This increase is due to:
Combined higher total Ministry of Education operating grants and property tax revenue
An increase in capital grants related to an in-year increase in preventative maintenance and repair (PMR) funding as well as funding for two relocatable classrooms at Lumsden Elementary School
Higher than estimated tuition revenues for higher than projected enrolments
Higher than estimated school generated funds, offset by matching expenses
Higher than estimated other revenues for miscellaneous reimbursements and other revenues
Expenditures The Division incurred operating expenditures of $104.3M, an increase of 0.7 per cent from 2014-2015 actual expenditures and $1.1M higher than the 2015-2016 budgeted expense. The increase in expenditures is attributable to salary and benefit pressures for substitute staff, building operating costs such as utilities and minor renovations, higher than projected amortization of capital assets and for expenses related to grants received in year and unknown during budget preparation. Other increases were related to increased attendance at Board events and for school generated fund expenses. Increases were offset by savings in administrative and support staff vacancy management, savings from lower than projected fuel costs, savings in supplies and services, professional development and travel costs. In 2015-2016, as in previous years, Prairie Valley School Division’s single largest expense was Instruction, which includes salaries and benefits for teachers and other staff who work with students, resource materials and classroom supplies. Capital expenditures for the year totaled $6.5M.

Prairie Valley Board of Education Annual Report – 2015-16 – Page 43

Prairie Valley Board of Education Annual Report – 2015-16 – Page 44
Budget to Actual Revenue, Expenses and Variances
Budget to Budget to
2016 2016 2015 Actual Actual %
Variance
Over / (Under)
Property Taxation 38,590,560 41,933,898 39,881,099 3,343,338 9% 1
Grants 55,464,766 54,134,870 54,487,262 (1,329,896) -2%
Tuition and Related Fees 5,832,189 6,050,508 5,840,279 218,319 4%
School Generated Funds 2,482,597 2,836,928 2,734,943 354,331 14% 2
Complementary Services 659,998 660,000 638,647 2 0%
External Services - 150,000 150,000 150,000 100% 3
Other 695,000 922,226 1,563,739 227,226 33% 4
103,725,110 106,688,430 105,295,969 2,963,320 3%
Governance 497,677 654,583 630,341 156,906 32% 5
Administration 4,492,884 4,402,784 3,963,990 (90,100) -2%
Instruction 71,029,779 71,130,098 70,833,119 100,319 0%
Plant 11,782,442 12,664,384 12,175,722 881,942 7% 6
Transportation 9,515,798 9,190,732 9,582,885 (325,066) -3%
Tuition and Related Fees 62,000 65,417 106,580 3,417 6% 7
School Generated Funds 2,452,457 2,793,262 2,689,633 340,805 14% 8
Complementary Services 2,598,293 2,526,313 2,589,275 (71,980) -3%
External Services - 150,000 150,000 150,000 100% 9
Other Expenses 740,395 728,073 875,656 (12,322) -2%
103,171,725 104,305,646 103,597,201 1,133,921 1%
553,385 2,382,784 1,698,768
Note
1
2
3
4
5
6
7
8
9
Board attendance and remuneration for committee meetings and provincial conferences, reflecting a full year of
governance work by the 11 member Board, and additional payments to the Public Section for litigation expenses.
Higher than budgeted salaries for substitute caretaker salaries, building operating costs for utilities and capital asset
amortization.
Higher than estimated enrolments
Higher than estimated recoverable expenses.
Offset by school generated funds revenues.
In year receipt of third party grant management.
Explanation for Variances (All variances that are greater than positive or negative 5% must be explained)
Explanation
Budget estimate was developed by the Ministry of Education
Offset by school generated funds expenses.
In year receipt of third party grant management.
Note
REVENUES
Total Revenues
EXPENSES
Total Expenses
Actual Variance
Surplus (Deficit) for the Year
Budget Actual
sheena.august
Typewritten Text
sheena.august
Typewritten Text
sheena.august
Typewritten Text
sheena.august
Typewritten Text
sheena.august
Typewritten Text
sheena.august
Typewritten Text
sheena.august
Typewritten Text
sheena.august
Typewritten Text
sheena.august
Typewritten Text
sheena.august
Typewritten Text
sheena.august
Typewritten Text
sheena.august
Typewritten Text
.
sheena.august
Typewritten Text
sheena.august
Typewritten Text
.
sheena.august
Typewritten Text

Prairie Valley Board of Education Annual Report – 2015-16 – Page 45
Appendices Appendix A – Payee List
Board Remuneration
Name Remuneration Expenses Travel Professional
Development (3)
Total
Berglund, Terry 16,350 3,112 8,647 - 28,109
Bradley, Judy 19,250 2,187 7,015 - 28,452
De Gooijer, Bert (2) 21,050 1,894 9,988 3,004 35,936
Emery, Kenton 16,900 1,844 3,123 2,020 23,887
Esplin, Kent 17,225 1,090 4,842 - 23,157
Fjestad, Deanna 18,775 2,932 3,959 1,164 26,830
Jenkins, Jay 20,825 3,223 9,502 967 34,517
Kotylak, Janet (1) 31,370 1,303 10,365 - 43,038
Sangwais, Rachel 8,375 1,153 2,394 - 11,922
Thauberger, Frank 21,375 2,307 4,629 2,386 30,697
Urban, Sandi 15,600 1,321 3,866 - 20,787
Total 207,095 22,366 68,330 9,541 307,331
(1) Board Chair (2) Board Vice-Chair (3) Professional development includes education, training and conferences.
Board remuneration varies for a number of reasons, including committee work, number of schools in each subdivision (varies from two to six), distance from the board member’s home to the Education Centre (ranges from 20 to 170 kilometres one way) and participation in provincial forums.
Personal Services
Name Amount
Aamodt, Marianne 84,783
Ackerman, David 54,422
Adames, Pamela 61,426
Adams, Amber 75,952
Adams, Tracy 88,396
Agarand, Carla 65,561
Name Amount
Akrigg, Lindsey 94,074
Amyotte, Greg 54,953
Anardi, Rodney 99,298
Anderson, Sarah 72,200
Andrews, Dean 88,655
Andrychuk, Jillian 52,669

Prairie Valley Board of Education Annual Report – 2015-16 – Page 46
Name Amount
Antifaiff, Gloria 64,557
Armstrong, Donna 88,942
Armstrong, Michael 58,797
Arnason, Jennifer 53,601
Ashton, Wendy 84,661
Atkinson, Colton 53,871
August, Sheena 85,798
Aulie, Brady 59,321
Aulie, Tracy 84,527
Babcock, Danielle 75,798
Bahm, Sarah 62,130
Bakken, Kristinia 93,433
Bales , Corey 85,477
Ballantyne, Robert (Bob) 95,241
Balogh, Rhonda 84,847
Bangsund, Wesley 88,949
Barber, Verne 90,507
Bashforth, Alana 62,087
Baumgartner, Connie 87,661
Baumgartner, Sarah 70,534
Beck, Karissa 57,569
Beckett, Aline 84,295
Behrns, Brian 54,953
Bell, Erin 87,540
Bell, Lisa 61,279
Belliveau, Marlene 88,396
Bender, Curtis 93,682
Benning, Sarah 51,378
Beresh, Dana 56,405
Berg, Michael 85,254
Berg, Robin 103,040
Beriault, Shaunessey 58,257
Bieber, Jennifer 84,295
Bigalky, Crystal 75,724
Bircher, Dave 106,461
Bircher, Kim 84,355
Bird, Reila 97,236
Birns, George W. 88,396
Bjornson-Kowalchuk, Bev 113,671
Black, Melanie 88,949
Name Amount
Blayone, Carmen 84,342
Blenkin, Trudy 67,300
Blomquist, Cheryl 105,120
Blyth, Janine 100,504
Blyth, Leslie 84,334
Boake, Megan 75,654
Bohay, Renea 80,079
Bohay , Rick 84,515
Bollinger, Margaret 85,042
Bone, Toni 63,874
Bonk, Noelle 53,098
Boutin-Maloney, Andre 95,644
Bouvet, Danielle 85,042
Bowes, Jolene 60,128
Boyle, Noleen 84,877
Boys, Melissa 92,491
Braden, Patricia 97,936
Bradley, Holly 88,843
Bradley, Marie 92,900
Bradley, Shannon 63,172
Brady, Patty 150,607
Brandt, Andrew 51,063
Brennan, Bonnie 85,488
Breti, Carolyn 84,595
Briere, Erica 52,345
Brodner, Leila 64,460
Brooks, Valerie 96,434
Bruce, Murray 108,721
Brueckner-Procyk, Kelly 93,743
Brule, James 84,295
Brule, Kimberly 85,053
Buchan, Scott 84,390
Buchko, Virginia 53,086
Burghardt, Amy 60,261
Burianyk-Noey, Anna Maria 84,295
Burlock, Alanna 56,425
Button, Tamra 84,556
Byrnes, Angela 88,711
Cabylis, Demetrios 60,990
Calder, Ashton 107,457

Prairie Valley Board of Education Annual Report – 2015-16 – Page 47
Name Amount
Callaghan Heuck, Jade 50,620
Campbell, Juli 88,491
Campbell, Mary 63,105
Carleton, Sherry 88,396
Carnegie, Kellianne 61,802
Carson, Roy 61,626
Catusanu, Ciprian 73,277
Charanduk, Andrea 73,170
Cheater, Kyla 59,918
Chernenkoff, Tamara 80,631
Chomos, Gisele 84,425
Chorneyko, Camille 86,878
Clark, Christine 85,659
Clark, David 85,546
Clark, Micheil 64,387
Clark, Randy 86,640
Clarke, Darlene 93,433
Clarke, Sarah 50,862
Cochrane, Cory 89,057
Coghill, Jason 70,307
Cooper, Carla 84,910
Correia, Gloria 119,136
Crawford, Charnelle 63,776
Crawford, Kim 84,295
Crich, Julia 58,444
Croshaw, Jim 86,256
Cross, Meaghan 65,339
Czemeres, Russell 88,672
Dahl-Ritco, Corinna 69,922
Danylczuk, Sara 72,587
Dash, Bonnie Jean 76,129
Davidson, Colby 57,773
Davis, Alisha 75,802
Davis, Jacquelyn 52,409
de Waal, Robert 67,744
Dean, Andrew 59,674
Dean, Kendra 62,416
Deck, Shelley 88,428
Decker, Michael 62,982
Deiter, Candice 84,325
Name Amount
Dermody, Krista 84,453
DeWitt, Barbara 65,756
Didur, Cheryl 53,543
Dirkson, Lois 84,295
Dodge, Adam 73,944
Dong, Ron 84,506
Doud, Brenda 99,673
Dovell, Karie 65,842
Drew, Brandy 71,840
Driedger, Sheldon 67,744
Driedger, Tracy 85,798
Driver, Danielle 63,809
Dubois-Evans, Denise 85,854
Dudley, B. Joyce 84,581
Dufour, Heidi 73,358
Dufour, Sean 85,418
Dunham, Lynn 84,295
Dunville, Luke 88,396
Dusterbeck, Ann 86,252
Dutkiwch, Carrie-Anne 81,037
Dvernichuk, Paula 93,512
Dwivedi, Rashi 78,477
Eberle, Valene 73,881
Eddy, Kali 70,013
Edgar, Renette 93,152
Edmonds, Mark 97,236
Elliott, Glenda 117,832
Elsner, Blaine 84,767
Embury, Mike 154,403
Endicott, Brian 110,604
Endicott, Codie 71,741
Engele, Jillian 57,216
Ermel, Danielle 58,314
Esplin, Karla 84,295
Exner, Tina 77,092
Fafard, Andrea 77,313
Faucher, Michelle 89,668
Fayant, Patricia 62,932
Feland, Carma 101,879
Fenske, Holly 64,387

Prairie Valley Board of Education Annual Report – 2015-16 – Page 48
Name Amount
Ferguson, Amie 73,718
Ferner, Amy 86,540
Fiorante, Lina 84,589
Fitterer, Bryce 59,355
Flahr, Amanda 73,611
Focht, Cindy 97,381
Folk, Brittany 64,843
Folnovic, Stephen 65,119
Forster, Sean 65,718
Fortin, Davina 84,295
Fowler, Krista 84,341
Fraser, Chelsea 59,337
Freitag, Justin 66,410
Freitag, Nicole 84,180
Frey, Roxanne 84,606
Frick, Troy 96,617
Fritzler, Connie 120,244
Froese, Lewis 85,127
Fry, Denise 84,433
Fuchs, Tracie 80,272
Fuhro, Dwight 86,660
Gabel, Brittany 55,481
Gabriel, Wayne 73,277
Gardiner Hoehn, Meghan 73,768
Gawley, Nathan 69,260
Geis, Kaitlyn 59,414
Geisler, Michelle 84,896
Geisler, Sarah 106,464
Gel, Rebecca 84,499
Gerein, Vanessa 73,887
Gheyssen, Janelle 55,368
Gheyssen, Jesse 72,012
Giambattista, Melanie 62,069
Gibbens, Shelley 66,752
Gibbs, Dana 84,295
Gilroy, Caren 83,311
Godlien, Joshua 73,661
Goertzen, Scott 67,928
Gorski, Shelly 110,256
Gottfried, Kelsey 50,441
Name Amount
Gottselig, Donn 73,277
Grad, Geraldine 64,158
Graham, Ferrah 89,680
Graham, Marlo 62,262
Grainger, Bonny 114,219
Grant, Jalissa 58,245
Gray, Sandra 83,920
Grebinski, Ben 215,217
Gurski, Barb 84,346
Habeebkutty, Candy 90,056
Haberstock, Roxanne 84,318
Hadfield, Mavis 87,016
Hadwen, Glenda 97,236
Halbgewachs, Michelle 84,936
Halipchak, Anastasia 112,019
Hallam, Heather 77,520
Hallam, Michael 84,524
Halter, Rebecca 59,926
Hamelin, Ken 88,559
Hamelin, Melody 72,328
Hamelin-Sorenson, Julie 85,817
Hamilton, Candace 84,295
Hamilton, Chelsea 60,640
Hampson, Lisa 78,054
Hansford, Melissa 84,519
Hanwell, Carrie 97,629
Harcourt, Dean 88,396
Harder, Shauna 84,860
Harder, Tamara 62,335
Harding, Ryan 99,903
Hardy, Danielle 58,300
Harkness, Keith 115,580
Harkness, Lorrie Anne 145,105
Harper, Donna-Lynne 84,562
Hartman, Jim 83,411
Hartman, Shanis 55,788
Harvey, John 111,915
Hasan, Maksudul 66,228
Hassler, Angela 88,396
Head, Micheal 61,597
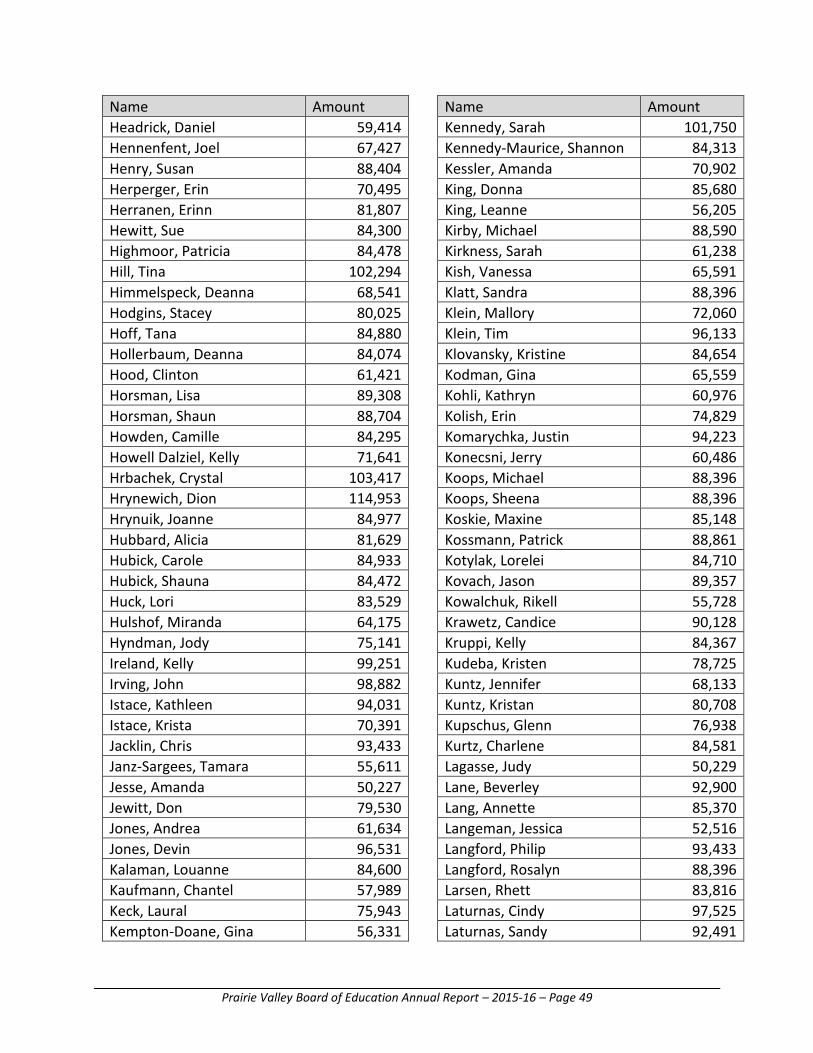
Prairie Valley Board of Education Annual Report – 2015-16 – Page 49
Name Amount
Headrick, Daniel 59,414
Hennenfent, Joel 67,427
Henry, Susan 88,404
Herperger, Erin 70,495
Herranen, Erinn 81,807
Hewitt, Sue 84,300
Highmoor, Patricia 84,478
Hill, Tina 102,294
Himmelspeck, Deanna 68,541
Hodgins, Stacey 80,025
Hoff, Tana 84,880
Hollerbaum, Deanna 84,074
Hood, Clinton 61,421
Horsman, Lisa 89,308
Horsman, Shaun 88,704
Howden, Camille 84,295
Howell Dalziel, Kelly 71,641
Hrbachek, Crystal 103,417
Hrynewich, Dion 114,953
Hrynuik, Joanne 84,977
Hubbard, Alicia 81,629
Hubick, Carole 84,933
Hubick, Shauna 84,472
Huck, Lori 83,529
Hulshof, Miranda 64,175
Hyndman, Jody 75,141
Ireland, Kelly 99,251
Irving, John 98,882
Istace, Kathleen 94,031
Istace, Krista 70,391
Jacklin, Chris 93,433
Janz-Sargees, Tamara 55,611
Jesse, Amanda 50,227
Jewitt, Don 79,530
Jones, Andrea 61,634
Jones, Devin 96,531
Kalaman, Louanne 84,600
Kaufmann, Chantel 57,989
Keck, Laural 75,943
Kempton-Doane, Gina 56,331
Name Amount
Kennedy, Sarah 101,750
Kennedy-Maurice, Shannon 84,313
Kessler, Amanda 70,902
King, Donna 85,680
King, Leanne 56,205
Kirby, Michael 88,590
Kirkness, Sarah 61,238
Kish, Vanessa 65,591
Klatt, Sandra 88,396
Klein, Mallory 72,060
Klein, Tim 96,133
Klovansky, Kristine 84,654
Kodman, Gina 65,559
Kohli, Kathryn 60,976
Kolish, Erin 74,829
Komarychka, Justin 94,223
Konecsni, Jerry 60,486
Koops, Michael 88,396
Koops, Sheena 88,396
Koskie, Maxine 85,148
Kossmann, Patrick 88,861
Kotylak, Lorelei 84,710
Kovach, Jason 89,357
Kowalchuk, Rikell 55,728
Krawetz, Candice 90,128
Kruppi, Kelly 84,367
Kudeba, Kristen 78,725
Kuntz, Jennifer 68,133
Kuntz, Kristan 80,708
Kupschus, Glenn 76,938
Kurtz, Charlene 84,581
Lagasse, Judy 50,229
Lane, Beverley 92,900
Lang, Annette 85,370
Langeman, Jessica 52,516
Langford, Philip 93,433
Langford, Rosalyn 88,396
Larsen, Rhett 83,816
Laturnas, Cindy 97,525
Laturnas, Sandy 92,491

Prairie Valley Board of Education Annual Report – 2015-16 – Page 50
Name Amount
Laurie, Peggy 74,918
Law, Janelle 59,435
Leach, Stephanie 81,343
Leader, Lindsay 65,768
LeBlanc, Danielle 71,193
Lechner, Cory 88,396
Lees, Jamie 73,319
Leflar, Scott 75,001
Leggett, Kai 88,997
Leonard, Cortney 84,737
Lerat, Tatroy 85,055
Lesiuk, Larry 108,505
Lesko, Doreen 85,178
Lindal, Tara 69,387
Lingenfelter, Sacha 97,742
Locken, Dale 76,124
Lockert, Larry 54,953
Longstaff, Andrew 84,417
Lowenberger, Tanya 97,472
Lubachowski, Jill 77,770
MacCallum, Tom 106,708
Macey, Debbie 84,524
Mackin, Kyle 57,030
Macsorley, Cindy 78,578
Magnien, Kathy 109,035
Magnuson, Hala 77,574
Mah, Roxanne 65,111
Maier, Connie 85,466
Manko-Bauche, Michael 54,770
Mansuy, Casandra 55,014
Marley, Melissa 86,153
Marshall, Judy 88,672
Martin, Laurie-Ann 110,129
Marzolf, Laurel 88,448
Mason-Poitras, Amberlee 51,879
Massier, Paul 85,171
Matai, Ali 88,396
Matity, Lori 84,424
Mattick, Nancy 84,634
Maxwell, Bruce 67,744
Name Amount
Mayer, Candace 84,295
Mayer, Melanie 57,852
Mayes, Carol 60,414
Mayo, Robert 95,132
Mazur, Lora 84,648
Mcammond, Wade 108,619
Mccaw-Levers, Jessica 84,374
McEachen, Glenda 84,609
McFadden, Shauna 66,469
McFarlen, Amy 65,429
McIntosh, Samantha 80,881
McKague, Maria 56,215
McKay, Ian 63,676
McKinney, Shannon 88,475
Mclean, Shelley 84,390
Mcmurtry, Barbara 94,595
Mcnish, Laura 73,692
McPherson, Melody 84,420
Meena, Rhonda 84,295
Meeres, Stewart 69,787
Meiklejohn, Amanda 84,771
Meiklejohn, Dianne 67,037
Mellor, Naomi 182,970
Meyer, Grant 84,985
Meyer, Scott 84,317
Meyers, Chad 66,216
Michael, Corinna 84,449
Mievre, Rachelle 73,241
Miller, Carla 84,796
Miller, Dan 90,437
Mills, Shannon 67,758
Montanini, Miranda 58,821
Mooney, Shelly 85,163
Moore, Jeff 84,295
Moore, Kirsten 54,559
Moroz, Andrea 84,852
Morphy, Fran 88,728
Morris, Deidre 74,848
Morris, Shawn 87,971
Morrison, Donald 84,918

Prairie Valley Board of Education Annual Report – 2015-16 – Page 51
Name Amount
Morrow, Shane 65,551
Morson, Charlene 88,113
Muller, Dwight 93,315
Muma, Valerie 84,024
Munro, Terry 88,853
Myers, Kristen 90,480
Mymryk, Leah 87,675
Nagel, Bonnie 84,327
Nagy, Alyssa 62,904
Nameth, Kristin 63,930
Neal Langdon, Christian 74,848
Newton, Kermit 64,084
Nye, Michelle 85,201
Odishaw, Susan 65,531
Ogden, Angela 84,645
Olafson, Lindy 75,281
Olah-Palfy, Carmen 85,865
Omoth, Alisa 84,295
Ostapowich, Jen 62,427
Pacio, Edrian 60,949
Parisien, Azalea 102,776
Park, Danelle 74,478
Parker-Harvey, Leeane 84,362
Parley, Trevor 84,311
Paterson, Gerri 84,742
Pattison, Jennifer 88,539
Paul, Gwen 88,396
Paulhus, Lorie 87,072
Pelletier, Rene 104,863
Perras, Shauna 85,391
Peters, Rodney 68,637
Peterson, Debbie 59,206
Petford, Corey 81,408
Petford, Dion 77,931
Petford, Tammy 77,972
Petrinchuk, Dwayne 76,308
Petrisor, Kendra 53,601
Phillips, Rhonda 87,967
Pinay-Schindler, Sandra 119,335
Pletz, Erin 75,981
Name Amount
Polasek, Christine 75,878
Pollard, Lance 82,768
Pollock, Brenda 84,390
Pollock, John 88,475
Polowich, Lindsay 65,780
Popoff, David 88,396
Popovic, Lyle 88,428
Potter, Holly 81,263
Prystay Thiessen, Tara 51,599
Punshon, Sarah 54,756
Racette, David 84,662
Racette, Michael 68,285
Racette, Patty Lou 84,308
Radwanski, Jill 84,295
Radwanski, Tim 88,396
Radwell, Tom 85,166
Raiwet, Macey 79,514
Rathgeber, Mandy 53,257
Rattray, Gloria 86,769
Redding, Amy 61,042
Redding, Katlyn 67,742
Reed, Dale 149,502
Reeder, Derek 73,277
Regel, Susan 84,862
Reid, Jay 84,733
Reitmeier, Rose Ann 85,400
Rich, Megan 107,457
Riffel, Shelly 85,083
Robertson, Sandra 84,839
Rogala, Lorrie 92,346
Rosnau, Scott 102,776
Ross, Jaret 93,777
Russell, Joel 73,064
Russell, Laura 55,492
Sache, Michael 82,166
Sandberg, Stacy 60,388
Sauer, Anne Marie 84,327
Savill, Melissa 63,441
Schaeffer, Stacey 65,204
Schebel, Miranda 57,788

Prairie Valley Board of Education Annual Report – 2015-16 – Page 52
Name Amount
Scheirer, Whitney 64,652
Schell, Jennifer 84,337
Scheller, Jamie 94,044
Schenk, Drew 85,400
Schill, Craig 63,790
Schimnosky, Robert 84,295
Schmitz, Janice 84,859
Schoepp, Sherry 84,295
Schuster, Lori 85,650
Schwab, Michele 85,658
Sedo, Julie 114,356
Sefton, Shirley 84,354
Shambel, Jessica 66,348
Shaw, Shandi 64,904
Shaw, Tracy 88,540
Shelstad-Sabean, Marcia 88,971
Shevalier, Charlotte 68,129
Shoemaker, Garth 101,706
Sikorski, Mary 64,042
Sillers, Tammy 102,515
Silvester, Jodie 84,460
Silzer, Gerald 100,400
Simmons, Lynn 86,525
Sinclair, Robyn 77,821
Singleton, Denise 94,442
Sirois, Marielle 50,807
Skene, Annette 68,295
Skibinsky, Chelsey 59,762
Sklar, Aaron 88,672
Smith, Angie 84,765
Smith, Corralee 106,201
Smith, Derek 150,073
Smith, Michael 69,294
Smyth, Christal 82,628
Sparvier, Jenna 54,474
Spitzer, Sarah 64,037
Sproat, Dionne 82,974
Squires, Nicole 71,544
Stadnyk, Fulvia 89,266
Starblanket, Kelsey 78,509
Name Amount
Stecyk, Amanda 65,709
Stecyk, Kalene 57,203
Stecyk, Lyle 155,905
Stefan, Kayla 74,347
Stein, Kristen 68,181
Steinhubl, Joseph 60,282
Stephenson, Sarah 77,312
Stevenson, Rodney 94,659
Stone, Sarah 89,389
Stringer, Brenda 85,273
Stroeder, Joseph 85,343
Stroeder, Roderick 84,848
Sudom, Leanne 107,439
Sullivan, Melissa 73,400
Sunderland, Sandra 84,579
Sveinbjornson, Robin 84,571
Swanson, Ailsa 84,387
Sweatman, Michael 99,299
Sweet, Darin 71,262
Switzer, Leslie 84,817
Switzer, Randi-lee 61,172
Tainio-Kiefer, Mervi 60,974
Taman, Lewis 56,580
Taylor, Kara 65,810
Taylor, Timothy 98,796
Templeton-Schultz, Audrey 84,360
Terry, Corey 109,591
Thauberger, Kim 70,630
Tholl, Tamara 84,436
Tholl, Victor 84,783
Thompson, Tia 65,465
Thresher, Barbara 62,118
Thrun, Teresa 53,833
Thurmeier, Patti 104,389
Toth, Jana 84,918
Tourand, Calvin 54,953
Trakalo, Allen 88,396
Tran, Samantha 61,925
Trann, Melissa 84,908
Trenholm, Judson 83,490

Prairie Valley Board of Education Annual Report – 2015-16 – Page 53
Name Amount
Turluk, Shawna 81,923
Umpherville, Colleen 110,733
Ursu, Jolene 61,853
Vadeboncoeur, Terelyne 70,138
Vallee, Greg 54,953
Van Dyke, Mia 83,404
Van Luven-Radwell, Michelle 84,374
Vanchu, Taylor 59,742
Vargo, Kayla 67,168
Verity, Darla 84,295
Verity, Richard 54,953
Vicente, Stephanie 71,895
Viergutz, Trevor 82,834
Vollman, BrieAnn 75,949
Vollman, Daniel 78,934
Wagner, Adele 61,037
Wagner, Susan 64,504
Wagner, Tammy 59,469
Waldner, Bailey 64,873
Walker, Patricia 98,538
Ward, Crystal 67,611
Ward, Sheldon 78,773
Warken, Judy 84,710
Watchman, Julie 83,160
Weaver, Gregory 86,153
Weeks, Cindy 89,280
Weichel, Wendy 72,152
Weisbrod, Garth 84,801
Weisbrod, Kate-Lynn 58,322
Weitzel, Bev 97,449
Weitzel, Jason 113,703
Werner, Brenda 84,996
Name Amount
West, Leah 88,396
Whalley, Ryan 94,073
Wheeler, Ryan 81,112
Whitteron, Linda 96,653
Wiebe, Jeffrey 85,617
Wiens, Jill 67,142
Wiest, Mark 99,805
Wihlidal, Randy 107,542
Wiley, Sandra 101,399
Wilk, JoAnn 77,906
Wilkie, Myrna 64,916
Will, Karen 77,817
Williams, Regan 97,236
Wilson, Lorne 88,761
Wilson, Sarah 63,157
Winand, Patrick 55,254
Winter, Heather 62,207
Winter, Jenna 61,366
Wright, Lorelei 62,804
Wyatt, Doris 107,586
Yanko, Ryan 73,298
Yee, Patrick 109,040
Youck-Cousins, Carol 100,560
Young, Nicole 88,083
Young-Lee, Jill 86,871
Zaiser, Angela 65,361
Zech, Anton 59,453
Zepick, Kim 84,642
Zinger, Mark 54,953
Zinger, Twyla 88,546
Zuiker, Sarah 63,524
Transfers
Name Amount
File Hills Qu’Appelle Tribal Council 150,000

Prairie Valley Board of Education Annual Report – 2015-16 – Page 54
Supplier Payments
Name Amount
Apple Canada Inc. 236,059
Beliveau Construction 67,826
BG Prairie Distributors 65,735
Boardwalk Communications Ltd. 357,338
Book & Brier Patch 59,445
Caliber Sports 109,032
Capital Ford Lincoln Inc. 166,489
Cardinal Health 97,200
CCR Construction 209,379
Century West Construction Ltd. 252,788
CIT Financial Ltd 63,048
Courtesy Driving School 96,630
Crestview Chrysler Jeep 162,007
Cummins Western Canada 75,278
Deco Interiors Ltd. 80,500
Do All Floors Ltd 91,809
Domo Gasoline Corporation 70,577
Double Diamond Industrial Structures 368,034
Evolution Presentation 179,365
Federated Co-operatives Ltd. 985,200
Gabriel Construction 215,844
Geanel Restaurant Supplies 135,515
Good Spirit School Division 60,563
Graham's Tire Service Ltd. 89,308
Great Western Saw Ltd. 162,429
Horsman Driving School 122,655
Independent Construction 119,126
Kress Electric Ltd. 105,406
Legacy Bus Sales 1,717,918
Loraas Disposal 58,933
Marsh Canada Ltd. 518,138
Maxim International Trucks 66,303
Name Amount
Mazenc Fuels Ltd. 91,162
Merlan Scientific 72,640
Municipal Employees Pension Plan 1,688,357
Nelson Education Ltd. 181,461
Pattison MGM Architectural 67,248
Pearson Education Canada 220,203
Powerland Computers 810,218
Quorex Construction Services 201,648
Royale Driving Academy 165,071
Russell Food Equipment Ltd. 258,279
Sask. School Boards Association 1,419,096
Sask. Worker's Compensation 275,682
Saskcon Repair Services 166,219
SaskEnergy 586,926
SaskPower 1,251,816
SaskTel CMR 1,072,957
SaskTel Mobility 100,464
SchoolLogic 78,904
SEPW Architecture Inc. 74,274
Sportfactor Inc. 68,438
St. John's Music 55,795
Supreme Basics 354,398
Toshiba Business Solutions 364,537
Town of Balgonie 50,024
Town of Pilot Butte 83,463
Town of Regina Beach 61,969
Trade West Equipment 252,417
Van Alstine Project Management 207,019
Warner Bus Industries Ltd. 189,625
Wesclean Equipment 100,678

Prairie Valley Board of Education Annual Report – 2015-16 – Page 55
Other Expenditures
Name Amount
Canadian Union of Public Employees $153,691
Municipal Employees Pension Plan 1,688,357
Receiver General for Canada 19,536,184
Name Amount
Saskatchewan Teachers’ Federation 6,443,605
Teachers’ Superannuation Commission 95,081

Prairie Valley Board of Education Annual Report – 2015-16 – Page 56
Appendix B – Management Report and Audited Financial Statements

Audited Financial Statements
Of the
School Division No. 2080500
For the Period Ending: August 31, 2016
Naomi MellorChief Financial Officer
MNP LLPAuditor
Note - Copy to be sent to Ministry of Education, Regina
Prairie Valley School Division No. 208

Independent Auditors’ Report To the Chairman and Trustees of The Board of Education of the Prairie Valley School Division No. 208 We have audited the accompanying financial statements of Prairie Valley School Division No. 208, which comprise the statement of financial position as at August 31, 2016 and the statements of operations and accumulated surplus from operations, changes in net debt and cash flows for the years then ended, and a summary of significant accounting policies and other explanatory information. Management’s Responsibility for the Financial Statements Management is responsible for the preparation and fair presentation of these financial statements in accordance with Canadian public sector accounting standards, and for such internal control as management determines is necessary to enable the preparation of financial statements that are free from material misstatement, whether due to fraud or error. Auditors’ Responsibility Our responsibility is to express an opinion on these financial statements based on our audit. We conducted our audit in accordance with Canadian generally accepted auditing standards. Those standards require that we comply with ethical requirements and plan and perform the audit to obtain reasonable assurance about whether the financial statements are free from material misstatement. An audit involves performing procedures to obtain audit evidence about the amounts and disclosures in the financial statements. The procedures selected depend on the auditors’ judgment, including the assessment of the risks of material misstatement of the financial statements, whether due to fraud or error. In making those risk assessments, the auditor considers internal control relevant to the entity’s preparation and fair presentation of the financial statements in order to design audit procedures that are appropriate in the circumstances, but not for the purpose of expressing an opinion on the effectiveness of the entity’s internal control. An audit also includes evaluating the appropriateness of accounting policies used and the reasonableness of accounting estimates made by management, as well as evaluating the overall presentation of the financial statements. We believe that the audit evidence we have obtained is sufficient and appropriate to provide a basis for our audit opinion. Opinion In our opinion, the financial statements present fairly, in all material respects, the financial position of Prairie Valley School Division No. 208 as at August 31, 2016, and the results of its operations, changes in net debt and its cash flows for the year then ended in accordance with Canadian public sector accounting standards. Regina, SK November 9, 2016 Chartered Professional Accountants
Accounting › consulting › tAxSuite 900, royal bank building, 2010 - 11th aVenue, regina Sk, S4P 0J3
1.877.500.0780 P: 306.790.7900 F: 306.790.7990 MnP.ca

Management's Responsibility for the Financial Statements
T h e school divis ion 's management is responsible for the preparation o f the financial
statements in accordance with Canadian public sector accounting standards and t he
format specified in the Financial Report ing Manual issued b y t h e Ministry o f
Education. The preparation o f financial statements necessarily involves the use o f
estimates based o n management ' s judgment , particularly when transactions affecting
the current accounting period cannot be finalized with certainty until future periods.
T h e school divis ion 's management maintains a system o f accounting and administrative
controls to ensure that accurate a n d reliable financial statements a re prepared and t o
provide reasonable assurance that transactions are authorized, assets are safeguarded, and financial records are properly maintained to provide reliable information for t he
preparation o f financial statements.
T h e Board o f Education is composed o f elected officials who are not employees o f the school division. T h e Board is responsible for ensuring that management fulfills its
responsibilities for financial report ing and internal control, a n d for approving t he
financial statements. T h e Board is also responsible for the appointment o f the school division's external auditors.
The external auditors, M N P LLP, conduct an independent examination in accordance
with Canadian auditing standards and express their opinion o n the financial statements.
The accompanying Auditors ' Repor t outlines their responsibilities, the scope o f their
examination and their opinion o n the school divis ion 's financial statements. T h e
external auditors have full and free access to, and mee t periodically and separately
with, both the Board and management t o discuss their audit f indings.
O n beha l f o f the Prairie Valley School Division N o . 208 :
Supervisor o f Finance
November 9, 2016

Prairie Valley School Division No. 208
Statement o f Financial Position
as at August 31, 2 0 1 6
• page 1
2016 2015
Financial Assets
Cash and Cash Equivalents
Accounts Receivable (Note 7) 933,606
23,606,811
919,142
25,175,830
Total Financial Assets 24,540,417 26,094,972
Liabilities
Bank Indebtedness (Note 3 )
Accounts Payable and Accrued Liabilities (Note 8)
Long-Term Debt (Note 9)
Liability for Employee Future Benefits (Note 5)
Deferred Revenue (Note 10)
488,664
5,355,973
16,200,675
844,700
1,900,244
6,065,646
4,131,338
17,655,209
737,000
1,203,499
Total Liabilities 24,790,256 29,792,692
Net Debt (249,839) (3,697,720)
Non-Financial Assets
Tangible Capital Assets (Schedule C ) Inventory o f Supplies for Consumption
Prepaid Expenses
121,122,382
291,408
523,732
122,125,787 229,068
647,764
Total Non-Financial Assets 121,937,522 123,002,619
Accumulated Surplus (Note 13) 121,687,683 119,304,899
Contractual Obligations and Commitments (Note 16)
The accompanying notes and schedules are an integral part o f these statements.

… page 2
2016 2016 2015Budget Actual Actual
REVENUES(Note 14)
Property Taxation 38,590,560 41,933,898 39,881,099 Grants 55,464,766 54,134,870 54,487,262 Tuition and Related Fees 5,832,189 6,050,508 5,840,279 School Generated Funds 2,482,597 2,836,928 2,734,943 Complementary Services (Note 11) 659,998 660,000 638,647 External Services (Note 12) - 150,000 150,000 Other 695,000 922,226 1,563,739
Total Revenues (Schedule A) 103,725,110 106,688,430 105,295,969
EXPENSESGovernance 497,677 654,583 630,341 Administration 4,492,884 4,402,784 3,963,990 Instruction 71,029,779 71,130,098 70,833,119 Plant 11,782,442 12,664,384 12,175,722 Transportation 9,515,798 9,190,732 9,582,885 Tuition and Related Fees 62,000 65,417 106,580 School Generated Funds 2,452,457 2,793,262 2,689,633 Complementary Services (Note 11) 2,598,293 2,526,313 2,589,275 External Services (Note 12) - 150,000 150,000 Other Expenses 740,395 728,073 875,656
Total Expenses (Schedule B) 103,171,725 104,305,646 103,597,201
Operating Surplus for the Year 553,385 2,382,784 1,698,768
Accumulated Surplus from Operations, Beginning of Year 119,304,899 119,304,899 117,606,131
Accumulated Surplus from Operations, End of Year 119,858,284 121,687,683 119,304,899
The accompanying notes and schedules are an integral part of these statements.
Prairie Valley School Division No. 208
Statement of Operations and Accumulated Surplus from Operationsfor the year ended August 31, 2016

… page 3
2016 2016 2015Budget Actual Actual
(Note 14)
Net Debt, Beginning of Year (3,697,720) (3,697,720) (5,366,424)
Changes During the YearOperating Surplus for the Year 553,385 2,382,784 1,698,768 Acquisition of Tangible Capital Assets (Schedule C) (5,297,783) (6,481,719) (6,332,894) Amortization of Tangible Capital Assets (Schedule C) 6,223,934 7,485,124 6,437,276 Net Acquisition of Inventory of Supplies - (62,340) 5,224 Net Change in Other Non-Financial Assets - 124,032 (139,670)
Change in Net Debt 1,479,536 3,447,881 1,668,704
Net Debt, End of Year (2,218,184) (249,839) (3,697,720)
The accompanying notes and schedules are an integral part of these statements.
Prairie Valley School Division No. 208
Statement of Changes in Net Debtfor the year ended August 31, 2016

… page 4
2016 2015
OPERATING ACTIVITIESOperating Surplus for the Year 2,382,784 1,698,768 Add Non-Cash Items Included in Surplus (Schedule D) 7,485,124 6,437,276 Net Change in Non-Cash Operating Activities (Schedule E) 3,659,791 (991,573)
Cash Provided by Operating Activities 13,527,699 7,144,471
CAPITAL ACTIVITIESCash Used to Acquire Tangible Capital Assets (6,481,719) (6,332,894)
Cash Used by Capital Activities (6,481,719) (6,332,894)
FINANCING ACTIVITIESRepayment of Long-Term Debt (1,454,534) (1,520,352)
Cash Used by Financing Activities (1,454,534) (1,520,352)
INCREASE (DECREASE) IN CASH AND CASH EQUIVALENTS 5,591,446 (708,775)
CASH AND CASH EQUIVALENTS, BEGINNING OF YEAR (5,146,504) (4,437,729)
CASH AND CASH EQUIVALENTS, END OF YEAR 444,942 (5,146,504)
REPRESENTED ON THE FINANCIAL STATEMENTS BY:Cash and Cash Equivalents 933,606 919,142 Bank Indebtedness (488,664) (6,065,646)
CASH AND CASH EQUIVALENTS, END OF YEAR 444,942 (5,146,504)
The accompanying notes and schedules are an integral part of these statements.
Prairie Valley School Division No. 208Statement of Cash Flows
for the year ended August 31, 2016

…page 5
PRAIRIE VALLEY SCHOOL DIVISION NO. 208 NOTES TO THE FINANCIAL STATEMENTS
As at August 31, 2016
1. AUTHORITY AND PURPOSE The school division operates under the authority of The Education Act, 1995 of Saskatchewan as a corporation under the name of “The Board of Education of the Prairie Valley School Division No. 208” and operates as “The Prairie Valley School Division No. 208”. The school division provides education services to residents within its geographic region and is governed by an elected board of trustees. The school division is funded mainly by grants from the Government of Saskatchewan and a levy on the property assessment included in the school division’s boundaries at mill rates determined by the provincial government. The school division is exempt from income tax and is a registered charity under the Income Tax Act.
2. SIGNIFICANT ACCOUNTING POLICIES
These financial statements have been prepared in accordance with Canadian public sector accounting standards for other government organizations as established by the Public Sector Accounting Board (PSAB) and as published by the Chartered Professional Accountants of Canada (CPA Canada). Significant aspects of the accounting policies adopted by the school division are as follows: a) Basis of Accounting
The financial statements are prepared using the accrual basis of accounting.
b) Reporting Entity
The financial statements include all of the assets, liabilities, revenues and expenses of the school division reporting entity.
c) Measurement Uncertainty and the Use of Estimates Canadian public sector accounting standards require management to make estimates and assumptions that affect the reported amount of assets and liabilities and disclosure of contingent assets and liabilities at the date of the financial statements, and the reported amounts of revenues and expenses during the year. Measurement uncertainty that may be material to these financial statements exists for: the liability for employee future benefits of $844,700 (2015 - $737,000)
because actual experience may differ significantly from actuarial estimations. property taxation revenue of $41,933,898 (2015 - $39,881,099) because final
tax assessments may differ from initial estimates. uncollectible taxes of $862,332 (2015 - $1,149,464) because actual
collectability may differ from initial estimates.

…page 6
PRAIRIE VALLEY SCHOOL DIVISION NO. 208 NOTES TO THE FINANCIAL STATEMENTS
As at August 31, 2016
useful lives of capital assets and related amortization of $7,485,124 (2015 - $6,437,276) because the actual useful lives of the capital assets may differ from their estimated economic lives.
These estimates and assumptions are reviewed periodically and, as adjustments become necessary, they are reported in earnings in the periods in which they become known. While best estimates are used for reporting items subject to measurement uncertainty, it is reasonably possible that changes in future conditions, occurring within one fiscal year, could require material changes in the amounts recognized or disclosed.
d) Financial Instruments
Financial instruments are any contracts that give rise to financial assets of one entity and financial liabilities or equity instruments of another entity. A contract establishing a financial instrument creates, at its inception, rights and obligations to receive or deliver economic benefits. The school division recognizes a financial instrument when it becomes a party to the contractual provisions of a financial instrument. The financial assets and financial liabilities portray these rights and obligations in the financial statements. Financial instruments of the school division include cash and cash equivalents, accounts receivable, bank indebtedness, accounts payable and accrued liabilities and long-term debt. All financial instruments are measured at cost or amortized cost. Transaction costs are a component of the cost of financial instruments measured using cost or amortized cost. For financial instruments measured using amortized cost, the effective interest rate method is used to determine interest revenues or expenses. Impairment losses such as write-downs or write-offs are reported in the statement of operations and accumulated surplus from operations. Bond premiums and discounts are amortized to income over the period remaining from the acquisition date to the date of bond maturity. Gains and losses on financial instruments, measured at cost or amortized cost, are recognized in the statement of operations and accumulated surplus from operations in the period the gain or loss occurs. Foreign currency transactions are translated at the exchange rate prevailing at the date of the transactions. Monetary assets and liabilities denominated in foreign currencies are translated into Canadian dollars at the exchange rate prevailing at the financial statement date. The school division believes that it is not subject to significant unrealized foreign exchange translation gains and losses arising from its financial instruments.

…page 7
PRAIRIE VALLEY SCHOOL DIVISION NO. 208 NOTES TO THE FINANCIAL STATEMENTS
As at August 31, 2016
e) Financial Assets
Financial assets are assets that could be used to discharge existing liabilities or finance future operations and are not for consumption in the normal course of operations. Valuation allowances are used where considered necessary to reduce the amounts reported for financial assets to their net realizable value. Cash and Cash Equivalents consist of cash, bank deposits and highly liquid investments with initial maturity terms of three months or less and held for the purpose of meeting short-term operating cash commitments rather than for investing purposes. Accounts Receivable include taxes receivable, provincial grants receivable and other receivables. Taxes receivable represent education property taxes assessed or estimated owing to the end of the fiscal period but not yet received. The allowance for uncollected taxes is a valuation allowance used to reduce the amount reported for taxes receivable to the estimated net recoverable amount. The allowance represents management’s estimate of the amount of taxes that will not be collected taking into consideration prior years’ tax collections and information provided by municipalities regarding collectability of outstanding balances. Provincial grants receivable represent operating, capital and other grants earned but not received at the end of the fiscal year, provided reasonable estimates of the amounts can be made. Grants are earned when the events giving rise to the grant have occurred, the grant is authorized and any eligibility criteria have been met. Other receivables are recorded at cost less valuation allowances. These allowances are recorded where collectability is considered doubtful.
f) Non-Financial Assets Non-financial assets are assets held for consumption in the provision of services. These assets do not normally provide resources to discharge the liabilities of the school division unless they are sold. Tangible Capital Assets have useful lives extending beyond the accounting period, are used by the school division to provide services to the public and are not intended for sale in the ordinary course of operations. Tangible capital assets of the school division include land and land improvements, buildings, buildings short-term, school buses, other vehicles, furniture and equipment, computer hardware and software, audio visual equipment, capital lease assets, and assets under construction. Tangible capital assets are recorded at cost (or estimated cost when the actual cost is unknown) and include all costs directly attributable to the acquisition, design, construction, development, installation and betterment of the tangible capital asset. The school division does not capitalize interest incurred while a tangible capital asset is under construction.

…page 8
PRAIRIE VALLEY SCHOOL DIVISION NO. 208 NOTES TO THE FINANCIAL STATEMENTS
As at August 31, 2016
The cost of depreciable tangible capital assets, net of any residual value, is amortized on a straight line basis over their estimated useful lives as follows:
Land improvements (pavement, fencing, lighting, etc.) 20 years Buildings 50 years Buildings – short-term (portables, storage sheds, outbuildings, garages)
20 years
School buses 12 years Other vehicles – passenger 5 years Other vehicles – heavy (graders, 1 ton truck, etc.) 10 years Furniture and equipment 10 years Computer hardware and audio visual equipment 4 years Computer software 5 years Leased capital assets Lease term
Assets under construction are not amortized until completed and placed into service for use. Assets that have a historical or cultural significance, such as works of art, monuments and other cultural artifacts, are not recognized as tangible capital assets because a reasonable estimate of future benefits associated with these properties cannot be made. Inventory of Supplies for Consumption consists of supplies held for consumption by the school division in the course of normal operations and are recorded at the lower of cost and replacement cost. Prepaid Expenses are prepaid amounts for goods or services which will provide economic benefits in one or more future periods. Prepaid expenses include insurance premiums, Saskatchewan School Boards Association membership fees, and Workers’ Compensation premiums.
g) Liabilities Liabilities are present obligations arising from transactions and events occurring prior to year-end, which will be satisfied in the future through the use of assets or another form of economic settlement. Short-Term Borrowings are comprised of bank indebtedness with initial maturities of one year or less and are incurred for the purpose of financing current expenses in accordance with the provisions of The Education Act, 1995. Accounts Payable and Accrued Liabilities include accounts payable and accrued liabilities owing to third parties and employees for work performed, goods supplied and services rendered, but not yet paid, at the end of the fiscal period.

…page 9
PRAIRIE VALLEY SCHOOL DIVISION NO. 208 NOTES TO THE FINANCIAL STATEMENTS
As at August 31, 2016
Long-Term Debt is comprised of debentures, capital loans and other long-term debt with initial maturities of more than one year and are incurred for the purpose of financing capital expenses in accordance with the provisions of The Education Act, 1995. Long-term debt also includes capital lease obligations where substantially all of the benefits and risks incident to ownership are transferred to the school division without necessarily transferring legal ownership. The amount of the lease liability recorded at the beginning of the lease term is the present value of the minimum lease payments, excluding the portion thereof relating to executory costs. Liability for Employee Future Benefits represent post-employment and compensated absence benefits that accrue to the school division's employees. The cost of these benefits is recorded as the benefits are earned by employees. The liability relating to these benefits is actuarially determined using the projected benefit method pro-rated on service. Actuarial valuations are performed periodically using assumptions including discount rate, inflation, salary escalation, termination and retirement rates and mortality. An actuary extrapolates these valuations when a valuation is not done in the current fiscal year. Actuarial gains and losses are amortized on a straight line basis over the expected average remaining service life of the related employee groups.
h) Employee Pension Plans Employees of the school division participate in the following pension plans: Multi-Employer Defined Benefit Plans The school division’s employees participate in one of the following multi-employer defined benefit plans: i) Teachers participate in the Saskatchewan Teachers’ Retirement Plan (STRP) or
the Saskatchewan Teachers’ Superannuation Plan (STSP). The school division’s obligation for these plans is limited to collecting and remitting contributions of the employees at rates determined by the plans.
ii) Other employees participate in the Municipal Employees’ Pension Plan
(MEPP). In accordance with the Public Sector Accounting Board (PSAB) standards, the plan is accounted for as a defined contribution plan whereby the school division’s contributions are expensed when due.
i) Revenue Recognition
Revenues are recorded on the accrual basis. Revenues are recognized in the period in which the transactions or events occurred that gave rise to the revenues, provided the amount to be received can be reasonably estimated and collection is reasonably assured.

…page 10
PRAIRIE VALLEY SCHOOL DIVISION NO. 208 NOTES TO THE FINANCIAL STATEMENTS
As at August 31, 2016
The school division’s sources of revenues include the following: i) Government Transfers (Grants)
Grants from governments are considered to be government transfers. In accordance with PS3410 standard, government transfers are recognized as revenues when the transfer is authorized, all eligibility criteria have been met, the amount can be estimated and collection is reasonably assured except when, and to the extent, stipulations by the transferor give rise to an obligation that meets the definition of a liability. For transfers with stipulations, revenue is recognized in the statement of operations and accumulated surplus from operations as the stipulation liabilities are settled.
ii) Property Taxation Property tax is levied and collected on a calendar year basis. Uniform education property tax mill rates are set by the Government of Saskatchewan. Tax revenues are recognized on the basis of time with 1/12th of estimated total tax revenue recorded in each month of the school division’s fiscal year. The tax revenue for the September to December portion of the fiscal year is based on the actual amounts reported by the municipalities for the calendar taxation year. For the January to August portion of its fiscal year, the school division estimates tax revenue based on estimate information provided by municipalities who levy and collect the property tax on behalf of the school division. The final annual taxation amounts are reported to the division by each municipality following the conclusion of each calendar taxation year, and any difference between final amounts and the school division’s estimates is recorded as an adjustment to revenue in the next fiscal year.
iii) Fees and Services Revenues from tuition fees and other fees and services are recognized in the year they are earned. Amounts that are restricted pursuant to legislation, regulation or agreements with external parties that may only be used in the conduct of certain programs or in the delivery of specific services and transactions are initially recorded as deferred revenue and subsequently recognized as revenue in the fiscal year the related expenses are incurred or services are performed.
iv) Interest Income Interest is recognized on an accrual basis when it is earned.

…page 11
PRAIRIE VALLEY SCHOOL DIVISION NO. 208 NOTES TO THE FINANCIAL STATEMENTS
As at August 31, 2016
v) Other (Non-Government Transfer) Contributions Unrestricted contributions are recognized as revenue in the year received or in the year the funds are committed to the school division if the amount can be reasonably estimated and collection is reasonably assured. Externally restricted contributions are contributions for which the contributor has placed restrictions on the use of the resources. Externally restricted contributions that are to be held in perpetuity are recognized as revenue in the year in which they are received or committed if the amount can be reasonably estimated and collection is reasonably assured. Externally restricted contributions that are not held in perpetuity are deferred until the resources are used for the purpose specified, at which time the contributions are recognized as revenue. In-kind contributions are recorded at their fair value when they are received.
j) Statement of Remeasurement Gains and Losses
The school division has not presented a statement of remeasurement gains and losses because it does not have financial instruments that give rise to material remeasurement gains or losses.
3. SHORT-TERM BORROWINGS
Bank indebtedness consists of a demand operating line of credit with a maximum borrowing limit of $16,000,000 (2015-$16,000,000) that bears interest at prime less 0.50% with the Bank of Montreal. This line of credit is authorized by a borrowing resolution by the board of education and is secured by legislative grants payable to the school division. This line of credit was approved by the Minister of Education on June 10, 2015. The balance drawn on the line of credit at August 31, 2016 was $488,664 at an interest rate of prime less 0.50% (August 31, 2015 - $6,065,646 at an interest rate of prime less 0.50%).
4. EXPENSES BY FUNCTION AND ECONOMIC CLASSIFICATION
FunctionSalaries & Benefits
Goods & Services
Debt ServiceAmortization
of TCA2016
Actual2015
Actual
Governance $ 318,497 $ 336,086 $ - $ - $ 654,583 $ 630,341
Administration 3,667,083 595,729 - 139,972 4,402,784 3,963,990
Instruction 64,078,194 4,392,418 - 2,659,486 71,130,098 70,833,119
Plant 4,096,100 5,310,878 - 3,257,406 12,664,384 12,175,722
Transportation 5,059,347 2,703,125 - 1,428,260 9,190,732 9,582,885
Tuition and Related Fees - 65,417 - - 65,417 106,580
School Generated Funds - 2,793,262 - - 2,793,262 2,689,633
Complementary Services 2,298,078 228,235 - - 2,526,313 2,589,275
External Services - 150,000 - - 150,000 150,000
Other - - 728,073 - 728,073 875,656
TOTAL $ 79,517,299 $ 16,575,150 $ 728,073 $ 7,485,124 $ 104,305,646 $ 103,597,201

…page 12
PRAIRIE VALLEY SCHOOL DIVISION NO. 208 NOTES TO THE FINANCIAL STATEMENTS
As at August 31, 2016
5. EMPLOYEE FUTURE BENEFITS
The school division provides certain post-employment, compensated absence and termination benefits to its employees. These benefits include accumulating non-vested sick leave. The liability associated with these benefits is calculated as the present value of expected future payments pro-rated for service and is recorded as Liability for Employee Future Benefits in the statement of financial position. Morneau Shepell Ltd, a firm of consulting actuaries, performed an actuarial valuation and extrapolated the results to estimate the Liability for Employee Future Benefits as at August 31, 2016. Details of the employee future benefits are as follows:
2016 2015Actuarial extrapolation date Aug/31/2016 Aug/31/2015 Long-term assumptions used: Discount rate at end of period 2.10% 2.50% Inflation and productivity rate (excluding merit and promotion) 3.20% 3.20% Expected average remaining service life (years) 14 14
Liability for Employee Future Benefits 2016 2015
Accrued Benefit Obligation - beginning of year 1,242,400$ 780,600$ Current period service cost 116,400 71,900 Interest cost 33,000 23,400 Benefit payments (81,500) (32,000) Actuarial losses 66,700 398,500
Plan amendments 1,200 - Accrued Benefit Obligation - end of year 1,378,200 1,242,400 Unamortized Net Actuarial Losses (533,500) (505,400)
Liability for Employee Future Benefits 844,700$ 737,000$
Employee Future Benefits Expense 2016 2015
Current period service cost 116,400$ 71,900$ Amortization of net actuarial loss 38,600 10,100 Plan amendments 1,200 - Benefit cost 156,200 82,000 Interest cost on unfunded employee future benefits obligation 33,000 23,400
Total Employee Future Benefits Expense 189,200$ 105,400$

…page 13
PRAIRIE VALLEY SCHOOL DIVISION NO. 208 NOTES TO THE FINANCIAL STATEMENTS
As at August 31, 2016
6. PENSION PLANS Multi-Employer Defined Benefit Plans Information on the multi-employer pension plans to which the school division contributes is as follows: i) Saskatchewan Teachers’ Retirement Plan (STRP) or Saskatchewan Teachers’
Superannuation Plan (STSP) The STRP and STSP provide retirement benefits based on length of service and pensionable earnings. The STRP and STSP are funded by contributions by the participating employee members and the Government of Saskatchewan. The school division’s obligation to the STRP and STSP is limited to collecting and remitting contributions of the employees at rates determined by the plans. Accordingly, these financial statements do not include any expense for employer contributions to these plans. Net pension assets or liabilities for these plans are not reflected in these financial statements as ultimate responsibility for retirement benefits rests with the Saskatchewan Teachers’ Federation for the STRP and with the Government of Saskatchewan for the STSP. Details of the contributions to these plans for the school division’s employees are as follows:
2015STRP STSP TOTAL TOTAL
Number of active School Division members 728 15 743 697 Member contribution rate (percentage of salary) 10.20-12.40% 6.05-7.85% 6.05-12.40% 6.05-12.40% Member contributions for the year 5,120,498$ 62,616$ 5,183,114$ 4,692,878$
2016

…page 14
PRAIRIE VALLEY SCHOOL DIVISION NO. 208 NOTES TO THE FINANCIAL STATEMENTS
As at August 31, 2016
ii) Municipal Employees’ Pension Plan (MEPP) The MEPP provides retirement benefits based on length of service and pensionable earnings. The MEPP is funded by employer and employee contributions at rates set by the Municipal Employees’ Pension Commission. Every three years, an actuarial valuation is performed to assess the financial position of the plan and the adequacy of plan funding. Any actuarially determined deficiency is the responsibility of the participating employers and employees which could affect future contribution rates and/or benefits. The contributions to the MEPP by the participating employers are not segregated in separate accounts or restricted to provide benefits to the employees of a particular employer. As a result, individual employers are not able to identify their share of the underlying assets and liabilities, and the net pension assets or liabilities for this plan are not recognized in these financial statements. In accordance with the Public Sector Accounting Board (PSAB) standards, the plan is accounted for as a defined contribution plan whereby the school division’s contributions are expensed when due. Details of the MEPP are as follows:
2016 2015
Number of active School Division members 662 661
Member contribution rate (percentage of salary) 8.15% 8.15% School Division contribution rate (percentage of salary) 8.15% 8.15% Member contributions for the year 1,688,357$ 1,634,965$
School Division contributions for the year 1,688,357$ 1,634,965$
Actuarial (extrapolation date) valuation date (Dec-31-2015) Dec-31-2014
Plan Assets (in thousands) 2,148,676$ 2,006,587$
Plan Liabilities (in thousands) 1,831,743$ 1,672,585$
Plan Surplus (in thousands) 316,933$ 334,002$

…page 15
PRAIRIE VALLEY SCHOOL DIVISION NO. 208 NOTES TO THE FINANCIAL STATEMENTS
As at August 31, 2016
7. ACCOUNTS RECEIVABLE All accounts receivable presented on the statement of financial position are net of any valuation allowances for doubtful accounts. Details of accounts receivable balances and allowances are as follows:
Total Valuation Net of Total Valuation Net ofReceivable Allowance Allowance Receivable Allowance Allowance
Taxes Receivable 20,750,379$ 862,332$ 19,888,047$ 21,712,877$ 1,149,464$ 20,563,413$ Provincial Grants Receivable 330,000 - 330,000 65,814 - 65,814 Other Receivables 3,388,764 - 3,388,764 4,546,603 - 4,546,603 Total Accounts Receivable 24,469,143$ 862,332$ 23,606,811$ 26,325,294$ 1,149,464$ 25,175,830$
2016 2015
8. ACCOUNTS PAYABLE AND ACCRUED LIABILITIES
Details of accounts payable and accrued liabilities are as follows:
2016 2015
Accrued Salaries and Benefits 1,969,091$ 1,666,754$ Supplier Payments 2,771,161 1,827,919 Accrued Interest on Long-Term Debt 39,946 42,947 Teacher Professional Development Fund 575,775 593,718
Total Accounts Payable and Accrued Liabilities 5,355,973$ 4,131,338$

…page 16
PRAIRIE VALLEY SCHOOL DIVISION NO. 208 NOTES TO THE FINANCIAL STATEMENTS
As at August 31, 2016
9. LONG-TERM DEBT
Details of long-term debt are as follows:
2016 2015
Debentures: The School Division has purchased an annuity debenture dated June 1, 2006 from the Municipal Financing Corporation of Saskatchewan (MFC) in the amount of $7,330,080. The 20 year debenture is repayable in annual amounts of $595,688, including interest at 5.15% due June 1. The School Division has the option to prepay the debenture prior to maturity, in accordance with MFC's repayment policy. The due date is June 1, 2026. 4,566,426$ 4,909,286$
4,566,426 4,909,286
Capital Loans: Capital bank loan for major capital projects payable to Royal Bank (RBC), at $75,263 due on the last day of the month, including interest at 3.80% per annum. The due date is April 30, 2033. 11,138,469 11,608,626
Capital bank loan for capital projects payable to BMO Bank of Montreal, at $24,127 due on the last day of the month, including interest at 2.38% per annum. The due date is May 31, 2018. 495,780 769,959
11,634,249 12,378,585 Other Long-Term Debt: Capital Leases
Capital bank lease for bus purchases payable to Royal Bank of Canada at $41,464 due on the 26th of each month, including interest at 3.80% per annum. Secured by the equipment. The due date is May 26, 2016. - 367,338
- 367,338
Total Long-Term Debt 16,200,675$ 17,655,209$

…page 17
PRAIRIE VALLEY SCHOOL DIVISION NO. 208 NOTES TO THE FINANCIAL STATEMENTS
As at August 31, 2016
Future principal repayments over the next 5 years are estimated as follows:
Debentures Capital Loans Total
2017 360,518$ 769,113$ 1,129,631$ 2018 379,084 722,228 1,101,312 2019 398,607 526,835 925,442 2020 419,135 547,207 966,342 2021 440,721 568,367 1,009,088 Thereafter 2,568,361 8,500,499 11,068,860
Total 4,566,426$ 11,634,249$ 16,200,675$ Principal and interest payments on the long-term debt are as follows:
Debentures Capital LoansCapital Leases 2016 2015
Principal 342,860$ 744,336$ 367,338$ 1,454,534$ 1,520,352$ Interest 252,828 448,342 5,841 707,011 765,677
Total 595,688$ 1,192,678$ 373,179$ 2,161,545$ 2,286,029$
10. DEFERRED REVENUE
Details of deferred revenues are as follows:
Balance Additions Revenue Balanceas at during the recognized as at
Aug. 31, 2015 Year in the Year Aug. 31, 2016
Capital projects:
Federal capital tuition 514,307$ 190,678$ -$ 704,985$
Total capital projects deferred revenue 514,307 190,678 - 704,985
Other deferred revenue:
Deferred Tax Revenue 689,192 1,195,259 (689,192) 1,195,259
Total other deferred revenue 689,192 1,195,259 (689,192) 1,195,259
Total Deferred Revenue 1,203,499$ 1,385,937$ (689,192)$ 1,900,244$

…page 18
PRAIRIE VALLEY SCHOOL DIVISION NO. 208 NOTES TO THE FINANCIAL STATEMENTS
As at August 31, 2016
11. COMPLEMENTARY SERVICES
Complementary services represent those services and programs where the primary purpose is other than K-12 learning/learning support, but which have the specific objective of enhancing the school division’s ability to successfully deliver its K-12 curriculum/learning programs. Following is a summary of the revenue and expenses of the Complementary Services programs operated by the school division in 2016 and 2015:
Summary of Complementary Services Revenues and Expenses, by Program Pre-K
ProgramsOther
Programs 2016 2015
Revenue:
Operating Grants $ 660,000 $ - $ 660,000 $ 638,647
Total Revenue 660,000 - 660,000 638,647
Expenses:
Tuition Fees - 27,890 27,890 34,073
Salaries & Benefits 597,055 1,701,023 2,298,078 2,306,887
Instructional Aids 23,732 16,896 40,628 48,761
Supplies and Services 2,696 928 3,624 9,351
Communications 66 2,758 2,824 3,959
Travel 66 39,716 39,782 44,405
Professional Development (Non-Salary Costs) - 2,554 2,554 4,099
Student Related Expenses 11,543 99,390 110,933 137,740
Total Expenses 635,158 1,891,155 2,526,313 2,589,275
Excess (Deficiency) of Revenue over Expenses
$ 24,842 $ (1,891,155) $ (1,866,313) $ (1,950,628)
The purpose and nature of each Complementary Services program is as follows: Prekindergarten programs provide in-school programs for children of preschool age. Other Programs consist of social and family support workers, community school supports and cultural and nutrition programs. Social Workers/Child and Family Support workers, members of the multi-disciplinary Student Services team, provide direct service for personal counselling, critical incident response, traumatic events counselling and positive behavioural supports. In addition, these professionals liaise with other agencies to support students and families in the school division. Child Nutrition programs, funded by Child Nutrition and Development Program Grant, exist at six schools. In some cases students are served meals on a needs basis while others offer snacks on a universal basis. The school division also provides additional cultural support programming to schools specific to their regional needs including Elders support for our First Nations students.

…page 19
PRAIRIE VALLEY SCHOOL DIVISION NO. 208 NOTES TO THE FINANCIAL STATEMENTS
As at August 31, 2016
12. EXTERNAL SERVICES
External services represent those services and programs that are outside of the school division’s learning/learning support and complementary programs. These services have no direct link to the delivery of the school division’s K-12 programs nor do they directly enhance the school division’s ability to deliver its K-12 programs. Following is a summary of the revenues and expenses of the External Services programs operated by the school division in 2016 and 2015: Summary of External Services Revenues and Expenses, by Program
Other Programs 2016 2015
Revenues:
Operating Grants $ 150,000 $ 150,000 $ 150,000
Total Revenues 150,000 150,000 150,000
Expenses:
Grant Transfers 150,000 150,000 150,000
Total Expenses 150,000 150,000 150,000
Excess (Deficiency) of Revenues over Expenses $ - $ - $ -
The purpose of each External Services program is as follows: Other Programs provides grant transfers to First Nation Indian bands.
13. ACCUMULATED SURPLUS
Accumulated surplus represents the financial assets and non-financial assets of the school division less liabilities. This represents the accumulated balance of net surplus arising from the operations of the school division including school generated funds. Certain amounts of the accumulated surplus, as approved by the board of education, have been designated for specific future purposes (school generated funds, operating reserve fund and capital asset purchases). These internally restricted amounts are included in the accumulated surplus presented in the statement of financial position. The school division does not maintain separate bank accounts for the internally restricted amounts.

…page 20
PRAIRIE VALLEY SCHOOL DIVISION NO. 208 NOTES TO THE FINANCIAL STATEMENTS
As at August 31, 2016
Details of accumulated surplus are as follows:
August 31
2015
Additions
during the
year
Reductions
during the
year
August 31
2016
Invested in Tangible Capital Assets:
Net Book Value of Tangible Capital Assets 122,125,787$ 6,481,719$ (7,485,124)$ 121,122,382$
Less: Debt owing on Tangible Capital Assets 17,655,209 - (1,454,534) 16,200,675
104,470,578 6,481,719 (6,030,590) 104,921,707
PMR maintenance project allocations (1) - 1,625,562 (1,625,562) -
Internally Restricted Surplus:
Other:
School generated funds 842,104 21,405 - 863,509
Operating reserve fund (2) 1,698,768 2,382,784 - 4,081,552
2,540,872 2,404,189 - 4,945,061
Unrestricted Surplus 12,293,449 - (472,534) 11,820,915
Total Accumulated Surplus 119,304,899$ 10,511,470$ (8,128,686)$ 121,687,683$
(1) PMR Maintenance Project Allocations represent transfers received from the
Ministry of Education as funding support for maintenance projects on the school division’s approved 3 year capital maintenance plans. Unspent funds at the end of a fiscal year are designated for future approved capital plan maintenance project expenditures.
(2) Operating Reserve Fund – The operating reserve fund was created by the board to support stable programming and ongoing operations for the benefit of the students served by Prairie Valley School Division. The reserve provides an internal source of funds to access in situations such as unanticipated increase in expenses, unanticipated funding reductions or shortfalls and uninsured losses. The board approved a transfer of $2,382,784 to the Operating Reserve fund on November 9, 2016.
14. BUDGET FIGURES
Budget figures included in the financial statements were approved by the board of education on June 10, 2015 and the Minister of Education on August 20, 2015.
…page 21
PRAIRIE VALLEY SCHOOL DIVISION NO. 208 NOTES TO THE FINANCIAL STATEMENTS
As at August 31, 2016
15. RELATED PARTIES These financial statements include transactions with related parties. The school division is related to all Government of Saskatchewan ministries, agencies, boards, school divisions, health authorities, colleges, and crown corporations under the common control of the Government of Saskatchewan. The school division is also related to non-crown enterprises that the Government jointly controls or significantly influences. In addition, the school division is related to other non-government organizations by virtue of its economic interest in these organizations. Related Party Transactions
Transactions with these related parties are in the normal course of operations. Amounts due to or from and the recorded amounts of transactions resulting from these transactions are included in the financial statements and the table below. They are recorded at exchange amounts which approximate prevailing market rates charged by those organizations and are settled on normal trade terms.

…page 22
PRAIRIE VALLEY SCHOOL DIVISION NO. 208 NOTES TO THE FINANCIAL STATEMENTS
As at August 31, 2016
2016 2015
Revenues:
Ministry of Education 54,527,416$ 54,795,192$
Saskatchewan Government Insurance 280,356 480,717
Southeast Regional College 5,362 6,863
54,813,134$ 55,282,772$
Expenses:
Good Spirit School Division 60,563$ 38,587$
Parkland Regional College 35,976 34,177
Regina Qu'Appelle Health Region 18,024 1,052
Regina Roman Catholic Separate School Division No. 81 3,194 5,678
Regina School Division No.4 31,331 57,546
Saskatchewan Government Insurance 185,889 186,180
Saskatchewan Power Corporation 1,251,816 1,077,714
Saskatchewan Telecommunciations Holding Company 1,173,421 763,897
SaskEnergy Incorporated 586,926 721,712
Southeast Regional College 1,500 6,000
Sun West School Division 41,500 33,900
University of Regina 4,809 3,788
Workers' Compensation Board 275,682 265,266
Other 14,237 1,158
3,684,868$ 3,196,655$
Accounts Receivable:
Ministry of Education 330,000$ 234,631$
Saskatchewan Government Insurance 199,717 68,980
Workers' Compensation Board - 105,530
529,717$ 409,141$
Prepaid Expenses:
Workers' Compensation Board 91,912$ 87,617$
91,912$ 87,617$
Accounts Payable and Accrued Liabilities:
Saskatchewan Government Insurance -$ 63$
SaskEnergy Incorporated 16,235 -
Saskatchewan Power Corporation 68,709 -
Saskatchewan Telecommunications Holding Company 40,270 413,029
Sun West School Division - 2,500
125,214$ 415,592$
In addition, the school division pays Provincial Sales Tax to the Saskatchewan Ministry of Finance on all its taxable purchases and customer sales on items that are deemed taxable. Taxes paid are recorded as part of the cost of those purchases.

…page 23
PRAIRIE VALLEY SCHOOL DIVISION NO. 208 NOTES TO THE FINANCIAL STATEMENTS
As at August 31, 2016
Other transactions with related parties and amounts due to/from them are described separately in the financial statements or notes thereto. A portion of the operating grant revenue from the Ministry of Education includes funding allocated to principal and interest repayments on some school board loans.
16. CONTRACTUAL OBLIGATIONS AND COMMITMENTS
Significant contractual obligations and commitments of the school division are as follows:
Copier Leases Total Operating
Future minimum lease payments:2017 32,157$ 32,157$
Total Lease Obligations 32,157$ 32,157$
Operating Leases
17. COMPARATIVE INFORMATION
Certain comparative figures have been reclassified to conform to the current year's presentation.
18. RISK MANAGEMENT The school division is exposed to financial risks from its financial assets and liabilities. These risks include credit risk, liquidity risk and market risk (consisting of interest rate risk and foreign exchange risk). i) Credit Risk
Credit risk is the risk to the school division from potential non-payment of accounts receivable. The credit risk related to the school division's receivables from the provincial government, federal government and their agencies are considered to be minimal. For other receivables, the school division has adopted credit policies which include credit limits applied to customers when set up and the monitoring of accounts that are overdue. The school division does not have a significant exposure to any individual customer. Management reviews accounts receivable on a case by case basis to determine if a valuation allowance is necessary to reflect an impairment in collectability.

…page 24
PRAIRIE VALLEY SCHOOL DIVISION NO. 208 NOTES TO THE FINANCIAL STATEMENTS
As at August 31, 2016
The aging of grants and other accounts receivable at August 31, 2016 was:
Total Current 0-30 days 30-60 days 60-90 days Over 90 days
Grants Receivable 330,000$ 330,000$ -$ -$ -$ -$
Other Receivables 3,039,958 445,623 - 1,047 3,640 2,589,648
Gross Receivables 3,369,958 775,623 - 1,047 3,640 2,589,648
Allowance for Doubtful Accounts - - - - - -
Net Receivables 3,369,958$ 775,623$ -$ 1,047$ 3,640$ 2,589,648$
August 31, 2016
ii) Liquidity Risk Liquidity risk is the risk that the school division will not be able to meet its financial obligations as they come due. The school division manages liquidity risk by projecting cash flow, reviewing budget to actual expenditures, and forecasting. The following table sets out the contractual maturities of the school division’s financial liabilities:
Within 6 months
6 months to 1 year 1 to 5 years > 5 years
Accounts payable and accrued liabilities 5,355,973$ -$ -$ -$
Long-term debt (including interest) 845,124 1,316,420 6,808,198 12,919,539
Total 6,201,097$ 1,316,420$ 6,808,198$ 12,919,539$
August 31, 2016
iii) Market Risk The school division is exposed to market risks with respect to interest rates and foreign currency exchange rates, as follows: Interest Rate Risk: Interest rate risk is the risk that the fair value or future cash flows of a financial instrument will fluctuate because of changes in market interest rates. The school division does not have any interest rate exposure. The school division also has an authorized bank line of credit of $16,000,000 with interest payable monthly at a rate of prime less 0.50 %. Changes in the bank's prime rate can cause fluctuation in interest payments and cash flows. The balance outstanding on this credit facility at August 31, 2016 was $488,664 (2015 - $6,065,646).

…page 25
PRAIRIE VALLEY SCHOOL DIVISION NO. 208 NOTES TO THE FINANCIAL STATEMENTS
As at August 31, 2016
The school division minimizes these risks by:
holding cash in an account at a Canadian bank, denominated in Canadian currency
managing cash flows to minimize utilization of its bank line of credit managing its interest rate risk on long-term debt through the exclusive use
of fixed rate terms for its long-term debt Foreign Currency Risk: Foreign currency risk is the risk that the fair value or future cash flows of a financial instrument will fluctuate because of changes in foreign exchange rates. The school division is exposed to currency risk on purchases denominated in U.S. dollars for which the related accounts payable balances are subject to exchange rate fluctuations; however, this risk is minimal as the school division does not make a significant amount of purchases denominated on a foreign currency.

A-1
2016 2016 2015
Budget Actual Actual
Property Taxation Revenue
Tax Levy Revenue Property Tax Levy Revenue 38,590,560 40,651,471 38,288,950
Total Property Tax Revenue 38,590,560 40,651,471 38,288,950 Grants in Lieu of Taxes
Federal Government - 220,228 265,807 Provincial Government - 541,370 338,639 Railways - 391,490 410,740 Other - 52,623 29,043
Total Grants in Lieu of Taxes - 1,205,711 1,044,229
Other Tax Revenues Treaty Land Entitlement - Rural - 59,191 21,793
House Trailer Fees - 21,186 84,706 Total Other Tax Revenues - 80,377 106,499
Additions to Levy Penalties - 278,786 264,644 Other - 49,008 567,377
Total Additions to Levy - 327,794 832,021
Deletions from Levy Cancellations - (209,748) (78,644)
Other Deletions - (121,707) (311,956) Total Deletions from Levy - (331,455) (390,600)
Total Property Taxation Revenue 38,590,560 41,933,898 39,881,099
Grants
Operating GrantsMinistry of Education Grants
Operating Grant 53,412,830 50,869,685 51,993,003 Other Ministry Grants - 370,021 328,591 Total Ministry Grants 53,412,830 51,239,706 52,321,594
Other Provincial Grants 687,720 411,093 480,717 Grants from Others 55,000 6,361 - Total Operating Grants 54,155,550 51,657,160 52,802,311
Capital GrantsMinistry of Education Capital Grants 1,309,216 2,477,710 1,684,951 Total Capital Grants 1,309,216 2,477,710 1,684,951
Total Grants 55,464,766 54,134,870 54,487,262
Prairie Valley School Division No. 208Schedule A: Supplementary Details of Revenues
for the year ended August 31, 2016

A-2
2016 2016 2015Budget Actual Actual
Tuition and Related Fees Revenue
Operating Fees Tuition Fees
Federal Government and First Nations 5,832,189 5,963,664 5,769,404 Individuals and Other - 86,844 70,875
Total Operating Tuition and Related Fees 5,832,189 6,050,508 5,840,279
Total Tuition and Related Fees Revenue 5,832,189 6,050,508 5,840,279
School Generated Funds Revenue
CurricularStudent Fees 179,705 194,075 197,977 Total Curricular Fees 179,705 194,075 197,977
Non-Curricular Fees Commercial Sales - Non-GST 783,480 903,649 926,428
Fundraising 731,242 952,646 795,791 Grants and Partnerships 149,758 100,385 152,174 Students Fees 197,123 233,596 231,149 Other 441,289 452,577 431,424 Total Non-Curricular Fees 2,302,892 2,642,853 2,536,966
Total School Generated Funds Revenue 2,482,597 2,836,928 2,734,943
Complementary Services
Operating GrantsMinistry of Education Grants
Operating Grant 659,998 660,000 638,647 Total Operating Grants 659,998 660,000 638,647
Total Complementary Services Revenue 659,998 660,000 638,647
Schedule A: Supplementary Details of Revenuesfor the year ended August 31, 2016
Prairie Valley School Division No. 208

A-3
2016 2016 2015Budget Actual Actual
External Services
Operating GrantsMinistry of Education Grants
Other Ministry Grants - 150,000 150,000 Total Operating Grants - 150,000 150,000
Total External Services Revenue - 150,000 150,000
Other Revenue
Miscellaneous Revenue 600,000 760,617 1,417,858 Sales & Rentals 45,000 146,452 127,065 Investments 50,000 15,157 18,816 Total Other Revenue 695,000 922,226 1,563,739
TOTAL REVENUE FOR THE YEAR 103,725,110 106,688,430 105,295,969
for the year ended August 31, 2016
Prairie Valley School Division No. 208Schedule A: Supplementary Details of Revenues

B-1
2016 2016 2015Budget Actual Actual
Governance Expense
Board Members Expense 171,622 318,497 297,615 Professional Development- Board Members 28,940 9,540 32,839 Elections - 430 2,917 Other Governance Expenses 297,115 326,116 296,970
Total Governance Expense 497,677 654,583 630,341
Administration Expense
Salaries 3,292,994 3,192,038 2,887,057 Benefits 495,141 475,045 384,136 Supplies & Services 260,101 311,390 345,939 Non-Capital Furniture & Equipment 80,300 57,683 61,524 Building Operating Expenses 107,845 106,560 70,117 Communications 67,500 59,398 57,007 Travel 31,480 24,870 26,518 Professional Development 71,500 35,828 30,797 Amortization of Tangible Capital Assets 86,023 139,972 100,895
Total Administration Expense 4,492,884 4,402,784 3,963,990
Instruction Expense
Instructional (Teacher Contract) Salaries 48,131,817 48,849,063 48,824,423 Instructional (Teacher Contract) Benefits 2,448,486 2,501,654 2,549,061 Program Support (Non-Teacher Contract) Salaries 10,840,645 10,522,502 10,512,496 Program Support (Non-Teacher Contract) Benefits 2,264,175 2,204,975 2,212,421 Instructional Aids 1,439,076 1,198,172 1,589,424 Supplies & Services 1,440,886 1,152,427 1,252,151 Non-Capital Furniture & Equipment 485,688 465,333 400,470 Communications 209,286 208,583 220,353 Travel 394,690 366,933 380,861 Professional Development 608,767 508,026 471,959 Student Related Expense 638,065 492,944 494,263 Amortization of Tangible Capital Assets 2,128,198 2,659,486 1,925,237
Total Instruction Expense 71,029,779 71,130,098 70,833,119
Prairie Valley School Division No. 208Schedule B: Supplementary Details of Expenses
for the year ended August 31, 2016

B-2
2016 2016 2015Budget Actual Actual
Plant Operation & Maintenance Expense
Salaries 3,234,116 3,388,791 3,225,050 Benefits 690,246 707,309 702,622 Supplies & Services 4,382 21,410 30,530 Non-Capital Furniture & Equipment 15,000 16,538 29,610 Building Operating Expenses 4,941,694 5,155,997 4,983,791 Communications 5,903 6,737 6,211 Travel 100,425 103,330 106,381 Professional Development 8,000 6,866 5,299 Amortization of Tangible Capital Assets 2,782,676 3,257,406 3,086,228
Total Plant Operation & Maintenance Expense 11,782,442 12,664,384 12,175,722
Student Transportation Expense
Salaries 4,382,007 4,161,437 4,200,025 Benefits 932,463 897,910 908,898 Supplies & Services 1,988,512 1,441,875 1,849,173 Non-Capital Furniture & Equipment 506,900 552,771 639,186 Building Operating Expenses 24,301 27,609 24,552 Communications 66,725 73,419 65,674 Travel 34,329 37,197 37,958 Professional Development 6,500 4,535 6,769 Contracted Transportation 347,025 565,719 525,734 Amortization of Tangible Capital Assets 1,227,036 1,428,260 1,324,916
Total Student Transportation Expense 9,515,798 9,190,732 9,582,885
Tuition and Related Fees Expense
Tuition Fees 62,000 65,417 106,580
Total Tuition and Related Fees Expense 62,000 65,417 106,580
School Generated Funds Expense
Academic Supplies & Services 211,151 174,678 154,281 Cost of Sales 674,062 714,300 748,739 Non-Capital Furniture & Equipment 32,395 31,738 21,069 School Fund Expenses 1,534,849 1,872,546 1,765,544
Total School Generated Funds Expense 2,452,457 2,793,262 2,689,633
Schedule B: Supplementary Details of Expensesfor the year ended August 31, 2016
Prairie Valley School Division No. 208

B-3
2016 2016 2015Budget Actual Actual
Complementary Services Expense
Tuition Fees 26,000 27,890 34,073 Instructional (Teacher Contract) Salaries & Benefits 421,535 396,291 432,021 Program Support (Non-Teacher Contract) Salaries & Benefits 1,974,538 1,901,787 1,874,866 Instructional Aids 47,960 40,628 48,761 Supplies & Services 19,740 3,624 9,351 Communications - 2,824 3,959 Travel 42,750 39,782 44,405 Professional Development (Non-Salary Costs) - 2,554 4,099 Student Related Expenses 65,770 110,933 137,740
Total Complementary Services Expense 2,598,293 2,526,313 2,589,275
External Service Expense
Grant Transfers - 150,000 150,000
Total External Services Expense - 150,000 150,000
Other Expense
Interest and Bank ChargesCurrent Interest and Bank Charges 31,900 77,302 102,695 Interest on Debentures 252,828 249,828 264,969 Interest on Capital Loans 455,667 400,943 507,992 Total Interest and Bank Charges 740,395 728,073 875,656
Total Other Expense 740,395 728,073 875,656
TOTAL EXPENSES FOR THE YEAR 103,171,725 104,305,646 103,597,201
Schedule B: Supplementary Details of ExpensesPrairie Valley School Division No. 208
for the year ended August 31, 2016

Prairie Valley School Division No. 208Schedule C - Supplementary Details of Tangible Capital Assetsfor the year ended August 31, 2016
Furniture ComputerLand Buildings School Other and Hardware and Assets
Land Improvements Buildings Short-Term Buses Vehicles EquipmentAudio Visual Equipment
Under Construction 2016 2015
Tangible Capital Assets - at Cost
Opening Balance as of September 1 3,046,843 3,369,751 154,116,620 443,810 14,272,534 731,259 10,144,891 8,814,795 - 194,940,503 193,535,777
Additions/Purchases - 246,283 639,392 - 1,658,993 329,804 1,323,790 2,037,621 245,836 6,481,719 6,332,894 Disposals - (36,254) (1,245,793) (199,704) (446,378) (406,633) (179,888) (134,345) - (2,648,995) (4,928,168)
Closing Balance as of August 31 3,046,843 3,579,780 153,510,219 244,106 15,485,149 654,430 11,288,793 10,718,071 245,836 198,773,227 194,940,503
Tangible Capital Assets - Amortization
Opening Balance as of September 1 - 1,636,422 54,204,823 371,541 7,394,521 643,487 3,879,530 4,684,392 - 72,814,716 71,305,608
Amortization of the Period - 163,011 3,070,204 24,191 1,297,374 130,886 1,128,879 1,670,579 - 7,485,124 6,437,276 Disposals - (36,254) (1,245,793) (199,704) (446,378) (406,633) (179,888) (134,345) - (2,648,995) (4,928,168)
Closing Balance as of August 31 N/A 1,763,179 56,029,234 196,028 8,245,517 367,740 4,828,521 6,220,626 N/A 77,650,845 72,814,716
Net Book ValueOpening Balance as of September 1 3,046,843 1,733,329 99,911,797 72,269 6,878,013 87,772 6,265,361 4,130,403 - 122,125,787 122,230,169 Closing Balance as of August 31 3,046,843 1,816,601 97,480,985 48,078 7,239,632 286,690 6,460,272 4,497,445 245,836 121,122,382 122,125,787
Change in Net Book Value - 83,272 (2,430,812) (24,191) 361,619 198,918 194,911 367,042 245,836 (1,003,405) (104,382)
DisposalsHistorical Cost - 36,254 1,245,793 199,704 446,378 406,633 179,888 134,345 - 2,648,995 4,928,168 Accumulated Amortization - 36,254 1,245,793 199,704 446,378 406,633 179,888 134,345 - 2,648,995 4,928,168 Net Cost - - - - - - - - - - - Price of Sale - - - - - - - - - - - Gain (Loss) on Disposal - - - - - - - - - - -
Sch
C

2016 2015
Non-Cash Items Included in SurplusAmortization of Tangible Capital Assets (Schedule C) 7,485,124 6,437,276
Total Non-Cash Items Included in Surplus 7,485,124 6,437,276
2016 2015
Net Change in Non-Cash Operating ActivitiesDecrease in Accounts Receivable 1,569,019 2,973,022 Increase (Decrease) in Accounts Payable and Accrued Liabilities 1,224,635 (4,156,358) Increase in Liability for Employee Future Benefits 107,700 73,400 Increase in Deferred Revenue 696,745 252,809 (Increase) Decrease in Inventory of Supplies for Consumption (62,340) 5,224 Decrease (Increase) in Prepaid Expenses 124,032 (139,670)
Total Net Change in Non-Cash Operating Activities 3,659,791 (991,573)
Schedule E: Net Change in Non-Cash Operating Activitiesfor the year ended August 31, 2016
Prairie Valley School Division No. 208Schedule D: Non-Cash Items Included in Surplus
for the year ended August 31, 2016
Prairie Valley School Division No. 208