PPEP: Online Performance, Power, and Energy Prediction Framework · PDF file ·...
13
PPEP: Online Performance, Power, and Energy Prediction Framework and DVFS Space Exploration Bo Su * , Junli Gu † , Li Shen * , Wei Huang † , Joseph L. Greathouse † , Zhiying Wang * * State Key Laboratory of High Performance Computing National University of Defense Technology {subo, lishen, zywang}@nudt.edu.cn † AMD Research Advanced Micro Devices, Inc. {Junli.Gu, WeiN.Huang, Joseph.Greathouse}@amd.com Abstract— Performance, power, and energy (PPE) are criti- cal aspects of modern computing. It is challenging to accurately predict, in real time, the effect of dynamic voltage and frequency scaling (DVFS) on PPE across a wide range of voltages and frequencies. This results in the use of reactive, iterative, and inefficient algorithms for dynamically finding good DVFS states. We propose PPEP, an online PPE prediction framework that proactively and rapidly searches the DVFS space. PPEP uses hardware events to implement both a cycles- per-instruction (CPI) model as well as a per-core power model in order to predict PPE across all DVFS states. We verify on modern AMD CPUs that the PPEP power model achieves an average error of 4.6% (2.8% standard deviation) on 152 benchmark combinations at 5 distinct voltage- frequency states. Predicting average chip power across different DVFS states achieves an average error of 4.2% with a 3.6% standard deviation. Further, we demonstrate the usage of PPEP by creating and evaluating a highly responsive power capping mechanism that can meet power targets in a single step. PPEP also provides insights for future development of DVFS technologies. For example, we find that it is important to carefully consider background workloads for DVFS policies and that enabling north bridge DVFS can offer up to 20% additional energy saving or a 1.4× performance improvement. I. I NTRODUCTION Performance, power, and energy (PPE) are primary opti- mization targets in modern computers. For battery-powered systems such as tablets and phones, energy usage directly impacts usability, and power that is dissipated as heat must be removed without bulky heat sinks. Desktops and laptops have limited thermal headroom to share between integrated devices, often necessitating intelligent ways of balancing power usage [23]. Warehouse-scale systems must deal with varying electricity costs and power substation limitations [10]. CPUs are still the dominant component in these calculations, because they often dictate system performance and consume a majority of the total system power [2]. Dynamic voltage and frequency scaling (DVFS) is a widely used technique to optimize system energy efficiency [27], maintain power caps [5, 14, 18, 20, 21], and share power with other system components [23]. All of these involve peri- odically monitoring dynamic system behavior and adjusting the voltage and frequency (VF) state to meet specific power management targets. Simple algorithms for controlling DVFS observe how the system is behaving during a time slice and will change VF states in reaction to these measurements. If the power goal is not met after this change, they will try a new VF state in the next time slice, iteratively approaching the goal. This mechanism is commonly used by commercial CPUs, but it can be inefficient, as a great deal of time may be wasted searching for the best solution. Compared to such reactive algorithms, a predictive ap- proach can be more efficient. For example, if an application is memory bound, a predictive algorithm may lower the CPU VF state just enough to achieve power savings without impacting performance. This requires good performance and power predictions in order to make the right decision in a single step. Unfortunately, existing predictors have limitations. It can be difficult to accurately predict performance across frequencies due to interactions with devices (such as DRAM) in other clock domains. There have been many proposed hardware additions that enable such estimates [8, 17, 22, 25], but they are generally unavailable in commercial processors. We recently described a method for accurately estimating one of these mechanisms, leading load counters, using existing performance monitoring hardware [28], though we did not demonstrate it in a proactive DVFS manager. More problematically, it is difficult to estimate power at the current VF state and to predict power usage at other VF states [20]. Off-chip power monitors may measure the whole chip, making it difficult to separate the effects of individual cores. While core-event-based estimation has been shown in simulation [24], demonstrations on real hardware have been less accurate [27]. This leads to a need for specialized hardware [13], per-application offline profiling [14], or external power monitors [20] in order to know a core’s current power usage. Previous work on estimating power at other VF states has used simple models that do not take into account workload variation, such as assuming a direct relationship between total power usage and either frequency [29, 14] or the number of executed instructions [27]. This paper introduces PPEP, an online PPE prediction framework that uses execution statistics gathered on real processors to estimate PPE at the current VF state and predict
Transcript of PPEP: Online Performance, Power, and Energy Prediction Framework · PDF file ·...

PPEP: Online Performance, Power, and Energy Prediction Frameworkand DVFS Space Exploration
Bo Su∗, Junli Gu†, Li Shen∗, Wei Huang†, Joseph L. Greathouse†, Zhiying Wang∗
∗State Key Laboratory of High Performance ComputingNational University of Defense Technology{subo, lishen, zywang}@nudt.edu.cn
†AMD ResearchAdvanced Micro Devices, Inc.
{Junli.Gu, WeiN.Huang, Joseph.Greathouse}@amd.com
Abstract— Performance, power, and energy (PPE) are criti-cal aspects of modern computing. It is challenging to accuratelypredict, in real time, the effect of dynamic voltage andfrequency scaling (DVFS) on PPE across a wide range ofvoltages and frequencies. This results in the use of reactive,iterative, and inefficient algorithms for dynamically findinggood DVFS states. We propose PPEP, an online PPE predictionframework that proactively and rapidly searches the DVFSspace. PPEP uses hardware events to implement both a cycles-per-instruction (CPI) model as well as a per-core power modelin order to predict PPE across all DVFS states.
We verify on modern AMD CPUs that the PPEP powermodel achieves an average error of 4.6% (2.8% standarddeviation) on 152 benchmark combinations at 5 distinct voltage-frequency states. Predicting average chip power across differentDVFS states achieves an average error of 4.2% with a 3.6%standard deviation. Further, we demonstrate the usage ofPPEP by creating and evaluating a highly responsive powercapping mechanism that can meet power targets in a singlestep. PPEP also provides insights for future development ofDVFS technologies. For example, we find that it is importantto carefully consider background workloads for DVFS policiesand that enabling north bridge DVFS can offer up to 20%additional energy saving or a 1.4× performance improvement.
I. INTRODUCTION
Performance, power, and energy (PPE) are primary opti-mization targets in modern computers. For battery-poweredsystems such as tablets and phones, energy usage directlyimpacts usability, and power that is dissipated as heat mustbe removed without bulky heat sinks. Desktops and laptopshave limited thermal headroom to share between integrateddevices, often necessitating intelligent ways of balancingpower usage [23]. Warehouse-scale systems must deal withvarying electricity costs and power substation limitations [10].CPUs are still the dominant component in these calculations,because they often dictate system performance and consumea majority of the total system power [2].
Dynamic voltage and frequency scaling (DVFS) is a widelyused technique to optimize system energy efficiency [27],maintain power caps [5, 14, 18, 20, 21], and share powerwith other system components [23]. All of these involve peri-odically monitoring dynamic system behavior and adjustingthe voltage and frequency (VF) state to meet specific powermanagement targets.
Simple algorithms for controlling DVFS observe how thesystem is behaving during a time slice and will change VFstates in reaction to these measurements. If the power goalis not met after this change, they will try a new VF statein the next time slice, iteratively approaching the goal. Thismechanism is commonly used by commercial CPUs, but itcan be inefficient, as a great deal of time may be wastedsearching for the best solution.
Compared to such reactive algorithms, a predictive ap-proach can be more efficient. For example, if an application ismemory bound, a predictive algorithm may lower the CPU VFstate just enough to achieve power savings without impactingperformance. This requires good performance and powerpredictions in order to make the right decision in a singlestep. Unfortunately, existing predictors have limitations.
It can be difficult to accurately predict performance acrossfrequencies due to interactions with devices (such as DRAM)in other clock domains. There have been many proposedhardware additions that enable such estimates [8, 17, 22, 25],but they are generally unavailable in commercial processors.We recently described a method for accurately estimating oneof these mechanisms, leading load counters, using existingperformance monitoring hardware [28], though we did notdemonstrate it in a proactive DVFS manager.
More problematically, it is difficult to estimate power atthe current VF state and to predict power usage at other VFstates [20]. Off-chip power monitors may measure the wholechip, making it difficult to separate the effects of individualcores. While core-event-based estimation has been shownin simulation [24], demonstrations on real hardware havebeen less accurate [27]. This leads to a need for specializedhardware [13], per-application offline profiling [14], orexternal power monitors [20] in order to know a core’s currentpower usage. Previous work on estimating power at other VFstates has used simple models that do not take into accountworkload variation, such as assuming a direct relationshipbetween total power usage and either frequency [29, 14] orthe number of executed instructions [27].
This paper introduces PPEP, an online PPE predictionframework that uses execution statistics gathered on realprocessors to estimate PPE at the current VF state and predict
PPE at all other states. PPEP is a software-level tool that doesnot require per-application offline training, external powermonitors, or new hardware. PPEP periodically reads hardwareperformance counters from the CPU cores, allowing it toquickly adjust to program phase changes. It also modelsthe power of components outside the core such as the northbridge (NB). It then predicts how the program would run atdifferent VF states, allowing accurate PPE decisions to bemade in a single step. While we focus our study on the CPUin order to better characterize our prediction mechanism,PPEP could also be included in system-level models, suchas CoScale [6], as a more accurate CPU estimator.
This paper makes the following contributions:• We develop an online PPE prediction model, PPEP,
which uses hardware performance events and on-chiptemperature measurements to achieve an average chippower estimation error of 4.6% versus a commercialAMD CPU. When used to predict full-chip averagepower across vastly different VF states, PPEP shows anaverage error of 4.2%.
• We demonstrate that a predictive DVFS controller canuse PPEP to explore the energy-delay space and pickenergy- and EDP-optimal points with high accuracy.
• We show a power capping mechanism built with PPEPthat operates 14× faster than a common reactive model.
• We use PPEP to explore future DVFS designs andestimate that an NB with multiple VF states couldachieve up to 20.4% additional power saving or 1.37×higher performance.
This paper is organized as follows. Section II describesthe hardware and benchmarks that were used in this study.Section III describes our cycles-per-instruction (CPI) pre-dictor, and Section IV details our model of per-core powerconsumption that works across VF states. Section V usesthese models to explore the ED space of programs andprovides insights for future DVFS technology. Section VI isthe related work, and the paper concludes with Section VII.
II. EXPERIMENTAL METHODOLOGY
We use real-time hardware measurements to derive ourperformance and power prediction models. To measure CPUpower data, we use a Pololu ACS711 Hall effect currentsensor clamped onto the +12V ATX power line of the CPU,between the power supply and the voltage regulator on themotherboard. An Arduino board with an AVR microcontrolleris used to sample the output of the sensor, generate the powerreadings and send them to the processor via a USB-basedserial port. This setup is similar to those used in previouswork [4, 7]. We take a power reading through this setupevery 20ms and record these to a power trace. We use 10power readings for every DVFS decision interval, makingeach interval 200ms.
The systems under test ran Ubuntu 12.04 LTS using kernelversion 3.2.0-24. For temperature measurements, we use the
socket thermal diode readings accessible through the hwmontree in sysfs. When gathering online performance statistics,we use taskset to affinitize benchmarks to particular coresand msr-tools to set and read performance counters.
Our main experimental platform is an 8-core AMDFX-8320 processor running on an ASUS M5A97 R2.0motherboard with two 4GB DDR3 DRAM DIMMs. TheAMD FX-8320 processor has four compute units (CU), eachcontaining two CPU cores and 2MB of shared L2 cache.All of these cores share an NB that includes the memorycontroller and 8MB of L3 cache. Each CU supports fivesoftware-visible VF states. The five VF states of our processorare VF5 (1.320V, 3.5GHz), VF4 (1.242V, 2.9GHz), VF3(1.128V, 2.3GHz), VF2 (1.008V, 1.7GHz), and VF1 (0.888V,1.4GHz). The cores also have two hardware-controlled booststates that are enabled only in VF5. We disabled these becausethey are not software controllable; unexpectedly entering aboost state would affect the power and event counts that wemeasure. Our PPEP technique could be used by hardwareor firmware boost controllers, but we disable boosting tomaintain control of our experiments.
The AMD FX-8320 processor can also perform per-CUpower gating (PG). We first build a power model when PG isdisabled in the BIOS (Section IV-A to IV-C). After that, weanalyze the power difference when PG is enabled (SectionIV-D) and derive a new power model.
We also verify the accuracy of our model on an AMDPhenom™ II X6 1090T processor, which supports four VFstates but does not support power gating. The results of ourstudy of the AMD FX-8320 are shown in the figures, whilethe results from the AMD Phenom II processor are describedonly in the text due to space constraints.
We test our models on 3 benchmark suites, which wecombine to make 152 benchmark combinations: SPEC®CPU 2006 v1.2 [12], PARSEC v2.1 [3], and the NAS ParallelBenchmarks (NPB) v3.3.1 [1]. We consider multi-threadedruns for PARSEC and NPB, and multi-programmed runs forSPEC CPU2006. We split our benchmarks into four equalsets and test our models using cross validation.
III. PERFORMANCE PREDICTION MODEL
The first step in the process of building a power andenergy manager is to build an accurate performance predictionmodel. To achieve this, we implement a mechanism thatcan predict the cycles-per-instruction (CPI) at one VFstate from measurements taken at another VF state. Werecently described an approximation of a leading loadspredictor [8, 17, 25] that is built using miss address buffer(MAB, commonly known as a miss status handling register)occupancy information on AMD CPUs. We build on thisLL-MAB performance predictor in this work [28].
Leading loads performance predictors split the executionof a program into core time, which scales as frequencychanges, and memory time, which stays constant. A leading

load is the first demand miss to leave a core’s clock domainwhenever no other leading load from that core exists. This,in effect, avoids measuring the latency of loads caused bymemory-level parallelism (MLP) while still taking cacheeffects and variable latencies into account. Miftakhutdinovet al. demonstrated that this model is not ideal (especiallywhen bandwidth is constrained) [22], but this model has thebenefit of existing in contemporary hardware. In AMD CPUs,performance monitors can measure the amount of time thatan off-core memory access is in the highest priority MAB,which is a good approximation of a leading load.
We previously demonstrated that this yields accurateperformance predictions when estimating the whole-programexecution time of single-threaded applications. In this work,we improve upon the existing LL-MAB model by extendingit to build an online CPI predictor which operates on periodicexecution intervals. We divide CPI into core CPI (CCPI) andmemory CPI (MCPI). CCPI stays the same across VF stateswhile MCPI scales proportionally with frequency. In eachprediction interval, we gather the CPI and MCPI in orderto calculate CCPI. This requires three performance countersto implement. CPI is calculated by CPU Clocks not Halteddivided by Retired Instructions. Similar to our LL-MABmodel, MCPI is calculated by MAB Wait Cycles divided byRetired Instructions. Thus, when running at frequency f, onecan predict the CPI at frequency f ’ as shown in Equation 1.
CPI(f ′) = CCPI(f) +MCPI(f)× f ′
f(1)
Because this model predicts periodic CPI rather thanwhole-program execution time (which our previous workdemonstrated), we tested its prediction accuracy on single-threaded versions of the 52 benchmarks from our threetest suites. We measured the above-mentioned performancecounters every 200ms at both VF5 and VF2. A simplecomparison of the predicted and measured CPI values fromeach sample would not properly test the model, as theexecution time of the program is different at the two differentfrequencies.
Instead, after gathering the performance counter traces,we divide them into segments based on the number ofinstructions completed. We then sum the number of cycleswe predicted that segment to take (based on the performancecounters in the other trace) and compare to the number ofcycles that segment actually took. The difference betweenthese two is the prediction error.
Our LL-MAB CPI predictor had an average error of 3.4%when predicting from VF5 down to VF2 and 3.0% whenpredicting from VF2 up to VF5. The standard deviationswere 4.6% and 3.2% respectively. These values are similarto those measured in our previous work, so we believe thisto be a good CPI predictor.
300
305
310
315
320
325
330
335
340
00.10.20.30.40.50.60.70.80.9
11.1
1 201 401 601 801 1001 1201 1401
Tem
pera
ture
(K)
Nor
mal
ized
Chi
p Po
wer
Step (200ms)
Power (Sampled Point)
Power (Curve)
Temperature
Heating Cooling
Figure 1 Idle power and temperature at VF5 as the workloadchanges on an AMD FX-8320.
IV. PER-CORE POWER PREDICTION MODEL
In this section, we present a temperature-aware per-coreidle power model and a dynamic power model based onperformance monitor counters (PMCs). These can provideper-core online power estimates without requiring applicationprofiling beforehand. Through measurements and microar-chitectural analysis, we derive a method for scaling dynamicpower based on hardware event counts taken at various VFstates. In addition, we extend our power estimation modelto predict power consumption at other VF states.
A. Chip Idle Power Model
We define chip idle power to include both static leakagepower and active (not power gated) idle dynamic powerwhen only OS housekeeping threads are running. We use anexperiment, shown in Figure 1, to examine the relationshipbetween idle power, VF states, and temperature. First, werun heavy workloads to heat up the processor until it reachesa steady-state temperature. We then stop the work. The chipremains active (not power gated) but idle at the VF state ofour choice while it cools. During the cooling process, powerand temperature traces are collected. These include leakagepower as a function of temperature and a constant dynamicpower, due to OS housekeeping threads, that exists wheneverthe chip is idle but not power-gated.
Theoretically, the relationship between leakage power andtemperature should be exponential. However, we observedthat, when the variation ranges of power and temperatureare small, the relationship of idle power and temperature isclose to linear. A linear relationship significantly simplifiesthe model training process and is a reasonable approach ifwe are mostly interested in temperatures within the normaloperating range of our processor. Similar linear relationshipshave been previously observed [19].
We use this data to build a regression model for thechip idle power based on temperature and voltage, asshown in Equation 2. T is the temperature in kelvin, andboth Widle1(V ) and Widle0(V ) are third-order polynomial
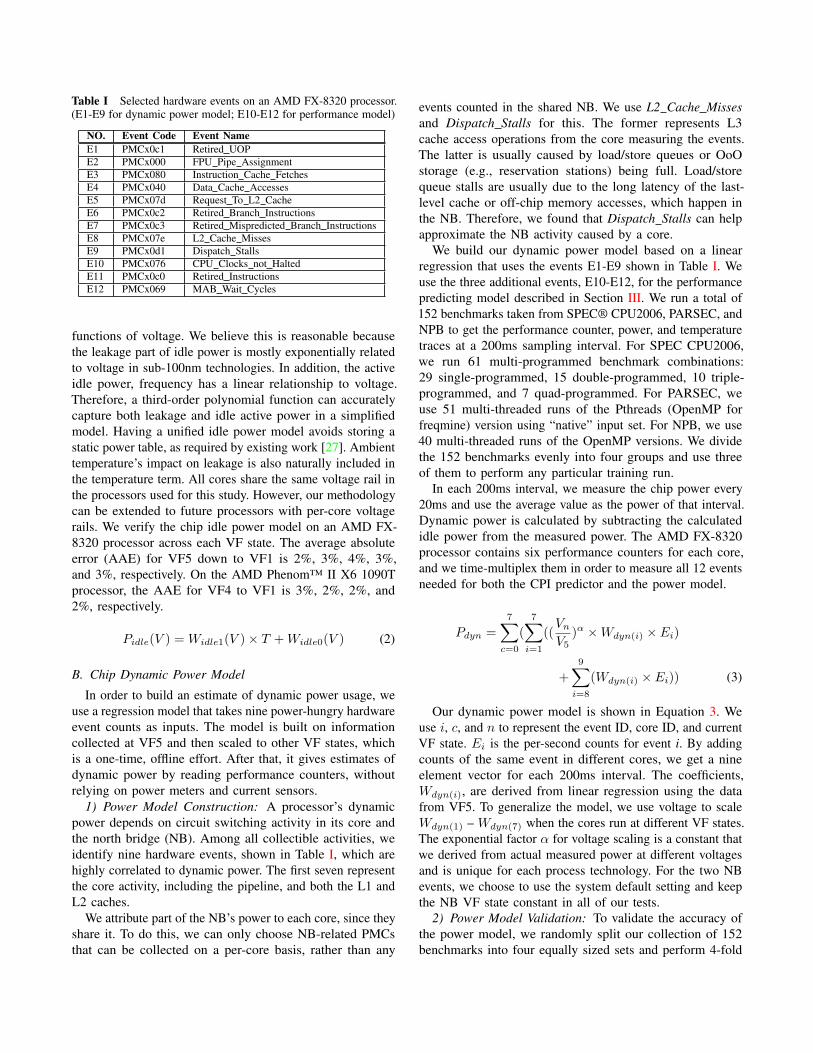
Table I Selected hardware events on an AMD FX-8320 processor.(E1-E9 for dynamic power model; E10-E12 for performance model)
NO. Event Code Event NameE1 PMCx0c1 Retired UOPE2 PMCx000 FPU Pipe AssignmentE3 PMCx080 Instruction Cache FetchesE4 PMCx040 Data Cache AccessesE5 PMCx07d Request To L2 CacheE6 PMCx0c2 Retired Branch InstructionsE7 PMCx0c3 Retired Mispredicted Branch InstructionsE8 PMCx07e L2 Cache MissesE9 PMCx0d1 Dispatch StallsE10 PMCx076 CPU Clocks not HaltedE11 PMCx0c0 Retired InstructionsE12 PMCx069 MAB Wait Cycles
functions of voltage. We believe this is reasonable becausethe leakage part of idle power is mostly exponentially relatedto voltage in sub-100nm technologies. In addition, the activeidle power, frequency has a linear relationship to voltage.Therefore, a third-order polynomial function can accuratelycapture both leakage and idle active power in a simplifiedmodel. Having a unified idle power model avoids storing astatic power table, as required by existing work [27]. Ambienttemperature’s impact on leakage is also naturally included inthe temperature term. All cores share the same voltage rail inthe processors used for this study. However, our methodologycan be extended to future processors with per-core voltagerails. We verify the chip idle power model on an AMD FX-8320 processor across each VF state. The average absoluteerror (AAE) for VF5 down to VF1 is 2%, 3%, 4%, 3%,and 3%, respectively. On the AMD Phenom™ II X6 1090Tprocessor, the AAE for VF4 to VF1 is 3%, 2%, 2%, and2%, respectively.
Pidle(V ) =Widle1(V )× T +Widle0(V ) (2)
B. Chip Dynamic Power Model
In order to build an estimate of dynamic power usage, weuse a regression model that takes nine power-hungry hardwareevent counts as inputs. The model is built on informationcollected at VF5 and then scaled to other VF states, whichis a one-time, offline effort. After that, it gives estimates ofdynamic power by reading performance counters, withoutrelying on power meters and current sensors.
1) Power Model Construction: A processor’s dynamicpower depends on circuit switching activity in its core andthe north bridge (NB). Among all collectible activities, weidentify nine hardware events, shown in Table I, which arehighly correlated to dynamic power. The first seven representthe core activity, including the pipeline, and both the L1 andL2 caches.
We attribute part of the NB’s power to each core, since theyshare it. To do this, we can only choose NB-related PMCsthat can be collected on a per-core basis, rather than any
events counted in the shared NB. We use L2 Cache Missesand Dispatch Stalls for this. The former represents L3cache access operations from the core measuring the events.The latter is usually caused by load/store queues or OoOstorage (e.g., reservation stations) being full. Load/storequeue stalls are usually due to the long latency of the last-level cache or off-chip memory accesses, which happen inthe NB. Therefore, we found that Dispatch Stalls can helpapproximate the NB activity caused by a core.
We build our dynamic power model based on a linearregression that uses the events E1-E9 shown in Table I. Weuse the three additional events, E10-E12, for the performancepredicting model described in Section III. We run a total of152 benchmarks taken from SPEC® CPU2006, PARSEC, andNPB to get the performance counter, power, and temperaturetraces at a 200ms sampling interval. For SPEC CPU2006,we run 61 multi-programmed benchmark combinations:29 single-programmed, 15 double-programmed, 10 triple-programmed, and 7 quad-programmed. For PARSEC, weuse 51 multi-threaded runs of the Pthreads (OpenMP forfreqmine) version using “native” input set. For NPB, we use40 multi-threaded runs of the OpenMP versions. We dividethe 152 benchmarks evenly into four groups and use threeof them to perform any particular training run.
In each 200ms interval, we measure the chip power every20ms and use the average value as the power of that interval.Dynamic power is calculated by subtracting the calculatedidle power from the measured power. The AMD FX-8320processor contains six performance counters for each core,and we time-multiplex them in order to measure all 12 eventsneeded for both the CPI predictor and the power model.
Pdyn =
7∑c=0
(
7∑i=1
((VnV5
)α ×Wdyn(i) × Ei)
+
9∑i=8
(Wdyn(i) × Ei)) (3)
Our dynamic power model is shown in Equation 3. Weuse i, c, and n to represent the event ID, core ID, and currentVF state. Ei is the per-second counts for event i. By addingcounts of the same event in different cores, we get a nineelement vector for each 200ms interval. The coefficients,Wdyn(i), are derived from linear regression using the datafrom VF5. To generalize the model, we use voltage to scaleWdyn(1) – Wdyn(7) when the cores run at different VF states.The exponential factor α for voltage scaling is a constant thatwe derived from actual measured power at different voltagesand is unique for each process technology. For the two NBevents, we choose to use the system default setting and keepthe NB VF state constant in all of our tests.
2) Power Model Validation: To validate the accuracy ofthe power model, we randomly split our collection of 152benchmarks into four equally sized sets and perform 4-fold

0%
2%
4%
6%
8%
10%
12%
14%
16%
18%
SPEPA
RN
PBA
LL
SPEPA
RN
PBA
LL
SPEPA
RN
PBA
LL
SPEPA
RN
PBA
LL
SPEPA
RN
PBA
LL
Valid
atio
n E
rror
of D
ynam
ic P
ower
Mod
el Average Standard Deviation
VF5 VF4 VF3 VF2 VF1
Average Value = 10.6%
(a) Validation error of the dynamic power model.
0%
1%
2%
3%
4%
5%
6%
7%
8%
SPEPA
RN
PBA
LL
SPEPA
RN
PBA
LL
SPEPA
RN
PBA
LL
SPEPA
RN
PBA
LL
SPEPA
RN
PBA
LL
Valid
atio
n E
rror
of C
hip
Pow
er M
odel Average Standard Deviation
VF5 VF4 VF3 VF2 VF1
Average Value = 4.6%
(b) Validation error of the chip power model.
Figure 2 Validation error of the dynamic power model (a) and the chip power model (b) at each VF state. The bars are the averages ofAAEs. The crosses are the standard deviations of AAEs.
cross validation. This method uses all combinations of threesets for training and tests the accuracy of our model on theremaining set for all of the training collections. This ensuresthat we test against all of our benchmarks without testing onour training data at any point. We measure the absolute errorof the estimated (versus measured) power at each interval fora given benchmark and VF state. We then gather the AAEacross all 200ms samples.
Figure 2(a) shows the error of the dynamic power modelon our AMD FX-8320. Due to space limitations, we onlypresent results at the granularity of each benchmark suite.The error information includes the average value of the AAEsas well as the standard deviation of each benchmark suite.
The AAE of the dynamic power estimates for all bench-mark combinations at all VF states is 10.6%. The AAEsacross VF5 to VF1 are 8.9%, 8.4%, 9.5%, 12.0%, and 14.4%,respectively. VF1 shows larger errors because: (1) lower VFstates have relatively smaller absolute power values, andhence the larger percentage error; and (2) the coefficients arederived at VF5, so the further VF states show a relativelyhigher error. We also see that the average standard deviation(SD), as shown by the cross, is 5.8% over all suites. We dosee a few outliers, with a maximum error up to 49%. Thishappens in DC and IS from NPB, and dedup from PARSEC.Possible sources of error are: (1) these benchmarks haverapid phase changes, which may cause errors because of ourperformance counter multiplexing; and (2) dedup and IS havemuch shorter execution times than the other benchmarks andmay be poorly represented by the training data.
Combining the idle and dynamic power models yields thefull-chip power model. Figure 2(b) shows the accuracy of thismodel. For all benchmark combinations at all VF states, itachieves a 4.6% average AAE with an average SD of 2.8%.
We also validate the model on our AMD Phenom IIprocessor using PARSEC and NPB from VF4 to VF2. Thedynamic power estimates over these points have an average
AAE of 8.2%, 7.3%, and 7.1%, respectively, while the full-chip model has average AAE of 3.6%, 3.1%, and 2.6%.
C. Predicting Power across VF States
The above model works by gathering performance countersat the VF state to be estimated. It would be helpful topredict power at other VF states during runtime withoutactually switching to that state and gathering performancecounters. Unfortunately, simple linear scaling of power basedon frequency and voltage does not take into account thepossible change in workload characteristics. For example, aworkload can become memory bound at higher frequencies,meaning some counters will scale in non-linear ways.
1) Hardware Event Prediction: The key challenge inmaking this estimate is predicting the hardware event countsat other frequencies. Through experimentation, we madetwo observations. Combining them with our performanceprediction model, we are able to predict hardware eventcounts, and hence power consumption, at different VF states.• Observation 1: At any given point in the execution
of a program, core-private hardware event counts perinstruction are independent of VF state.
Observation 1 indicates that the activity of a core’s privateresources incurred per instruction only depends on the coremicroarchitecture and the application’s behavior. This islike the fingerprint of the microarchitecture and application.The core’s private resources include the pipeline, the L1caches and accesses to the L2 cache. Our experiments showthat the first eight hardware events for the dynamic powermodel happen in these core’s private resources and all followObservation 1 very well. We use the same configuration andbenchmarks we used in Section III to verify this observation.For E1 to E8, the difference between VF5 and VF2 on anAMD FX-8320 processor is 0.6%, 0.9%, 0.7%, 5.0%, 0.7%,1.3%, and 4.0%, respectively. We observe similar results onthe AMD Phenom II processor.

• Observation 2: At any given point in the execution of aprogram, (CPI - Dispatch Stalls per inst) is indepen-dent of VF state.
Observation 2 indicates that the dynamic gap between CPIand Dispatch Stalls per inst changes along with programphase, but stays the same across all VF states at any givenpoint in the execution of a program. We use the sameconfigurations and benchmarks that we used in Section IIIto verify this observation. The difference in the gap acrossVF5 and VF2 on an AMD FX-8320 processor is 1.7%. Weobserve similar results on the AMD Phenom™ II processor.This observation is critical for predicting power across VFstates. At any particular point in a program, we can use thepredicted CPI from our performance prediction model topredict Dispatch Stalls per inst using simple arithmetic.
This phenomenon can be explained as follows. We candivide a core’s unhalted clock cycles into two parts: retiringcycles and bubble cycles.
Retiring cycles are cycles with architectural states commit-ments from instructions. On an ideal pipeline, the number isequal to the commit width, which would be roughly equalto the issue width in a balanced design. Applications donot always retire Issue Width instructions in every retirecycle, but interval analysis uses this simplified assumptionand shows good analytical modeling results [9]. We thereforeestimate that a retire cycle is a cycle with Issue Widthinstructions retiring. We later discuss how this could begeneralized.
Bubble cycles are those cycles where no instructionsretire. These can further be divided into stall cycles anddiscarded cycles. Stall cycles are cycles where the coreis stalled waiting for data from the memory hierarchy ordue to pipeline resource limitations such as reorder bufferoccupancy. Discarded cycles are those where no usefulwork is accomplished due to pipeline flush events such asbranch mispredictions and interrupts. Equation 4 shows therelationship between unhalted, retiring, stall, and discardedcycles.
Cunhalted = Cretiring + Cbubble
= Cretiring + Cstall + Cdiscarded (4)
E10 ≈ E9+E7×MisBranchPen+E11
Issue Width(5)
CPI −DispatchStall Per Ins ≈ 1
Issue Width
+MisBranchPen× Inst MisPred
Inst Retired
(6)
The unhalted cycles can be counted by event E10,CPU Clocks not Halted. The stall cycles can be countedby event E9, Dispatch Stalls. The ideal retiring cycles
can be calculated by the ratio between event E11, Re-tired Instructions, and issue width (which is a microar-chitectural feature). Due to hardware limitations, we usemispredicted cycles to approximate discarded cycles. Mispre-dicted cycles can be expressed as the product of event E7,Retired Mispredicted Branch Instructions, and the resultingpenalty cycles (MisBranchPen). We find that this approxima-tion does not significantly increase power prediction errordue to its relatively small weight in Equation 3. Therefore,Equation 4 can be rewritten in terms of event counts asEquation 5. Dividing both sides of this equation by the retiredinstructions and rearranging the terms yields Equation 6.
Among terms in the right-hand side of Equation 6,Issue Width and MisBranchPen are microarchitecture-specificconstants, and Inst Retired and Inst MisPred are constantsat a given program point. Since none of these values aredependent on frequency, CPI - DispatchStall Per Inst isapproximately a constant at a given point in a program,regardless of VF states.
We note here that Equation 5 assumes that every retiringcycle retires Issue Width instructions. We could make amore accurate estimate of this value by separating outCycles Retiring 1, . . . , Cycles Retiring Issue Width. Unitmask values in our performance counters could count thesevalues separately, at the cost of more counter multiplexing.We note that this retire count is mostly a function of programlocation and microarchitectural features, however. As such,Observation 2 still holds.
The above two observations provide the relationship ofhardware event counters among different VF states. Therefore,given the hardware event counts at one VF state, we canderive good estimates of event counts at any other VF state.
2) Validation of Power Prediction across VF States:We now evaluate the power prediction errors for all thebenchmark combinations across all pairs of VF states. Foreach pair of VF states, we compare the average measuredpower and the average predicted power for each benchmarkcombination and illustrate the error for each suite.
Figure 3 shows the validation results of dynamic powerand chip power with predictions across different VF states.VFi→VFj means predicting power at VFj based on eventcounts gathered at VFi. We use the same 4-fold crossvalidation method as was used for the power model, and foreach VF state pair, the prediction errors of all 152 benchmarkcombinations are collected and presented in one column.
As Figure 3(a) shows, the average prediction error forthe dynamic power ranges from 5.5% to 13.7% in differentVF state pairs, with an overall average error of 8.3%. Asthe voltage and frequency differences between VFi and VFjincrease, the prediction errors usually increase accordingly.The errors are higher when the target state is VF1 becausethe dynamic power model has higher error there. Figure 3(a)also presents the standard deviation, which ranges from 4.7%to 10.5%, with an overall average of 6.9%.

0%
2%
4%
6%
8%
10%
12%
14%
16%
VF5->V
F5V
F5->VF4
VF5->V
F3V
F5->VF2
VF5->V
F1
VF4->V
F5V
F4->VF4
VF4->V
F3V
F4->VF2
VF4->V
F1
VF3->V
F5V
F3->VF4
VF3->V
F3V
F3->VF2
VF3->V
F1
VF2->V
F5V
F2->VF4
VF2->V
F3V
F2->VF2
VF2->V
F1
VF1->V
F5V
F1->VF4
VF1->V
F3V
F1->VF2
VF1->V
F1
Dyn
amic
Pow
er P
redi
ctio
n E
rror
Acr
oss V
F St
ates Average Standard Deviation
Average Value = 8.3%
(a) Prediction error of the dynamic power across VF states
0%
1%
2%
3%
4%
5%
6%
7%
8%
VF5->V
F5V
F5->VF4
VF5->V
F3V
F5->VF2
VF5->V
F1
VF4->V
F5V
F4->VF4
VF4->V
F3V
F4->VF2
VF4->V
F1
VF3->V
F5V
F3->VF4
VF3->V
F3V
F3->VF2
VF3->V
F1
VF2->V
F5V
F2->VF4
VF2->V
F3V
F2->VF2
VF2->V
F1
VF1->V
F5V
F1->VF4
VF1->V
F3V
F1->VF2
VF1->V
F1
Chi
p Po
wer
Pre
dict
ion
Err
or A
cros
s VF
Stat
es Average Standard Deviation
Average Value = 4.2%
(b) Prediction error of the chip power across VF states
Figure 3 Dynamic (a) and chip power (b) prediction error across VF states. The bars are the averages of AAEs. The crosses are thestandard deviations of AAEs.
Figure 3(b) shows the across-VF errors for the chip levelpower prediction. The average prediction errors for each VFstate pair range from 2.7% to 6.3%, with an overall averageerror of 4.2%. The standard deviations for all VF state pairsfall within 5.5%, with the average deviation as 3.6%.
On the AMD Phenom II X6 1090T processor, we verifythe prediction accuracy between VF4, VF3, and VF2. Theoverall average prediction error for dynamic power modeland chip power model are 5.6% and 3.1%, respectively.
D. Power Gating and Per-core Idle Power
In our AMD FX-8320 processor, power gating (PG) isimplemented at the CU level. That is, when PG is enabledin the BIOS, a CU can be power gated if both of its coresare idle. The NB can also be power gated if all of the CUsare idle. To model the impact of PG on chip idle powerand to isolate the core idle power from NB idle power, wedeveloped a microbenchmark, bench A, which has an L1-resident data set, requires no dynamic NB accesses, and has asteady program phase. The performance and dynamic powerof each instance is the same if multiple instances are runningconcurrently on different CUs.
We devised an experiment in which we fix the processor’sVF state and sweep the number of busy CUs from 0 (chipidle) to 4 (all CUs are actively running bench A), for both PGenabled and PG disabled cases. Figure 4 shows the measuredchip power. We use Pidle(CU) and Pidle(NB) to denote aCU’s idle power and the NB’s idle power. For each VFstate in the figure, the two bars in the 4CU case have nodifference because all CUs are busy and no CU is powergated. In the 3CUs case, the gap between the two bars isPidle(CU). Similarly, in the 2CUs and 1CU cases, the gapsare 2 × Pidle(CU) and 3 × Pidle(CU), respectively. For theidle case, the difference is 4×Pidle(CU)+Pidle(NB) becausethe NB is also power gated. When the chip is idle and PG
is enabled, there is still a constant power, Pidle(Base), whichexists when the processor is powered on. Pidle(Base) doesnot change with the core VF state. For all VF states, wequantify Pidle(CU) and Pidle(NB) using this method.
The idle power is partitioned by the busy cores runningthe application. When PG is enabled, the busy cores in aCU share Pidle(CU) and all busy cores in the chip sharePidle(NB)+Pidle(Base). This is shown in Equation 7, wherem is the number of the busy cores in a CU and n is thenumber of busy cores in the chip. When PG is disabled,all busy cores share chip idle power, which is always4 × Pidle(CU) + Pidle(NB) + Pidle(Base). This is shown inEquation 8. Combining this with the per-core dynamic powermodel, we can derive total per-core power.
Pidle(Core) = Pidle(CU)/m+ (Pidle(NB) + Pidle(Base))/n(7)
Pidle(Core) = (4× Pidle(CU) + Pidle(NB) + Pidle(Base))/n(8)
0
0.2
0.4
0.6
0.8
1
idle1C
U2C
Us
3CU
s4C
Us
idle1C
U2C
Us
3CU
s4C
Us
idle1C
U2C
Us
3CU
s4C
Us
idle1C
U2C
Us
3CU
s4C
Us
idle1C
U2C
Us
3CU
s4C
Us
Nor
mal
ized
Chi
p Po
wer Disable Power Gating
Enable Power Gating
VF5 VF4 VF3 VF2 VF1
Figure 4 Chip power when power gating is disabled and enabled.

PerformancePrediction
Model
Dynamic Power Model
H/W Events Predictor
PMC at other VFs
CPIs at all VFs
Idle Power Model
Dynamic Info:PMC, VF,
Temperature
Temperature, VF
Dynamic Power at all VFs
Idle Power at all VFs
CPI at all VFsPMC, VF
PMCVF
All-in-one: PPEP
DVFS Exploring Space:Energy -Delay Scaling,
Power Capping, etc.
DVFS Decision
VF Regulator
EnergyPrediction Core 0's
PPE
Core 1'sPPE
Core n'sPPE1
2
3
4
5
6
Figure 5 The framework of PPEP and the working flow of PPEP-based DVFS management.
E. Complexity and Generality Analysis
The PPEP framework has four components: a performanceprediction model, an idle power model, a dynamic powermodel, and a power prediction model for estimating powerat other VF states. To predict energy consumption, wecan simply combine the power prediction model and theperformance prediction model.
PPEP can run as a user-level daemon without hardwaremodifications, and we found that it had negligible overheadat our 200 ms sampling rate. PPEP can also sample fasterwithout significant overhead in the kernel or in firmware. Ifimplemented in firmware, PPEP can also be used to controlhardware boost states, which were disabled in our tests.
While we have focused on implementing PPEP on AMDprocessors, the general techniques should carry betweenarchitectures and implementations. CPI predictors have beendemonstrated on other architectures [16, 25], for instance.This work could also be taken as a recommendation forthe type of performance events that can be useful in othercommercial processors.
V. ENERGY AND POWER SPACE EXPLORATION
Figure 5 shows an overview of the PPEP framework. PPEPis a software daemon that runs alongside regular applicationsand can estimate their performance and power in order tomake DVFS decisions. It starts by recording the hardwareperformance counters, current VF state, and temperaturediode values from the cores on the CPU. This is used as theinput to the PPEP manager.
From there, PPEP operates as follows: 1© it uses theperformance predictor to estimate the CPI of the applicationat all VF states; 2© the hardware event predictor, which wedescribed in Section IV-C, takes the predicted CPI values,the current performance counter values, and the VF state andestimates what the hardware events would be at all of the
VF states; 3© these event predictions are used to predict thedynamic power that would be consumed at other VF states;4© the PG-aware idle power model estimates the remaining
power at all VF states; 5© these values are fed into a decisionalgorithm; 6© this can use these power, energy, and relatedprojections in order to easily make decisions about changingthe chip’s VF states.
PPEP’s predictions can be used to dynamically explore theperformance-power-energy (PPE) space to select the optimalVF states within one step. In this section, we demonstratehow PPEP can be used for real-time energy prediction, highresponsive (one-step) power capping scheme and further PPEexploration.
A. Energy Prediction
For battery-powered handheld devices, it is important topredict energy consumption in order to make runtime powercontrol decisions that will meet battery life targets. Energycan be calculated by multiplying power and interval length.When using the PPEP framework, we use energy from thecurrent interval to predict energy of the next interval. Besidesmodel fitting errors, phase changes between neighboringintervals can also introduce errors. To examine the total error,we compare the estimated chip energy of the current intervaland the measured chip energy of the next interval. We thencalculate the AAE across all intervals in each benchmarkcombination. Figure 6 shows the energy prediction error atVF5 for SPEC® CPU2006 benchmark combinations, withthe average AAE (second-to-last bar) on the AMD FX-8320 processor. We also compare our result to the resultof the existing work of Green Governors [27] (the last bar)which is also implemented on an AMD processor. The GreenGovernors power model is based upon a theoretical powermodel (i.e. CV2f) and does not consider energy contributionsfrom the NB. As seen in Figure 6, PPEP achieves a 3.6%

0%
1%
2%
3%
4%
5%
6%
7%
8%
400401403429445456458462464471473483410416433434435436437444447450453454459465470481482400+401403+429445+456458+462464+471473+483410+416433+434435+436437+444447+450453+454459+465470+481482+429400+401+403429+445+456458+462+464471+473+483410+416+433434+435+436437+444+447450+453+454459+465+470481+482+429400+401+403+429445+456+458+462464+471+473+483410+416+433+434435+436+437+444447+450+453+454459+465+470+481A
VG
AV
G(G
G)
AA
E o
f Ene
rgy
Pred
ictio
n(V
F5)
Green Governors
PPEP
Figure 6 Energy prediction error of the whole chip (including cores and the NB).
average energy prediction error while Green Governorshas about 7% average error. We also evaluate the energyprediction error at all other VF states. From VF4 to VF1 theaverage AAE are 3.3%, 3.7%, 4.0%, and 4.9%, respectively.
B. One-step Power Capping
Power caps are often enforced by temporarily running coresat lower VF states [14, 29, 20, 21]. Finding the VF statethat maximizes performance under the power cap is usuallyan iterative process. A control loop will change the VF stateand spend some time determining the current power usage.If the power usage is not yet under the cap, this VF stateis lowered and the process repeats. Similarly, if the poweris far enough below the cap, the controller will try to raisethe VF state in order to gain back performance. In contrastto such an iterative algorithm, PPEP allows proactive powerconsumption predictions across all VF states. This allows itto directly select the VF state that maximizes performanceunder the power cap.
Similar to previous work [20, 21], we assume for thisexperiment that each CU of the processor has a separatepower plane, allowing per-CU DVFS. This is in contrast tomost current hardware, which supports per-CU frequencyscaling but only supports global voltage scaling.
Figure 7 shows the dynamic power capping responsive-ness when running a benchmark combination of 429.mcf,458.sjeng, 416.gamess, and swaptions on four CUs. PPEPadjusts chip power within a single 0.2s sampling period (OSor firmware implementations could respond even faster). Inaddition, it adheres to the power budget with 94% accuracy.The simple iterative mechanism, which takes 2.8s to adjustto the power budget, adheres to the power budget with 81%accuracy and occasionally violates the power cap. Note thatwe chose a large power cap swing to demonstrate PPEP’sability to more rapidly reach the cap than iterative algorithms.This is not perfectly representative of all power cap changes,but as an example, removing a laptop from its wall powercan cause a significant and rapid power cap change.
020406080
100120
1 61 121 181 241 301
Chi
p Po
wer
(W)
Step (200ms)
Power Target PPEP Based Policy
020406080
100120
1 61 121 181 241 301C
hip
Pow
er (W
)Step (200ms)
Power Target Simple Iterative Policy
Figure 7 Power capping time responsiveness.
C. Further PPE Exploration
Using the PPEP framework, we are also able to provideinsights for future DVFS technology. Note that power gatingis enabled for all of these experiments.
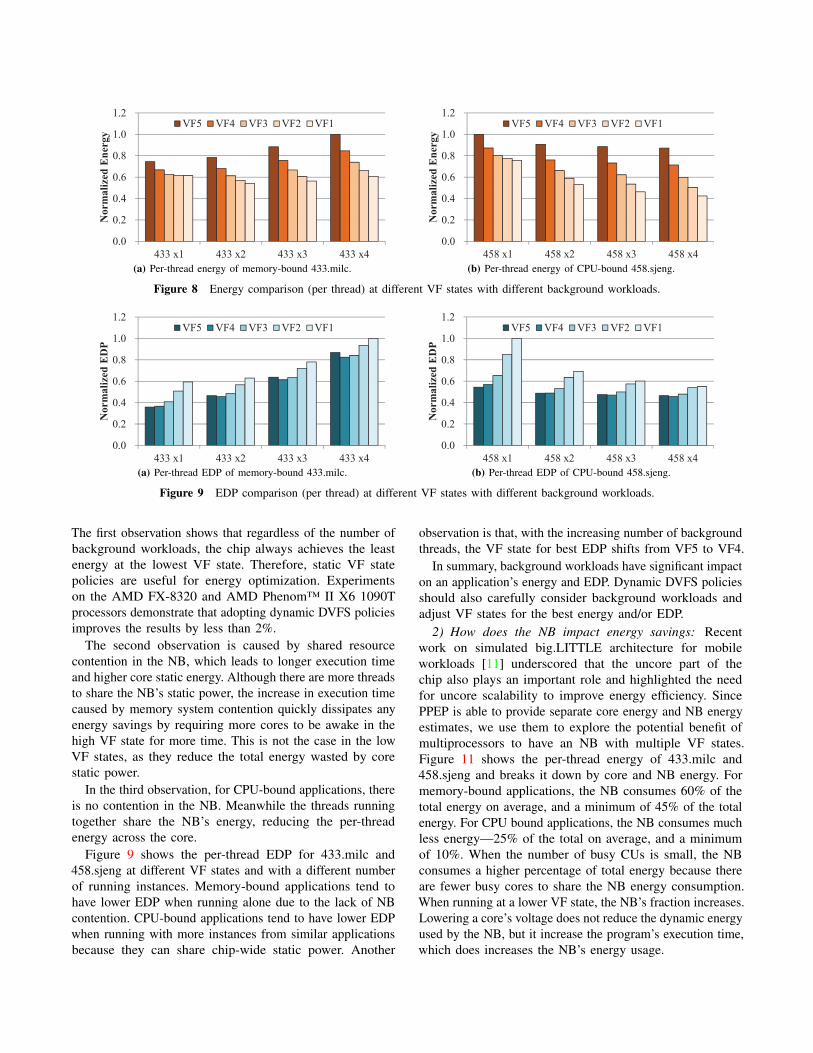
1) How background workloads impact energy and EDP:In this experiment, we run the SPEC CPU2006 benchmarksat VF5 with a different number of concurrent instances. Wethen use PPEP to explore their energy and EDP at other VFstates. Of these results, we illustrate 433.milc and 458.sjeng,typical memory- and CPU-bound benchmarks, respectively.
Figure 8 shows the per-thread energy consumption forthese programs at different VF states and with a differentnumber of instances. We make three observations:
1) For both CPU- and memory-bound applications, run-ning at the lowest VF state produces the lowest energyconsumption;
2) At a high VF state, a single memory-bound applica-tion consumes less per-thread energy than a multi-programmed memory-bound application; and,
3) At the same VF state, a single CPU-bound applica-tion consumes more per-thread energy than multi-programmed CPU-bound applications.
0.0
0.2
0.4
0.6
0.8
1.0
1.2
433 x1 433 x2 433 x3 433 x4
Nor
mal
ized
Ene
rgy
VF5 VF4 VF3 VF2 VF1
(a) Per-thread energy of memory-bound 433.milc.
0.0
0.2
0.4
0.6
0.8
1.0
1.2
458 x1 458 x2 458 x3 458 x4
Nor
mal
ized
Ene
rgy
VF5 VF4 VF3 VF2 VF1
(b) Per-thread energy of CPU-bound 458.sjeng.
Figure 8 Energy comparison (per thread) at different VF states with different background workloads.
0.0
0.2
0.4
0.6
0.8
1.0
1.2
433 x1 433 x2 433 x3 433 x4
Nor
mal
ized
ED
P
VF5 VF4 VF3 VF2 VF1
(a) Per-thread EDP of memory-bound 433.milc.
0.0
0.2
0.4
0.6
0.8
1.0
1.2
458 x1 458 x2 458 x3 458 x4
Nor
mal
ized
ED
P
VF5 VF4 VF3 VF2 VF1
(b) Per-thread EDP of CPU-bound 458.sjeng.
Figure 9 EDP comparison (per thread) at different VF states with different background workloads.
The first observation shows that regardless of the number ofbackground workloads, the chip always achieves the leastenergy at the lowest VF state. Therefore, static VF statepolicies are useful for energy optimization. Experimentson the AMD FX-8320 and AMD Phenom™ II X6 1090Tprocessors demonstrate that adopting dynamic DVFS policiesimproves the results by less than 2%.
The second observation is caused by shared resourcecontention in the NB, which leads to longer execution timeand higher core static energy. Although there are more threadsto share the NB’s static power, the increase in execution timecaused by memory system contention quickly dissipates anyenergy savings by requiring more cores to be awake in thehigh VF state for more time. This is not the case in the lowVF states, as they reduce the total energy wasted by corestatic power.
In the third observation, for CPU-bound applications, thereis no contention in the NB. Meanwhile the threads runningtogether share the NB’s energy, reducing the per-threadenergy across the core.
Figure 9 shows the per-thread EDP for 433.milc and458.sjeng at different VF states and with a different numberof running instances. Memory-bound applications tend tohave lower EDP when running alone due to the lack of NBcontention. CPU-bound applications tend to have lower EDPwhen running with more instances from similar applicationsbecause they can share chip-wide static power. Another
observation is that, with the increasing number of backgroundthreads, the VF state for best EDP shifts from VF5 to VF4.
In summary, background workloads have significant impacton an application’s energy and EDP. Dynamic DVFS policiesshould also carefully consider background workloads andadjust VF states for the best energy and/or EDP.
2) How does the NB impact energy savings: Recentwork on simulated big.LITTLE architecture for mobileworkloads [11] underscored that the uncore part of thechip also plays an important role and highlighted the needfor uncore scalability to improve energy efficiency. SincePPEP is able to provide separate core energy and NB energyestimates, we use them to explore the potential benefit ofmultiprocessors to have an NB with multiple VF states.Figure 11 shows the per-thread energy of 433.milc and458.sjeng and breaks it down by core and NB energy. Formemory-bound applications, the NB consumes 60% of thetotal energy on average, and a minimum of 45% of the totalenergy. For CPU bound applications, the NB consumes muchless energy—25% of the total on average, and a minimumof 10%. When the number of busy CUs is small, the NBconsumes a higher percentage of total energy because thereare fewer busy cores to share the NB energy consumption.When running at a lower VF state, the NB’s fraction increases.Lowering a core’s voltage does not reduce the dynamic energyused by the NB, but it increase the program’s execution time,which does increases the NB’s energy usage.

0%10%20%30%40%50%60%70%80%90%100%110%120%
0
0.2
0.4
0.6
0.8
1
1.2
VF5
VF4
VF3
VF2
VF1
VF5
VF4
VF3
VF2
VF1
VF5
VF4
VF3
VF2
VF1
VF5
VF4
VF3
VF2
VF1
NB
Rat
io
Nor
mal
ized
Ene
rgy
Energy(Core) Eneryg(NB) NB Ratio
433 x1 433 x2 433 x3 433 x4(a) NB energy share in memory-bound 433.milc.
0%10%20%30%40%50%60%70%80%90%100%110%120%
0
0.2
0.4
0.6
0.8
1
1.2
VF5
VF4
VF3
VF2
VF1
VF5
VF4
VF3
VF2
VF1
VF5
VF4
VF3
VF2
VF1
VF5
VF4
VF3
VF2
VF1
NB
Rat
io
Nor
mal
ized
Ene
rgy
Energy(Core) Eneryg(NB) NB Ratio
458 x1 458 x2 458 x3 458 x4(b) NB energy share in CPU-bound 458.sjeng.
Figure 10 NB energy consumption percentage.
This shows that it is important to evaluate the energybenefit of scaling the NB voltage and frequency. As such,we use PPEP to conduct studies assuming two VF statesfor the NB. The higher one is the current VF hi (1.175V,2.2GHz). We introduce a lower VF state to the NB witha 20% voltage drop and a 50% frequency drop as VF lo(0.940V, 1.1GHz). We assume the idle power of the NBdrops 40%, and dynamic power for same operations drops36%. For performance prediction, we assume the leadingloads cycles increase by 50% when frequency drops fromhigh to low. We adopt these considerations and re-evaluatethe PPE of the new Core-NB VF combinations.
As can be seen in Figure 11(a), both memory- and CPU-bound applications can achieve further energy saving throughscaling the VF state of the NB. We compare the scaling rangeof energy consumption when fixing the run mode to x1, x2,x3 or x4. For 433.milc, the potential of energy savings withNB VF scaling are 26%, 23%, 21%, and 20%, respectively,with NB VF scaling. For 458.sjeng these values are 25%,19%, 16%, and 14%. For memory-bound applications, a lowervoltage makes a large reduction in the NB’s dynamic energy.Although the increase in execution time causes a largerportion of the program’s energy to come from the NB idleenergy, it still reduces chip-wide energy usage. The energybenefits are also significant for CPU-bound applications,which may run slightly slower but see much less static NBenergy usage.
Figure 11(b) shows that scaling the NB can reduceexecution time with similar energy consumption. We observethat, because the NB uses less power, the cores can now run ata higher VF state. This reduces their execution time withoutchanging chip-wide energy usage. Using core-VF1 and NB-VF hi as the baseline, we observe that for the memorybound 433.milc, the potential performance gains are 1.54×,1.30×, 1.27×, and 1.25×. For the CPU-bound 458.sjeng,these values are 1.99×, 1.19×, 1.19×, and 1.20×.
Note that due to measurement limitation, we cannotseparate the power of the memory controller from that ofthe last-level cache in our NB. As such, we scale both in
0%
10%
20%
30%433x1433x2433x3433x4
458x1458x2458x3458x4
Ener
gy S
avin
g (%
)
Average=20.4%
(a) Energy savings.
0
0.5
1
1.5
2
433x1433x2433x3433x4
458x1458x2458x3458x4
Speedup
Average=1.37
(b) Speedup.
Figure 11 Further energy savings with a scalable NB and theperformance speedup with similar energy consumption.
the above results. In reality, for SRAM reliability reasons,only the memory controller power should be scaled.
This experiment indicates that future DVFS technologyshould also consider scaling the NB to achieve energy savingsand higher performance.
VI. RELATED WORK
Research on power modeling has evolved from simple fre-quency and voltage scaling to hardware event counter-basedregression models. Many other empirical models require off-line profiling or preprocessing for each application, whichdo not provide flexibility and generality for new workloads.There are many studies that use linear power models builtfrom different performance counters combinations. Karanet. al. [26] propose a real-time power model based onfour hardware event counters on AMD Phenom™ quad-core processor. Isci et al. [15] collected hardware eventinformation to create a fingerprint of the power traces, buttheir particular microprocessor required many counters, andwas thus quite costly. Deng et al. [6] proposed a simulationbased system-level framework, CoScale, with performance

and power predictions. The recent work on Green Governorsbuilt a power model from a theoretical (CV2f) power formulaby calculating the effective capacitance and the processor’sdynamic activity [27]. This work measured the voltageregulator to get the power traces for cores but did notconsider the NB for DVFS benefits. In contrast, PPEPbuilds performance and power models based on hardwaremeasurements and extends them to predict across VF statesby implementing a hardware event predictor. Once the modelis built for a specific processor, runtime usage does notrequire power meters or off-line application training. It simplyfollows the application’s behavior with high sensitivity.
Power capping has been achieved by migrating threads [5]or scaling down core frequency [20, 21, 29] to meet thepower budget. Steepest Drop [29] assumes knowledge ofthe power consumption of each core, which is not yetfully supported by modern processors. Others [20, 21]have developed the three-layer power control architecturecalled FreqPar for many-core processors, which requiresa power monitor attached to the chip. Pack & Cap [5]predicts performance with a multi-nomial logistic regression(MLR) classifier trained through an offline analysis. Whenqueried at runtime, this classifier returns the best candidateoperating point. In contrast, PPEP predicts performance andpower directly from architectural properties, providing moregeneral and theoretical insights with a low complexity. Thisability, especially for distant VF states, makes PPEP a goodinfrastructure to implement single step power capping policiesin commercial processors without attaching external powermonitors.
VII. CONCLUSION
In this paper, we propose the PPEP framework to provideonline PPE estimations across all available voltage-frequencystates. PPEP implements a hardware event predictor thattakes the performance counters from one VF state and usesthem to generate dynamic information about another VFstate. We verify PPEP’s modeling accuracy on both an AMDFX-8320 and an AMD Phenom™ II X6 1090T processorwith a broad set of benchmarks, including SPEC® CPU2006,PARSEC, and the NAS Parallel Benchmarks.
Using PPEP, we conduct an energy and power spaceexploration which demonstrates the following: PPEP is ableto make power adjustment decisions that meet the targetpower cap in a single step, improving the response timecompared to a commonly-practiced iterative power cappingmechanism. We also show that background workloads havesignificant impact on application’s energy and EDP. Thus itis an important factor to consider in DVFS policies. Finally,we show that future processor designs which take advantageof scalable VF states in the north bridge, can offer an extra20% energy saving or 1.4× performance improvement versusmodern cores which maintain mostly constant north bridgeVF states.
ACKNOWLEDGMENT
We would like to thank our shepherd and anonymousreviewers for their comments and suggestions that havegreatly improved this paper. In addition, we wish to thank Y.Eckert and I. Paul for their help and advice. Finally, thanksto V. Spiliopoulos for his help in understanding the GreenGovernors model. This work is partially supported by 863Program of China (2012AA010905), NSFC (61472431). BoSu is supported by NUDT/Hunan Innov. Fund. For PostGrad.(B120604, CX2012B029).AMD, the AMD Arrow logo, AMD Phenom, and combina-tions thereof are trademarks of Advanced Micro Devices, Inc.SPEC is a registered trademark of the Standard PerformanceEvaluation Corporation (SPEC). Other names used in thispublication are for identification purposes only and may betrademarks of their respective companies.
REFERENCES
[1] D. Bailey, E. Barszcz, J. Barton, D. Browning, R. Carter,L. Dagum, R. Fatoohi, S. Finebert, P. Frederickson, T. Lasinski,R. Schreiber, H. Simon, V. Venkatakrishnan, and S. Weer-atunga, “The NAS Parallel Benchmarks,” Tech. Rep. RNR-94-007, March 1994.
[2] L. A. Barroso, J. Clidaras, and U. Holzle, The Datacenter as aComputer: An Introduction to the Design of Warehouse-ScaleMachines, Second ed. Morgan & Claypool, 2013.
[3] C. Bienia, S. Kumar, J. P. Singh, and K. Li, “The PARSECBenchmark Suite: Characterization and Architectural Impli-cations,” in Proc. of the Int’l Conf. on Parallel Architecturesand Compilation Techniques (PACT), 2008.
[4] T. Cao, S. M. Blackburn, T. Gao, and K. S. McKinley, “TheYin and Yang of Power and Performance for AsymmetricHardware and Managed Software,” in Proc. of the Int’l Symp.on Computer Architecture (ISCA), 2012.
[5] R. Cochran, C. Hankendi, A. K. Coskun, and S. Reda, “Pack &Cap: Adaptive DVFS and Thread Packing Under Power Caps,”in Proc. of the Int’l Symp. on Microarchitecture (MICRO),2011.
[6] Q. Deng, D. Meisner, A. Bhattacharjee, T. Wenisch, andR. Bianchini, “CoScale: Coordinating CPU and MemorySystem DVFS in Server Systems,” in Proc. of the Int’l Symp.on Microarchitecture (MICRO), 2012.
[7] H. Esmaeilzadeh, T. Cao, Y. Xi, S. M. Blackburn, and K. S.McKinley, “Looking Back on the Language and HardwareRevolutions: Measured Power, Performance, and Scaling,”in Proc. of the Int’l Conf. on Architectural Support forProgramming Languages and Operating Systems (ASPLOS),2011.
[8] S. Eyerman and L. Eeckhout, “A Counter Architecturefor Online DVFS Profitability Estimation,” IEEE Trans. onComputers, vol. 59, no. 11, pp. 1576–1583, 2010.
[9] S. Eyerman, L. Eeckhout, T. Karkhanis, and J. E. Smith, “AMechanistic Performance Model for Superscalar Out-of-OrderProcessors,” ACM Transactions on Computer Systems, vol. 27,no. 2, pp. 3:1–3:37, 2009.
[10] A. Greenberg, J. Hamilton, D. A. Maltz, and P. Patel, “TheCost of a Cloud: Research Problems in Data Center Networks,”ACM SIGCOMM Computer Communication Review, vol. 39,no. 1, pp. 68–73, Dec. 2008.
[11] V. Gupta, P. Brett, D. Koufaty, D. Reddy, S. Hahn, K. Schwan,and G. Srinivasa, “The Forgotten ’Uncore’: On the Energy-

Efficiency of Heterogeneous Cores,” in Proc. of the USENIXAnnual Technical Conf. (USENIX ATC), 2012.
[12] J. L. Henning, “SPEC CPU2006 Benchmark Descriptions,”ACM SIGARCH Computer Architecture News, vol. 34, no. 4,pp. 1–17, 2006.
[13] W. Huang, C. Lefurgy, W. Kuk, A. Buyuktosunoglu, M. Floyd,K. Rajamani, M. Allen-Ware, and B. Brock, “Accurate Fine-Grained Processor Power Proxies,” in Proc. of the Int’l Symp.on Microarchitecture (MICRO), 2012.
[14] C. Isci, A. Buyuktosunoglu, C.-Y. Cher, P. Bose, andM. Martonosi, “An Analysis of Efficient Multi-Core GlobalPower Management Policies: Maximizing Performance fora Given Power Budget,” in Proc. of the Int’l Symp. onMicroarchitecture (MICRO), 2006.
[15] C. Isci and M. Martonosi, “Runtime Power Monitoring inHigh-End Processors: Methodology and Empirical Data,” inProc. of the Int’l Symp. on Microarchitecture (MICRO), 2003.
[16] R. Joseph and M. Martonosi, “Run-time Power Estimationin High Performance Microprocessors,” in Proc. of the Int’lSymp. on Low Power Electronics and Design (ISLPED), 2001.
[17] G. Keramidas, V. Spiliopoulos, and S. Kaxiras, “Interval-BasedModels for Run-Time DVFS Orchestration in SuperscalarProcessors,” in Int’l Conf. on Computing Frontiers (CF), 2010.
[18] C. Lefurgy, X. Wang, and M. Ware, “Power Capping: a Preludeto Power Shifting,” Cluster Computing, vol. 11, no. 2, pp. 183–195, 2008.
[19] Y. Liu, R. P. Dick, L. Shang, and H. Yang, “AccurateTemperature-Dependent Integrated Circuit Leakage Power Es-timation is Easy,” in Proc. of the Conf. on Design, Automationand Test in Europe (DATE), 2007.
[20] K. Ma, X. Li, M. Chen, and X. Wang, “Scalable PowerControl for Many-Core Architectures Running Multi-threadedApplications,” in Proc. of the Int’l Symp. on ComputerArchitecture (ISCA), 2011.
[21] K. Ma and X. Wang, “PGCapping: Exploiting Power Gatingfor Power Capping and Core Lifetime Balancing in CMPs,”
in Proc. of the Int’l. Conf. on Parallel Architectures andCompilation Techniques (PACT), 2012.
[22] R. Miftakhutdinov, E. Ebrahimi, and Y. N. Patt, “PredictingPerformance Impact of DVFS for Realistic Memory Systems,”in Proc. of the Int’l Symp. on Microarchitecture (MICRO),2012.
[23] I. Paul, S. Manne, M. Arora, W. L. Bircher, and S. Yalaman-chili, “Cooperative Boosting: Needy versus Greedy PowerManagement,” in Proc. of the Int’l Symp. on ComputerArchitecture (ISCA), 2013.
[24] M. D. Powell, A. Biswas, J. S. Emer, S. S. Mikherjee, B. R.Sheikh, and S. Yardi, “CAMP: A Technique to Estimate Per-Structure Power at Run-time using a Few Sample Parameters,”in Proc. of the Int’l Symp. on High Performance ComputerArchitecture (HPCA), 2009.
[25] B. Rountree, D. K. Lowenthal, M. Schulz, and B. R. de Supin-ski, “Practical Performance Prediction Under Dynamic VoltageFrequency Scaling,” in Int’l Green Computing Conf. andWorkshops (IGCC), 2011.
[26] K. Singh, M. Bhadauria, and S. A. McKee, “Real Time PowerEstimation and Thread Scheduling via Performance Counters,”ACM SIGARCH Computer Architecture News, vol. 37, no. 2,pp. 46–55, 2009.
[27] V. Spiliopoulos, S. Kaxiras, and G. Keramidas, “Green Gov-ernors: A Framework for Continuously Adaptive DVFS,” inProc. of the Int’l Green Computing Conference and Workshops(IGCC), 2011.
[28] B. Su, J. L. Greathouse, J. Gu, M. Boyer, L. Shen, and Z. Wang,
“Implementing a Leading Loads Performance Predictor onCommodity Processors,” in Proc. USENIX Annual TechnicalConf. (USENIX ATC), 2014.
[29] J. A. Winter, D. H. Albonesi, and C. A. Shoemaker, “ScalableThread Scheduling and Global Power Management for Het-erogeneous Many-Core Architectures,” in Proc. Int’l Conf. onParallel Architectures and Compilation Techniques (PACT),2010.


![.STNVPY 3L^SM]ZbY .L^^P]ZWP · 1]ppep] 9z_p^.zap] .l^^p]zwp bt_s qztw lyo [wlnp ty _sp q]ppep] ?z wl^_ wzyrp] _sly l xzy_s ty _sp q]ppep] dz` nly nzap] bt_s qztw _spy [wlnp ty^top](https://static.fdocuments.net/doc/165x107/5ec8781fcfca0407af29b66b/stnvpy-3lsmzby-lpzwp-1ppep-9zpzap-lpzwp-bts-qztw-lyo-wlnp-ty-sp.jpg)