Scalability of the DVFS Power Management Technique as...
25
Journal of Computer and Communications, 2017, 5, 69-93 http://www.scirp.org/journal/jcc ISSN Online: 2327-5227 ISSN Print: 2327-5219 DOI: 10.4236/jcc.2017.51007 January 20, 2017 Scalability of the DVFS Power Management Technique as Applied to 3-Tier Data Center Architecture in Cloud Computing Sulieman Bani-Ahmad * , Saleh Sa’adeh Department of Computer Science, School of Information Technology, Al-Balqa Applied University, Salt, Jordan Abstract The increase in computing capacity caused a rapid and sudden increase in the Operational Expenses (OPEX) of data centers. OPEX reduction is a big con- cern and a key target in modern data centers. In this study, the scalability of the Dynamic Voltage and Frequency Scaling (DVFS) power management technique is studied under multiple different workloads. The environment of this study is a 3-Tier data center. We conducted multiple experiments to find the impact of using DVFS on energy reduction under two scheduling tech- niques, namely: Round Robin and Green. We observed that the amount of energy reduction varies according to data center load. When the data center load increases, the energy reduction decreases. Experiments using Green scheduler showed around 83% decrease in power consumption when DVFS is enabled and DC is lightly loaded. In case the DC is fully loaded, in which case the servers’ CPUs are constantly busy with no idle time, the effect of DVFS decreases and stabilizes to less than 10%. Experiments using Round Robin scheduler showed less energy saving by DVFS, specifically, around 25% in light DC load and less than 5% in heavy DC load. In order to find the effect of task weight on energy consumption, a set of experiments were conducted through applying thin and fat tasks. A thin task has much less instructions compared to fat tasks. We observed, through the simulation, that the differ- ence in power reduction between both types of tasks when using DVFS is less than 1%. Keywords Cloud Computing, Data Centers, Operational Expenses, Green Technology, DVFS, Energy Reduction *Part of this work was done while the first author was visiting the University of Tabuk, Saudi Arabia, while on sabbatical leave from Al-Balqa Applied University, Jordan. How to cite this paper: Bani-Ahmad, S. and Sa’adeh, S. (2017) Scalability of the DVFS Power Management Technique as Applied to 3-Tier Data Center Architecture in Cloud Computing. Journal of Computer and Communications, 5, 69-93. http://dx.doi.org/10.4236/jcc.2017.51007 Received: December 6, 2016 Accepted: January 17, 2017 Published: January 20, 2017 Copyright © 2017 by authors and Scientific Research Publishing Inc. This work is licensed under the Creative Commons Attribution International License (CC BY 4.0). http://creativecommons.org/licenses/by/4.0/ Open Access
Transcript of Scalability of the DVFS Power Management Technique as...

Journal of Computer and Communications, 2017, 5, 69-93 http://www.scirp.org/journal/jcc
ISSN Online: 2327-5227 ISSN Print: 2327-5219
DOI: 10.4236/jcc.2017.51007 January 20, 2017
Scalability of the DVFS Power Management Technique as Applied to 3-Tier Data Center Architecture in Cloud Computing
Sulieman Bani-Ahmad*, Saleh Sa’adeh
Department of Computer Science, School of Information Technology, Al-Balqa Applied University, Salt, Jordan
Abstract The increase in computing capacity caused a rapid and sudden increase in the Operational Expenses (OPEX) of data centers. OPEX reduction is a big con-cern and a key target in modern data centers. In this study, the scalability of the Dynamic Voltage and Frequency Scaling (DVFS) power management technique is studied under multiple different workloads. The environment of this study is a 3-Tier data center. We conducted multiple experiments to find the impact of using DVFS on energy reduction under two scheduling tech-niques, namely: Round Robin and Green. We observed that the amount of energy reduction varies according to data center load. When the data center load increases, the energy reduction decreases. Experiments using Green scheduler showed around 83% decrease in power consumption when DVFS is enabled and DC is lightly loaded. In case the DC is fully loaded, in which case the servers’ CPUs are constantly busy with no idle time, the effect of DVFS decreases and stabilizes to less than 10%. Experiments using Round Robin scheduler showed less energy saving by DVFS, specifically, around 25% in light DC load and less than 5% in heavy DC load. In order to find the effect of task weight on energy consumption, a set of experiments were conducted through applying thin and fat tasks. A thin task has much less instructions compared to fat tasks. We observed, through the simulation, that the differ-ence in power reduction between both types of tasks when using DVFS is less than 1%. Keywords Cloud Computing, Data Centers, Operational Expenses, Green Technology, DVFS, Energy Reduction
*Part of this work was done while the first author was visiting the University of Tabuk, Saudi Arabia, while on sabbatical leave from Al-Balqa Applied University, Jordan.
How to cite this paper: Bani-Ahmad, S. and Sa’adeh, S. (2017) Scalability of the DVFS Power Management Technique as Applied to 3-Tier Data Center Architecture in Cloud Computing. Journal of Computer and Communications, 5, 69-93. http://dx.doi.org/10.4236/jcc.2017.51007 Received: December 6, 2016 Accepted: January 17, 2017 Published: January 20, 2017 Copyright © 2017 by authors and Scientific Research Publishing Inc. This work is licensed under the Creative Commons Attribution International License (CC BY 4.0). http://creativecommons.org/licenses/by/4.0/
Open Access
S. Bani-Ahmad, S. Sa’adeh
70
1. Introduction
Cloud computing is an online-based computing that provides shared processing resources and data to computers and other components on demand. It is a sys-tem for on-demand access to a shared pool of configurable computing which can be rapidly provisioned and released with minimal management effort.
Cloud computing data centers are gaining popularity recently due to the pro-visioning of computing resources. The increase in computing capacity caused a rapid and sudden increase in the expenses of operating data centers. It has been shown by [1] that energy consumption by data centers forms a major part of the operational expenses bill.
Since OPEX (Operational Expenses) is a key target in data centers, multiple power saving solutions were proposed. Two technologies were widely used and deployed, namely: Dynamic Voltage and Frequency Scaling (DVFS), and Dy-namic Power Management (DPM) [1]. The project of DPM explores some technologies that are concerned with improving the issue of conserving power capabilities in the platforms that are based on software that is open source. The techniques that can be applied to running systems are the ones of the highest in-terest; parameters are adjusted instantly while meeting the deadlines of running software. The other technique is DVFS, which is a technique where it is possible to adjust the microprocessors’ frequency to save energy. In this technique, the CPU clock frequency is decreased to reduce power consumption [2]. A down side of DPM is that energy is wasted during mode-switching in processors. Thus, we focus on studying the DVFS in this work.
According to [3], energy consumption is somewhere between 70% and 85% of full operational power in most servers while they are in their idle mode. As a re-sult, it can be said that a facility using just 20% of its’ operational capacity ac-tually uses 80% of the energy as the same facility will use when it operates at 100% capacity. Hence, as server load decreases, server power consumption will remain relatively high.
In general, it can be said that data centers are any dedicated facility, and this includes buildings, complexes, and rooms, with the main function of hosting computer servers and providing some data services. In [4], data centers are de-fined as including “all buildings, facilities and rooms which contain enterprise servers, server communication equipment, cooling equipment and power equip- ment, and provide some form of data service”. This encompasses wide range of facilities: from mission-critical facilities down to small server rooms located in office buildings.
Data centers are facilities that primarily contain electronic equipment used for data processing (servers), data storage (storage equipment), and communication (network equipment) [5].
A considerable amount of heat is generated by the different components of the data center. Thus, there is a need for the temperature of these components to be controlled. Therefore, DCs are equipped with air conditioning and cooling units. This is important for data centers to remain available and reliable, which
S. Bani-Ahmad, S. Sa’adeh
71
are often granted in the agreements of specific service level. This also implies adding more critical elements to data centers, e.g.; The Uninterruptable Power Supplies (UPS) as a backup power generation units [6].
Ever since the cost of powering and cooling in data centers increased, im-proving energy efficiency has been a major issue in cloud computing. The per-centage of energy consumed is increasing every year. That’s why infrastructure providers are under enormous pressure to reduce energy consumption. This im-plies designing energy-efficient data centers. Minimizing the cost in data centers was not the only goal; another goal is meeting the regulations of the government and the standards of the environment. This can be addressed in several ap-proaches. As an example, designing the architecture of energy efficient hardware helps decrease the speed of CPU and shut down idle hardware units. Another way is to propose energy-aware scheduling mechanisms that allows for turning off idle resources.
The big challenge in the methods that have been mentioned above is how to obtain a good trade-off between energy consumption and performance. There is a need for techniques that can manage the ever-growing amount of work while maintaining acceptable performance level, which is referred to as scalability.
Two and Three Tier Data Center Architecture Structure
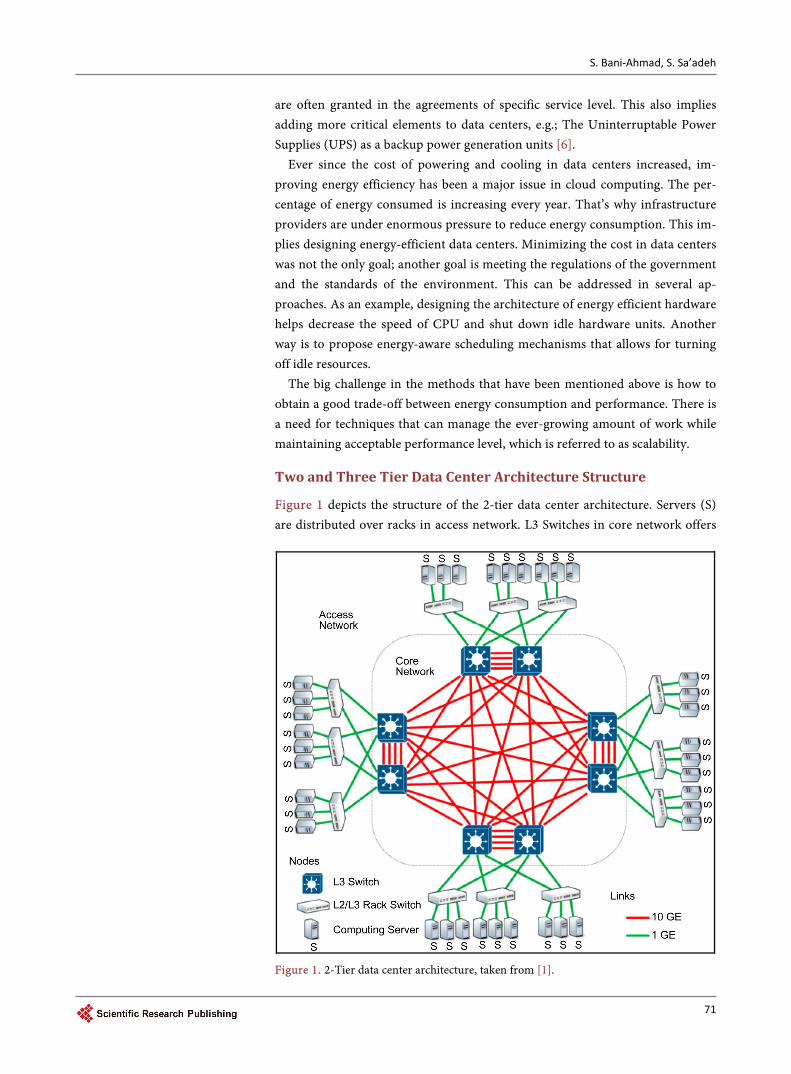
Figure 1 depicts the structure of the 2-tier data center architecture. Servers (S) are distributed over racks in access network. L3 Switches in core network offers
Figure 1. 2-Tier data center architecture, taken from [1].
S. Bani-Ahmad, S. Sa’adeh
72
full mesh interconnection using 10 GE links. The 2-Tier architecture has worked well in earlier data centers in which the computing servers were limited in num-ber [1]. 2-tier data centers can support up to 5500 nodes depending on the kind of switches in the access network [7].
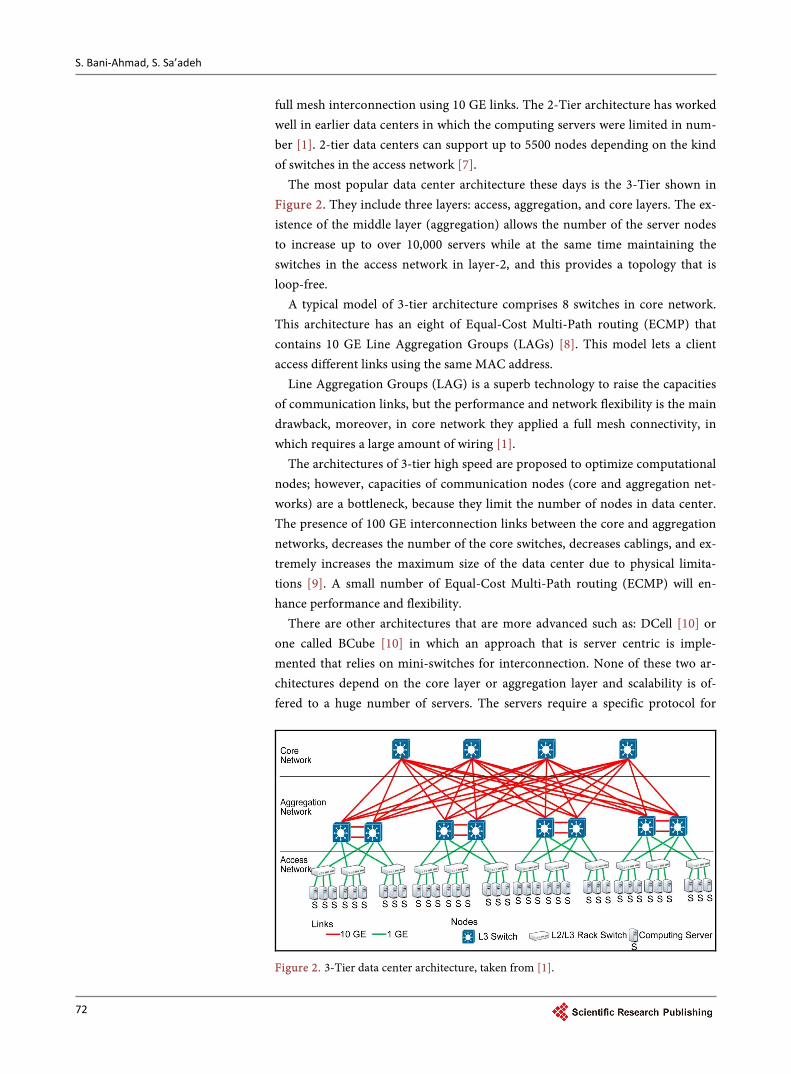
The most popular data center architecture these days is the 3-Tier shown in Figure 2. They include three layers: access, aggregation, and core layers. The ex-istence of the middle layer (aggregation) allows the number of the server nodes to increase up to over 10,000 servers while at the same time maintaining the switches in the access network in layer-2, and this provides a topology that is loop-free.
A typical model of 3-tier architecture comprises 8 switches in core network. This architecture has an eight of Equal-Cost Multi-Path routing (ECMP) that contains 10 GE Line Aggregation Groups (LAGs) [8]. This model lets a client access different links using the same MAC address.
Line Aggregation Groups (LAG) is a superb technology to raise the capacities of communication links, but the performance and network flexibility is the main drawback, moreover, in core network they applied a full mesh connectivity, in which requires a large amount of wiring [1].
The architectures of 3-tier high speed are proposed to optimize computational nodes; however, capacities of communication nodes (core and aggregation net-works) are a bottleneck, because they limit the number of nodes in data center. The presence of 100 GE interconnection links between the core and aggregation networks, decreases the number of the core switches, decreases cablings, and ex-tremely increases the maximum size of the data center due to physical limita-tions [9]. A small number of Equal-Cost Multi-Path routing (ECMP) will en-hance performance and flexibility.
There are other architectures that are more advanced such as: DCell [10] or one called BCube [10] in which an approach that is server centric is imple-mented that relies on mini-switches for interconnection. None of these two ar-chitectures depend on the core layer or aggregation layer and scalability is of-fered to a huge number of servers. The servers require a specific protocol for
Figure 2. 3-Tier data center architecture, taken from [1].
S. Bani-Ahmad, S. Sa’adeh
73
routing to insure fault tolerance because they perform the routing. However, both of the two architectures are new in research area and they were not tested in real data centers, and thus, their advantages are not very clear in large data centers [1].
2. Research Scope
It is well-known that a major portion of the total amount of energy consumed by typical data center (two-tier or three-tier types) is utilized to: 1) maintain inter-connection links and network equipment operations (routers and switches); and 2) maintain processing elements (CPUs, memories and storage disks). However, the rest of the energy is lost (in fact, wasted) in the power distribution system (the wires mainly). This portion of energy is: 1) dissipated as heat; or 2) con-sumed by air-conditioning (AC) units.
This research is a simulation-based study. For that, the GreenCloud simula-tion environment is used. GreenCloud distinguishes three energy consumption components: a) computational energy consumption; b) communicational energy consumption; and c) data center infrastructure energy. We use this simulator to study the scalability of the DVFS power management technique.
Scalability is the capability of a system to adjust and perform when workload is increasing or expanding. The system in this case is the data center with its all components (Wires, processing elements, storage devices, network devices and others). The “amount of work” consisted of: 1) Computation load: represented by the amount of computation required by incoming tasks; 2) Communication load: represented by the amount of communication required by incoming tasks; the number of messages to be sent by each task as well as the size of these mes-sages; 3) Tasks load: represented by the number of incoming tasks; 4) Data load: Represented by the size of data transferred from and to a processing element by the task running on that specific processing element. Here, we distinguish be-tween Computationally Intensive Workloads (CIWs) model, Data-Intensive Workloads (DIWs) model and Balanced Workloads (BWs) model in data cen-ters [11].
Computationally Intensive Workloads (CIWs) model: produce heavy computation-load at the computing servers, but require almost no data transfers over the network. The significance of the model is to solve sophisticated compu-tational workload and one of its main concerns is the power consumption of the data center. This CIW model has the following features: • Loads heavy computations on computing servers. • Requires almost no data transfers in the interconnection network of the data
center. • CIW energy-efficient scheduling process focus on the server power con-
sumption footprint. This is achieved by grouping the workloads at the min-imum set of computing servers and route the traffic produced using a mini-mum set of network devices.
• Putting most of the switches into sleep mode will ensure the lowest power of
S. Bani-Ahmad, S. Sa’adeh
74
the data center network. Data-Intensive Workloads (DIWs): produce almost no computation-load at
the computing servers, but require heavy data transfers (over the network infra-structure of the data center). One example of DIWs is video file sharing applica-tions where each simple user request turns into a video streaming process. This model has the following features: • The interconnection network and not the computing capacity becomes a bot-
tleneck of the data center for DIWs. • Ideally, there should be a continuous feedback implemented between the
switches and the central workload network scheduler. • Based on this feedback, the network load scheduler should distribute the
workloads to the available switches taking current congestion levels of the communication links into consideration. That is; it will avoid sending work-loads over congested links even if certain server’s computing capacity will al-low accommodating the workload. This approach promises balancing the traffic in the data center network and, thus, reducing average time required for a task delivery from the core switches to the computing servers.
Balanced Workloads (BWs): In this model, the applications have both com-puting and data transfer requirements. BWs load the computing servers as well as communication links proportionally. Example BWs applications are the geo-graphic information systems which require both large graphical data transfers and heavy processing of maps. Consequently, scheduling of BWs should take into consideration both servers’ load and the load of the interconnection net-work.
The efficiency of a data center can be defined in terms of the performance de-livered per watt; this can be quantified and measured by the following two me-trics: (I) Power Usage Effectiveness (PUE) and (II) Data Center Infrastructure Efficiency (DCiE).
Both PUE and DCiE describe which portion of the totally consumed energy gets delivered to the computing servers.
In this study, the architecture chosen is a 3-tier data center. For the number of core, aggregation, and access switches, in addition to the number of servers, dif-ferent ones are chosen for each experiment. The power saving technique used is DVFS. The tests are divided into five experiments; each experiment has a fixed architecture and specific parameters that will be explained in details later in this articles.
In experiment 1, the focus is on task distribution over DC servers using two different schedulers (Green and Round Robin) for comparison purposes. In ex-periment 2, task load is studied to find the effect of data center load on energy consumption once when DVFS is enabled and once when DVFS is disabled. Ex-periments 3 and 4 are concerned with relatively light and heavy data center loads. The goal is to find the effect of using DVFS while the data center is both lightly and heavily loaded. The last experiment, experiment 5, focuses on com-putational load, the total number of instructions that will be served by the data
S. Bani-Ahmad, S. Sa’adeh
75
center (MIPS) is fixed and the tests are held over different number of tasks to find the effect of varying number of instructions per task on energy consump-tion.
3. Literature Review
In [10], the authors were concerned with the amount of energy consumed in da-ta centers, and points out that the redundancy in the data center architecture is a main contribution in data centers’ electricity consumption. Scheduling tech-niques for data center workload on switches were proposed in this work. The aim was to target the redundancy in the data center by distributing the workload over a number of servers that is as few as possible in order to put unnecessary servers in idle state and create a low-power environment in the data center. In this work, some solutions were proposed.
The authors of [12] discussed various issues in their work such as different aspects of scalability, data migration, and the management and reduction of energy and power by using DVFS. The proposed issues were studied and applied to find their effect on heavy workload energy consumption. It was shown that the mentioned approaches were helpful in workload integration and as a result, saving significant amount of energy in the environment of cloud computing while ensuring the efficiency of the performance of real-time applications.
It was stated by [1] and [13] that since data centers in general consume a great deal of energy and this energy consumption occurs in different data center components such as switches, servers, and communication links, there was a need for some kind of a simulation environment to measure energy consump-tion. In [1], an environment was presented as a simulator for data centers de-signed for cloud computing. The purpose of the simulator is to measure the energy consumption caused by all the computational and communicational components of the data center. Three data center architectures were presented in this work, namely: 2-Tier, 3-Tier, and 3-Tier high-speed architectures. DVFS is used and results were acquired for all three architectures and the results showed that when different schemes of power management were applied on both com-putational components and communicational components (such as voltage scaling and dynamic shutdown), they were applicable.
In [1], DVFS is also used to reduce energy in DCs and results are acquired for the 3-Tier DC architecture. Two different scheduling methods are used, namely: Green and Round Robin scheduler, and compared in order to find out which is more efficient when it comes to energy saving using DVFS. In addition to find-ing out the effect of light and heavy DC load on energy consumption, many tests are held in this study to find the effect of varying number of instructions per task on energy consumption while the total number of instructions served by the DC (MIPS) is fixed. In the work of [1], this aspect was not tested.
The authors of [14] have discussed different aspects of cloud computing. Their aim was to enhance computing resources utilization and minimize energy consumption in data centers. DVFS technique was used in this work for the
S. Bani-Ahmad, S. Sa’adeh
76
purpose of increasing energy management efficiency. It was shown that when the workload on the processors is heavy, resources can be managed more effec-tively when applying real-time migration. This resulted in the decrease of energy consumption and a decrease in execution time.
Similar to [14], we also study the DVFS technique. However; we also study the scalability of the DVFS and we highlight how it performs with different schedu-lers. Further, the authors in [14] have used the CloudSim simulator, while in this study, GreenCloud is used. We could successfully identify one drawback of the GreenCloud simulator.
In [15], two strategies to enhance the utilization of resources and energy con-sumption while maintaining the availability of the services were proposed. It was shown that when the workload is oscillating, this strategy becomes less effective, but was shown that the allocation strategy in private clouds demonstrated an 87% reduction in energy consumption compared to a normal cloud. It was stated in this work that saving energy increases when DVFS is applied on servers in a simulated environment.
In [16], it is explained that simulators are needed to measure energy and to test algorithms designed to maximize energy efficiency. In this work, the tools that simulators require to be able to support energy related experiments are de-scribed. The simulation that this work focused on is the DVFS from all aspects starting with the implementation of DVFS in CloudSim simulator to the ap-proach needed for it to function properly. The direct correlation between the ef-ficiency of DVFS and its hardware architecture is pointed out. Results of this work showed that the behavior of DVFS and the interior architecture of both application and hosts functioning are directly linked. Results also showed that DVFS is efficient in energy saving using fixed frequencies, while otherwise, might not be as efficient.
The simulator used in the works of [16] is CloudSim, while in this study, the simulator used is GreenCloud simulator. In their work, they attempted to find energy consumption using different workloads, not testing or focusing on sche-dulers, while in this study, energy consumption using different workloads is ex-plored in addition to testing different schedulers for efficiency.
The work of [1] highlights the effect of communication issues on energy con-sumption in data centers and therefore the need for a technique that is con-cerned with this aspect. A scheduling approach was presented, named DENS, which binds data center energy efficiency and network awareness. This approach finds a good balance between job unification and traffic pattern distribution. The importance of this methodology is particularly clear when there is intensive data load on data centers which need low computations, but the resulted data streams transmitted on the network are heavy. The results of this work acquired for a data center with a 3-Tier architecture highlights the details of how DENS me-thodology operates and its capability to preserve the needed level of quality of service for the users while sacrificing a small increase (4%) in energy consump-tion in comparison with the Green scheduler.
S. Bani-Ahmad, S. Sa’adeh
77
A team of researchers designed a product known as Energy Farm. This me-thod is concerned with server energy consumption. It optimizes server energy consumption by concentrating the functions of the data center to fewer servers every chance it is possible, according to the prediction by mathematical models of data center performance needs. This product, Energy Farm, shuts off the servers that are not needed at any given time in order to make the best use of servers. In this setup, not all computers must be running and consuming energy; in many computers, the processes are concentrated and assigned to fewer com-puters. Researchers performed many test and concluded that Energy Farm has the potential to increase resource allocation efficiency by up to 68%, which can lead to significant savings in costs and energy [17].
4. Scalability of the DVFS Power Management Technique
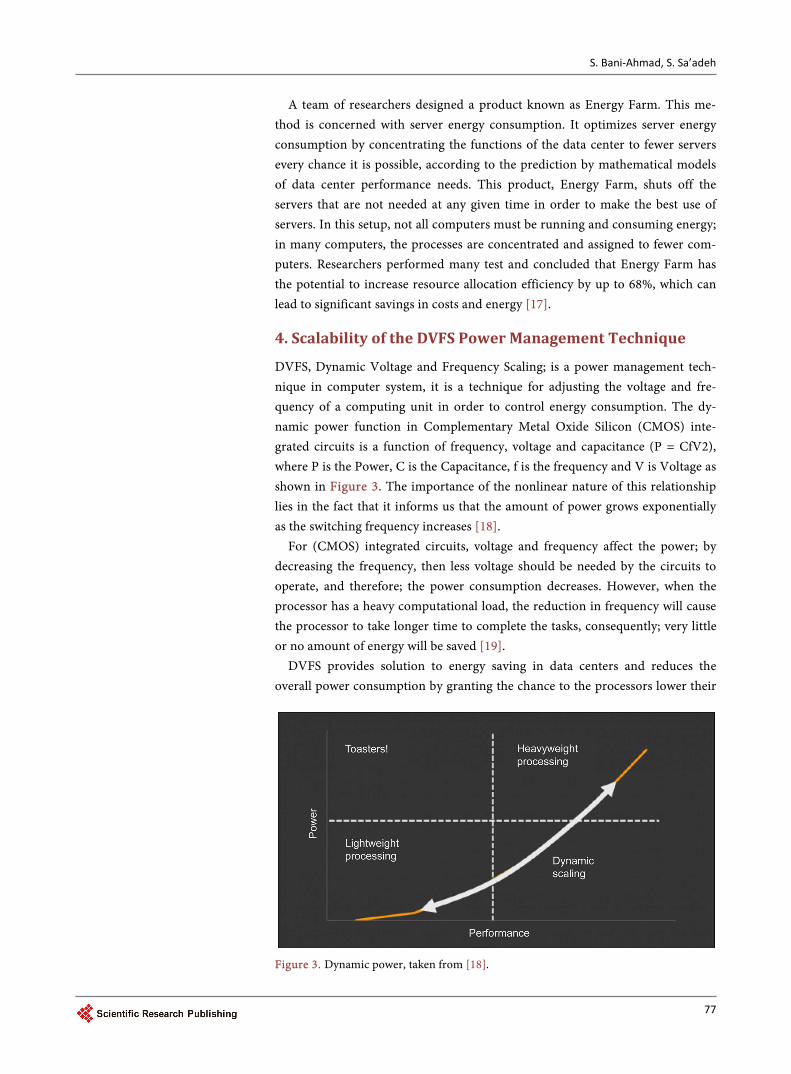
DVFS, Dynamic Voltage and Frequency Scaling; is a power management tech-nique in computer system, it is a technique for adjusting the voltage and fre-quency of a computing unit in order to control energy consumption. The dy-namic power function in Complementary Metal Oxide Silicon (CMOS) inte-grated circuits is a function of frequency, voltage and capacitance (P = CfV2), where P is the Power, C is the Capacitance, f is the frequency and V is Voltage as shown in Figure 3. The importance of the nonlinear nature of this relationship lies in the fact that it informs us that the amount of power grows exponentially as the switching frequency increases [18].
For (CMOS) integrated circuits, voltage and frequency affect the power; by decreasing the frequency, then less voltage should be needed by the circuits to operate, and therefore; the power consumption decreases. However, when the processor has a heavy computational load, the reduction in frequency will cause the processor to take longer time to complete the tasks, consequently; very little or no amount of energy will be saved [19].
DVFS provides solution to energy saving in data centers and reduces the overall power consumption by granting the chance to the processors lower their
Figure 3. Dynamic power, taken from [18].

S. Bani-Ahmad, S. Sa’adeh
78
power consumption. This is done by decreasing the supplied voltage during the idle time of the processor or the periods in which the processor has reduced workload [19]. In case the current computational workload on a processor is relatively light, it is possible to reduce the operating frequency and therefore de-crease power consumption rate of that particular processor. This technique is called Dynamic Frequency Scaling (DFS). Consequently, when the frequency is decreased, the processor does not need the same level of voltage to operate. Hence, when the frequency is reduced, the voltage can be reduced as well. The technique of adjusting voltage to a computer processor is called Dynamic Vol-tage Scaling (DVS). The Dynamic Frequency Scaling (DFS) and Dynamic Vol-tage Scaling (DVS) combined together are called Dynamic Voltage and Fre-quency Scaling (DVFS) [18].
To elaborate more on how DVFS works [20], it can be said that processors which uses DVFS can execute a task by using a set of frequency with voltage pairs, (fi, vi), when {vi < v2 < ∙∙∙ < vN} and {fi < f2 < ∙∙∙ < fN}. In CMOS based pro-cessors, the power consumption of a processor consists of two parts: (1) dynamic part that is mainly related to CMOS circuit switching energy, and (2) static part that addresses the CMOS circuit leakage power. The total power consumption (Pd) is estimated shown in Equation (1) [21].
( )
2
2d
t
t
P fv v
v vf
v
λ µ = + −
∝
(1)
where λ, f and v represent capacitance, frequency, and voltage; respectively. And where tv is a manufacturer threshold voltage. Voltage, frequency and power relation is shown in Equation (2).
( ) ( ) ( ) ( ), , , , ,i i j i d i i d j jIf f v f V then P f v P f v< < (2)
DVFS is one of most known techniques of energy reduction and applying this technique has many advantages, some are: • Reduces energy consumption by adjusting the processor frequency and sup-
plied voltage according to the workload. • It is not necessity to adapt services or software to use it. • Applying it (or not) is controlled by the user [15].
4.1. Experimental Setup and Environment
In cloud computing, computing takes place in big groups of networked servers that are remotely controlled. This allows sharing centralized data storage through the network and also allows sharing online resources. Cloud computing data center from the energy efficiency perspective is defined as a group of com-putation and communication units arranged in a way to transform the power that is consumed into computation and communication work according to us-ers’ needs. For that, the GreenCloud Simulator is used in this study [22] [23].
GreenCloud is a packet-level simulator for energy-aware cloud computing
S. Bani-Ahmad, S. Sa’adeh
79
data centers. This simulator offers a modeling for the data center units’ energy consumption (computation and communication units). In addition, GreenCloud includes a detailed investigation of the distributions of workload.
It differentiates and identifies three aspects of energy consumption; the first one is computational units’ energy consumption. The second is communica-tional units’ energy consumption, and the energy consumed by the data center infrastructure components is the third aspect [1].
GreenCloud is released under the General Public License Agreement based on Network Simulator NS2 [22] and was used to create Cloud infrastructure, It of-fers all data center components; servers as computational units and switches as communicational units. Moreover, it gives information regarding energy con-sumed by the different components of the data center and workload distribu-tions. GreenCloud is coded in C++ and uses OTcl libraries. It is called a pack-et-level simulator because when the data is transmitted between nodes then an allocation is created in the memory for a packet structure along with its asso-ciated protocol headers and all the associated processing of protocol is per-formed.
The server’s components in GreenCloud implement nodes, these nodes have 1) a limited processing speed (measured in MIPS Million of Instructions Per Second); 2) a limited size of the shared memory and storage; and 3) have various mechanisms for scheduling tasks such as: round-robin, rand-DENS, and green scheduler. In this study, both Green and Round Robin schedulers are used as a scheduling mechanism.
Data center consists of number of servers distributed over number of racks, with a fixed number of servers on each rack and a Top-of-Rack (ToR) switch connecting the servers together forming the access network. These racks are in-terconnected by aggregation switches.
In the simulated environment, various parameters are taken into considera-tion. These are: network topology, number of switches at each layer (core switches, aggregation switches and access switches), the number of servers, the number of users, the number of tasks, and the number of instruction for each task.
The GreenCloud simulator output includes: data center load (percentage), the total number of tasks submitted, the average task per server, the number of tasks rejected by the data center scheduler, the total number of failed tasks by the servers, and servers’ energy consumption.
The architecture in this study is a 3-Tier data center, which has been the most commonly addressed in research recently. Throughout the course of our expe-riments, the number of core, aggregation and access switches, and servers will vary according to each different scenario. The number of users and tasks will al-so vary in each experiment.
4.2. Data Center Schedulers
There are two schedulers implemented in GreenCloud simulator and is used in our research: the Round Robin and the Green schedulers. The Round Robin
S. Bani-Ahmad, S. Sa’adeh
80
scheduler is a simple, easy to implement, and widely known scheduler. It is a static algorithm that assigns tasks to servers in cyclical fashion and distributes tasks equivalently among servers resulting in as many working servers as needed at the same time [24] [25].
The Green scheduler assigns tasks to the lowest number of servers possible which will allow the shutdown of the idle servers to reduce energy consumed by these servers. The list of tasks received by the data center gets maintained and then the scheduler distributes these tasks over servers in such a way that they would be completed within their deadline. The efficiency of this scheduler is the main reason why it was chosen in this study. In the Green Scheduler, the task in hand is allocated to the first non-idle server that has the enough capacity among the list of available servers. When task assignment to non-idle servers could not be done, the scheduler will assign it to the next server that is idle, in this case sa-crificing energy efficiency in order to complete the task within the deadline. In the case of all servers being fully loaded and no server can be found that has the required computing capacity, then the task is rejected because it cannot meet its deadline. When a task completes, its produced output is generated and sent to the data center through the rack [26].
We experimentally evaluate the performance of both scheduling mechanisms in terms of the system’s power consumption. The aim is to find out which sche-duler is best to be used by the DC to distribute coming tasks over servers in such a way that less energy is consumed.
5. Experimental Results
In order to find the effect of using DVFS in terms of energy consumption, dif-ferent scenarios are simulated. “C1” represents the number of core switches, “C2” represents the number of aggregation switches, “C3” represents the num-ber of access switches, “H” represents the number of servers, “U” represents the number of users, and “T” represents the number of tasks in each experiment.
Experiment 1: Evaluation Green and Round Robin schedulers In this experiment, cloud tasks arriving to the DC are distributed over the
servers using either of two schedulers: the Green and the Round Robin schedu-lers. The aim is to find out which scheduler is to comparatively evaluate them in terms consumed energy.
In this experiment, the data center consists of 144 servers distributed over 3 racks, 48 servers on each rack. The racks are interconnected by 2 aggregation switches and 1 core switch. The topology of the data center has the architecture below: • Number of Core switches (C1): 1 • Number of Aggregation switches (C2): 2 • Number of Access switches (C3): 3 • Number of Racks: 3 • Number of Hosts (H): 144
The bandwidth of the interconnection links between nodes is as follows: Link
S. Bani-Ahmad, S. Sa’adeh
81
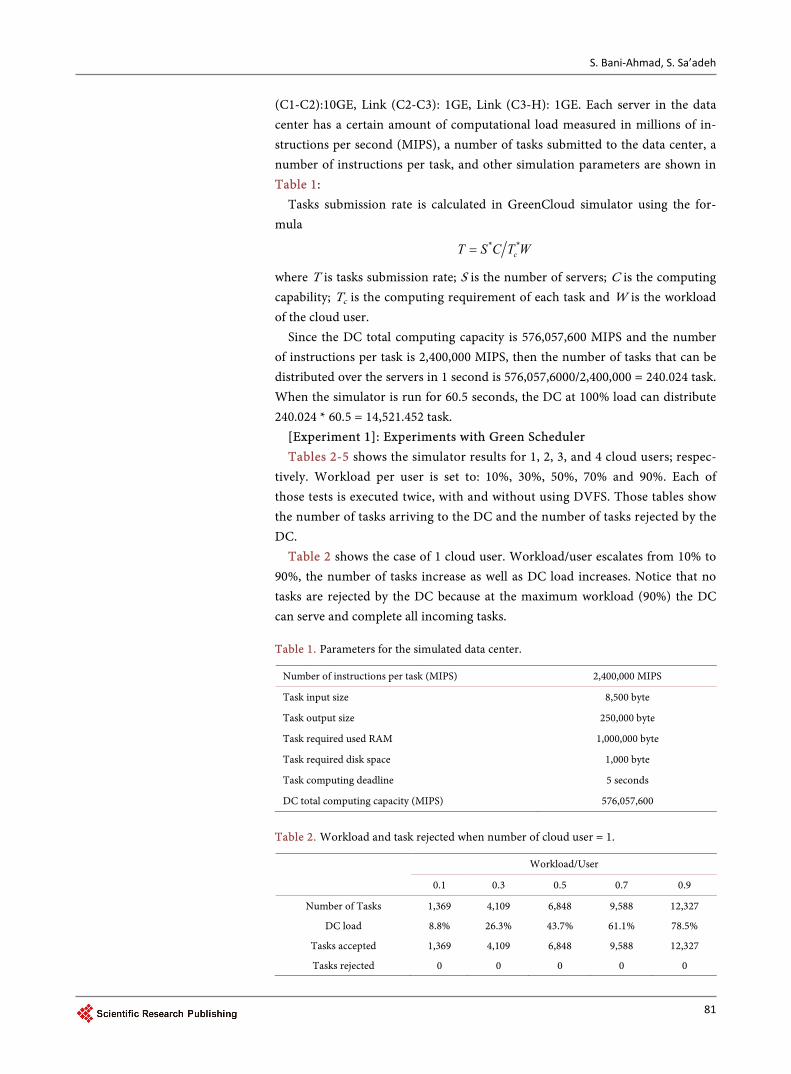
(C1-C2):10GE, Link (C2-C3): 1GE, Link (C3-H): 1GE. Each server in the data center has a certain amount of computational load measured in millions of in-structions per second (MIPS), a number of tasks submitted to the data center, a number of instructions per task, and other simulation parameters are shown in Table 1:
Tasks submission rate is calculated in GreenCloud simulator using the for-mula
* *cT S C T W=
where T is tasks submission rate; S is the number of servers; C is the computing capability; Tc is the computing requirement of each task and W is the workload of the cloud user.
Since the DC total computing capacity is 576,057,600 MIPS and the number of instructions per task is 2,400,000 MIPS, then the number of tasks that can be distributed over the servers in 1 second is 576,057,6000/2,400,000 = 240.024 task. When the simulator is run for 60.5 seconds, the DC at 100% load can distribute 240.024 * 60.5 = 14,521.452 task.
[Experiment 1]: Experiments with Green Scheduler Tables 2-5 shows the simulator results for 1, 2, 3, and 4 cloud users; respec-
tively. Workload per user is set to: 10%, 30%, 50%, 70% and 90%. Each of those tests is executed twice, with and without using DVFS. Those tables show the number of tasks arriving to the DC and the number of tasks rejected by the DC.
Table 2 shows the case of 1 cloud user. Workload/user escalates from 10% to 90%, the number of tasks increase as well as DC load increases. Notice that no tasks are rejected by the DC because at the maximum workload (90%) the DC can serve and complete all incoming tasks. Table 1. Parameters for the simulated data center.
Number of instructions per task (MIPS) 2,400,000 MIPS
Task input size 8,500 byte
Task output size 250,000 byte
Task required used RAM 1,000,000 byte
Task required disk space 1,000 byte
Task computing deadline 5 seconds
DC total computing capacity (MIPS) 576,057,600
Table 2. Workload and task rejected when number of cloud user = 1.
Workload/User
0.1 0.3 0.5 0.7 0.9
Number of Tasks 1,369 4,109 6,848 9,588 12,327
DC load 8.8% 26.3% 43.7% 61.1% 78.5%
Tasks accepted 1,369 4,109 6,848 9,588 12,327
Tasks rejected 0 0 0 0 0
S. Bani-Ahmad, S. Sa’adeh
82
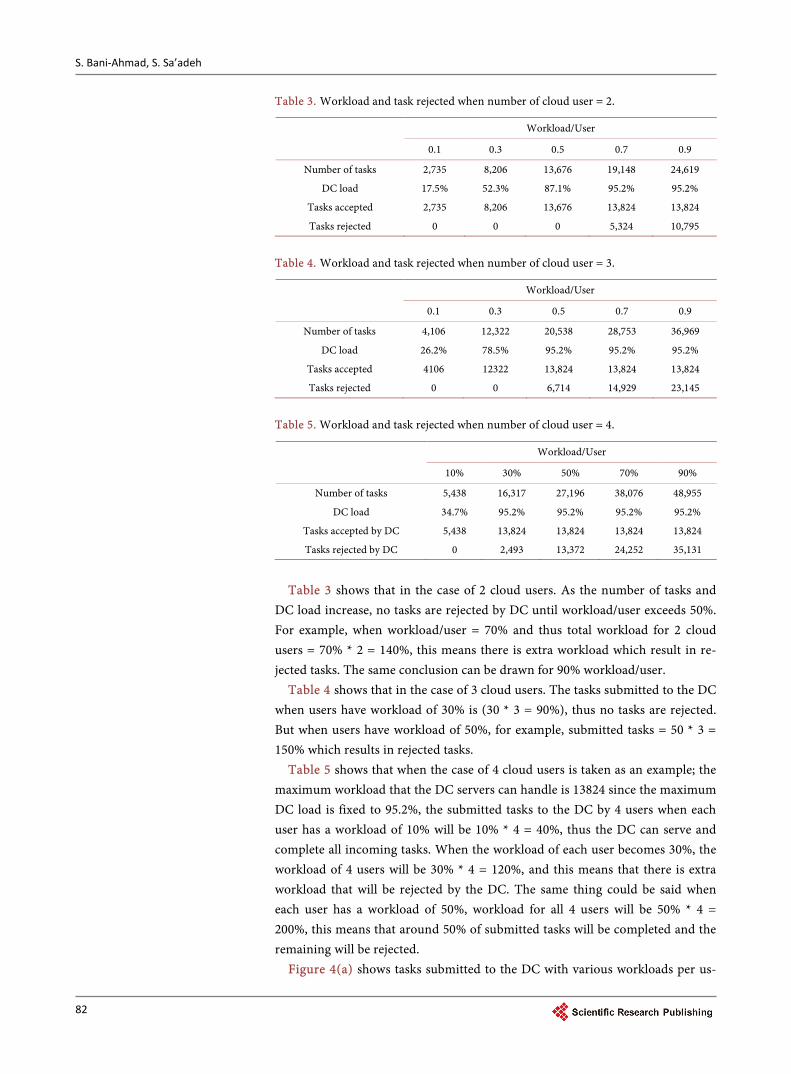
Table 3. Workload and task rejected when number of cloud user = 2.
Workload/User
0.1 0.3 0.5 0.7 0.9
Number of tasks 2,735 8,206 13,676 19,148 24,619
DC load 17.5% 52.3% 87.1% 95.2% 95.2%
Tasks accepted 2,735 8,206 13,676 13,824 13,824
Tasks rejected 0 0 0 5,324 10,795
Table 4. Workload and task rejected when number of cloud user = 3.
Workload/User
0.1 0.3 0.5 0.7 0.9
Number of tasks 4,106 12,322 20,538 28,753 36,969
DC load 26.2% 78.5% 95.2% 95.2% 95.2%
Tasks accepted 4106 12322 13,824 13,824 13,824
Tasks rejected 0 0 6,714 14,929 23,145
Table 5. Workload and task rejected when number of cloud user = 4.
Workload/User
10% 30% 50% 70% 90%
Number of tasks 5,438 16,317 27,196 38,076 48,955
DC load 34.7% 95.2% 95.2% 95.2% 95.2%
Tasks accepted by DC 5,438 13,824 13,824 13,824 13,824
Tasks rejected by DC 0 2,493 13,372 24,252 35,131
Table 3 shows that in the case of 2 cloud users. As the number of tasks and
DC load increase, no tasks are rejected by DC until workload/user exceeds 50%. For example, when workload/user = 70% and thus total workload for 2 cloud users = 70% * 2 = 140%, this means there is extra workload which result in re-jected tasks. The same conclusion can be drawn for 90% workload/user.
Table 4 shows that in the case of 3 cloud users. The tasks submitted to the DC when users have workload of 30% is (30 * 3 = 90%), thus no tasks are rejected. But when users have workload of 50%, for example, submitted tasks = 50 * 3 = 150% which results in rejected tasks.
Table 5 shows that when the case of 4 cloud users is taken as an example; the maximum workload that the DC servers can handle is 13824 since the maximum DC load is fixed to 95.2%, the submitted tasks to the DC by 4 users when each user has a workload of 10% will be 10% * 4 = 40%, thus the DC can serve and complete all incoming tasks. When the workload of each user becomes 30%, the workload of 4 users will be 30% * 4 = 120%, and this means that there is extra workload that will be rejected by the DC. The same thing could be said when each user has a workload of 50%, workload for all 4 users will be 50% * 4 = 200%, this means that around 50% of submitted tasks will be completed and the remaining will be rejected.
Figure 4(a) shows tasks submitted to the DC with various workloads per us-

S. Bani-Ahmad, S. Sa’adeh
83
ers. Figure 4(b) displays completed tasks in comparison with rejected tasks among tasks submitted to the DC. A DC has a certain amount of load that it can handle within a specific period of time, the number of rejected tasks by the DC is calculated by (Tasks submitted - Tasks completed), any tasks above the maxi-mum DC load will be rejected.
It can be concluded that the data center completes all coming tasks in a cer-tain amount of time within its maximum capability, and when the submitted tasks by all cloud users exceeds this maximum load, the number of completed tasks will be the highest limit of the DC load, the remaining tasks will be re-jected. Figure 4(b) that the number of completed tasks is always 13824 in all cases where submitted tasks exceed the maximum DC load, which means that the maximum capacity for the data center = 13824.
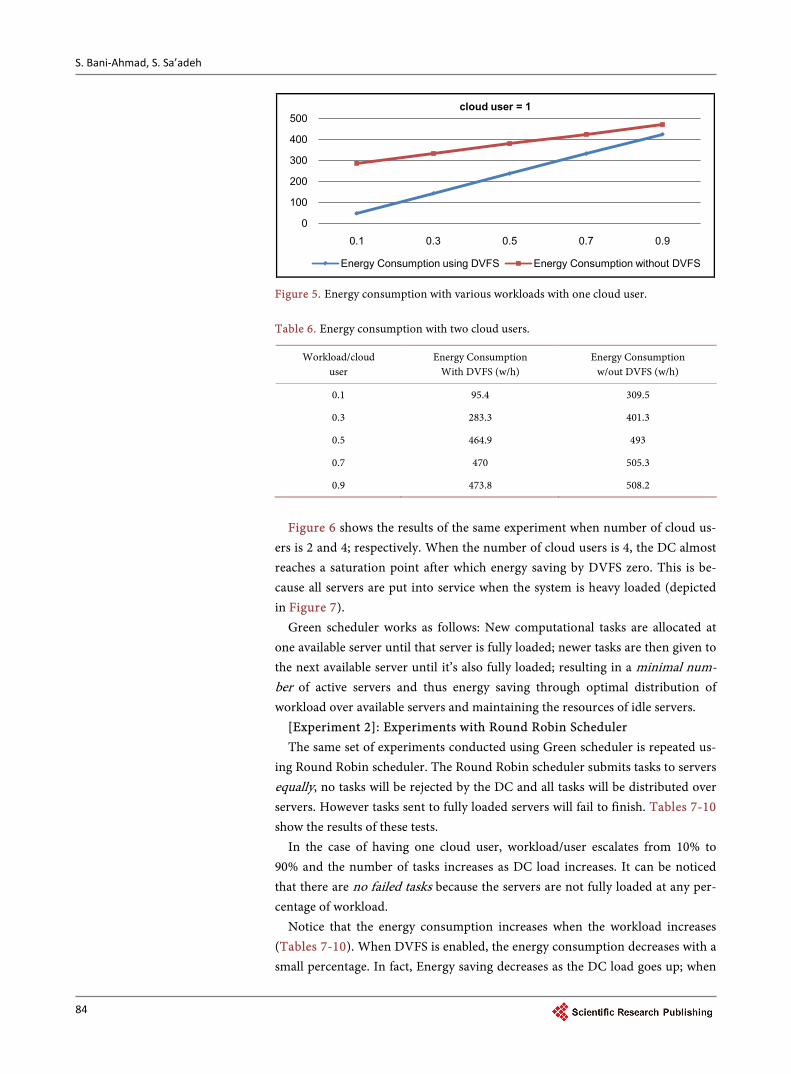
Figure 5 shows the energy consumption of the DC for various workloads for 1 cloud user. Energy consumption increases as workload increases. In the case of enabling DVFS, notice that energy saving decreases as the DC load goes up. For example, when the workload/user is 10% (i.e., light load), the energy saving per-centage using DVFS is 83%; while when the workload/user is 90% (heavy load), the energy saving using DVFS is 9.7%.
Table 6 shows similar results in the case of 2 cloud users. Data center seems to be fully loaded at workload of 50%. Energy consumption does not noticeably change at load higher than this threshold even when DVFS used because the servers rejects new tasks after this threshold value.
(a)
(b)
Figure 4. (a) (Above): Tasks submitted to the DC with various workloads. (b) (Below): Completed vs. Rejected tasks submitted to the data center with various workloads.
0
10000
20000
30000
40000
50000
60000
0.1 0.3 0.5 0.7 0.9
Num
ber o
f tas
ks s
ubm
itted
to
DC
workload/user
1 user
2 users
3 users
4 users
15%49%
64%72%
0100002000030000400005000060000
0.1 0.3 0.5 0.7 0.9workload/user
total number of tasks
Tasks completed
Tasks rejected on DC scheduler
S. Bani-Ahmad, S. Sa’adeh
84
Figure 5. Energy consumption with various workloads with one cloud user. Table 6. Energy consumption with two cloud users.
Workload/cloud user
Energy Consumption With DVFS (w/h)
Energy Consumption w/out DVFS (w/h)
0.1 95.4 309.5
0.3 283.3 401.3
0.5 464.9 493
0.7 470 505.3
0.9 473.8 508.2
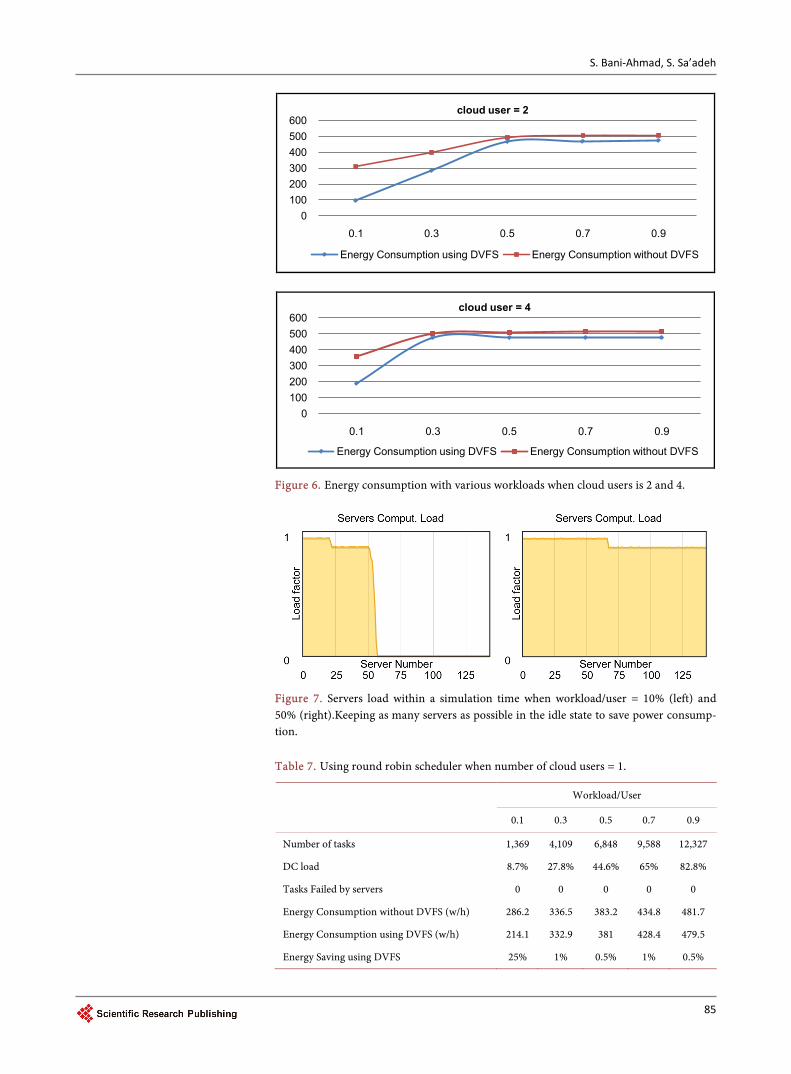
Figure 6 shows the results of the same experiment when number of cloud us-
ers is 2 and 4; respectively. When the number of cloud users is 4, the DC almost reaches a saturation point after which energy saving by DVFS zero. This is be-cause all servers are put into service when the system is heavy loaded (depicted in Figure 7).
Green scheduler works as follows: New computational tasks are allocated at one available server until that server is fully loaded; newer tasks are then given to the next available server until it’s also fully loaded; resulting in a minimal num-ber of active servers and thus energy saving through optimal distribution of workload over available servers and maintaining the resources of idle servers.
[Experiment 2]: Experiments with Round Robin Scheduler The same set of experiments conducted using Green scheduler is repeated us-
ing Round Robin scheduler. The Round Robin scheduler submits tasks to servers equally, no tasks will be rejected by the DC and all tasks will be distributed over servers. However tasks sent to fully loaded servers will fail to finish. Tables 7-10 show the results of these tests.
In the case of having one cloud user, workload/user escalates from 10% to 90% and the number of tasks increases as DC load increases. It can be noticed that there are no failed tasks because the servers are not fully loaded at any per-centage of workload.
Notice that the energy consumption increases when the workload increases (Tables 7-10). When DVFS is enabled, the energy consumption decreases with a small percentage. In fact, Energy saving decreases as the DC load goes up; when
0
100
200
300
400
500
0.1 0.3 0.5 0.7 0.9
cloud user = 1
Energy Consumption using DVFS Energy Consumption without DVFS
S. Bani-Ahmad, S. Sa’adeh
85
Figure 6. Energy consumption with various workloads when cloud users is 2 and 4.
Figure 7. Servers load within a simulation time when workload/user = 10% (left) and 50% (right).Keeping as many servers as possible in the idle state to save power consump-tion. Table 7. Using round robin scheduler when number of cloud users = 1.
Workload/User
0.1 0.3 0.5 0.7 0.9
Number of tasks 1,369 4,109 6,848 9,588 12,327
DC load 8.7% 27.8% 44.6% 65% 82.8%
Tasks Failed by servers 0 0 0 0 0
Energy Consumption without DVFS (w/h) 286.2 336.5 383.2 434.8 481.7
Energy Consumption using DVFS (w/h) 214.1 332.9 381 428.4 479.5
Energy Saving using DVFS 25% 1% 0.5% 1% 0.5%
0100200300400500600
0.1 0.3 0.5 0.7 0.9
cloud user = 2
Energy Consumption using DVFS Energy Consumption without DVFS
0100200300400500600
0.1 0.3 0.5 0.7 0.9
cloud user = 4
Energy Consumption using DVFS Energy Consumption without DVFS
S. Bani-Ahmad, S. Sa’adeh
86
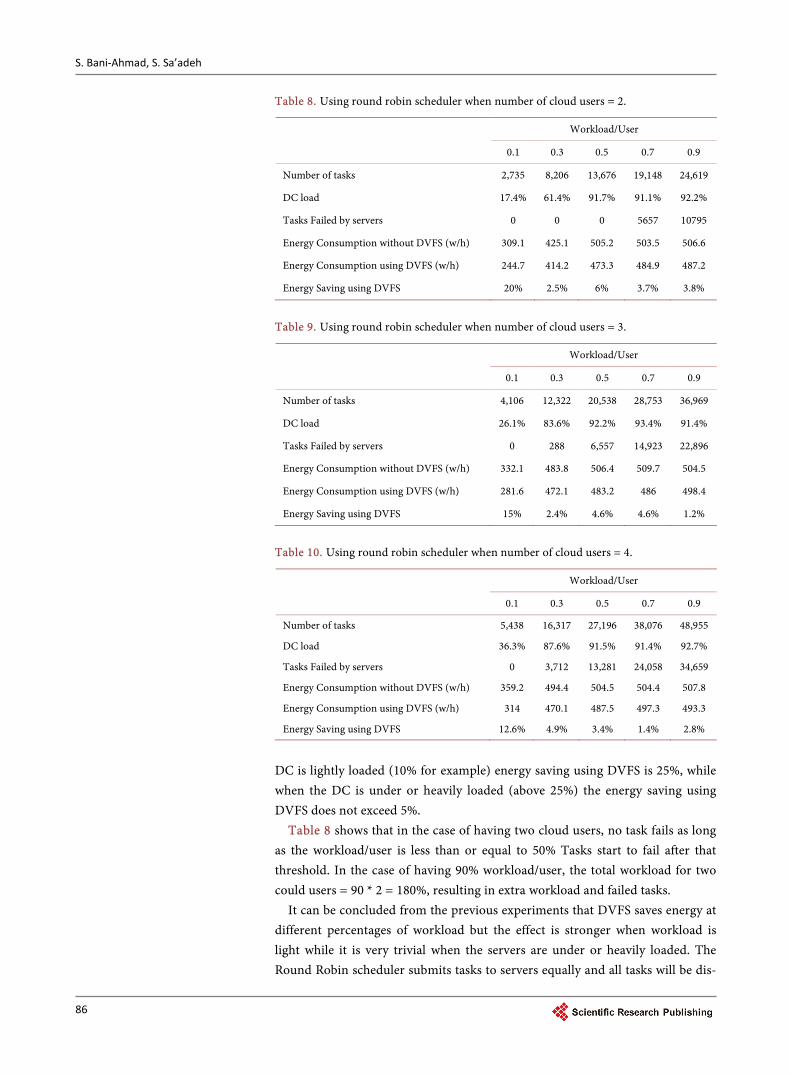
Table 8. Using round robin scheduler when number of cloud users = 2.
Workload/User
0.1 0.3 0.5 0.7 0.9
Number of tasks 2,735 8,206 13,676 19,148 24,619
DC load 17.4% 61.4% 91.7% 91.1% 92.2%
Tasks Failed by servers 0 0 0 5657 10795
Energy Consumption without DVFS (w/h) 309.1 425.1 505.2 503.5 506.6
Energy Consumption using DVFS (w/h) 244.7 414.2 473.3 484.9 487.2
Energy Saving using DVFS 20% 2.5% 6% 3.7% 3.8%
Table 9. Using round robin scheduler when number of cloud users = 3.
Workload/User
0.1 0.3 0.5 0.7 0.9
Number of tasks 4,106 12,322 20,538 28,753 36,969
DC load 26.1% 83.6% 92.2% 93.4% 91.4%
Tasks Failed by servers 0 288 6,557 14,923 22,896
Energy Consumption without DVFS (w/h) 332.1 483.8 506.4 509.7 504.5
Energy Consumption using DVFS (w/h) 281.6 472.1 483.2 486 498.4
Energy Saving using DVFS 15% 2.4% 4.6% 4.6% 1.2%
Table 10. Using round robin scheduler when number of cloud users = 4.
Workload/User
0.1 0.3 0.5 0.7 0.9
Number of tasks 5,438 16,317 27,196 38,076 48,955
DC load 36.3% 87.6% 91.5% 91.4% 92.7%
Tasks Failed by servers 0 3,712 13,281 24,058 34,659
Energy Consumption without DVFS (w/h) 359.2 494.4 504.5 504.4 507.8
Energy Consumption using DVFS (w/h) 314 470.1 487.5 497.3 493.3
Energy Saving using DVFS 12.6% 4.9% 3.4% 1.4% 2.8%
DC is lightly loaded (10% for example) energy saving using DVFS is 25%, while when the DC is under or heavily loaded (above 25%) the energy saving using DVFS does not exceed 5%.
Table 8 shows that in the case of having two cloud users, no task fails as long as the workload/user is less than or equal to 50% Tasks start to fail after that threshold. In the case of having 90% workload/user, the total workload for two could users = 90 * 2 = 180%, resulting in extra workload and failed tasks.
It can be concluded from the previous experiments that DVFS saves energy at different percentages of workload but the effect is stronger when workload is light while it is very trivial when the servers are under or heavily loaded. The Round Robin scheduler submits tasks to servers equally and all tasks will be dis-
S. Bani-Ahmad, S. Sa’adeh
87
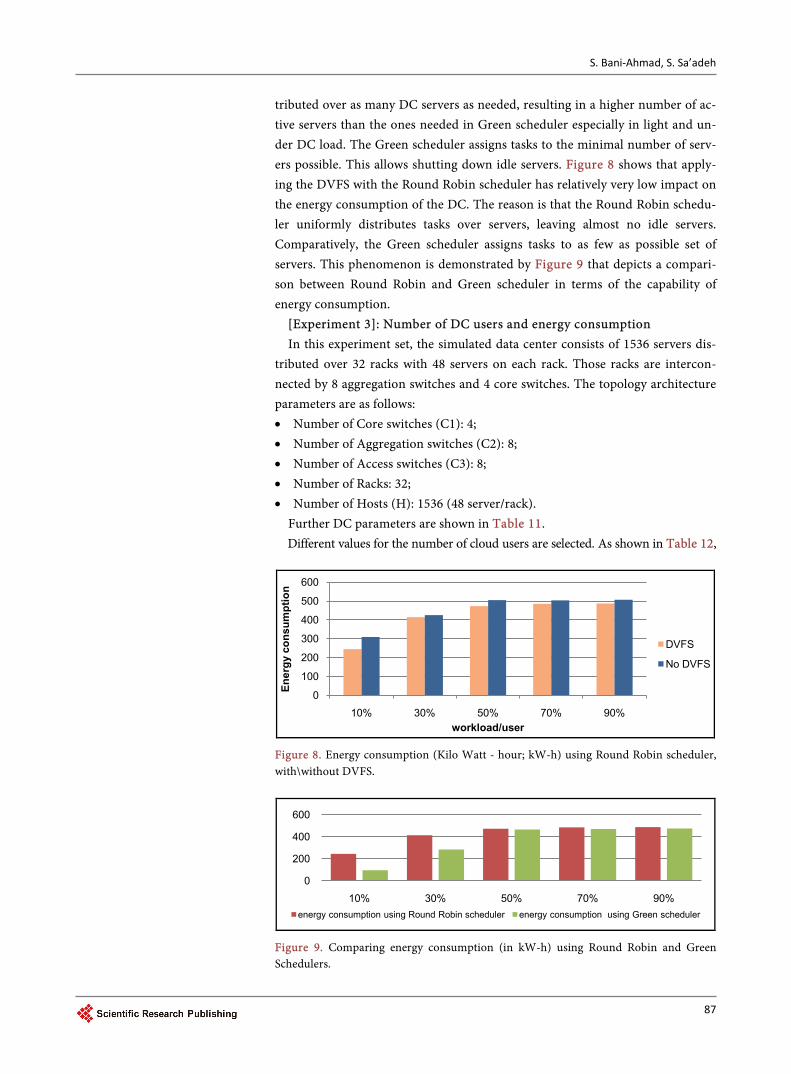
tributed over as many DC servers as needed, resulting in a higher number of ac-tive servers than the ones needed in Green scheduler especially in light and un-der DC load. The Green scheduler assigns tasks to the minimal number of serv-ers possible. This allows shutting down idle servers. Figure 8 shows that apply-ing the DVFS with the Round Robin scheduler has relatively very low impact on the energy consumption of the DC. The reason is that the Round Robin schedu-ler uniformly distributes tasks over servers, leaving almost no idle servers. Comparatively, the Green scheduler assigns tasks to as few as possible set of servers. This phenomenon is demonstrated by Figure 9 that depicts a compari-son between Round Robin and Green scheduler in terms of the capability of energy consumption.
[Experiment 3]: Number of DC users and energy consumption In this experiment set, the simulated data center consists of 1536 servers dis-
tributed over 32 racks with 48 servers on each rack. Those racks are intercon-nected by 8 aggregation switches and 4 core switches. The topology architecture parameters are as follows: • Number of Core switches (C1): 4; • Number of Aggregation switches (C2): 8; • Number of Access switches (C3): 8; • Number of Racks: 32; • Number of Hosts (H): 1536 (48 server/rack).
Further DC parameters are shown in Table 11. Different values for the number of cloud users are selected. As shown in Table 12,
Figure 8. Energy consumption (Kilo Watt - hour; kW-h) using Round Robin scheduler, with\without DVFS.
Figure 9. Comparing energy consumption (in kW-h) using Round Robin and Green Schedulers.
0
100
200
300
400
500
600
10% 30% 50% 70% 90%
Ener
gy c
onsu
mpt
ion
workload/user
DVFS
No DVFS
0
200
400
600
10% 30% 50% 70% 90%energy consumption using Round Robin scheduler energy consumption using Green scheduler
S. Bani-Ahmad, S. Sa’adeh
88
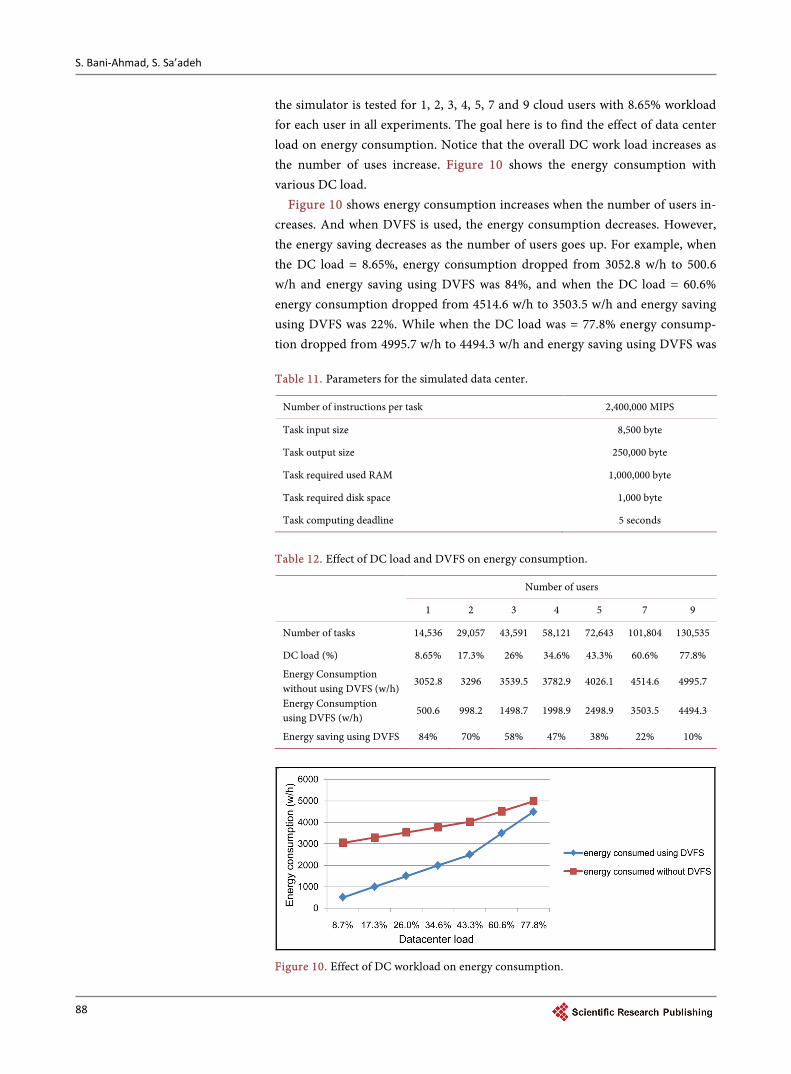
the simulator is tested for 1, 2, 3, 4, 5, 7 and 9 cloud users with 8.65% workload for each user in all experiments. The goal here is to find the effect of data center load on energy consumption. Notice that the overall DC work load increases as the number of uses increase. Figure 10 shows the energy consumption with various DC load.
Figure 10 shows energy consumption increases when the number of users in-creases. And when DVFS is used, the energy consumption decreases. However, the energy saving decreases as the number of users goes up. For example, when the DC load = 8.65%, energy consumption dropped from 3052.8 w/h to 500.6 w/h and energy saving using DVFS was 84%, and when the DC load = 60.6% energy consumption dropped from 4514.6 w/h to 3503.5 w/h and energy saving using DVFS was 22%. While when the DC load was = 77.8% energy consump-tion dropped from 4995.7 w/h to 4494.3 w/h and energy saving using DVFS was
Table 11. Parameters for the simulated data center.
Number of instructions per task 2,400,000 MIPS
Task input size 8,500 byte
Task output size 250,000 byte
Task required used RAM 1,000,000 byte
Task required disk space 1,000 byte
Task computing deadline 5 seconds
Table 12. Effect of DC load and DVFS on energy consumption.
Number of users
1 2 3 4 5 7 9
Number of tasks 14,536 29,057 43,591 58,121 72,643 101,804 130,535
DC load (%) 8.65% 17.3% 26% 34.6% 43.3% 60.6% 77.8%
Energy Consumption without using DVFS (w/h)
3052.8 3296 3539.5 3782.9 4026.1 4514.6 4995.7
Energy Consumption using DVFS (w/h)
500.6 998.2 1498.7 1998.9 2498.9 3503.5 4494.3
Energy saving using DVFS 84% 70% 58% 47% 38% 22% 10%
Figure 10. Effect of DC workload on energy consumption.
S. Bani-Ahmad, S. Sa’adeh
89
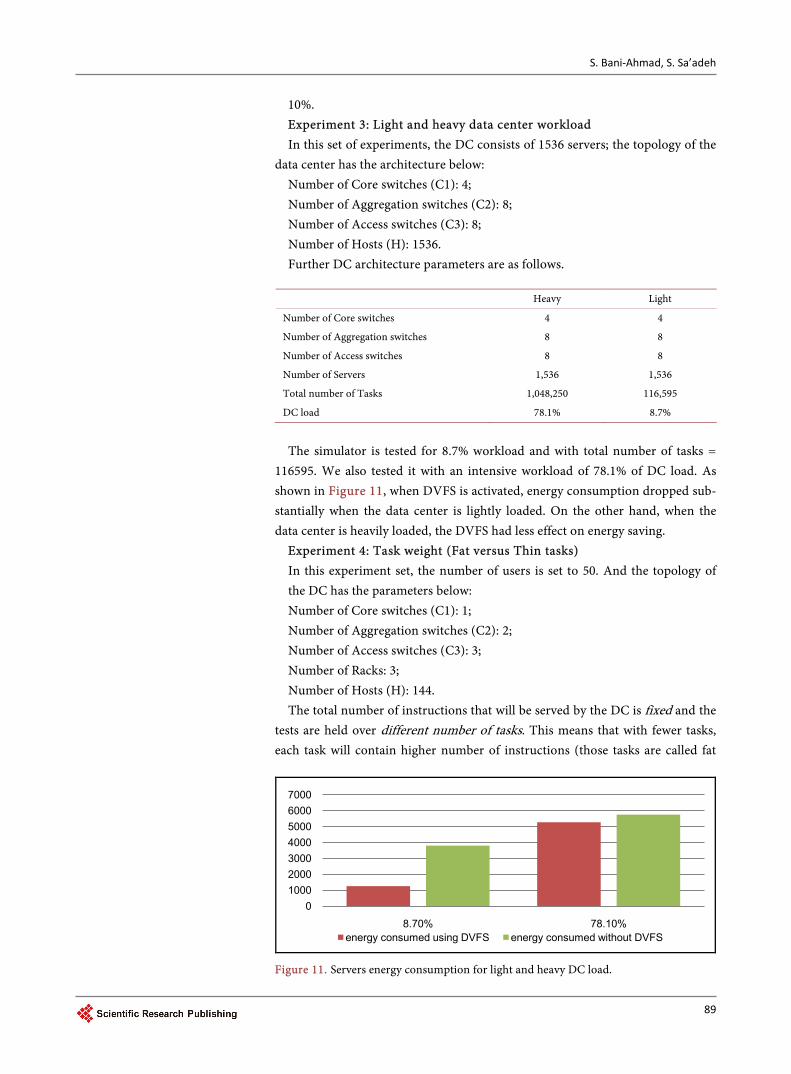
10%. Experiment 3: Light and heavy data center workload In this set of experiments, the DC consists of 1536 servers; the topology of the
data center has the architecture below: Number of Core switches (C1): 4; Number of Aggregation switches (C2): 8; Number of Access switches (C3): 8; Number of Hosts (H): 1536. Further DC architecture parameters are as follows.
Heavy Light
Number of Core switches 4 4
Number of Aggregation switches 8 8
Number of Access switches 8 8
Number of Servers 1,536 1,536
Total number of Tasks 1,048,250 116,595
DC load 78.1% 8.7%
The simulator is tested for 8.7% workload and with total number of tasks = 116595. We also tested it with an intensive workload of 78.1% of DC load. As shown in Figure 11, when DVFS is activated, energy consumption dropped sub-stantially when the data center is lightly loaded. On the other hand, when the data center is heavily loaded, the DVFS had less effect on energy saving.
Experiment 4: Task weight (Fat versus Thin tasks) In this experiment set, the number of users is set to 50. And the topology of the DC has the parameters below: Number of Core switches (C1): 1; Number of Aggregation switches (C2): 2; Number of Access switches (C3): 3; Number of Racks: 3; Number of Hosts (H): 144. The total number of instructions that will be served by the DC is fixed and the
tests are held over different number of tasks. This means that with fewer tasks, each task will contain higher number of instructions (those tasks are called fat
Figure 11. Servers energy consumption for light and heavy DC load.
01000200030004000500060007000
8.70% 78.10%energy consumed using DVFS energy consumed without DVFS
S. Bani-Ahmad, S. Sa’adeh
90
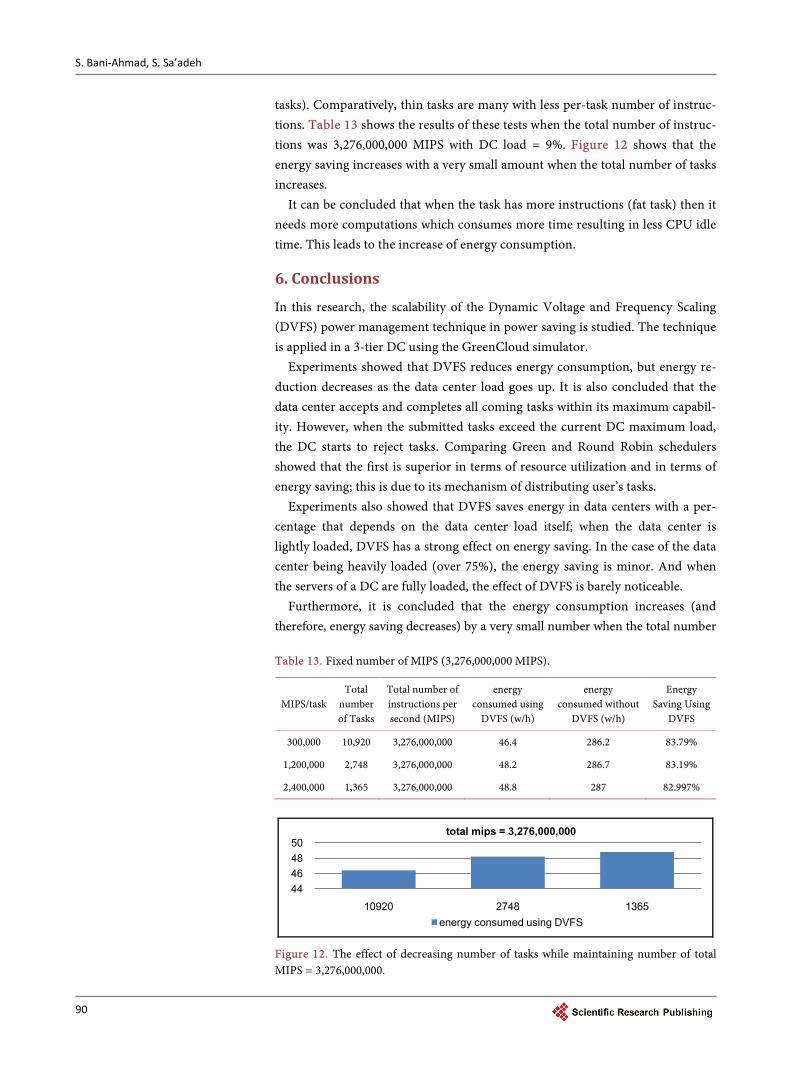
tasks). Comparatively, thin tasks are many with less per-task number of instruc-tions. Table 13 shows the results of these tests when the total number of instruc-tions was 3,276,000,000 MIPS with DC load = 9%. Figure 12 shows that the energy saving increases with a very small amount when the total number of tasks increases.
It can be concluded that when the task has more instructions (fat task) then it needs more computations which consumes more time resulting in less CPU idle time. This leads to the increase of energy consumption.
6. Conclusions
In this research, the scalability of the Dynamic Voltage and Frequency Scaling (DVFS) power management technique in power saving is studied. The technique is applied in a 3-tier DC using the GreenCloud simulator.
Experiments showed that DVFS reduces energy consumption, but energy re-duction decreases as the data center load goes up. It is also concluded that the data center accepts and completes all coming tasks within its maximum capabil-ity. However, when the submitted tasks exceed the current DC maximum load, the DC starts to reject tasks. Comparing Green and Round Robin schedulers showed that the first is superior in terms of resource utilization and in terms of energy saving; this is due to its mechanism of distributing user’s tasks.
Experiments also showed that DVFS saves energy in data centers with a per-centage that depends on the data center load itself; when the data center is lightly loaded, DVFS has a strong effect on energy saving. In the case of the data center being heavily loaded (over 75%), the energy saving is minor. And when the servers of a DC are fully loaded, the effect of DVFS is barely noticeable.
Furthermore, it is concluded that the energy consumption increases (and therefore, energy saving decreases) by a very small number when the total number Table 13. Fixed number of MIPS (3,276,000,000 MIPS).
MIPS/task Total
number of Tasks
Total number of instructions per second (MIPS)
energy consumed using
DVFS (w/h)
energy consumed without
DVFS (w/h)
Energy Saving Using
DVFS
300,000 10,920 3,276,000,000 46.4 286.2 83.79%
1,200,000 2,748 3,276,000,000 48.2 286.7 83.19%
2,400,000 1,365 3,276,000,000 48.8 287 82.997%
Figure 12. The effect of decreasing number of tasks while maintaining number of total MIPS = 3,276,000,000.
44464850
10920 2748 1365
total mips = 3,276,000,000
energy consumed using DVFS
S. Bani-Ahmad, S. Sa’adeh
91
of tasks decreases and the number of instructions per task increases. In addition, it is concluded that when the task has more instructions, then it needs more computations and that leads to the increase of energy consumption. One of the main conclusions is that DVFS reduces energy consumption in all cases, but the amount of saved energy varies according to DC workload.
It is well-known that, although simulators are quite useful in modeling com-plex systems, they are limited in their ability to create fully-realistic and accurate models especially with system of relatively high complexity. A key consideration in modeling the energy efficiency of a complex network is not only the task load at a given period of time, but quite crucially, what constitutes the load. For in-stance, multimedia programs are quite demanding as far as computing power is concerned. Hence, a key weakness is the inability of the simulations to address task-specific concerns which may influence experimental results. Following this specific observation also, we noticed that one drawback of the GreenCloud si-mulation environment is that it does not take into consideration process migra-tion and context-switching times when switching between ready processes in the system queue. It would be interesting to re-execute the same set of experiments we conducted in this research using another, probably more accurate, simulation environment. Examples are: CloudSim, CloudAnalyst, Cloudshed, etc.
References [1] Kliazovich, D., Bouvry, P. and Khan, S.U. (2010) DENS: Data Center Energy-Effi-
cient Network-Aware Scheduling. Proceedings of Green Computing and Commu-nications (GreenCom), 2010 IEEE/ACM Int’l Conference on & Int’l Conference on Cyber, Physical and Social Computing (CPSCom), Hangzhou, 18-20 December 2010, 69-75. https://doi.org/10.1109/greencom-cpscom.2010.31
[2] Chen, G., Huang, K. and Knoll, A. (2014) Energy Optimization for Real-Time Mul-tiprocessor System-on-Chip with Optimal DVFS and DPM Combination. ACM Transactions on Embedded Computing Systems, 13, Article No. 111. https://doi.org/10.1145/2567935
[3] Emerson Network Power (2010) Energy Logic: Reducing Data Center Energy Con-sumption by Creating Savings That Cascade Across Systems. A White Paper from the Experts in Business-Critical Continuity. http://www.vinsure.in/pdf/resources/energy-efficient-DC-By-ENP.pdf
[4] Code of Conduct on Data Centres Energy Efficiency (2008) Joint Research Centre, Institute for Energy, Version 1.0.
[5] Brown, R. (2008) Report to Congress on Server and Data Center Energy Efficiency: Public Law 109-431. Lawrence Berkeley National Laboratory, Berkeley.
[6] Cisco (2011) Data Center Power and Cooling. White Paper.
[7] Cisco Systems (2007) Cisco Data Center Infrastructure 2.5 Design Guide. Cisco Va-lidated Design I.
[8] SysKonnect GmbH (2002) Link Aggregation According to IEEE 802.3ad. White Paper, IEEE, V1.10. http://cs.uccs.edu/~scold/doc/linkage%20aggregation.pdf
[9] Farrington, N., Rubow, E. and Vahdat, A. (2009) Data Center Switch Architecture in the Age of Merchant Silicon. Proceedings of the 2009 17th IEEE Symposium on High Performance Interconnects, Washington DC, 25-27 August 2009, 93-102.
S. Bani-Ahmad, S. Sa’adeh
92
https://doi.org/10.1109/HOTI.2009.11
[10] Shuja, J., Bilal, K., Hayat, K., Madani, S.A., Khan, S.U. and Shahzad, S. (2012) Ener-gy-Efficient Data Centers. Computing, 94, 973-994. https://doi.org/10.1007/s00607-012-0211-2
[11] Kliazovich, D., Bouvry, P. and Khan, S.U. (2013) Simulation and Performance Analysis of Data Intensive and Workload Intensive Cloud Computing Data Centers. In: Kachris, C., Bergman, K. and Tomkos, I., Eds., Optical Interconnects for Future Data Center Networks, Chapter 4, Springer-Verlag, New York, 47-63.
[12] Kaur, P. and Kaur, P.D. (2015) Energy Efficient Resource Allocation for Heteroge-neous Cloud Workloads. 2nd International Conference on Computing for Sustain-able Global Development (INDIACom), New Delhi, 1319-1322.
[13] Gill, B.S., Gill, S.K. and Jain, P. (2013) Analysis of Energy Aware Data Center Using Green Cloud Simulator in Cloud Computing. International Journal of Computer Trends and Technology, 5, 154-159.
[14] Patel, V.J. and Bheda, H.A. (2014) Reducing Energy Consumption with DVFS for Real-Time Services in Cloud Computing.16, 53-57.
[15] Geronimo, G.A., Werner, J. and Weingartner, R. (2014) Provisioning, Resource Al-location, and DVFS in Green Clouds. International Journal on Advances in Net-works and Services, 7, 108-117.
[16] Kaur, A., Gupta, D. and Verma, D.K. (2014) Making Cloud Computing More Effi-cient. Vol. 4.
[17] Ricciardi, S., Careglio, D., Santos-Boada, G., Solé-Pareta, J., Fiore, U. and Palmieri, F. (2011) Saving Energy in Data Center Infrastructures. Proceedings of Data Com-pression, Communications and Processing, Palinuro, 21-24 June 2011, 265-270. https://doi.org/10.1109/CCP.2011.9
[18] Benson, M. (2012) Software Thermal Management with TI OMAP Processors. Electronic Engineering Journal. http://www.eejournal.com/archives/articles/20120802-logicpd/
[19] Mishra, A. and Khare, N. (2015) Analysis of DVFS Techniques for Improving the GPU Energy Efficiency. Open Journal of Energy Efficiency, 4, 77-86. https://doi.org/10.4236/ojee.2015.44009
[20] Rizvandi, N.B., Taheri, J. and Zomaya, A.Y. (2011) Some Observations on Optimal Frequency Selection in DVFS-Based Energy Consumption Minimization. Journal of Parallel and Distributed Computing, 71, 1154-1164. https://doi.org/10.1016/j.jpdc.2011.01.004
[21] Mochocki, B., Hu, X.S. and Quan, G. (2004) A Unified Approach to Variable Vol-tage Scheduling for Non Ideal DVS Processors. IEEE Transactions on CAD of Inte-grated Circuits and Systems, 23, 1370-1377. https://doi.org/10.1109/TCAD.2004.833602
[22] GreenCloud (2016). https://greencloud.gforge.uni.lu/
[23] Kliazovich, D., Bouvry, P. and Khan, S.U.J. (2012) GreenCloud: A PacketLevel Si-mulator of Energy-Aware Cloud Computing Data Centers. The Journal of Super-computing, 62, 1263. https://doi.org/10.1007/s11227-010-0504-1
[24] Mohapatra, S., Mohanty, S. and Rekha, S. (2013) Analysis of Different Variants in Round Robin Algorithms for Load Balancing in Cloud Computing. International Journal of Computer Applications, 69, 17-21. https://doi.org/10.5120/12103-8221
[25] Pasha, N., Agarwal, A. and Rastogi, R. (2014) Round Robin Approach for VM Load Balancing Algorithm in Cloud Computing Environment. International Journal of
S. Bani-Ahmad, S. Sa’adeh
93
Advanced Research in Computer Science and Software Engineering, 4, 34-39.
[26] Premalatha, M.S. and Ramakrishnan, B. (2014) Green Scheduling of Bag-of-Tasks Applications in Cloud Data Center Using GreenCloud Simulator. Journal of Emerging Technologies in Web Intelligence, 6, 273-279.
Submit or recommend next manuscript to SCIRP and we will provide best service for you:
Accepting pre-submission inquiries through Email, Facebook, LinkedIn, Twitter, etc. A wide selection of journals (inclusive of 9 subjects, more than 200 journals) Providing 24-hour high-quality service User-friendly online submission system Fair and swift peer-review system Efficient typesetting and proofreading procedure Display of the result of downloads and visits, as well as the number of cited articles Maximum dissemination of your research work
Submit your manuscript at: http://papersubmission.scirp.org/ Or contact [email protected]