PowerPoint Presentation · 2019-12-19 · Central SoMa The Hub Mission Bay Pier 70 Potrero HOPE SF...
22
Transcript of PowerPoint Presentation · 2019-12-19 · Central SoMa The Hub Mission Bay Pier 70 Potrero HOPE SF...


2050 Change in SF
Population and
Employment Density
Based on adopted plans,
policies, and entitlements
Treasure Island
Transit Center District Plan
Central SoMa
The Hub
Mission Bay
Pier 70
Potrero HOPE SF
Potrero Power Station
Parkmerced
Balboa Reservoir
Schlage Lock
HOPE SF Sunnydale
Executive Park
Candlestick Point
Hunters Point Shipyard
India Basin
HOPE SF Hunters View
Mission Rock

0 200,000 400,000 600,000 800,000 1,000,000 1,200,000
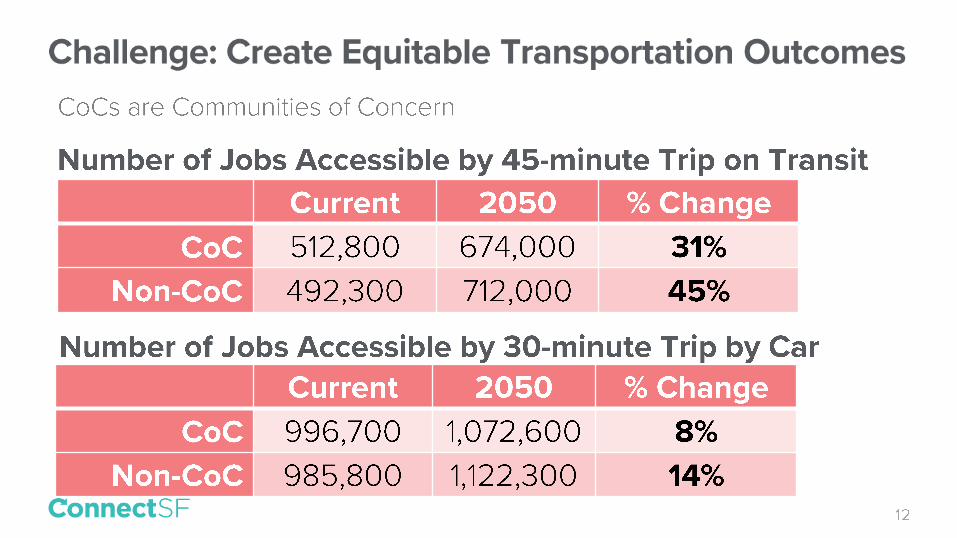
45- minute transit trip
30- minute auto trip


0
200,000
400,000
600,000
800,000
1,000,000
1,200,000
1,400,000
1,600,000
Drive Alone HOV2 HOV3+ TNC… Transit Walk Bike School BusTNCs (Uber, Lyft)
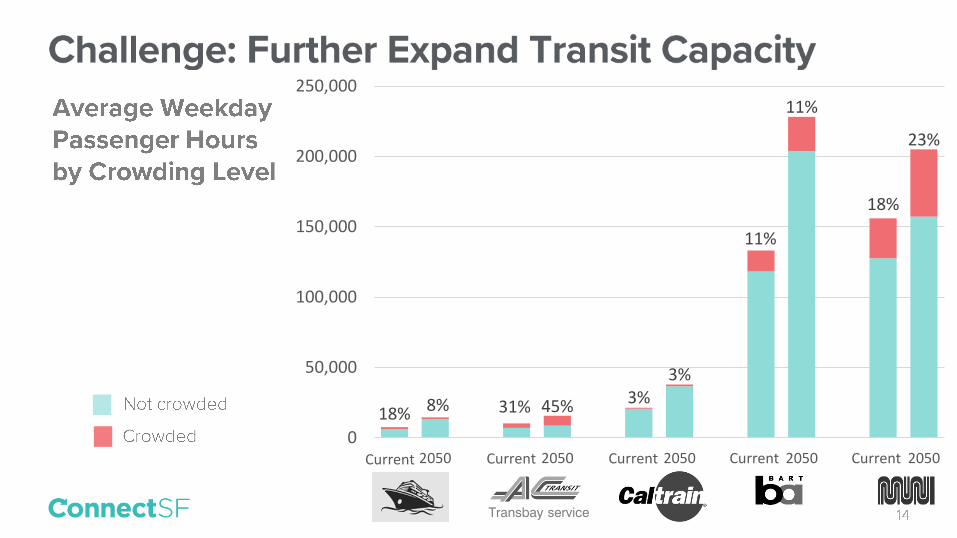
18% 8% 31% 45% 3%3%
11%
11%
18%
23%
0
50,000
100,000
150,000
200,000
250,000
2015 2050 2015 2050 2015 2050 2015 2050 2015 2050
Transbay service
Current Current Current Current Current