Powering Performance in Global Transportation
139
CAI International, Inc. 2018 Annual Report Powering Performance in Global Transportation
Transcript of Powering Performance in Global Transportation

CAI International, Inc. 2018 Annual Report
Powering Performance in Global Transportation

CAI is a leading global transportation company offering intermodal container leasing and sales, rail leasing and operations, and global logistics services. Established in 1989 and headquartered in San Francisco, CAI has grown into a leading expert in intermodal transportation, international shipping, and container sales and leasing. With offices around the world and a broad network of agents, depots, and carriers, CAI serves hundreds of the world’s leading shipping lines, shippers, and logistics users.
A powerful force. With an integrated offering
of shipping container leasing and sales, rail
leasing and operations, and global logistics
services, CAI International occupies a unique
position within the supply chain—the only
container leasing company with in-house U.S.
and global logistics capabilities. With 99+%
shipping container utilization, a double-digit
increase in railcar utilization, and an almost
50% increase in logistics business, CAI is
well-positioned for continued
growth in the future.
1
CA
I International 2018 Annual Report
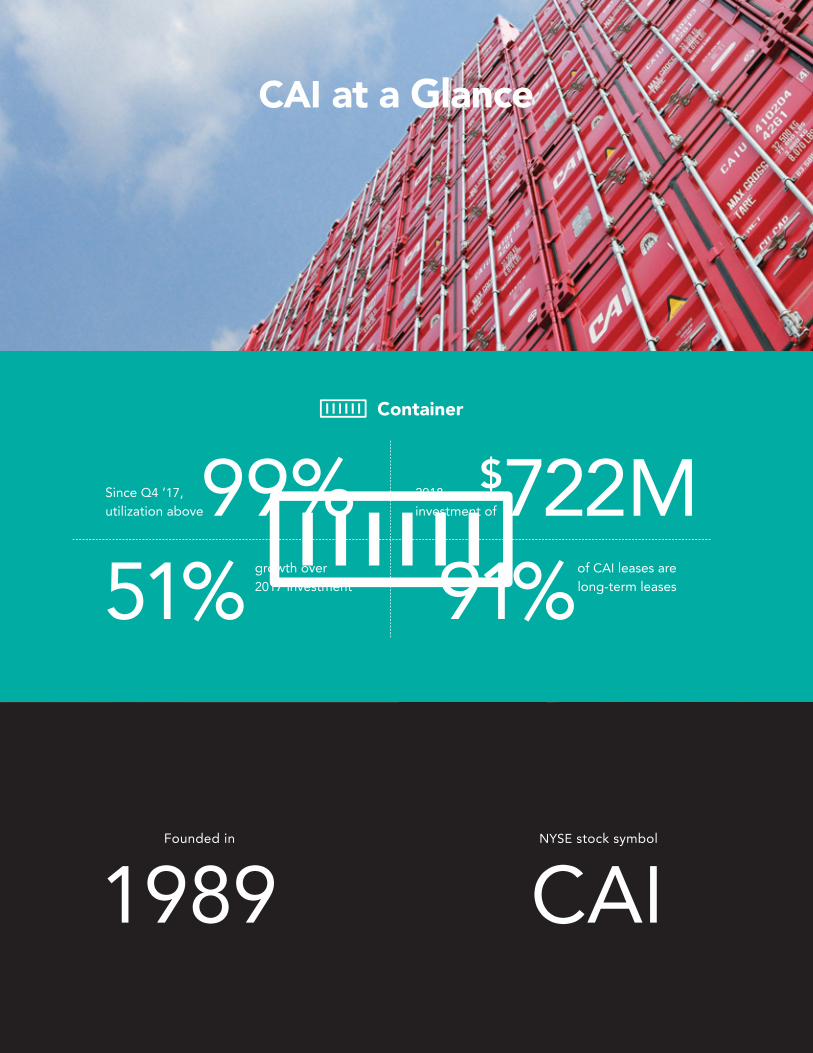
99%Since Q4 ‘17, utilization above
51% growth over2017 investment
$722M2018investment of
91%of CAI leases are long-term leases
Container
1989 CAIFounded in NYSE stock symbol
CAI at a Glance

14% 12
~20%
Compound annual growth rate of Offices in
in book value per share since going public in 2007
countries
$111M15%Record revenues ofGross margin dollars
year-over-year
Rail
Logistics
87%13%
38%growth over 2017
revenue
247Year-end utilization of
Net lease-outs in Q4increase in number of cars on lease year-over-year
improvement over 2017

Rail Power
CAI has a diverse fleet of railcars, providing a high level of service for custom-ers across North America. The CAI Rail team has extensive experience in all as-pects of rail operations and railcar leasing—delivering the best solution to get things done. Services include buying and selling operating leases, refinancing long- and short-term operating leases, and restructuring portfolios.
Beyond railcar leasing, CAI is a true railcar operator. The company has cars to handle virtually all commodities and industrial products shipped by rail. And CAI owns and maintains these assets, ensuring optimal performance and reliability.
4
CA
I International 2018 Annual Report

5
CA
I International 2018 Annual Report
Case Study: How a better boxcar helps protect the payloadSituation: A paper company has been investing heavily in mills throughout North America in order to expand production and provide value-added products to its customers. Its transportation services are supplied by a regional rail carrier. Consistent, efficient boxcar supply has been a challenge for both parties. Expanded production has increased boxcar demand, highlighting a shortage of proper equipment.Success+ CAI Rail collaborated with both parties to successfully modify
52-foot Plate F boxcars and design a new loading diagram for all sizes of rolled paper.
+ With cars approved for use by the Association of American Railroads, the paper company is shipping many combinations of its sensitive commodity while more effectively protecting the payload.
+ Connecting railroads know they will get boxcars that are loaded safely and without damage.

6
CA
I International 2018 Annual Report
Case Study: How customized solutions make inventory more accessibleSituation: A global communications engineering company supplies customers with delivery of products on demand. Its greatest supply chain challenges are storing inventory on a short-term basis and finding warehouse space across its rapidly growing network. CAI Logistics helped secure solutions for the optimal movement of inventory storage, warehouse movement, and disaster support for telecom infrastructure.Success+ Efficient supply chain solutions enable inventory to be
reclaimed at more than 100 cell-tower locations, with shipping to one final-mile location.
+ CAI customized a project document while overseeing material handling and packaging SOP for IT, asset recovery, shipment optimization, and freight flow.
+ During peak periods, when demand is high and warehouse relocation needs are required, CAI Logistics provides door-to-door material handling and consolidation into new warehouse locations.

Logistics Power
The logistics business continues to gain momentum. A growing customer portfolio and deeper penetration with key clients have led to record revenue. Growth has been particularly strong in our domestic intermodal and truck brokerage businesses. CAI expects continued double-digit expansion of our logistics business into 2019.
This year, our Hybrid Logistics and Challenger Overseas brands were combined with CAI Logistics, uniting all the company’s logistics services under one brand name. This leverages and enhances each company’s area of strength while offering customers a level of service unparalleled in the third-party logistics sector. Combined with an established intermodal program, CAI Logistics’ customers will now benefit from a comprehensive suite of shipping and supply chain solutions, all under one umbrella.
7
CA
I International 2018 Annual Report

Container Power
With approximately 1 million units in use around the world, you will find CAI containers on railcars, ships, and highways—everywhere goods are trans-ported. These standard and specialized containers transport finished goods, agricultural products, refrigerated goods, commodities, raw materials, and chemicals. The CAI container fleet serves more than 300 customers, including many of the world’s largest international container shipping lines, shippers, and logistics companies.
As the dynamics of global shipping continue to shift, CAI adds value through an innovative, real-time equipment control system, providing up-to-the-minute container visibility. And our experienced team keeps everything moving—working with a global network of more than 200 depot facilities in 41 countries.
8
CA
I International 2018 Annual Report
9
CA
I International 2018 Annual Report
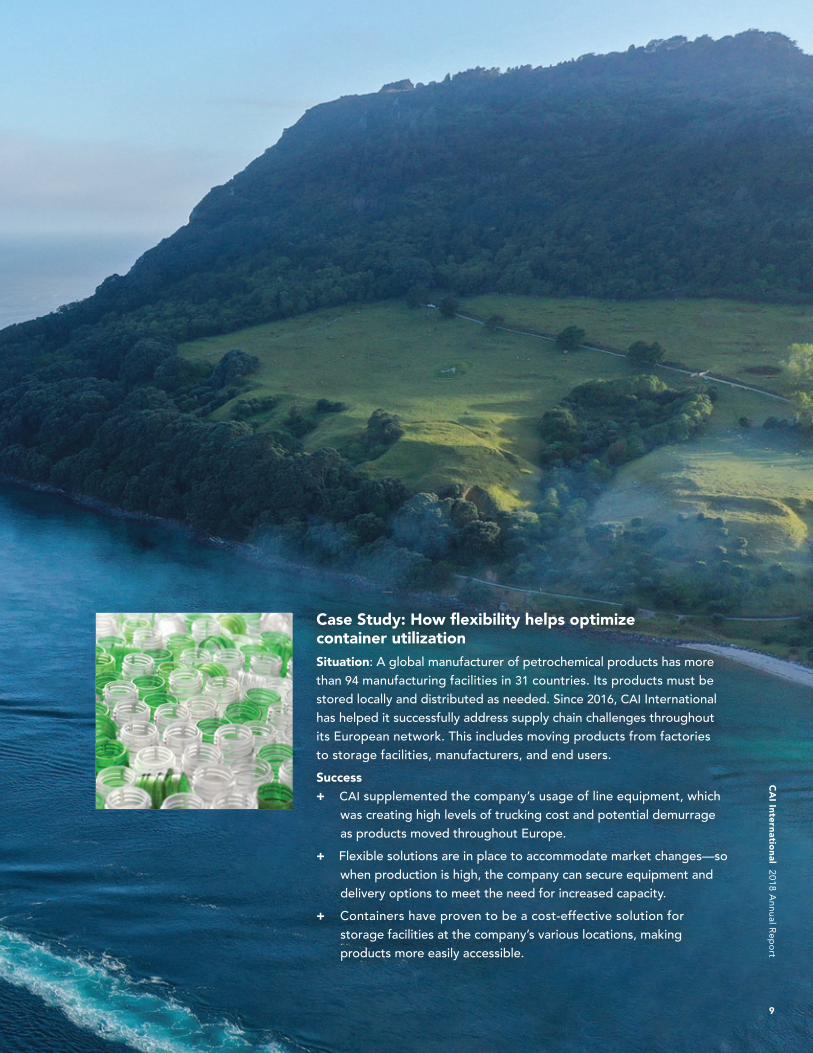
Case Study: How flexibility helps optimize container utilization Situation: A global manufacturer of petrochemical products has more than 94 manufacturing facilities in 31 countries. Its products must be stored locally and distributed as needed. Since 2016, CAI International has helped it successfully address supply chain challenges throughout its European network. This includes moving products from factories to storage facilities, manufacturers, and end users. Success+ CAI supplemented the company’s usage of line equipment, which
was creating high levels of trucking cost and potential demurrage as products moved throughout Europe.
+ Flexible solutions are in place to accommodate market changes—so when production is high, the company can secure equipment and delivery options to meet the need for increased capacity.
+ Containers have proven to be a cost-effective solution for storage facilities at the company’s various locations, making products more easily accessible.

The Year’s Highlights. We are always focused on long-term financial performance and shareholder value. Early in 2018, it was our expectation that the economy was likely to be strong during the year. Europe was recovering economically and benefiting from monetary stimulus. Similarly, the United States had recently enacted the Tax Cuts and Jobs Act of 2017, and the economy was poised to benefit from this new legislation. We decided early on to invest aggressively in our container segment, to take advan-tage of what we believed was going to be a strong container demand year. Our optimism proved correct, and we experienced increased demand for container equipment, particularly for delivery in the second and third quarters of the year. By the end of 2018, we had invested more than $700 million in marine containers that were placed on attractive leases with terms that averaged more than nine years in duration. Utilization throughout the year remained strong, at more than 99%, and we continued to benefit from a strong sec-ondary sales market. Clearly, our customers viewed CAI as one of the most reliable equipment providers, and we continued to see strong support from them.
As a result of the significant investment in contain-ers, we increased our 2018 net income to $73.5 million from $55.1 million in 2017, after adjusting for the tax benefit related to the United States Tax Cuts and Jobs Act. We were able to increase our net income while managing through a downturn in our rail seg-ment and significantly growing our investment in our logistics business.
Our focus on diversification provides us the flex-ibility to place capital where the returns are greatest.
As in 2017, it was clear in 2018 that the container segment was the best place to invest. To fund some of this investment we raised $104 million of cumula-tive perpetual preferred stock, which also gave us the flexibility to repurchase 1.8 million shares of our common stock, representing $41 million of equity and 9% of our outstanding shares at the beginning of the year. During the year, our board of directors approved a 3 million share repurchase program, and we expect repurchase activity to continue through 2019, due to our confidence in the contractual cash flows we have in place.Container. Considering the competitive nature of the container leasing business, we will be disciplined in our procurement and lease terms in 2019, focusing on high utilization, and being strategic in our second-ary sales activity. We have the needed strength and discipline to achieve market-leading returns, despite the competitive nature of the market. During 2018, we focused on all of these principles. We were aggressive in procurement beginning early in the year, seeking attractive long-term leases. We maintained market-leading utilization that was more than 99% all year, and we reported a $10 million gain on the sale of containers, selectively moving equipment into stronger markets. The efforts we made in 2018 have positioned us for success in 2019, and we expect to take advantage of market opportunities as they arise.Rail. The rail market was challenging in 2018 but con-tinued to steadily improve over the course of the year. We took delivery of 482 new railcars, which primarily came from the final year of our three-year equipment
2018 was a tremendous year for our company, as we expanded each of our three businesses and improved both our overall financial performance and our access to capital. We took advantage of strong container lease demand to increase our investment in containers by 50%, grew revenue from our logistics business by 38%, and continued to increase the utilization of our railcar fleet in a recovering rail market. We did all of this while improving our access to capital, with the issuance of $104 million of perpetual preferred stock and the repurchase of 9% of our outstanding shares. We go into 2019, our 30th anniversary year, with great momentum, optimism, and financial strength.
10
CA
I International 2018 Annual Report
Fellow Shareholders

purchase program with a manufacturer. Most of the equipment was delivered and placed on lease. We have witnessed an improvement in rental rates across all car types, particularly related to the tank segment, where we witnessed a doubling of rates by the end of the year. Our railcar utilization increased as the year progressed, averaging 81% for the year and finishing at 87%.
Our primary focus with all our businesses is to maximize overall corporate returns. As such, we have focused on the sale of railcars as a means to redeploy capital into higher-yielding opportunities, such as containers, or to increase the amount and pace of our share repurchase program. We sold $40 million of railcars in the fourth quarter of 2018, and have continued this strategy into 2019, with the sale of approximately $200 million of railcars. We believe these decisions were in the best interest of our shareholders and long-term strategic positioning.Logistics. Logistics remains a great strategic op-portunity for our company, and we are focused on aggressively expanding that segment. In 2018, we saw a 38% growth in revenue, most of which was in our domestic intermodal and truck brokerage business. We expanded the size of the teams in our existing offices and added a new office in Dallas. We see many opportunities to leverage our existing customer base and organically grow the business. Growth remains a focus considering the large market opportunity before us, but we are also looking at leveraging our existing investment in people and systems in order to improve margins and profitability. We are optimistic about contin-ued growth in 2019.Strategic Perspective. The long-term opportu-nity within the container
leasing segment is compelling and attractive. We believe we have the skills, capital, and customer relationships to increase our market share and returns in the segment. We also believe that diversification is important and will look for opportunities to expand beyond our core container business. Rail and logistics provide us long-term strategic advantages that can be expanded as market opportunities justify the investment.Outlook. As we look ahead to 2019, the outlook is less certain than it was in the prior year. Uncertainties surrounding trade negotiations are a concern, though we believe that global trade will continue to grow in 2019. As a result, we expect good opportunities for container investment, and we expect utilization to remain strong. This is likely to provide the underpin-nings for our earnings in 2019.
In our rail market, our focus will be on improving returns. We will do so by looking at opportunities to increase utilization rates and negotiate higher rental rates on cars currently on lease. We think the market will be strong enough to do both. We will also look at current investment and see if further equipment sales make sense as a way to improve the segment results.
On the logistics side, we expect continued growth of our team, particularly the marketing staff. We believe we have sufficient support and operations staff that can be leveraged as the business grows, thus improving financial returns in the segment. The customer reaction to our participation in this seg-ment has been great, and we are encouraged about
the growth prospects for logistics in 2019 and well beyond.
As always, we remain grateful to you, our shareholders, for your continued confidence and support.
David G. Remington Chairman of the Board and Audit Committee
Victor M. Garcia President and Chief Executive Officer
11
CA
I International 2018 Annual Report
Sincerely,

Total Revenue* Book Value Per Common Share*
2015
2015 2015
2016
2016 2016
2017
2017 2017
2018
2018 2018
EBITDA*Net Income*
Total Revenue
Operating Income
Net Income
EBITDA
(dollars in millions)
*Dollars in millions
$249.7
67.4
26.6
181.5
2015
$294.4
53.3
6.0
159.3
2016
$348.4
111.0
72.1
223.5
2017
$432.1
160.5
73.5
283.3
2018
12
CA
I International 2018 Annual Report
31.83
24.01
27.65
2015 2016 2017 2018
432.1
294.4
348.4
249.7
22.81
73.5
26.6 6.0
72.1
283.3
181.5 159.3
223.5
Financial Highlights

CAI International, Inc. 2018 Annual Report
Form 10-K

Creative A
gency: Michael Patrick Partners San Francisco, C
A
[This page has been intentionally left blank]

UNITED STATESSECURITIES AND EXCHANGE COMMISSION
WASHINGTON, D.C. 20549
FORM 10-K
☒ ANNUAL REPORT PURSUANT TO SECTION 13 OR 15(d)OF THE SECURITIES EXCHANGE ACT OF 1934
For the Fiscal Year Ended December 31, 2018or
☐ TRANSITION REPORT PURSUANT TO SECTION 13 OR 15(d)OF THE SECURITIES EXCHANGE ACT OF 1934
For the Transition Period from toCommission file number: 001-33388
CAI International, Inc.(Exact name of registrant as specified in its charter)
Delaware 94-3109229(State or other jurisdiction ofincorporation or organization)
(I.R.S. EmployerIdentification Number)
Steuart Tower1 Market Plaza, Suite 900 San Francisco, California 94105
(Address of principal executive office) (Zip Code)
(415) 788-0100(Registrant’s telephone number including area code)
Securities registered pursuant to Section 12(b) of the Act:Title of each class Name of exchange on which registered
Common Stock, par value $0.0001 per share New York Stock Exchange8.50% Series A Fixed-to-Floating Rate Cumulative Redeemable Perpetual
Preferred Stock, par value $0.0001 per shareNew York Stock Exchange
8.50% Series B Fixed-to-Floating Rate Cumulative Redeemable PerpetualPreferred Stock, par value $0.0001 per share
New York Stock Exchange
Securities registered pursuant to Section 12(g) of the Act: None
Indicate by check mark if the registrant is a well-known seasoned issuer, as defined in Rule 405 of the Securities Act. Yes ☐ No ☒
Indicate by check mark if the registrant is not required to file reports pursuant to Section 13 or Section 15(d) of the Act. Yes ☐ No ☒
Indicate by check mark whether the registrant (1) has filed all reports required to be filed by Section 13 or 15(d) of the Securities Exchange Act of 1934during the preceding 12 months (or for such shorter period that the registrant was required to file such reports), and (2) has been subject to such filingrequirement for the past 90 days. Yes ☒ No ☐
Indicate by check mark whether the registrant has submitted electronically every Interactive Data File required to be submitted pursuant to Rule 405of Regulation S-T (§232.405 of this chapter) during the preceding 12 months (or for such shorter period that the registrant was required to submit suchfiles). Yes ☒ No ☐
Indicate by check mark if disclosure of delinquent filers pursuant to Item 405 of Regulation S-K (§229.405 of this chapter) is not contained herein, andwill not be contained, to the best of registrant’s knowledge, in definitive proxy or information statements incorporated by reference in Part III of this Form10-K or any amendment to this Form 10-K. ☐
Indicate by check mark whether the registrant is a large accelerated filer, an accelerated filer, a non-accelerated filer, a smaller reporting company, oremerging growth company. See the definitions of “large accelerated filer,” “accelerated filer,” “smaller reporting company,” and “emerging growth company” inRule 12b-2 of the Exchange Act
Large accelerated filer ☐ Accelerated filer ☒Non-accelerated filer ☐ Smaller reporting company ☐
Emerging growth company ☐
If emerging growth company, indicate by check mark if the registrant has elected not to use the extended transition period for complying withany new or revised financial accounting standards provided pursuant to Section 13(a) of the Exchange Act. ☐
Indicate by check mark whether the registrant is a shell company (as defined in the Rule 12b-2 of the Act). Yes ☐ No ☒
As of June 29, 2018, the last trading day of the registrant’s most recently completed second fiscal quarter, the aggregate market value of common stockheld by non-affiliates of the registrant (based upon the closing sale price of such shares on the New York Stock Exchange on June 29, 2018) was approximately$382.8 million. Shares of registrant’s common stock held by each executive officer, director and beneficial holders of 10% or more of our common stock havebeen excluded in that such persons may be deemed to be affiliates of the registrant. This determination of affiliate status is not necessarily a conclusivedetermination for other purposes.
As of February 28, 2019, there were 18,712,252 shares of the registrant’s common stock outstanding.
DOCUMENTS INCORPORATED BY REFERENCEPortions of the registrant’s definitive proxy statement relating to the registrant’s 2019 Annual Meeting of Stockholders, which will be filed no later than
120 days after the close of the registrant’s fiscal year ended December 31, 2018, are incorporated by reference into Part III hereof.

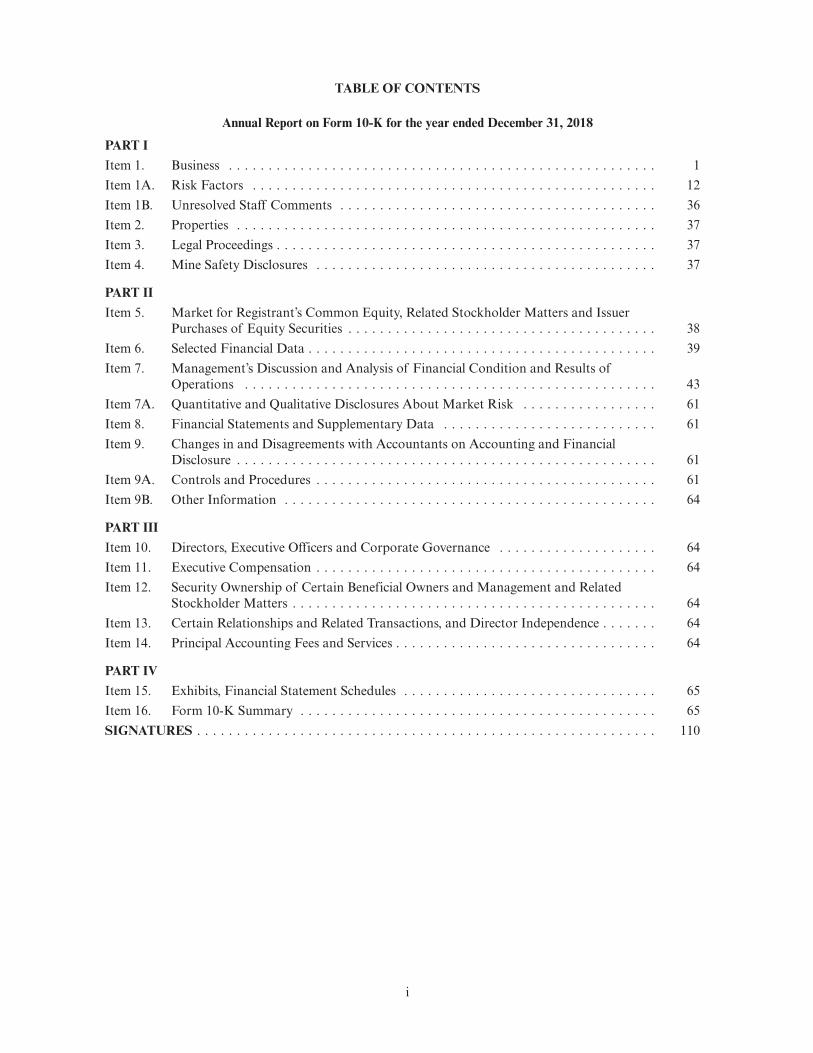
TABLE OF CONTENTS
Annual Report on Form 10-K for the year ended December 31, 2018
PART IItem 1. Business . . . . . . . . . . . . . . . . . . . . . . . . . . . . . . . . . . . . . . . . . . . . . . . . . . . . . . 1Item 1A. Risk Factors . . . . . . . . . . . . . . . . . . . . . . . . . . . . . . . . . . . . . . . . . . . . . . . . . . . 12Item 1B. Unresolved Staff Comments . . . . . . . . . . . . . . . . . . . . . . . . . . . . . . . . . . . . . . . . 36Item 2. Properties . . . . . . . . . . . . . . . . . . . . . . . . . . . . . . . . . . . . . . . . . . . . . . . . . . . . . 37Item 3. Legal Proceedings . . . . . . . . . . . . . . . . . . . . . . . . . . . . . . . . . . . . . . . . . . . . . . . . 37Item 4. Mine Safety Disclosures . . . . . . . . . . . . . . . . . . . . . . . . . . . . . . . . . . . . . . . . . . . 37
PART IIItem 5. Market for Registrant’s Common Equity, Related Stockholder Matters and Issuer
Purchases of Equity Securities . . . . . . . . . . . . . . . . . . . . . . . . . . . . . . . . . . . . . . . 38Item 6. Selected Financial Data . . . . . . . . . . . . . . . . . . . . . . . . . . . . . . . . . . . . . . . . . . . . 39Item 7. Management’s Discussion and Analysis of Financial Condition and Results of
Operations . . . . . . . . . . . . . . . . . . . . . . . . . . . . . . . . . . . . . . . . . . . . . . . . . . . . 43Item 7A. Quantitative and Qualitative Disclosures About Market Risk . . . . . . . . . . . . . . . . . 61Item 8. Financial Statements and Supplementary Data . . . . . . . . . . . . . . . . . . . . . . . . . . . 61Item 9. Changes in and Disagreements with Accountants on Accounting and Financial
Disclosure . . . . . . . . . . . . . . . . . . . . . . . . . . . . . . . . . . . . . . . . . . . . . . . . . . . . . 61Item 9A. Controls and Procedures . . . . . . . . . . . . . . . . . . . . . . . . . . . . . . . . . . . . . . . . . . . 61Item 9B. Other Information . . . . . . . . . . . . . . . . . . . . . . . . . . . . . . . . . . . . . . . . . . . . . . . 64
PART IIIItem 10. Directors, Executive Officers and Corporate Governance . . . . . . . . . . . . . . . . . . . . 64Item 11. Executive Compensation . . . . . . . . . . . . . . . . . . . . . . . . . . . . . . . . . . . . . . . . . . . 64Item 12. Security Ownership of Certain Beneficial Owners and Management and Related
Stockholder Matters . . . . . . . . . . . . . . . . . . . . . . . . . . . . . . . . . . . . . . . . . . . . . . 64Item 13. Certain Relationships and Related Transactions, and Director Independence . . . . . . . 64Item 14. Principal Accounting Fees and Services . . . . . . . . . . . . . . . . . . . . . . . . . . . . . . . . . 64
PART IVItem 15. Exhibits, Financial Statement Schedules . . . . . . . . . . . . . . . . . . . . . . . . . . . . . . . . 65Item 16. Form 10-K Summary . . . . . . . . . . . . . . . . . . . . . . . . . . . . . . . . . . . . . . . . . . . . . 65SIGNATURES . . . . . . . . . . . . . . . . . . . . . . . . . . . . . . . . . . . . . . . . . . . . . . . . . . . . . . . . . . 110
i

SPECIAL NOTE REGARDING FORWARD LOOKING STATEMENTS
This Annual Report on Form 10-K contains certain forward-looking statements, including, withoutlimitation, statements concerning the conditions in our industry, our operations, our economic performanceand financial condition, including, in particular, statements relating to our business, operations, and growthstrategy and service development efforts. The Private Securities Litigation Reform Act of 1995 provides a“safe harbor” for certain forward-looking statements so long as such information is identified asforward-looking and is accompanied by meaningful cautionary statements identifying important factorsthat could cause actual results to differ materially from those projected in the information. When used inthis Annual Report on Form 10-K, the words “may,” “might,” “should,” “estimate,” “project,” “plan,”“anticipate,” “expect,” “intend,” “outlook,” “believe” and other similar expressions are intended to identifyforward-looking statements and information. You are cautioned not to place undue reliance on theseforward-looking statements, which speak only as of their dates. These forward-looking statements are basedon estimates and assumptions by our management that, although we believe to be reasonable, are inherentlyuncertain and subject to a number of risks and uncertainties. These risks and uncertainties include, withoutlimitation, those identified under the caption Item 1A. “Risk Factors” in this Annual Report on Form 10-Kand our other reports filed with the Securities and Exchange Commission (SEC). We undertake noobligation to publicly update or revise any forward-looking statement as a result of new information, futureevents or otherwise, except as otherwise required by law. Reference is also made to such risks anduncertainties detailed from time to time in our filings with the SEC.
Unless the context requires otherwise, references to “CAI,” the “Company,” “we,” “us” or “our” in thisAnnual Report on Form 10-K refer to CAI International, Inc. and its subsidiaries.
ii

PART I
ITEM 1: BUSINESS
Our Company
We are one of the world’s leading transportation finance and logistics companies. We purchaseequipment, primarily intermodal shipping containers and railcars, which we lease to our customers. We alsomanage equipment for third-party investors. In operating our fleet, we lease, re-lease and dispose ofequipment and contract for the repair, repositioning and storage of equipment. We also provide domesticand international logistics services.
The following tables show the composition of our fleet as of December 31, 2018 and our averageutilization for the year ended December 31, 2018:
As ofDecember 31,
2018
Percent ofTotal
Container Fleet
Owned container fleet in TEUs . . . . . . . . . . . . . . . . . . . . . . . . . . . . . . . . . 1,465,799 95%Managed container fleet in TEUs . . . . . . . . . . . . . . . . . . . . . . . . . . . . . . . . 74,246 5%Total container fleet in TEUs . . . . . . . . . . . . . . . . . . . . . . . . . . . . . . . . . . . 1,540,045 100%
Owned container fleet in CEUs . . . . . . . . . . . . . . . . . . . . . . . . . . . . . . . . . 1,501,060 96%Managed container fleet in CEUs . . . . . . . . . . . . . . . . . . . . . . . . . . . . . . . . 67,647 4%Total container fleet in CEUs . . . . . . . . . . . . . . . . . . . . . . . . . . . . . . . . . . . 1,568,707 100%
Owned railcar fleet in units . . . . . . . . . . . . . . . . . . . . . . . . . . . . . . . . . . . . 7,279
Year EndedDecember 31,
2018
Average container fleet utilization in CEUs . . . . . . . . . . . . . . . . . . . . . . . . . . . . . . . . . . . . 99.2%Average owned container fleet utilization in CEUs . . . . . . . . . . . . . . . . . . . . . . . . . . . . . . . 99.2%Average railcar fleet utilization . . . . . . . . . . . . . . . . . . . . . . . . . . . . . . . . . . . . . . . . . . . . 88.6%
The intermodal marine container industry-standard measurement unit is the 20-foot equivalent unit(TEU), which compares the size of a container to a standard 20-foot container. For example, a 20-footcontainer is equivalent to one TEU and a 40-foot container is equivalent to two TEUs. Containers can alsobe measured in cost equivalent units (CEUs), whereby the cost of each type of container is expressed as aratio relative to the cost of a standard 20-foot dry van container. For example, the CEU ratio for a standard40-foot dry van container is 1.6, and a 40-foot high cube container is 1.7.
Utilization of containers is computed by dividing the average total units on lease during the period inCEUs, by the average total CEUs in our container fleet during the period. Utilization of railcars iscomputed by dividing the average number of railcars on lease during the period by the average total numberof railcars in our fleet during the period. In both cases, the total fleet excludes new units not yet leased andoff-hire units designated for sale. If new units not yet leased are included in the total fleet, total containerfleet utilization would be 97.0%, owned container fleet utilization would be 96.9%, and railcar fleetutilization would be 81.0%, for the year ended December 31, 2018.
Our revenue consists of container lease revenue and rail lease revenue from our owned container andrailcar fleets, management fee revenue for managing containers for third-party investors and logisticsrevenue for the provision of logistics services. Substantially all of our revenue is denominated inU.S. dollars. For the year ended December 31, 2018, we recorded revenue of $432.1 million and net incomeattributable to CAI common stockholders of $73.5 million. A comparison of our 2018 financial resultswith those of the prior years can be found in Item 6. “Selected Financial Data” of this Annual Report onForm 10-K.
1

We earn container lease revenue from intermodal containers, which are deployed by our customers in awide variety of global trade routes. Virtually all of our containers are used internationally, and no containeris domiciled in one particular place for a prolonged period of time. As such, substantially all of ourcontainer assets are considered to be international with no single country of use. Our railcars are used bylessees on railroads in North America. Our logistics business provides both domestic and internationallogistics services.
History
We were founded in 1989, as a traditional container leasing company that leased containers owned byus to container shipping lines. We were originally incorporated under the name Container ApplicationsInternational, Inc. in the State of Nevada in August 1989. In February 2007, we were reincorporated underour present name in the State of Delaware.
We formed CAI Rail Inc. (CAI Rail), a wholly-owned subsidiary of the Company in December 2011.CAI Rail purchases and leases our fleet of railcars in North America.
Our logistics business operates under the brand name, CAI Logistics, which is comprised of ouracquisitions of (i) ClearPointt Logistics LLC, an intermodal logistics company focused on the domesticintermodal market, in July 2015, (ii) Challenger Overseas, LLC (Challenger), a Non-Vessel OperatingCommon Carrier (NVOCC), in February 2016, and (iii) Hybrid Logistics, Inc. and its affiliate, GeneralTransportation Services, Inc. (collectively, Hybrid), which are asset light truck brokers, in June 2016. CAILogistics is headquartered in Everett, Washington.
Corporate Information
Our corporate headquarters and principal executive offices are located at Steuart Tower, 1 MarketPlaza, Suite 900, San Francisco, California 94105. Our telephone number is (415) 788-0100 and our websiteaddress is www.capps.com. The information found on, or otherwise accessible through, our website is notincorporated by reference into, nor does it form a part of, this Annual Report on Form 10-K, or any otherdocument that we file with the SEC. We operate our business in 22 offices in 12 countries including theUnited States, and have agents in Asia, Europe, South Africa, and South America. Our wholly-ownedinternational subsidiaries are located in the United Kingdom, Japan, Malaysia, Sweden, Germany,Singapore, Luxembourg, Australia, Chile, South Korea, Barbados and Bermuda.
Segment Information
We organize our business by the nature of services we provide and separate our business into threereportable segments: container leasing, rail leasing and logistics.
The container leasing segment derives its revenue from the ownership and leasing of containers andfees earned for managing container portfolios on behalf of third-party investors. The rail leasing segmentderives its revenue from the ownership and leasing of railcars. The logistics segment derives its revenue fromthe provision of logistics services.
Industry Overview
Container Leasing
We operate in the worldwide intermodal freight container leasing industry. Intermodal freightcontainers, or containers, are large, standardized steel boxes used to transport cargo by a number of means,including ship, truck and rail. Container shipping lines use containers as the primary means for packagingand transporting freight internationally, principally from export-oriented economies in Asia to other Asiancountries, North America and Western Europe.
Containers are built in accordance with standard dimensions and weight specifications established bythe International Standards Organization (ISO). Standard dry van containers are eight feet wide, either20 or 40 feet long and are either 8 feet 6 inches or 9 feet 6 inches tall.
2

The three principal categories of containers are as follows:
• Dry van containers. A dry van container is constructed of steel sides, roof and end panel with aset of doors on the other end, a wooden floor and a steel undercarriage. Dry van containers arethe least expensive and most commonly used type of container. They are used to carry generalcargo, such as manufactured component parts, consumer staples, electronics and apparel.
• Refrigerated containers. A refrigerated container has an integrated refrigeration unit on one endwhich plugs into a generator set or other outside power source and is used to transport perishablegoods.
• Specialized equipment. Specialized equipment includes open-top, flat-rack, palletwide andswapbody containers, roll trailers, and generator sets. An open-top container is similar inconstruction to a dry van container except that the roof is replaced with a tarpaulin supported byremovable roof bows. A flat-rack container is a heavily reinforced steel platform with a wood deckand steel end panels. Open-top and flat-rack containers are generally used to move heavy oroversized cargo, such as marble slabs, building products or machinery. Palletwide containers are atype of dry-van container externally similar to ISO standard containers, but internally about twoinches wider so as to accommodate two European-sized pallets side-by-side. Swapbody containersare a type of dry van container designed to be easily transferred between rail, truck, and bargeand are equipped with legs under their frames. Roll trailers are a type of flat-bed trailer equippedwith rubber wheels underneath for terminal haulage and stowage on board roll-on/roll-off vessels.Generator sets are units that are attached to refrigerated containers to provide the container withcooling.
Containers provide a secure and cost-effective method of transportation because they can be used inmultiple modes of transportation, making it possible to move cargo from a point of origin to a finaldestination without repeated unpacking and repacking. As a result, containers reduce transit time andfreight and labor costs as they permit faster loading and unloading of shipping vessels and more efficientutilization of transportation containers than traditional bulk shipping methods. The protection provided bycontainers also reduces damage, loss and theft of cargo during shipment. While the life of containers variesbased upon the damage and normal wear and tear suffered by a container, we estimate that the averageuseful life of a dry van container used in our fleet is 13.0 years.
Container shipping lines own and lease containers for their use. Based on container fleet informationreported by Harrison Consulting, transportation companies (including container shipping lines and freightforwarders) own approximately 47% of the total worldwide container fleet, measured in TEUs, withcontainer leasing companies owning the remaining 53%. Given the uncertainty and variability of exportvolumes and the fact that container shipping lines have difficulty in accurately forecasting their containerrequirements at different ports, the availability of containers for lease significantly reduces a containershipping line’s need to purchase and maintain excess container inventory. In addition, container leases allowthe container shipping lines to adjust their container fleets both seasonally and over time and help tobalance trade flows. The flexibility offered by container leasing helps container shipping lines improve theiroverall fleet management and provides the container shipping lines with an alternative source of financing.
3

Fleet Overview. The table below summarizes the composition of our container fleet as ofDecember 31, 2018 by type of equipment:
Dry VanContainers
Percent ofTotal Fleet
RefrigeratedContainers
Percent ofTotal Fleet
SpecializedEquipment
Percent ofTotal Fleet Total
Percent ofTotal Fleet
Owned containerfleet in TEUs . . . 1,337,809 87% 52,552 3% 75,438 5% 1,465,799 95%
Managed containerfleet in TEUs . . . 73,267 5% 556 0% 423 0% 74,246 5%
Total containerfleet in TEUs . . . 1,411,076 92% 53,108 3% 75,861 5% 1,540,045 100%
Dry VanContainers
Percent ofTotal Fleet
RefrigeratedContainers
Percent ofTotal Fleet
SpecializedEquipment
Percent ofTotal Fleet Total
Percent ofTotal Fleet
Owned containerfleet in CEUs . . . 1,188,630 76% 190,145 12% 122,285 8% 1,501,060 96%
Managed containerfleet in CEUs . . . 65,157 4% 1,946 0% 544 0% 67,647 4%
Total container fleetin CEUs . . . . . . . 1,253,787 80% 192,091 12% 122,829 8% 1,568,707 100%
Marketing and Operations Overview. Our marketing and operations personnel are responsible fordeveloping and maintaining relationships with our lessees, facilitating lease contracts and maintaining theday-to-day coordination of operational issues. This coordination allows us to negotiate lease contracts thatsatisfy both our financial return requirements and our lessees’ operating needs. It also facilitates ourawareness of lessees’ potential equipment shortages and their awareness of our available equipmentinventories. We have marketing and operations employees in ten countries, supported by independent agentsin a further seven countries.
Leases Overview. To meet the needs of our lessees and achieve a favorable utilization rate, we leasecontainers under three main types of leases:
• Long-Term Leases. Our long-term leases have terms of one year or more and specify the numberof containers to be leased, the pick-up and drop-off locations, the applicable per diem rate and thecontract term. We typically enter into long-term leases for a fixed term ranging from three toeight years, with five-year leases being most common. Our long-term leases generally require ourlessees to maintain all units on lease for the duration of the lease, which provides us withscheduled lease payments and predictable, recurring revenue. A small percentage of our long-termleases contain early termination options and afford the lessee interchangeability of containers, andthe ability to redeliver containers if the lessee’s fleet requirements change. Generally, leases with anearly termination provision impose various economic penalties on the customer if the customerelects to exercise the early termination provision.
• Short-Term Leases. Short-term leases include both master interchange leases and customizedshort-term leases. Master interchange leases provide a master framework pursuant to whichlessees can lease containers on an as-needed basis, and thus command a higher per diem rate thanlong-term leases. The terms of master interchange leases are typically negotiated on an annualbasis. Under our master interchange leases, lessees know in advance their per diem rates anddrop-off locations, subject to monthly port limits. We also enter into other short-term leases thattypically have a term of less than one year and are generally used for one-way leasing, typically forsmall quantities of containers. The terms of short-term leases are customized for the specificrequirements of the lessee. Short-term leases are sometimes used to reposition containers tohigh-demand locations and accordingly may contain terms that provide incentives to lessees.
4

• Finance Leases. Finance leases provide our lessees with an alternative method to finance theircontainer acquisitions. Finance leases are long-term in nature and require relatively little customerservice attention. They ordinarily require fixed payments over a defined period and generallyprovide lessees with a right to purchase the leased containers for a nominal amount at the end ofthe lease term. Per diem rates under finance leases include an element of repayment of capitaland, therefore, typically are higher than per diem rates charged under long-term leases. Financeleases require the container lessee to keep the container on lease for the entire term of the lease.
The following table provides a summary of our container fleet by lease type as of December 31, 2018:As of December 31, 2018
TEUs CEUs
Long-term leases . . . . . . . . . . . . . . . . . . . . . . . . . . . . . . . . . . . . . . . . . . . . . . . . 67% 69%Short-term leases . . . . . . . . . . . . . . . . . . . . . . . . . . . . . . . . . . . . . . . . . . . . . . . 9% 9%Finance leases . . . . . . . . . . . . . . . . . . . . . . . . . . . . . . . . . . . . . . . . . . . . . . . . . . 24% 22%Total . . . . . . . . . . . . . . . . . . . . . . . . . . . . . . . . . . . . . . . . . . . . . . . . . . . . . . . . 100% 100%
Our lease agreements contain general terms and conditions detailing standard rights and obligations,including requirements that lessees pay a per diem rate, depot charges, taxes and other charges when due,maintain equipment in good condition, return equipment in good condition in accordance with returnconditions set forth in the lease agreement, use equipment in compliance with all applicable laws, and pay usfor the value of the equipment as determined by the lease agreement if the equipment is lost or destroyed.A default clause in our lease agreements gives us certain legal remedies in the event that an equipment lesseeis in breach of lease terms.
Our lease agreements contain an exclusion of warranties clause and require lessees to defend andindemnify us in most instances from third-party claims arising out of the lessee’s use, operation, possessionor lease of the equipment. Lessees are required to maintain physical damage and comprehensive generalliability insurance, or be adequately self-insured, and to indemnify us against loss with respect to theequipment. We also maintain our own contingent physical damage and third-party liability insurance thatcovers our equipment during both on-lease and off-lease periods. All of our insurance coverage is subject toannual deductible provisions and per occurrence and aggregate limits.
Management Services Overview. We manage containers for third-party investors under managementagreements that cover portfolios of containers. We lease, re-lease and dispose of the containers and contractfor their repair, repositioning and storage. Our management agreements have multiple year terms andprovide that we receive a management fee based upon the net operating income for each container, which isequal to the rental revenue for a container less the operating expenses directly attributable to that container.Management fees are collected monthly or quarterly, depending upon the agreement, and generally are notpaid if net operating revenue is zero dollars or less for a particular period. If operating expenses exceedrevenue, third-party investors are required to pay the excess, or we may deduct the excess, including ourmanagement fee, from future net operating revenue. Under these agreements, we also receive a commissionfor selling or otherwise disposing of containers for the third-party investor. Sales of containers typicallyhave to be approved by the third-party investor. Our management agreements generally require us toindemnify the third-party investor for liabilities or losses arising out of a breach of our obligations. Inreturn, the third-party investor typically indemnifies us in our capacity as the manager of the containeragainst a breach by the third-party investor, sales taxes on commencement of the arrangement, withholdingtaxes on payments to the third-party investor under the management agreement and any other taxes, otherthan our income taxes, incurred with respect to the containers that are not otherwise included as operatingexpenses deductible from revenue.
5

Re-leasing, Logistics Management and Depot Management. We believe that managing the period afterlease termination, in particular after our containers’ first lease, is one of the most important aspects of ourbusiness. Successful management of this period requires disciplined re-leasing capabilities, logisticsmanagement and depot management.
• Re-leasing. Since our leases generally allow our lessees to return their containers, we typicallylease a container several times during its useful life. New containers can usually be leased with alimited marketing and customer service infrastructure because initial leases for new containerstypically cover large volumes of units and are fairly standardized transactions. Used containers,on the other hand, are typically leased in smaller transactions that are structured to accommodatepick-ups and returns in a variety of locations. Our utilization rates depend on our re-leasingabilities. Factors that affect our ability to re-lease used containers include the size of our lesseebase, ability to anticipate lessee needs, our presence in relevant geographic locations and the levelof service we provide our lessees. We believe that our global presence and long-standingrelationships with more than 300 container lessees as of December 31, 2018 provide us anadvantage over our smaller competitors in re-leasing our used containers.
• Logistics Management. The shipping industry is characterized by large regional tradeimbalances, with loaded containers generally flowing from export-oriented economies in Asia toother Asian countries, North America and Western Europe. Because of these trade imbalances,container shipping lines have an incentive to return leased containers in relatively low export areasto reduce the cost of shipping empty containers. We have managed this structural imbalance ofinventories with the following approach:• Limiting or prohibiting container returns to low-demand areas. In order to minimize our
repositioning costs, our leases typically include a list of the specific locations to whichcontainers may be returned, limitations on the number of containers that may be returned tolow-demand locations, high drop-off charges for returning containers to low-demandlocations or a combination of these provisions;
• Taking advantage of the secondary resale market. In order to maintain a younger fleet ageprofile, we have aggressively sold older containers when they are returned to low demandareas;
• Developing country-specific leasing markets to utilize older containers in the portable storagemarket. In North America and Western Europe, we lease older containers on a limited basisfor use as portable storage;
• Seeking one-way lease opportunities to move containers from lower demand locations to higherdemand locations. One-way leases may include incentives, such as free days, credits anddamage waivers. The cost of offering these incentives is considerably less than the cost wewould incur if we paid to reposition the empty containers; and
• Paying to reposition our containers to higher demand locations. At locations where ourinventories remain high, despite the efforts described above, we will selectively choose to shipexcess containers to locations with higher demand.
• Depot Management. As of December 31, 2018, we managed our equipment fleet through200 independent equipment depot facilities located in 41 countries. Depot facilities are generallyresponsible for repairing containers when they are returned by lessees and for storing thecontainers while they are off-hire. Our operations group is responsible for managing our depotcontracts and periodically visiting depot facilities to conduct inventory and repair audits. We alsosupplement our internal operations group with the use of independent inspection agents. As ofDecember 31, 2018, a majority of our off-lease inventory was located at depots that are able toreport notices of container activity and damage detail via electronic data interchange.
Most of our depot agency agreements follow a standard form and generally provide that the depotwill be liable for loss or damage of containers and, in the event of loss or damage, will pay us thepreviously agreed loss value of the applicable containers. The agreements require the depots tomaintain insurance against container loss or damage and we carry insurance to cover the risk thata depot’s insurance proves insufficient.
6

Our container repair standards and processes are generally managed in accordance with standardsand procedures specified by the Institute of International Container Lessors, or the IICL. TheIICL establishes and documents the acceptable interchange condition for containers and therepair procedures required to return damaged containers to acceptable interchange condition.When containers are returned by lessees, the depot arranges an inspection of the containers toassess the repairs required to return the containers to acceptable IICL condition. As part of theinspection process, damages are categorized either as lessee damage or normal wear and tear.Items typically designated as lessee damage include dents in the container, while items such as rustare typically designated as normal wear and tear. In general, lessees are responsible for the lesseedamage portion of repair costs and we are responsible for normal wear and tear.
Customer Concentration. Billings from our ten largest container lessees represented 63.4% ofcontainer leasing billings for the year ended December 31, 2018, with billings from our two largest lessees,MSC Mediterranean Shipping Company S.A. and CMA CGM, accounting for 18.2% and 13.0%,respectively, of container leasing billings, or $58.0 million and $41.3 million, respectively. The $58.0 millionand $41.3 million of billings generated by MSC Mediterranean Shipping Company S.A. and CMA CGMrepresented 11.8% and 8.4%, respectively, of our total billings for the year ended December 31, 2018.
Proprietary Real-time Information Technology System. Our proprietary real-time informationtechnology system tracks all of our containers individually by container number, provides designspecifications for the containers, tracks on-lease and off-lease transactions, matches each on-lease unit to alease contract and each off-lease unit to a depot contract, maintains the major terms for each leasecontract, tracks accumulated depreciation, calculates the monthly bill for each container lessee and tracksand bills for container repairs. Most of our depot activity is reported electronically, which enables us toprepare container lessee bills and calculate financial reporting information more efficiently.
In addition, our system allows our lessees to conduct business with us through the Internet. This allowsour lessees to review our container inventories, monitor their on-lease information, view designspecifications and receive information on maintenance and repair. Many of our lessees receive billing andon- and off-lease information from us electronically.
Our Suppliers. We purchase most of our containers in China from manufacturers that have met ourqualification requirements. We are currently not dependent on any single manufacturer. We havelong-standing relationships with all of our major container suppliers. Our technical services personnelreview the designs for our containers and periodically audit the production facilities of our suppliers.In addition, we contract with independent third-party inspectors to monitor production at factories whileour containers are being produced. This provides an additional layer of quality control and helps ensurethat our containers are produced in accordance with our specifications.
Our Competition. We compete primarily with other global container leasing companies, includingboth larger and smaller lessors. We also compete with bank leasing companies who offer long-termoperating leases and finance leases, and container shipping lines, which sometimes lease their excesscontainer inventory. Other participants in the shipping industry, such as container manufacturers, may alsodecide to enter the container leasing business. It is common for container shipping lines to utilize severalleasing companies to meet their container needs and to minimize reliance on any one individual leasingcompany.
Our competitors compete with us in many ways, including pricing, lease flexibility, supply reliability,customer service and the quality and condition of containers. Some of our competitors have greaterfinancial resources than us, or are affiliates of larger companies. We emphasize the quality of our fleet,supply reliability and high level of customer service to our container lessees. We focus on ensuring adequatecontainer availability in high-demand locations, dedicate large portions of our organization to buildingrelationships with lessees, maintain close day-to-day coordination with lessees and have developed aproprietary information technology system that allows our lessees to access real-time information abouttheir containers.
Seasonality. We have historically experienced increased seasonal demand for containers in the secondand third quarters of the year. However, equipment rental revenue may fluctuate significantly in futureperiods based upon the level of demand by container shipping lines for leased containers, our ability tomaintain a high utilization rate of containers in our total fleet, and changes in per diem rates for leases.
7

Rail LeasingFleet Overview. We own a fleet of railcars of various types including: 50 foot and 60 foot box cars for
paper and forest products; covered hoppers for grain, cement, sand, plastic pellets and many otherindustrial products; general purpose tank cars that are used to transport food-grade and other liquid andgaseous commodities; gondolas for coal and steel; and general service flat cars. We owned 7,279 railcars asof December 31, 2018. On February 26, 2019, we entered into an agreement to sell 2,146 railcars forapproximately $200 million. See Note 18 to our consolidated financial statements included in thisAnnual Report on Form 10K.
In 2015, we entered into a multi-year railcar order (the Agreement) with a railcar manufacturer. Underthe Agreement, we committed to purchase 2,000 railcars of various types for use on the North Americanrail system, for a total investment expected to be in excess of $200 million. In 2018, we entered into anamendment to the Agreement, by which we modified the type of railcars yet to be delivered and increasedthe total car count to 2,050 as of the date of the amendment. As of December 31, 2018, 1,600 railcars hadbeen delivered under the Agreement and the remaining 450 cars are to be delivered in 2019 at a cost of$58.6 million.
Overview of Our Leases. We offer multiple lease options to our railcar customers, including fullservice leases, net operating leases and per diem leases. Our full-service leases provide our customers withcomprehensive management services including maintenance and the payment of taxes. Net operating leasesallow customers to manage and pay the cost of operating and maintaining railcars themselves. Our perdiem lease product enables customers to pay through a settlement process on an hourly and mileage basis.
Customer Concentration. Our railcar customers are typically industrial companies who ship theirproducts or raw materials by rail. Our customers are generally large, creditworthy, industrial companies.Additionally, we work with a number of North American Class I Railroads and regional carriers. Billingsfrom our ten largest railcar lessees represented 54.2% of rail leasing billings for the year endedDecember 31, 2018, with billings from our single largest lessee accounting for 14.7% of rail leasing billings,or $4.2 million, for the year ended December 31, 2018. The $4.2 million of billings represented animmaterial portion of our total billings for the year ended December 31, 2018.
Our Competition. We operate in a highly competitive marketplace that includes large and smalloperating lessors, financial institutions with passive leasing enterprises, captive leasing companies owned bymanufacturers and at times with shippers holding large and diverse fleets of railcars. We compete on thebasis of customer relationships, lease rate, maintenance expertise, service capability and availability ofrailcars.
LogisticsOverview of Our Services. We offer comprehensive logistics services including intermodal, truck
brokerage, port drayage, warehousing, international ocean freight and freight forwarding, as well as thearrangement and coordination of international air freight services and customs brokerage. Through ournetwork of transportation carriers and equipment providers, we arrange for the movement of ourcustomers’ freight. We contract with railroads to provide transportation for the line-haul portion of theshipment and with local trucking companies, known as “drayage companies,” for pickup and delivery.We may also offer use of our own CAI equipment for domestic beneficial cargo owner (BCO) movements.As part of our intermodal and truck brokerage services, we negotiate and bundle rates for our customers,track shipments in transit, and facilitate the handling of claims for freight loss or damage on behalf of ourcustomers. We also provide international export and import services for full container loads, less thancontainer loads, perishable cargo, project cargo, and airfreight across the globe.
We have a network of logistics professionals dedicated to developing, implementing and operatingcustomized logistics solutions. We offer a wide range of transportation management services andtechnology solutions including shipment optimization, load consolidation, mode selection, carriermanagement, load planning and execution and web-based shipment visibility.
Customer Concentration. We provide services to customers in a wide variety of industries, includingconsumer products, retail and durable goods. Billings from our ten largest logistics customers represented30.2% of logistics billings for the year ended December 31, 2018, with no single customer generating morethan 10% of our logistics billings.
8
Our Competition. The transportation services industry is highly competitive. We compete againstother logistics companies, third party brokers, asset-backed trucking companies and shipping lines thatmarket their own intermodal and international shipping services. Several large trucking companies haveentered into agreements with railroads to market intermodal services nationwide. Competition is basedprimarily on freight rates, quality of services, reliability, transit time and scope of operations. We believe wehave a strong competitive advantage being able to offer customers a variety of services under oneorganization. Few, if any, of our competitors can offer customers leasing of containers, sale of usedcontainers, rail service, nationwide truck brokerage and international export/import services. This distinctadvantage, along with the cross selling between all of our divisions, is expected to provide us with significantopportunities to increase market share.
Relationship with Railroads. A key element of our business strategy is to strengthen our close workingrelationship with the major railroads in the United States and Canada. Due to our size and relativeimportance, some railroads have dedicated support personnel to focus on our day-to-day servicerequirements. We have relationships with all seven of the Class I freight railroads, and our senior executivesmeet with each of the railroads on a regular basis to discuss major strategic issues concerning intermodaltransportation.
Transportation rates are market driven. We sometimes negotiate with the railroads or other majorservice providers on a route or customer specific basis. Consistent with industry practice, some of the rateswe negotiate are special commodity quotations (SCQs), which provide discounts from published price listsbased on competitive market factors and are designed by the railroads or major service providers to attractnew business or to retain existing business. SCQ rates are generally issued for the account of a singleIntermodal Marketing Company (IMC). SCQ rates apply to specific customers in specified shipping lanesfor a specific period of time, usually up to 12 months. Other transactional or spot market business isnegotiated on a daily basis, dependent on capacity and dynamic pricing, consistent with existing marketconditions.
Relationship with Drayage Companies. We have a “Quality Drayage Program,” under whichparticipants commit to provide high quality drayage service along with clean and safe equipment, maintaina defined on-time performance level and follow specified procedures designed to minimize freight loss anddamage. We negotiate drayage rates for transportation between specific origin and destination points.Drayage is the transport of goods over a short distance and is often part of a longer overall move.
Relationship with Trucking Companies. Our truck brokerage operation has relationships with morethan 14,000 trucking companies that we use to transport freight. Our truck brokerage operation handles theadministrative and regulatory aspects of the trucking company relationship including an eight-step vettingprocess. Our relationships with these trucking companies are important since these relationships determinepricing, load coverage and overall service.
Relationship with Shipping Lines. Our international division has relationships with every majorshipping line providing a worldwide network of shipping options based on price and service for export andimport cargoes. These relationships enable us to provide a basket of options that best suit the needs of ourcustomers at any given moment. Supported by a world-wide agency network, we are able to provide the bestprice and service option anywhere in the world. Additional value and customized solutions can beaccomplished by offering use of our own CAI equipment for domestic and international BCO movements.
Risk Management and Insurance. We require all drayage companies participating in our QualityDrayage Program to carry general liability insurance, truckman’s auto liability insurance and cargoinsurance. Railroads, which are self-insured, provide limited cargo protection per shipment. To cover freightloss or damage our carriers are carefully vetted to ensure all cargo insurance requirements are in place andmonitored. We also carry contingent cargo insurance to protect from any lapse in a carrier’s primaryinsurance.
9

Credit Control
We provide services for container shipping lines, freight forwarders, railroads and other companiesthat meet our credit criteria. Our credit policy sets different maximum exposure limits depending on ourrelationship and previous experience with each customer. Credit criteria may include, but are not limited to,trade route, country, business climate, social and political climate, assessments of net worth, assetownership, bank and trade credit references, credit bureau reports (including those produced specifically forthe maritime sector by Dynamar), operational history and financial strength. We monitor our customers’performance on an ongoing basis. Our credit control processes are aided by the long payment experience wehave with most of our customers, our broad network of relationships that provide current informationabout our customers’ market reputations and our focus on collections.
Environmental Matters
We are subject to federal, state, local and foreign laws and regulations relating to the protection of theenvironment, including those governing the discharge of pollutants to air and water, the management anddisposal of hazardous substances and wastes and the cleanup of contaminated sites. We could incursubstantial costs, including cleanup costs, fines and third-party claims for property or natural resourcedamage and personal injury, as a result of violations of environmental laws and regulations in connectionwith our or our lessees’ current or historical operations. Under some environmental laws in theUnited States and certain other countries, the owner or operator of equipment may be liable forenvironmental damage, cleanup or other costs in the event of a spill or discharge of material from theequipment without regard to the fault of the owner or operator. While we typically maintain liabilityinsurance coverage and typically require our lessees to provide us with indemnity against certain losses, theinsurance coverage is subject to large deductibles, limits on maximum coverage and significant exclusionsand may not be sufficient or available to protect against any or all liabilities and such indemnities may notcover or be sufficient to protect us against losses arising from environmental damage.
Regulation
Our container operations are subject to regulations promulgated in various countries, including theUnited States, seeking to protect the integrity of international commerce and prevent the use of equipmentfor international terrorism or other illicit activities. For example, the Container Security Initiative, theCustoms-Trade Partnership Against Terrorism and Operation Safe Commerce are among the programsadministered by the U.S. Department of Homeland Security (DHS) that are designed to enhance securityfor cargo moving throughout the international transportation system by identifying existing vulnerabilitiesin the supply chain and developing improved methods for ensuring the security of containerized cargoentering and leaving the United States. Moreover, the International Convention for Safe Containers, 1972,as amended (CSC), adopted by the International Maritime Organization, applies to new and existingcontainers and seeks to maintain a high-level of safety of human life in the transport and handling ofcontainers by providing uniform international safety regulations. As these regulations develop and change,we may incur increased compliance costs due to the acquisition of new, compliant equipment and/or theadaptation of existing equipment to meet new requirements imposed by such regulations.
Our rail operations are subject to various laws, rules, and regulations administered by authorities injurisdictions where we do business: the United States, Canada and Mexico. In the United States, forexample, our railcar fleet is subject to safety, operations, maintenance, and mechanical standards, rules, andregulations enforced by various federal and state agencies and industry organizations, including theU.S. Department of Transportation (DOT), the Federal Railroad Administration (FRA), and theAssociation of American Railroads (AAR). State agencies regulate some health and safety matters relatedto rail operations not otherwise covered by federal law. As these regulations develop and change, we mayincur increased compliance costs due to additional maintenance or substantial modification orrefurbishment of our railcars to meet new requirements imposed by such regulations. In addition, violationsof these rules and regulations can result in substantial fines and penalties, including potential limitations onoperations or forfeitures of assets.
10

Our domestic logistics business is licensed by the DOT as brokers in arranging for the transportation ofgeneral commodities by motor carriers and railroads. To the extent that we perform truck brokerage andintermodal services, we do so under these licenses. The DOT prescribes qualifications for acting in thiscapacity, including a surety bond that we have posted. To date, compliance with these regulations hasnot had a material adverse effect on our results of operations or financial condition. However, thetransportation industry is subject to legislative or regulatory changes that can affect the economics of theindustry by requiring changes in operating practices or influencing the demand for, and cost of providing,transportation services. Our international freight forwarding business is regulated by the Federal MaritimeCommission (FMC). We have our own tariff on file with the FMC and are required to have a bond for bothour freight forwarding and NVOCC businesses.
Employees
As of December 31, 2018, we had 261 employees worldwide. We are not a party to any collectivebargaining agreements. We believe that relations with our employees are good.
Available Information
Our Internet website address is www.capps.com. Our Annual Reports on Form 10-K, QuarterlyReports on Form 10-Q, Current Reports on Form 8-K, and amendments to those reports filed or furnishedpursuant to Section 13(a) or 15(d) of the Securities Exchange Act of 1934, as amended (Exchange Act), areavailable free of charge through the SEC’ website at www.sec.gov and on our website as soon as reasonablypracticable after they are electronically filed with, or furnished to, the SEC. Also, copies of our filings withthe SEC will be made available, free of charge, upon written request to the Company. The informationfound on, or otherwise accessible through, our website is not incorporated by reference into, nor does itform a part of, this Annual Report on Form 10-K, or any other document that we file with the SEC.
11

ITEM 1A: RISK FACTORS
In addition to the other information contained in this Annual Report on Form 10-K, we have identified thefollowing risks and uncertainties that may have a material adverse effect on our business, financial condition,results of operations and cash flows. Investors should carefully consider the risks described below beforemaking an investment decision. The risks described below are not the only ones we face. Additional risks notpresently known to us or that we currently believe are immaterial may also impair our business operations. Ourbusiness could be harmed by any of these risks. The trading price of our securities could decline due to any ofthese risks and investors may lose all or part of their investment. This section should be read in conjunctionwith our audited consolidated financial statements and related notes thereto, and Item 7, “Management’sDiscussion and Analysis of Financial Condition and Results of Operations” contained in this Annual Report onForm 10-K.
Risks Related to Container Leasing
The demand for leased containers is particularly tied to international trade. If international trade were todecrease, it could reduce demand for container leasing, which would materially adversely affect our business,financial condition and results of operations.
A substantial portion of our containers are used in trade involving goods being shipped fromexporting countries (e.g., China and other export-oriented Asian countries) to importing countries(e.g., other Asian countries, North America and Western Europe). The willingness and ability ofinternational consumers to purchase foreign goods is dependent upon political support for an absence ofgovernment-imposed barriers to international trade in goods and services. For example, internationalconsumer demand for foreign goods is related to price. Therefore, if the price differential between foreigngoods and domestically-produced goods were to decrease due to increased tariffs on the import of foreigngoods, strengthening in the applicable foreign currencies relative to domestic currencies, rising foreignwages, increasing input or energy costs or other factors, then demand for foreign goods could decrease. Thisin turn could result in reduced demand for container leasing. A similar reduction in demand for containerleasing could result from an increased use of quotas or other technical barriers to restrict trade. The currentregime of relatively free trade may not continue, which would materially adversely affect our business,financial condition and results of operations.
The current U.S. Government has withdrawn from certain international trade agreements (i.e. theTrans Pacific Partnership) and has announced its intention to renegotiate or already renegotiated someexisting trade agreements (i.e. NAFTA). Any further changes in international trade agreements may lead tothe implementation of tariffs, border taxes or other measures that could impact the level of trade betweenthe U.S. and other countries, including countries in Asia, Canada and Mexico. Any such changes to tradeagreements or the implementation of tariffs could have a material impact on the purchase of foreign goods,and negatively impact our customers and the volume of container and rail shipments, which wouldmaterially adversely affect our business, financial condition and results of operations.
Increased tariffs or other actions impeding trade could adversely affect our business, financial condition andresults of operations.
The international nature of the container industry exposes us to risks relating to the imposition ofimport and export duties, quotas, domestic and foreign customs and tariffs, and other impediments totrade. These risks have increased recently due to trade actions taken by the United States and China thathave led to increased tariffs on goods traded between these two countries, and the United States hasthreatened to further increase tariffs if certain demands are not met. Given the importance of theUnited States and China in the global economy, these increased tariffs could significantly reduce the volumeof goods traded internationally and reduce the rate of global economic growth, leading to decreaseddemand for leased containers, lower new container prices (which would indirectly reduce the value of theCompany’s inventory of containers held for lease) and decreased market leasing rates. These impacts couldhave a materially adverse effect on our business, financial condition and results of operations.
12
Market conditions could weaken due to a combination of factors, including significant declines in steel prices,new container prices and used container prices, which could lead to lower demand for containers.
Market conditions could weaken leading to reduced investment, a lack of growth and a significantreduction in our profitability. For example, in 2015 and 2016 there was an overall decline in worldwidecommodity prices and, in particular, steel prices. World containerization trade growth deceleratedsignificantly during 2015 and trade growth remained weak in 2016. The decline in steel prices, along withslower trade growth resulted in a reduced demand for containers and contributed to a significant decline inthe price of new containers. New container prices reached a low point of approximately $1,250 in thefirst quarter of 2016. Sale prices for used containers decreased significantly, resulting in losses on the sale ofequipment. Although container prices recovered in 2017 and 2018, with prices reaching approximately$2,250 in the first quarter of 2018, they have since declined with prices dropping below $2,000. If steelprices continue to decline and the market conditions we saw in 2015 and 2016 return, our profitability willdecline, which could limit the availability of our liquidity and capital resources and therefore constrain ourability to repay debt, invest in additional containers or repurchase our common shares.
Container leasing demand can be negatively affected by numerous market factors as well as external politicaland economic events that are beyond our control. Decreasing leasing demand could have a material adverseeffect on our business, financial condition, results of operations and cash flows.
Demand for containers depends largely on the rate of world trade and economic growth. Demand forleased containers is also driven by our customers’ “lease vs. buy” decisions. Cyclical recessions cannegatively affect the operating results of container lessors, such as us, because during economic downturnsor periods of reduced trade, shipping lines tend to lease fewer containers, or lease containers only atreduced rates, and tend to rely more on their own fleets to satisfy a greater percentage of their requirements.As a result, during periods of weak global economic activity, container lessors like ourselves typicallyexperience decreased leasing demand, decreased equipment utilization, lower average rental rates, decreasedleasing revenue, decreased used container resale prices and significantly decreased profitability. These effectscan be severe.
For example, our profitability decreased significantly from the third quarter of 2008 to the thirdquarter of 2009 due to the effects of the global financial crisis, and profitability would have decreasedfurther if trade activity did not start to recover at the end of 2009. Starting in 2015 and continuing through2016, our operating performance and profitability were also negatively impacted due to slower global tradegrowth resulting in reduced demand for leased containers, decreases in lease rental revenue, decreased usedcontainer sales prices, and higher operating costs. If these conditions return, our profitability will benegatively affected, which could constrain our ability to invest in additional containers or repurchase sharesof our common stock.
Other general factors affecting demand for leased containers, container utilization and per diem rentalrates include:
• available supply and prices of new and used containers;
• changes in the operating efficiency of our customers;
• economic conditions and competitive pressures in the shipping industry;
• shifting trends and patterns of cargo traffic, including a reduction in exports from Asian nationsor increased trade imbalances;
• the availability and terms of container financing;
• fluctuations in interest rates and foreign currency values;
• overcapacity or undercapacity of the container manufacturers;
• the lead times required to purchase containers;
• the number of containers purchased by competitors and container lessees;
• container ship fleet overcapacity or undercapacity;
13

• increased repositioning by container shipping lines of their own empty containers tohigher-demand locations in lieu of leasing containers from us;
• consolidation or withdrawal of individual container lessees in the container shipping industry;
• import/export tariffs and restrictions;
• customs procedures, foreign exchange controls and other governmental regulations;
• natural disasters that are severe enough to affect local and global economies;
• political and economic factors, including any changes in international trade agreements; and
• future regulations which could restrict our current business practices and increase our cost ofdoing business.
All of these factors are inherently unpredictable and beyond our control. These factors will vary overtime, often quickly and unpredictably, and any change in one or more of these factors may have a materialadverse effect on our business, financial condition, results of operations and cash flows. Many of thesefactors also influence decisions by our customers to lease or buy containers. Should one or more of thesefactors influence our customers to buy a larger percentage of the containers they operate, our utilizationrate would decrease, resulting in decreased revenue and increased storage and repositioning costs.
Lease rates may decrease due to a decrease in new container prices, weak leasing demand, increasedcompetition or other factors, resulting in reduced revenues, lower margins, and reduced profitability and cashflows.
Market lease rates are typically a function of, among other things, new equipment prices (which areheavily influenced by steel prices), interest rates, the type and length of the lease, the equipment supply anddemand balance at a particular time and location, and other factors more fully described below. A decreasein lease rates can have a materially adverse effect on our leasing revenues, profitability and cash flow.For example, the low container prices experienced in 2016, together with low interest rates, resulted inmarket lease rates reaching historically low levels.
A decrease in market lease rates negatively impacts the lease rates on both new container investmentsand existing containers in our fleet. Most of our existing containers are on operating leases, which meansthat the lease term is shorter than the expected life of the container, so the lease rate we receive for thecontainer is subject to change at the expiration of the current lease. Lower new container prices, widespreadavailability of attractively priced financing, and aggressive competition for new leasing transactions couldput pressure on market lease rates. As a result, during periods of low market lease rates, the average leaserate received for our containers is negatively impacted by both the addition of new containers at low leaserates as well as, and more significantly, by the turnover of existing containers from leases with higher leaserates to leases with lower lease rates. We have a large number of historically high rate leases that expirebetween 2019 and 2020 and those that have already expired or been renegotiated have been re-priced atrelatively lower lease rates.
A reduction in the price of new containers could harm our business, results of operations and financialcondition.
New container prices have generally been increasing since their lows in the first quarter of 2016,although prices started to decrease in the fourth quarter of 2018. If new container prices continue todecrease, the per diem lease rates for new leases of older, off-lease containers would also be expected todecrease and the prices obtained for containers sold at the end of their useful life would also be expected todecrease. Between the beginning of 2014 and the first quarter of 2016, due primarily to decreases in steelprices and other macro-economic factors outside of our control, new container pricing and the sale pricesof containers sold at the end of their useful life declined. Although new and used container prices recoveredfrom the lows of 2016, they have recently started to decline. If the price of new containers declines such thatmarket per diem lease rates or resale values for containers are reduced, our revenue and income coulddecline. A continuation of these factors could harm our business, financial condition, results of operationsand cash flows, even if a sustained reduction in price would allow us to purchase new containers at a lowercost.
14

We face risks associated with re-leasing containers after their initial long-term lease.
Containers used in our fleet have an average useful life that is generally between 12 and 15 years. Whenwe purchase newly manufactured containers, we typically lease them out under long-term leases with termsof 3 to 8 years, with five-year leases being most common, at a lease rate that is correlated to the price paidfor the container. As containers leased under term leases are not leased out for their full economic life, weface risks associated with re-leasing containers after their initial long-term lease at a rate that continues toprovide a reasonable economic return based on the initial purchase price of the container. If prevailingcontainer lease rates decline significantly between the time a container is initially leased out and when itsinitial long-term lease expires, or if overall demand for containers declines, we may be unable to earn asufficient lease rate from the re-leasing of containers when their initial term leases expire. This couldadversely affect our business, financial condition, results of operations and cash flows.
Our customers may decide to lease fewer containers. Should shipping lines decide to buy a larger percentage ofthe containers they operate, our utilization rate and level of investment would decrease, resulting in decreasedleasing revenues, increased storage costs, increased repositioning costs and lower growth.
We, like other suppliers of leased containers, are dependent upon decisions by shipping lines to leaserather than buy their container equipment. Should shipping lines decide to buy a larger percentage of thecontainers they operate, our utilization rate would decrease, resulting in decreased leasing revenues,increased storage costs and increased positioning costs. A decrease in the portion of leased containersoperated by shipping lines would also reduce our investment opportunities and significantly constrain ourgrowth. Most of the factors affecting the decisions of our customers are outside of our control.
Our shipping line customers are subject to requirements under environmental and operational safety laws,regulations and conventions that could require them to incur significant expenditures, which may impact ourcontainer leasing business.
On October 27, 2016, the International Maritime Organization’s Marine Environment ProtectionCommittee announced the results from a vote concerning the implementation of regulations mandating areduction in sulfur emissions from 3.5% to 0.5% as of the beginning of 2020 rather than pushing thedeadline back to 2025. By 2020 ships will now have to either remove sulfur from emissions through the useof emission scrubbers or buy fuel with low sulfur content. Scrubbers can cost $3.0 million to $5.0 million toinstall on existing ships. If a vessel is not retrofitted with a scrubber or other emission abatementtechnology, it will need to use low sulfur bunker fuel (0.5%), which is more expensive than standard bunkerfuel. The increased demand for low sulfur bunker fuel is likely to result in an increase in the bunker price.While we believe that these costs will be passed on to shippers through higher freight rates, if such costs arenot able to be passed on, it may impact the financial results of our shipping line customers, which mayadversely impact our business, financial condition, results of operations and cash flows.
Used container sale prices may decrease, leading to losses on the sale of used rental equipment.
Although our revenues primarily depend upon equipment leasing, our profitability is also affected bythe gains or losses we realize on the sale of used containers because, in the ordinary course of our business,we sell certain containers when they are returned to us. The volatility of the selling prices and gains or lossesfrom the disposal of such equipment may be significant. Used container selling prices, which can varysubstantially, depend upon, among other factors, the cost of new containers, the global supply and demandbalance for containers, the location of the containers, the supply and demand balance for used containers ata particular location, the repair condition of the container, refurbishment needs, materials and labor costsand equipment obsolescence. Most of these factors are outside of our control.
Containers are typically sold if it is in our best interest to do so, after taking into considerationearnings prospects, book value, remaining useful life, condition and repair costs, storage costs, suitability forleasing or other uses, and the prevailing local sales price for containers. Gains or losses on the disposition ofused containers will fluctuate and may be significant if we sell large quantities of used containers.
15
Used container selling prices and the gains or losses that we have recognized from selling usedcontainers have varied widely over recent years. Selling prices for used container and our disposal gainswere exceptionally high from 2010 to 2012 due to a generally tight global supply and demand balance forcontainers. Since the beginning of 2013, due primarily to decreases in steel prices and othermacro-economic factors outside of our control, new container pricing and the sale prices of containers soldat the end of their useful life declined. During 2015 and 2016, disposal prices were close to, and in manycases below, our residual values which resulted in losses being incurred on the sales of used equipment. As aresult of consistent losses being recorded on the sale of 40-foot high cube dry van containers, we reducedthe residual value for these containers from $1,650 to $1,400 per container, effective July 1, 2016. Salesprices for used containers recovered from the lows of 2016, resulting in gains being recognized on the sale ofused equipment, but have recently started to decline. If used container prices continue to decline, we mayincur losses on the sale of used containers, our residual values may need to be reduced further, resulting inincreased depreciation expense, and we may incur impairment charges on such equipment. A decline inthese factors could have a material adverse effect on our business, financial condition, results of operationsand cash flows.
We may incur significant costs to reposition containers.
When lessees return containers to locations where supply exceeds demand, we may make a decision toreposition containers to higher demand areas rather than sell the container and realize a loss on sale.Repositioning expenses vary depending on geographic location, distance, freight rates and other factors,and may not be fully covered by drop-off charges collected from the last lessee of the containers or pick-upcharges paid by the new lessee. We seek to limit the number of units that can be returned and imposesurcharges on containers returned to areas where demand for such containers is not expected to be strong.However, market conditions may not enable us to continue such practices. In addition, we may notaccurately anticipate which port locations will be characterized by high or low demand in the future, andour current contracts will not protect us from repositioning costs if ports that we expect to be high-demandports turn out to be low-demand ports at the time leases expire.
Lessee defaults may adversely affect our business, results of operations and financial condition by decreasingrevenue and increasing storage, repositioning, collection and recovery expenses.
Our container equipment is leased to numerous lessees. Lessees are required to pay rent and indemnifyus for damage to or loss of equipment. Lessees may default in paying rent and performing other obligationsunder their leases. A delay or diminution in amounts received under the leases (including leases on ourmanaged equipment), or a default in the performance of maintenance or other lessee obligations under theleases could adversely affect our business, financial condition, results of operations and cash flows and ourability to make payments on our debt.
Our cash flows from container equipment, principally container rental revenue, management feerevenue, gain on disposition of used equipment and commissions earned on the sale of equipment on behalfof equipment investors, are affected significantly by the ability to collect payments under leases and theability to replace cash flows from terminating leases by re-leasing or selling equipment on favorable terms.All of these factors are subject to external economic conditions and the performance by lessees and serviceproviders that are not within our control.
In addition, when lessees default, we may fail to recover all of our equipment, and the equipment wedo recover may be returned in damaged condition or to locations where we will not be able to efficientlyre-lease or sell the equipment. As a result, we may have to repair and reposition the equipment to otherplaces where we can re-lease or sell it, and we may lose revenue and incur additional operating expenses inrepossessing, repositioning and storing the equipment.
16

We believe that the risk of lessee defaults remains high. Excess vessel capacity over the lastseveral years has led to low ocean freight rates, which has resulted in large financial losses for certaincarriers. For example, Hanjin Shipping Co. Ltd (Hanjin), previously the world’s seventh largest containershipping line, declared bankruptcy on August 31, 2016, and a second major shipping line entered intorestructuring negotiations with its creditors, which was successfully completed in 2016. We expect excessvessel capacity, and future financial commitments for new capacity, to persist and freight rates to remainunder pressure, which could adversely affect the credit worthiness of our customers. The Hanjin bankruptcyresulted in us recording bad debt expense of $2.5 million and an impairment charge of $2.0 million in 2016.Additional large lessee defaults could have a material adverse effect on our business, financial condition,results of operations and cash flow.
We maintain insurance to reimburse us and third-party investors for customer defaults. The insuranceagreements are subject to deductibles of $3.0 million or $3.5 million per occurrence, depending on thecustomer’s credit rating, and have significant exclusions. Our level of insurance coverage in 2019 is limitedto $23.2 million or $23.7 million per occurrence and $28.2 million or $28.7 million in aggregate, dependingon the customer’s credit rating, and may not be sufficient to prevent us from suffering material losses.Additional insurance claims made by the Company may result in such insurance not being available to us inthe future on commercially reasonable terms, or at all.
We may incur additional asset impairment charges and depreciation expense.
Asset impairment charges may result from the occurrence of unexpected adverse events ormanagement decisions that impact our estimates of expected cash flows generated from our long-livedassets. We review our long-lived assets for impairment when events or changes in circumstances indicate thecarrying value of an asset may not be recoverable. We may be required to recognize additional assetimpairment charges in the future as a result of prolonged reductions in demand for specific container types,an extended weak economic environment, persistent challenging market conditions, events related toparticular customers or asset type, or as a result of asset or portfolio sale decisions by management. If anasset, or group of assets, is considered to be impaired, it may also indicate that the residual value of theassociated equipment type needs to be reduced. For example, we reduced the residual value for 40-foot highcube dry van containers from $1,650 to $1,400 per container, effective July 1, 2016. If residual values of ourrental equipment are lowered further, then our depreciation expense will increase, which would have anadverse impact on our business, financial condition and results of operations.
We derive a substantial portion of our revenue from a limited number of container lessees. The loss of, orreduction in business by, any of these container lessees, or a default from any large container lessee, couldresult in a significant loss of revenue and cash flow.
We have derived, and believe that we will continue to derive, a significant portion of our revenue andcash flow from a limited number of container lessees. Billings from our ten largest container lesseesrepresented 63.4% of total billings for this segment for the year ended December 31, 2018, with billingsfrom our two largest container lessees accounting for 18.2% and 13.0%, respectively, of container leasebillings, or $58.0 million and $41.3 million, respectively, which represented 11.8% and 8.4%, respectively, ofour total billings for the year ended December 31, 2018. As our business grows, and as consolidationcontinues among our shipping line customers, we expect the proportion of revenue generated by our largercustomers to continue to increase. Recent consolidation among our major shipping line customers includesCosco and China Shipping Container Lines in 2016, Maersk and Hamburg Süd in 2017, and the formationof Ocean Network Express (ONE), a joint venture between NYK, Mitsui OSK and K Line, in 2018. Theloss of such a customer would have a material adverse impact on our business, financial condition, resultsof operations and cash flows. In addition, a default by any of our largest lessees would result in a majorreduction in our leasing revenue, large repossession expenses, potentially large lost equipment charges and amaterial adverse impact on our performance and financial condition. Although we maintain insuranceagainst customer defaults, our insurance is limited and may not be sufficient to cover such a default.
17

Sustained Asian economic, social or political instability could reduce demand for leasing.
Many of our customers are substantially dependent upon shipments of goods exported from Asia.From time to time, there have been economic disruptions, financial turmoil, natural disasters and politicalinstability in this region. If these events were to occur in the future, they could adversely affect ourequipment lessees and the general demand for shipping and lead to reduced demand for leased equipmentor otherwise adversely affect us. Currently China is transitioning from an export-based economy to adomestic demand economy. Any consequent reductions in demand for leased equipment could adverselyimpact our business, financial condition, results of operations and cash flows.
Consolidation and concentration in the container shipping industry could decrease the demand for leasedcontainers.
We primarily lease containers to container shipping lines. The container shipping lines have historicallyrelied on a large number of leased containers to satisfy their needs. Consolidation of major containershipping lines, such as between Cosco and China Shipping Container Lines in 2016, and between Maerskand Hamburg Süd in 2017, or the creation of operating alliances between shipping lines, such as theformation of ONE, a joint venture between NYK, Mitsui OSK and K Line, in 2018, could createefficiencies for the shipping lines and decrease demand for leased containers, because they may be able tofulfill a larger portion of their needs through their owned container fleets. It would also create increasedconcentration of credit risk if the number of our container lessees decreases due to consolidation.Additionally, large container shipping lines with significant resources could choose to manufacture theirown containers, which would decrease their demand for leased containers and could have an adverse impacton our business, financial condition, results of operations and cash flows. Finally, decreased demand fromshipping companies for leased containers could also occur due to consolidation caused by the financialfailure of container shipping companies, such as the bankruptcy of Hanjin during 2016.
Changes in market price or availability of containers in China could adversely affect our ability to maintainour supply of containers.
The vast majority of intermodal containers are currently manufactured in China, and we currentlypurchase almost all of our containers from manufacturers based there. In addition, the containermanufacturing industry in China is highly concentrated. If it became more expensive for us to procurecontainers in China because of further consolidation among container suppliers, a dispute with one of ourmanufacturers, increased tariffs imposed by the United States or other governments or for any other reason,we may have to seek alternative sources of supply. We may not be able to make alternative arrangementsquickly enough to meet our equipment needs, and the alternative arrangements may increase our costs.
It may become more expensive for us to store our off-hire containers.
We are dependent on third-party depot operators to repair and store our equipment in port areasthroughout the world. In many of these locations the land occupied by these depots is increasingly beingconsidered as prime real estate. Accordingly, local communities are considering increasing restrictions ondepot operations which may increase their costs of operation and in some cases force depots to relocate tosites further from port areas. Additionally, depots in prime locations may become filled to capacity basedon market conditions and may refuse additional containers due to space constraints. This could require usto enter into higher-cost storage agreements with third-party depot operators in order to accommodate ourcustomers’ turn-in requirements and could result in increased costs and expenses for us. If these changesaffect a large number of our depots, it could significantly increase the cost of maintaining and storing ouroff-hire containers.
18

We face extensive competition in the equipment leasing industry.
We may be unable to compete favorably in the highly competitive equipment leasing business.We compete with a number of major leasing companies, many smaller lessors, manufacturers of equipment,companies and financial institutions offering finance leases, promoters of equipment ownership and leasingas a tax-efficient investment, container shipping lines (which sometimes lease their excess container stocks),and suppliers of alternative types of containers for freight transport. Some of these competitors havegreater financial resources and access to capital than we do. Additionally, some of these competitors mayhave large, underutilized inventories of equipment, which could lead to significant downward pressure onper diem rates, margins and prices of equipment.
Our business requires large amounts of working capital to fund our operations. We are aware thatsome of our competitors have had ownership changes and there has been consolidation in the industry inrecent years. As a consequence, these competitors may have greater resources available to aggressively seekto expand their market share. This could include offering lease rates with which we may not be able toeffectively compete. We may not be able to compete successfully against these competitors.
Competition among equipment leasing companies depends upon many factors, including, amongothers, per diem rates; lease terms, including lease duration, drop-off restrictions and repair provisions;customer service; and the location, availability, quality and individual characteristics of equipment units.The highly competitive nature of our industry may reduce lease rates and margins and undermine ourability to maintain our current level of container utilization or achieve our growth plans.
The international nature of our business exposes us to numerous risks.
Our ability to enforce lessees’ obligations will be subject to applicable law in the jurisdiction in whichenforcement is sought. As containers are predominantly located on international waterways, it is notpossible to predict, with any degree of certainty, the jurisdictions in which enforcement proceedings may becommenced. For example, repossession from defaulting lessees may be difficult and more expensive injurisdictions in which laws do not confer the same security interests and rights to creditors and lessors asthose in the United States and in other jurisdictions where recovery of containers from defaulting lessees ismore cumbersome. As a result, the relative success and expedience of enforcement proceedings with respectto containers in various jurisdictions cannot be predicted.
We are also subject to risks inherent in conducting business across national boundaries, any one ofwhich could adversely impact our business. These risks include:
• regional or local economic downturns;
• changes in governmental policy or regulation;
• restrictions on the transfer of funds into or out of the countries in which we operate;
• value-added tax and other sales-type taxes which could result in additional costs to us if they arenot properly collected or paid;
• domestic and foreign customs and tariffs;
• international incidents;
• war, hostilities, terrorist attacks, piracy, or the threat of any of these events;
• government instability;
• nationalization of foreign assets;
• government protectionism;
• compliance with export controls, including those of the U.S. Department of Commerce;
• compliance with import procedures and controls, including those of the DHS;
19

• consequences from changes in tax laws, including tax laws pertaining to container investors;
• potential liabilities relating to foreign withholding taxes;
• labor or other disruptions at key ports;
• difficulty in staffing and managing widespread operations;
• restrictive local employment laws; and
• restrictions on our ability to own or operate subsidiaries, make investments or acquire newbusinesses in these jurisdictions.
One or more of these factors could impair our current or future international operations and, as aresult, harm our overall business, financial condition, results of operations and cash flows.
We may incur costs associated with new security regulations, which may adversely affect our business, financialcondition and results of operations.
We may be subject to regulations promulgated in various countries, including the United States,seeking to protect the integrity of international commerce and prevent the use of equipment forinternational terrorism or other illicit activities. For example, the Container Security Initiative, theCustoms-Trade Partnership Against Terrorism and Operation Safe Commerce are among the programsadministered by the DHS that are designed to enhance security for cargo moving throughout theinternational transportation system by identifying existing vulnerabilities in the supply chain anddeveloping improved methods for ensuring the security of containerized cargo entering and leaving theUnited States. Moreover, the CSC applies to new and existing containers and seeks to maintain a high levelof safety of human life in the transport and handling of containers by providing uniform internationalsafety regulations. As these regulations develop and change, we may incur compliance costs due to theacquisition of new, compliant equipment and/or the adaptation of existing equipment to meet newrequirements imposed by such regulations. Additionally, certain companies are currently developing or mayin the future develop products designed to enhance the security of equipment transported in internationalcommerce. Regardless of the existence of current or future government regulations mandating the safetystandards of intermodal shipping equipment, our competitors may adopt such products or our equipmentlessees may require that we adopt such products. In responding to such market pressures, we may incurincreased costs, which could have a material adverse effect on our business, financial condition, results ofoperations and cash flows.
We operate in numerous tax jurisdictions and a taxing authority within any of these jurisdictions maychallenge our operating structure which could result in additional taxes, interest and penalties that couldmaterially impact our financial conditions and our future financial results.
We have structured our Company and its domestic and international subsidiaries to minimize ourincome tax obligations in countries in which we operate. There can be no assurance that our tax structureand the amount of taxes we pay in any of these countries will not be challenged by the relevant taxingauthorities. If the tax authorities challenge our tax positions or the amount of taxes paid for the purchase,lease or sale of equipment in each jurisdiction in which we operate, we could incur substantial expensesassociated with defending our tax position as well as expenses associated with the payment of anyadditional taxes, penalties and interest that may be imposed on us. The payment of these amounts couldhave an adverse material effect on our business, financial condition, results of operations and cash flows.
20
Environmental liability may adversely affect our business and financial condition.
We are subject to federal, state, local and foreign laws and regulations relating to the protection of theenvironment, including those governing the discharge of pollutants to air, ground and water, themanagement and disposal of hazardous substances and wastes and the cleanup of contaminated sites.We could incur substantial costs, including cleanup costs, fines and costs arising out of third-party claimsfor property or natural resource damage and personal injury, as a result of violations of or liabilities underenvironmental laws and regulations in connection with our or our lessees’ current or historical operations.Under some environmental laws in the United States and certain other countries, the owner or operator ofa container may be liable for environmental damage, cleanup or other costs in the event of a spill ordischarge of material from a container without regard to whether or not the spill or discharge was the faultof the owner or operator. While we typically maintain liability insurance and typically require lessees toprovide us with indemnity against certain losses, insurance coverage may not be sufficient, or available, toprotect against any or all liabilities and such indemnities may not be sufficient to protect us against lossesarising from environmental damage. Moreover, our lessees may not have adequate resources, or may refuseto honor their indemnity obligations and our insurance coverage is subject to large deductibles, coveragelimits and significant exclusions.
Many countries, including the United States, restrict, prohibit or otherwise regulate the use of chemicalrefrigerants due to their ozone depleting and global warming effects. Our refrigerated containers currentlyuse R134A or 404A refrigerant. While R134A and 404A do not contain Chlorofluorocarbons (CFCs)(which have been restricted since 1995), the European Union (EU) has instituted regulations, which beganin 2011 to phase out the use of R134A in automobile air conditioning systems due to concern that therelease of R134A into the atmosphere may contribute to global warming. While the EU regulations do notcurrently restrict the use of R134A or 404A in refrigerated containers or trailers, it has been proposed that,beginning in 2025, R134A and 404A usage in refrigerated containers will be banned, although the finaldecision has not yet been made. Further, certain manufacturers of refrigerated containers, including thelargest manufacturer of cooling machines for refrigerated containers, have begun testing units that utilizealternative refrigerants, such as carbon dioxide, that may have less global warming potential thanR134A and 404A. If future regulations prohibit the use or servicing of containers using R134A or 404Arefrigerants, we could be forced to incur large retrofitting expenses. In addition, refrigerated containers thatare not retrofitted may become difficult to lease, command lower rental rates and disposal prices, or mayhave to be scrapped.
Before 2010, foam insulation in the walls of intermodal refrigerated containers required the use of ablowing agent that contained hydrochlofluorcarbons (specifically HCFC-141b). Since 2010, ourmanufacturers have phased out the use of this blowing agent in the manufacturing process, replacing thatblowing agent with cyclopentane, which contains no CFCs. However, we may still have intermodalrefrigerated containers in our fleet that used HCFC-141b in their production. The EU prohibits the importand the placing on the market in the EU of intermodal containers with insulation made with HCFC-141b(EU Regulation). However, the European Commission has recognized that notwithstanding its regulation,under international conventions governing free movement of intermodal containers, the use of suchintermodal refrigerated containers admitted into EU countries on temporary customs admission should bepermitted. Each country in the EU has its own individual and different regulations to implement the EURegulation. We have procedures in place that we believe comply with the EU and country regulations.However, if such intermodal refrigerated containers exceed their temporary customs admission periodand/or their custom admissions status changes (e.g., should such container be off-hired) and suchintermodal refrigerated containers are deemed placed on the market in the EU, or if our procedures aredeemed not to comply with EU or a country’s regulation, we could be subject to fines and penalties. Also, iffuture international conventions or regulations prohibit the use or servicing of containers with foaminsulation that utilized this blowing agent during the manufacturing process, we could be forced to incurlarge retrofitting expenses and those containers that are not retrofitted may become more difficult to leaseand command lower rental rates and disposal prices.
21

An additional environmental concern affecting our operations relates to the construction materialsused in our dry containers. The floors of dry containers are plywood, usually made from tropicalhardwoods. Due to concerns about the de-forestation of tropical rain forests and climate change, manycountries that have been the source of these hardwoods have implemented severe restrictions on the cuttingand export of these woods. Accordingly, container manufacturers have switched a significant portion ofproduction to more readily available alternatives such as birch, bamboo, and other farm grown woodspecies. Container users are also evaluating alternative designs that would limit the amount of plywoodrequired and are also considering possible synthetic materials to replace the plywood. These new woods orother alternatives have not proven their durability over the typical 10 to 15 year life of a dry container, andif they cannot perform as well as the hardwoods have historically, the future repair and operating costs forthese containers could be significantly higher and the useful life of the containers may be decreased.
Use of counterfeit and improper refrigerant in refrigeration machines for refrigerated containers could result inirreparable damage to the refrigeration machines, death or personal injury, and materially impair the value ofour refrigerated container fleet.
There are reports of counterfeit and improper refrigerant gas being used to service refrigerationmachines. The use of this counterfeit gas has led to the explosion of several refrigeration machines withinthe industry. A small number of these incidents have resulted in personal injury or death and, in all cases,the counterfeit gas has led to irreparable damage to the refrigeration machines.
A testing procedure has been developed and approved by the IICL to determine whether counterfeitgas has been used to service a refrigeration machine. These tests are carried out on our refrigerationmachines when they are off-hired and returned to a depot. If such tests are not proven safe and effective orif the use of such counterfeit and improper refrigerant is more widespread than currently believed, the valueof our refrigerated container fleet and our ability to lease refrigerated containers could be materiallyimpaired and could therefore have a material adverse effect on our business, financial condition, results ofoperations and cash flows.
Certain liens may arise on our equipment.
Depot operators, repairmen and transporters may come into possession of our equipment from time totime and have sums due to them from lessees or sub-lessees of equipment. In the event of nonpayment ofthose charges by lessees or sub-lessees, we may be delayed in, or entirely barred from, repossessingequipment, or be required to make payments or incur expenses to discharge liens on our equipment.
The lack of an international title registry for containers increases the risk of ownership disputes.
There is no internationally recognized system of recordation or filing to evidence our title to containersnor is there an internationally recognized system for filing security interests in containers. Although we havenot incurred material problems with respect to this lack of an internationally recognized system, the lack ofan international title recordation system for containers could result in disputes with lessees, end-users, orthird parties who may improperly claim ownership of the containers.
Risks Related to Railcar Leasing
Weak economic conditions, financial market volatility, and other factors may decrease customer demand forour assets and services and negatively impact our business and results of operations.
We rely on continued demand from our customers to lease our railcars. Demand for railcars dependson the markets for our customers’ products and services and the strength and growth of their businesses.Some of our customers operate in cyclical markets, such as the steel, chemical, energy and constructionindustries, which are susceptible to macroeconomic downturns and may experience significant changes indemand over time. Weakness in certain sectors of the economy in the United States and other parts of theworld may make it more difficult for us to lease certain types of railcars that are either returned at the endof a lease term or returned as a result of a customer bankruptcy or default. We have experienced continuedweakness in macroeconomic conditions in the railcar business over the last year.
22

In many cases, demand for our assets also depends on our customers’ desire to lease, rather than buy,the assets. Tax and accounting considerations, interest rates, and operational flexibility, among otherfactors, may influence a customer’s decision to lease or buy assets. We have no control over these externalconsiderations, and changes in these factors, including potential changes to lease accounting rules, couldnegatively impact demand for our assets held for lease.
Additional factors, such as changes in harvest or production volumes, changes in supply chains,choices in types of transportation assets, availability of substitutes and other operational needs may alsoinfluence customer demand for our assets. Significant declines in customer demand for our assets andservices or continued weakness in macroeconomic conditions in the railcar business could adversely affectour financial performance.
We may be unable to maintain assets on lease at satisfactory rates.Our profitability depends on our ability to lease railcars at satisfactory rates, sell railcars, and to
re-lease railcars upon lease expiration. Circumstances such as economic downturns, changes in customerbehavior, excess capacity in particular railcar types or generally in the marketplace, or other changes insupply or demand can adversely affect asset utilization rates and lease rates. Economic uncertainty or adecline in customer demand for our railcars could cause customers to request shorter lease terms and lowerlease rates, which may result in a decrease in our asset utilization rate and reduced revenues. Alternatively,customers may seek to lock-in relatively low lease rates for longer terms, which may result in an adverseimpact on current or future revenues.
We enter long-term railcar purchase commitments that could subject us to material operational and financialrisks.
In order to obtain committed access to a supply of newly built railcars on competitive terms, we haveentered into long-term supply agreements with manufacturers to purchase significant numbers of newlybuilt railcars over a multi-year period. In many cases, we cannot economically cancel or materially reduce orreschedule our orders under these purchase commitments. If economic conditions weaken during the termof a long-term supply agreement, it is possible that we may be required to continue to accept delivery of,and pay for, new railcars at times when it may be difficult for us to lease such railcars and our financingcosts may be high, which could negatively affect our revenues and profitability. For example, in 2015 weentered into an agreement with a railcar manufacturer to purchase 2,000 new railcars. In 2018, we enteredinto an amendment to the agreement, by which we modified the type of railcars yet to be delivered andincreased the total car count to 2,050 as of the date of the amendment. As of December 31, 2018,1,600 railcars had been delivered under the agreement and the remaining 450 railcars are to be delivered in2019 at a cost of $58.6 million. Due to a weak and highly competitive railcar leasing environment, 280 ofthese cars currently remain off-lease. We intend to place all of these railcars on multi-year leases, but if weare not able to do so at rates that are sufficient to earn a return on our investment, it could have a materialadverse effect on our business, financial condition, results of operations and cash flows.
A significant and sustained decrease in the price of crude oil and related products could reduce customerdemand for our railcars.
Demand for railcars that are used to transport commodities used in drilling operations, including fracsand, is dependent on the demand for these commodities. Sustained low oil prices could cause oil producersto curtail the drilling of new wells or cease production at certain existing wells that are uneconomical tooperate at current crude price levels. Reduced oil drilling activity could result in decreased demand for ourrailcars used to transport the commodities used in drilling operations, such as frac sand.
Changes in railroad efficiency may adversely affect demand for our railcars.Railroad infrastructure investments that improve efficiency or declines in rail traffic due to decreased
demand could increase the average speed at which railroads can operate their trains, which may reduce thenumber of railcars needed for railroads to haul the same amount of cargo. Adverse weather conditions,railroad mergers, and increase in rail traffic could result in slower transit times making rail transportationless attractive to shippers versus other modes of transport. In each case, these changes could reducedemand for our railcars and negatively impact revenue and our result of operations.
23

A significant decrease in lease renewals by our customers could negatively impact operations and substantiallyincrease our costs.
Decreases in customer demand for our railcars could increase the number of leases that are notrenewed upon expiration, resulting in the early return of railcars. Railcars that are returned by ourcustomers often must undergo maintenance and service work before being leased to new customers.A significant increase in the number of railcars requiring maintenance may negatively affect our operationsand substantially increase maintenance and other related costs. In addition, low demand for certain types ofrailcars in our fleet may make those railcars more difficult to lease to new customers if they are returned atthe end of their existing leases or following a customer default, which could negatively affect our results ofoperations.
Our rail operations are subject to various laws, rules, and regulations. If these laws, rules, and regulationschange or we fail to comply with them, it could have a significant negative effect on our business andprofitability.
Our rail operations are subject to various laws, rules, and regulations administered by authorities injurisdictions where we do business. In the United States, our railcar fleet is subject to safety, operations,maintenance, and mechanical standards, rules, and regulations enforced by various federal and stateagencies and industry organizations, including the DOT, the FRA, and the AAR. State agencies regulatesome health and safety matters related to rail operations not otherwise preempted by federal law.Our business and railcar fleet may be adversely impacted by new rules or regulations, or changes to existingrules or regulations, which could require additional maintenance or substantial modification orrefurbishment of our railcars, or could make certain types of railcars inoperable or obsolete or require themto be phased out prior to the end of their useful lives. In addition, violations of these rules and regulationscan result in substantial fines and penalties, including potential limitations on operations or forfeitures ofassets.
We are subject to extensive environmental regulations and the costs of remediation may be material.
We are subject to extensive federal, state, and local environmental laws and regulations concerning,among other things, the discharge of hazardous materials. Under some environmental laws in theUnited States, the owner of a leased railcar may be liable for environmental damage, cleanup or other costsin the event of a spill or discharge of material from a railcar without regard to the owner’s fault. Weroutinely assess environmental liabilities, including our potential obligations and the possible amount ofrecoveries from other responsible parties. Due to the regulatory complexities and the potential liability forthe operations of our lessees, it is possible environmental and remediation costs could adversely affect ourfinancial performance.
We may incur future asset impairment charges.
We review long-lived assets for impairment regularly, or when circumstances indicate the carrying valueof an asset or investment may not be recoverable. Among other circumstances, the following may changeour estimates of the cash flows we expect our long-lived assets will generate, which could require us torecognize asset impairment charges:
• a weak economic environment or challenging market conditions;
• new laws, rules or regulations affecting our assets, or changes to existing laws, rules or regulations;
• events related to particular customers or asset types; and
• asset portfolio sale decisions by management.
24

Our assets may become obsolete.
In addition to changes in laws, rules, and regulations that may make assets obsolete, changes in thepreferred method our customers use to ship their products, changes in demand for particular products, or ashift by customers toward purchasing assets rather than leasing them may adversely impact us.Our customers’ industries are driven by dynamic market forces and trends, which are influenced byeconomic and political factors. Changes in our customers’ markets may significantly affect demand for ourrail assets. A reduction in customer demand or change in customers’ preferred method of producttransportation could result in the economic obsolescence of the assets leased by those customers.
Competition could result in decreased profitability.
We operate in a highly competitive business environment. In certain cases, our competitors are largerthan we are and have greater financial resources, higher credit ratings, and a lower cost of capital.In addition, we compete against railcar manufacturers that have leasing subsidiaries. These factors mayenable our competitors to offer leases to customers at lower rates than we can provide, thus negativelyimpacting our profitability, asset utilization and investment volume.
We derive a substantial portion of our revenue from a limited number of railcar lessees. The loss of, orreduction in business by, any of these railcar lessees, or a default from any large railcar lessee, could result in asignificant loss of revenue and cash flow.
We have derived, and believe that we will continue to derive, a significant portion of our revenue andcash flow from a limited number of railcar lessees. Billings from our ten largest railcar lessees represented54.2% of total billings for this segment for the year ended December 31, 2018. The loss of such customerswould have a material adverse impact on our business, financial condition, results of operations and cashflows. In addition, a default by any of our largest railcar lessees would result in a major reduction in ourleasing revenue, large repossession expenses, potentially large lost equipment charges and a material adverseimpact on our performance and financial condition.
Lessee defaults may adversely affect our business, results of operations and financial condition by decreasingrevenue and increasing storage, repositioning, collection and recovery expenses.
Our railcar equipment is leased to numerous lessees. Lessees are required to pay rent and indemnify usfor damage to or loss of equipment. Lessees may default in paying rent and performing other obligationsunder their leases. A delay or diminution in amounts received under the leases, or a default in theperformance of maintenance or other lessee obligations under the leases could adversely affect our business,financial condition, results of operations and cash flows and our ability to make payments on our debt.
Our cash flows from railcar equipment, principally railcar rental revenue, are affected significantly bythe ability to collect payments under leases and the ability to replace cash flows from terminating leases byre-leasing or selling equipment on favorable terms. All of these factors are subject to external economicconditions and the performance by lessees and service providers that are not within our control.
In addition, when lessees default, we may fail to recover all of our equipment, and the equipment wedo recover may be returned in damaged condition or to locations where we will not be able to efficientlyre-lease or sell the equipment. As a result, we may have to repair and reposition the equipment to otherplaces where we can re-lease or sell it, and we may lose revenue and incur additional operating expenses inrepossessing, repositioning and storing the equipment.
We maintain insurance to reimburse the Company for customer defaults. The insurance agreements aresubject to deductibles of $3.0 million or $3.5 million per occurrence, depending on the customer’s creditrating, and have significant exclusions and, therefore, may not be sufficient to prevent us from sufferingmaterial losses. Our level of insurance cover in 2019 is limited to $23.2 million or $23.7 million peroccurrence and $28.2 million and $28.7 million in aggregate, depending on the customer’s credit rating.Additional insurance claims made by the Company may result in such insurance not being available to us inthe future on commercially reasonable terms, or at all.
25

Certain liens may arise on our equipment.
Depot operators and repairmen may come into possession of our equipment from time to time andhave sums due to them from lessees or sub-lessees of equipment. In the event of nonpayment of thosecharges by lessees or sub-lessees, we may be delayed in, or entirely barred from, repossessing equipment, orbe required to make payments or incur expenses to discharge liens on our equipment.
Risk Related to Logistics
Because we depend on railroads for our operations, our operating results and financial condition are likely to beadversely affected by any reduction or deterioration in rail service.
We depend on the major railroads in the United States for virtually all of the intermodal services weprovide. In many markets, rail service is limited to one or two railroads. Consequently, a reduction in, orelimination of, rail service to a particular market is likely to adversely affect our ability to provideintermodal transportation services to some of our customers. In addition, the railroads are relatively free toadjust shipping rates up or down as market conditions permit. Rate increases would result in higherintermodal transportation costs, reducing the attractiveness of intermodal transportation compared totruck or other transportation modes, which could cause a decrease in demand for our services. Further, ourability to continue to expand our intermodal transportation business is dependent upon the railroads’ability to increase capacity for intermodal freight and provide consistent and reliable service. Our businesscould also be adversely affected by a work stoppage at one or more railroads or by adverse weatherconditions or other factors that hinder the railroads’ ability to provide reliable transportation services. Inthe past, there have been service issues when railroads have merged. As a result, we cannot predict whateffect, if any, further consolidations among railroads may have on intermodal transportation services or ourresults of operations.
Because our relationships with the major railroads are critical to our ability to provide intermodaltransportation services, our business may be adversely affected by any change to those relationships.
We have important relationships with certain major U.S. railroads. To date, the railroads have chosento rely on us, other IMCs and other intermodal competitors to market their intermodal services rather thanfully developing their own marketing capabilities. If one or more of the major railroads were to decide toreduce their dependence on us, the volume of intermodal shipments we arrange would likely decline, whichcould adversely affect our results of operations and financial condition.
Because we rely on drayage companies in our intermodal operations, our ability to expand our business ormaintain our profitability may be adversely affected by a shortage of drivers and drayage capacity.
In certain markets we serve, we use third-party drayage companies for pickup and delivery of some orall of our intermodal containers. Most drayage companies operate relatively small fleets and have limitedaccess to capital for fleet expansion. In some of our markets, there are a limited number of drayagecompanies that can meet our quality standards. This could limit our ability to expand our intermodalbusiness or require us to establish more of our own drayage operations in some markets, which couldincrease our operating costs and could adversely affect our profitability and financial condition. Also, thetrucking industry periodically experiences a shortage of available drivers, which may limit the ability ofthird-party drayage companies to expand their fleets. This shortage also may require them to increasedrivers’ compensation, thereby increasing our cost of providing drayage services to our customers.Therefore, the driver shortage could also adversely affect our profitability and limit our ability to expandour intermodal business.
26
Because we depend on trucking companies for our truck brokerage services, our ability to maintain or expandour truck brokerage business may be adversely affected by a shortage of trucking capacity.
We depend upon various third-party trucking companies for the transportation of our customers’loads. Particularly during periods of economic expansion, trucking companies may be unable to expandtheir fleets due to capital constraints or chronic driver shortages, and these trucking companies also mayraise their rates. If we face insufficient capacity among our third-party trucking companies, we may beunable to maintain or expand our truck brokerage business. Also, we may be unable to pass rate increaseson to our customers, which could adversely affect our profitability.
Our results of operations are susceptible to changes in general economic conditions and cyclical fluctuations.Economic recession, customers’ business cycles, changes in fuel prices and supply, interest rate
fluctuations, increases in fuel or energy taxes and other general economic factors affect the demand fortransportation services and the operating costs of railroads, trucking companies and drayage companies.We have little or no control over any of these factors or their effects on the transportation industry.Increases in the operating costs of railroads, trucking companies or drayage companies can be expected toresult in higher freight rates. Our operating margins could be adversely affected if we were unable to passthrough to our customers the full amount of higher freight rates. Economic recession or a downturn incustomers’ business cycles also may have an adverse effect on our results of operations and growth byreducing demand for our services. Therefore, our results of operations, like the entire freight transportationindustry, are cyclical and subject to significant period-to-period fluctuations.
Relatively small increases in our transportation costs that we are unable to pass through to our customers arelikely to have a significant effect on our gross margin and operating income.
Because transportation costs represent such a significant portion of our costs, even relatively smallincreases in these transportation costs, if we are unable to pass them through to our customers, are likely tohave a significant effect on our gross margin and operating income.
The transportation industry is subject to government regulation, and regulatory changes could have a materialadverse effect on our operating results or financial condition.
We are licensed by the DOT as freight brokers. The DOT prescribes qualifications for acting in thiscapacity, including surety bond requirements. As freight brokers, we may become subject to new or morerestrictive regulations relating to new laws and regulations specific to legal liability, such as motor carriersare today. Future laws and regulations may be more stringent and require changes in operating practices,influence the demand for transportation services or increase the cost of providing transportation services,any of which could adversely affect our business and results of operations.
We are not able to accurately predict how new governmental laws and regulations, or changes toexisting laws and regulations, will affect the transportation industry generally, or us in particular. Althoughgovernment regulation that affects us and our competitors may simply result in higher costs that can bepassed along to customers, that may not be the case.
Our operations may be subject to various environmental laws and regulations, the violation of which couldresult in substantial fines or penalties.
From time to time, we arrange for the movement of hazardous materials at the request of ourcustomers. As a result, we may be subject to various environmental laws and regulations relating to thehandling of hazardous materials. If we are involved in a spill or other accident involving hazardousmaterials, or if we are found to be in violation of applicable laws or regulations, we could be subject tosubstantial fines or penalties and to civil and criminal liability, any of which could have an adverse effect onour business and results of operations.
We derive a significant portion of our logistics revenue from our largest customers and the loss of several ofthese customers could have a material adverse effect on our revenue and business.
Billings from our ten largest customers represented 30.2% of total billings for this segment for the yearended December 31, 2018. A reduction in or termination of our services by such customers could have amaterial adverse effect on our revenue and business.
27

Our obligation to pay our carriers is not contingent upon receipt of payment from our clients, and we extendcredit to certain clients as part of our business model.
In most cases, we take full risk of credit loss for the transportation services we procure from carriers.Our obligation to pay our carriers is not contingent upon receipt of payments from our clients. If any ofour key clients fail to pay for our services, our profitability would be negatively impacted.
We extend credit to certain clients in the ordinary course of business as part of our business model.By extending credit, we increase our exposure to uncollected receivables. A deterioration in the global ordomestic economy could drive an increase in business failures, downsizing and delinquencies, which couldcause an increase in our credit risk. If we fail to monitor and manage effectively any increased credit risk,our immediate and long-term liquidity may be adversely affected.
An economic downturn could materially adversely affect our business.
Our operations and performance depend significantly on economic conditions. Uncertainty aboutglobal economic conditions poses a risk as consumers and businesses may postpone spending in response totighter credit, negative financial news and/or declines in income, which could have a material negative effecton demand for transportation services. We are unable to predict the likely duration and severity ofdisruptions in the financial markets and adverse global economic conditions. If economic conditionsdeteriorate, our business and results of operations could be materially and adversely affected. Other factorsthat could influence demand include fluctuations in fuel costs, labor costs, consumer confidence,international trade or military conflicts, and other macroeconomic factors affecting consumer spendingbehavior. There could be a number of follow-on effects from a credit crisis on our business, including theinsolvency of key transportation providers and the inability of our customers to obtain credit to financedevelopment and/or manufacture products resulting in a decreased demand for transportation services.Our revenues and gross margins are dependent upon this demand, and if demand for transportationservices declines, our revenues and gross margins could be adversely affected.
Continued weakness in the logistics business could have an adverse effect on our overall business, results ofoperations and financial condition, and may require us to record an impairment charge with respect to theassets relating to our logistics business.
We have recently reported losses in our logistics business. Continued weakness or other disruptions inthe logistics segment could have a material adverse effect on our overall business, results of operations orfinancial condition, and could require us to record impairment charges in the future with respect to theassets relating to our logistics business. Any impairment charge would result in an immediate reduction toour earnings in the period in which the charge is taken, which could have a material adverse effect on ourresults of operations and financial condition.
If we fail to maintain and enhance our information technology systems, or if we fail to successfully implementnew technology or enhancements, we may be at a competitive disadvantage and lose customers.
We continue to see technology as key to driving internal efficiencies as well as providing additionalcapabilities to customers and carriers. We expect our customers to continue to demand more sophisticatedtechnology-driven solutions from their suppliers and we may need to enhance or replace our informationtechnology systems in response. This may involve significant implementation costs and potential challenges.
Technology and new market entrants may also disrupt the way we and our competitors operate.As technology improves and new companies enter the freight brokerage market, our customers may beable to find alternatives to our services for matching shipments with available freight hauling capacity.We will continue to develop innovative emerging technologies to source, track and provide visibility tocapacity while exploiting machine learning and artificial intelligence to further improve customer outcomes.
28

General Business Risks
Our level of indebtedness reduces our financial flexibility and could impede our ability to operate.
We have a significant amount of indebtedness and we intend to borrow additional amounts under ourcredit facilities to purchase equipment and make acquisitions and other investments. We expect that we willmaintain a significant amount of indebtedness on an ongoing basis. As of December 31, 2018, our totaloutstanding debt was $2,179.4 million. Interest expense on such debt will be $20.4 million per quarter for2019, assuming floating interest rates remain consistent with those as of December 31, 2018. There is noassurance that we will be able to refinance our outstanding indebtedness when it becomes due, or, ifrefinancing is available, that it can be obtained on terms that we can afford.
Some of our credit facilities require us to pay a variable rate of interest, which will increase or decreasebased on variations in certain financial indices, and increases in interest rates can significantly decrease ourprofits. We do not have any hedge or similar contracts that would protect us against changes in interest rates.
The amount of our indebtedness could have important consequences for us, including the following:
• requiring us to dedicate a substantial portion of our cash flow from operations to make paymentson our debt, thereby reducing funds available for operations, future business opportunities andother purposes;
• limiting our flexibility in planning for, or reacting to, changes in our business and the industry inwhich we operate;
• making it more difficult for us to satisfy our debt obligations, and any failure to comply with suchobligations, including financial and other restrictive covenants, could result in an event of defaultunder the agreements governing such indebtedness, which could lead to, among other things, anacceleration of our indebtedness or foreclosure on the assets securing our indebtedness, whichcould have a material adverse effect on our business, financial condition, results of operations andcash flows;
• making it difficult for us to pay dividends on, or repurchase, our common stock, our Series APreferred Stock or our Series B Preferred Stock;
• placing us at a competitive disadvantage compared to our competitors having less debt;
• limiting our ability to borrow additional funds, or to sell assets to raise funds, if needed, forworking capital, capital expenditures, acquisitions or other purposes; and
• increasing our vulnerability to general adverse economic and industry conditions, includingchanges in interest rates.
We may not generate sufficient cash flow from operations to service and repay our debt and relatedobligations and have sufficient funds left over to achieve or sustain profitability in our operations, meet ourworking capital and capital expenditure needs or compete successfully in our industry.
We will require a significant amount of cash to service and repay our outstanding indebtedness and our abilityto generate cash depends on many factors beyond our control.
Our ability to make payments on and repay our indebtedness and to fund planned capital expenditureswill depend on our ability to generate cash in the future. As of December 31, 2018, our total outstandingdebt was $2,179.4 million. Interest expense on such debt will be $20.4 million per quarter in 2019, assumingfloating interest rates remain consistent with those at December 31, 2018. These amounts will increase tothe extent we borrow additional funds and if interest rates increase. It is possible that:
• our business will not generate sufficient cash flow from operations to service and repay our debtand to fund working capital requirements and planned capital expenditures;
• future borrowings will not be available under our current or future credit facilities in an amountsufficient to enable us to refinance our debt; or
• we will not be able to refinance any of our debt on commercially reasonable terms or at all.
29

Our credit facilities impose, and the terms of any future indebtedness may impose, significant operating,financial and other restrictions on us and our subsidiaries.
Restrictions imposed by our credit facilities or other indebtedness will limit or prohibit, among otherthings, our ability to:
• incur additional indebtedness;
• pay dividends on or redeem or repurchase our stock;
• enter into new lines of business;
• issue capital stock of our subsidiaries (except to the Company);
• make loans and certain types of investments;
• create liens;
• sell certain assets or merge with or into other companies;
• enter into certain transactions with stockholders and affiliates; and
• restrict dividends, distributions or other payments from our subsidiaries.
These restrictions could adversely affect our ability to finance our future operations or capital needsand pursue available business opportunities. A breach of any of these restrictions, including a breach offinancial covenants, could result in a default in respect of the related indebtedness. If a default occurs, therelevant lenders could elect to declare the indebtedness, together with accrued interest and fees, to beimmediately due and payable and proceed against any collateral securing that indebtedness, which wouldconstitute substantially all of our equipment assets.
Possible replacement of the LIBOR benchmark interest rate may have an impact on our business.
On July 27, 2017, the U.K. Financial Conduct Authority (the “FCA”), which regulates LIBOR,announced that it will no longer persuade or compel banks to submit rates for the calculation of LIBORrates after 2021. As a result, LIBOR may be discontinued after 2021. The FCA and the submitting LIBORbanks have indicated they will support the LIBOR indices through 2021 to allow for an orderly transition toan alternative reference rate. Financial services regulators and industry groups are evaluating the phase-outof LIBOR and the development of alternate reference rate indices or reference rates.
As of December 31, 2018, we had $801.1 million of debt outstanding on facilities with interest ratesbased on LIBOR.
Potential changes to the underlying floating rate indices may have an adverse impact on our liabilitiesindexed to LIBOR and could have a material adverse effect on our operating results and financialcondition.
30

Security breaches and other disruptions could compromise our information technology systems and expose usto a liability, which could have a material adverse effect on our business, results of operations and ourreputation.
In the ordinary course of business, we collect and store sensitive data on our systems and networks,including our proprietary business information and that of our customers and suppliers, and personallyidentifiable information of our customers and employees. The secure storage, processing, maintenance andtransmission of this information is critical to our operations. Despite security measures we employ, ourinformation technology systems and networks may be vulnerable to attacks by hackers or breached due toemployee error, malfeasance or other disruptions. Hackers and data thieves are increasingly sophisticatedand operate large-scale and complex automated attacks. Any breach of our network may result in the lossof valuable business data, misappropriation of our consumers’ or employees’ personal information, cause usto breach our legal, regulatory or contractual obligations, create an inability to access or rely upon criticalbusiness records or cause other disruptions of our business. Despite our existing security procedures andcontrols, if our network becomes compromised, it could give rise to unwanted media attention, materiallydamage our customer relationships, harm our business, our reputation, and our financial results, whichcould result in fines or lawsuits, and may increase the costs we incur to protect against such informationsecurity breaches, such as increased investment in technology, the costs of compliance with consumerprotection laws, and costs resulting from consumer fraud. These breaches may result from human error,equipment failure, or fraud or malice on the part of employees or third parties.
We expend significant financial resources to protect against such threats and may be required tofurther expend financial resources to alleviate problems caused by physical, electronic, and cyber securitybreaches. As techniques used to breach security are growing in frequency and sophistication and aregenerally not recognized until launched against a target, regardless of our expenditures and protectionefforts, we may not be able to implement security measures in a timely manner or, if and whenimplemented, these measures could be circumvented. Any breaches that may occur could expose us toincreased risk of lawsuits, loss of existing or potential future customers, harm to our reputation andincreases in our security costs, which could have a material adverse effect on our financial performance andoperating results.
In the event of a breach resulting in loss of data, such as personally identifiable information or othersuch data protected by data privacy or other laws, we may be liable for damages, fines and penalties for suchlosses under applicable regulatory frameworks despite not handling the data. Further, the regulatoryframework around data custody, data privacy and breaches varies by jurisdiction and is an evolving area oflaw. We may not be able to limit our liability or damages in the event of such a loss.
We are subject to legislative, regulatory, and legal developments involving taxes.Taxes are a significant part of our expenses. We are subject to U.S. federal, state, and foreign income,
payroll, property, sales and use, fuel, and other types of taxes. Changes in tax rates, such as those includedin the U.S. Tax Cuts and Jobs Act, enactment of new tax laws, revisions of tax regulations, and claims orlitigation with taxing authorities could result in a material effect to our results of operations, financialcondition, and liquidity. Higher tax rates could have a material adverse effect on our results of operations,financial condition, and liquidity.
Actual or threatened terrorist attacks, efforts to combat terrorism, or the outbreak of war and hostilities couldnegatively impact our operations and profitability and may expose us to liability.
Terrorist attacks and the threat of such attacks have contributed to economic instability in theUnited States and elsewhere, and further acts or threats of terrorism, violence, war or hostilities couldsimilarly affect world trade and the industries in which we and our customers operate. In addition, terroristattacks or hostilities may directly impact ports, depots, our facilities or those of our suppliers or customers,and could impact our sales and our supply chain. A severe disruption to the worldwide ports system andflow of goods could result in a reduction in the level of international trade and lower demand for ourequipment or services. Any of these events could also negatively affect the economy and consumerconfidence, which could cause a downturn in the transportation industry. The consequence of any terroristattacks or hostilities are unpredictable, and we may not be able to foresee events that could have an adverseeffect on our operations.
31

It is also possible that our equipment could be involved in a terrorist attack. Although our leaseagreements require our lessees to indemnify us against all damages arising out of the use of our containers,and we carry insurance to potentially offset any costs in the event that our customer indemnifications proveto be insufficient, our insurance does not cover certain types of terrorist attacks, and we may not be fullyprotected from liability of the reputational damage that could arise from a terrorist attack which utilizesone of our containers.
Our operations could be affected by natural or man-made events in the locations in which we or our customersor suppliers operate.
We have operations in locations subject to severe weather conditions, natural disasters, the outbreak ofcontagious disease, or man-made incidents such as chemical explosions, any of which could disrupt ouroperations. In addition, our suppliers and customers also have operations in such locations. For example, in2015, a chemical explosion and fire in the port of Tianjin, China damaged or destroyed a small number ofour containers and disrupted operations in the port. Similarly, outbreaks of pandemic or contagiousdiseases, such as H1N1 (swine) flu and the Ebola virus, could significantly reduce the demand forinternational shipping or could prevent our containers from being discharged in the affected areas or inother locations after having visited the affected areas. Any future natural or man-made disasters or healthconcerns in the world where we have business operations could lead to disruption of the regional and globaleconomies, which could result in a decrease in demand for leased containers.
We may be affected by market or regulatory responses to climate change.Changes in laws, rules, and regulations, or actions by authorities under existing laws, rules, or
regulations, to address greenhouse gas emissions and climate change could negatively impact our customersand business. For example, restrictions on emissions could significantly increase costs for our customerswhose production processes require significant amounts of energy. Customers’ increased costs could reducetheir demand to lease our assets. Potential consequences of laws, rules, or regulations addressing climatechange could have an adverse effect on our financial position, results of operations, and cash flows.
Our business could be adversely affected by strikes or work stoppages by draymen, truckers, port workers andrailroad workers.
There has been labor unrest, including strikes and work stoppages, among workers at varioustransportation providers and in industries affecting the transportation industry, such as port workers.We could lose business due to any significant work stoppage or slowdown and, if labor unrest results inincreased rates for transportation providers such as draymen, we may not be able to pass these costincreases on to our customers. Strikes among longshoremen and clerical workers at ports in the pastfew years have slowed down the ports for a time, creating a major impact on the transportation industry.Work stoppages occurring among owner-operators in a specific market have increased our operating costsperiodically over the past several years. In the past several years, there have been strikes involving railroadworkers. Future strikes by railroad workers in the United States, Canada or anywhere else that ourcustomers’ freight travels by railroad would impact our operations. Any significant work stoppage,slowdown or other disruption involving ports, railroads, truckers or draymen could adversely affect ourbusiness and results of operations.
Our senior executives are critical to the success of our business and our inability to retain them or recruit newpersonnel could adversely affect our business.
Most of our senior executives and other management-level employees have over fifteen years ofindustry experience. We rely on this knowledge and experience in our strategic planning and in ourday-to-day business operations. Our success depends in large part upon our ability to retain our seniormanagement, the loss of one or more of whom could have a material adverse effect on our business,financial condition, results of operations and cash flows. Our success also depends on our ability to retainour experienced sales force and technical personnel as well as recruiting new skilled sales, marketing andtechnical personnel. Competition for these individuals in our industry is intense and we may not be able tosuccessfully recruit, train or retain qualified personnel. If we fail to retain and recruit the necessarypersonnel, our business and our ability to obtain new equipment lessees and provide acceptable levels ofcustomer service could suffer.
32

We rely on our information technology systems to conduct our business. If these systems fail to adequatelyperform their functions, or if we experience an interruption in their operation, our business, results ofoperations and financial prospects could be adversely affected.
The efficient operation of our business is highly dependent on our information technology systems. Werely on our systems to track transactions, such as repair and depot charges and changes to book value, andmovements associated with each of our owned or managed equipment units. We use the informationprovided by our systems in our day-to-day business decisions in order to effectively manage our leaseportfolio and improve customer service. We also rely on them for the accurate tracking of the performanceof our managed fleet for each third-party investor, and the tracking and billing of logistics moves. Thefailure of our systems to perform as we expect could disrupt our business, adversely affect our financialcondition, results of operations and cash flows and cause our relationships with lessees and third-partyinvestors to suffer. In addition, our information technology systems are vulnerable to damage orinterruption from circumstances beyond our control, including fire, natural disasters, power loss andcomputer systems failures, unauthorized breach and viruses. Any such interruption could have a materialadverse effect on our business, reputation, results of operations and financial prospects.
As a U.S. corporation, we are subject to U.S. Executive Orders and U.S. Treasury Sanctions Regulationsregarding doing business in or with certain nations and specially designated nationals.
As a U.S. corporation, we are subject to U.S. Executive Orders and U.S. Treasury SanctionsRegulations restricting or prohibiting business dealings in or with certain nations and with certain speciallydesignated nationals (individuals and legal entities). Any perception or determination that we have violatedsuch Executive Orders and U.S. Treasury Sanctions Regulations could have a material adverse effect on ourbusiness, financial condition, results of operations and cash flows.
As a U.S. corporation, we are subject to the Foreign Corrupt Practices Act, and a determination that weviolated this act may affect our business and operations adversely.
As a U.S. corporation, we are subject to the regulations imposed by the Foreign Corrupt Practices Act(FCPA), which generally prohibits U.S. companies and their intermediaries from making improperpayments to foreign officials for the purpose of obtaining or keeping business. Any perception ordetermination that we have violated the FCPA could have a material adverse effect on our business,financial condition, results of operations and cash flows.
A failure to comply with export control or economic sanctions laws and regulations could have a materialadverse effect on our business, results of operations or financial condition. We may be unable to ensure that ouragents and/or customers comply with applicable sanctions and export control laws.
We face several risks inherent in conducting our business internationally, including compliance withapplicable economic sanctions laws and regulations, such as laws and regulations administered by the U.S.Department of Treasury’s Office of Foreign Assets Control (OFAC), the U.S. Department of State and theU.S. Department of Commerce. We must also comply with all applicable export control laws andregulations of the United States (including but not limited to the U.S. Export Administration Regulations)and other countries. Any determination of a violation or an investigation into violations of export controlsor economic sanctions laws and regulations could result in significant criminal or civil fines, penalties orother sanctions and repercussions, including reputational harm that could materially affect our business,results of operations or financial condition.
We may pursue acquisitions or joint ventures in the future that could present unforeseen integration obstaclesor costs.
We have pursued, and may continue to pursue, acquisitions and joint ventures in the future.Acquisitions involve a number of risks and present financial, managerial and operational challenges,including:
• potential disruption of our ongoing business and distraction of management;
• customer retention;
33

• difficulty integrating personnel and financial and other systems;
• hiring additional management and other critical personnel; and
• increasing the scope, geographic diversity and complexity of our operations.
In addition, we may encounter unforeseen obstacles or costs in the integration of acquired businesses.Also, the presence of one or more material liabilities of an acquired company that are unknown to us at thetime of acquisition may have a material adverse effect on our business. Acquisitions or joint ventures maynot be successful, we may not realize any anticipated benefits from acquisitions or joint ventures, we mayrealize dilutive earnings per share from such activities, and acquired businesses and joint ventures may incurlosses.
Fluctuations in foreign exchange rates could reduce our profitability.
Most of our revenues and costs are billed in U.S. dollars. Our operations and used equipment sales inlocations outside of the U.S. have some exposure to foreign currency fluctuations, and trade growth and thedirection of trade flows can be influenced by large changes in relative currency values. In addition, most ofour container equipment fleet is manufactured in China. Although the purchase price is in U.S. dollars, ourmanufacturers pay labor and other costs in the local currency, the Chinese yuan. To the extent that ourmanufacturers’ costs increase due to changes in the valuation of the Chinese yuan, the dollar price we payfor equipment could be affected. Adverse or large exchange rate fluctuations may negatively affect ourfinancial condition, results of operations and cash flows.
Risks Related to our Stock
Our common stock price has been volatile and may remain volatile.
The trading price of our common stock may be subject to wide fluctuations in response toquarter-to-quarter variations in operating results, new products or services by us or our competitors,general conditions in the shipping industry and the intermodal equipment sales and leasing markets,changes in earnings estimates by analysts, or other events or factors which may or may not be under ourcontrol. Broad market fluctuations may adversely affect the market price of our common stock. Since theinitial public offering of our common stock at $15.00 per share on May 16, 2007, the market price of ourcommon stock has fluctuated significantly from a high of $40.11 per share to a low of $2.12 per sharethrough February 28, 2019. Since the trading volume of our common stock is modest on a daily basis,shareholders may experience difficulties in liquidating our common stock at an acceptable price. Factorsaffecting the trading price of our common stock may include:
• variations in our financial results;
• changes in financial estimates or investment recommendations by any securities analysts followingour business;
• the public’s response to our press releases, our other public announcements and our filings withthe SEC;
• our ability to successfully execute our business plan;
• changes in accounting standards, policies, guidance, interpretations or principles;
• future sales of common stock by us or our directors, officers or significant stockholders or theperception such sales may occur;
• our ability to achieve operating results consistent with securities analysts’ projections;
• the operating and stock price performance of other companies that investors may deemcomparable to us;
• recruitment or departure of key personnel;
• our ability to timely address changing equipment lessee and third-party investor preferences;
34

• equipment market and industry factors;
• the size of our public float;
• general stock market conditions; and
• other events or factors, including those resulting from war, incidents of terrorism or responses tosuch events.
In addition, if the market for companies deemed similar to us or the stock market in generalexperiences loss of investor confidence, the trading price of our common stock could decline for reasonsunrelated to our business or financial results. The trading price of our common stock might also decline inreaction to events that affect other companies in our industry even if these events do not directly affect us.
Future new sales of our common stock or preferred stock by us or outstanding shares by existing stockholders,or the perception that there will be future sales of new shares from us or existing stockholders, may cause ourcommon stock or preferred stock price, as applicable, to decline and impair our ability to obtain capitalthrough future stock offerings.
In the future, we may sell additional shares of our common stock or preferred stock to raise additionalcapital. The issuance of additional shares of our common stock, preferred stock or convertible securities,will dilute the ownership interest of our common and preferred stockholders. In addition, our greater than5% stockholders may sell a substantial number of their shares in the public market, which could also affectthe market price for our common and preferred stock. We cannot predict the size of future sales orissuances of our common or preferred stock or the effect, if any, that they may have on the market price forour common and preferred stock. The issuance and/or sale of substantial amounts of common or preferredstock, or the perception that such issuances and/or sales may occur, could adversely affect the market priceof our common or preferred stock and impair our ability to raise capital through the sale of additionalequity or debts securities.
We do not currently pay dividends to holders of our common stock, and we cannot assure you that we will paydividends to holders of our common stock in the future.
Although our board of directors may consider a dividend policy under which we would pay cashdividends on our common stock, any determinations by us to pay cash dividends on our common stock inthe future will be based primarily upon our financial condition, results of operations, businessrequirements, tax considerations and our board of directors’ continuing determination that the declarationof dividends under the dividend policy are in the best interests of our stockholders and are in compliancewith all laws and agreements applicable to the dividend program. In addition, the terms of our creditagreements contain provisions restricting the payment of cash dividends subject to certain exceptions.Consequently, investors may be required to rely on sales of their common stock as the only way to realizeany future gains on their investment.
If securities analysts do not publish research or reports about our business or if they decrease their financialestimates or investment recommendations, the price of our stock could decline.
The trading market for our common and preferred stock may rely in part on the research and reportsthat industry or financial analysts publish about us or our business. We do not control or influence thedecisions or opinions of these analysts and analysts may not cover us.
If any analyst who covers us decreases his or her financial estimates or investment recommendation,the price of our common and preferred stock could decline. If any analyst ceases coverage of our company,we could lose visibility in the market, which in turn could cause our common or preferred stock price todecline.
35

Our certificate of incorporation and bylaws and Delaware law contain provisions that could discourage a thirdparty from acquiring us and consequently decrease the market value of an investment in our stock.
Our certificate of incorporation and bylaws and Delaware corporate law each contain provisions thatcould delay, defer or prevent a change in control of our company or changes in our management. Amongother things, these provisions:
• authorize us to issue preferred stock that can be created and issued by the board of directorswithout prior stockholder approval, with rights senior to those of our common stock;
• permit removal of directors only for cause by the holders of a majority of the shares entitled tovote at the election of directors and allow only the directors to fill a vacancy on the board ofdirectors;
• prohibit stockholders from calling special meetings of stockholders;
• prohibit stockholder action by written consent, thereby requiring all stockholder actions to betaken at a meeting of our stockholders;
• require the affirmative vote of 662∕3% of the shares entitled to vote to amend our bylaws andcertain articles of our certificate of incorporation, including articles relating to the classifiedboard, the size of the board, removal of directors, stockholder meetings and actions by writtenconsent;
• allow the authorized number of directors to be changed only by resolution of the board ofdirectors;
• establish advance notice requirements for submitting nominations for election to the board ofdirectors and for proposing matters that can be acted upon by stockholders at a meeting;
• classify our board of directors into three classes so that only a portion of our directors are electedeach year; and
• allow our directors to amend our bylaws.
These provisions could discourage proxy contests and make it more difficult for our stockholders toelect directors and take other corporate actions, which may prevent a change of control or changes in ourmanagement that a stockholder might consider favorable. In addition, Section 203 of the Delaware GeneralCorporation Law, which makes unfriendly takeover more difficult, may discourage, delay or prevent achange in control of us, which shareholders not affiliated with the takeover group might favor. Any delay orprevention of a change in control or change in management that stockholders might otherwise consider tobe favorable could cause the market price of our common stock to decline.
The change of control conversion right in our preferred stock may make it more difficult for a party to acquireus or discourage a party from acquiring us.
Upon the occurrence of a change of control, each holder of shares of our outstanding preferred stockwill have the right (subject to certain conditions) to convert some or all of the shares of preferred stock heldby such holder (the “Change of Control Conversion Right”). The Change of Control Conversion Rightmay have the effect of discouraging a third party from making an acquisition proposal for us or of delaying,deferring or preventing certain of our change of control transactions under circumstances that otherwisecould provide the holders of our preferred stock with the opportunity to realize a premium over thethen-current market price of such equity securities or that stockholders may otherwise believe is in theirbest interests.
ITEM 1B: UNRESOLVED STAFF COMMENTS
None.
36

ITEM 2: PROPERTIES
Office Locations. As of December 31, 2018, we operated our business in 22 offices in 12 differentcountries including the U.S. We have 10 offices in the U.S. including our headquarters in San Francisco,California. We have 12 offices outside the U.S., including offices operated by third-party corporate serviceproviders in Bermuda and Luxembourg. In addition, we have agents in Asia, Europe, Africa, and SouthAmerica. Our headquarters is used for our container leasing, rail leasing and logistics segments. Our officesin Everett, Washington, Eatontown, New Jersey, Portland, Oregon, Tampa, Florida, Jacksonville, Florida,Knoxville, Tennessee, Kennesaw, Georgia, and Dallas, Texas are used for our logistics segment operations.Each one of our other offices is used for our container leasing segment. All of our offices, except thoseoperated by third party corporate service providers, are leased.
The following table summarizes our office locations as of December 31, 2018:
Office Locations — U.S.San Francisco, CA (Headquarters)Charleston, SCEverett, WAEatontown, NJPortland, ORTampa, FLJacksonville, FLKnoxville, FLKennesaw, GADallas, TX
Office Locations — InternationalBrentwood, United KingdomSt. Michael, BarbadosAntwerp, BelgiumSingaporeDelmenhorst, GermanyHamburg, GermanyKuala Lumpur, MalaysiaTaipei, TaiwanLuxembourg City, LuxembourgHamilton, BermudaSeoul, South KoreaSydney, Australia
ITEM 3: LEGAL PROCEEDINGS
From time to time we may become a party to litigation matters arising in connection with the normalcourse of our business, including in connection with enforcing our rights under our leases. While we cannotpredict the outcome of these matters, in the opinion of our management, any liability arising from thesematters will not have a material adverse effect on our business, financial condition, results of operations orcash flows. Nevertheless, unexpected adverse future events, such as an unforeseen development in ourexisting proceedings, a significant increase in the number of new cases or changes in our current insurancearrangements could result in liabilities that have a material adverse impact on our business, financialcondition, results of operations or cash flows. We are currently not party to any material legal proceedingswhich are material to our business, financial condition, results of operations or cash flows.
ITEM 4: MINE SAFETY DISCLOSURES
Not applicable.
37

PART II
ITEM 5: MARKET FOR REGISTRANT’S COMMON EQUITY, RELATED STOCKHOLDERMATTERS AND ISSUER PURCHASES OF EQUITY SECURITIES
Our common stock is traded on the NYSE under the symbol “CAI.” As of February 6, 2019, therewere 38 registered holders of record of the common stock and 3,909 beneficial holders, based oninformation obtained from our transfer agent.
In addition, our Series A Preferred Stock and our Series B Preferred Stock are traded on the NYSEunder the symbols “CAI-PA” and “CAI-PB,” respectively.
Dividend Policy
We have never declared or paid dividends on our common stock. We are required to pay dividends of8.5% per annum on our outstanding shares of preferred stock. Our board of directors may consideradopting a dividend policy in the future with respect to our common stock. Any determinations by us topay cash dividends on our common stock in the future will be based primarily upon our financial condition,results of operations, business requirements, tax considerations and our board of directors’ continuingdetermination that the declaration of dividends under the dividend policy are in the best interests of ourstockholders and are in compliance with all laws and agreements applicable to the dividend program. In theabsence of such a policy, other than to pay dividends on our preferred stock, we intend to retain futureearnings to finance the operation and expansion of our business, and to repurchase our common stock.
Issuer Purchases of Equity Securities
Period
Total Number ofShares (or Units)
Purchased(1)
Average PricePaid per Share
(or Unit)(1)
Total Number ofShares (or Units)
Purchased as Part ofPublicly AnnouncedPlans or Programs(1)
Maximum Number (orApproximate Dollar
Value) of Shares(or Units)
that May Yet BePurchased Under thePlans or Programs(1)
October 1, 2018 – October 31, 2018 . . . . . — $ — — 3,000,000November 1, 2018 – November 30, 2018. . 285,886 24.78 285,886 2,714,114December 1, 2018 – December 31, 2018 . . 255,857 22.77 255,857 2,458,257Total . . . . . . . . . . . . . . . . . . . . . . . . . . 541,743 $ 23.83 541,743 2,458,257
(1) On October 8, 2018, we announced that our Board of Directors had approved the repurchase of up tothree million shares of outstanding common stock. The repurchase plan does not have an expirationdate and does not oblige us to acquire any particular amount of our common stock. As ofDecember 31, 2018, approximately 2.5 million shares remained available for repurchase under ourshare repurchase plan.
38

Performance Graph
The graph below compares cumulative shareholder returns on our common stock as compared withthe Russell 2000 Stock Index and the Dow Jones Transportation Stock Index for the period fromDecember 31, 2013 to December 31, 2018. The graph assumes an investment of $100 as of December 31,2013, and that all dividends were reinvested without the payment of any commissions. The stockperformance shown on the performance graph below is not necessarily indicative of future performance.
12/31/13 12/31/14 12/31/15 12/31/16 12/31/17 12/31/18
CAI International, Inc. Russell 2000 Index Dow Jones Transportation Index
25
50
75
100
125
150
175
200
Company/IndexDec. 31,
2013
Returns as of December 31,
2014 2015 2016 2017 2018
CAI International, Inc. . . . . . . . . . . . . . . . . . . . . . . . . . . $100 $ 98 $ 43 $ 37 $120 $ 99Russell 2000 Index . . . . . . . . . . . . . . . . . . . . . . . . . . . . . 100 104 98 117 132 116Dow Jones Transportation Index . . . . . . . . . . . . . . . . . . . 100 124 101 122 143 124
ITEM 6: SELECTED FINANCIAL DATA
The selected financial data presented below have been derived from our audited consolidated financialstatements. Historical results are not necessarily indicative of the results of operations to be expected infuture periods. You should read the selected consolidated financial data and operating data presented belowin conjunction with Item 7, “Management’s Discussion and Analysis of Financial Condition and Results ofOperations” and with our consolidated financial statements and related notes included elsewhere in thisAnnual Report on Form 10-K.
39
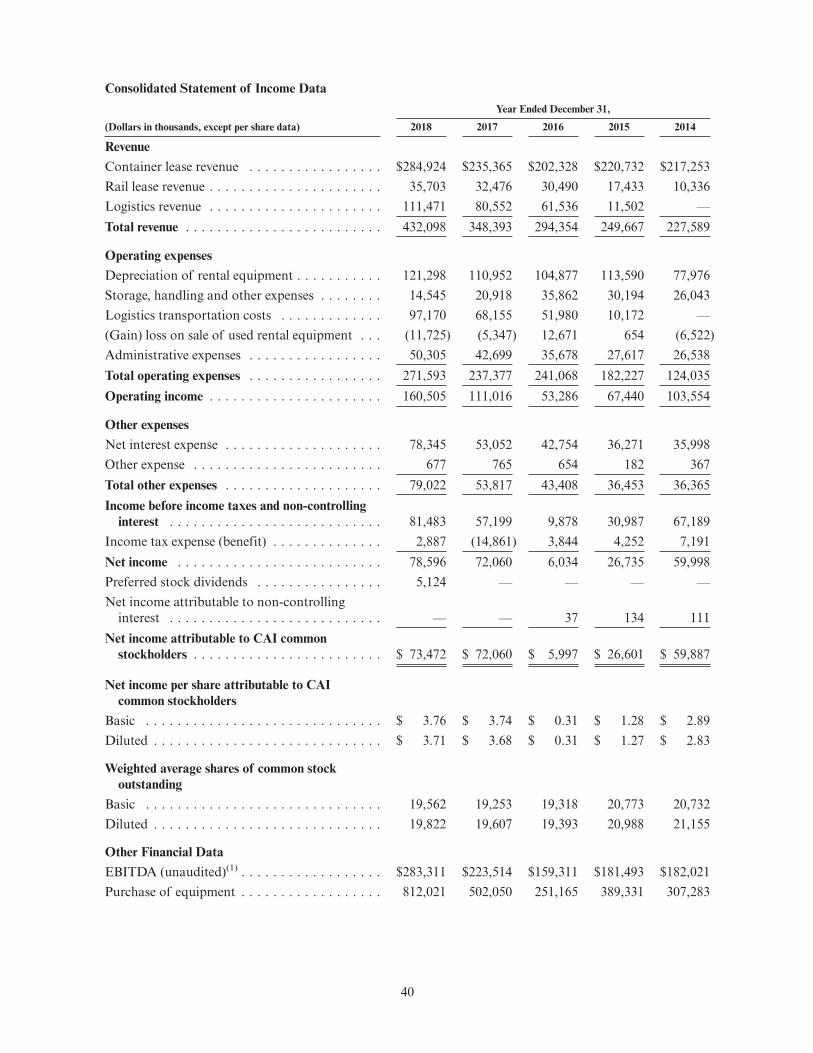
Consolidated Statement of Income DataYear Ended December 31,
(Dollars in thousands, except per share data) 2018 2017 2016 2015 2014
RevenueContainer lease revenue . . . . . . . . . . . . . . . . . $284,924 $235,365 $202,328 $220,732 $217,253Rail lease revenue . . . . . . . . . . . . . . . . . . . . . . 35,703 32,476 30,490 17,433 10,336Logistics revenue . . . . . . . . . . . . . . . . . . . . . . 111,471 80,552 61,536 11,502 —Total revenue . . . . . . . . . . . . . . . . . . . . . . . . . 432,098 348,393 294,354 249,667 227,589
Operating expensesDepreciation of rental equipment . . . . . . . . . . . 121,298 110,952 104,877 113,590 77,976Storage, handling and other expenses . . . . . . . . 14,545 20,918 35,862 30,194 26,043Logistics transportation costs . . . . . . . . . . . . . 97,170 68,155 51,980 10,172 —(Gain) loss on sale of used rental equipment . . . (11,725) (5,347) 12,671 654 (6,522)Administrative expenses . . . . . . . . . . . . . . . . . 50,305 42,699 35,678 27,617 26,538Total operating expenses . . . . . . . . . . . . . . . . . 271,593 237,377 241,068 182,227 124,035Operating income . . . . . . . . . . . . . . . . . . . . . . 160,505 111,016 53,286 67,440 103,554
Other expensesNet interest expense . . . . . . . . . . . . . . . . . . . . 78,345 53,052 42,754 36,271 35,998Other expense . . . . . . . . . . . . . . . . . . . . . . . . 677 765 654 182 367Total other expenses . . . . . . . . . . . . . . . . . . . . 79,022 53,817 43,408 36,453 36,365Income before income taxes and non-controlling
interest . . . . . . . . . . . . . . . . . . . . . . . . . . . 81,483 57,199 9,878 30,987 67,189Income tax expense (benefit) . . . . . . . . . . . . . . 2,887 (14,861) 3,844 4,252 7,191Net income . . . . . . . . . . . . . . . . . . . . . . . . . . 78,596 72,060 6,034 26,735 59,998Preferred stock dividends . . . . . . . . . . . . . . . . 5,124 — — — —Net income attributable to non-controlling
interest . . . . . . . . . . . . . . . . . . . . . . . . . . . — — 37 134 111Net income attributable to CAI common
stockholders . . . . . . . . . . . . . . . . . . . . . . . . $ 73,472 $ 72,060 $ 5,997 $ 26,601 $ 59,887
Net income per share attributable to CAIcommon stockholders
Basic . . . . . . . . . . . . . . . . . . . . . . . . . . . . . . $ 3.76 $ 3.74 $ 0.31 $ 1.28 $ 2.89Diluted . . . . . . . . . . . . . . . . . . . . . . . . . . . . . $ 3.71 $ 3.68 $ 0.31 $ 1.27 $ 2.83
Weighted average shares of common stockoutstanding
Basic . . . . . . . . . . . . . . . . . . . . . . . . . . . . . . 19,562 19,253 19,318 20,773 20,732Diluted . . . . . . . . . . . . . . . . . . . . . . . . . . . . . 19,822 19,607 19,393 20,988 21,155
Other Financial DataEBITDA (unaudited)(1) . . . . . . . . . . . . . . . . . . $283,311 $223,514 $159,311 $181,493 $182,021Purchase of equipment . . . . . . . . . . . . . . . . . . 812,021 502,050 251,165 389,331 307,283
40
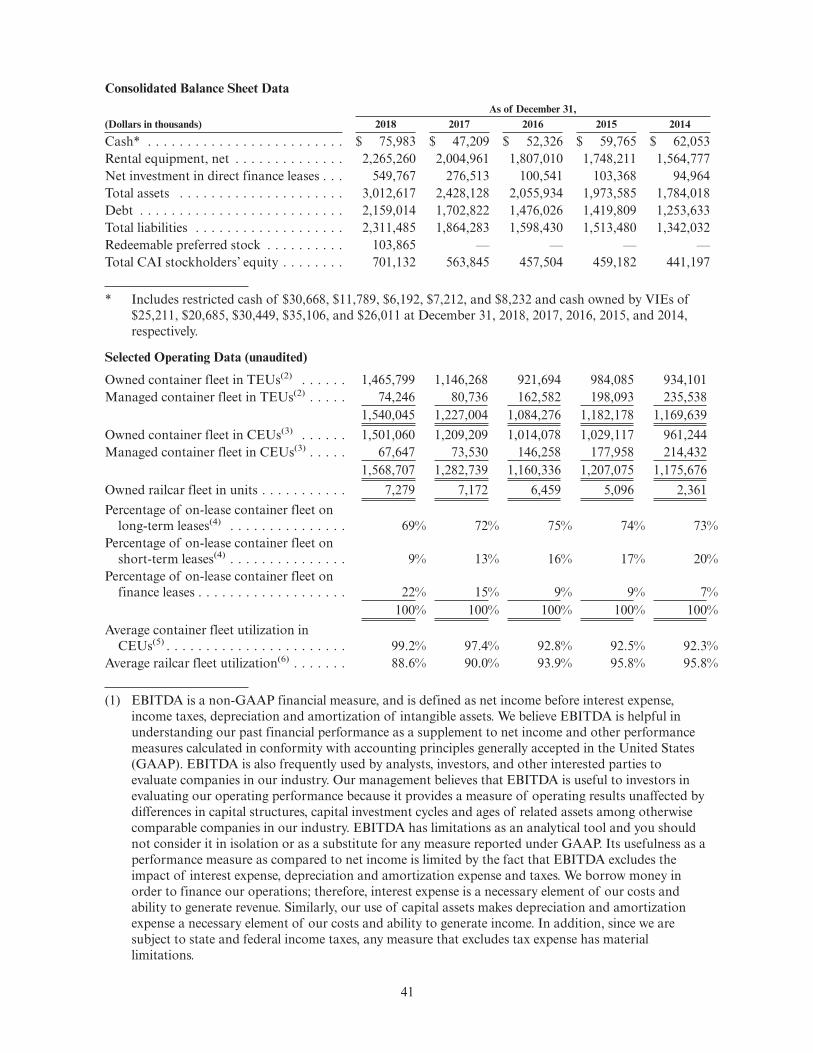
Consolidated Balance Sheet DataAs of December 31,
(Dollars in thousands) 2018 2017 2016 2015 2014
Cash* . . . . . . . . . . . . . . . . . . . . . . . . . $ 75,983 $ 47,209 $ 52,326 $ 59,765 $ 62,053Rental equipment, net . . . . . . . . . . . . . . 2,265,260 2,004,961 1,807,010 1,748,211 1,564,777Net investment in direct finance leases . . . 549,767 276,513 100,541 103,368 94,964Total assets . . . . . . . . . . . . . . . . . . . . . 3,012,617 2,428,128 2,055,934 1,973,585 1,784,018Debt . . . . . . . . . . . . . . . . . . . . . . . . . . 2,159,014 1,702,822 1,476,026 1,419,809 1,253,633Total liabilities . . . . . . . . . . . . . . . . . . . 2,311,485 1,864,283 1,598,430 1,513,480 1,342,032Redeemable preferred stock . . . . . . . . . . 103,865 — — — —Total CAI stockholders’ equity . . . . . . . . 701,132 563,845 457,504 459,182 441,197
* Includes restricted cash of $30,668, $11,789, $6,192, $7,212, and $8,232 and cash owned by VIEs of$25,211, $20,685, $30,449, $35,106, and $26,011 at December 31, 2018, 2017, 2016, 2015, and 2014,respectively.
Selected Operating Data (unaudited)
Owned container fleet in TEUs(2) . . . . . . 1,465,799 1,146,268 921,694 984,085 934,101Managed container fleet in TEUs(2) . . . . . 74,246 80,736 162,582 198,093 235,538
1,540,045 1,227,004 1,084,276 1,182,178 1,169,639Owned container fleet in CEUs(3) . . . . . . 1,501,060 1,209,209 1,014,078 1,029,117 961,244Managed container fleet in CEUs(3) . . . . . 67,647 73,530 146,258 177,958 214,432
1,568,707 1,282,739 1,160,336 1,207,075 1,175,676Owned railcar fleet in units . . . . . . . . . . . 7,279 7,172 6,459 5,096 2,361Percentage of on-lease container fleet on
long-term leases(4) . . . . . . . . . . . . . . . 69% 72% 75% 74% 73%Percentage of on-lease container fleet on
short-term leases(4) . . . . . . . . . . . . . . . 9% 13% 16% 17% 20%Percentage of on-lease container fleet on
finance leases . . . . . . . . . . . . . . . . . . . 22% 15% 9% 9% 7%100% 100% 100% 100% 100%
Average container fleet utilization inCEUs(5) . . . . . . . . . . . . . . . . . . . . . . . 99.2% 97.4% 92.8% 92.5% 92.3%
Average railcar fleet utilization(6) . . . . . . . 88.6% 90.0% 93.9% 95.8% 95.8%
(1) EBITDA is a non-GAAP financial measure, and is defined as net income before interest expense,income taxes, depreciation and amortization of intangible assets. We believe EBITDA is helpful inunderstanding our past financial performance as a supplement to net income and other performancemeasures calculated in conformity with accounting principles generally accepted in the United States(GAAP). EBITDA is also frequently used by analysts, investors, and other interested parties toevaluate companies in our industry. Our management believes that EBITDA is useful to investors inevaluating our operating performance because it provides a measure of operating results unaffected bydifferences in capital structures, capital investment cycles and ages of related assets among otherwisecomparable companies in our industry. EBITDA has limitations as an analytical tool and you shouldnot consider it in isolation or as a substitute for any measure reported under GAAP. Its usefulness as aperformance measure as compared to net income is limited by the fact that EBITDA excludes theimpact of interest expense, depreciation and amortization expense and taxes. We borrow money inorder to finance our operations; therefore, interest expense is a necessary element of our costs andability to generate revenue. Similarly, our use of capital assets makes depreciation and amortizationexpense a necessary element of our costs and ability to generate income. In addition, since we aresubject to state and federal income taxes, any measure that excludes tax expense has materiallimitations.
41

The following table provides a reconciliation of net income, the most comparable performance measureunder GAAP (in thousands):
Year Ended December 31,
2018 2017 2016 2015 2014
Net income . . . . . . . . . . . . . . . . . . . . $ 78,596 $ 72,060 $ 6,034 $ 26,735 $ 59,998Net interest expense . . . . . . . . . . . . 78,345 53,052 42,754 36,271 35,998Income tax expense (benefit) . . . . . . 2,887 (14,861) 3,844 4,252 7,191Depreciation . . . . . . . . . . . . . . . . . 121,494 111,294 105,236 114,003 78,451Amortization of intangible assets . . 1,989 1,969 1,443 232 383
EBITDA . . . . . . . . . . . . . . . . . . . . . $283,311 $223,514 $159,311 $181,493 $182,021
(2) Reflects the total number of TEUs in our managed or owned equipment fleet, as applicable, as of theend of the period indicated, including units for sale and units we have purchased but held at themanufacturer.
(3) Reflects the total number of CEUs in our managed or owned equipment fleet, as applicable, as of theend of the period indicated, including units for sale and units we have purchased but held at themanufacturer.
(4) Long-term leases comprise leases that had a contractual term in excess of twelve months at the time ofinception of the leases, including leases that permit cancellation by the lessee within 12 months ifpenalties are paid, and leases that have exceeded their initial contractual term of 12 months or greater.Short-term leases comprise leases that had a contractual term of 12 months or less at the time ofinception of the leases.
(5) Reflects the average number of CEUs in our equipment fleet on lease as a percentage of total CEUsavailable for lease. In calculating CEUs available for lease, we exclude units for sale and units held atthe manufacturer that we have purchased.
(6) Reflects the average number of units in our railcar fleet on lease as a percentage of total units availablefor lease. In calculating units available for lease, we exclude units for sale and units held at themanufacturer that we have purchased. If new railcars not yet leased are included in the total railcarfleet, railcar fleet utilization would be 81.0% for the year ended December 31, 2018.
42

ITEM 7: MANAGEMENT’S DISCUSSION AND ANALYSIS OF FINANCIAL CONDITION ANDRESULTS OF OPERATIONS
The following discussion and analysis of our financial condition and results of operations should be read inconjunction with our consolidated financial statements and related notes thereto, included elsewhere in thisAnnual Report on Form 10-K. In addition to historical consolidated financial information, the followingdiscussion contains forward-looking statements that reflect our plans, estimates and beliefs. Our actual resultsmay differ materially from those contained in or implied by any forward-looking statements. See “Special NoteRegarding Forward-Looking Statements.” Factors that could cause or contribute to these differences includethose discussed below and elsewhere in this Annual Report on Form 10-K, particularly in Item 1A. “RiskFactors.”
Overview
We are one of the world’s leading transportation finance and logistics companies. We purchaseequipment, primarily intermodal shipping containers and railcars, which we lease to our customers. We alsomanage equipment for third-party investors. In operating our fleet, we lease, re-lease and dispose ofequipment and contract for the repair, repositioning and storage of equipment. We also provide domesticand international logistics services. As of December 31, 2018, our container fleet comprised 1,568,707CEUs, 96% of which represented our owned fleet and 4% of which represented our managed fleet. Inaddition, we also own 7,279 railcars, which we lease within North America.
Our revenue comprises container lease revenue and rail lease revenue from our owned container andrailcar fleets, management fee revenue for managing containers for third-party investors, and logisticsrevenue for the provision of logistics services.
Our container and rail lease revenue from our owned fleets depends primarily upon a combination of:(1) the number of units in our owned fleet; (2) the utilization level of equipment in our owned fleet; and(3) the per diem rates charged under each equipment lease. The same factors in our managed fleet affect theamount of our management fee income. The number of CEUs in our container fleet, and the number ofcars in our railcar fleet, varies over time as we purchase new equipment based on prevailing marketconditions during the year and sell used equipment to parties in the secondary resale market.
Key Metrics
Utilization. We measure container utilization on the basis of the average number of CEUs on leaseexpressed as a percentage of our total container fleet available for lease. We measure railcar utilization onthe basis of the average number of railcars on lease expressed as a percentage of our total railcar fleetavailable for lease. In both cases, we calculate the total fleet available for lease by excluding new units thathave been manufactured for us but either remain at the manufacturer or have not yet entered their firstlease, and off-hire units that are likely to be sold. Our utilization is primarily driven by the overall level ofequipment demand, the location of our available equipment and the quality of our relationships withequipment lessees. The location of available equipment is critical because equipment available inhigh-demand locations is more readily leased and is typically leased on more favorable terms thanequipment available in low-demand locations.
The equipment leasing market is highly competitive. As such, our relationships with our customers areimportant to ensure that they continue to select us as one of their providers of leased equipment. Ouraverage container fleet utilization rate in CEUs for the year ended December 31, 2018 was 99.2% comparedto 97.4% and 92.8% for the years ended December 31, 2017 and 2016, respectively. The increase in ouraverage fleet utilization from 2017 is primarily attributable to an increase in demand for leased containersthat continued from 2017. Our average railcar fleet utilization rate for the year ended December 31, 2018was 88.6% compared to 90.0% and 93.9% for the years ended December 31, 2017 and 2016, respectively. Ifnew railcars not yet leased are included in the total railcar fleet, railcar fleet utilization would be 81.0% forthe year ended December 31, 2018. The decrease in the utilization of our railcar fleet has been primarilycaused by decreased demand and competitive pressure in the rail market. Our utilization rate may increaseor decrease depending on future global economic conditions and the additional supply of new equipment.
43
Per Diem Rates. The per diem rate for a lease is set at the time we enter into a lease agreement. Ourlong-term per diem rates have historically been strongly influenced by new equipment pricing, interest rates,the balance of supply and demand for equipment at a particular time and location, our estimate of theresidual value of the equipment at the end of the lease, the type and age of the equipment being leased, and,for container per diem rates, the purchase of equipment and efficiencies in container utilization bycontainer shipping lines. The overall average per diem rates for equipment in our owned fleet and in theportfolios of equipment comprising our managed fleet do not change significantly in response to changes innew equipment prices because existing lease agreements can only be re-priced upon the expiration of thelease.
Revenue
Our revenue is comprised of container lease revenue, rail lease revenue, and logistics revenue.
Container Lease Revenue. We generate container lease revenue by leasing our owned containersprimarily to container shipping lines. Approximately 96% of our container lease revenue is derived from therental of containers. Container lease revenue is comprised of monthly lease payments due under the leaseagreements together with payments for other charges set forth in the leases, such as handling fees, drop-offcharges and repair charges. Approximately 22% of our owned container fleet is subject to finance leases.Under a finance lease, the lessee’s payments consist of principal and interest components. The interestcomponent is included within container lease revenue. Lessees under our finance leases have the substantiverisks and rewards of equipment ownership and typically have the option to purchase the equipment at theend of the lease term for a nominal amount.
Container lease revenue also includes management fee revenue generated by our management services,which include the leasing, re-leasing, repair, repositioning, storage and disposition of equipment. Weprovide these management services pursuant to management agreements with third-party investors. Underthese agreements, which have multiple year terms, we earn fees for the management of the equipment and acommission, or a managed units’ sales fee, upon disposition of equipment under management.
Rail Lease Revenue. We generate rail lease revenue by leasing our railcars primarily for the transportof industrial goods, materials and other products on railroad tracks throughout North America. Rail leaserevenue is comprised of monthly lease payments due under the lease agreements. Lease revenue may bebased on a fixed monthly rate or may be recognized on an hourly or mileage basis. None of our railcars aresubject to finance leases.
Logistics Revenue. We generate logistics revenue by arranging for the movement of our customers’freight through our network of non-affiliated transportation carriers and equipment providers. Revenue iscomprised of the gross price charged to our customers.
Operating Expenses
Our operating expenses include transportation costs, depreciation of rental equipment, storage,handling and other expenses applicable to our owned equipment, and administrative expenses.
We depreciate our containers on a straight-line basis over a period ranging from 12 to 15 years to afixed estimated residual value depending on the type of container (see Note 2(c) to our consolidatedfinancial statements included in this Annual Report on Form 10-K). We regularly assess both the estimateduseful life of our containers and their expected residual values, and, when warranted, adjust ourdepreciation estimate accordingly. Railcar equipment is depreciated over its estimated useful life of 43 yearsto its estimated residual value using the straight-line method. Depreciation expense for rental equipmentwill vary over time based upon the size of our owned rental equipment fleet and the purchase price of newequipment. If our rental equipment is impaired, the equipment is written-down to its fair value and theamount of the write-down is recorded in depreciation expense.
44

Storage, handling and other expenses are operating costs of our owned rental equipment fleet. Storageand handling expenses occur when lessees drop off equipment at depots at the end of a lease. Storage andhandling expenses vary significantly by location. Other expenses include repair expenses, which are theresult of normal wear and tear on the equipment, and repositioning expenses, which are incurred when wecontract to move equipment from locations where our inventories exceed actual or expected demand tolocations with higher demand. Storage, handling and other expenses are directly related to the numberof units in our owned fleet and inversely related to our utilization rate for those units: as utilizationincreases, we typically have lower storage, handling and repositioning expenses.
Logistics transportation costs represent the expenses we incur for providing logistics services to ourcustomers. Such costs include shipping, pick-up and delivery charges, primarily from railroads and drayagecompanies we contract with to fulfill the movement of our customers’ freight.
Our administrative expenses are primarily employee-related costs such as salary, bonus andcommission expenses, employee benefits, rent, allowance for doubtful accounts and travel andentertainment costs, as well as expenses incurred for outside services such as legal, consulting andaudit-related fees.
Our operating expenses include the gain or loss on sale of used rental equipment. This gain or loss istypically the result of our sale of used equipment in the secondary resale market and is the differencebetween: (1) the cash we receive for these units, less selling expenses; and (2) the net book value of the units.
45

Results of Operations
The following table summarizes our results of operations for the three years ended December 31, 2018,2017 and 2016 (in thousands):
Year Ended December 31,
2018 2017 2016
RevenueContainer lease revenue . . . . . . . . . . . . . . . . . . . . . . . . . . . . . . . . . . $284,924 $235,365 $202,328Rail lease revenue . . . . . . . . . . . . . . . . . . . . . . . . . . . . . . . . . . . . . . 35,703 32,476 30,490Logistics revenue . . . . . . . . . . . . . . . . . . . . . . . . . . . . . . . . . . . . . . . 111,471 80,552 61,536Total revenue . . . . . . . . . . . . . . . . . . . . . . . . . . . . . . . . . . . . . . . . . . 432,098 348,393 294,354
Operating expensesDepreciation of rental equipment . . . . . . . . . . . . . . . . . . . . . . . . . . . 121,298 110,952 104,877Storage, handling and other expenses . . . . . . . . . . . . . . . . . . . . . . . . . 14,545 20,918 35,862Logistics transportation costs . . . . . . . . . . . . . . . . . . . . . . . . . . . . . . 97,170 68,155 51,980(Gain) loss on sale of used rental equipment . . . . . . . . . . . . . . . . . . . . (11,725) (5,347) 12,671Administrative expenses . . . . . . . . . . . . . . . . . . . . . . . . . . . . . . . . . . 50,305 42,699 35,678Total operating expenses . . . . . . . . . . . . . . . . . . . . . . . . . . . . . . . . . . 271,593 237,377 241,068Operating income . . . . . . . . . . . . . . . . . . . . . . . . . . . . . . . . . . . . . . 160,505 111,016 53,286
Other expensesNet interest expense . . . . . . . . . . . . . . . . . . . . . . . . . . . . . . . . . . . . . 78,345 53,052 42,754Other expense . . . . . . . . . . . . . . . . . . . . . . . . . . . . . . . . . . . . . . . . . 677 765 654Total other expenses . . . . . . . . . . . . . . . . . . . . . . . . . . . . . . . . . . . . . 79,022 53,817 43,408Income before income taxes and non-controlling interest . . . . . . . . . . . 81,483 57,199 9,878Income tax expense (benefit) . . . . . . . . . . . . . . . . . . . . . . . . . . . . . . . 2,887 (14,861) 3,844Net income . . . . . . . . . . . . . . . . . . . . . . . . . . . . . . . . . . . . . . . . . . . 78,596 72,060 6,034Preferred stock dividends . . . . . . . . . . . . . . . . . . . . . . . . . . . . . . . . . 5,124 — —Net income attributable to non-controlling interest . . . . . . . . . . . . . . . — — 37Net income attributable to CAI common stockholders . . . . . . . . . . . . . . $ 73,472 $ 72,060 $ 5,997
2018 Compared with 2017, and 2017 Compared with 2016
Container lease revenueYear Ended December 31, 2018 vs 2017 2017 vs 2016
($ in thousand) 2018 2017 2016 $ Change % Change $ Change % Change
Container lease revenue . . $284,924 $235,365 $202,328 $49,559 21% $33,037 16%
The increase in container lease revenue between 2018 and 2017 was a result of a $54.2 million increasein rental revenue, primarily due to a 25% increase in the average number of CEUs of on-lease ownedcontainers, partially offset by a $2.2 million decrease in rental revenue resulting from a 1% decrease inaverage owned container per diem rental rates, and $2.2 million of container lease revenue from insuranceproceeds recognized in 2017 that was not recurring in 2018. The reduction in average container per diemrental rates has been caused primarily by competitive market pressure.
46

The increase in container lease revenue between 2017 and 2016 was a result of a $35.2 million increasein rental revenue, primarily due to a 19% increase in the average number of CEUs of on-lease ownedcontainers, partially offset by a $5.7 million decrease in rental revenue resulting from a 3% decrease inaverage owned container per diem rental rates, and a decrease of $1.4 million reflecting lost revenue relatedto the bankruptcy of Hanjin in 2016, net of $2.2 million of insurance proceeds for lost lease rental revenue,recognized in 2017. The reduction in average container per diem rental rates has been primarily caused bycompetitive market pressure.
Rail lease revenueYear Ended December 31, 2018 vs 2017 2017 vs 2016
($ in thousand) 2018 2017 2016 $ Change % Change $ Change % Change
Rail lease revenue . . . . . . $35,703 $32,476 $30,490 $3,227 10% $1,986 7%
Rail lease revenue increased between 2018 and 2017, primarily as a result of a 14% increase in theaverage size of our on-lease railcar fleet and a 2% increase in rental rates, partially offset by a $1.0 millionsettlement with a customer for damaged railcars recognized in 2017.
Rail lease revenue increased between 2017 and 2016, primarily as a result of a $1.0 million settlementwith a customer for damaged railcars recognized in 2017, and a 2% increase in the average size of ouron-lease railcar fleet. The average lease revenue per railcar also increased as new railcars, which commandhigher per diem rental rates than used railcars, formed a larger percentage of the fleet.
Logistics revenue and gross marginYear Ended December 31, 2018 vs 2017 2017 vs 2016
($ in thousand) 2018 2017 2016 $ Change % Change $ Change % Change
Logistics revenue . . . . . . . $111,471 $80,552 $61,536 $30,919 38% $19,016 31%Logistics transportation
costs . . . . . . . . . . . . . . 97,170 68,155 51,980 29,015 43% 16,175 31%Logistics gross margin . . . $ 14,301 $12,397 $ 9,556 $ 1,904 15% $ 2,841 30%
The increase in logistics revenue between 2018 and 2017 was primarily due to an increase in freightrates in our intermodal and truck brokerage operations. Transportation costs increased at a slightly higherrate than revenue due primarily to increased volume in our lower margin intermodal business and resultedin a decrease in the gross margin percentage from 15.4% for the year ended December 31, 2017 to 12.8% forthe year ended December 31, 2018.
The increase in logistics revenue between 2017 and 2016 was primarily due to an additional$15.8 million of revenue from the acquisitions of Challenger in February 2016 and Hybrid in June 2016, aswell as new customers generating an additional $3.4 million of revenue. The increase in logisticstransportation costs was mainly attributable to an additional $14.2 million of costs from the acquisitions ofChallenger in February 2016 and Hybrid in June 2016, as well as an increase of $1.8 million as a result ofnew customer activity. The gross margin percentage of our logistics business for the year endedDecember 31, 2017 was 15.4%, consistent with the prior year.
Depreciation of rental equipmentYear Ended December 31, 2018 vs 2017 2017 vs 2016
($ in thousand) 2018 2017 2016 $ Change % Change $ Change % Change
Container Leasing . . . . . . $107,109 $ 99,753 $ 95,755 $ 7,356 7% $ 3,998 4%Rail Leasing . . . . . . . . . . 14,189 11,199 9,122 2,990 27% 2,077 23%
$121,298 $110,952 $104,877 $ 10,346 9% $ 6,075 6%
47

Container Leasing
The increase in depreciation expense between 2018 and 2017 was primarily attributable to a 12%increase in the average size of our owned fleet between the two periods, partially offset by a $1.3 millionone-time write-off of rental equipment on lease to a bankrupt customer, which was recognized in 2017, andan increase in assets on direct finance leases.
The increase in depreciation expense between 2017 and 2016 was primarily attributable to an increaseof $4.4 million resulting from a decrease in the residual value estimates for 40-foot high cube dry vancontainers implemented in 2016, a $1.3 million write-off of rental equipment on lease to a bankruptcustomer and a 7% increase in the average size of our owned fleet between the two periods, partially offsetby a decrease due to a one-time impairment charge of $2.0 million, related to the Hanjin bankruptcy,recorded in 2016.
Rail Leasing
The increase in depreciation expense between 2018 and 2017 was primarily attributable to a 16%increase in the average size of the railcar fleet, excluding new railcars not yet on lease, during the lasttwelve months and an impairment charge of $0.6 million related to off-lease railcars designated for scraprecognized in 2018. There was also an increase in the proportion of new railcars in the fleet leading tohigher depreciation per railcar.
The increase in depreciation expense between 2017 and 2016 was primarily attributable to a 16%increase in the average size of the railcar fleet. There was also an increase in the proportion of new railcarsin the fleet leading to higher depreciation per railcar.
Storage, handling and other expensesYear Ended December 31, 2018 vs 2017 2017 vs 2016
($ in thousand) 2018 2017 2016 $ Change % Change $ Change % Change
Container Leasing . . . . . . $ 8,853 $15,303 $32,476 $(6,450) -42% $(17,173) -53%Rail Leasing . . . . . . . . . . 5,692 5,615 3,386 77 1% 2,229 66%
$14,545 $20,918 $35,862 $(6,373) -30% $(14,944) -42%
Container Leasing
The decrease in storage, handling and other expenses between 2018 and 2017 was primarilyattributable to a $3.9 million decrease in storage and handling costs and a $1.1 million decrease inpositioning fees, both due to a decrease in the size of the off-lease fleet and a 2% increase in averageutilization between the two periods, and a $1.8 million credit recorded in recovery costs as a result ofinsurance proceeds received in 2018 relating to the Hanjin bankruptcy, partially offset by an increase of$0.5 million in container liability insurance premium.
The decrease in storage, handling and other expenses between 2017 and 2016 was primarilyattributable to a $13.7 million decrease in storage costs as the size of the off-lease fleet decreased comparedto the prior year, a $2.7 million decrease in repair and maintenance costs, and $1.5 million of insuranceproceeds recorded related to repair costs associated with the previously reported Hanjin bankruptcy,partially offset by an increase of $0.5 million in container liability insurance premium resulting from theHanjin insurance claim.
Rail Leasing
Storage, handling and other expenses remained relatively consistent between 2018 and 2017.
The increase in storage, handling and other expenses between 2017 and 2016 was primarily attributableto a $1.2 million increase in storage and handling expenses as the size of the railcar fleet increased, whileutilization decreased by 4%, between the two periods, as well as a $0.7 million increase in repair relatedcosts and positioning fees, reflecting our efforts to put railcars on lease.
48

(Gain) loss on sale of used rental equipmentYear Ended December 31, 2018 vs 2017 2017 vs 2016
($ in thousand) 2018 2017 2016 $ Change % Change $ Change % Change
Container Leasing . . . . . . $ (9,886) $(5,333) $12,750 $(4,553) 85% $(18,083) -142%Rail Leasing . . . . . . . . . . (1,839) (14) 33 (1,825) NM (47) -142%Logistics . . . . . . . . . . . . . — — (112) — — 112 100%
$(11,725) $(5,347) $12,671 $(6,378) 119% $(18,018) -142%
NM = Not meaningful
Container Leasing
While we sold 28% fewer CEUs of used containers in 2018 compared to the prior year, there was anincrease of 54% in the average sales price per unit, which reflected the recovery in new equipment prices inthe last twelve months as well as a limited supply of used equipment on the market, and resulted in anincrease in gain on sale of used rental equipment.
While we sold 30% fewer used containers in 2017 compared to the prior year, there was an increase of26% in the average sales price per unit, reflecting the recovery in new equipment prices during the year,resulting in a gain on sale of used rental equipment.
Rail Leasing
We recorded a gain of $1.8 million on the sale of used rental equipment for the year endedDecember 31, 2018, compared to a gain of less than $0.1 million in 2017, and a loss of less than$0.1 million in 2016, respectively. The $1.8 million gain in 2018 resulted from the sale of 385 newlymanufactured railcars.
Administrative expensesYear Ended December 31, 2018 vs 2017 2017 vs 2016
($ in thousand) 2018 2017 2016 $ Change % Change $ Change % Change
Container Leasing . . . . . . $27,560 $22,925 $20,453 $4,635 20% $ 2,472 12%Rail Leasing . . . . . . . . . . 5,297 4,756 3,759 541 11% 997 27%Logistics . . . . . . . . . . . . . 17,448 15,018 11,466 2,430 16% 3,552 31%
$50,305 $42,699 $35,678 $7,606 18% $ 7,021 20%
Container Leasing
The increase in administrative expenses between 2018 and 2017 was primarily attributable to a$2.2 million decrease in credits related to adjustments to our estimated contingent consideration liabilityrelated to our previous acquisitions, a $0.6 million increase in rent expense, a $0.6 million increase inmarketing expenses due to an increased effort to promote our brand and services, and a $0.3 millionincrease in payroll-related costs, largely due to increased headcount and increased stock-basedcompensation expense, partially offset by a reduction in incentive compensation.
The increase in administrative expenses between 2017 and 2016 was primarily attributable to a$3.9 million increase in payroll related expenses, mainly bonus expense, and a $1.6 million decrease incredits related to adjustments to our estimated contingent consideration related to our acquisitions,partially offset by a $2.3 million decrease in bad debt expense resulting from the $2.5 million chargeincurred in 2016 related to the bankruptcy of Hanjin.
Rail Leasing
The increase in administrative expenses between 2018 and 2017 was primarily a result of higheremployee-related costs, largely due to increased incentive compensation.
49

The increase in administrative expenses between 2017 and 2016 was primarily a result of higheremployee-related costs, as well as an increase in allocated overhead costs due to the increase in size of therailcar fleet between the two periods.
Logistics
The increase in administrative expenses between 2018 and 2017 was primarily attributable to anincrease of $2.1 million in payroll-related costs due to a 36% increase in headcount.
The increase in administrative expenses between 2017 and 2016 was primarily a result of $3.9 millionof additional administrative expenses and a $0.6 million increase in amortization expense incurred by thelogistics companies acquired in February and June 2016, partially offset by a $0.9 million decrease inadministrative expenses for CAI Logistics, mainly attributable to a decrease in payroll related expenses dueto a reduction in headcount.
Other expensesYear Ended December 31, 2018 vs 2017 2017 vs 2016
($ in thousand) 2018 2017 2016 $ Change % Change $ Change % Change
Net interest expense . . . . . $78,345 $53,052 $42,754 $25,293 48% $10,298 24%Other expense . . . . . . . . . 677 765 654 (88) -12% 111 17%
$79,022 $53,817 $43,408 $25,205 47% $10,409 24%
Net interest expense
The increase in net interest expense between 2018 and 2017 was due primarily to an increase in ouraverage loan principal balance between the two periods, as we continue to increase our borrowings tofinance our acquisition of additional rental equipment, as well as an increase in the average interest rate onour outstanding debt, caused by an increase in LIBOR, from approximately 3.3% at December 31, 2017 to3.9% at December 31, 2018.
The increase in net interest expense between 2017 and 2016 was due primarily to an increase in ouraverage loan principal balance between the two periods, as we increased our borrowings to finance ouracquisition of additional rental equipment, as well as an increase in the average interest rate on ouroutstanding debt, caused by an increase in LIBOR, from approximately 2.7% at December 31, 2016 to 3.3%at December 31, 2017.
Other expense
Other expense, being a loss on foreign exchange, of $0.7 million for the year ended December 31, 2018remained relatively consistent with other expense of $0.8 million for the year ended December 31, 2017.
Other expense of $0.8 million for the year ended December 31, 2017 remained relatively consistentwith other expense of $0.7 million for the year ended December 31, 2016.
Income tax expense (benefit)Year Ended December 31, 2018 vs 2017 2017 vs 2016
($ in thousand) 2018 2017 2016 $ Change % Change $ Change % Change
Income tax expense(benefit) . . . . . . . . . . . $2,887 $(14,861) $3,844 $17,748 -119% $(18,705) -487%
The increase in income tax expense between 2018 and 2017 was mainly attributable to a $16.9 milliontax benefit arising from the U.S. Tax Cuts and Jobs Act, which was recognized in 2017. Excluding thisone-off benefit and other discrete items, the effective tax rate was 3.6% and related income tax expense was$2.0 million for the year ended December 31, 2017. The effective tax rate for the year ended December 31,2018 remained relatively consistent at 3.5%.
50

The decrease in income tax expense between 2017 and 2016 was mainly attributable to a $16.9 milliontax benefit arising from the Tax Act that reduced the federal tax rate from 35% to 21%, resulting in theremeasurement of our net deferred tax liabilities, and a benefit of $1.8 million related to stock-basedcompensation excess tax benefits, partially offset by $1.9 million of tax expense related to prior yeartrue-ups. Excluding these items, income tax expense was $2.0 million for the year ended December 31, 2017,a decrease of $1.8 million, or 47%, compared to the prior year. Excluding the items noted above, theeffective tax rate for the year ended December 31, 2017 was 3.6% compared to an effective tax rate of 39%for the year ended December 31, 2016. The lower effective tax rate for the year ended December 31, 2017was due to an increase in the proportion of pretax income generated in lower tax jurisdictions by ourcontainer leasing business, and a corresponding decrease in the proportion of pretax income generated inhigher tax jurisdictions, primarily by our railcar business.
Note 10 to our consolidated financial statements included in this Annual Report on Form 10-Kincludes a reconciliation between the tax expense calculated at the statutory U.S. income tax rate and theactual tax expense for the years ended December 31, 2018, 2017 and 2016.
Liquidity and Capital Resources
As of December 31, 2018, we had cash and cash equivalents of $45.3 million, including $25.2 millionof cash held by VIEs. Our principal sources of liquidity are cash in-flows provided by operating activities,proceeds from the sale of rental equipment, borrowings from financial institutions, and equity and debtofferings. Our cash in-flows are used to finance capital expenditures and meet debt service requirements.
As of December 31, 2018, our outstanding indebtedness and the related maximum borrowing level wasas follows (in thousands):
CurrentAmount
Outstanding
CurrentMaximum
Borrowing Level
Revolving credit facilities . . . . . . . . . . . . . . . . . . . . . . . . . . . . . . . . . . . . . $ 597,157 $1,678,614Term loans . . . . . . . . . . . . . . . . . . . . . . . . . . . . . . . . . . . . . . . . . . . . . . . 381,934 381,934Senior secured notes . . . . . . . . . . . . . . . . . . . . . . . . . . . . . . . . . . . . . . . . . 58,885 58,885Asset-backed notes . . . . . . . . . . . . . . . . . . . . . . . . . . . . . . . . . . . . . . . . . 1,032,722 1,032,722Collateralized financing obligations . . . . . . . . . . . . . . . . . . . . . . . . . . . . . . 107,225 107,225Term loans held by VIE . . . . . . . . . . . . . . . . . . . . . . . . . . . . . . . . . . . . . . 1,456 1,456
2,179,379 3,260,836Debt issuance costs . . . . . . . . . . . . . . . . . . . . . . . . . . . . . . . . . . . . . . . . . (20,365) —Total . . . . . . . . . . . . . . . . . . . . . . . . . . . . . . . . . . . . . . . . . . . . . . . . . . . $2,159,014 $3,260,836
As of December 31, 2018, we had $1,081.4 million in availability under our revolving credit facilities(net of $0.1 million in letters of credit), subject to our ability to meet the collateral requirements under theagreements governing the facilities. Based on the borrowing base and collateral requirements as ofDecember 31, 2018, the borrowing availability under our revolving credit facilities was $111.2 million,assuming no additional contributions of assets.
As of December 31, 2018, we had $1,358.3 million of total debt outstanding on facilities with fixedinterest rates. These fixed rate facilities are scheduled to mature between 2019 and 2043, and had a weightedaverage interest rate of 3.8% as of December 31, 2018.
As of December 31, 2018, we had $821.0 million of total debt outstanding on facilities with interestrates based on floating rate indices (primarily LIBOR). These floating rate facilities are schedule to maturebetween 2019 and 2023, and had a weighted average interest rate of 4.1% as of December 31, 2018.
We have typically funded a significant portion of the purchase price for new equipment throughborrowings under our credit facilities. However, from time to time we have funded new equipmentacquisitions through the use of working capital.
51

Revolving Credit Facilities
We have three revolving credit facilities, which have a maximum borrowing capacity of$1,100.0 million, $550.0 million, and €25.0 million, respectively, and maturity dates of June 2023,October 2023, and September 2020, respectively. The entire amount of the facilities drawn at any time plusaccrued interest and fees is callable on demand in the event of certain specified events of default.
We use the revolving credit facilities primarily to fund the purchase of rental equipment. As ofDecember 31, 2018, in addition to a rental equipment payable of $74.1 million, we had commitments topurchase $9.4 million of containers and $64.4 million of railcars in the twelve months ending December 31,2019.
Term Loans
We utilize our term loans as an important funding source for the purchase of rental equipment. Ourterm loans amortize in monthly or quarterly installments and mature between October 2019 andOctober 2023.
Senior Secured Notes
We used the proceeds from the senior secured notes primarily to fund the purchase of rentalequipment. The notes amortize in semi-annual installments and mature in September 2022.
Asset-Backed Notes
Our asset-backed notes were issued by two of our indirect wholly-owned subsidiaries, which wereestablished to facilitate asset-backed note financings. We used the proceeds from the issuance of theasset-backed notes primarily to repay part of our borrowings under the senior revolving credit facility andto reduce the balance on one of our term loans.
Our borrowings under the asset-backed facilities amortize in monthly installments and mature betweenOctober 2027 and September 2043. We are required to maintain a restricted cash account to coverpayments of the obligations. As of December 31, 2018, the restricted cash account had a balance of$30.7 million.
Other Debt Obligations
We have entered into a series of collateralized financing obligations with Japanese investor funds thatare consolidated by us as VIEs (see Note 3 to our consolidated financial statements included in thisAnnual Report on Form 10-K). The obligations have maturity dates between March 2019 andDecember 2021.
One of our Japanese investor funds that is consolidated by us as a VIE entered into a term loanagreement with a bank. The VIE term loan matures in June 2019.
Our term loans, senior secured notes, asset-backed notes, collateralized financing obligations and termloans held by VIEs are secured by specific pools of rental equipment and other assets owned by theCompany, the underlying leases thereon and the Company’s interest in any money received under suchcontracts.
In addition to customary events of default, our revolving credit facilities and term loans containrestrictive covenants, including limitations on certain liens, indebtedness and investments. In addition, all ofour debt facilities contain various restrictive financial and other covenants. The financial covenants in ourdebt facilities require us to maintain (1) a consolidated funded debt to consolidated tangible net worth ratioof no more than 3.75:1.00, and in the case of our asset-backed notes, of no more than 4.50:1:00; and (2) afixed charge coverage ratio of at least 1.20:1.00, and in the case of our asset-backed notes, of at least1.10:1.00. As of December 31, 2018, we were in compliance with all of our debt covenants.
Under certain conditions, as defined in our credit agreements with our banks and/or note holders, weare subject to certain cross default provisions that may result in an acceleration of principal repaymentunder these credit facilities if an uncured default condition were to exist. Our asset-backed notes are notsubject to any such cross-default provisions.
52

Cash Flow
The following table sets forth certain cash flow information for the years ended December 31, 2018,2017 and 2016 (in thousands):
Year Ended December 31,
2018 2017 2016
Net income . . . . . . . . . . . . . . . . . . . . . . . . . . . . . . . . . . . . . . . . . $ 78,596 $ 72,060 $ 6,034Net income adjusted for non-cash items . . . . . . . . . . . . . . . . . . . . . 200,965 168,719 131,013Changes in working capital . . . . . . . . . . . . . . . . . . . . . . . . . . . . . . (21,195) (13,527) (1,757)Net cash provided by operating activities . . . . . . . . . . . . . . . . . . . . 179,770 155,192 129,256Net cash used in investing activities . . . . . . . . . . . . . . . . . . . . . . . . (663,343) (411,751) (181,600)Net cash provided by financing activities . . . . . . . . . . . . . . . . . . . . 512,350 251,222 45,579Effect on cash of foreign currency translation . . . . . . . . . . . . . . . . . (3) 220 (674)Net increase (decrease) in cash . . . . . . . . . . . . . . . . . . . . . . . . . . . . 28,774 (5,117) (7,439)Cash and restricted cash at beginning of period . . . . . . . . . . . . . . . . 47,209 52,326 59,765Cash and restricted cash at end of period . . . . . . . . . . . . . . . . . . . . $ 75,983 $ 47,209 $ 52,326
Operating Activities Cash Flows
Net cash provided by operating activities of $179.8 million for the year ended December 31, 2018,increased $24.6 million from $155.2 million for the year ended December 31, 2017. The increase was due toa $32.2 million increase in net income as adjusted for depreciation, amortization and other non-cash items,partially offset by a decrease of $7.7 million in our net working capital adjustments. The increase in netincome as adjusted for non-cash items was primarily due to a $6.5 million increase in net income, a$10.2 million increase in depreciation expense, a $17.4 million increase in deferred income taxes, a$2.2 million reduction in contingent consideration, and a $1.0 million increase in amortization of debtissuance costs, partially offset by a $6.4 million increase in gain on sale of used rental equipment. Networking capital used in operating activities of $21.2 million during the year ended December 31, 2018, wasdue to a $19.3 million increase in accounts receivable, primarily caused by an increase in lease and logisticsactivity and a $2.4 million increase in prepaid expenses and other assets as a result of an increase in initialdirect costs related to new railcar leases.
Net cash provided by operating activities of $155.2 million for the year ended December 31, 2017,increased $25.9 million from $129.3 million for the year ended December 31, 2016. The increase was due toa $37.7 million increase in net income as adjusted for depreciation, amortization and other non-cash items,partially offset by a decrease of $11.8 million in our net working capital adjustments. The increase in netincome as adjusted for non-cash items was primarily due to a $66.0 million increase in net income, a$6.1 million increase in depreciation expense, and a $1.6 million reduction in contingent consideration,partially offset by an $18.0 million increase in gain on sale of used rental equipment, a $16.1 milliondecrease in deferred income taxes, and a $2.7 million decrease in bad debt expense as a result of theHanjin bankruptcy. Net working capital used in operating activities of $13.5 million during the year endedDecember 31, 2017, was due to a $5.0 million increase in accounts receivable, primarily caused by anincrease in lease and logistics activity, a $2.2 million decrease in accounts payable, accrued expenses andother current liabilities, primarily caused by a decrease in accrued tax expense as a result of excess taxbenefits from share-based compensation awards, a $5.8 million decrease in due to container investors due tothe decrease in our managed fleet, and a $1.3 million decrease in unearned revenue.
Investing Activities Cash Flows
Net cash used in investing activities increased $251.6 million to $663.3 million for the year endedDecember 31, 2018 from $411.8 million for the year ended December 31, 2017. The increase in cash usagewas primarily attributable to a $310.0 million increase in the purchase of rental equipment, partially offsetby a $39.8 million increase in proceeds from sale of used rental equipment and a $19.3 million increase inreceipt of principal payments from direct financing leases.
53
Net cash used in investing activities increased $230.2 million to $411.8 million for the year endedDecember 31, 2017 from $181.6 million for the year ended December 31, 2016. The increase in cash usagewas primarily attributable to a $250.9 million increase in the purchase of rental equipment, partially offsetby a $15.6 million decrease in acquisition costs and a $4.4 million increase in receipt of principal paymentsfrom direct financing leases.
Financing Activities Cash FlowsNet cash provided by financing activities of $512.4 million for the year ended December 31, 2018
increased $261.1 million compared to the year ended December 31, 2017, primarily as a result of higher netborrowings being required to finance the acquisition of rental equipment. During the year endedDecember 31, 2018, our net cash inflow from borrowings was $458.2 million compared to $226.5 million forthe year ended December 31, 2017, reflecting an increase in investment in rental equipment during 2018compared to 2017. The increase was also attributable to an increase of $75.4 million in proceeds receivedfrom issuances of common stock under our At-the-Market (ATM) offering program and issuances ofPreferred Stock in underwritten offerings and Series A Preferred Stock under our Series A Preferred StockATM offering program, partially offset by a $40.9 million increase in the repurchase of our common stock.
Net cash provided by financing activities of $251.2 million for the year ended December 31, 2017increased $205.6 million compared to the year ended December 31, 2016, primarily as a result of higher netborrowings being required to finance the acquisition of rental equipment. During the year endedDecember 31, 2017, our net cash inflow from borrowings was $226.5 million compared to $56.3 million forthe year ended December 31, 2016, reflecting an increase in investment in rental equipment during 2017compared to 2016. The increase was also attributable to an increase of $28.0 million in proceeds receivedfrom the issuance of common stock under our ATM offering program and a decrease of $9.2 million usedto repurchase our common stock, partially offset by a $1.9 million increase in debt issuance costs, primarilyrelated to the asset-backed notes issued in 2017.
Equity Transactions
Stock Repurchase PlanIn May 2018, we purchased, and subsequently cancelled, 1.2 million shares of our common stock,
from an affiliate of Andrew S. Ogawa in a privately-negotiated transaction. Mr. Ogawa is a member of ourBoard of Directors. The stock was purchased at a price of $22.81 per share, which represented a 2%discount to the closing price as reported on the New York Stock Exchange on the date of purchase.
In October 2018, we announced that our Board of Directors had approved the repurchase of up tothree million shares of our outstanding common stock. The number, price, structure and timing of therepurchases, if any, will be at our sole discretion and will be evaluated by us depending on marketconditions, corporate needs and other factors. Stock repurchases may be made in the open market, blocktrades or privately negotiated transactions. This stock repurchase program replaced any available priorshare repurchase authorization and may be discontinued at any time. In the fourth quarter of 2018, werepurchased 541,743 shares of our common stock under this repurchase plan, at a cost of approximately$12.9 million. As of December 31, 2018, approximately 2.5 million shares remained available for repurchaseunder our share repurchase plan.
Common Stock ATM Offering ProgramIn October 2017, we commenced an ATM offering program with respect to our common stock, which
allows us to issue and sell up to 2.0 million shares of our common stock. As of December 31, 2017, we hadissued 888,453 shares of common stock and had remaining capacity to issue up to approximately1.1 million of additional shares of common stock under the ATM offering program. During the year endedDecember 31, 2018, we issued 100,000 shares of common stock under the ATM offering program for netproceeds of $2.8 million. We paid commissions to the sales agent of $0.1 million in connection with thesales of common stock under this ATM offering program during the year ended December 31, 2018. Thenet proceeds were used for general corporate purposes. As of December 31, 2018, we have remainingcapacity to issue up to approximately 1.0 million of additional shares of common stock under this ATMoffering program.
54

Series A Preferred Stock Underwritten Offering
In March 2018, we completed an underwritten public offering of 1,600,000 shares of our 8.50%Series A Fixed-to-Floating Rate Cumulative Redeemable Perpetual Preferred Stock, par value $0.0001 pershare and liquidation preference $25.00 per share (Series A Preferred Stock), resulting in net proceeds to usof approximately $38.3 million, after deducting the underwriting discount and other offering expenses. InApril 2018, we sold an additional 170,900 shares of our Series A Preferred Stock upon the exercise by theunderwriters of their option to purchase additional Series A Preferred Stock, resulting in net proceeds to usof approximately $4.1 million, after deducting the underwriting discount. The net proceeds were used forrepayment of debt and general corporate purposes.
See Note 14 to our consolidated financial statements in this Annual Report on Form 10-K foradditional information related to our Series A Preferred Stock.
Series A Preferred Stock ATM Offering Program
In May 2018, we commenced an ATM offering program with respect to our Series A Preferred Stock,which allows us to issue and sell up to 2.2 million shares of our Series A Preferred Stock. During the yearended December 31, 2018, we issued 428,710 shares of Series A Preferred Stock under the ATM offeringprogram for net proceeds of $10.5 million. We paid commissions to the sales agent of $0.2 million inconnection with the sales of Series A Preferred Stock under this ATM offering program during the yearended December 31, 2018. The net proceeds were used for debt repayment and general corporate purposes.As of December 31, 2018, we have remaining capacity to issue up to approximately 1.8 million of additionalshares of Series A Preferred Stock under this ATM program.
Series B Preferred Stock Underwritten Offering
In August 2018, we completed an underwritten public offering of 1,700,000 shares of our 8.50%Series B Fixed-to-Floating Rate Cumulative Redeemable Perpetual Preferred Stock, par value $0.0001 pershare and liquidation preference $25.00 per share (Series B Preferred Stock), resulting in net proceeds to usof approximately $41.2 million, after deducting the underwriting discount and other offering expenses. Wesold an additional 255,000 shares of Series B Preferred Stock upon the exercise by the underwriters of theiroption to purchase additional Series B Preferred Stock, resulting in net proceeds to us of approximately$6.2 million, after deducting the underwriting discount. The net proceeds were used for repayment of debtand general corporate purposes.
See Note 14 to our consolidated financial statements in this Annual Report on Form 10-K foradditional information related to our Series B Preferred Stock.
55

Contractual Obligations and Commercial Commitments
The following table sets forth our contractual obligations and commercial commitments by due date asof December 31, 2018 (in thousands):
Payments Due by Period
TotalLess than
1 year1 – 2years
2 – 3years
3 – 4years
4 – 5years
More than5 years
Total debt obligations:Revolving credit facilities . . . . . $ 597,157 $ 4,200 $ 19,457 $ — $ — $573,500 $ —Term loans . . . . . . . . . . . . . . 381,934 130,699 33,100 113,935 7,800 96,400 —Senior secured notes . . . . . . . . 58,885 6,110 6,110 6,110 40,555 — —Asset-backed notes . . . . . . . . . 1,032,722 134,547 134,547 134,547 131,697 100,272 397,112Collateralized financing
obligations . . . . . . . . . . . . . 107,225 39,610 21,773 35,855 9,987 — —Term loans held by VIE . . . . . . 1,456 1,456 — — — — —Interest on debt obligations(1) . . 341,199 81,742 70,941 62,297 53,721 37,085 35,413
Rental equipment payable . . . . . . 74,139 74,139 — — — — —Rent, office facilities and
equipment . . . . . . . . . . . . . . . 4,904 2,395 801 707 531 393 77Equipment purchase
commitments – Containers . . . 9,427 9,427 — — — — —Equipment purchase
commitments – Rail . . . . . . . . 64,413 64,413 — — — — —Total contractual obligations . . . . $2,673,461 $548,738 $286,729 $353,451 $244,291 $807,650 $432,602
(1) Our estimate of interest expense commitment includes $112.6 million relating to our revolving creditfacilities, $40.4 million relating to our term loans, $9.4 million relating to our senior secured notes,$176.5 million relating to our asset-backed notes, $2.2 million relating to our collateralized financingobligations, and less than $0.1 million related to our term loans held by VIEs. The calculation ofinterest commitment related to our debt assumes the following weighted average interest rates as ofDecember 31, 2018: revolving credit facilities, 4.1%; term loans, 4.1%; senior secured notes, 4.9%;asset-backed notes, 4.0%; collateralized financing obligations, 1.2%; and term loans held byVIEs, 3.3%. These calculations assume that interest rates will remain at the same level over the nextfive years. We expect that interest rates will vary over time based upon fluctuations in the underlyingindexes upon which these interest rates are based.
See Note 8 to our consolidated financial statements included in this Annual Report on Form 10-K fora description of the terms of our revolving credit facilities, term loans and asset-based notes.
Off-Balance Sheet Arrangements
As of December 31, 2018, we had no material off-balance sheet arrangements or obligations that haveor are reasonably likely to have a current or future effect on our financial condition, change in financialcondition, revenue or expenses, results of operations, liquidity capital expenditure, or capital resources thatare material to investors. An off-balance sheet arrangement includes any contractual obligation, agreementor transaction arrangement involving an unconsolidated entity under which we would have: (1) retained acontingent interest in transferred assets; (2) an obligation under derivative instruments classified as equity;(3) any obligation arising out of a material variable interest in an unconsolidated entity that providesfinancing, liquidity, market risk or credit risk support to us, or that engages in leasing, hedging or researchand development services with us; or (4) made guarantees.
56

Critical Accounting Policies and EstimatesThe preparation of financial statements in conformity with GAAP requires management to use
judgment in making estimates and assumptions that affect reported amounts of assets and liabilities, thereported amounts of income and expenses during the reporting period and the disclosure of contingentassets and liabilities as of the date of the financial statements. We have identified the policies and estimatesbelow as among those critical to our business operations and the understanding of our results ofoperations. These policies and estimates are considered critical due to the existence of uncertainty at thetime the estimate is made, the likelihood of changes in estimates from period to period and the potentialimpact that these estimates can have on our financial statements. The following accounting policies andestimates include inherent risks and uncertainties related to judgments and assumptions made by us. Ourestimates are based on the relevant information available at the end of each period. Actual results coulddiffer from those estimates.
Revenue RecognitionWe provide a range of services to our customers incorporating rental, sale and management of
equipment, and the provision of logistics services. Revenue for all forms of service is recognized whenearned following the guidelines under Financial Accounting Standards Board (FASB) AccountingStandards Codification (ASC) Topic 606, Revenue Recognition and FASB ASC Topic 840, Leases. Revenueis reported net of any related sales tax.
Container and Rail Lease RevenueWe recognize revenue from operating leases of our owned equipment as earned over the term of the
lease. Where minimum lease payments vary over the lease term, revenue is recognized on a straight-linebasis over the term of the lease. We recognize revenue on a cash basis for certain railcar leases that are billedon an hourly or mileage basis through a third-party railcar manager. Early termination of the rentalcontracts subjects the lessee to a penalty, which is included in lease revenue upon such termination. Financelease income is recognized using the effective interest method, which generates a constant rate of interestover the period of the lease. Included in lease revenue is revenue consisting primarily of fees charged to thelessee for handling, delivery, and repairs, which are recognized as earned.
We cease recognition of lease revenue if and when a lessee defaults in making timely lease payments orwe otherwise determine that future lease payments are not likely to be collected from the lessee. Ourdetermination of the collectability of future lease payments is made by management on the basis ofavailable information, including the current creditworthiness of lessees, historical collection results andreview of specific past due receivables. If we experience unexpected payment defaults from our lessees, wewill cease accruing rental revenue as earned and will recognize revenue as cash is received.
Also included in lease revenue is revenue from management fees earned under equipment managementagreements. Management fees are generally calculated as a percentage of the monthly net operating incomefor an investor’s portfolio and recognized as revenue in the month of service.
Logistics RevenueOur logistics business derives its revenue from three principal sources: (1) truck brokerage services,
(2) intermodal transportation services, and (3) international ocean freight and freight forwarding services.For truck brokerage services, which typically involve a short transit time, revenue is recognized whendelivery has been completed due to the lack of reliable information to reasonably measure progress towardcomplete satisfaction of the performance obligation. For intermodal transportation services, which can takea longer time to complete, revenue is recognized over time by measuring progress toward completesatisfaction of the performance obligation, utilizing input methods. For any such services not completed atthe end of a reporting period, we use a percentage of completion method based on costs incurred to date toallocate the appropriate revenue to each separate reporting period. We provide international freightforwarding services as an indirect carrier, sometimes referred to as a Non-Vessel Operating CommonCarrier. Due to the lack of reliable information to reasonably measure progress toward completesatisfaction of the performance obligation, revenue from these shipments is recognized at the time thefreight departs the terminal of origin, which is when the customer is billed and we have no furtherobligation to the customer.
57

We report logistics revenue on a gross basis as we are primarily responsible for fulfilling the promise toprovide the specified service desired by the customer and have discretion in establishing the price for thespecified service.
Rental Equipment
Container
We purchase new container equipment from manufacturers to lease to our customers. We alsopurchase used container equipment through sale-leaseback transactions with our customers, or equipmentthat was previously owned by one of our third party investors. Used equipment is typically purchased withan existing lease in place.
Container rental equipment is recorded at original cost and depreciated to an estimated residual valueon a straight-line basis over its estimated useful life. The estimated useful lives and residual values of ourcontainer equipment are based on historical disposal experience and our expectations for future usedcontainer sale prices. Depreciation estimates are reviewed on a regular basis to determine whether sustainedchanges have taken place in the useful lives of our equipment or assigned residual values, which wouldsuggest that a change in depreciation estimates is warranted.
In considering changes to residual values for the three major dry van categories and two refrigeratedcontainer categories, we reviewed 3-year, 5-year, 7-year, and 13-year average disposition pricing trends. Aswith all estimates, particularly related to long-lived assets, current market performance may not necessarilybe indicative of long-term residual values, so we do not adjust residual values to point-in-time prices.Rather, we consider the mix of data shown in the following tables and use the average over time to eitherconfirm residual value estimates or support revisions to those estimates.
The sale-related unit proceeds by dry van and refrigerated container category that we considered as ofOctober 31, 2018, when we performed our annual residual value analysis, are shown below:Category 3-year Avg. 5-year Avg. 7-year Avg. 13-year Avg.
20-ft. standard dry van container . . . . . . . . . . . . . . . . . . $ 977 $ 1,025 $ 1,104 $ 1,12440-ft. standard dry van container . . . . . . . . . . . . . . . . . . 1,086 1,202 1,321 1,34840-ft. high cube dry van container . . . . . . . . . . . . . . . . . . 1,137 1,251 1,357 1,43920-ft. refrigerated container . . . . . . . . . . . . . . . . . . . . . . 2,903 3,181 N/A N/A40-ft. high cube refrigerated container . . . . . . . . . . . . . . . 4,353 4,058 N/A N/A
Our residual value estimates ($1,050 for a 20-ft. dry van, $1,300 for a 40-ft. dry van, and $1,400 for a40-ft. high cube dry van) are slightly higher than the 3-year and 5-year average sale price for all equipmenttypes and the 7-year average for 40-ft. high cube dry vans. While we experienced losses when selling certainof these assets during 2015 and 2016, there was a recovery in prices during 2017 that has continued into2018, resulting in gains on sale of our equipment. Due to this cyclical nature in the container market, we donot adjust long-term residual value estimates based on short-term data points, such as current year saleresults, the 3-year average and even the 5-year average shown above, as we do not believe they are indicativeof a change in the long-term market value for these containers. As such, no change to the residual values ofdry van containers was considered necessary during the year ended December 31, 2018. We regularly reviewthis data and update our analysis, and will make revisions to residual value estimates as and whenconditions warrant.
58

The largest segment of our non-dry van container fleet consists of 20-ft. refrigerated containers and40-ft. high cube refrigerated containers. We regularly review the residual value estimates associated with ourrefrigerated containers. Given the specific nature of these assets and the lower volumes of containers thatare sold each year in the secondary market, not always at the end of the container’s life, there is morevariability in asset pricing. Similar to our dry van containers, we evaluate the relationship between salesprices and residual values over a long-term horizon. We excluded 7-year and 13-year historical averagesfrom our analysis as we do not have a long enough history of sales for refrigerated containers. The currentresidual values for 20-ft. refrigerated and 40-ft. high cube refrigerated containers are set at $2,750 and$3,500, respectively. Based on the data trends, we believe that the residual value estimates for ourrefrigerated containers are appropriate and do not warrant revision.
The estimated useful lives and residual values for the majority of our container equipment purchasednew from the factory are as follows:
ResidualValue
DepreciableLife in Years
20-ft. standard dry van container . . . . . . . . . . . . . . . . . . . . . . . . . . . . . . . $1,050 13.040-ft. standard dry van container . . . . . . . . . . . . . . . . . . . . . . . . . . . . . . . $1,300 13.040-ft. high cube dry van container . . . . . . . . . . . . . . . . . . . . . . . . . . . . . . . $1,400 13.020-ft. refrigerated container . . . . . . . . . . . . . . . . . . . . . . . . . . . . . . . . . . . $2,750 12.040-ft. high cube refrigerated container . . . . . . . . . . . . . . . . . . . . . . . . . . . . $3,500 12.0
Other specialized equipment is depreciated to its estimated residual value, which ranges from $1,000 to$3,500, over its estimated useful life of between 12.5 years and 15 years.
For used container equipment acquired through sale-leaseback transactions, we often adjust ourestimates for remaining useful life and residual values based on current conditions in the sale market forolder containers and our expectations for how long the equipment will remain on-hire to the current lessee.
Rail
Railcar equipment is recorded at original cost and depreciated over its estimated useful life of 43 yearsto its estimated residual value of $8,700 using the straight-line method. We determine the useful life basedon our estimate of the period over which the asset will generate revenue. Residual value is based on theaverage estimated scrap value of our railcars. We periodically review the appropriateness of our estimates ofuseful life and residual value based on changes in economic circumstances and other factors.
Our railcars may undergo refurbishment and upgrade programs to, for example, extend their usefullife, meet higher car classification grades, enter new product or service segments, increase the tonnagecarried, or to achieve higher utilization. The costs for these programs are capitalized.
Normal repairs and maintenance associated with our railcar assets are expensed as incurred.
Impairment of Long-Lived Assets
On at least an annual basis, we evaluate our rental equipment fleet to determine whether there havebeen any events or changes in circumstances indicating that the carrying amount of all, or part, of our fleetmay not be recoverable. Events which would trigger an impairment review include, among others, asignificant decrease in the long-term average market value of rental equipment, a significant decrease in theutilization rate of rental equipment resulting in an inability to generate income from operations and positivecash flow in future periods, or a change in market conditions resulting in a significant decrease inlease rates.
59
When testing for impairment, equipment is generally grouped by equipment type, and is testedseparately from other groups of assets and liabilities. Potential impairment exists when the estimated futureundiscounted cash flows generated by an asset group, comprised of lease proceeds and residual values, lessrelated operating expenses, are less than the carrying value of that asset group. If potential impairmentexists, the equipment is written down to its fair value. In determining the fair value of an asset group, weconsider market trends, published value for similar assets, recent transactions of similar assets and incertain cases, quotes from third party appraisers. No impairment charges were recorded in 2018, 2017 and2016 as a result of our annual review.
Recent Accounting Pronouncements.
In February 2016, the FASB issued ASU No. 2016-02, Leases (Topic 842) (ASU 2016-02), whichrequires lessors to classify leases as a sales-type, direct financing, or operating lease. Topic 842 wassubsequently amended by ASU 2018-01, Land Easement Practical Expedient for Transition to Topic 842,ASU 2018-10, Codification Improvements to Topic 842, Leases, ASU 2018-11, Targeted Improvements, andASU 2018-20, Narrow-Scope Improvements for Lessors. A lease is a sales-type lease if any of five criteria aremet, each of which indicate that the lease, in effect, transfers control of the underlying asset to the lessee. Ifnone of those five criteria are met, but two additional criteria are both met, indicating that the lessor hastransferred substantially all of the risks and benefits of the underlying asset to the lessee and a third-party,the lease is a direct financing lease. All leases that are not sales-type or direct financing leases are operatingleases. The new standard also established a right-of-use model (ROU) that requires a lessee to recognize anROU asset and lease liability on the balance sheet for all leases with a term longer than twelve months.
The new standard is effective for us on January 1, 2019, with early adoption permitted. A modifiedretrospective transition approach is required, applying the new standard to all leases existing at the date ofinitial application. An entity may choose to use either (1) its effective date or (2) the beginning of theearliest comparative period presented in the financial statements as its date of initial application. If anentity chooses the second option, the transitions requirements for existing leases also apply to leases enteredinto between the date of initial application and the effective date. The entity must also recast its comparativeperiod financial statements and provide the disclosures required by the new standard for the comparativeperiods. We expect to adopt the new standard on January 1, 2019 and use the effective date as our date ofinitial application. Consequently, financial information will not be updated and the disclosures requiredunder the new standard will not be provided for dates and periods before January 1, 2019.
The new standard provides a number of optional practical expedients in transition. We expect to elect(1) the “package of practical expedients”, which permits us not to reassess under the new standard ourprior conclusions about lease identification, lease classification, and initial direct costs, (2) the short-termlease recognition exemption for our office space leases of twelve months or less, which means we will notrecognize an ROU asset or lease liability for these leases, and (3) the practical expedient to not separatelease and non-lease components for all of our leases. We do not expect to elect the use-of-hindsight or thepractical expedient pertaining to land easements; the latter not being applicable to us.
We have completed our full assessment of adopting the new standard and have determined thatadoption will not have a material effect on our financial statements and related disclosures.
60

ITEM 7A: QUANTITATIVE AND QUALITATIVE DISCLOSURES ABOUT MARKET RISK
Market risk represents the risk of changes in value of a financial instrument, derivative ornon-derivative, caused by fluctuations in foreign exchange rates and interest rates. Changes in these factorscould cause fluctuations in our results of operations and cash flows. We are exposed to the market risksdescribed below.
Interest Rate Risk. The nature of our business exposes us to market risk arising from changes ininterest rates to which our variable-rate debt is linked. As of December 31, 2018, the principal amount ofdebt outstanding under variable-rate revolving credit facilities was $597.2 million. In addition, atDecember 31, 2018, we had balances on our variable rate term loans of $223.4 million, and $0.5 million ofvariable rate loans held by a VIE. As of December 31, 2018, our total outstanding variable-rate debt was$821.1 million, which represented 38% of our total debt at that date. The average interest rate on ourvariable-rate debt was 4.1% as of December 31, 2018 based on LIBOR plus a margin based on certainconditions.
A 1.0% increase or decrease in underlying interest rates for these obligations would increase or decreaseinterest expense by approximately $8.2 million annually, assuming debt remains constant at December 31,2018 levels.
We do not currently participate in hedging, interest rate swaps or other transactions to manage themarket risks described above.
Foreign Exchange Rate Risk. Although we have significant foreign-based operations, the U.S. dollar isour primary operating currency. Thus, most of our revenue and expenses are denominated in U.S. Dollars.We have equipment sales in British Pound Sterling, Euros and Japanese Yen and incur overhead costs inforeign currencies, primarily in British Pound Sterling and Euros. During the year ended December 31,2018, the U.S. Dollar increased in value in relation to other major foreign currencies (such as the Euro andBritish Pound Sterling). The increase in the relative value of the U.S. Dollar has decreased our revenues andexpenses denominated in foreign currencies. The associated decrease in the value of certain foreigncurrencies as compared to the U.S. Dollar has also caused assets held at some of our foreign subsidiaries todecrease in value when translated to U.S. Dollars. For the year ended December 31, 2018, we recognized aloss on foreign exchange of $0.7 million. A 10% change in foreign exchange rates would not have a materialimpact on our business, financial position, results of operations or cash flows.
ITEM 8: FINANCIAL STATEMENTS AND SUPPLEMENTARY DATA
The consolidated financial statements and financial statement schedule are contained in Item 15 of thisAnnual Report on Form 10-K, and are incorporated herein by reference. See Part IV, Item 15(a) for anindex to the consolidated financial statements and supplementary data.
ITEM 9: CHANGES IN AND DISAGREEMENTS WITH ACCOUNTANTS ON ACCOUNTINGAND FINANCIAL DISCLOSURE
None.
ITEM 9A: CONTROLS AND PROCEDURES
Management’s Evaluation of Disclosure Controls and Procedures
In accordance with Rule 13a-15(b) under the Exchange Act, we carried out an evaluation, under thesupervision and with the participation of our management, including our President and Chief ExecutiveOfficer and our Chief Financial Officer, of the effectiveness of the design and operation of our disclosurecontrols and procedures (as defined in Rule 13a-15(e) under the Exchange Act) as of the end of the periodcovered by this Annual Report on Form 10-K. Based upon their evaluation of these disclosure controls andprocedures, our President and Chief Executive Officer and our Chief Financial Officer concluded that ourdisclosure controls and procedures were effective as of December 31, 2018.
61

Changes in Internal Control Over Financial Reporting
There were no changes in our internal control over financial reporting (as such term is defined inRule 13a-15(f) and 15d-15(f) under the Exchange Act) during the quarter ended December 31, 2018 thathave materially affected, or are reasonably likely to materially affect, our internal control over financialreporting.
Management’s Annual Report on Internal Control Over Financial Reporting
Our management is responsible for establishing and maintaining adequate internal control overfinancial reporting (as defined in Rules 13a-15(f) and 15d-15(f) under the Exchange Act). Our internalcontrol over financial reporting is a process designed with the participation of our principal executiveofficer and principal financial officer or persons performing similar functions to provide reasonableassurance regarding the reliability of financial reporting and the preparation of our financial statements forexternal reporting purposes in accordance with U.S. generally accepted accounting principles. Our internalcontrol over financial reporting includes policies and procedures that: (a) pertain to the maintenance ofrecords that, in reasonable detail, accurately and fairly reflect our transactions and dispositions of assets;(b) provide reasonable assurance that transactions are recorded as necessary to permit preparation offinancial statements in accordance with U.S. generally accepted accounting principles, and that our receiptsand expenditures are being made only in accordance with authorizations of our management and Board ofDirectors; and (c) provide reasonable assurance regarding prevention or timely detection of unauthorizedacquisition, use or disposition of our assets that could have a material effect on our financial statements.
Because of its inherent limitations, our internal controls and procedures may not prevent or detectmisstatements. A control system, no matter how well conceived and operated, can only provide reasonable,not absolute, assurance that the objectives of the control system are met. Because of the inherentlimitations in all control systems, no evaluation of controls can provide absolute assurance that all controlissues and instances of fraud, if any, have been detected. Also, projections of any evaluation of effectivenessto future periods are subject to the risk that controls may become inadequate because of changes inconditions or that the degree of compliance with the policies or procedures may deteriorate.
As of December 31, 2018, our management, with the participation of our President and ChiefExecutive Officer and our Chief Financial Officer, conducted an evaluation of the effectiveness of ourinternal control over financial reporting based on the framework established in Internal Control —Integrated Framework (2013) issued by the Committee of Sponsoring Organizations of the TreadwayCommission (COSO). Based on this evaluation, management has determined that our internal control overfinancial reporting is effective as of December 31, 2018.
KPMG LLP, the independent registered public accounting firm that audited our 2018 consolidatedfinancial statements included in this Annual Report on Form 10-K, has issued an attestation report on ourinternal control over financial reporting. The report appears below.
62
Report of Independent Registered Public Accounting Firm
To the Stockholders and Board of DirectorsCAI International, Inc.:
Opinion on Internal Control Over Financial ReportingWe have audited CAI International, Inc. and subsidiaries’ (the Company) internal control over financialreporting as of December 31, 2018, based on criteria established in Internal Control — IntegratedFramework (2013) issued by the Committee of Sponsoring Organizations of the Treadway Commission. Inour opinion, the Company maintained, in all material respects, effective internal control over financialreporting as of December 31, 2018, based on criteria established in Internal Control — IntegratedFramework (2013) issued by the Committee of Sponsoring Organizations of the Treadway Commission.We also have audited, in accordance with the standards of the Public Company Accounting OversightBoard (United States) (PCAOB), the consolidated balance sheets of the Company as of December 31, 2018and 2017, the related consolidated statements of income, comprehensive income, stockholders’ equity, andcash flows for each of the years in the three-year period ended December 31, 2018, and the related notesand financial statement schedule II (collectively, the consolidated financial statements), and our reportdated March 5, 2019 expressed an unqualified opinion on those consolidated financial statements.
Basis for OpinionThe Company’s management is responsible for maintaining effective internal control over financial reportingand for its assessment of the effectiveness of internal control over financial reporting, included in theaccompanying Form 10-K. Our responsibility is to express an opinion on the Company’s internal control overfinancial reporting based on our audit. We are a public accounting firm registered with the PCAOB and arerequired to be independent with respect to the Company in accordance with the U.S. federal securities lawsand the applicable rules and regulations of the Securities and Exchange Commission and the PCAOB.
We conducted our audit in accordance with the standards of the PCAOB. Those standards require that weplan and perform the audit to obtain reasonable assurance about whether effective internal control overfinancial reporting was maintained in all material respects. Our audit of internal control over financialreporting included obtaining an understanding of internal control over financial reporting, assessing the riskthat a material weakness exists, and testing and evaluating the design and operating effectiveness of internalcontrol based on the assessed risk. Our audit also included performing such other procedures as we considerednecessary in the circumstances. We believe that our audit provides a reasonable basis for our opinion.
Definition and Limitations of Internal Control Over Financial ReportingA company’s internal control over financial reporting is a process designed to provide reasonable assuranceregarding the reliability of financial reporting and the preparation of financial statements for externalpurposes in accordance with generally accepted accounting principles. A company’s internal control overfinancial reporting includes those policies and procedures that (1) pertain to the maintenance of records that,in reasonable detail, accurately and fairly reflect the transactions and dispositions of the assets of thecompany; (2) provide reasonable assurance that transactions are recorded as necessary to permit preparationof financial statements in accordance with generally accepted accounting principles, and that receipts andexpenditures of the company are being made only in accordance with authorizations of management anddirectors of the company; and (3) provide reasonable assurance regarding prevention or timely detection ofunauthorized acquisition, use, or disposition of the company’s assets that could have a material effect on thefinancial statements.Because of its inherent limitations, internal control over financial reporting may not prevent or detectmisstatements. Also, projections of any evaluation of effectiveness to future periods are subject to the riskthat controls may become inadequate because of changes in conditions, or that the degree of compliancewith the policies or procedures may deteriorate./s/ KPMG LLP
San Francisco, CaliforniaMarch 5, 2019
63

ITEM 9B: OTHER INFORMATION
None.
PART III
ITEM 10: DIRECTORS, EXECUTIVE OFFICERS AND CORPORATE GOVERNANCE
The information required by this item is incorporated herein by reference from our definitive proxystatement for our 2019 Annual Meeting of Stockholders, which will be filed no later than 120 days afterDecember 31, 2018.
Code of Ethics
We have a written Code of Business Conduct and Ethics in place that applies to all our employees,including our principal executive officer, principal financial officer, principal accounting officer andcontroller, and persons performing similar functions. A copy of our Code of Business Conduct and Ethicsis available on our website at www.capps.com. We intend to use our website as a method of disseminatingany change to, or waiver from, our Code of Business Conduct and Ethics as permitted by the applicableSEC rules.
ITEM 11: EXECUTIVE COMPENSATION
The information required by this item is incorporated herein by reference from our definitive proxystatement for our 2019 Annual Meeting of Stockholders, which will be filed no later than 120 days afterDecember 31, 2018.
ITEM 12: SECURITY OWNERSHIP OF CERTAIN BENEFICIAL OWNERS AND MANAGEMENTAND RELATED STOCKHOLDER MATTERS
The information required by this item is incorporated herein by reference from our definitive proxystatement for our 2019 Annual Meeting of Stockholders, which will be filed no later than 120 days afterDecember 31, 2018.
ITEM 13: CERTAIN RELATIONSHIPS AND RELATED TRANSACTIONS, AND DIRECTORINDEPENDENCE
The information required by this item is incorporated herein by reference from our definitive proxystatement for our 2019 Annual Meeting of Stockholders, which will be filed no later than 120 days afterDecember 31, 2018.
ITEM 14: PRINCIPAL ACCOUNTING FEES AND SERVICES
The information required by this item is incorporated herein by reference from our definitive proxystatement for our 2019 Annual Meeting of Stockholders, which will be filed no later than 120 days afterDecember 31, 2018.
64

PART IV
ITEM 15: EXHIBITS, FINANCIAL STATEMENT SCHEDULES
(a)(1) Financial Statements.
The following financial statements are included in Item 8 of this report:Page
Report of Independent Registered Public Accounting Firm . . . . . . . . . . . . . . . . . . . . . . . . . . . 66Consolidated Balance Sheets as of December 31, 2018 and 2017 . . . . . . . . . . . . . . . . . . . . . . . . 67Consolidated Statements of Income for the years ended December 31, 2018, 2017 and 2016 . . . . 68Consolidated Statements of Comprehensive Income for the years ended December 31, 2018, 2017
and 2016 . . . . . . . . . . . . . . . . . . . . . . . . . . . . . . . . . . . . . . . . . . . . . . . . . . . . . . . . . . . . . 69Consolidated Statements of Stockholders’ Equity for the years ended December 31, 2018, 2017
and 2016 . . . . . . . . . . . . . . . . . . . . . . . . . . . . . . . . . . . . . . . . . . . . . . . . . . . . . . . . . . . . . 70Consolidated Statements of Cash Flows for the years ended December 31, 2018, 2017 and 2016 . . 71Notes to Consolidated Financial Statements . . . . . . . . . . . . . . . . . . . . . . . . . . . . . . . . . . . . . 72
(a)(2) Financial Statement Schedules.
The following financial statement schedule for the Company is filed as part of this report:
Schedule II — Valuation Accounts . . . . . . . . . . . . . . . . . . . . . . . . . . . . . . . . . . . . . . . . . . . . 104
Schedules not listed above have been omitted because the information required to be set forth therein isnot applicable or is shown in the accompanying Consolidated Financial Statements or notes thereto.
(a)(3) List of Exhibits.
The exhibits set forth on the accompanying Exhibit Index immediately following the financialstatement schedule are filed as part of, or incorporated by reference into, this Annual Report onForm 10-K. . . . . . . . . . . . . . . . . . . . . . . . . . . . . . . . . . . . . . . . . . . . . . . . . . . . . . . . . . . . 105
ITEM 16: FORM 10-K SUMMARY
None.
65

Report of Independent Registered Public Accounting Firm
To the Stockholders and Board of DirectorsCAI International, Inc.:
Opinion on the Consolidated Financial Statements
We have audited the accompanying consolidated balance sheets of CAI International, Inc. and subsidiaries(the Company) as of December 31, 2018 and 2017, the related consolidated statements of income,comprehensive income, stockholders’ equity, and cash flows for each of the years in the three-year periodended December 31, 2018, and the related notes and financial statement schedule II (collectively, theconsolidated financial statements). In our opinion, the consolidated financial statements present fairly, in allmaterial respects, the financial position of the Company as of December 31, 2018 and 2017, and the resultsof its operations and its cash flows for each of the years in the three-year period ended December 31, 2018,in conformity with U.S. generally accepted accounting principles.
We also have audited, in accordance with the standards of the Public Company Accounting OversightBoard (United States) (PCAOB), the Company’s internal control over financial reporting as ofDecember 31, 2018, based on criteria established in Internal Control — Integrated Framework (2013) issuedby the Committee of Sponsoring Organizations of the Treadway Commission, and our report datedMarch 5, 2019 expressed an unqualified opinion on the effectiveness of the Company’s internal control overfinancial reporting.
Basis for Opinion
These consolidated financial statements are the responsibility of the Company’s management. Ourresponsibility is to express an opinion on these consolidated financial statements based on our audits. Weare a public accounting firm registered with the PCAOB and are required to be independent with respect tothe Company in accordance with the U.S. federal securities laws and the applicable rules and regulations ofthe Securities and Exchange Commission and the PCAOB.
We conducted our audits in accordance with the standards of the PCAOB. Those standards require that weplan and perform the audit to obtain reasonable assurance about whether the consolidated financialstatements are free of material misstatement, whether due to error or fraud. Our audits included performingprocedures to assess the risks of material misstatement of the consolidated financial statements, whetherdue to error or fraud, and performing procedures that respond to those risks. Such procedures includedexamining, on a test basis, evidence regarding the amounts and disclosures in the consolidated financialstatements. Our audits also included evaluating the accounting principles used and significant estimatesmade by management, as well as evaluating the overall presentation of the consolidated financialstatements. We believe that our audits provide a reasonable basis for our opinion.
/s/ KPMG LLP
We have served as the Company’s auditor since 1989.
San Francisco, CaliforniaMarch 5, 2019
66

CAI INTERNATIONAL, INC.
CONSOLIDATED BALANCE SHEETS(In thousands, except share information)
December 31,2018
December 31,2017
AssetsCurrent assets
Cash . . . . . . . . . . . . . . . . . . . . . . . . . . . . . . . . . . . . . . . . . . . . . . . . . . . . . $ 20,104 $ 14,735Cash held by variable interest entities . . . . . . . . . . . . . . . . . . . . . . . . . . . . . . . . 25,211 20,685Accounts receivable, net of allowance for doubtful accounts of $2,042 and $1,440
at December 31, 2018 and 2017, respectively . . . . . . . . . . . . . . . . . . . . . . . . . . 95,942 68,324Current portion of net investment in direct finance leases . . . . . . . . . . . . . . . . . . . 75,975 30,063Prepaid expenses and other current assets . . . . . . . . . . . . . . . . . . . . . . . . . . . . . 2,789 4,258
Total current assets . . . . . . . . . . . . . . . . . . . . . . . . . . . . . . . . . . . . . . . . . . . . . . 220,021 138,065Restricted cash . . . . . . . . . . . . . . . . . . . . . . . . . . . . . . . . . . . . . . . . . . . . . . . . 30,668 11,789Rental equipment, net of accumulated depreciation of $599,443 and $505,546 at
December 31, 2018 and 2017, respectively . . . . . . . . . . . . . . . . . . . . . . . . . . . . . 2,265,260 2,004,961Net investment in direct finance leases . . . . . . . . . . . . . . . . . . . . . . . . . . . . . . . . . 473,792 246,450Goodwill . . . . . . . . . . . . . . . . . . . . . . . . . . . . . . . . . . . . . . . . . . . . . . . . . . . . 15,794 15,794Intangible assets, net of accumulated amortization of $5,397 and $3,407 at
December 31, 2018 and 2017, respectively . . . . . . . . . . . . . . . . . . . . . . . . . . . . . 5,733 7,723Furniture, fixtures and equipment, net of accumulated depreciation of $2,635 and
$3,201 at December 31, 2018 and 2017, respectively . . . . . . . . . . . . . . . . . . . . . . 964 338Other non-current assets . . . . . . . . . . . . . . . . . . . . . . . . . . . . . . . . . . . . . . . . . . 385 3,008Total assets(1) . . . . . . . . . . . . . . . . . . . . . . . . . . . . . . . . . . . . . . . . . . . . . . . . . $3,012,617 $2,428,128
Liabilities and Stockholders’ EquityCurrent liabilities
Accounts payable . . . . . . . . . . . . . . . . . . . . . . . . . . . . . . . . . . . . . . . . . . . . . $ 7,371 $ 7,831Accrued expenses and other current liabilities . . . . . . . . . . . . . . . . . . . . . . . . . . 22,460 15,706Due to container investors . . . . . . . . . . . . . . . . . . . . . . . . . . . . . . . . . . . . . . . 2,609 1,845Unearned revenue . . . . . . . . . . . . . . . . . . . . . . . . . . . . . . . . . . . . . . . . . . . . . 7,573 7,811Current portion of debt . . . . . . . . . . . . . . . . . . . . . . . . . . . . . . . . . . . . . . . . . 311,381 132,049Rental equipment payable . . . . . . . . . . . . . . . . . . . . . . . . . . . . . . . . . . . . . . . 74,139 92,415
Total current liabilities . . . . . . . . . . . . . . . . . . . . . . . . . . . . . . . . . . . . . . . . . . . 425,533 257,657Debt . . . . . . . . . . . . . . . . . . . . . . . . . . . . . . . . . . . . . . . . . . . . . . . . . . . . . . . 1,847,633 1,570,773Deferred income tax liability . . . . . . . . . . . . . . . . . . . . . . . . . . . . . . . . . . . . . . . 38,319 35,853Total liabilities(2) . . . . . . . . . . . . . . . . . . . . . . . . . . . . . . . . . . . . . . . . . . . . . . . 2,311,485 1,864,283
Stockholders’ equityPreferred stock, par value $.0001 per share; authorized 10,000,000 and 5,000,000 shares
at December 31, 2018 and 2017, respectively:8.50% Series A fixed-to-floating rate cumulative redeemable perpetual preferred
stock, issued and outstanding 2,199,610 and 0 shares at December 31, 2018 and2017, respectively, at liquidation preference . . . . . . . . . . . . . . . . . . . . . . . . . . 54,990 —
8.50% Series B fixed-to-floating rate cumulative redeemable perpetual preferredstock, issued and outstanding 1,955,000 and 0 shares at December 31, 2018 and2017, respectively, at liquidation preference . . . . . . . . . . . . . . . . . . . . . . . . . . 48,875 —
Common stock: par value $.0001 per share; authorized 84,000,000 shares; issued andoutstanding 18,764,459 and 20,390,622 shares at December 31, 2018 and 2017,respectively . . . . . . . . . . . . . . . . . . . . . . . . . . . . . . . . . . . . . . . . . . . . . . . . . 2 2
Additional paid-in capital . . . . . . . . . . . . . . . . . . . . . . . . . . . . . . . . . . . . . . . . . 132,666 172,325Accumulated other comprehensive loss . . . . . . . . . . . . . . . . . . . . . . . . . . . . . . . . (6,513) (6,122)Retained earnings . . . . . . . . . . . . . . . . . . . . . . . . . . . . . . . . . . . . . . . . . . . . . . 471,112 397,640Total stockholders’ equity . . . . . . . . . . . . . . . . . . . . . . . . . . . . . . . . . . . . . . . . . . 701,132 563,845Total liabilities and stockholders’ equity . . . . . . . . . . . . . . . . . . . . . . . . . . . . . . . . $3,012,617 $2,428,128
(1) Total assets at December 31, 2018 and December 31, 2017 include the following assets of certain variable interest entities(VIEs) that can only be used to settle the liabilities of those VIEs: Cash, $25,211 and $20,685; Net investment in directfinance leases, $13,862 and $4,423; and Rental equipment net of accumulated depreciation, $71,958 and $61,842,respectively.
(2) Total liabilities at December 31, 2018 and December 31, 2017 include the following VIE liabilities for which the VIEcreditors do not have recourse to CAI International, Inc.: Current portion of debt, $41,066 and $22,549; Debt, $67,615and $72,727, respectively.
See accompanying notes to consolidated financial statements.67

CAI INTERNATIONAL, INC.
CONSOLIDATED STATEMENTS OF INCOME(In thousands, except per share data)
Year Ended December 31,
2018 2017 2016
RevenueContainer lease revenue . . . . . . . . . . . . . . . . . . . . . . . . . . . . . . . $284,924 $235,365 $202,328Rail lease revenue . . . . . . . . . . . . . . . . . . . . . . . . . . . . . . . . . . . . 35,703 32,476 30,490Logistics revenue . . . . . . . . . . . . . . . . . . . . . . . . . . . . . . . . . . . . 111,471 80,552 61,536Total revenue . . . . . . . . . . . . . . . . . . . . . . . . . . . . . . . . . . . . . . . 432,098 348,393 294,354
Operating expensesDepreciation of rental equipment . . . . . . . . . . . . . . . . . . . . . . . . . 121,298 110,952 104,877Storage, handling and other expenses . . . . . . . . . . . . . . . . . . . . . . 14,545 20,918 35,862Logistics transportation costs . . . . . . . . . . . . . . . . . . . . . . . . . . . 97,170 68,155 51,980(Gain) loss on sale of used rental equipment . . . . . . . . . . . . . . . . . (11,725) (5,347) 12,671Administrative expenses . . . . . . . . . . . . . . . . . . . . . . . . . . . . . . . 50,305 42,699 35,678Total operating expenses . . . . . . . . . . . . . . . . . . . . . . . . . . . . . . . 271,593 237,377 241,068
Operating income . . . . . . . . . . . . . . . . . . . . . . . . . . . . . . . . . . . . 160,505 111,016 53,286
Other expensesNet interest expense . . . . . . . . . . . . . . . . . . . . . . . . . . . . . . . . . . 78,345 53,052 42,754Other expense . . . . . . . . . . . . . . . . . . . . . . . . . . . . . . . . . . . . . . 677 765 654Total other expenses . . . . . . . . . . . . . . . . . . . . . . . . . . . . . . . . . . 79,022 53,817 43,408
Income before income taxes and non-controlling interest . . . . . . . . . . 81,483 57,199 9,878Income tax expense (benefit) . . . . . . . . . . . . . . . . . . . . . . . . . . . . 2,887 (14,861) 3,844
Net income . . . . . . . . . . . . . . . . . . . . . . . . . . . . . . . . . . . . . . . . 78,596 72,060 6,034Preferred stock dividends . . . . . . . . . . . . . . . . . . . . . . . . . . . . . . 5,124 — —Net income attributable to non-controlling interest . . . . . . . . . . . . — — 37Net income attributable to CAI common stockholders . . . . . . . . . . . $ 73,472 $ 72,060 $ 5,997
Net income per share attributable to CAI common stockholdersBasic . . . . . . . . . . . . . . . . . . . . . . . . . . . . . . . . . . . . . . . . . . . . $ 3.76 $ 3.74 $ 0.31Diluted . . . . . . . . . . . . . . . . . . . . . . . . . . . . . . . . . . . . . . . . . . . $ 3.71 $ 3.68 $ 0.31
Weighted average shares of common stock outstandingBasic . . . . . . . . . . . . . . . . . . . . . . . . . . . . . . . . . . . . . . . . . . . . 19,562 19,253 19,318Diluted . . . . . . . . . . . . . . . . . . . . . . . . . . . . . . . . . . . . . . . . . . . 19,822 19,607 19,393
See accompanying notes to consolidated financial statements.68

CAI INTERNATIONAL, INC.
CONSOLIDATED STATEMENTS OF COMPREHENSIVE INCOME(In thousands)
Year Ended December 31,
2018 2017 2016
Net income . . . . . . . . . . . . . . . . . . . . . . . . . . . . . . . . . . . . . . . . $78,596 $72,060 $6,034
Other comprehensive income, net of tax:Foreign currency translation adjustments . . . . . . . . . . . . . . . . . . . (391) 2,010 (815)Comprehensive income before preferred stock dividends . . . . . . . . . 78,205 74,070 5,219Dividends on preferred stock . . . . . . . . . . . . . . . . . . . . . . . . . . . . 5,124 — —Comprehensive income attributable to non-controlling interest . . . . — — 37Comprehensive income attributable to CAI common stockholders . . $73,081 $74,070 $5,182
See accompanying notes to consolidated financial statements.69

CAI INTERNATIONAL, INC.
CONSOLIDATED STATEMENTS OF STOCKHOLDERS’ EQUITY(In thousands)
Preferred Stock Common Stock AdditionalPaid-InCapital
AccumulatedOther
ComprehensiveLoss
RetainedEarnings
Non-Controlling
InterestTotal
EquityShares Amount Shares Amount
Balances as of December 31, 2015 . . . . . . — $ — 20,133 $ 2 $148,523 $ (7,922) $318,579 $ 923 $460,105Net income . . . . . . . . . . . . . . . . . . — — — — — — 5,997 37 6,034Foreign currency translation adjustment . . — — — — — (815) — — (815)Disposal of subsidiary . . . . . . . . . . . . — — — — — 605 — (960) (355)Repurchase of common stock . . . . . . . . — — (1,104) — (9,176) — — — (9,176)Stock based compensation – options . . . . — — — — 1,292 — — — 1,292Stock based compensation – restricted
stock . . . . . . . . . . . . . . . . . . . . — — 31 — 440 — — — 440Payment of income tax withheld on
vested restricted stock . . . . . . . . . . — — (3) — (21) — — — (21)
Balances as of December 31, 2016 . . . . . . — — 19,057 2 141,058 (8,132) 324,576 — 457,504Net income . . . . . . . . . . . . . . . . . . — — — — — — 72,060 — 72,060Adoption of ASU 2016-09 . . . . . . . . . — — — — — — 1,004 — 1,004Foreign currency translation adjustment . . — — — — — 2,010 — — 2,010Issuance of common stock, net of
offering costs . . . . . . . . . . . . . . . . — — 889 — 29,148 — — — 29,148Exercise of stock options . . . . . . . . . . — — 414 — 145 — — — 145Stock based compensation – options . . . . — — — — 1,593 — — — 1,593Stock based compensation – restricted
stock . . . . . . . . . . . . . . . . . . . . — — 37 — 494 — — — 494Payment of income tax withheld on vested
restricted stock . . . . . . . . . . . . . . — — (6) — (113) — — — (113)
Balances as of December 31, 2017 . . . . . . — — 20,391 2 172,325 (6,122) 397,640 — 563,845Net income . . . . . . . . . . . . . . . . . . — — — — — — 78,596 — 78,596Preferred stock dividends . . . . . . . . . . — — — — — — (5,124) (5,124)Foreign currency translation adjustment . . — — — — — (391) — — (391)Issuance of common and preferred stock,
net of offering costs . . . . . . . . . . . . 4,155 103,865 100 — (1,552) — — — 102,313Repurchase of common stock . . . . . . . . — — (1,767) — (40,869) — — — (40,869)Exercise of stock options . . . . . . . . . . — — 5 — 24 — — — 24Stock based compensation – options . . . . — — — — 1,236 — — — 1,236Stock based compensation – restricted
stock . . . . . . . . . . . . . . . . . . . . — — 42 — 1,631 — — — 1,631Payment of income tax withheld on vested
restricted stock . . . . . . . . . . . . . . — — (7) — (129) — — — (129)
Balances as of December 31, 2018 . . . . . . 4,155 $103,865 18,764 $ 2 $132,666 $ (6,513) $471,112 $ — $701,132
See accompanying notes to consolidated financial statements.70

CAI INTERNATIONAL, INC.
CONSOLIDATED STATEMENTS OF CASH FLOWS(in thousands)
Year Ended December 31,2018 2017 2016
Cash flows from operating activitiesNet income . . . . . . . . . . . . . . . . . . . . . . . . . . . . . . . . . . . . . . . . . $ 78,596 $ 72,060 $ 6,034
Adjustments to reconcile net income to net cash provided by operatingactivities:Depreciation . . . . . . . . . . . . . . . . . . . . . . . . . . . . . . . . . . . . . . . 121,494 111,294 105,236Amortization of debt issuance costs . . . . . . . . . . . . . . . . . . . . . . . . 4,350 3,306 2,975Amortization of intangible assets . . . . . . . . . . . . . . . . . . . . . . . . . . 1,989 1,969 1,443Stock-based compensation expense . . . . . . . . . . . . . . . . . . . . . . . . . 2,867 2,087 1,732Reduction in contingent consideration . . . . . . . . . . . . . . . . . . . . . . . — (2,211) (3,789)Unrealized loss on foreign exchange . . . . . . . . . . . . . . . . . . . . . . . . 436 106 276(Gain) loss on sale of used rental equipment . . . . . . . . . . . . . . . . . . . (11,725) (5,347) 12,671Loss on disposal of subsidiary . . . . . . . . . . . . . . . . . . . . . . . . . . . . — — 146Deferred income taxes . . . . . . . . . . . . . . . . . . . . . . . . . . . . . . . . . 2,466 (14,947) 1,138Bad debt expense . . . . . . . . . . . . . . . . . . . . . . . . . . . . . . . . . . . . 492 402 3,151
Changes in other operating assets and liabilities:Accounts receivable . . . . . . . . . . . . . . . . . . . . . . . . . . . . . . . . . . . (19,269) (4,994) (1,175)Prepaid expenses and other assets . . . . . . . . . . . . . . . . . . . . . . . . . . (2,361) 735 (2,691)Accounts payable, accrued expenses and other current liabilities . . . . . . . 15 (2,206) 3,572Due to container investors . . . . . . . . . . . . . . . . . . . . . . . . . . . . . . 764 (5,766) 652Unearned revenue . . . . . . . . . . . . . . . . . . . . . . . . . . . . . . . . . . . . (344) (1,296) (2,115)
Net cash provided by operating activities . . . . . . . . . . . . . . . . . . . . . . . . 179,770 155,192 129,256
Cash flows from investing activitiesPurchase of rental equipment . . . . . . . . . . . . . . . . . . . . . . . . . . . . . . (812,021) (502,050) (251,165)Acquisitions, net of cash acquired . . . . . . . . . . . . . . . . . . . . . . . . . . . — — (15,599)Proceeds from sale of used rental equipment . . . . . . . . . . . . . . . . . . . . . 106,149 66,364 66,073Disposal of subsidiary, net of cash disposed of . . . . . . . . . . . . . . . . . . . — — (460)Purchase of furniture, fixtures and equipment . . . . . . . . . . . . . . . . . . . . (823) (126) (82)Receipt of principal payments from direct finance leases . . . . . . . . . . . . . 43,352 24,061 19,633Net cash used in investing activities . . . . . . . . . . . . . . . . . . . . . . . . . . . (663,343) (411,751) (181,600)
Cash flows from financing activitiesProceeds from debt . . . . . . . . . . . . . . . . . . . . . . . . . . . . . . . . . . . . . 1,695,064 754,340 552,540Principal payments on debt . . . . . . . . . . . . . . . . . . . . . . . . . . . . . . . (1,236,912) (527,850) (496,270)Debt issuance costs . . . . . . . . . . . . . . . . . . . . . . . . . . . . . . . . . . . . (5,130) (3,441) (1,515)Proceeds from issuance of common and preferred stock . . . . . . . . . . . . . 103,433 28,028 —Repurchase of common stock . . . . . . . . . . . . . . . . . . . . . . . . . . . . . . (40,869) — (9,176)Dividends paid to preferred stockholders . . . . . . . . . . . . . . . . . . . . . . . (3,260) — —Exercise of stock options . . . . . . . . . . . . . . . . . . . . . . . . . . . . . . . . . 24 145 —Net cash provided by financing activities . . . . . . . . . . . . . . . . . . . . . . . . 512,350 251,222 45,579Effect on cash of foreign currency translation . . . . . . . . . . . . . . . . . . . . (3) 220 (674)Net increase (decrease) in cash and restricted cash . . . . . . . . . . . . . . . . . . 28,774 (5,117) (7,439)Cash and restricted cash at beginning of the period(1) . . . . . . . . . . . . . . . 47,209 52,326 59,765Cash and restricted cash at end of the period(2) . . . . . . . . . . . . . . . . . . . . $ 75,983 $ 47,209 $ 52,326
Supplemental disclosure of cash flow informationCash paid during the period for:
Income taxes . . . . . . . . . . . . . . . . . . . . . . . . . . . . . . . . . . . . . . . $ 651 $ 194 $ 889Interest . . . . . . . . . . . . . . . . . . . . . . . . . . . . . . . . . . . . . . . . . . 71,286 47,596 38,491
Supplemental disclosure of non-cash investing and financing activityTransfer of rental equipment to direct finance lease . . . . . . . . . . . . . . . . $ 316,697 $ 205,033 $ 19,036Transfer of direct finance lease to rental equipment . . . . . . . . . . . . . . . . — 413 732Rental equipment payable . . . . . . . . . . . . . . . . . . . . . . . . . . . . . . . . 74,139 92,415 92,415
(1) Includes cash of $14,735, $15,685, and $17,447, cash held by variable interest entities of $20,685, $30,449, and $35,106,and restricted cash of $11,789, $6,192, and $7,212 at December 31, 2017, 2016, and 2015, respectively.
(2) Includes cash of $20,104, $14,735, and $15,685, cash held by variable interest entities of $25,211, $20,685, and $30,449,and restricted cash of $30,668, $11,789, and $6,192 at December 31, 2018, 2017, and 2016, respectively.
See accompanying notes to consolidated financial statements.71

CAI INTERNATIONAL, INC.
Notes to Consolidated Financial Statements
(1) The Company and Nature of Operations
CAI International, Inc., together with its subsidiaries (collectively, CAI or the Company), is atransportation finance and logistics company. The Company purchases equipment, primarily intermodalshipping containers and railcars, which it leases to its customers. The Company also manages equipment forthird-party investors. In operating its fleet, the Company leases, re-leases and disposes of equipment andcontracts for the repair, repositioning and storage of equipment. The Company also provides domestic andinternational logistics services.
In February 2016, the Company purchased Challenger Overseas LLC (Challenger), a Non-VesselOperating Common Carrier (NVOCC), for approximately $10.8 million. Challenger is headquartered inEatontown, New Jersey.
In June 2016, the Company purchased Hybrid Logistics, Inc. and its affiliate, General TransportationServices, Inc. (collectively, Hybrid), asset light truck brokers, for approximately $12.0 million. Hybrid isheadquartered in Portland, Oregon.
In July 2018, the Company combined the operations of its three logistics companies under one brandname, CAI Logistics. CAI Logistics is headquartered in Everett, Washington.
The Company’s common stock, 8.50% Series A Fixed-to-Floating Rate Cumulative RedeemablePerpetual Stock and 8.50% Series B Fixed-to-Floating Rate Cumulative Redeemable Perpetual Stock areeach traded on the New York Stock Exchange under the symbols “CAI,” “CAI-PA” and “CAI-PB,”respectively. The Company’s corporate headquarters are located in San Francisco, California.
(2) Summary of Significant Accounting Policies and Recent Accounting Pronouncements
Recent Accounting Pronouncements
In May 2014, the Financial Accounting Standards Board (FASB) issued Accounting Standards Update(ASU) 2014-09, Revenue from Contracts with Customers (Topic 606) (ASU 2014-09), which supersedesprevious revenue recognition guidance. Leasing revenue recognition is specifically excluded, and therefore,the new standard is only applicable to the Company’s logistics services agreements, management servicesagreements, and the sale of used rental equipment. The new standard defines a five-step process to achievethe core principle of ASU 2014-09, which is to recognize revenue when promised goods or services aretransferred to customers in amounts that reflect the consideration the Company expects to receive inexchange for those goods or services. The Company adopted ASU 2014-09 effective January 1, 2018, whichdid not have a material impact on the Company’s consolidated financial statements and related disclosures.See Note 2(l) for further details.
In August 2016, the FASB issued ASU No. 2016-15, Statement of Cash Flows (Topic 230):Classification of Certain Cash Receipts and Cash Payments (ASU 2016-15), which clarifies the classificationof certain cash receipts and cash payments in the statement of cash flows, including debt prepayment orextinguishment costs, settlement of contingent consideration arising from a business combination andinsurance settlement proceeds. The Company adopted ASU 2016-15 effective January 1, 2018, which didnot result in any changes to the presentation of amounts shown on the Company’s consolidated statementsof cash flows for all periods presented.
In November 2016, the FASB issued ASU No. 2016-18, Statement of Cash Flows (Topic 230):Restricted Cash (ASU 2016-18), that requires the inclusion of restricted cash and restricted cash equivalentswith cash and cash equivalents when reconciling the beginning-of-period and end-of-period total amountsshown on the statement of cash flows. The Company adopted ASU 2016-18 effective January 1, 2018,which resulted in the inclusion of the Company’s restricted cash balances along with cash in the Company’sconsolidated statements of cash flows and separate line items showing changes in restricted cash balanceswere eliminated from the Company’s consolidated statements of cash flows. ASU 2016-18 was appliedretrospectively to all periods presented.
72

CAI INTERNATIONAL, INC.
Notes to Consolidated Financial Statements
Summary of Significant Accounting Policies
(a) Principles of Consolidation
The consolidated financial statements include the financial statements of CAI International, Inc., itswholly-owned subsidiaries, and its previously 80%-owned subsidiary, CAIJ, Inc., up to its date of disposalin April 2016. All significant intercompany balances and transactions have been eliminated inconsolidation.
The Company regularly performs a review of its container fund arrangements with investors todetermine whether or not it has a variable interest in the fund and if the fund is a variable interest entity(VIE). If it is determined that the Company does not have a variable interest in the fund, further analysis isnot required and the Company does not consolidate the fund. If it is determined that the Company doeshave a variable interest in the fund and the fund is a VIE, further analysis is performed to determine if theCompany is a primary beneficiary of the VIE and meets both of the following criteria under FinancialAccounting Standards Board (FASB) Accounting Standards Codification (ASC) Topic 810, Consolidation:
• it has the power to direct the activities of the VIE that most significantly impact the VIE’seconomic performance; and
• it has the obligation to absorb losses of the VIE that could be potentially significant to the VIE orthe right to receive benefits from the VIE that could potentially be significant to the VIE.
If in the Company’s judgment both of the above criteria are met, the VIE’s financial statements areincluded in the Company’s consolidated financial statements as required under FASB ASC Topic 810,Consolidation (see Note 3).
(b) Use of Estimates
Certain estimates and assumptions were made by the Company’s management that affect the reportedamounts of assets and liabilities and disclosure of contingent assets and liabilities at the date of thefinancial statements and the reported amounts of revenue and expenses during the reporting periods.Significant items subject to such estimates and assumptions include revenue recognition, allowancesfor receivables, the carrying amount of rental equipment, the residual values and lives of rental equipment,and income tax uncertainties. Actual results could differ from those estimates.
(c) Rental equipment
Container
The Company purchases new container equipment from manufacturers to lease to its customers. TheCompany also purchases used container equipment through sale-leaseback transactions with its customers,or equipment that was previously owned by one of the Company’s third-party investors. Used equipment istypically purchased with an existing lease in place.
Container rental equipment is recorded at original cost and depreciated to an estimated residual valueon a straight-line basis over its estimated useful life. The estimated useful lives and residual values of theCompany’s container equipment are based on historical disposal experience and the Company’sexpectations for future used container sale prices. Depreciation estimates are reviewed on a regular basisto determine whether sustained changes have taken place in the useful lives of equipment or the assignedresidual values, which would suggest that a change in depreciation estimates is warranted.
73

CAI INTERNATIONAL, INC.
Notes to Consolidated Financial Statements
The estimated useful lives and residual values for the majority of the Company’s container equipmentpurchased new from the factory are as follows:
ResidualValue
DepreciableLife in Years
20-ft. standard dry van container . . . . . . . . . . . . . . . . . . . . . . . . . . . . . . . $1,050 13.040-ft. standard dry van container . . . . . . . . . . . . . . . . . . . . . . . . . . . . . . . $1,300 13.040-ft. high cube dry van container . . . . . . . . . . . . . . . . . . . . . . . . . . . . . . . $1,400 13.020-ft. refrigerated container . . . . . . . . . . . . . . . . . . . . . . . . . . . . . . . . . . . $2,750 12.040-ft. high cube refrigerated container . . . . . . . . . . . . . . . . . . . . . . . . . . . . $3,500 12.0
Other specialized equipment is depreciated to its estimated residual value, which ranges from $1,000 to$3,500, over its estimated useful life of between 12.5 years and 15 years.
For used container equipment acquired through sale-leaseback transactions, the Company oftenadjusts its estimates for remaining useful life and residual values based on current conditions in the salemarket for older containers and its expectations for how long the equipment will remain on-hire to thecurrent lessee.
Rail
Railcar equipment is recorded at original cost and depreciated over its estimated useful life of 43 yearsto its estimated residual value of $8,700 using the straight-line method. The useful life is based on anestimate of the period over which the asset will generate revenue for the Company. Residual value is basedon the average estimated scrap value of the Company’s railcars. The Company periodically reviews theappropriateness of its estimates of useful life and residual value based on changes in economiccircumstances and other factors.
The Company’s railcars may undergo refurbishment and upgrade programs to, for example, extendtheir useful life, meet higher car classification grades, enter new product or service segments, increase thetonnage carried, or to achieve higher utilization. The costs for these programs are capitalized.
Normal repairs and maintenance associated with the Company’s railcar assets are expensed asincurred.
(d) Impairment of Long-Lived Assets
On at least an annual basis, the Company evaluates its rental equipment fleet to determine whetherthere have been any events or changes in circumstances indicating that the carrying amount of all, or part,of its fleet may not be recoverable. Events which would trigger an impairment review include, among others,a significant decrease in the long-term average market value of rental equipment, a significant decrease inthe utilization rate of rental equipment resulting in an inability to generate income from operations andpositive cash flow in future periods, or a change in market conditions resulting in a significant decrease inlease rates.
When testing for impairment, equipment is generally grouped by equipment type, and is testedseparately from other groups of assets and liabilities. Potential impairment exists when the estimated futureundiscounted cash flows generated by an asset group, comprised of lease proceeds and residual values, lessrelated operating expenses, are less than the carrying value of that asset group. If potential impairmentexists, the equipment is written down to its fair value. In determining the fair value of an asset group, theCompany considers market trends, published value for similar assets, recent transactions of similar assetsand in certain cases, quotes from third party appraisers. No impairment charges were recorded in 2018,2017 and 2016.
74

CAI INTERNATIONAL, INC.
Notes to Consolidated Financial Statements
(e) Intangible Assets
Intangible assets with definite useful lives are reviewed for impairment whenever events or changes incircumstances indicate an asset’s carrying value may not be recoverable. The Company amortizes intangibleassets on a straight-line basis over their estimated useful lives as follows:
Trademarks and tradenames . . . . . . . . . . . . . . . . . . . . . . . . . . . . . . . . . . . . . . . . . . . . 2 – 3 yearsCustomer relationships . . . . . . . . . . . . . . . . . . . . . . . . . . . . . . . . . . . . . . . . . . . . . . . . 5 – 8 years
(f) Goodwill
In connection with acquisitions made in 2015 and 2016, the Company recorded $15.8 million ofgoodwill. Goodwill represents the excess of the purchase price over the fair value of the net assets acquiredin a business combination. Goodwill is not amortized but is evaluated for impairment at the reporting unitlevel annually, or more frequently if events or changes in circumstances indicate that impairment may exist.
The Company assesses qualitative factors such as industry and market considerations, overall financialperformance and other relevant events and factors affecting a reporting unit to determine if it is more likelythan not that impairment may exist and whether it is necessary to perform the quantitative goodwillimpairment test. This involves comparing the fair value to the carrying value of each reporting unit that hasgoodwill assigned to it. The Company recognizes an impairment charge for the amount by which thecarrying value of the reporting unit exceeds the fair value. The Company performed the annual impairmenttest during the fourth quarter of 2018 and concluded that there was no impairment of goodwill.
(g) Direct Finance Leases
Interest on finance leases is recognized using the effective interest method. Lease income is recorded indecreasing amounts over the term of the contract, resulting in a level rate of return on the net investment indirect finance leases.
(h) Debt Issuance Costs
To the extent that the Company is required to pay issuance fees or direct costs relating to its debt andcredit facilities, such fees are amortized over the lives of the related debt using the effective interest methodand reflected in interest expense. Unamortized debt issuance costs of $20.4 million and $11.7 million arepresented as a reduction of debt on the Company’s consolidated balance sheets as of December 31, 2018and 2017, respectively.
(i) Foreign Currency Translation
The accounts of the Company’s foreign subsidiaries have been converted at rates of exchange in effectat year-end for balance sheet accounts and average exchange rates for the year for income statementaccounts. The effects of changes in exchange rates in translating foreign subsidiaries’ financial statementsare included in stockholders’ equity as accumulated other comprehensive income.
75

CAI INTERNATIONAL, INC.
Notes to Consolidated Financial Statements
(j) Accounts Receivable
Amounts billed under leases for equipment owned by the Company, as well as amounts due fromcustomers for the provision of logistics services, are recorded in accounts receivable. The Companyestimates an allowance for doubtful accounts for accounts receivable it does not consider fully collectible.The allowance for doubtful accounts is developed based on two components: (1) specific reserves forreceivables for which management believes full collection is doubtful; and (2) a general reserve for estimatedlosses inherent in the receivables. The general reserve is estimated by applying certain percentages toreceivables that have not been specifically reserved, ranging from 1.0% on accounts that are one to thirtydays overdue, to 100% on accounts that are one year or more overdue. The allowance for doubtful accountsis reviewed regularly by management and is based on the risk profile of the receivables, credit qualityindicators such as the level of past due amounts and non-performing accounts and economic conditions.Changes in economic conditions or other events may necessitate additions or deductions to the allowancefor doubtful accounts. The allowance is intended to provide for losses inherent in the company’s accountsreceivable, and requires the application of estimates and judgments as to the outcome of collection effortsand the realization of collateral, among other things.
(k) Income Taxes
Income taxes are accounted for using the asset-and-liability method. Under this method, deferredincome taxes are recognized for the future tax consequences of differences between the tax bases of assetsand liabilities and their financial reporting amounts at each year-end. Deferred tax assets and liabilities aremeasured using enacted tax rates expected to apply to taxable income in the years in which those temporarydifferences are expected to be recovered or settled. Valuation allowances are established when it is morelikely than not that deferred tax assets will not be recovered.
The Company recognizes the effect of income tax positions only if those positions are more likely thannot of being sustained. Recognized income tax positions are measured at the largest amount that is greaterthan 50% likely of being realized. Changes in recognition or measurement are reflected in the period inwhich the change in judgment occurs. The Company records penalties and interest related to unrecognizedtax benefits within income tax expense (see Note 10).
(l) Revenue Recognition
The Company provides a range of services to its customers incorporating the rental, sale andmanagement of equipment and the provision of logistics services. Revenue for all forms of service isrecognized when earned following the guidelines under FASB ASC Topic 606, Revenue Recognition andFASB ASC Topic 840, Leases. Revenue is reported net of any related sales tax.
Container and Rail Lease Revenue
The Company recognizes revenue from operating leases of its owned equipment as earned over theterm of the lease. Where minimum lease payments vary over the lease term, revenue is recognized on astraight-line basis over the term of the lease. The Company recognizes revenue on a cash basis for certainrailcar leases that are billed on an hourly or mileage basis through a third-party railcar manager. Earlytermination of the rental contracts subjects the lessee to a penalty, which is included in lease revenue uponsuch termination. Finance lease income is recognized using the effective interest method, which generates aconstant rate of interest over the period of the lease.
Included in lease revenue is revenue consisting primarily of fees charged to the lessee for handling,delivery, and repairs, which are recognized as earned.
Also included in lease revenue is revenue from management fees earned under equipment managementagreements. Management fees are generally calculated as a percentage of the monthly net operating incomefor an investor’s portfolio and recognized as revenue in the month of service.
76
CAI INTERNATIONAL, INC.
Notes to Consolidated Financial Statements
Logistics Revenue
The Company’s logistics business derives its revenue from three principal sources: (1) truck brokerageservices, (2) intermodal transportation services, and (3) international ocean freight and freight forwardingservices. For truck brokerage services, which typically involve a short transit time, revenue is recognizedwhen delivery has been completed due to lack of reliable information to reasonably measure progresstoward complete satisfaction of the performance obligation. For intermodal transportation services, whichcan take a longer time to complete, revenue is recognized over time by measuring progress toward completesatisfaction of the performance obligation, utilizing input methods. For any such services not completed asof the end of a reporting period, a percentage of completion method based on costs incurred to date is usedto allocate the appropriate revenue to each separate reporting period. The Company provides internationalfreight forwarding services as an indirect carrier, sometimes referred to as a Non-Vessel Operating CommonCarrier. Due to the lack of reliable information to reasonably measure progress toward completesatisfaction of the performance obligation, revenue for these shipments is recognized at the time the freightdeparts the terminal of origin, which is when the customer is billed and the Company has no furtherobligation to the customer.
The Company reports logistics revenue on a gross basis as it is primarily responsible for fulfilling thepromise to provide the specified service desired by the customers and has discretion in establishing the pricefor the specified service.
Unearned Revenue
The Company records unearned revenue when cash payments are received in advance of the Companysatisfying its performance obligations.
Payment terms vary by customer and type of service. The term between invoicing and when payment isdue is not significant. For certain customers or services, the Company may require payment before theservices are delivered or performed for the customer.
Practical Expedients
The Company expenses sales commissions when incurred because the period of amortization wouldhave been one year or less. These costs are recorded within administrative expenses.
The Company does not disclose the value of unsatisfied performance obligations for (i) contracts withan original expected length of one year or less and (ii) contracts with variable consideration for a distinctgood or service that forms part of a single performance obligation.
(m) Stock-Based Compensation
The Company has granted stock options and restricted stock to certain directors and employees underits 2007 Equity Incentive Plan. The Company accounts for stock-based compensation in accordance withFASB ASC Topic 718, Compensation — Stock Compensation, which requires that compensation cost relatedto stock-based compensation be recognized in the financial statements. The cost is measured at the date theaward is granted based on the fair value of the award. The fair value of stock options is calculated using theBlack-Scholes-Merton option pricing model. The stock-based compensation expense is recognized over thevesting period of the grant on a straight-line basis (see Note 11). The company accounts for forfeitures asthey occur.
(n) Repairs and Maintenance
The Company’s leases generally require the lessee to pay for any damage to the equipment beyondnormal wear and tear at the end of the lease term. The Company accounts for repairs and maintenanceexpense on an accrual basis when an obligation to pay has been incurred.
77

CAI INTERNATIONAL, INC.
Notes to Consolidated Financial Statements
(3) Consolidation of Variable Interest Entities as a Non-Controlling Interest
The Company regularly performs a review of its container fund arrangements with investors todetermine whether or not it has a variable interest in the fund and if the fund is a VIE. If it is determinedthat the Company does not have a variable interest in the fund, further analysis is not required and theCompany does not consolidate the fund. If it is determined that the Company does have a variable interestin the fund and the fund is a VIE, further analysis is performed to determine if the Company is a primarybeneficiary of the VIE and meets both of the following criteria under FASB ASC Topic 810, Consolidation:
• it has the power to direct the activities of the VIE that most significantly impact the VIE’seconomic performance; and
• it has the obligation to absorb losses of the VIE that could be potentially significant to the VIE orthe right to receive benefits from the VIE that could potentially be significant to the VIE.
If in the Company’s judgment both of the above criteria are met, the VIE’s financial statements areincluded in the Company’s consolidated financial statements as required under FASB ASC Topic 810,Consolidation.
The Company currently enters into two types of container fund arrangements with investors which arereviewed under FASB ASC Topic 810, Consolidation. These arrangements include container funds that theCompany manages for investors and container funds that have entered into financing arrangements withinvestors. All of the funds under financing arrangements are Japanese container funds that were establishedunder separate investment agreements allowed under Japanese commercial laws. Each of the funds isfinanced by unrelated Japanese third-party investors.
Managed Container Funds
The fees earned by the Company for arranging, managing and establishing container funds arecommensurate with the level of effort required to provide those services, and the arrangements include onlyterms and conditions that are customarily present in arrangements for similar services. As such, theCompany does not have a variable interest in the managed container funds, and does not consolidate thosefunds. No container portfolios were sold to the funds in the years ended December 31, 2018, 2017 and 2016.
Collateralized Financing Obligations
The Company has transferred containers to Japanese investor funds while concurrently entering intolease agreements for the same containers, under which the Company leases the containers back from theJapanese investors. In accordance with FASB ASC Topic 840, Sale-Leaseback Transactions, the Companyconcluded these were financing transactions under which sale-leaseback accounting was not applicable.
The terms of the transactions with container funds under financing arrangements include options forthe Company to purchase the containers from the funds at a fixed price. As a result of the residual interestresulting from the fixed price call option, the Company concluded that it may absorb a significant amountof the variability associated with the funds’ anticipated economic performance and, as a result, theCompany has a variable interest in the funds. The funds are considered VIEs under FASB ASC Topic 810,Consolidation, because, as lessee of the funds, the Company has the power to direct the activities that mostsignificantly impact each entity’s economic performance, including the leasing and managing of containersowned by the funds. As the Company has the power to direct the activities that most significantly impactthe economic performance of the VIEs and the variable interest provides the Company with the right toreceive benefits from the entity that could potentially be significant to the funds, the Company determinedthat it is the primary beneficiary of these VIEs and included the VIEs’ assets and liabilities as ofDecember 31, 2018 and 2017, and the results of the VIEs’ operations and cash flows for the years endedDecember 31, 2018, 2017 and 2016 in the Company’s consolidated financial statements.
78

CAI INTERNATIONAL, INC.
Notes to Consolidated Financial Statements
The containers that were transferred to the Japanese investor funds had a net book value of$85.8 million as of December 31, 2018. The container equipment, together with $25.2 million of cash heldby the investor funds that can only be used to settle the liabilities of the VIEs, has been included on theCompany’s consolidated balance sheet with the related liability presented in the debt section of theCompany’s consolidated balance sheet as collateralized financing obligations of $107.2 million and termloans held by VIE of $1.5 million. See Note 8(e) and Note 8(f) for additional information. No gain or losswas recognized by the Company on the initial consolidation of the VIEs. Containers sold to the Japaneseinvestor funds during the years ended December 31, 2018, 2017 and 2016, had a net book value of$40.6 million, $20.5 million and $36.2 million, respectively.
(4) Rental Equipment
The following table provides a summary of the Company’s rental equipment (in thousands):December 31,
2018December 31,
2017
Dry containers . . . . . . . . . . . . . . . . . . . . . . . . . . . . . . . . . . . . . . . . . . $ 1,840,304 $ 1,533,063Refrigerated containers . . . . . . . . . . . . . . . . . . . . . . . . . . . . . . . . . . . . 341,983 345,744Other specialized equipment . . . . . . . . . . . . . . . . . . . . . . . . . . . . . . . . . 192,035 160,529Railcars . . . . . . . . . . . . . . . . . . . . . . . . . . . . . . . . . . . . . . . . . . . . . . . 490,381 471,171
2,864,703 2,510,507Accumulated depreciation . . . . . . . . . . . . . . . . . . . . . . . . . . . . . . . . . . (599,443) (505,546)Rental equipment, net of accumulated depreciation . . . . . . . . . . . . . . . . . $ 2,265,260 $ 2,004,961
(5) Net Investment in Direct Finance Leases
The following table represents the components of the Company’s net investment in direct finance leases(in thousands):
December 31,2018
December 31,2017
Gross finance lease receivables(1) . . . . . . . . . . . . . . . . . . . . . . . . . . . . . . $ 804,511 $ 412,489Unearned income(2) . . . . . . . . . . . . . . . . . . . . . . . . . . . . . . . . . . . . . . . (254,744) (135,976)Net investment in direct finance leases . . . . . . . . . . . . . . . . . . . . . . . . . . $ 549,767 $ 276,513
(1) At the inception of the lease, the Company records the total minimum lease payments, executory costs,if any, and unguaranteed residual value as gross finance lease receivables. The gross finance leasereceivables are reduced as customer payments are received. There was $74.4 million and $34.4 millionunguaranteed residual value at December 31, 2018 and 2017, respectively, included in gross financelease receivables. There were no executory costs included in gross finance lease receivables as ofDecember 31, 2018 and 2017.
(2) The difference between the gross finance lease receivables and the cost of the equipment or carryingamount at the lease inception is recorded as unearned income. Unearned income, together with initialdirect costs, are amortized to income over the lease term so as to produce a constant periodic rate ofreturn. There were no unamortized initial direct costs as of December 31, 2018 and 2017.
In order to estimate the allowance for losses contained in the gross finance lease receivables, theCompany reviews the credit worthiness of its customers on an ongoing basis. The review includesmonitoring credit quality indicators, the aging of customer receivables and general economic conditions.
79

CAI INTERNATIONAL, INC.
Notes to Consolidated Financial Statements
The categories of gross finance lease receivables based on the Company’s internal customer creditratings can be described as follows:
Tier 1 — These customers are typically large international shipping lines that have been in business formany years and have world-class operating capabilities and significant financial resources. In most cases,the Company has had a long commercial relationship with these customers and currently maintains regularcommunication with them at several levels of management, which provides the Company with insight intothe customer’s current operating and financial performance. In the Company’s view, these customers havethe greatest ability to withstand cyclical down turns and would likely have greater access to needed capitalthan lower-rated customers. The Company views the risk of default for Tier 1 customers to range fromminimal to moderate.
Tier 2 — These customers are typically either smaller shipping lines or freight forwarders with lessoperating scale or with a high degree of financial leverage, and accordingly the Company views thesecustomers as subject to higher volatility in financial performance over the business cycle. The Companygenerally expects these customers to have less access to capital markets or other sources of financing duringcyclical down turns. The Company views the risk of default for Tier 2 customers as moderate.
Tier 3 — Customers in this category exhibit volatility in payments on a regular basis.
Based on the above categories, the Company’s gross finance lease receivables were as follows (inthousands):
December 31,2018
December 31,2017
Tier 1 . . . . . . . . . . . . . . . . . . . . . . . . . . . . . . . . . . . . . . . . . . . . . . . . . $ 698,014 $ 366,629Tier 2 . . . . . . . . . . . . . . . . . . . . . . . . . . . . . . . . . . . . . . . . . . . . . . . . . 106,497 45,860Tier 3 . . . . . . . . . . . . . . . . . . . . . . . . . . . . . . . . . . . . . . . . . . . . . . . . . — —
$ 804,511 $ 412,489
Contractual maturities of the Company’s gross finance lease receivables subsequent to December 31,2018 for the years ending December 31 are as follows (in thousands):
2019 . . . . . . . . . . . . . . . . . . . . . . . . . . . . . . . . . . . . . . . . . . . . . . . . . . . . . . . . . . . . $ 117,7192020 . . . . . . . . . . . . . . . . . . . . . . . . . . . . . . . . . . . . . . . . . . . . . . . . . . . . . . . . . . . . 88,6342021 . . . . . . . . . . . . . . . . . . . . . . . . . . . . . . . . . . . . . . . . . . . . . . . . . . . . . . . . . . . . 85,3392022 . . . . . . . . . . . . . . . . . . . . . . . . . . . . . . . . . . . . . . . . . . . . . . . . . . . . . . . . . . . . 78,4962023 . . . . . . . . . . . . . . . . . . . . . . . . . . . . . . . . . . . . . . . . . . . . . . . . . . . . . . . . . . . . 73,2602024 and thereafter . . . . . . . . . . . . . . . . . . . . . . . . . . . . . . . . . . . . . . . . . . . . . . . . . . 361,063
$ 804,511
80

CAI INTERNATIONAL, INC.
Notes to Consolidated Financial Statements
(6) Intangible Assets
The Company’s intangible assets as of December 31, 2018 and 2017 were as follows (in thousands):Gross
CarryingAmount
AccumulatedAmortization
Net CarryingAmount
December 31, 2018Trademarks and tradenames . . . . . . . . . . . . . . . . . . . . . . . $ 1,786 $ (1,786) $ —Customer relationships . . . . . . . . . . . . . . . . . . . . . . . . . . . 9,344 (3,611) 5,733
$ 11,130 $ (5,397) $ 5,733
December 31, 2017Trademarks and tradenames . . . . . . . . . . . . . . . . . . . . . . . $ 1,786 $ (1,411) $ 375Customer relationships . . . . . . . . . . . . . . . . . . . . . . . . . . . 9,344 (1,996) 7,348
$ 11,130 $ (3,407) $ 7,723
Amortization expense was $2.0 million for both the years ended December 31, 2018 and 2017, and$1.4 million for the year ended December 31, 2016, and was included in administrative expenses in theconsolidated statements of income.
As of December 31, 2018, estimated future amortization expenses are as follows (in thousands):
2019 . . . . . . . . . . . . . . . . . . . . . . . . . . . . . . . . . . . . . . . . . . . . . . . . . . . . . . . . . . . . $ 1,6092020 . . . . . . . . . . . . . . . . . . . . . . . . . . . . . . . . . . . . . . . . . . . . . . . . . . . . . . . . . . . . 1,6092021 . . . . . . . . . . . . . . . . . . . . . . . . . . . . . . . . . . . . . . . . . . . . . . . . . . . . . . . . . . . . 1,5162022 . . . . . . . . . . . . . . . . . . . . . . . . . . . . . . . . . . . . . . . . . . . . . . . . . . . . . . . . . . . . 4742023 . . . . . . . . . . . . . . . . . . . . . . . . . . . . . . . . . . . . . . . . . . . . . . . . . . . . . . . . . . . . 4572024 and thereafter . . . . . . . . . . . . . . . . . . . . . . . . . . . . . . . . . . . . . . . . . . . . . . . . . . 68
$ 5,733
(7) Equipment Leases
The Company leases its equipment on either short-term operating leases through master leaseagreements, long-term non-cancelable operating leases, or finance leases. The following represents futureminimum rents receivable under long-term non-cancelable operating leases as of December 31, 2018(in thousands):
2019 . . . . . . . . . . . . . . . . . . . . . . . . . . . . . . . . . . . . . . . . . . . . . . . . . . . . . . . . . . . . $ 184,9782020 . . . . . . . . . . . . . . . . . . . . . . . . . . . . . . . . . . . . . . . . . . . . . . . . . . . . . . . . . . . . 152,9272021 . . . . . . . . . . . . . . . . . . . . . . . . . . . . . . . . . . . . . . . . . . . . . . . . . . . . . . . . . . . . 129,3612022 . . . . . . . . . . . . . . . . . . . . . . . . . . . . . . . . . . . . . . . . . . . . . . . . . . . . . . . . . . . . 107,7762023 . . . . . . . . . . . . . . . . . . . . . . . . . . . . . . . . . . . . . . . . . . . . . . . . . . . . . . . . . . . . 71,7622024 and thereafter . . . . . . . . . . . . . . . . . . . . . . . . . . . . . . . . . . . . . . . . . . . . . . . . . . 108,714
$ 755,518
See Note 5 for contractual maturities of the Company’s gross finance lease receivables.
81

CAI INTERNATIONAL, INC.
Notes to Consolidated Financial Statements
(8) Debt
Details of the Company’s debt as of December 31, 2018 and 2017 were as follows (dollars inthousands):
December 31, 2018 December 31, 2017
Maturity
OutstandingAverageInterest
OutstandingAverageInterestReference Current Long-term Current Long-term
(a)(i) Revolving credit facility . . . . . . . . . $ 4,200 $ 301,000 4.2% $ — $ 528,000 3.2% June 2023(a)(ii) Revolving credit facility – Rail . . . . . — 272,500 4.2% — 272,000 3.2% October 2023(a)(iii) Revolving credit facility – Euro . . . . — 19,457 2.0% — 14,736 2.0% September 2020(b)(i) Term loan . . . . . . . . . . . . . . . . 1,800 27,300 4.5% 21,900 — 3.4% April 2023(b)(ii) Term loan . . . . . . . . . . . . . . . . 111,750 — 3.8% 9,000 111,750 3.1% October 2019(b)(iii) Term loan . . . . . . . . . . . . . . . . 7,000 75,500 4.0% 7,000 82,500 3.3% June 2021(b)(iv) Term loan . . . . . . . . . . . . . . . . 1,240 15,284 3.4% 1,198 16,524 3.4% December 2020(b)(v) Term loan . . . . . . . . . . . . . . . . 2,909 40,651 3.6% 2,805 43,560 3.6% August 2021(b)(vi) Term loan . . . . . . . . . . . . . . . . 6,000 92,500 4.6% — — — October 2023(c) Senior secured notes. . . . . . . . . . . 6,110 52,775 4.9% 6,110 58,885 4.9% September 2022(d)(i) Asset-backed notes 2012-1 . . . . . . . 17,100 48,450 3.5% 17,100 65,550 3.5% October 2027(d)(ii) Asset-backed notes 2013-1 . . . . . . . 22,900 74,425 3.4% 22,900 97,325 3.4% March 2028(d)(iii) Asset-backed notes 2017-1 . . . . . . . 25,307 189,802 3.7% 25,307 215,109 3.7% June 2042(d)(iv) Asset-backed notes 2018-1 . . . . . . . 34,890 284,935 4.0% — — — February 2043(d)(v) Asset-backed notes 2018-2 . . . . . . . 34,350 300,563 4.4% — — — September 2043(e) Collateralized financing obligations . . 39,610 67,615 1.2% 22,549 69,441 1.2% December 2021(f) Term loans held by VIE. . . . . . . . . 1,456 — 3.3% — 3,286 2.7% June 2019
316,622 1,862,757 135,869 1,578,666Debt issuance costs (5,241) (15,124) (3,820) (7,893)
Total Debt $311,381 $1,847,633 $132,049 $1,570,773
(a) Revolving Credit Facilities
Revolving credit facilities consist of the following:
(i) On March 15, 2013, the Company entered into a Third Amended and Restated Revolving CreditAgreement, as amended, with a consortium of banks to finance the acquisition of container rentalequipment and for general working capital purposes. On June 27, 2018, the Company entered into anamendment to the Third Amended and Restated Revolving Credit Agreement, pursuant to which therevolving credit facility was amended to, among other things, increase the commitment level from$960.0 million to $1,100.0 million, with the ability to increase the revolving credit facility by an additional$250.0 million without lender approval, subject to certain conditions. The amendment also extended thematurity date of the revolving credit facility to June 26, 2023 and revised certain covenants, restrictions andevents of default to provide the Company with additional flexibility, including an increase in the maximumtotal leverage ratio from 3.75:1.00 to 4.00:1.00, subject to certain conditions.
82

CAI INTERNATIONAL, INC.
Notes to Consolidated Financial Statements
As of December 31, 2018, the maximum commitment under the revolving credit facility was$1,100.0 million. There is a commitment fee on the unused amount of the total commitment, payablequarterly in arrears. The revolving credit facility provides that swing line loans (short-term borrowings ofup to $25.0 million in the aggregate that are payable within 10 business days or at maturity date, whichevercomes earlier) and standby letters of credit (up to $30.0 million in the aggregate) will be available to theCompany. These credit commitments are part of, and not in addition to, the total commitment providedunder the revolving credit facility. The interest rates vary depending upon whether the loans arecharacterized as Base Rate loans or Eurodollar rate loans, as defined in the revolving credit agreement.Interest rates are based on LIBOR for Eurodollar loans and Base Rate for Based Rate loans. In addition tovarious financial and other covenants, the Company’s revolving credit facility also includes certainrestrictions on the Company’s ability to incur other indebtedness or pay dividends to stockholders. As ofDecember 31, 2018, the Company was in compliance with the terms of the revolving credit facility.
As of December 31, 2018, the Company had $794.7 million in availability under the revolving creditfacility (net of $0.1 million in letters of credit) subject to its ability to meet the collateral requirements underthe agreement governing the facility. Based on the borrowing base and collateral requirements atDecember 31, 2018, the borrowing availability under the revolving credit facility was $91.2 million,assuming no additional contribution of assets. The entire amount of the facility drawn at any time plusaccrued interest and fees is callable on demand in the event of certain specified events of default.
The Company’s revolving credit facility, including any amounts drawn on the facility, is secured bysubstantially all of the assets of the Company (not otherwise used as security for its other credit facilities),including containers owned by the Company, which had a net book value of $477.0 million as ofDecember 31, 2018, the underlying leases and the Company’s interest in any money received under suchcontracts.
(ii) On October 22, 2018, the Company and CAI Rail Inc. (CAI Rail), a wholly-owned subsidiary ofthe Company, entered into the Third Amended and Restated Revolving Credit Agreement with aconsortium of banks, pursuant to which the revolving credit facility for CAI Rail was amended to, amongother things, (i) extend the maturity date from October 22, 2020 to October 23, 2023, (ii) increase thecommitment level from $500.0 million to $550.0 million, with the ability to increase the facility by anadditional $150.0 million, subject to certain conditions, and (iii) revise certain of the covenants andrestrictions under the prior facility to provide the Company with additional flexibility. As of December 31,2018, the maximum credit commitment under the revolving line of credit was $550.0 million.
Borrowings under this revolving credit facility bear interest at a variable rate. The interest rates varydepending upon whether the loans are characterized as Base Rate loans or Eurodollar rate loans, as definedin the revolving credit agreement. Interest rates are based on LIBOR for Eurodollar loans, and Base Ratefor Base Rate loans.
As of December 31, 2018, CAI Rail had $277.5 million in availability under the revolving creditfacility, subject to its ability to meet the collateral requirements under the agreement governing the facility.Based on the borrowing base and collateral requirements at December 31, 2018, the borrowing availabilityunder the revolving credit facility was $18.6 million, assuming no additional contribution of assets. Theentire amount of the facility drawn at any time plus accrued interest and fees is callable on demand in theevent of certain specified events of default.
The agreement governing CAI Rail’s revolving credit facility contains various financial and othercovenants. As of December 31, 2018, CAI Rail was in compliance with the terms of the revolving creditfacility. CAI Rail’s revolving credit facility, including any amounts drawn on the facility, is secured bycertain assets of CAI Rail, which had a net book value of $363.9 million as of December 31, 2018, and isguaranteed by the Company.
83

CAI INTERNATIONAL, INC.
Notes to Consolidated Financial Statements
(iii) On September 23, 2016, the Company and CAI International GmbH (CAI GmbH), awholly-owned subsidiary of the Company, entered into a Revolving Credit Agreement with a financialinstitution to finance the acquisition of rental equipment. As of December 31, 2018, the maximum creditcommitment under the revolving credit facility was €25.0 million. Borrowings under this revolving creditfacility bear interest at a variable rate. Interest rates are based on EURIBOR.
As of December 31, 2018, CAI GmbH had €8.0 million in availability under the revolving creditfacility, subject to its ability to meet the collateral requirements under the agreement governing the facility.Based on the borrowing base and collateral requirements at December 31, 2018, the borrowing availabilityunder the revolving credit facility was €1.2 million, assuming no additional contribution of assets. Theentire amount of the facility drawn at any time plus accrued interest and fees is callable on demand in theevent of certain specified events of default.
The agreement governing CAI GmbH’s revolving credit facility containers various financial and othercovenants. As of December 31, 2018, CAI GmbH was in compliance with the terms of the revolving creditfacility. CAI GmbH’s revolving credit facility, including any amounts drawn on the facility, is secured by allof the assets of CAI GmbH, which had a net book value of €24.2 million as of December 31, 2018, and isguaranteed by the Company.
(b) Term Loans
Term loans consist of the following:
(i) On April 19, 2018, the Company entered into a $30.0 million five-year term loan agreement with abank. The loan is payable in 19 quarterly installments of $0.5 million starting July 31, 2018 and a finalpayment of $21.5 million on April 30, 2023. The loan bears interest at a variable rate based on LIBOR. Asof December 31, 2018, the loan had a balance of $29.1 million.
The following are the estimated future principal and interest payments under these loans as ofDecember 31, 2018 (in thousands). The payments were calculated assuming the interest rate remains 4.5%through maturity of the loan.
2019 . . . . . . . . . . . . . . . . . . . . . . . . . . . . . . . . . . . . . . . . . . . . . . . . . . . . . . . . . . . . $ 3,0862020 . . . . . . . . . . . . . . . . . . . . . . . . . . . . . . . . . . . . . . . . . . . . . . . . . . . . . . . . . . . . 3,0052021 . . . . . . . . . . . . . . . . . . . . . . . . . . . . . . . . . . . . . . . . . . . . . . . . . . . . . . . . . . . . 2,9242022 . . . . . . . . . . . . . . . . . . . . . . . . . . . . . . . . . . . . . . . . . . . . . . . . . . . . . . . . . . . . 2,8422023 . . . . . . . . . . . . . . . . . . . . . . . . . . . . . . . . . . . . . . . . . . . . . . . . . . . . . . . . . . . . 22,391
34,248Less: Amount representing interest . . . . . . . . . . . . . . . . . . . . . . . . . . . . . . . . . . . . . . . (5,148)Term loan . . . . . . . . . . . . . . . . . . . . . . . . . . . . . . . . . . . . . . . . . . . . . . . . . . . . . . . . $29,100
(ii) On December 20, 2010, the Company entered into a term loan agreement with a consortium ofbanks. Under this loan agreement, the Company was eligible to borrow up to $300.0 million, subject tocertain borrowing conditions, which amount is secured by certain assets of the Company’s wholly-ownedforeign subsidiaries. The loan agreement is an amortizing facility with a term of six years. The interest ratesvary depending upon whether the loans are characterized as Base Rate loans or Eurodollar rate loans, asdefined in the term loan agreement. The loan bears a variable interest rate based on LIBOR for Eurodollarloans, and Base Rate for Base Rate loans.
On March 28, 2013, the term loan was amended which reduced the principal balance of the loan from$249.4 million to $125.0 million through payment of $124.4 million from the proceeds of the $229.0 millionfixed-rate asset-backed notes issued by the Company’s indirect wholly-owned subsidiary, CAL Funding IILimited (CAL II) (see Note 8 (d) below).
84

CAI INTERNATIONAL, INC.
Notes to Consolidated Financial Statements
On October 1, 2014, the Company entered into an amended and restated term loan agreement with aconsortium of banks, pursuant to which the prior loan agreement was refinanced. The amended andrestated term loan agreement, which contains similar terms to the prior loan agreement, was amended to,among other things: (a) reduce the borrowing rates from LIBOR plus 2.25% to LIBOR plus 1.6%(per annum) for Eurodollar loans, (b) increase the loan commitment from $115.0 million to $150.0 million,(c) extend the maturity date to October 1, 2019, and (d) revise certain of the covenants and restrictionsunder the prior loan agreement to provide the Company with additional flexibility. As of December 31,2018, the term loan had a balance of $111.8 million.
The following are the estimated future principal and interest payments under this loan as ofDecember 31, 2018 (in thousands). The payments were calculated assuming the interest rate remains 3.8%through maturity of the loan.
2019 . . . . . . . . . . . . . . . . . . . . . . . . . . . . . . . . . . . . . . . . . . . . . . . . . . . . . . . . . . . . $115,275115,275
Less: Amount representing interest . . . . . . . . . . . . . . . . . . . . . . . . . . . . . . . . . . . . . . . (3,525)Term loan . . . . . . . . . . . . . . . . . . . . . . . . . . . . . . . . . . . . . . . . . . . . . . . . . . . . . . . . $111,750
(iii) On April 11, 2012, the Company entered into a term loan agreement with a consortium of banks.The agreement, as amended, provided for a five-year term loan of up to $142.0 million, subject to certainborrowing conditions, which amount is secured by certain assets of the Company.
On June 30, 2016, the Company entered into an amended and restated term loan agreement, pursuantto which the prior loan agreement was refinanced. The amended and restated term loan agreement, whichcontains similar terms to the prior loan agreement, was amended to, among other things: (a) provide theCompany with the ability to increase the commitments under the facility to a maximum of $100.0 million,subject to certain conditions, (2) extend the maturity date to June 30, 2021, and (c) revise certain of thecovenants and restrictions under the prior agreement to provide the Company with additional flexibility.The term loan’s outstanding principal is amortized quarterly, with quarterly payments equal to 1.75%multiplied by the original outstanding principal. The amended and restated term loan agreement bears avariable interest rate based on LIBOR for Eurodollar loans, and Base Rate for base rate loans. As ofDecember 31, 2018, the loan had a balance of $82.5 million.
The following are the estimated future principal and interest payments under this loan as ofDecember 31, 2018 (in thousands). The payments were calculated assuming the interest rate remains 4.0%through maturity of the loan.
2019 . . . . . . . . . . . . . . . . . . . . . . . . . . . . . . . . . . . . . . . . . . . . . . . . . . . . . . . . . . . . $10,4592020 . . . . . . . . . . . . . . . . . . . . . . . . . . . . . . . . . . . . . . . . . . . . . . . . . . . . . . . . . . . . 10,1652021 . . . . . . . . . . . . . . . . . . . . . . . . . . . . . . . . . . . . . . . . . . . . . . . . . . . . . . . . . . . . 69,953
90,577Less: Amount representing interest . . . . . . . . . . . . . . . . . . . . . . . . . . . . . . . . . . . . . . . (8,077)Term loan . . . . . . . . . . . . . . . . . . . . . . . . . . . . . . . . . . . . . . . . . . . . . . . . . . . . . . . . $82,500
(iv) On December 22, 2015, the Company entered into a $20.0 million five-year term loan agreementfor CAI Rail with a financial institution. The term loan’s outstanding principal bears interest at a fixed rateof 3.4% per annum and is amortized quarterly. Any unpaid principal and interest is due and payable onDecember 22, 2020. The proceeds from the term loan were primarily used to repay outstanding amountsunder CAI Rail’s revolving credit facility. As of December 31, 2018, the loan had a balance of$16.5 million.
85

CAI INTERNATIONAL, INC.
Notes to Consolidated Financial Statements
The following are the estimated future principal and interest payments under this loan as ofDecember 31, 2018 (in thousands). The payments were calculated based on the fixed interest rate of 3.4%.
2019 . . . . . . . . . . . . . . . . . . . . . . . . . . . . . . . . . . . . . . . . . . . . . . . . . . . . . . . . . . . . $ 1,7932020 . . . . . . . . . . . . . . . . . . . . . . . . . . . . . . . . . . . . . . . . . . . . . . . . . . . . . . . . . . . . 15,793
17,586Less: Amount representing interest . . . . . . . . . . . . . . . . . . . . . . . . . . . . . . . . . . . . . . . (1,062)Term loan . . . . . . . . . . . . . . . . . . . . . . . . . . . . . . . . . . . . . . . . . . . . . . . . . . . . . . . . $16,524
(v) On August 30, 2016, CAI Rail entered into a term loan agreement of up to $100.0 million with aconsortium of banks for the acquisition of railcars, subject to certain borrowing conditions, which issecured by certain railcars and other assets of CAI Rail. The loan agreement is an amortizing facility with aterm of five years. Borrowings under the loan bear interest at a fixed rate as specified in the applicable termnote entered into at the time a draw is made under the loan agreement. Principal and interest on theborrowings are payable monthly during the five-year term of the note. At closing of the loan agreement,CAI Rail made a draw of $50.0 million on the facility at a fixed interest rate of 3.6% per annum. Anyunpaid principal and interest is due on August 30, 2021. As of December 31, 2018, the loan had a balanceof $43.6 million.
The following are the estimated future principal and interest payments under this loan as ofDecember 31, 2018 (in thousands). The payments were calculated based on the fixed interest rate of 3.6%.
2019 . . . . . . . . . . . . . . . . . . . . . . . . . . . . . . . . . . . . . . . . . . . . . . . . . . . . . . . . . . . . $ 4,4412020 . . . . . . . . . . . . . . . . . . . . . . . . . . . . . . . . . . . . . . . . . . . . . . . . . . . . . . . . . . . . 4,4412021 . . . . . . . . . . . . . . . . . . . . . . . . . . . . . . . . . . . . . . . . . . . . . . . . . . . . . . . . . . . . 38,524
47,406Less: Amount representing interest . . . . . . . . . . . . . . . . . . . . . . . . . . . . . . . . . . . . . . . (3,846)Term loan . . . . . . . . . . . . . . . . . . . . . . . . . . . . . . . . . . . . . . . . . . . . . . . . . . . . . . . . $43,560
(vi) On October 18, 2018, the Company entered into a $100.0 million five-year term loan agreementwith a bank. The loan is payable in 20 quarterly installments of $1.5 million starting December 20, 2018and a final payment of $70.0 million on October 18, 2023. The outstanding principal amounts under theloan bear interest at a fixed rate per annum of 4.6%. As of December 31, 2018, the loan had a balance of$98.5 million.
The following are the estimated future principal and interest payments under this loan as ofDecember 31, 2018 (in thousands). The payments were calculated based on the fixed interest rate of 4.6%.
2019 . . . . . . . . . . . . . . . . . . . . . . . . . . . . . . . . . . . . . . . . . . . . . . . . . . . . . . . . . . . . $ 10,3962020 . . . . . . . . . . . . . . . . . . . . . . . . . . . . . . . . . . . . . . . . . . . . . . . . . . . . . . . . . . . . 10,1222021 . . . . . . . . . . . . . . . . . . . . . . . . . . . . . . . . . . . . . . . . . . . . . . . . . . . . . . . . . . . . 9,8482022 . . . . . . . . . . . . . . . . . . . . . . . . . . . . . . . . . . . . . . . . . . . . . . . . . . . . . . . . . . . . 9,5742023 . . . . . . . . . . . . . . . . . . . . . . . . . . . . . . . . . . . . . . . . . . . . . . . . . . . . . . . . . . . . 77,266
117,206Less: Amount representing interest . . . . . . . . . . . . . . . . . . . . . . . . . . . . . . . . . . . . . . . (18,706)Term loan . . . . . . . . . . . . . . . . . . . . . . . . . . . . . . . . . . . . . . . . . . . . . . . . . . . . . . . . $ 98,500
86

CAI INTERNATIONAL, INC.
Notes to Consolidated Financial Statements
The Company’s term loans are secured by rental equipment owned by the Company, which had a netbook value of $461.8 million as of December 31, 2018.
(c) Senior Secured Notes
On September 13, 2012, Container Applications Limited (CAL), a wholly-owned subsidiary of theCompany, entered into a Note Purchase Agreement with certain institutional investors, pursuant to whichCAL issued $103.0 million of its 4.90% Senior Secured Notes due September 13, 2022 (the Notes) to theinvestors. The Notes are guaranteed by the Company and secured by certain assets of CAL and theCompany.
The Notes bear interest at 4.9% per annum, due and payable semiannually on March 13 andSeptember 13 of each year, commencing on March 13, 2013. In addition, CAL is required to make certainprincipal payments on March 13 and September 13 of each year, commencing on March 13, 2013. Anyunpaid principal and interest is due and payable on September 13, 2022. The Note Purchase Agreementprovides that CAL may prepay at any time all or any part of the Notes in an amount not less than 10% ofthe aggregate principal amount of the Notes then outstanding. As of December 31, 2018, the Notes had abalance of $58.9 million.
The following are the estimated future principal and interest payments under the Notes as ofDecember 31, 2018 (in thousands). The payments were calculated based on the fixed interest rate of 4.9%.
2019 . . . . . . . . . . . . . . . . . . . . . . . . . . . . . . . . . . . . . . . . . . . . . . . . . . . . . . . . . . . . $ 8,9212020 . . . . . . . . . . . . . . . . . . . . . . . . . . . . . . . . . . . . . . . . . . . . . . . . . . . . . . . . . . . . 8,6212021 . . . . . . . . . . . . . . . . . . . . . . . . . . . . . . . . . . . . . . . . . . . . . . . . . . . . . . . . . . . . 8,3222022 . . . . . . . . . . . . . . . . . . . . . . . . . . . . . . . . . . . . . . . . . . . . . . . . . . . . . . . . . . . . 42,467
68,331Less: Amount representing interest . . . . . . . . . . . . . . . . . . . . . . . . . . . . . . . . . . . . . . . (9,446)Senior secured notes . . . . . . . . . . . . . . . . . . . . . . . . . . . . . . . . . . . . . . . . . . . . . . . . . $58,885
The Company’s senior secured notes are secured by rental equipment owned by the Company, whichhad a net book value of $76.2 million as of December 31, 2018.
(d) Asset-Backed Notes
Asset-backed notes consist of the following:
(i) On October 18, 2012, CAL II issued $171.0 million of 3.47% fixed rate asset-backed notes(Series 2012-1 Asset-Backed Notes). Principal and interest on the Series 2012-1 Asset-Backed Notes ispayable monthly commencing on November 26, 2012, and the Series 2012-1 Asset-Backed Notes mature inOctober 2027. The proceeds from the Series 2012-1 Asset-Backed Notes were used to repay part of theCompany’s borrowings under its senior revolving credit facility. As of December 31, 2018, the Series 2012-1Asset-Backed Notes had a balance of $65.6 million.
87

CAI INTERNATIONAL, INC.
Notes to Consolidated Financial Statements
The following are the estimated future principal and interest payments under the Series 2012-1Asset-Backed Notes as of December 31, 2018 (in thousands). The payments were calculated based on thefixed interest rate of 3.5%.
2019 . . . . . . . . . . . . . . . . . . . . . . . . . . . . . . . . . . . . . . . . . . . . . . . . . . . . . . . . . . . . $19,1032020 . . . . . . . . . . . . . . . . . . . . . . . . . . . . . . . . . . . . . . . . . . . . . . . . . . . . . . . . . . . . 18,5092021 . . . . . . . . . . . . . . . . . . . . . . . . . . . . . . . . . . . . . . . . . . . . . . . . . . . . . . . . . . . . 17,9162022 . . . . . . . . . . . . . . . . . . . . . . . . . . . . . . . . . . . . . . . . . . . . . . . . . . . . . . . . . . . . 14,477
70,005Less: Amount representing interest . . . . . . . . . . . . . . . . . . . . . . . . . . . . . . . . . . . . . . . (4,455)Asset-backed notes . . . . . . . . . . . . . . . . . . . . . . . . . . . . . . . . . . . . . . . . . . . . . . . . . . $65,550
(ii) On March 28, 2013, CAL II issued $229.0 million of 3.35% fixed rate asset-backed notes(Series 2013-1 Asset-Backed Notes). Principal and interest on the Series 2013-1 Asset-Backed Notes ispayable monthly commencing on April 25, 2013, and the Series 2013-1 Asset-Backed Notes mature inMarch 2028. The proceeds from the Series 2013-1 Asset-Backed Notes were used partly to reduce thebalance of the Company’s term loan as described in Note 10 (b)(ii) above, and to partially pay down theCompany’s senior revolving credit facility. The Series 2013-1 Asset-Backed Notes had a balance of$97.3 million as of December 31, 2018.
The following are the estimated future principal and interest payments under the Series 2013-1Asset-Backed Notes as of December 31, 2018 (in thousands). The payments were calculated based on thefixed interest rate of 3.4%.
2019 . . . . . . . . . . . . . . . . . . . . . . . . . . . . . . . . . . . . . . . . . . . . . . . . . . . . . . . . . . . . $ 25,8092020 . . . . . . . . . . . . . . . . . . . . . . . . . . . . . . . . . . . . . . . . . . . . . . . . . . . . . . . . . . . . 25,0422021 . . . . . . . . . . . . . . . . . . . . . . . . . . . . . . . . . . . . . . . . . . . . . . . . . . . . . . . . . . . . 24,2742022 . . . . . . . . . . . . . . . . . . . . . . . . . . . . . . . . . . . . . . . . . . . . . . . . . . . . . . . . . . . . 23,5072023 . . . . . . . . . . . . . . . . . . . . . . . . . . . . . . . . . . . . . . . . . . . . . . . . . . . . . . . . . . . . 5,757
104,389Less: Amount representing interest . . . . . . . . . . . . . . . . . . . . . . . . . . . . . . . . . . . . . . . (7,064)Asset-backed notes . . . . . . . . . . . . . . . . . . . . . . . . . . . . . . . . . . . . . . . . . . . . . . . . . . $ 97,325
(iii) On July 6, 2017, CAL Funding III Limited (CAL III), a wholly-owned indirect subsidiary of CAI,issued $240.9 million of 3.6% Class A fixed rate asset-backed notes and $12.2 million of 4.6% Class B fixedrate asset-backed notes (collectively, the Series 2017-1 Asset-Backed Notes). Principal and interest on theSeries 2017-1 Asset-Backed Notes is payable monthly commencing on July 25, 2017, with the Series 2017-1Asset-Backed Notes maturing in June 2042. The proceeds from the Series 2017-1 Asset-Backed Notes wereused for general corporate purposes, including repayment of debt by the Company. As of December 31,2018, the Series 2017-1 Asset-Backed Notes had a balance of $215.1 million.
88

CAI INTERNATIONAL, INC.
Notes to Consolidated Financial Statements
The following are the estimated future principal and interest payments under the Series 2017-1Asset-Backed Notes as of December 31, 2018 (in thousands). The payments were calculated based on theweighted average fixed interest rate of 3.7%.
2019 . . . . . . . . . . . . . . . . . . . . . . . . . . . . . . . . . . . . . . . . . . . . . . . . . . . . . . . . . . . . $ 32,7702020 . . . . . . . . . . . . . . . . . . . . . . . . . . . . . . . . . . . . . . . . . . . . . . . . . . . . . . . . . . . . 31,8422021 . . . . . . . . . . . . . . . . . . . . . . . . . . . . . . . . . . . . . . . . . . . . . . . . . . . . . . . . . . . . 30,9142022 . . . . . . . . . . . . . . . . . . . . . . . . . . . . . . . . . . . . . . . . . . . . . . . . . . . . . . . . . . . . 29,9862023 . . . . . . . . . . . . . . . . . . . . . . . . . . . . . . . . . . . . . . . . . . . . . . . . . . . . . . . . . . . . 29,0582024 and thereafter . . . . . . . . . . . . . . . . . . . . . . . . . . . . . . . . . . . . . . . . . . . . . . . . . . 94,394
248,964Less: Amount representing interest . . . . . . . . . . . . . . . . . . . . . . . . . . . . . . . . . . . . . . . (33,855)Asset-backed notes . . . . . . . . . . . . . . . . . . . . . . . . . . . . . . . . . . . . . . . . . . . . . . . . . . $215,109
(iv) On February 28, 2018, CAL III issued $332.0 million of 4.0% Class A fixed rate asset-backednotes and $16.9 million of 4.8% Class B fixed rate asset-backed notes (collectively, the Series 2018-1Asset-Backed Notes). Principal and interest on the Series 2018-1 Asset-Backed Notes is payable monthlycommencing on March 26, 2018, with the Series 2018-1 Asset-Backed Notes maturing in February 2043.The proceeds were used for general corporate purposes, including repayment of debt by the Company. As ofDecember 31, 2018, the Series 2018-1 Asset-Backed Notes had a balance of $319.8 million.
The following are the estimated future principal and interest payments under the Series 2018-1Asset-Backed Notes as of December 31, 2018 (in thousands). The payments were calculated based on theweighted average fixed interest rate of 4.0%.
2019 . . . . . . . . . . . . . . . . . . . . . . . . . . . . . . . . . . . . . . . . . . . . . . . . . . . . . . . . . . . . $ 47,0452020 . . . . . . . . . . . . . . . . . . . . . . . . . . . . . . . . . . . . . . . . . . . . . . . . . . . . . . . . . . . . 45,6502021 . . . . . . . . . . . . . . . . . . . . . . . . . . . . . . . . . . . . . . . . . . . . . . . . . . . . . . . . . . . . 44,2542022 . . . . . . . . . . . . . . . . . . . . . . . . . . . . . . . . . . . . . . . . . . . . . . . . . . . . . . . . . . . . 42,8582023 . . . . . . . . . . . . . . . . . . . . . . . . . . . . . . . . . . . . . . . . . . . . . . . . . . . . . . . . . . . . 41,4622024 and thereafter . . . . . . . . . . . . . . . . . . . . . . . . . . . . . . . . . . . . . . . . . . . . . . . . . . 157,734
379,003Less: Amount representing interest . . . . . . . . . . . . . . . . . . . . . . . . . . . . . . . . . . . . . . . (59,178)Asset-backed notes . . . . . . . . . . . . . . . . . . . . . . . . . . . . . . . . . . . . . . . . . . . . . . . . . . $319,825
(v) On September 19, 2018, CAL III issued $331.5 million of 4.3% Class A fixed rate asset-backednotes and $12.0 million of 5.2% Class B fixed rate asset-backed notes (collectively, the Series 2018-2Asset-Backed Notes). Principal and interest on the Series 2018-2 Asset-Backed Notes is payable monthlycommencing on October 25, 2018, with the Series 2018-2 Asset-Backed Notes maturing in September 2043.The proceeds were used for general corporate purposes, including repayment of debt by the Company. As ofDecember 31, 2018, the Series 2018-2 Asset-Backed Notes had a balance of $334.9 million.
89

CAI INTERNATIONAL, INC.
Notes to Consolidated Financial Statements
The following are the estimated future principal and interest payments under the Series 2018-2Asset-Backed Notes as of December 31, 2018 (in thousands). The payments were calculated based on theweighted average fixed interest rate of 4.4%.
2019 . . . . . . . . . . . . . . . . . . . . . . . . . . . . . . . . . . . . . . . . . . . . . . . . . . . . . . . . . . . . $ 48,3002020 . . . . . . . . . . . . . . . . . . . . . . . . . . . . . . . . . . . . . . . . . . . . . . . . . . . . . . . . . . . . 46,7992021 . . . . . . . . . . . . . . . . . . . . . . . . . . . . . . . . . . . . . . . . . . . . . . . . . . . . . . . . . . . . 45,2972022 . . . . . . . . . . . . . . . . . . . . . . . . . . . . . . . . . . . . . . . . . . . . . . . . . . . . . . . . . . . . 43,7962023 . . . . . . . . . . . . . . . . . . . . . . . . . . . . . . . . . . . . . . . . . . . . . . . . . . . . . . . . . . . . 42,2952024 and thereafter . . . . . . . . . . . . . . . . . . . . . . . . . . . . . . . . . . . . . . . . . . . . . . . . . . 180,397
406,884Less: Amount representing interest . . . . . . . . . . . . . . . . . . . . . . . . . . . . . . . . . . . . . . . (71,971)Asset-backed notes . . . . . . . . . . . . . . . . . . . . . . . . . . . . . . . . . . . . . . . . . . . . . . . . . . $334,913
The Company’s asset-backed notes are secured by rental equipment owned by the Company, which hada net book value of $1,249.2 million as of December 31, 2018.
The agreements under each of the asset-backed notes described above require the Company tomaintain a restricted cash account to cover payment of the obligations. As of December 31, 2018, therestricted cash account had a balance of $30.7 million.
(e) Collateralized Financing Obligations
As of December 31, 2018, the Company had collateralized financing obligations of $107.2 million (seeNote 3). The obligations had an average interest rate of 1.2% as of December 31, 2018 with maturity datesbetween March 2019 and December 2021. The debt is secured by a pool of containers covered under thefinancing arrangements.
The following are the estimated future principal and interest payments under the Company’scollateralized financing obligations as of December 31, 2018 (in thousands). The payments were calculatedassuming an average interest rate of 1.2% through maturity of the obligations.
2019 . . . . . . . . . . . . . . . . . . . . . . . . . . . . . . . . . . . . . . . . . . . . . . . . . . . . . . . . . . . . $ 40,7842020 . . . . . . . . . . . . . . . . . . . . . . . . . . . . . . . . . . . . . . . . . . . . . . . . . . . . . . . . . . . . 22,0842021 . . . . . . . . . . . . . . . . . . . . . . . . . . . . . . . . . . . . . . . . . . . . . . . . . . . . . . . . . . . . 36,4142022 . . . . . . . . . . . . . . . . . . . . . . . . . . . . . . . . . . . . . . . . . . . . . . . . . . . . . . . . . . . . 10,147
109,429Less: Amount representing interest . . . . . . . . . . . . . . . . . . . . . . . . . . . . . . . . . . . . . . . (2,204)Collateralized financing obligations . . . . . . . . . . . . . . . . . . . . . . . . . . . . . . . . . . . . . . . $107,225
(f) Term Loans Held by VIE
On June 25, 2014, one of the Japanese investor funds that is consolidated by the Company as a VIE(see Note 3) entered into a term loan agreement with a bank. Under the terms of the agreement, theJapanese investor fund entered into two loans; a five year, amortizing loan of $9.2 million at a fixed interestrate of 2.7%, and a five year, non-amortizing loan of $1.6 million at a variable interest rate based onLIBOR. The debt is secured by assets of the Japanese investor fund, and is subject to certain borrowingconditions set out in the loan agreement. As of December 31, 2018, the term loans held by the Japaneseinvestor fund totaled $1.5 million and had an average interest rate of 3.3%.
90

CAI INTERNATIONAL, INC.
Notes to Consolidated Financial Statements
The following are the estimated future principal and interest payments under this loan as ofDecember 31, 2018 (in thousands). The payments were calculated assuming the interest rate remains3.3% through maturity of the loan.
2019 . . . . . . . . . . . . . . . . . . . . . . . . . . . . . . . . . . . . . . . . . . . . . . . . . . . . . . . . . . . . $1,4861,486
Less: Amount representing interest . . . . . . . . . . . . . . . . . . . . . . . . . . . . . . . . . . . . . . . (30)Term loans held by VIE . . . . . . . . . . . . . . . . . . . . . . . . . . . . . . . . . . . . . . . . . . . . . . . $1,456
The Company’s term loans held by VIE are secured by rental equipment owned by the Japaneseinvestor fund, which had a net book value of $8.5 million as of December 31, 2018.
The agreements relating to all of the Company’s debt contain various financial and other covenants.As of December 31, 2018, the Company was in compliance with all of its debt covenants.
(9) Stock–Based Compensation Plan
Stock OptionsThe Company may grant stock options from time to time to certain employees and independent
directors pursuant to its 2007 Equity Incentive Plan, as amended (Plan). Under the Plan, a maximum of3,421,980 share awards may be granted.
Stock options granted to employees have a vesting period of four years from grant date, with 25%vesting after one year, and 1∕48
th vesting each month thereafter until fully vested. Stock options granted toindependent directors vest in one year. All of the stock options have a contractual term of ten years.
The following table summarizes the Company’s stock option activities for the three years endedDecember 31, 2018:
Number ofShares
WeightedAverageExercise
Price
WeightedAverage
RemainingContractual
Term(in years)
AggregateIntrinsic
Value(in thousands)
Options outstanding, December 31, 2015 . . . . . . 1,189,255 $18.08Options granted . . . . . . . . . . . . . . . . . . . . . 245,000 $ 7.87Options forfeited/cancelled . . . . . . . . . . . . . . (6,000) $21.99
Options outstanding, December 31, 2016 . . . . . . 1,428,255 $16.31Options granted . . . . . . . . . . . . . . . . . . . . . 230,500 $16.80Options exercised . . . . . . . . . . . . . . . . . . . . . (799,195) $16.31
Options outstanding, December 31, 2017 . . . . . . 859,560 $16.44Options granted . . . . . . . . . . . . . . . . . . . . . — $ —Options exercised . . . . . . . . . . . . . . . . . . . . . (9,393) $14.76
Options outstanding, December 31, 2018 . . . . . . 850,167 $16.46 5.9 $5,936Options exercisable at December 31, 2018 . . . . . 657,471 $17.38 5.3 $4,028Expected to vest after December 31, 2018 . . . . . 192,696 $13.33 7.7 $1,907
The aggregate intrinsic value represents the value by which the Company’s closing stock price of$23.23 per share on the last trading day of the year ended December 31, 2018 exceeds the exercise price ofthe stock multiplied by the number of options outstanding or exercisable, excluding options that have a zeroor negative intrinsic value. The aggregate intrinsic value of stock options exercised during 2018 and 2017,based on the closing share price on the date each option was exercised, was $0.1 million and $11.7 million,respectively.
91

CAI INTERNATIONAL, INC.
Notes to Consolidated Financial Statements
The Company recognized stock-based compensation expense relating to stock options of $1.2 million,$1.6 million and $1.3 million for the years ended December 31, 2018, 2017 and 2016, respectively. As ofDecember 31, 2018, the remaining unamortized stock-based compensation cost relating to stock optionsgranted to the Company’s employees and independent directors was approximately $1.3 million, which is tobe recognized over the remaining weighted average vesting period of approximately 1.7 years.
The total fair value of stock options granted to the Company’s employees and independent directors atthe time of grant was approximately $2.1 million, or $9.16 per share and $0.9 million, or $3.55 per share forthe years ended December 31, 2017 and 2016, respectively, calculated using the Black-Scholes-Mertonpricing model under the following weighted average assumptions:
2017 2016
Stock price . . . . . . . . . . . . . . . . . . . . . . . . . . . . . . . . . . . . . . . . . . . . . . . $ 16.80 $ 7.87Exercise price . . . . . . . . . . . . . . . . . . . . . . . . . . . . . . . . . . . . . . . . . . . . . $ 16.80 $ 7.87Expected term (years) . . . . . . . . . . . . . . . . . . . . . . . . . . . . . . . . . . . . . . . 5.5 – 6.25 5.5 – 6.25Expected volatility (%) . . . . . . . . . . . . . . . . . . . . . . . . . . . . . . . . . . . . . . . 56.4 – 57.5 45.4 – 46.7Risk-free interest rate (%) . . . . . . . . . . . . . . . . . . . . . . . . . . . . . . . . . . . . . 1.77 – 2.14 1.30 – 1.40Dividend yield (%) . . . . . . . . . . . . . . . . . . . . . . . . . . . . . . . . . . . . . . . . . — —
No options were granted by the Company during the year ended December 31, 2018.
The expected option term is calculated using the simplified method in accordance with SEC guidance.The expected volatility was derived from the average volatility of the Company’s stock over a periodapproximating the expected term of the options. The risk-free rate is based on the daily U.S. Treasury yieldcurve with a term approximating the expected term of the options. No forfeiture was estimated on alloptions granted during the years ended December 31, 2017 and 2016, as the Company accounts forforfeitures as they occur (see Note 2(m)).
Restricted Stock and Performance Stock
The Company grants restricted stock, comprising restricted stock units and restricted stock awards,from time to time to certain employees and independent directors pursuant to the Plan. Restricted stockgranted to employees has a vesting period of four years; 25% vesting on each anniversary of the grant date.Restricted stock granted to independent directors vests in one year. The company recognizes thecompensation cost associated with restricted stock over the vesting period based on the closing price of theCompany’s stock on the date of grant.
The Company grants performance stock to selected executives and other key employees. Theperformance stock vests at the end of a 3-year performance cycle if certain financial performance targetsare met. The Company recognizes compensation cost associated with the performance stock ratably overthe 3-year term when it is considered probable that performance targets will be met. Compensation cost isbased on the closing price of the Company’s common stock on the date of grant.
92
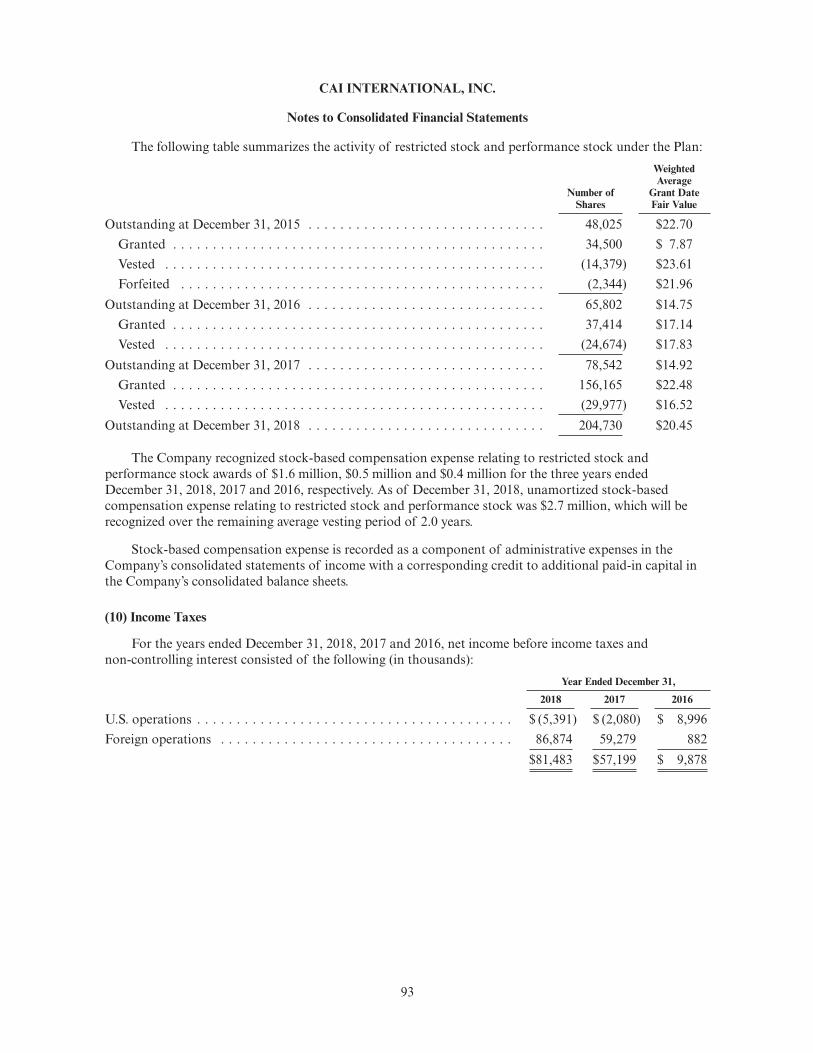
CAI INTERNATIONAL, INC.
Notes to Consolidated Financial Statements
The following table summarizes the activity of restricted stock and performance stock under the Plan:
Number ofShares
WeightedAverage
Grant DateFair Value
Outstanding at December 31, 2015 . . . . . . . . . . . . . . . . . . . . . . . . . . . . . . 48,025 $22.70Granted . . . . . . . . . . . . . . . . . . . . . . . . . . . . . . . . . . . . . . . . . . . . . . . 34,500 $ 7.87Vested . . . . . . . . . . . . . . . . . . . . . . . . . . . . . . . . . . . . . . . . . . . . . . . . (14,379) $23.61Forfeited . . . . . . . . . . . . . . . . . . . . . . . . . . . . . . . . . . . . . . . . . . . . . . (2,344) $21.96
Outstanding at December 31, 2016 . . . . . . . . . . . . . . . . . . . . . . . . . . . . . . 65,802 $14.75Granted . . . . . . . . . . . . . . . . . . . . . . . . . . . . . . . . . . . . . . . . . . . . . . . 37,414 $17.14Vested . . . . . . . . . . . . . . . . . . . . . . . . . . . . . . . . . . . . . . . . . . . . . . . . (24,674) $17.83
Outstanding at December 31, 2017 . . . . . . . . . . . . . . . . . . . . . . . . . . . . . . 78,542 $14.92Granted . . . . . . . . . . . . . . . . . . . . . . . . . . . . . . . . . . . . . . . . . . . . . . . 156,165 $22.48Vested . . . . . . . . . . . . . . . . . . . . . . . . . . . . . . . . . . . . . . . . . . . . . . . . (29,977) $16.52
Outstanding at December 31, 2018 . . . . . . . . . . . . . . . . . . . . . . . . . . . . . . 204,730 $20.45
The Company recognized stock-based compensation expense relating to restricted stock andperformance stock awards of $1.6 million, $0.5 million and $0.4 million for the three years endedDecember 31, 2018, 2017 and 2016, respectively. As of December 31, 2018, unamortized stock-basedcompensation expense relating to restricted stock and performance stock was $2.7 million, which will berecognized over the remaining average vesting period of 2.0 years.
Stock-based compensation expense is recorded as a component of administrative expenses in theCompany’s consolidated statements of income with a corresponding credit to additional paid-in capital inthe Company’s consolidated balance sheets.
(10) Income Taxes
For the years ended December 31, 2018, 2017 and 2016, net income before income taxes andnon-controlling interest consisted of the following (in thousands):
Year Ended December 31,
2018 2017 2016
U.S. operations . . . . . . . . . . . . . . . . . . . . . . . . . . . . . . . . . . . . . . . . $ (5,391) $ (2,080) $ 8,996Foreign operations . . . . . . . . . . . . . . . . . . . . . . . . . . . . . . . . . . . . . 86,874 59,279 882
$81,483 $57,199 $ 9,878
93
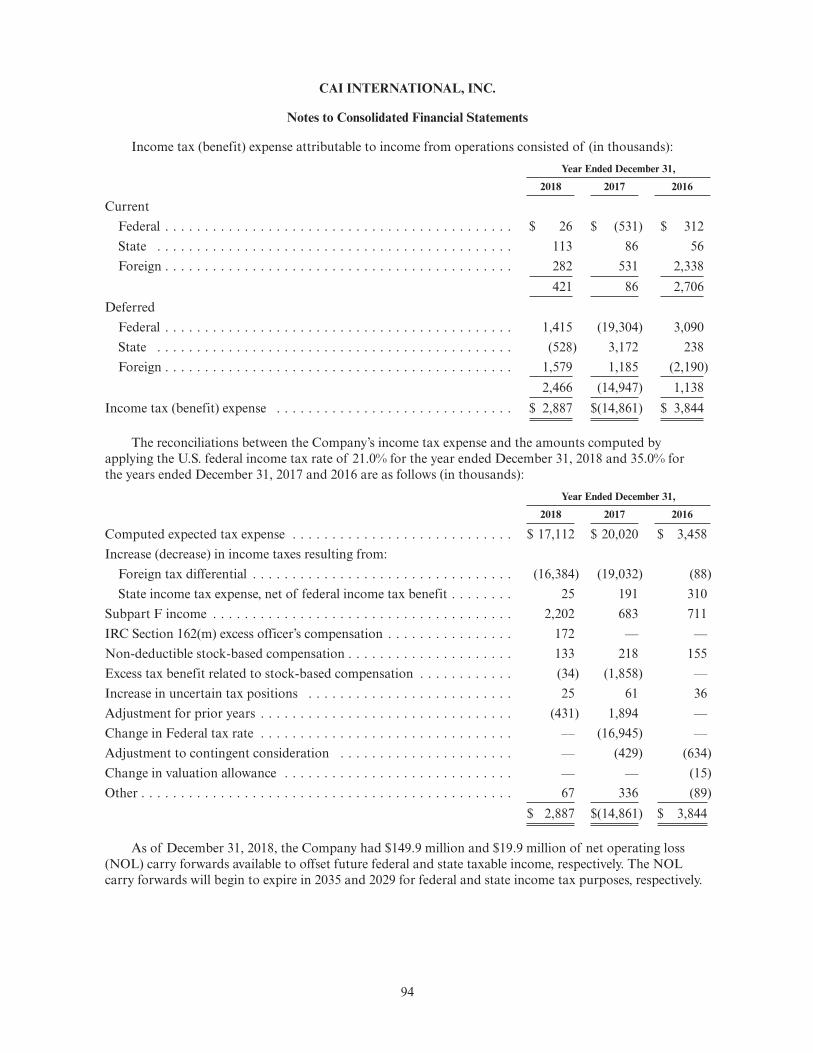
CAI INTERNATIONAL, INC.
Notes to Consolidated Financial Statements
Income tax (benefit) expense attributable to income from operations consisted of (in thousands):Year Ended December 31,
2018 2017 2016
CurrentFederal . . . . . . . . . . . . . . . . . . . . . . . . . . . . . . . . . . . . . . . . . . . . $ 26 $ (531) $ 312State . . . . . . . . . . . . . . . . . . . . . . . . . . . . . . . . . . . . . . . . . . . . . 113 86 56Foreign . . . . . . . . . . . . . . . . . . . . . . . . . . . . . . . . . . . . . . . . . . . . 282 531 2,338
421 86 2,706Deferred
Federal . . . . . . . . . . . . . . . . . . . . . . . . . . . . . . . . . . . . . . . . . . . . 1,415 (19,304) 3,090State . . . . . . . . . . . . . . . . . . . . . . . . . . . . . . . . . . . . . . . . . . . . . (528) 3,172 238Foreign . . . . . . . . . . . . . . . . . . . . . . . . . . . . . . . . . . . . . . . . . . . . 1,579 1,185 (2,190)
2,466 (14,947) 1,138Income tax (benefit) expense . . . . . . . . . . . . . . . . . . . . . . . . . . . . . . $ 2,887 $(14,861) $ 3,844
The reconciliations between the Company’s income tax expense and the amounts computed byapplying the U.S. federal income tax rate of 21.0% for the year ended December 31, 2018 and 35.0% forthe years ended December 31, 2017 and 2016 are as follows (in thousands):
Year Ended December 31,
2018 2017 2016
Computed expected tax expense . . . . . . . . . . . . . . . . . . . . . . . . . . . . $ 17,112 $ 20,020 $ 3,458Increase (decrease) in income taxes resulting from:
Foreign tax differential . . . . . . . . . . . . . . . . . . . . . . . . . . . . . . . . . (16,384) (19,032) (88)State income tax expense, net of federal income tax benefit . . . . . . . . 25 191 310
Subpart F income . . . . . . . . . . . . . . . . . . . . . . . . . . . . . . . . . . . . . . 2,202 683 711IRC Section 162(m) excess officer’s compensation . . . . . . . . . . . . . . . . 172 — —Non-deductible stock-based compensation . . . . . . . . . . . . . . . . . . . . . 133 218 155Excess tax benefit related to stock-based compensation . . . . . . . . . . . . (34) (1,858) —Increase in uncertain tax positions . . . . . . . . . . . . . . . . . . . . . . . . . . 25 61 36Adjustment for prior years . . . . . . . . . . . . . . . . . . . . . . . . . . . . . . . . (431) 1,894 —Change in Federal tax rate . . . . . . . . . . . . . . . . . . . . . . . . . . . . . . . . — (16,945) —Adjustment to contingent consideration . . . . . . . . . . . . . . . . . . . . . . — (429) (634)Change in valuation allowance . . . . . . . . . . . . . . . . . . . . . . . . . . . . . — — (15)Other . . . . . . . . . . . . . . . . . . . . . . . . . . . . . . . . . . . . . . . . . . . . . . . 67 336 (89)
$ 2,887 $(14,861) $ 3,844
As of December 31, 2018, the Company had $149.9 million and $19.9 million of net operating loss(NOL) carry forwards available to offset future federal and state taxable income, respectively. The NOLcarry forwards will begin to expire in 2035 and 2029 for federal and state income tax purposes, respectively.
94

CAI INTERNATIONAL, INC.
Notes to Consolidated Financial Statements
The tax effects of temporary differences that give rise to significant portions of the deferred tax assetsand deferred tax liabilities as of December 31, 2018 and 2017 are presented below (in thousands):
Year Ended December 31,
2018 2017
Deferred tax assets:Accounts receivable . . . . . . . . . . . . . . . . . . . . . . . . . . . . . . . . . . . . . . . . . . . . $ 144 $ 68Accrued expenses and other current liabilities . . . . . . . . . . . . . . . . . . . . . . . . . . 743 886Unearned revenue . . . . . . . . . . . . . . . . . . . . . . . . . . . . . . . . . . . . . . . . . . . . . 51 198Stock-based compensation . . . . . . . . . . . . . . . . . . . . . . . . . . . . . . . . . . . . . . . 1,060 744Other . . . . . . . . . . . . . . . . . . . . . . . . . . . . . . . . . . . . . . . . . . . . . . . . . . . . . 62 89Net operating loss carry forwards . . . . . . . . . . . . . . . . . . . . . . . . . . . . . . . . . . 37,464 34,758
Gross deferred tax assets . . . . . . . . . . . . . . . . . . . . . . . . . . . . . . . . . . . . . . . . . . 39,524 36,743Valuation allowance . . . . . . . . . . . . . . . . . . . . . . . . . . . . . . . . . . . . . . . . . . . — —
Net deferred tax assets . . . . . . . . . . . . . . . . . . . . . . . . . . . . . . . . . . . . . . . . . . . 39,524 36,743
Deferred tax liabilities:Depreciation and amortization . . . . . . . . . . . . . . . . . . . . . . . . . . . . . . . . . . . . 68,859 65,609Foreign deferred tax liabilities . . . . . . . . . . . . . . . . . . . . . . . . . . . . . . . . . . . . . 1,047 943Intangible assets . . . . . . . . . . . . . . . . . . . . . . . . . . . . . . . . . . . . . . . . . . . . . . 1,425 1,734Deferred subpart F income . . . . . . . . . . . . . . . . . . . . . . . . . . . . . . . . . . . . . . 6,512 4,310
Gross deferred tax liabilities . . . . . . . . . . . . . . . . . . . . . . . . . . . . . . . . . . . . . . . . 77,843 72,596Net deferred tax liability . . . . . . . . . . . . . . . . . . . . . . . . . . . . . . . . . . . . . . . . . . $38,319 $35,853
The realization of deferred tax assets is dependent upon the generation of future taxable incomeduring the periods in which those temporary differences become deductible. The Company’s managementconsiders the projected future taxable income for making this assessment. Based upon the level of historicaltaxable income and projections for future taxable income over the periods in which the deferred tax assetsare deductible, the Company’s management believes it is more likely than not the Company will realize thebenefits of the deductible differences noted above.
Deferred income taxes have not been provided on the undistributed earnings of foreign subsidiaries.As of December 31, 2018, the amount of such earnings totaled approximately $28.5 million. These earningshave been permanently reinvested and the Company does not plan to initiate any action that wouldprecipitate the payment of income taxes thereon. The amount of income taxes that would have resulted hadsuch earnings been repatriated is not practically determinable.
The following table summarizes the activity related to the Company’s unrecognized tax benefits(in thousands):
Balance at January 1, 2017 . . . . . . . . . . . . . . . . . . . . . . . . . . . . . . . . . . . . . . . . . . . . . . $266Increases related to current year tax positions . . . . . . . . . . . . . . . . . . . . . . . . . . . . . . . . . 11Balance at December 31, 2017 . . . . . . . . . . . . . . . . . . . . . . . . . . . . . . . . . . . . . . . . . . . 277Increases related to current year tax positions . . . . . . . . . . . . . . . . . . . . . . . . . . . . . . . . . 14Balance at December 31, 2018 . . . . . . . . . . . . . . . . . . . . . . . . . . . . . . . . . . . . . . . . . . . $291
95

CAI INTERNATIONAL, INC.
Notes to Consolidated Financial Statements
The unrecognized tax benefits of approximately $0.3 million at December 31, 2018, if recognized,would reduce the Company’s effective tax rate. The Company accrued potential interest and penalties of lessthan $0.1 million related to unrecognized tax benefits for each of the years ended December 31, 2018 and2017.
The U.S. Tax Cuts and Job Act of 2017 (TCJA) was signed into law on December 22, 2017. The mostsignificant effect of TCJA on the Company was the U.S. federal corporate tax rate reduction from 35% to21%, which required re-measurement of the Company’s U.S. deferred income tax assets and liabilities as ofDecember 31, 2017. As the Company was in an overall net deferred tax liability position, the corporate taxrate reduction resulted in a net tax benefit of $16.9 million in 2017.
Other significant provisions of the TCJA that became effective in 2018 that may impact the Company’sincome taxes are: the limitation on the deduction of interest expense in excess of 30 percent of adjustedtaxable income; limitation on the utilization of net operating losses generated after fiscal year 2017 to80 percent of taxable income; the taxation of global intangible low-taxed income of controlled foreigncorporations; and limitation on the deduction for executive compensation.
The Company’s tax returns, including the United States, California, New Jersey and South Carolina,are subject to examination by the tax authorities. The Company accrues for unrecognized tax benefits basedupon its best estimate of the additional taxes, interest and penalties expected to be paid. These estimates areupdated over time as more definitive information becomes available from taxing authorities, completion oftax audits, expiration of statute of limitations, or upon occurrence of other events.
The Company does not believe the total amount of unrecognized tax benefit as of December 31, 2018will increase or decrease significantly in the next twelve months. As of December 31, 2018, the statute oflimitations for tax examinations in the United States has not expired for the years ended December 31, 2015through 2017. California, New Jersey and South Carolina have not expired for tax returns filed for the yearsended December 31, 2014 through 2017. The Company was notified on May 1, 2017 that its 2015 U.S.federal income tax return was selected for examination. The examination was concluded on June 20, 2018with no impact to tax expense.
(11) Fair Value of Financial Instruments
The carrying amounts reported in the consolidated balance sheets for cash, accounts receivable andaccounts payable approximate fair value because of the immediate or short-term maturity of these financialinstruments. The Company’s asset-backed notes of $1,032.7 million and collateralized financing obligationsof $107.2 million as of December 31, 2018 were estimated to have a fair value of approximately$1,024.7 million and $108.9 million, respectively, based on the fair value of estimated future paymentscalculated using prevailing interest rates. The fair value of these financial instruments would be categorizedas Level 2 of the fair value hierarchy. Management believes that the balances of the Company’s revolvingcredit facilities of $597.2 million, variable-rate term loans totaling $223.4 million, fixed-rate term loans of$158.6 million, senior secured notes of $58.9 million and term loans held by VIE of $1.5 millionapproximate their fair values as of December 31, 2018. The fair value of these financial instruments wouldbe categorized as Level 2 of the fair value hierarchy.
96

CAI INTERNATIONAL, INC.
Notes to Consolidated Financial Statements
(12) Commitments and Contingencies
The Company utilizes certain office facilities and office equipment under non-cancelable operatinglease agreements which generally have original terms of up to five years. Future minimum lease paymentsrequired under non-cancellable operating leases having an original term of more than one year as ofDecember 31, 2018 are as follows (in thousands):
Office Facilitiesand Equipment
Year ending December 31:2019 . . . . . . . . . . . . . . . . . . . . . . . . . . . . . . . . . . . . . . . . . . . . . . . . . . . . . . . . . . . . . $ 2,3952020 . . . . . . . . . . . . . . . . . . . . . . . . . . . . . . . . . . . . . . . . . . . . . . . . . . . . . . . . . . . . . 8012021 . . . . . . . . . . . . . . . . . . . . . . . . . . . . . . . . . . . . . . . . . . . . . . . . . . . . . . . . . . . . . 7072022 . . . . . . . . . . . . . . . . . . . . . . . . . . . . . . . . . . . . . . . . . . . . . . . . . . . . . . . . . . . . . 5302023 . . . . . . . . . . . . . . . . . . . . . . . . . . . . . . . . . . . . . . . . . . . . . . . . . . . . . . . . . . . . . 3932024 and thereafter . . . . . . . . . . . . . . . . . . . . . . . . . . . . . . . . . . . . . . . . . . . . . . . . . . . 78
$ 4,904
Office facility expense was $2.7 million, $2.0 million, and $1.7 million for the years endedDecember 31, 2018, 2017 and 2016, respectively, which was included in administrative expenses in theconsolidated statements of income.
As of December 31, 2018 and 2017, the Company had one outstanding letter of credit of $0.1 million.The letter of credit guarantees the Company’s obligations under certain operating lease agreements.
In addition to the rental equipment payable of $74.1 million, the Company had commitments topurchase approximately $9.4 million of containers and $64.4 million railcars as of December 31, 2018; all inthe twelve months ended December 31, 2019.
In the ordinary course of business, the Company executes contracts involving indemnificationsstandard in the industry and indemnifications specific to a transaction such as an assignment andassumption agreement. These indemnifications might include claims related to tax matters, governmentalregulations, and contractual relationships. Performance under these indemnities would generally betriggered by a breach of terms of a contract or by a third-party claim. The Company regularly evaluates theprobability of having to incur costs associated with these indemnifications and as of December 31, 2018there were no claims outstanding under such indemnifications and the Company believes that no claims areprobable of occurring in the future.
(13) Related Party Transactions
In May 2018, the Company purchased, and subsequently cancelled, 1,225,214 shares of its commonstock, from an affiliate of Andrew S. Ogawa in a privately-negotiated transaction. Mr. Ogawa is a memberof the Company’s Board of Directors. The stock was purchased at a price of $22.81 per share, whichrepresented a 2% discount to the closing price on the date of purchase.
97

CAI INTERNATIONAL, INC.
Notes to Consolidated Financial Statements
(14) Stockholders’ Equity
Common Stock At-the-Market (ATM) Offering Program
In October 2017, the Company commenced an ATM offering program with respect to its commonstock, which allows the Company to issue and sell up to 2.0 million shares of its common stock. During theyear ended December 31, 2018, the Company issued 100,000 shares of common stock under the ATMoffering program for net proceeds of $2.8 million. The Company paid commissions to the sales agent of$0.1 million in connection with the sales of common stock under this ATM offering program during theyear ended December 31, 2018. The net proceeds were used for general corporate purposes. The Companyhas remaining capacity to issue up to approximately 1.0 million of additional shares of common stockunder this ATM offering program.
Series A Preferred Stock Underwritten Offering
In March 2018, the Company completed an underwritten public offering of 1,600,000 shares of its8.5% Series A Fixed-to-Floating Rate Cumulative Redeemable Perpetual Preferred Stock, par value $0.0001per share and liquidation preference $25.00 per share (Series A Preferred Stock), resulting in net proceeds tothe Company of approximately $38.3 million, after deducting the underwriting discount and other offeringexpenses. In April 2018, the Company sold an additional 170,900 shares of Series A Preferred Stock uponthe partial exercise by the underwriters of their option to purchase additional Series A Preferred Stock,resulting in net proceeds to the Company of approximately $4.1 million, after deducting the underwritingdiscount of $0.1 million. The net proceeds were used for repayment of debt and general corporate purposes.
Dividends on the Series A Preferred Stock accrue daily and are cumulative from and including the dateof original issuance and are payable quarterly in arrears on the 15th day of each April, July, October andJanuary. Dividends accrue at the Fixed Dividend Rate (as defined in the certificate of designations for theSeries A Preferred Stock (Series A Certificate of Designations)) at an annual rate of 8.5% of the $25.00liquidation preference per annum from, and including, the date of original issuance to, but not including,April 15, 2023. On and after April 15, 2023, dividends on the Series A Preferred Stock shall accrue at anannual rate equal to the sum of (a) Three-Month LIBOR (as defined in the Series A Certificate ofDesignations) as calculated on each applicable date and (b) 5.82% of the $25.00 liquidation preference pershare of Series A Preferred Stock. The Series A Preferred Stock ranks senior to the Company’s commonstock with respect to dividend rights and rights upon the Company’s liquidation, dissolution or winding up.
The Series A Preferred Stock becomes redeemable by the Company beginning April 15, 2023 for cashat a redemption price of $25.00 per share of Series A Preferred Stock, plus accrued but unpaid dividendsthereon to, but not including, the date fixed for redemption. In addition, upon the occurrence of a Changeof Control (as defined in the Series A Certificate of Designations), subject to certain restrictions, theCompany may, at its option, upon not less than thirty (30) days’ nor more than sixty (60) days’ writtennotice, redeem the Series A Preferred Stock, in whole or in part, within one hundred twenty (120) days afterthe first date on which such Change of Control occurred, for cash at a redemption price of $25.00 pershare, plus any accumulated and unpaid dividends thereon to, but not including, the date fixed forredemption. There is no mandatory redemption of the Series A Preferred Stock or redemption at the optionof the holders. Holders of the Series A Preferred Stock generally have no voting rights except for limitedvoting rights if the Company fails to pay dividends on the Series A Preferred Stock for six or morequarterly periods (whether or not consecutive) or the Company fails to maintain the listing of the Series APreferred Stock on a National Exchange (as defined in the Series A Certificate of Designations) for a periodof 180 consecutive days.
98
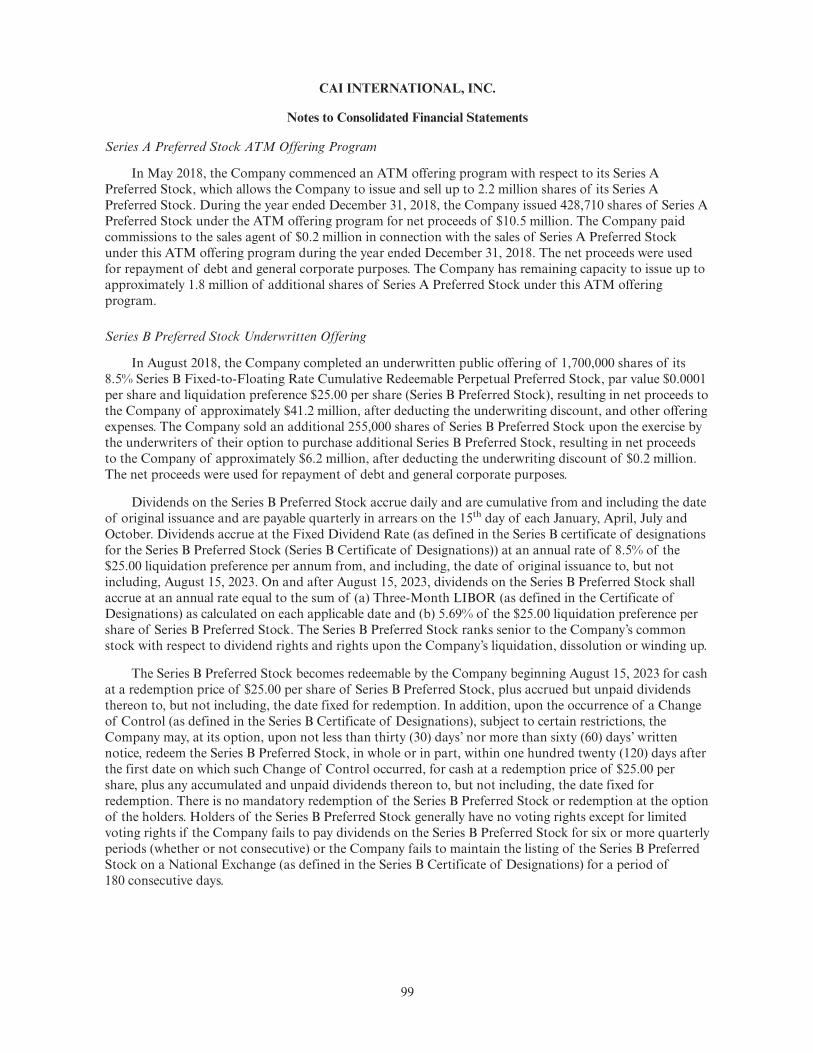
CAI INTERNATIONAL, INC.
Notes to Consolidated Financial Statements
Series A Preferred Stock ATM Offering Program
In May 2018, the Company commenced an ATM offering program with respect to its Series APreferred Stock, which allows the Company to issue and sell up to 2.2 million shares of its Series APreferred Stock. During the year ended December 31, 2018, the Company issued 428,710 shares of Series APreferred Stock under the ATM offering program for net proceeds of $10.5 million. The Company paidcommissions to the sales agent of $0.2 million in connection with the sales of Series A Preferred Stockunder this ATM offering program during the year ended December 31, 2018. The net proceeds were usedfor repayment of debt and general corporate purposes. The Company has remaining capacity to issue up toapproximately 1.8 million of additional shares of Series A Preferred Stock under this ATM offeringprogram.
Series B Preferred Stock Underwritten Offering
In August 2018, the Company completed an underwritten public offering of 1,700,000 shares of its8.5% Series B Fixed-to-Floating Rate Cumulative Redeemable Perpetual Preferred Stock, par value $0.0001per share and liquidation preference $25.00 per share (Series B Preferred Stock), resulting in net proceeds tothe Company of approximately $41.2 million, after deducting the underwriting discount, and other offeringexpenses. The Company sold an additional 255,000 shares of Series B Preferred Stock upon the exercise bythe underwriters of their option to purchase additional Series B Preferred Stock, resulting in net proceedsto the Company of approximately $6.2 million, after deducting the underwriting discount of $0.2 million.The net proceeds were used for repayment of debt and general corporate purposes.
Dividends on the Series B Preferred Stock accrue daily and are cumulative from and including the dateof original issuance and are payable quarterly in arrears on the 15th day of each January, April, July andOctober. Dividends accrue at the Fixed Dividend Rate (as defined in the Series B certificate of designationsfor the Series B Preferred Stock (Series B Certificate of Designations)) at an annual rate of 8.5% of the$25.00 liquidation preference per annum from, and including, the date of original issuance to, but notincluding, August 15, 2023. On and after August 15, 2023, dividends on the Series B Preferred Stock shallaccrue at an annual rate equal to the sum of (a) Three-Month LIBOR (as defined in the Certificate ofDesignations) as calculated on each applicable date and (b) 5.69% of the $25.00 liquidation preference pershare of Series B Preferred Stock. The Series B Preferred Stock ranks senior to the Company’s commonstock with respect to dividend rights and rights upon the Company’s liquidation, dissolution or winding up.
The Series B Preferred Stock becomes redeemable by the Company beginning August 15, 2023 for cashat a redemption price of $25.00 per share of Series B Preferred Stock, plus accrued but unpaid dividendsthereon to, but not including, the date fixed for redemption. In addition, upon the occurrence of a Changeof Control (as defined in the Series B Certificate of Designations), subject to certain restrictions, theCompany may, at its option, upon not less than thirty (30) days’ nor more than sixty (60) days’ writtennotice, redeem the Series B Preferred Stock, in whole or in part, within one hundred twenty (120) days afterthe first date on which such Change of Control occurred, for cash at a redemption price of $25.00 pershare, plus any accumulated and unpaid dividends thereon to, but not including, the date fixed forredemption. There is no mandatory redemption of the Series B Preferred Stock or redemption at the optionof the holders. Holders of the Series B Preferred Stock generally have no voting rights except for limitedvoting rights if the Company fails to pay dividends on the Series B Preferred Stock for six or more quarterlyperiods (whether or not consecutive) or the Company fails to maintain the listing of the Series B PreferredStock on a National Exchange (as defined in the Series B Certificate of Designations) for a period of180 consecutive days.
99

CAI INTERNATIONAL, INC.
Notes to Consolidated Financial Statements
(15) Segment and Geographic Information
The Company organizes itself by the nature of the services it provides, which includes equipmentleasing (consisting of container leasing and rail leasing) and logistics.
The container leasing segment is aggregated with equipment management and derives its revenue fromthe ownership and leasing of containers and fees earned for managing container portfolios on behalf ofthird party investors. The rail leasing segment derives its revenue from the ownership and leasing of railcars.The logistics segment derives its revenue from the provision of logistics services. There are no inter-segmentrevenues.
With the exception of administrative expenses, operating expenses are directly attributable to eachsegment. Administrative expenses that are not directly attributable to a segment are allocated to thesegments based upon relative asset values or revenue.
The following tables show condensed segment information for the years ended December 31, 2018,2017 and 2016, reconciled to the Company’s income before income taxes and non-controlling interest asshown in its consolidated statements of income for such periods (in thousands):
Year Ended December 31, 2018
ContainerLeasing Rail Leasing Logistics Total
Container lease revenue . . . . . . . . . . . . . . . . . . $ 284,924 $ — $ — $ 284,924Rail lease revenue . . . . . . . . . . . . . . . . . . . . . . — 35,703 — 35,703Logistics revenue . . . . . . . . . . . . . . . . . . . . . . . — — 111,471 111,471Total revenue . . . . . . . . . . . . . . . . . . . . . . . . . 284,924 35,703 111,471 432,098Depreciation of rental equipment . . . . . . . . . . . 107,109 14,189 — 121,298Storage, handling and other expenses . . . . . . . . 8,853 5,692 — 14,545Logistics transportation costs . . . . . . . . . . . . . . — — 97,170 97,170Gain on sale of used rental equipment . . . . . . . . (9,886) (1,839) — (11,725)Administrative expenses . . . . . . . . . . . . . . . . . . 27,560 5,297 17,448 50,305Total operating expenses . . . . . . . . . . . . . . . . . 133,636 23,339 114,618 271,593Operating income (loss) . . . . . . . . . . . . . . . . . . 151,288 12,364 (3,147) 160,505Net interest expense . . . . . . . . . . . . . . . . . . . . 62,572 15,773 — 78,345Other expense . . . . . . . . . . . . . . . . . . . . . . . . . 677 — — 677Total other expenses . . . . . . . . . . . . . . . . . . . . 63,249 15,773 — 79,022Income (loss) before income taxes . . . . . . . . . . . $ 88,039 $ (3,409) $ (3,147) $ 81,483
Goodwill . . . . . . . . . . . . . . . . . . . . . . . . . . . . $ — $ — $ 15,794 $ 15,794Total assets . . . . . . . . . . . . . . . . . . . . . . . . . . . $ 2,506,279 $ 460,387 $ 45,951 $ 3,012,617
Purchase of rental equipment(1) . . . . . . . . . . . . $ 739,944 $ 72,077 $ — $ 812,021
100

CAI INTERNATIONAL, INC.
Notes to Consolidated Financial Statements
Year Ended December 31, 2017ContainerLeasing Rail Leasing Logistics Total
Container lease revenue . . . . . . . . . . . . . . . . . . $ 235,365 $ — $ — $ 235,365Rail lease revenue . . . . . . . . . . . . . . . . . . . . . . — 32,476 — 32,476Logistics revenue . . . . . . . . . . . . . . . . . . . . . . . — — 80,552 80,552Total revenue . . . . . . . . . . . . . . . . . . . . . . . . . 235,365 32,476 80,552 348,393Depreciation of rental equipment . . . . . . . . . . . 99,753 11,199 — 110,952Storage, handling and other expenses . . . . . . . . 15,207 5,615 96 20,918Logistics transportation costs . . . . . . . . . . . . . . — — 68,155 68,155Gain on sale of used rental equipment . . . . . . . . (5,333) (14) — (5,347)Administrative expenses . . . . . . . . . . . . . . . . . . 22,925 4,756 15,018 42,699Total operating expenses . . . . . . . . . . . . . . . . . 132,552 21,556 83,269 237,377Operating income (loss) . . . . . . . . . . . . . . . . . . 102,813 10,920 (2,717) 111,016Net interest expense . . . . . . . . . . . . . . . . . . . . 41,815 11,237 — 53,052Other expense . . . . . . . . . . . . . . . . . . . . . . . . . 765 — — 765Total other expenses . . . . . . . . . . . . . . . . . . . . 42,580 11,237 — 53,817Income (loss) before income taxes . . . . . . . . . . . $ 60,233 $ (317) $ (2,717) $ 57,199Goodwill . . . . . . . . . . . . . . . . . . . . . . . . . . . . $ — $ — $ 15,794 $ 15,794Total assets . . . . . . . . . . . . . . . . . . . . . . . . . . . $1,938,723 $ 449,376 $ 40,029 $ 2,428,128Purchase of rental equipment(1) . . . . . . . . . . . . $ 445,168 $ 56,882 $ — $ 502,050
Year Ended December 31, 2016ContainerLeasing Rail Leasing Logistics Total
Container lease revenue . . . . . . . . . . . . . . . . . . $ 202,328 $ — $ — $ 202,328Rail lease revenue . . . . . . . . . . . . . . . . . . . . . . — 30,490 — 30,490Logistics revenue . . . . . . . . . . . . . . . . . . . . . . . — — 61,536 61,536Total revenue . . . . . . . . . . . . . . . . . . . . . . . . . 202,328 30,490 61,536 294,354Depreciation of rental equipment . . . . . . . . . . . 95,755 9,122 — 104,877Storage, handling and other expenses . . . . . . . . 32,465 3,386 11 35,862Logistics transportation costs . . . . . . . . . . . . . . — — 51,980 51,980Loss (gain) on sale of used rental equipment . . . 12,750 33 (112) 12,671Administrative expenses . . . . . . . . . . . . . . . . . . 20,453 3,759 11,466 35,678Total operating expenses . . . . . . . . . . . . . . . . . 161,423 16,300 63,345 241,068Operating income (loss) . . . . . . . . . . . . . . . . . . 40,905 14,190 (1,809) 53,286Net interest expense . . . . . . . . . . . . . . . . . . . . 35,784 6,970 — 42,754Other expense . . . . . . . . . . . . . . . . . . . . . . . . . 654 — — 654Total other expenses . . . . . . . . . . . . . . . . . . . . 36,438 6,970 — 43,408Income (loss) before income taxes and
non-controlling interest . . . . . . . . . . . . . . . . $ 4,467 $ 7,220 $ (1,809) $ 9,878Purchase of rental equipment(1) . . . . . . . . . . . . $ 118,374 $ 132,791 $ — $ 251,165
(1) Represents cash disbursements for purchasing of rental equipment as reflected in the consolidatedstatements of cash flows for the periods indicated.
101

CAI INTERNATIONAL, INC.
Notes to Consolidated Financial Statements
Geographic Data
The Company earns its revenue primarily from intermodal containers which are deployed by itscustomers in a wide variety of global trade routes. Virtually all of the Company’s containers are usedinternationally and typically no container is domiciled in one particular place for a prolonged period oftime. As such, substantially all of the Company’s long-lived assets are considered to be international, withno single country of use.
The Company’s railcars, with a net book value of $448.5 million as of December 31, 2018, are used totransport cargo within North America.
The following table represents the geographic allocation of revenue for the periods indicated based oncustomers’ primary domicile (in thousands):
Year Ended December 31,
2018 2017 2016
United States . . . . . . . . . . . . . . . . . . . . . . . . . . . . . . . . . . . $ 154,427 $ 120,558 $ 99,824Switzerland . . . . . . . . . . . . . . . . . . . . . . . . . . . . . . . . . . . . 50,805 32,430 19,636France . . . . . . . . . . . . . . . . . . . . . . . . . . . . . . . . . . . . . . . . 37,565 34,862 29,273Korea . . . . . . . . . . . . . . . . . . . . . . . . . . . . . . . . . . . . . . . . 31,877 20,755 14,904Singapore . . . . . . . . . . . . . . . . . . . . . . . . . . . . . . . . . . . . . . 26,854 19,856 16,172Other Asia . . . . . . . . . . . . . . . . . . . . . . . . . . . . . . . . . . . . . 67,695 64,097 63,190Other Europe . . . . . . . . . . . . . . . . . . . . . . . . . . . . . . . . . . . 54,677 45,176 40,170Other International . . . . . . . . . . . . . . . . . . . . . . . . . . . . . . . 8,198 10,659 11,185Total revenue . . . . . . . . . . . . . . . . . . . . . . . . . . . . . . . . . . . $ 432,098 $ 348,393 $ 294,354
(16) Concentration of Credit Risk
The Company’s single largest container lessee accounted for 11.8%, or $58.0 million, 9.7%, or$34.7 million, and 6.9% or $20.6 million, of total billings for the years ended December 31, 2018, 2017 and2016, respectively, and accounted for 6% of its accounts receivable as of December 31, 2018 and 2017. TheCompany’s second largest container lessee accounted for 8.4%, or $41.3 million, 10.5%, or $37.5 million,and 10.6%, or $31.7 million, of total billings for the years ended December 31, 2018, 2017 and 2016,respectively, and accounted for 15% and 9% of its accounts receivable as of December 31, 2018 and 2017,respectively.
(17) Earnings per Share
Basic earnings per share is computed by dividing income available to common stockholders by theweighted average number of common shares outstanding for the period. Diluted earnings per share reflectsthe potential dilution that would occur if securities or other contracts to issue common stock were exercisedor converted into common stock; however, potential common equivalent shares are excluded if their effect isanti-dilutive.
102
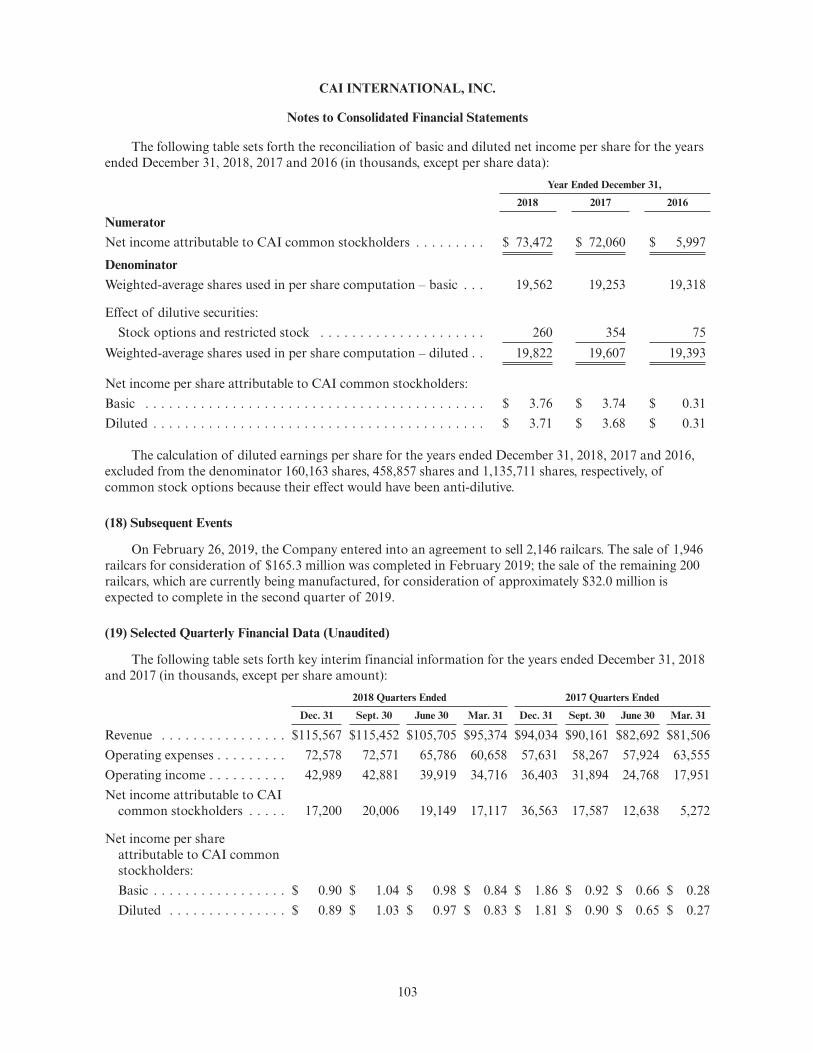
CAI INTERNATIONAL, INC.
Notes to Consolidated Financial Statements
The following table sets forth the reconciliation of basic and diluted net income per share for the yearsended December 31, 2018, 2017 and 2016 (in thousands, except per share data):
Year Ended December 31,
2018 2017 2016
NumeratorNet income attributable to CAI common stockholders . . . . . . . . . $ 73,472 $ 72,060 $ 5,997
DenominatorWeighted-average shares used in per share computation – basic . . . 19,562 19,253 19,318
Effect of dilutive securities:Stock options and restricted stock . . . . . . . . . . . . . . . . . . . . . 260 354 75
Weighted-average shares used in per share computation – diluted . . 19,822 19,607 19,393
Net income per share attributable to CAI common stockholders:Basic . . . . . . . . . . . . . . . . . . . . . . . . . . . . . . . . . . . . . . . . . . . $ 3.76 $ 3.74 $ 0.31Diluted . . . . . . . . . . . . . . . . . . . . . . . . . . . . . . . . . . . . . . . . . . $ 3.71 $ 3.68 $ 0.31
The calculation of diluted earnings per share for the years ended December 31, 2018, 2017 and 2016,excluded from the denominator 160,163 shares, 458,857 shares and 1,135,711 shares, respectively, ofcommon stock options because their effect would have been anti-dilutive.
(18) Subsequent Events
On February 26, 2019, the Company entered into an agreement to sell 2,146 railcars. The sale of 1,946railcars for consideration of $165.3 million was completed in February 2019; the sale of the remaining 200railcars, which are currently being manufactured, for consideration of approximately $32.0 million isexpected to complete in the second quarter of 2019.
(19) Selected Quarterly Financial Data (Unaudited)
The following table sets forth key interim financial information for the years ended December 31, 2018and 2017 (in thousands, except per share amount):
2018 Quarters Ended 2017 Quarters Ended
Dec. 31 Sept. 30 June 30 Mar. 31 Dec. 31 Sept. 30 June 30 Mar. 31
Revenue . . . . . . . . . . . . . . . . $115,567 $115,452 $105,705 $95,374 $94,034 $90,161 $82,692 $81,506Operating expenses . . . . . . . . . 72,578 72,571 65,786 60,658 57,631 58,267 57,924 63,555Operating income . . . . . . . . . . 42,989 42,881 39,919 34,716 36,403 31,894 24,768 17,951Net income attributable to CAI
common stockholders . . . . . 17,200 20,006 19,149 17,117 36,563 17,587 12,638 5,272
Net income per shareattributable to CAI commonstockholders:Basic . . . . . . . . . . . . . . . . . $ 0.90 $ 1.04 $ 0.98 $ 0.84 $ 1.86 $ 0.92 $ 0.66 $ 0.28Diluted . . . . . . . . . . . . . . . $ 0.89 $ 1.03 $ 0.97 $ 0.83 $ 1.81 $ 0.90 $ 0.65 $ 0.27
103

Schedule II
Valuation Accounts(In thousands)
Balance atBeginningof Period
Net Additionsto Expense
(Deductions)/Recoveries*
Balance atEnd ofPeriod
December 31, 2016Accounts receivable, allowance for doubtful accounts . . . $ 548 $ 3,151 $(2,359) $ 1,340December 31, 2017Accounts receivable, allowance for doubtful accounts . . . $ 1,340 $ 402 $ (302) $ 1,440December 31, 2018Accounts receivable, allowance for doubtful accounts . . . $ 1,440 $ 492 $ 110 $ 2,042
* Primarily consists of write-offs, net of recoveries and other adjustments
104

EXHIBIT INDEXExhibit No. Description
2.1 Stock Purchase Agreement, dated June 1, 2016, among CAI International, Inc., HybridLogistics, Inc., General Transportation Service, Inc., the shareholders named therein, andZions Bank, a division of ZB, National Association, as escrow agent (incorporated byreference to Exhibit 2.1 of our Quarterly Report on Form 10-Q for the quarter ended June 30,2016, filed on August 9, 2016).
3.1 Amended and Restated Certificate of Incorporation of CAI International, Inc. (incorporatedby reference to Exhibit 3.1 of our Registration Statement on Form S-1, as amended, FileNo. 333-140496, filed on April 24, 2007).
3.2 Certificate of Amendment to the Amended and Restated Certificate of Incorporation of CAIInternational, Inc., dated June 4, 2018 (incorporated by reference to Exhibit 3.1 to our CurrentReport on Form 8-K filed on June 5, 2018).
3.3 Certificate of Designations of Rights and Preferences of 8.50% Series A Fixed-to-FloatingRate Cumulative Redeemable Perpetual Preferred Stock, dated March 28, 2018 (incorporatedby reference to Exhibit 3.1 to our Current Report on Form 8-K filed on March 28, 2018).
3.4 Certificate of Designations of Rights and Preferences of 8.50% Series B Fixed-to-FloatingRate Cumulative Redeemable Perpetual Preferred Stock, dated August 10, 2018 (incorporatedby reference to Exhibit 3.1 to our Current Report on Form 8-K filed on August 10, 2018).
3.5 Amended and Restated Bylaws of CAI International, Inc. (incorporated by reference toExhibit 3.1 of our Current Report on Form 8-K, filed on March 10, 2009).
4.1 Form of Common Stock Certificate (incorporated by reference to Exhibit 4.1 of ourRegistration Statement on Form S-1, as amended, File No. 333-140496, filed on April 24,2007).
4.2 Indenture, dated October 18, 2012, between CAL Funding II Limited and Wells Fargo Bank,National Association (incorporated by reference to Exhibit 4.1 of our Current Report onForm 8-K, filed on October 23, 2012).
4.3 Series 2012-1 Supplement, dated October 18, 2012, to Indenture dated October 18, 2012,between CAL Funding II Limited and Wells Fargo Bank, National Association (incorporatedby reference to Exhibit 4.2 of our Current Report on Form 8-K, filed on October 23, 2012).
4.4 Series 2013-1 Supplement, dated March 28, 2013, to Indenture dated October 18, 2012,between CAL Funding II Limited and Wells Fargo Bank, National Association (incorporatedby reference to Exhibit 4.1 of our Current Report on Form 8-K, filed on April 3, 2013).
4.5 Indenture, dated July 6, 2017, among CAL Funding III Limited and Wells Fargo Bank,National Association (incorporated by reference to Exhibit 4.1 of our Current Report onForm 8-K, filed on July 11, 2017).
4.6 Series 2017-01 Supplement, dated July 6, 2017, among CAL Funding III Limited and WellsFargo Bank, National Association (incorporated by reference to Exhibit 4.2 of our CurrentReport on Form 8-K, filed on July 11, 2017).
4.7 Series 2018-1 Supplement, dated February 28, 2018, to Indenture dated July 6, 2017, betweenCAL Funding III Limited and Wells Fargo Bank, National Association (incorporated byreference to Exhibit 4.1 of our Current Report on Form 8-K filed on March 5, 2018).
4.8 Series 2018-2 Supplement, dated September 19, 2018, to Indenture dated July 6, 2017, betweenCAL Funding III Limited and Wells Fargo Bank, National Association (incorporated byreference to Exhibit 4.1 of our Current Report on Form 8-K filed on September 25, 2018).
105

Exhibit No. Description
10.1 Amended and Restated Registration Rights Agreement, dated February 16, 2007, among CAIInternational, Inc., Hiromitsu Ogawa, Ogawa Family Trust dated 7/06/98, Ogawa FamilyLimited Partnership and DBJ Value Up Fund (incorporated by reference to Exhibit 10.7 ofour Registration Statement on Form S-1, as amended, File No. 333-140496, filed on March 21,2007).
10.2* Form of Indemnification Agreement between CAI International, Inc. and each of its currentexecutive officers and directors (incorporated by reference to Exhibit 10.8 of our RegistrationStatement on Form S-1, as amended, File No. 333-140496, filed on April 24, 2007).
10.3* CAI International, Inc. 2007 Equity Incentive Plan, as amended (incorporated by reference toExhibit 10.1 of our Current Report on Form 8-K, filed on June 7, 2017).
10.4‡‡ P&R Management Agreement, dated March 14, 2006, among Container ApplicationsInternational, Inc., P&R Equipment & Finance Corporation and Interpool ContainersLimited (incorporated by reference to Exhibit 10.12 of our Registration Statement onForm S-1, as amended, File No. 333-140496, filed on March 27, 2007).
10.5 Third Amended and Restated Revolving Credit Agreement, dated March 15, 2013, by andamong CAI International, Inc., Container Applications Limited, the lending institutions listedon Schedule I thereto, Bank of America, N.A., as administrative agent, Merrill Lynch, Pierce,Fenner & Smith Incorporated, Union Bank, N.A. and Wells Fargo Bank, N.A., as syndicationagents, Merrill Lynch, Pierce, Fenner & Smith Incorporated, Union Bank, N.A. and WellsFargo Securities, LLC, as joint lead arrangers and book managers, and Bank of Montreal(Chicago Branch), JPMorgan Chase Bank, N.A. and Sovereign Bank, N.A., as co-agents(incorporated by reference to Exhibit 99.1 of our Current Report on Form 8-K, filed onMarch 21, 2013).
10.6 Amendment No. 1 to Third Amended and Restated Revolving Credit Agreement, datedOctober 1, 2013, by and among CAI International, Inc., Container Applications Limited,Bank of America, N.A. and other lending institutions from time to time party to theThird Amended and Restated Revolving Credit Agreement, Bank of America, N.A., asadministrative agent, Merrill Lynch, Pierce, Fenner & Smith Incorporated, Union Bank, N.A.and Wells Fargo Bank, N.A., as syndication agents, Merrill Lynch, Pierce, Fenner & SmithIncorporated, Union Bank, N.A. and Wells Fargo Securities, LLC, as joint lead arrangers andbook managers, and Bank of Montreal (Chicago Branch), JP Morgan Chase Bank, N.A. andSovereign Bank, N.A., as co-agents (incorporated by reference to Exhibit 10.6 of our AnnualReport on Form 10-K for the fiscal year ended December 31, 2014, filed on February 27,2015).
10.7 Amendment No. 2 to Third Amended and Restated Revolving Credit Agreement, datedAugust 15, 2014, by and among CAI International, Inc., Container Applications Limited,Bank of America, N.A. and other lending institutions from time to time party to theThird Amended and Restated Revolving Credit Agreement, Bank of America, N.A., asadministrative agent, Merrill Lynch, Pierce, Fenner & Smith Incorporated, Union Bank, N.A.and Wells Fargo Bank, N.A., as syndication agents, Merrill Lynch, Pierce, Fenner & SmithIncorporated, Union Bank, N.A. and Wells Fargo Securities, LLC, as joint lead arrangers andbook managers, and Bank of Montreal (Chicago Branch), JP Morgan Chase Bank, N.A. andSantander Bank, N.A., as co-agents (incorporated by reference to Exhibit 10.7 of our AnnualReport on Form 10-K for the fiscal year ended December 31, 2014, filed on February 27,2015).
106

Exhibit No. Description
10.8 Amendment No. 3 to Third Amended and Restated Revolving Credit Agreement, datedJanuary 30, 2015, by and among CAI International, Inc., Container Applications Limited,Bank of America, N.A. and other lending institutions from time to time party to theThird Amended and Restated Revolving Credit Agreement, Bank of America, N.A., asadministrative agent, Merrill Lynch, Pierce, Fenner & Smith Incorporated, MUFG UnionBank, N.A. and Wells Fargo Bank, N.A., as syndication agents, Merrill Lynch, Pierce, Fenner& Smith Incorporated, MUFG Union Bank, N.A. and Wells Fargo Securities, LLC, as jointlead arrangers and book managers, and Bank of Montreal (Chicago Branch), JP MorganChase Bank, N.A. and Santander Bank, N.A., as co-agents (incorporated by reference toExhibit 99.1 of our Current Report on Form 8-K, filed on February 5, 2015).
10.9 Commitment Increase, Amendment No. 5 and Joinder, dated June 16, 2017, by and amongCAI International, Inc., Container Applications Limited, the guarantors named therein, Bankof America, N.A., as a lender and administrative agent of the lenders, the other lendinginstitutions party thereto, Merrill Lynch, Pierce, Fenner & Smith Incorporated, MUFG UnionBank, N.A. and Wells Fargo Bank, N.A., as syndication agents, Merrill Lynch, Pierce, Fenner& Smith Incorporated, MUFG Union Bank, N.A. and Wells Fargo Securities, LLC, as jointlad arrangers and book managers, and Bank of Montreal (Chicago branch), JPMorgan ChaseBank, N.A. and Santander Bank N.A. as co-agents (incorporated by reference to Exhibit 10.1to our Current Report on Form 8-K, filed on June 22, 2017).
10.10 Amendment No. 6 to Third Amended and Restated Revolving Credit Agreement, datedJune 26, 2018, by and among CAI International, Inc., Container Applications Limited, theguarantors named therein, Bank of America, N.A., as a lender and administrative agent, theother lending institutions party thereto, Merrill Lynch, Pierce, Fenner & Smith Incorporated(“Merrill Lynch”), MUFG Union Bank, N.A. and Wells Fargo Bank, N.A., as syndicationagents, Merrill Lynch, as lead arranger and book runner, and ABN AMRO Capital USA,LLC, Compass Bank, Bank of Montreal, Royal Bank of Canada and PNC Bank, NationalAssociation, as documentation agents (incorporated by reference to Exhibit 10.1 of ourCurrent Report on Form 8-K filed on June 28, 2018).
10.11 Amended and Restated Term Loan Agreement, dated October 1, 2014, among ContainerApplications Limited, CAI International, Inc., the lending institutions from time to time listedon Schedule I thereto, ING Bank N.V. and ING Bank, branch of ING-DIBA AG(incorporated by reference to Exhibit 99.1 of our Current Report on Form 8-K, filed onOctober 7, 2014).
10.12 Amended and Restated Term Loan Agreement, dated June 30, 2016, among ContainerApplications Limited, CAI International, Inc., the Lenders listed on Schedule I thereto,SunTrust Bank and SunTrust Robinson Humphrey, Inc. (incorporated by reference toExhibit 99.1 of our Current Report on Form 8-K, filed on July 7, 2016).
10.12 Second Amended and Restated Revolving Credit Agreement, dated October 22, 2015, amongCAI Rail, Inc., CAI International, Inc., the lending institutions from time to time listed onSchedule 1 thereto, MUFG Union Bank, N.A. and Bank of America, N.A., as joint leadarrangers and joint bookrunners, Bank of America, N.A., as syndication agent, and INGBank, a branch of ING-Diba AG and The Huntington National Bank, as co-documentationagents (incorporated by reference to Exhibit 99.1 of our Current Report on Form 8-K, filed onOctober 27, 2015).
10.13 Third Amended and Restated Revolving Credit Agreement, dated October 22, 2018, amongCAI Rail Inc., CAI International, Inc., the lending institutions from time to time listed onSchedule 1 thereto, MUFG Union Bank, N.A., as administrative agent and lead arranger andbookrunner, Bank of America, N.A., as syndication agent, and ING Bank, a branch ofING-Diba AG and The Huntington National Bank, as co-documentation agents.
107

Exhibit No. Description
10.14 Contribution and Sale Agreement, dated October 18, 2012, between Container ApplicationsLimited and CAL Funding II Limited (incorporated by reference to Exhibit 99.2 of ourCurrent Report on Form 8-K, filed on October 23, 2012).
10.15 Performance Guaranty, dated October 18, 2012, made by CAI International, Inc. for thebenefit of Wells Fargo Bank, National Association (incorporated by reference to Exhibit 99.3of our Current Report on Form 8-K, filed on October 23, 2012).
10.16 Loan and Security Agreement, dated August 30, 2016, among CAI Rail, Inc., the lenders fromtime to time party thereto, and Bank of Utah, as administrative and collateral agent(incorporated by reference to Exhibit 99.1 of our Current Report on Form 8-K filed onSeptember 6, 2016).
10.17 Term Loan Agreement, dated October 18, 2018, among Container Applications Limited, CAIInternational, Inc., the lending institutions from time to time listed on Schedule 1 thereto, andWells Fargo Bank, N.A., as administrative agent.
10.18* Amended and Restated Employment Agreement, dated April 29, 2011, between CAIInternational, Inc. and Victor Garcia (incorporated by reference to Exhibit 10.1 of ourQuarterly Report on Form 10-Q for the fiscal quarter ended March 31, 2011, filed on May 6,2011).
10.19* Employment Agreement, dated August 20, 2013, between CAI International, Inc. and TimothyB. Page (incorporated by reference to Exhibit 99.1 of our Current Report on Form 8-K, filedon August 23, 2013).
10.20* Service Agreement, dated August 20, 2013, between Container Applications International(UK) Limited and Daniel Hallahan (incorporated by reference to Exhibit 99.2 of our CurrentReport on Form 8-K, filed on August 23, 2013).
10.21* Amendment No. 1 to Service Agreement, dated March 7, 2017, between ContainerApplications International (UK) Limited and Daniel Hallahan (incorporated by reference toExhibit 10.1 of our Quarterly Report on Form 10-Q for the quarter ended March 31, 2017,filed on May 4, 2017).
10.22* Continuing Services Agreement, dated April 29, 2011, between Masaaki Nishibori and CAIInternational, Inc. (incorporated by reference to Exhibit 10.3 of our Quarterly Report onForm 10-Q for the fiscal quarter ended March 31, 2011, filed on May 6, 2011).
10.23‡‡ Multi-Year Railcar Order, dated June 29, 2015, among CAI Rail, Inc., Trinity North AmericaFreight Car, Inc. and Trinity Tank Car, Inc. (incorporated by reference to Exhibit 10.1 of ourQuarterly Report on Form 10-Q for the fiscal quarter ended June 30, 2015, filed on August 5,2015).
10.24 Equity Distribution Sales Agreement, dated October 23, 2017, among CAI International, Inc.,Merrill Lynch, Pierce, Fenner & Smith Incorporated, and Wells Fargo Securities, Inc.(incorporated by reference to Exhibit 1.1 of our Current Report on Form 8-K, filed onOctober 23, 2017).
10.25 At the Market Issuance Sales Agreement, dated May 2, 2018, between CAI International, Inc.and B. Riley FBR, Inc. (incorporated by reference to Exhibit 1.1 of our Current Report onForm 8-K filed on May 2, 2018).
21.1 Subsidiaries of CAI International, Inc.23.1 Consent of KPMG LLP.31.1 Certification of Chief Executive Officer Pursuant to Exchange Act Rule 13a-14(a).31.2 Certification of Chief Financial Officer Pursuant to Exchange Act Rule 13a-14(a).32.1 Certification of Chief Executive Officer Furnished Pursuant to 18 U.S.C. Section 1350, as
Adopted Pursuant to Section 906 of the Sarbanes-Oxley Act of 2002.32.2 Certification of Chief Financial Officer Furnished Pursuant to 18 U.S.C. Section 1350, as
Adopted Pursuant to Section 906 of the Sarbanes-Oxley Act of 2002.
108

Exhibit No. Description
101 The following financial statements, formatted in XBRL: (i) Consolidated Balance Sheets as ofDecember 31, 2018 and 2017, (ii) Consolidated Statements of Income for the years endedDecember 31, 2018, 2017 and 2016; (iii) Consolidated Statements of Comprehensive Incomefor the years ended December 31, 2018, 2017 and 2016; (iv) Consolidated Statements ofStockholders’ Equity for the years ended December 31, 2018, 2017 and 2016; (v) ConsolidatedStatements of Cash Flows for the years ended December 31, 2018, 2017 and 2016; and(vi) Notes to Consolidated Financial Statements.
* Management contract or compensatory plan.
‡‡ Confidential treatment granted as to portions of this exhibit. Confidential information has beenomitted and filed separately with the Securities and Exchange Commission.
109

SIGNATURES
Pursuant to the requirements of Section 13 or 15(d) of the Securities Exchange Act of 1934, theregistrant has duly caused this report to be signed on its behalf by the undersigned, thereunto dulyauthorized.
Date: March 5, 2019 CAI INTERNATIONAL, INC.
By: /s/ VICTOR M. GARCIAVictor M. Garcia
President and Chief Executive Officer
Pursuant to the requirements of the Securities Exchange Act of 1934, this report has been signedbelow by the following persons on behalf of the registrant, in the capacities indicated, on the 5th day ofMarch, 2019.
Signature Title(s)
/s/ VICTOR M. GARCIAVictor M. Garcia
President and Chief Executive Officer, Director(Principal Executive Officer)
/s/ TIMOTHY B. PAGETimothy B. Page
Chief Financial Officer (Principal Financial andAccounting Officer)
/s/ DAVID REMINGTONDavid Remington
Chairman of the Board of Directors
/s/ MASAAKI (JOHN) NISHIBORIMasaaki (John) Nishibori
Director
/s/ KATHRYN G. JACKSONKathryn G. Jackson
Director
/s/ GARY M. SAWKAGary M. Sawka
Director
/s/ ANDREW OGAWAAndrew Ogawa
Director
/s/ JOHN WILLIFORDJohn Williford
Director
110

Exhibit 21.1
CAI INTERNATIONAL, INC.
LIST OF SUBSIDIARIESSubsidiary Jurisdiction
CAI Chile S.p.A ChileCAI Consent Sweden AB SwedenCAI Intermodal LLC Washington (U.S.A.)CAI International GmbH GermanyCAI Korea Yuhan Hoesa South KoreaCAI Logistics Inc. Delaware (U.S.A.)CAI Luxembourg S.a r.l. LuxembourgCAI Rail Inc. Delaware (U.S.A.)CAL Funding II Limited BermudaCAL Funding III Limited BermudaChallenger Overseas LLC New JerseyContainer Applications (Malaysia) SDN BHD MalaysiaContainer Applications (Singapore) Pte. Ltd. SingaporeContainer Applications International (Australia) Pty Ltd AustraliaContainer Applications International (U.K.) Limited United KingdomContainer Applications International Ltd. JapanContainer Applications Limited BarbadosGeneral Transportation Services, Inc. OregonHybrid Logistics, Inc. NevadaSky Container Trading, Ltd. United Kingdom

Exhibit 23.1
Consent of Independent Registered Public Accounting Firm
The Board of DirectorsCAI International, Inc.:
We consent to the incorporation by reference in the registration statements (Nos. 333-143000,333-159870, 333-176369, 333-187058, 333-206102, 333-212135 and 333-219615) on Form S-8 and(No. 333-217915) on Form S-3 of CAI International, Inc. of our reports dated March 5, 2019, with respectto the consolidated balance sheets of CAI International, Inc. as of December 31, 2018 and 2017, and therelated consolidated statements of income, comprehensive income, stockholders’ equity, and cash flows foreach of the years in the three-year period ended December 31, 2018, and the related notes and financialstatement schedule II (collectively, the “consolidated financial statements”), and the effectiveness of internalcontrol over financial reporting as of December 31, 2018, which reports appear in the December 31, 2018annual report on Form 10-K of CAI International, Inc.
/s/ KPMG LLP
San Francisco, CaliforniaMarch 5, 2019

Exhibit 31.1
CERTIFICATION OF CHIEF EXECUTIVE OFFICER PURSUANT TOSECTION 302 OF THE SARBANES-OXLEY ACT OF 2002
I, Victor M. Garcia, certify that:
1. I have reviewed this Annual Report on Form 10-K of CAI International, Inc.;
2. Based on my knowledge, this report does not contain any untrue statement of a material fact oromit to state a material fact necessary to make the statements made, in light of the circumstancesunder which such statements were made, not misleading with respect to the period covered by thisreport;
3. Based on my knowledge, the financial statements, and other financial information included in thisreport, fairly present in all material respects the financial condition, results of operations and cashflows of the registrant as of, and for, the periods presented in this report;
4. The registrant’s other certifying officer and I are responsible for establishing and maintainingdisclosure controls and procedures (as defined in Exchange Act Rules 13a-15(e) and 15d-15(e))and internal control over financial reporting (as defined in Exchange Act Rules 13a-15(f) and15d-15(f)) for the registrant and have:
a. Designed such disclosure controls and procedures, or caused such disclosure controls andprocedures to be designed under our supervision, to ensure that material information relatingto the registrant, including its consolidated subsidiaries, is made known to us by others withinthose entities, particularly during the period in which this report is being prepared;
b. Designed such internal control over financial reporting, or caused such internal control overfinancial reporting to be designed under our supervision, to provide reasonable assuranceregarding the reliability of financial reporting and the preparation of financial statements forexternal purposes in accordance with generally accepted accounting principles;
c. Evaluated the effectiveness of the registrant’s disclosure controls and procedures andpresented in this report our conclusions about the effectiveness of the disclosure controls andprocedures, as of the end of the period covered by this report based on such evaluation; and
d. Disclosed in this report any change in the registrant’s internal control over financial reportingthat occurred during the registrant’s most recent fiscal quarter (the registrant’s fourth fiscalquarter in the case of an annual report) that has materially affected, or is reasonably likely tomaterially affect, the registrant’s internal control over financial reporting; and
5. The registrant’s other certifying officer and I have disclosed, based on our most recent evaluationof internal control over financial reporting, to the registrant’s auditors and the audit committee ofthe registrant’s board of directors (or persons performing the equivalent functions):
a. All significant deficiencies and material weaknesses in the design or operation of internalcontrol over financial reporting which are reasonably likely to adversely affect the registrant’sability to record, process, summarize and report financial information; and
b. Any fraud, whether or not material, that involves management or other employees who havea significant role in the registrant’s internal control over financial reporting.
Date: March 5, 2019By: /s/ VICTOR M. GARCIA
Victor M. GarciaPresident and Chief Executive Officer
Exhibit 31.2
CERTIFICATION OF CHIEF FINANCIAL OFFICER PURSUANT TOSECTION 302 OF THE SARBANES-OXLEY ACT OF 2002
I, Timothy B. Page, certify that:
1. I have reviewed this Annual Report on Form 10-K of CAI International, Inc.;
2. Based on my knowledge, this report does not contain any untrue statement of a material fact oromit to state a material fact necessary to make the statements made, in light of the circumstancesunder which such statements were made, not misleading with respect to the period covered by thisreport;
3. Based on my knowledge, the financial statements, and other financial information included in thisreport, fairly present in all material respects the financial condition, results of operations and cashflows of the registrant as of, and for, the periods presented in this report;
4. The registrant’s other certifying officer and I are responsible for establishing and maintainingdisclosure controls and procedures (as defined in Exchange Act Rules 13a-15(e) and 15d-15(e))and internal control over financial reporting (as defined in Exchange Act Rules 13a-15(f) and15d-15(f)) for the registrant and have:
a. Designed such disclosure controls and procedures, or caused such disclosure controls andprocedures to be designed under our supervision, to ensure that material information relatingto the registrant, including its consolidated subsidiaries, is made known to us by others withinthose entities, particularly during the period in which this report is being prepared;
b. Designed such internal control over financial reporting, or caused such internal control overfinancial reporting to be designed under our supervision, to provide reasonable assuranceregarding the reliability of financial reporting and the preparation of financial statements forexternal purposes in accordance with generally accepted accounting principles;
c. Evaluated the effectiveness of the registrant’s disclosure controls and procedures andpresented in this report our conclusions about the effectiveness of the disclosure controls andprocedures, as of the end of the period covered by this report based on such evaluation; and
d. Disclosed in this report any change in the registrant’s internal control over financial reportingthat occurred during the registrant’s most recent fiscal quarter (the registrant’s fourth fiscalquarter in the case of an annual report) that has materially affected, or is reasonably likely tomaterially affect, the registrant’s internal control over financial reporting; and
5. The registrant’s other certifying officer and I have disclosed, based on our most recent evaluationof internal control over financial reporting, to the registrant’s auditors and the audit committee ofthe registrant’s board of directors (or persons performing the equivalent functions):
a. All significant deficiencies and material weaknesses in the design or operation of internalcontrol over financial reporting which are reasonably likely to adversely affect the registrant’sability to record, process, summarize and report financial information; and
b. Any fraud, whether or not material, that involves management or other employees who havea significant role in the registrant’s internal control over financial reporting.
Date: March 5, 2019By: /s/ TIMOTHY B. PAGE
Timothy B. PageChief Financial Officer

Exhibit 32.1
CERTIFICATION OF CHIEF EXECUTIVE OFFICERPURSUANT TO 18 U.S.C. SECTION 1350,
AS ADOPTED PURSUANT TOSECTION 906 OF THE SARBANES-OXLEY ACT OF 2002
In connection with the Annual Report of CAI International, Inc. (the “Company”) on Form 10-K forthe year ended December 31, 2018 as filed with the Securities and Exchange Commission on the date hereof(the “Report”), I, Victor M. Garcia, certify, pursuant to 18 U.S.C. Section 1350, as adopted pursuant toSection 906 of the Sarbanes-Oxley Act of 2002, that to my knowledge:
(1) The Report fully complies with the requirements of Section 13(a) or 15(d) of the SecuritiesExchange Act of 1934; and
(2) The information contained in the Report presents, in all material respects, the financial conditionand results of operations of the Company.
Date: March 5, 2019By: /s/ VICTOR M. GARCIA
Victor M. GarciaPresident and Chief Executive Officer

Exhibit 32.2
CERTIFICATION OF CHIEF FINANCIAL OFFICERPURSUANT TO 18 U.S.C. SECTION 1350,
AS ADOPTED PURSUANT TOSECTION 906 OF THE AS SARBANES-OXLEY ACT OF 2002
In connection with the Annual Report of CAI International, Inc. (the “Company”) on Form 10-K forthe year ended December 31, 2018 as filed with the Securities and Exchange Commission on the date hereof(the “Report”), I, Timothy B. Page, certify, pursuant to 18 U.S.C. Section 1350, as adopted pursuant toSection 906 of the Sarbanes-Oxley Act of 2002, that to my knowledge:
(1) The Report fully complies with the requirements of Section 13(a) or 15(d) of the SecuritiesExchange Act of 1934; and
(2) The information contained in the Report presents, in all material respects, the financial conditionand results of operations of the Company.
Date: March 5, 2019By: /s/ TIMOTHY B. PAGE
Timothy B. PageChief Financial Officer

[This Page Intentionally Left Blank]

Directors (pictured left to right) Masaaki (John) Nishibori Director
Andrew Ogawa Director
David G. Remington Chairman of the Board
Victor M. Garcia President, Chief Executive Officer, and Director
Kathryn G. Jackson Compensation Committee Chair
Gary M. Sawka Audit Committee Chair
John Williford Nominating and Corporate Governance Committee Chair
Corporate Headquarters Steuart Tower, 1 Market Plaza, Suite 900 San Francisco, CA 94105 Tel: 415 788 0100
Independent Accountants KPMG LLP
Stockholder Inquiries Investor Relations Steuart Tower, 1 Market Plaza, Suite 900 San Francisco, CA 94105 Tel: 415 788 0100
Stock Listing Our common shares are listed on the NYSE under the symbol CAI.
Legal Counsel Perkins Coie LLP 3150 Porter Drive Palo Alto, CA 94304
Stock Transfer Agent Computershare Investor Services 250 Royall Street Canton, MA 02021 Tel: 781 575 2879
Investor Center www.computershare.com/investor
Annual Report (Form 10-K) A copy of the company’s 2018 Annual Report on Form 10-K filed with the Securities and Exchange Commission is available to stockholders, without charge, through the company’s website at www.capps.com or upon written request to the company’s headquarters.
Annual Meeting The 2019 annual meeting of stockholders will be held on Friday, June 7, 2019, at 10 a.m. (PDT) at the offices of Perkins Coie, at 3150 Porter Drive, Palo Alto, CA 94304.
Website The company’s website provides access to a wide range of information about the company and our products. Please visit us at www.capps.com.
Investor Relations on the Web For more information related to investing in the company, please see the Investors tab on our website at www.capps.com.
Creative A
gency: Michael Patrick Partners San Francisco, C
A
Corporate Information
This document is printed on paper certified to the environmental and social standards of the Forest Stewardship CouncilTM (FSC®).

CAI International, Inc. Steuart Tower, 1 Market Plaza, Suite 900 San Francisco, CA 94105 415 788 0100
www.capps.com