National Performance Management Program Transportation ...
22
National Performance Management Program Transportation System Condition Assessment
Transcript of National Performance Management Program Transportation ...

National Performance Management ProgramTransportation System Condition Assessment

Pavement and Bridge Targets Consideration and action regarding a
recommendation to the MPO Policy Board regarding MPO support of TxDOT pavement and bridge targets for Calendar Year 2024 for National Highway System (NHS) facilities in accordance with requirements from the Fixing America’s Surface Transportation Act (FAST).
14

15

Tracking Condition is a Federal Requirement for States & MPOs For State DOTs, failure to achieve target would require
shift of federal dollars to improve conditions Requirement for National Highway System only
Interstates Other Freeways Principal Arterials 11% of regional lane-miles, 60% of regional travel
MPO tracks condition for all arterial & collector roads within MTP
Pavement & Bridge Condition Performance
16

17
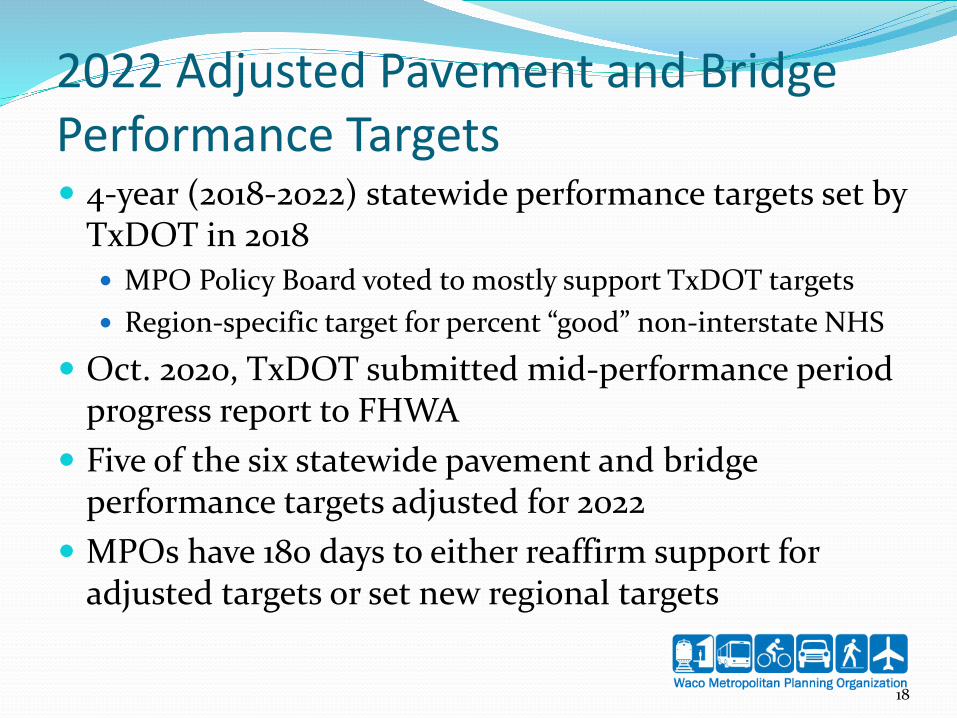
4-year (2018-2022) statewide performance targets set by TxDOT in 2018 MPO Policy Board voted to mostly support TxDOT targets Region-specific target for percent “good” non-interstate NHS
Oct. 2020, TxDOT submitted mid-performance period progress report to FHWA
Five of the six statewide pavement and bridge performance targets adjusted for 2022
MPOs have 180 days to either reaffirm support for adjusted targets or set new regional targets
2022 Adjusted Pavement and Bridge Performance Targets
18

For pavement condition, Interstate performance is more stringent than other NHS facilities Interstate System IRI, Cracking, & Rutting or Faulting Good pavements must be good for all 3 Poor pavements = poor for 2 of the 3
All Other NHS facilities Int’l Roughness Index (IRI) only
Pavement Performance Targets
19

Definitions Monitored for 1/10 mile segments for each direction All Pavements
International Roughness Index (IRI)
Asphalt Pavements Rutting Condition Cracking Percentage
Concrete Pavements Cracking Percentage Joint Faulting
Pavement Performance Targets
20

International Roughness Index (IRI) Standard universal score 94 or less = good Greater than 170 = poor
NOTE: Rough roads do not necessarily equal a poor pavement condition
Pavement Performance Targets
21

Rutting Condition in Asphalt Pavements TxDOT Definition Applies only to Interstate Depth less than 0.2 inches = good Depth greater than 0.4 inches = poor
NOTE: Rutting is not generally an issue for concrete pavements
Pavement Performance Targets
22

Cracking Condition in Asphalt Pavements TxDOT Definition Applies only to Interstate 4% or less = good Greater than 20% = poor
Pavement Performance Targets
23

Cracking Condition in Jointed Concrete Pavements TxDOT Definition Applies only to Interstate 4% or less = good Greater than 18% = poor
Pavement Performance Targets
24

Cracking Condition in Continuously Reinforced Concrete Pavements TxDOT Definition Applies only to Interstate 4% or less = good Greater than 10% = poor
Pavement Performance Targets
25

Facility Type 2020 Good Lane-Miles
Previous 2022 Target
Adjusted 2022 Target
Interstate 76.01% 66.6% 66.5%Non-Interstate 55.55% 55.2% 54.1%
Waco Regional NHS Pavement Condition & TxDOT Statewide Targets
Facility Type 2020 Poor Lane-Miles
Previous 2022 Target
Adjusted 2022 Target
Interstate 0.0% 0.3% 0.2%Non-Interstate 6.99% 14.3% 14.2%
Note: In 2018, the MPO adopted a separate regional target for Non-Interstate pavements in good condition at 48.0%. Since the percentage of these facilities being rated as good increased significantly, MPO staff is recommending support of the adjusted TxDOT targets.
26

MPO Staff Recommendations Support adjusted 2022 state targets for both
Interstate and Non-Interstate Conditions Regional conditions better than statewide average IH-35 reconstruction should further improve
Interstate pavement conditions
Pavement Performance Targets
27

Unlike pavement condition, no difference between Interstate vs. Non-Interstate measures % of NHS bridge deck area in good condition % of NHS bridge deck area in poor condition
Required Elements (Score 1 to 10) Superstructure Condition Substructure Condition Bridge Deck Condition
Score of 7 or greater = ‘good’ Score of 4 or less = ‘poor’ Good bridges have all elements with score > 7 Poor bridges have at least one element with score < 4
Bridge Performance Targets
28

Facility Type Good DeckArea
Previous 2022 Target
Adjusted 2022 Target
Total NHS 49.4% 50.4% 50.4% (no change)
Interstate 55.1% n/a n/aNon-Interstate 45.9% n/a n/a
Waco Regional NHS Bridge Conditions & TxDOT Statewide Targets
Facility Type Poor DeckArea
Previous 2022 Target
Adjusted 2022 Target
Total NHS 0.0% 1.3% 1.5%Interstate 0.0% n/a n/a
Non-Interstate 0.0% n/a n/a
29

Scheduled Work IH-35 reconstruction (ongoing)
All bridges either have been or will be reconstructed or have significant rehabilitation
Increases ‘good’ deck area for IH-35 from 57.7% to 93.3% Overall ‘good’ deck area increases from 46.57% to 55.09%
Several other bridges will be removed from this calculation because they are coming off the NHS system
No other bridge work in the pipeline to impact 2022 targets
Bridge Performance Targets
30

MPO Staff Recommendations Support adjusted 2022 state targets Regional conditions better than statewide average IH-35 reconstruction will replace, reconstruct or
eliminate several bridges previously rated as ‘fair’
Bridge Performance Targets
31

2022 Adjusted Pavement and Bridge Performance Targets Summary
Pavement Condition Percent Good Percent Poor
Roadway Type 4-Year Target
Adjusted 4-Year Target
4-Year Target
Adjusted 4-Year Target
Interstate NHS 66.4% 66.5% 0.3% 0.2%
Non-Interstate NHS 48.0% 54.1% 14.3% 14.2%
Bridge Condition Percent Good Percent Poor
Roadway Type 4-Year Target
Adjusted 4-Year Target
4-Year Target
Adjusted 4-Year Target
Interstate NHS 50.4% 50.4% (no change) 0.8% 1.5%
32

10 Day Public Comment Period Comments accepted through January 14, 2021
Public informational meeting January 11, 2021 at 5:30 PM
Tech Committee Recommendation
January 14, 2021
Public Hearing and Policy Board Support January 21, 2021
33
Pavement and Bridge Adjusted TargetsPublic Input Schedule

Pavement and Bridge TargetsTech Committee RecommendationRecommendation Options Support TxDOT Targets for all pavement and
bridge metrics
Adopt Region Specific Targets for some or all pavement or bridge metrics Would require reconsideration at February meeting
34