Powder flow down a vertical pipe: the e ect of air flow
29
J. Fluid Mech. (2002), vol. 459, pp. 317–345. c 2002 Cambridge University Press DOI: 10.1017/S0022112002008042 Printed in the United Kingdom 317 Powder flow down a vertical pipe: the effect of air flow By Y. BERTHO 1 , F. GIORGIUTTI-DAUPHIN ´ E 1 , T. RAAFAT 1,2 , E. J. HINCH 3 , H. J. HERRMANN 2 AND J. P. HULIN 1 1 Laboratoire FAST, UMR 7608, Bat. 502, Campus Universitaire, 91405 Orsay Cedex, France 2 Laboratoire PMMH, ESPCI, UMR 7636, 10 rue Vauquelin, 75231 Paris, Cedex 05, France 3 Department of Applied Mathematics and Theoretical Physics, University of Cambridge, Silver Street, Cambridge CB3 9EW, UK (Received 2 March 2001 and in revised form 16 November 2001) The dynamics of dry granular flows down a vertical glass pipe of small diameter have been studied experimentally. Simultaneous measurements of pressure profiles, air and grain flow rates and volume fractions of particles have been realized together with spatio-temporal diagrams of the grain distribution down the tube. At large grain flow rates, one observes a stationary flow characterized by high particle velocities, low particle fractions and a downflow of air resulting in an underpressure in the upper part of the pipe. A simple model assuming a free fall of the particles slowed down by air friction and taking into account finite particle fraction effects through Richardson– Zaki’s law has been developed: it reproduces pressure and particle fraction variations with distance and estimates friction forces with the wall. At lower flow rates, sequences of high-density plugs separated by low-density bubbles moving down at a constant velocity are observed. The pressure is larger than outside the tube and its gradient reflects closely the weight of the grains. Writing mass and momentum conservation equations for the air and for the grains allows one to estimate the wall friction, which is less than 10% of the weight for grains with a clean smooth surface but up to 30% for grains with a rougher surface. At lower flow rates, oscillating-wave regimes resulting in large pressure fluctuations are observed and their frequency is predicted. 1. Introduction Dry granular media are at present a very active domain of research both because of their fundamental interest in relation to the modelling of disordered and dispersed media and because of their many areas of practical application. Granular media are encountered in many areas such as the food industry, and civil and chemical engineering (Jaeger & Nagel 1992; Duran 1997; Behringer & Jenkins 1997). A particularly important problem is the flow of these materials in pipes and channels (Jackson 2000). A first type of study deals with systems in which the interaction between the flowing grains and air is negligible (Savage 1979). These flows frequently undergo instabilities (Wang, Jackson & Sundaresan 1997) and density waves may then appear. Such waves were for instance observed experimentally between parallel walls by Reydellet, Rioual & Clement (2000) and can be reproduced by numerical simulations using molecular dynamics (P¨ oschel 1994; Lee 1994) or lattice-gas methods (Peng & Herrmann 1994).
Transcript of Powder flow down a vertical pipe: the e ect of air flow

J. Fluid Mech. (2002), vol. 459, pp. 317–345. c© 2002 Cambridge University Press
DOI: 10.1017/S0022112002008042 Printed in the United Kingdom
317
Powder flow down a vertical pipe:the effect of air flow
By Y. B E R T H O1, F. G I O R G I U T T I-D A U P H I NE1,T. R A A F A T1,2, E. J. H I N C H3, H. J. H E R R M A N N2
AND J. P. H U L I N1
1Laboratoire FAST, UMR 7608, Bat. 502, Campus Universitaire, 91405 Orsay Cedex, France2Laboratoire PMMH, ESPCI, UMR 7636, 10 rue Vauquelin, 75231 Paris, Cedex 05, France
3Department of Applied Mathematics and Theoretical Physics, University of Cambridge,Silver Street, Cambridge CB3 9EW, UK
(Received 2 March 2001 and in revised form 16 November 2001)
The dynamics of dry granular flows down a vertical glass pipe of small diameter havebeen studied experimentally. Simultaneous measurements of pressure profiles, air andgrain flow rates and volume fractions of particles have been realized together withspatio-temporal diagrams of the grain distribution down the tube. At large grain flowrates, one observes a stationary flow characterized by high particle velocities, lowparticle fractions and a downflow of air resulting in an underpressure in the upperpart of the pipe. A simple model assuming a free fall of the particles slowed down byair friction and taking into account finite particle fraction effects through Richardson–Zaki’s law has been developed: it reproduces pressure and particle fraction variationswith distance and estimates friction forces with the wall. At lower flow rates, sequencesof high-density plugs separated by low-density bubbles moving down at a constantvelocity are observed. The pressure is larger than outside the tube and its gradientreflects closely the weight of the grains. Writing mass and momentum conservationequations for the air and for the grains allows one to estimate the wall friction, whichis less than 10% of the weight for grains with a clean smooth surface but up to30% for grains with a rougher surface. At lower flow rates, oscillating-wave regimesresulting in large pressure fluctuations are observed and their frequency is predicted.
1. IntroductionDry granular media are at present a very active domain of research both because
of their fundamental interest in relation to the modelling of disordered and dispersedmedia and because of their many areas of practical application. Granular mediaare encountered in many areas such as the food industry, and civil and chemicalengineering (Jaeger & Nagel 1992; Duran 1997; Behringer & Jenkins 1997). Aparticularly important problem is the flow of these materials in pipes and channels(Jackson 2000).
A first type of study deals with systems in which the interaction between the flowinggrains and air is negligible (Savage 1979). These flows frequently undergo instabilities(Wang, Jackson & Sundaresan 1997) and density waves may then appear. Such waveswere for instance observed experimentally between parallel walls by Reydellet, Rioual& Clement (2000) and can be reproduced by numerical simulations using moleculardynamics (Poschel 1994; Lee 1994) or lattice-gas methods (Peng & Herrmann 1994).

318 Y. Bertho and others
Analysis in terms of kinetic wave theories can be applied to these phenomena (Leibig1994; Lee & Leibig 1994) which bear strong similarities with density waves in trafficflows (Lighthill & Whitham 1955; Musha & Higuichi 1976).
In most cases of interest, however, the interaction of the air with the flowing grainsplays a key part. This is particularly the case in practical applications to pneumatictransport, catalytic cracking, fluid beds and emptying storage silos. Very diverse flowregimes such as moving packed particle beds, fluidized suspensions and combinationsof these regimes are observed in these systems (Leung & Jones 1978). These regimesmay coexist in a flow system, particularly when gas is injected locally into the flowpipe (Mountziaris & Jackson 1990). Furthermore, these flows may display unwantedintermittency, oscillations and/or blockages: a periodic intermittent flow of this typeis observed in ‘ticking hourglass’ experiments as grains flow through a constrictionconnecting two glass reservoirs (Le Pennec et al. 1995, 1996, 1998). This effect againresults from interactions between the interstitial air and the grains.
Very detailed and elaborate theoretical models have been developed to analysethese flows and take into account the interaction between air and the grains (Leung& Jones 1978; Ginestra, Rangachari & Jackson 1980; Chen, Rangachari & Jackson1984; Sinclair & Jackson 1989; Nott & Jackson 1992; Jackson 2000). These modelspredict flow configurations and characteristic parameters in the different parts of theflow from a small number of input variables (the grain flow rate for instance). Whenexperiments are available, the predictions of these theoretical models are generallychecked against pressure profile measurements Chen et al. (1984); other parameters areestimated theoretically. More recent experimental work has included a larger numberof measurements, allowing one in particular to analyse the particle distribution inthe flow channels (Srivastava et al. 1998). Although the above approach is very wellsuited to modelling complete large systems, it requires the introduction of a largenumber of relations between the various variables, based on published literature andon experimental or empirical correlations. This may result in significant uncertaintiesin the values of key variables.
In the present work we used a different approach and performed a set of experimentson a very simple flow system (a plain vertical glass tube with a feeding hopper atthe top and a variable constriction at the bottom) equipped with a large number ofsensors. They allowed us to determine simultaneously the grain and air flow rates, thelocal solid volume fraction at two positions along the tube and the pressure profile.In addition, a linear camera gives spatio-temporal diagrams of the grain distributionalong the tube allowing a detailed analysis of the dynamical properties of the flow.In this way, many variables are directly measured instead of needing to be estimatedthrough theoretical or empirical relations. Relatively simple theoretical developmentsare then needed since most other parameters of interest can generally be determinedreliably through simple conservation equations: friction forces on the pipe wall canin particular be estimated simply.
Using a simple set-up also allows us to explore systematically a broad range ofcontrol parameter values: as shown in previous papers (Raafat, Hulin & Herrmann1996; Aider et al. 1999), it is possible to observe a large variety of flow regimesby varying the grain flow rate. We observe in particular, at intermediate grain flowrates, density waves in which compact plugs are separated by bubbles with a lowvolume fraction of particles (the volume fraction of particles will in the followingbe called the ‘particle fraction’). The plugs move generally at constant velocity butmay display oscillations in a few cases. At higher flow rates, a low-particle-fractionhigh-velocity free-fall regime is observed. At lower flow rates, the grain flow may be

Powder flow down a vertical pipe 319
stationary or intermittent and is characterized by a low velocity and a high particlefraction (≈ 60%): this latter regime is similar to the flows of particle beds discussedby Ginestra et al. (1980). Its properties, and particularly the intermittency associatedwith it, will be reported in a subsequent work and the present paper deals with thetwo other regimes in the case of vertical tubes. As stated in the introduction, otherflow regimes can appear in such systems such as the coexistence of a free fall anda compact regime (Mountziaris & Jackson 1990) but they were not observed in thepresent work.
After describing the experimental procedure, the high-velocity free-fall regime willbe first studied experimentally and analysed theoretically: it will be shown that boththe pressure and the particle fraction profiles can be reproduced quantitatively by asimple set of equations and that the friction force on the walls can be determinedreliably. A similar approach will be used to study the pressure distribution and thewall friction in the constant-velocity wave regime, with particular attention given tothe dependence of wall friction on the roughness of the grain surface. The sameapproach is, finally, extended to an oscillating-wave regime in which analogies withsound propagation in two-phase flows appear.
2. Experimental procedure2.1. Experimental set-up
In the present work, we study the flow of glass beads of diameter 2a = 175± 25 µmand of density ρg = (2.5±0.02)103 kg m−3 (the glass density is measured by comparingthe weight of a picnometer of precisely known volume filled first with water and thenwith a known mass of beads saturated with water). The experimental flow channel(figure 1a) is a vertical glass pipe of length L = 1.25 m and of internal diameter2R = 3 ± 0.05 mm welded to the bottom of a spherical hopper. The bottom endof the pipe is fitted with a variable constriction allowing one to adjust the outflow.Computer-controlled scales placed below the tube monitor the mass of grains flowingout at the bottom end. The mass flow rate Qm is then determined by differentiationwith respect to time. In the following the grain flow rate is characterized by thesuperficial velocity q (i.e. the volume flow rate of the grains per unit area) with
q =Qm
πR2ρg(1)
The hopper is a container with one opening at its bottom serving as a connectionto the experimental tube and a side inlet allowing an inflow of air monitored bya Honeywell gas flow rate sensor. The measurement ranges are 1 l mn−1 or 4 l mn−1
and the sensors are calibrated by means of a variable-flow-rate displacement syringepump; the volume flow rate Qmeas of inflowing air is measured in this way with aprecision of ± 1%. As for grains, the flow of air through the tube is characterized bya superficial velocity qa (i.e. the volume flow rate per unit area in the experimentaltube section). Note that qa is not equal to Qmeas/πR
2 but that
qa =1
πR2
(Qmeas − Qm
ρg
)=Qmeas
πR2− q. (2)
The inflow of air must compensate both the volume flow rate Qm/ρg of the grainswhich flow out of the hopper and that of the air which flows out of the hopper intothe tube.

320 Y. Bertho and others
Pressure sensor
Air inletand flowrate sensor
Capacitanceparticlefractionsensors
Experimentaltube
Computer-controlledscales
Fillinginlet
Hopper
Linearcamera
Pressuresensors
Adjustableconstriction
Longbottomplug
Bubble
Plug
Bubble
Plug
(c)(b)(a)
lbp
lpb lb
lp
lb
lp
z
Figure 1. (a) Experimental set-up for vertical granular flow studies. (b) Schematic view of thefree-fall regime. (c) Schematic view of the density-wave regime.
Pressure variations along the pipe are monitored by four sensors located alongthe tube at vertical distances of 200, 450, 700 and 950 mm below the outlet of thehopper. We use solid-state strain-gauge sensors attached directly to the tube wallwith a measurement range of 3 × 10⁴ Pa, a resolution of the order of 100 Pa and aresponse time of a few 10−2 s: the transducers have a low internal volume of a fewmm3 and are connected by short (5 mm long), 1 mm ID tubes to 0.5 mm diameterholes in the experimental pipe. A fine-meshed grid is stretched across them in orderto avoid grains penetrating the sensors. Another transducer measures pressure in thehopper.
Variations of the mean particle fraction in a tube section are estimated from themeasurement of the electrical capacitance between two 3 mm diameter cylindricalelectrodes with their ends against the outside tube wall and facing each other. Carefulshielding reduces the global capacitance of the probe to a few 10−2 pF and theelectrode assembly can be moved along the tube. Using a General Radio 1615Acapacitance bridge and a lock-in detector with a 3 ms time constant and a 10 kHzmeasurement frequency gives a very good measurement stability and a noise levelequivalent to a few 10−5 pF. The DC output is assumed to vary roughly linearlywith the particle fraction since the corresponding capacitance variations are only aminor fraction of the global value; the measurement is then calibrated by comparingreadings obtained with an empty tube and with the same tube containing a beadpacking of particle fraction 63% (estimated by weighing the grains and independentlymeasuring their density). The noise level corresponds to particle fraction variationsof order 0.5%. We estimate the vertical resolution of the measurement by movingthe upper boundary of the grain packing in a partly filled tube through the sensor

Powder flow down a vertical pipe 321
and recording the output reading for each location: the corresponding capacitancevariation is roughly linear and spreads over 2 mm which therefore represents thetypical spatial resolution of the measurement.
A Spectral Dynamics SD195 signal analyser records instantaneous variations ofthe readings of four sensors (up to a 200 kHz sampling frequency), while averages of10 physical parameters over time intervals of 1 s are recorded simultaneously.
Another important issue is the determination of the various characteristic velocitiesof the flow. Mean air and grain velocities can be estimated by combining grain and airflow rate values with those of the particle fraction; on the other hand the velocity ofthe plugs in the wave regime can be determined from spatio-temporal diagrams of theparticle density distribution along the pipe. Such diagrams were also constructed forthe free-fall regime and provide the velocity of small density fluctuations associatedwith small aggregates of particles. Spatio-temporal diagrams are obtained by meansof a digital linear CCD camera mounted on a micrometric assembly allowing aprecise alignment of the view field of the camera with the flow tube. The readingsof all the pixels of the linear sensor are directly transmitted to a computer at arepetition rate of 2000 Hz for the free-fall regime and 500 Hz for the wave regime.Spatio-temporal diagrams obtained in this way are stored as numerical data arrayswhich can be visualized by standard image processing programs; in addition theyallow one to detect with great sensitivity oscillations and intermittencies of the flowand to measure the propagation velocity of the perturbations.
2.2. Flow regime dependence on granular flow rate and humidity
The key parameter determining the flow regime is the granular flow rate, but thedegree of humidity H of the ambient air also significantly influences the flow regimesobserved. Breathing into the pipe for a second generates enough humidity on thewalls to completely block the flow of grains in the tube. More generally, large valuesof humidity often induce clogging due to capillary forces between particles or betweenparticles and tube walls. On the other hand, if the atmosphere is too dry, electrostaticforces appear and may also lead to a blocking of the flow. Humidity is monitoredby an electronic hygrometer and adjusted by a humidifier in order to obtain a goodreproducibility during a series of experimental runs.
The free-fall regime characterized by high velocities and low densities of particlesis only observed for grain flow rates with q > 0.35 m s−1 with little or no constrictionat the bottom (figure 1b). When the constriction is increased, the flow switchesto a regime with density waves of constant velocity in the range of flow rates0.11 < q < 0.26 m s−1 (and for relative humidities between 45% and 55%). In this case,a system of high-density plugs and low-density bubbles moves at a constant downwardvelocity (figure 1c). For narrower constrictions and q of order 0.085–0.11 m s−1, thewaves may start to oscillate with a system of plugs and bubbles moving up and downwith an amplitude of the order of a centimetre: this is particularly the case at lowhumidity. At still lower flow rates q < 0.08 m s−1, a compact flow is observed witha slow constant velocity or an intermittent motion of the particles. This regime, inwhich solid contact forces play a crucial role, will be discussed in a future paper andwe shall deal here only with free-fall and wave regimes.
In order to demonstrate qualitatively the influence of the contact forces in thewave regime, we report near the end of the paper (§ 5) a few experiments realizedwith beads which had been processed many times through the experimental tubeand had their surface roughened by collisions with the walls and with each other.
322 Y. Bertho and others
0 100 200
Time (ms)
100
200
Dz
(mm
)
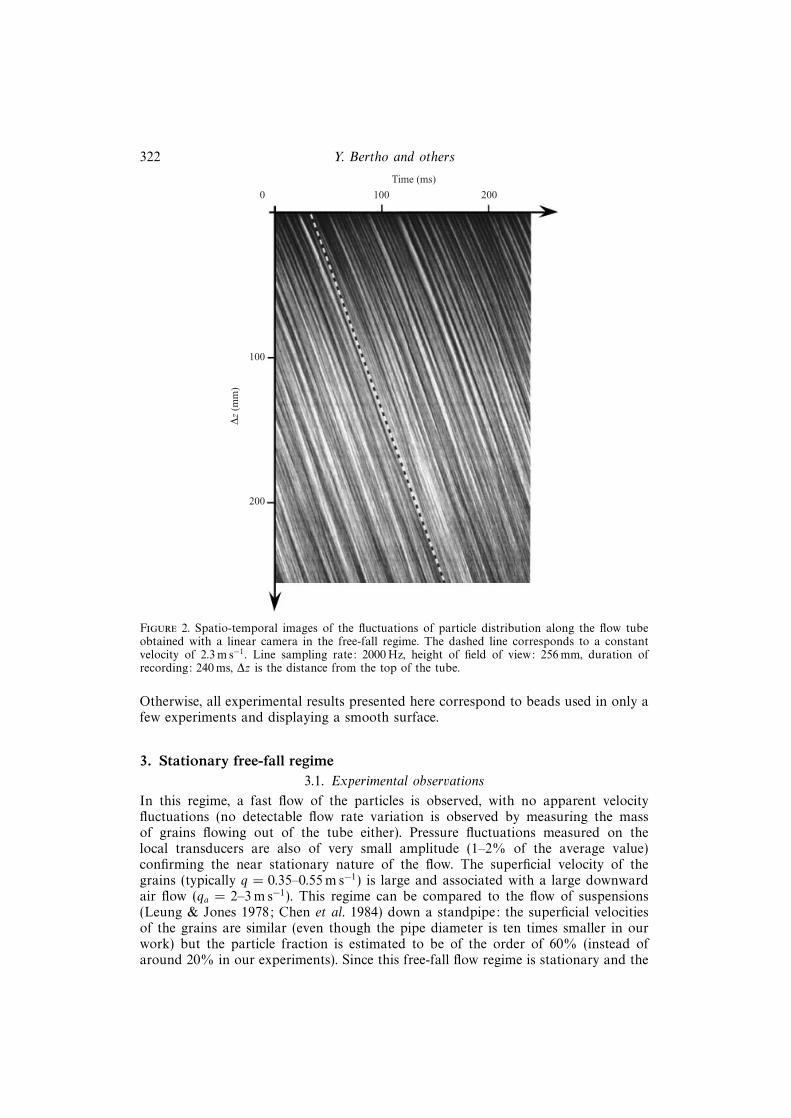
Figure 2. Spatio-temporal images of the fluctuations of particle distribution along the flow tubeobtained with a linear camera in the free-fall regime. The dashed line corresponds to a constantvelocity of 2.3 m s−1. Line sampling rate: 2000 Hz, height of field of view: 256 mm, duration ofrecording: 240 ms, ∆z is the distance from the top of the tube.
Otherwise, all experimental results presented here correspond to beads used in only afew experiments and displaying a smooth surface.
3. Stationary free-fall regime3.1. Experimental observations
In this regime, a fast flow of the particles is observed, with no apparent velocityfluctuations (no detectable flow rate variation is observed by measuring the massof grains flowing out of the tube either). Pressure fluctuations measured on thelocal transducers are also of very small amplitude (1–2% of the average value)confirming the near stationary nature of the flow. The superficial velocity of thegrains (typically q = 0.35–0.55 m s−1) is large and associated with a large downwardair flow (qa = 2–3 m s−1). This regime can be compared to the flow of suspensions(Leung & Jones 1978; Chen et al. 1984) down a standpipe: the superficial velocitiesof the grains are similar (even though the pipe diameter is ten times smaller in ourwork) but the particle fraction is estimated to be of the order of 60% (instead ofaround 20% in our experiments). Since this free-fall flow regime is stationary and the
Powder flow down a vertical pipe 323
50
40
30
20
10
0
0 0.5 1.0
0
–1000
–2000
–3000
0 0.5 1.0z (m)z (m)
Pre
ssur
e (P
a)
c (%
)
(a) (b)
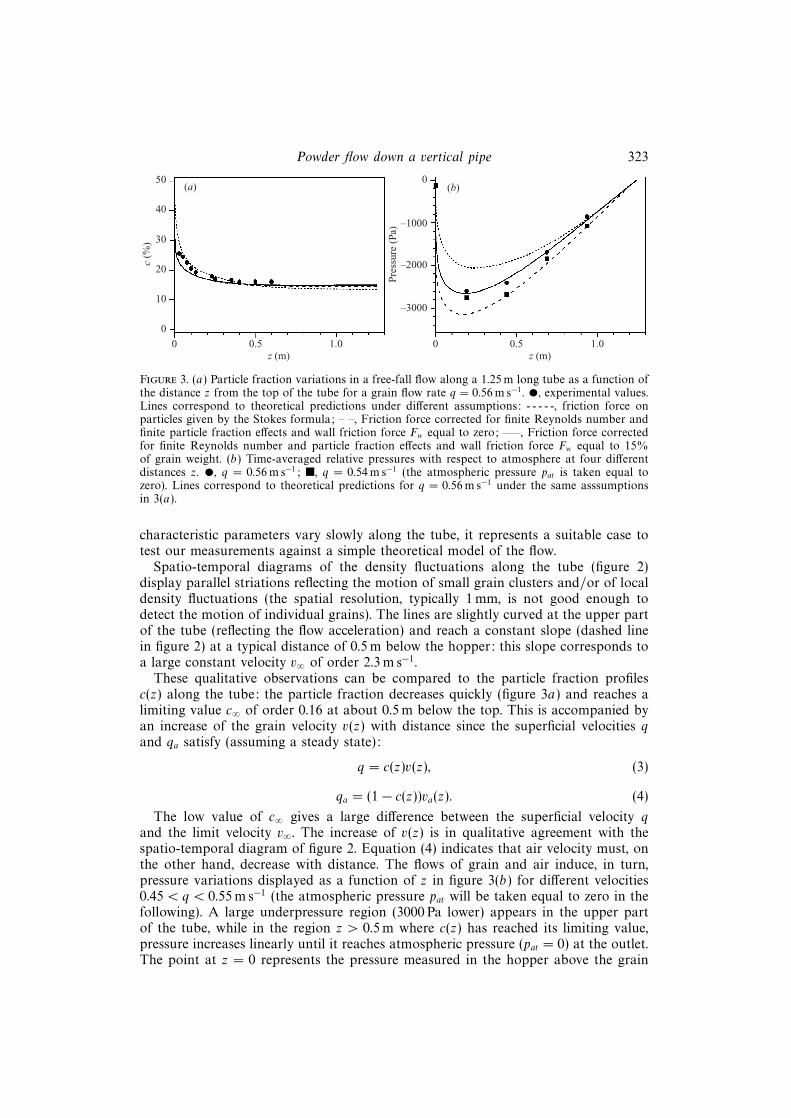
Figure 3. (a) Particle fraction variations in a free-fall flow along a 1.25 m long tube as a function ofthe distance z from the top of the tube for a grain flow rate q = 0.56 m s−1. •, experimental values.Lines correspond to theoretical predictions under different assumptions: - - - - -, friction force onparticles given by the Stokes formula; – –, Friction force corrected for finite Reynolds number andfinite particle fraction effects and wall friction force Fw equal to zero; —–, Friction force correctedfor finite Reynolds number and particle fraction effects and wall friction force Fw equal to 15%of grain weight. (b) Time-averaged relative pressures with respect to atmosphere at four differentdistances z. •, q = 0.56 m s−1; �, q = 0.54 m s−1 (the atmospheric pressure pat is taken equal tozero). Lines correspond to theoretical predictions for q = 0.56 m s−1 under the same asssumptionsin 3(a).
characteristic parameters vary slowly along the tube, it represents a suitable case totest our measurements against a simple theoretical model of the flow.
Spatio-temporal diagrams of the density fluctuations along the tube (figure 2)display parallel striations reflecting the motion of small grain clusters and/or of localdensity fluctuations (the spatial resolution, typically 1 mm, is not good enough todetect the motion of individual grains). The lines are slightly curved at the upper partof the tube (reflecting the flow acceleration) and reach a constant slope (dashed linein figure 2) at a typical distance of 0.5 m below the hopper: this slope corresponds toa large constant velocity v∞ of order 2.3 m s−1.
These qualitative observations can be compared to the particle fraction profilesc(z) along the tube: the particle fraction decreases quickly (figure 3a) and reaches alimiting value c∞ of order 0.16 at about 0.5 m below the top. This is accompanied byan increase of the grain velocity v(z) with distance since the superficial velocities qand qa satisfy (assuming a steady state):
q = c(z)v(z), (3)
qa = (1− c(z))va(z). (4)
The low value of c∞ gives a large difference between the superficial velocity qand the limit velocity v∞. The increase of v(z) is in qualitative agreement with thespatio-temporal diagram of figure 2. Equation (4) indicates that air velocity must, onthe other hand, decrease with distance. The flows of grain and air induce, in turn,pressure variations displayed as a function of z in figure 3(b) for different velocities0.45 < q < 0.55 m s−1 (the atmospheric pressure pat will be taken equal to zero in thefollowing). A large underpressure region (3000 Pa lower) appears in the upper partof the tube, while in the region z > 0.5 m where c(z) has reached its limiting value,pressure increases linearly until it reaches atmospheric pressure (pat = 0) at the outlet.The point at z = 0 represents the pressure measured in the hopper above the grain

324 Y. Bertho and others
packing and is very close to zero: a strong pressure gradient above z = 0.2 m results,which explains the large downward air flow through the porous grain packing.
Let us now write the equations of motion for the air and for the grains (Ginestraet al. 1980; Chen et al. 1984): combined with the mass conservation equations abovethey will allow us to determine friction forces on the walls from pressure and particlefraction profiles without needing further relations. Assuming in addition a simpleexpression from the literature for the friction force between air and the grains, it willthen be possible to predict the full pressure and particle fraction profiles along thepipe for given flow rates q and qa.
3.2. Equations of motion for the air and for the grains and estimates of friction forces
It is assumed here that the flow is stationary in time and homogeneous across agiven section of the tube. Then, the velocities va and v of air and of the grainsrespectively depend only on the distance z from the bottom of the hopper (takenpositively downwards) and are related to the particle fraction c(z) by equations (3)and (4). Let us first assume that the friction force between the grains and the tubewalls is negligible. Then, when the flow is stationary, the Lagrangian accelerationdv(z)/dt = v(z) dv(z)/dz satisfies
mv(z)dv(z)
dz= mg − F(v(z)− va(z)). (5)
Here m is the mass of a single grain given by m = 4πρga3/3 and F(v(z) − va(z)) is
the friction force on the grain, which depends only on the relative velocity of theparticles with respect to the air. On the other hand, the equation of motion of air canbe reduced to
dp
dz= ρgc(z)
F(v(z)− va(z))m
, (6)
in which ρgc(z)/m is equal to the number of particles per unit volume. Equation(6) assumes a balance between the pressure gradient and the friction force betweenthe air and the grains: this amounts to neglecting both the Lagrangian accelerationρav(z) dv(z)/dz and the friction force of air on the walls. The first term is negligibledue to the low density of air and the second is shown below to be markedly smallerthan the pressure gradient. Equation (6) may be combined with (5) to obtain thefollowing equation which does not include explicitly the friction force F:
dp
dz= ρggc(z)− ρgc(z)v(z)dv(z)
dz. (7)
At large enough distances from the hopper (z > 0.4 m), the particle fraction c(z) andthe velocities v and va reach the limiting values c∞ = 0.16, v∞ and va∞ (figure 3), andthe term ρgc(z)v(z) dv(z)/dz is equal to zero in (7). However the value of (dp/dz)predicted by taking c∞ = 0.16 in (7) is of the order of 3900 Pa m−1 which is largerthan the experimental value (dp/dz) = 3500 Pa m−1 at long distances (figure 3). Thisdifference implies that the friction force on the walls is not zero and that (7) must bereplaced (in the constant-pressure-gradient and velocity region) by
dp(z)
dz= ρggc∞ − Fw
πR2. (8)
Fw is the friction force on the walls per unit length of the tube and is of the order of15% of the grain weight for q = 0.56 m s−1 (as in figure 3a). Let us show now that Fwis made up mostly of the friction force Fwg between grains and the walls and that the
Powder flow down a vertical pipe 325
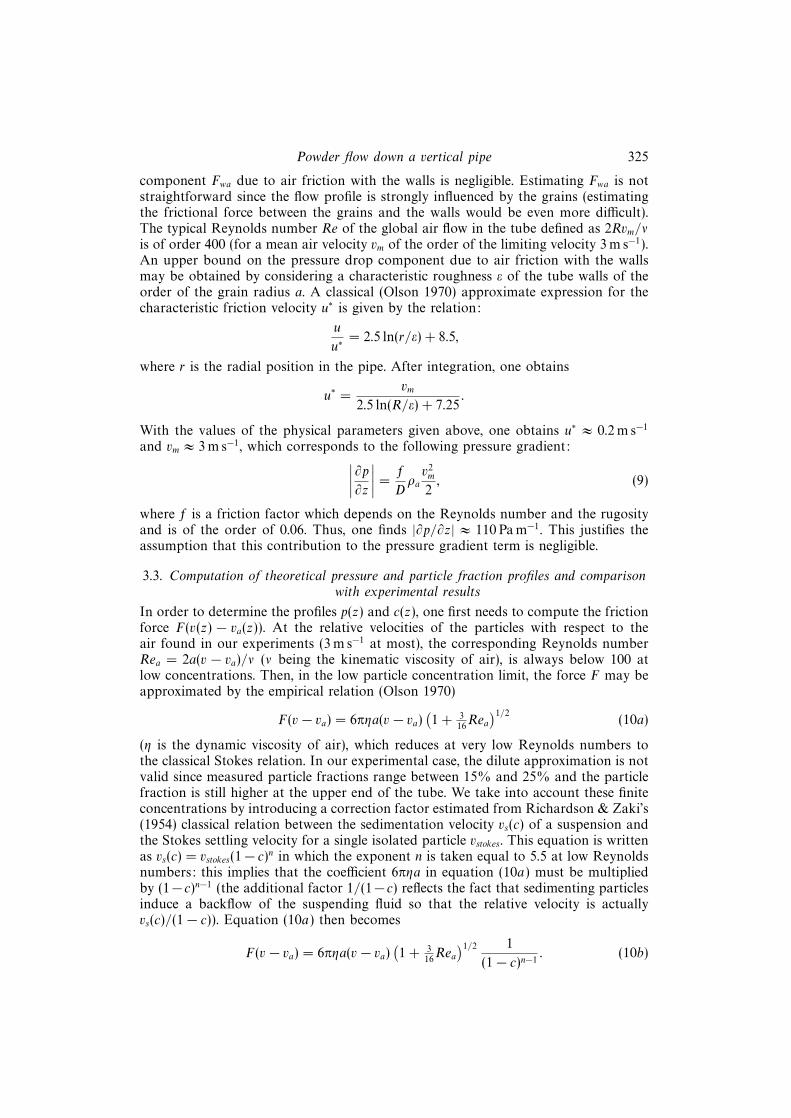
component Fwa due to air friction with the walls is negligible. Estimating Fwa is notstraightforward since the flow profile is strongly influenced by the grains (estimatingthe frictional force between the grains and the walls would be even more difficult).The typical Reynolds number Re of the global air flow in the tube defined as 2Rvm/νis of order 400 (for a mean air velocity vm of the order of the limiting velocity 3 m s−1).An upper bound on the pressure drop component due to air friction with the wallsmay be obtained by considering a characteristic roughness ε of the tube walls of theorder of the grain radius a. A classical (Olson 1970) approximate expression for thecharacteristic friction velocity u∗ is given by the relation:
u
u∗= 2.5 ln(r/ε) + 8.5,
where r is the radial position in the pipe. After integration, one obtains
u∗ =vm
2.5 ln(R/ε) + 7.25.
With the values of the physical parameters given above, one obtains u∗ ≈ 0.2 m s−1
and vm ≈ 3 m s−1, which corresponds to the following pressure gradient:∣∣∣∣∂p∂z∣∣∣∣ =
f
Dρav2m
2, (9)
where f is a friction factor which depends on the Reynolds number and the rugosityand is of the order of 0.06. Thus, one finds |∂p/∂z| ≈ 110 Pa m−1. This justifies theassumption that this contribution to the pressure gradient term is negligible.
3.3. Computation of theoretical pressure and particle fraction profiles and comparisonwith experimental results
In order to determine the profiles p(z) and c(z), one first needs to compute the frictionforce F(v(z) − va(z)). At the relative velocities of the particles with respect to theair found in our experiments (3 m s−1 at most), the corresponding Reynolds numberRea = 2a(v − va)/ν (ν being the kinematic viscosity of air), is always below 100 atlow concentrations. Then, in the low particle concentration limit, the force F may beapproximated by the empirical relation (Olson 1970)
F(v − va) = 6πηa(v − va) (1 + 316Rea)1/2
(10a)
(η is the dynamic viscosity of air), which reduces at very low Reynolds numbers tothe classical Stokes relation. In our experimental case, the dilute approximation is notvalid since measured particle fractions range between 15% and 25% and the particlefraction is still higher at the upper end of the tube. We take into account these finiteconcentrations by introducing a correction factor estimated from Richardson & Zaki’s(1954) classical relation between the sedimentation velocity vs(c) of a suspension andthe Stokes settling velocity for a single isolated particle vstokes. This equation is writtenas vs(c) = vstokes(1− c)n in which the exponent n is taken equal to 5.5 at low Reynoldsnumbers: this implies that the coefficient 6πηa in equation (10a) must be multipliedby (1− c)n−1 (the additional factor 1/(1− c) reflects the fact that sedimenting particlesinduce a backflow of the suspending fluid so that the relative velocity is actuallyvs(c)/(1− c)). Equation (10a) then becomes
F(v − va) = 6πηa(v − va) (1 + 316Rea)1/2 1
(1− c)n−1. (10b)
326 Y. Bertho and others
Combining equations (3)–(5) and (10b), one obtains the following first-order differ-ential equation for c(z) (assuming at this stage Fw = 0):
dc
dz= −g c
3
q2+
6πηac3
mq2
(qc− qa
1− c)[
1 +3
8
a
ν
(qc− qa
1− c)]1/2
1
(1− c)n−1, (11a)
which, for low Reynolds numbers and low particle fractions, becomes
dc
dz= −g c
3
q2+
6πηa
m
(c2
q− c3qa
q2(1− c)). (11b)
Equations (11a) and (11b) are then integrated numerically to obtain the theoreticalparticle fraction profiles c(z) displayed in figure 3(a). Note that the value c(0) right atthe top of the hopper cannot be determined precisely due to the fast variation of c(z)in this region: on the other hand (and for the same reason) the choice of c(0) doesnot markedly influence c(z) in regions of slower variation farther from the hopper.Even a large variation of c(0) corresponds to an uncertainty of a few mm in the zscale of the profiles, which has a small influence on the value of c(z), except very closeto the hopper. We have chosen the value c = 0.5, which is a good order-of-magnitudeestimate of the particle fraction just after decompaction, to obtain the curves offigure 3(a). In order to determine c(z), we have used in (11a, b) the experimental valueof the air flow qa. This air flow might alternatively be estimated for a given grain flowq from the permeability and particle fraction of the grain packing in the hopper andthe pressure variation across this packing. This estimate would however be much lessprecise than the direct measurement in view of the uncertainty in these parameters.
One observes first in figure 3(a) that the fit of the theoretical curves with theexperimental data is improved by including finite Reynolds number and particlefraction effects. The theoretical profiles also confirm the experimental observationthat c(z) reaches a lower limit c∞ at a distance of 0.4 m. This limiting value c∞ is equalto 0.14 when the friction force Fw is omitted. In order to obtain the experimentalvalue 0.16, a friction force Fw equal to 15% of the grain weight must be introduced,as already found in the previous section (this amounts to decreasing the gravityacceleration g by 15%). The third curve in figure 3(a) corresponds to this hypothesisand differs little near the hopper from that corresponding to Fw = 0, while the fitbecomes better further down the tube. Note that the value 0.15 of the ratio betweenFw and the grain weight can be determined directly from (7) and does not dependon the expression for the friction force F between the air and the grains. This ratioshould depend however on various flow parameters such as the flow rate, the surfacecondition of the grains and of the tube and their diameters. Similar observations havebeen reported on pressure gradients in circulating fluidized beds (although at higherparticle fractions) by Srivastava et al. (1998) and were also interpreted in terms ofwall friction.
Theoretical pressure profiles p(z) are computed at the same time as c(z) by meansof (6) (at each step of the integration, the friction force F is computed by combiningequations (3), (4) and (11a, b)). The integration constant is then chosen to give theatmospheric pressure at the lower outlet of the tube. Closer to the top of the tube,the fit between experimental and theoretical pressure variations is markedly betterwhen the effects of the finite Reynolds number and particle fraction values are takeninto account (figure 3b); it is further improved by introducing the friction force Fwof the grains with the walls.
Powder flow down a vertical pipe 327
5
4
3
2
1
0
0 0.5 1.0z (m)
v, v
a (m
s–1
)
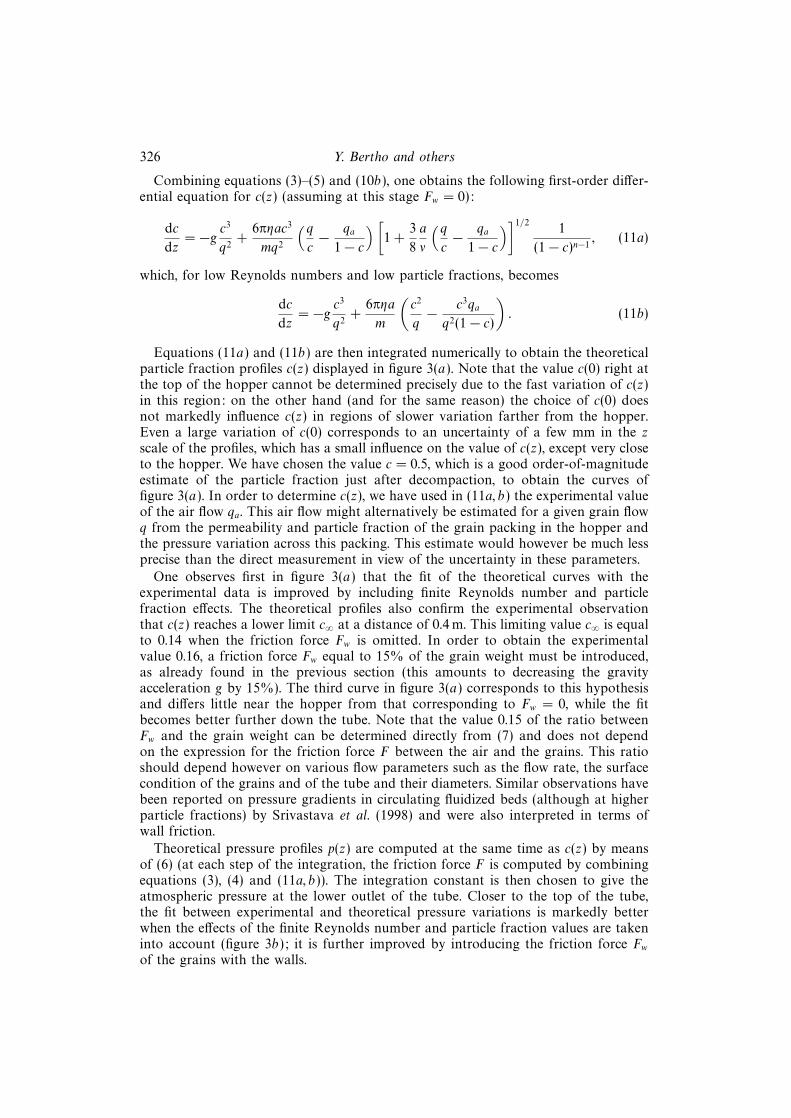
Figure 4. Air and grain velocity variations in a free-fall flow (q = 0.56 m s−1) along a 1.25 m longtube as a function of distance z from the bottom of the hopper. Theoretical grain and air velocityprofile: v(z) (—) and va(z) (- - -). N, Grain cluster velocity determined from spatio-temporal diagramat z = 0.4 m; •, mean grain velocity computed from experimental particle fraction profile.
3.4. Particle and air velocities in the stationary free-fall regime
By combining the two mass conservation equations (3) and (4) and the particlefraction profile c(z), one obtains the respective profiles va(z) and v(z) of the meanair and particle velocities. Theoretical curves obtained by taking into account thefinite Reynolds number and density effects on the drag as well as grain friction withthe walls are plotted in figure 4. One observes a decrease of the air velocity withdistance (corresponding to the decreasing particle fraction) while, on the contrary,the grain velocity increases. In the upper part of the tube, the air moves faster thanthe grains and contributes to their acceleration. The velocities become equal aroundz = 0.2 m where pressure is minimal. Then the grains move faster than the air andtheir acceleration decreases until their weight is exactly balanced by friction with theair and with the walls.
These data are first compared to semi-experimental values determined by substi-tuting into equations (3) and (4) experimental particle fractions plotted in figure 3(a).The good agreement between the two set of values essentially mirrors the agreementbetween theoretical and experimental particle fraction variations. More meaning-ful comparisons can be made with direct velocity determinations using the spatio-temporal diagram of figure 2. As already stated, the particle density fluctuations giverise to a set of parallel dark and light lines: the slope dz/dt of these lines is equalto the propagation velocity of the fluctuations which is thus defined well at a givenheight. The velocity determined in this way at z = 0.4 m has been plotted on figure 4.It is close to the theoretical particle velocity although slightly lower. The differenceis probably due to the fact that the linear camera does not have a sufficiently goodspatial resolution to detect individual particles. Thus the fine dark and light lines offigure 2 probably correspond to small clusters of particles or to small low-densityzones which may have a different velocity from that of individual grains: the fairagreement displayed in figure 4 indicates that these diagrams however represent agood practical way to track particle motions quantitatively.

328 Y. Bertho and others
Studying the stationary free-fall regime has allowed us to test measurement andmodelling tools in a simple experimental case. It has been possible in particular toestimate quantitatively the magnitude of friction forces of the particles with the wallswithout making assumptions about the expression for the friction force between theair and the particles. Using a simple classical model for this latter force allowed us inaddition to predict precisely pressure and particle fraction variations with distance.The estimate of particle cluster velocities from spatio-temporal diagrams has alsodemonstrated the potential of this technique for analysing the flow dynamics.
We shall now apply the same approach to the analysis of the density-wave regimecharacterized by a sequence of plugs and low-density bubbles moving downwards ata constant velocity vw (Raafat et al. 1996). This system is more complex and newcharacteristic variables must be introduced such as the velocity vw and the length ofthe bubbles and the plugs. Both the particle fraction and the air and grain velocitiesdiffer in the plug and bubble regions and the flow can be considered as stationary onlyin the reference frame moving at velocity vw . In this part of the work, our objective isto analyse the dependence of the structure of the flow (particle fraction distribution,plug and bubble lengths, plug, particle and gas velocities, etc.) on the grain flow rateand to determine the relations between the pressure gradient, the wall friction forcesand the various experimental variables.
4. Constant-velocity density-wave regime4.1. Spatio-temporal characteristics of the constant-velocity wave regime
Spatio-temporal diagrams obtained in the wave regime at two different flow rates aredisplayed in figure 5(a, b). The sequence of plugs and bubbles appears as inclinedstripes of slope corresponding to the plug velocity vw . This slope is quite constant fora given plug and also from one plug to another so that vw can be determined precisely.The variation of vw with the flow rate q is seen in figure 6 to be roughly linear forlarge q(q > 0.16 m s−1) and constant for small q: plugs move faster near the transitionto the free-fall regime where they disintegrate. Extrapolating the variation of figure 6suggests that vw would go to zero at a positive non-zero value of q (transient-waveregimes with stationary plugs were also observed in a tube closed at the bottom andfilled from the top). A net downward grain flow from one plug to the next is observed.Inside each bubble, the spatio-temporal diagram is qualitatively similar to that in thefree-fall regime: the curvature of the lines (figure 5a) indicates an acceleration of thegrain clusters as they fall out of a plug. The distribution of the plugs is variable: insome cases plugs and bubbles are well-defined and separated while, in others, plugscluster together (but remain separated) and buildup a like kind of ‘puff pastry’ as canbe seen in figure 5(a).
The sequence of plugs and low-density bubbles does not extend down the full lengthof the tube: in the top part, it becomes established only after a distance of 4 to 15 cmbelow the hopper (increasing with flow rate q) where short plugs appear and quicklygrow to their final length (figure 5a, b). Closer to the hopper, the spatio-temporaldiagram is similar to that observed in the free-fall regime (figure 2) with a velocityincreasing with distance. At the other end, the lower part of the tube (not visible onthe figure) is occupied by a compact bottom plug of length lbp decreasing from morethan 300 mm down to 50 mm as q increases (figure 9).
Information provided by the spatio-temporal diagrams is complemented by particlefraction measurements. Figure 7 displays the time variation of the capacitance sensor

Powder flow down a vertical pipe 329
(a) (b)
Figure 5. Spatio-temporal images of the fluctuations of particle distribution along the tube obtainedwith a linear camera in the wave regime. Line sampling rate: 2000 Hz, height of field of view:450 mm, time lapse corresponding to diagrams: 0.5 s. (a) q = 0.14 m s−1, (b) q = 0.22 m s−1. Thespatio-temporal diagrams extend from the top of the tube (the bottom of the hopper appears as adark strip at the top). Both horizontal white lines correspond to mechanical supports and the darkstripe below to a pressure transducer.
0.8
0.6
0.4
0.2
0
0.10 0.15 0.20 0.25q (m s–1)
v w(m
s–1
)
Figure 6. Wave velocity vw as a function of the superficial grain velocity q in the steady wavesregime (vw is computed from the spatio-temporal diagram). •, Data points corresponding to beadswith a smooth surface; N, data points for beads with a rougher surface.

330 Y. Bertho and others
60
50
40
30
20
10
00 5 10 15
Time (s)
c(%
)Particle fraction inside plugs
Average particle fraction
Minimum particle fraction inside bubbles
54.5%
25%
8.5%
Figure 7. Time variation of the reading of a capacitive particle fraction sensor located at 300 mmbelow the hopper in the density-wave regime (q = 0.1 m s−1), particle fraction inside plugs = 54.5%,average particle fraction = 24%, minimum particle fraction inside bubbles = 8.5%.
in the wave regime, showing large fluctuations of the particle fraction between well-defined high values of often 50% or more in the plugs and low values of 15% orless inside bubbles. The asymmetrical peaks correspond to the plugs: the sharper rearslope of the peak corresponds to the upper side of the plugs where the particle fractionincreases abruptly as grains falling through a bubble hit the top of the plug. On theother hand, the particle fraction variation is smoother at the bottom of the plugswhere beads accelerate progressively as they leave it. The particle fraction cp in theplugs is more or less constant from one plug to the next while the minimum particlefraction cb inside bubbles increases with their length. This reflects the accelerationof particles inside bubbles and the fact that they reach a higher velocity at thebottom of long bubbles. The distribution of the size of the plugs and the bubblescan be estimated from the width of the peaks and their intervals together with directmeasurements of the plug velocities: in a previous work (Raafat et al. 1996), thesize of the plugs was found to be relatively constant and of the order of 10 mmwhile bubbles are generally larger and with more dispersed sizes (no indication ofvery broad size distributions, such as power laws for instance, was found however).Variations of the mean bubble sizes with the flow parameters are displayed below infigure 9.
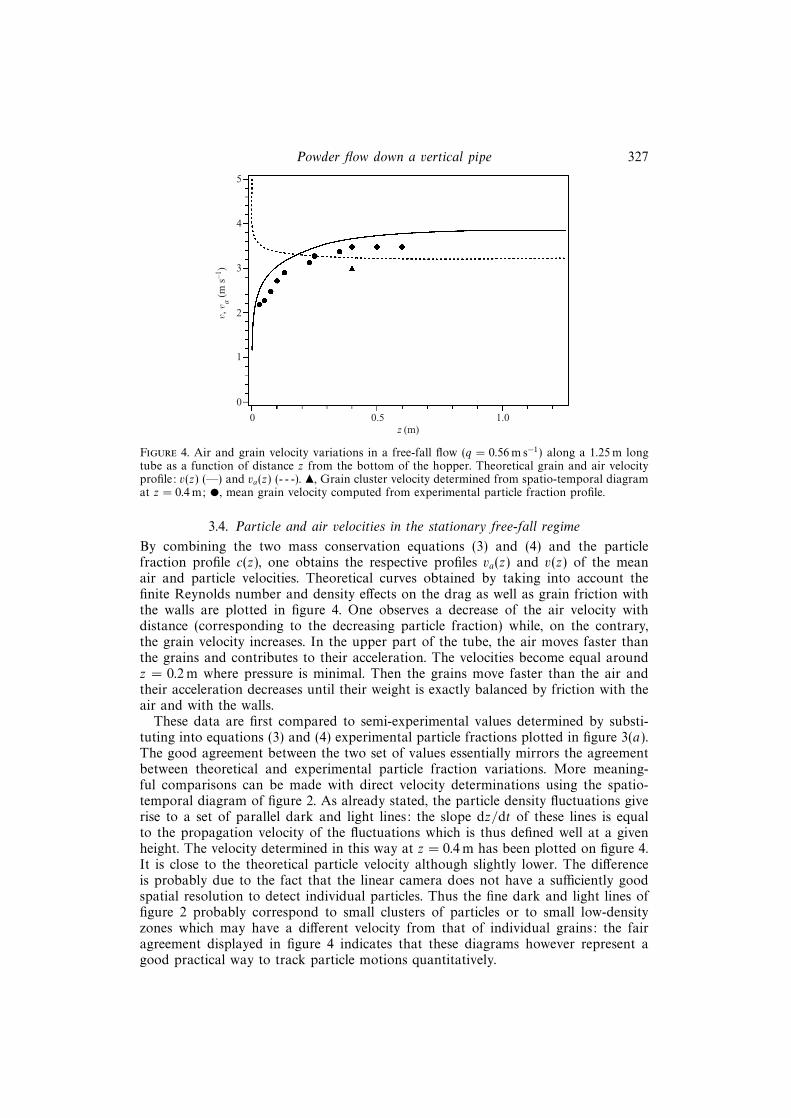
Figure 8 presents, for beads with a smooth surface, variations with the superficialvelocity q of four specific particle fractions: the fraction cp in the plugs, the minimumfraction cb at the bottom of long bubbles, the time-averaged fraction c and thefraction cbp in the bottom plug near the outlet of the tube. The particle fraction cpin the plugs decreases from 60% for q = 0.11 m s−1 (close to the particle fraction ofa fixed random packing) down to 30% for q = 0.23 m s−1 with an acceleration of thevariation close to q = 0.16 m s−1 (the same value above which the wave velocity vwincreases faster with q). The minimum fraction cb in the bubbles is of the same orderof magnitude as in the free-fall regime; the time-averaged fraction c is of the orderof 25% at low flow rates and decreases quickly with q towards an almost constantvalue of 20%. The particle fraction cbp in the bottom plug is larger than that of the
Powder flow down a vertical pipe 331
60
50
40
30
20
10
00.10 0.15 0.20 0.25
c(%
)
q (m s–1)
Figure 8. Variations of time-averaged particle fraction c (N), particle fraction in plugs cp (•),particle fraction inside bubbles cb (�), and bottom plug particle fraction cbp (H) in the wave regimeas a function of superficial grain velocity q.
0.1
0.10 0.15 0.20 0.25
l pb, l
bp (
m)
q (m s–1)
5
3
2
5
3
2
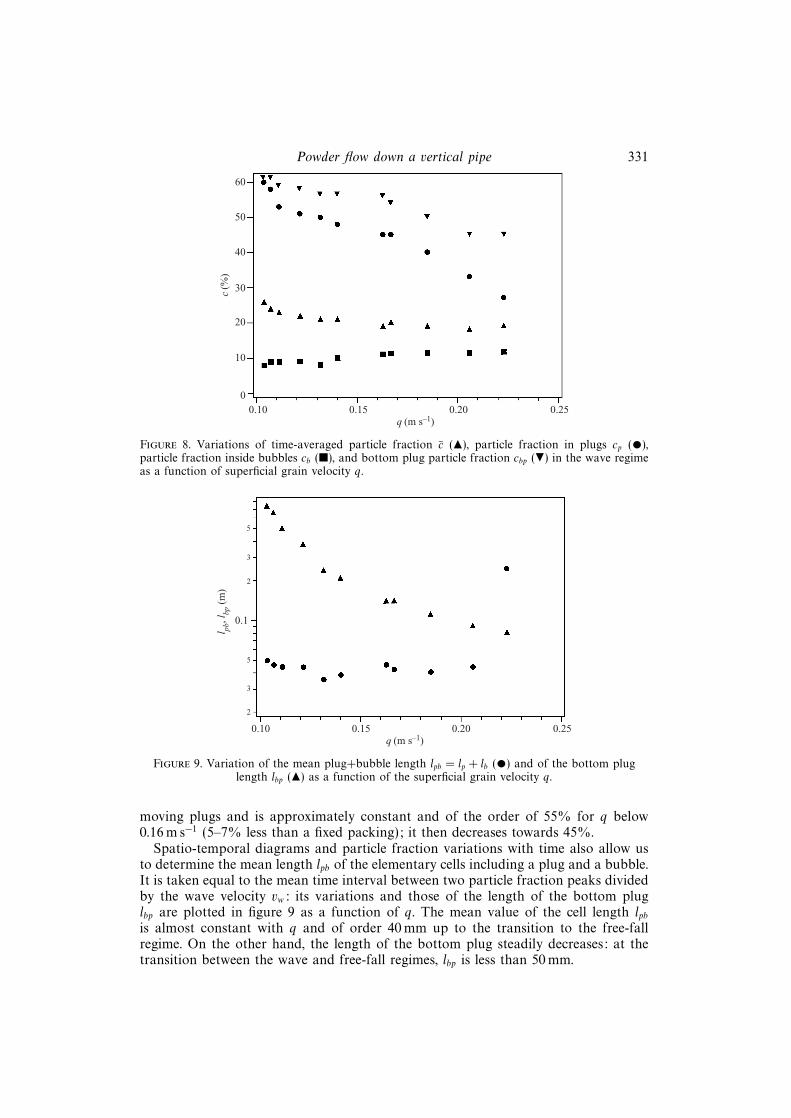
Figure 9. Variation of the mean plug+bubble length lpb = lp + lb (•) and of the bottom pluglength lbp (N) as a function of the superficial grain velocity q.
moving plugs and is approximately constant and of the order of 55% for q below0.16 m s−1 (5–7% less than a fixed packing); it then decreases towards 45%.
Spatio-temporal diagrams and particle fraction variations with time also allow usto determine the mean length lpb of the elementary cells including a plug and a bubble.It is taken equal to the mean time interval between two particle fraction peaks dividedby the wave velocity vw: its variations and those of the length of the bottom pluglbp are plotted in figure 9 as a function of q. The mean value of the cell length lpbis almost constant with q and of order 40 mm up to the transition to the free-fallregime. On the other hand, the length of the bottom plug steadily decreases: at thetransition between the wave and free-fall regimes, lbp is less than 50 mm.
332 Y. Bertho and others
0.4
0.10 0.15 0.20 0.25
q a, q
abp,
qaw
, qar
, qar
bp (
m s
–1)
q (m s–1)
0.2
0
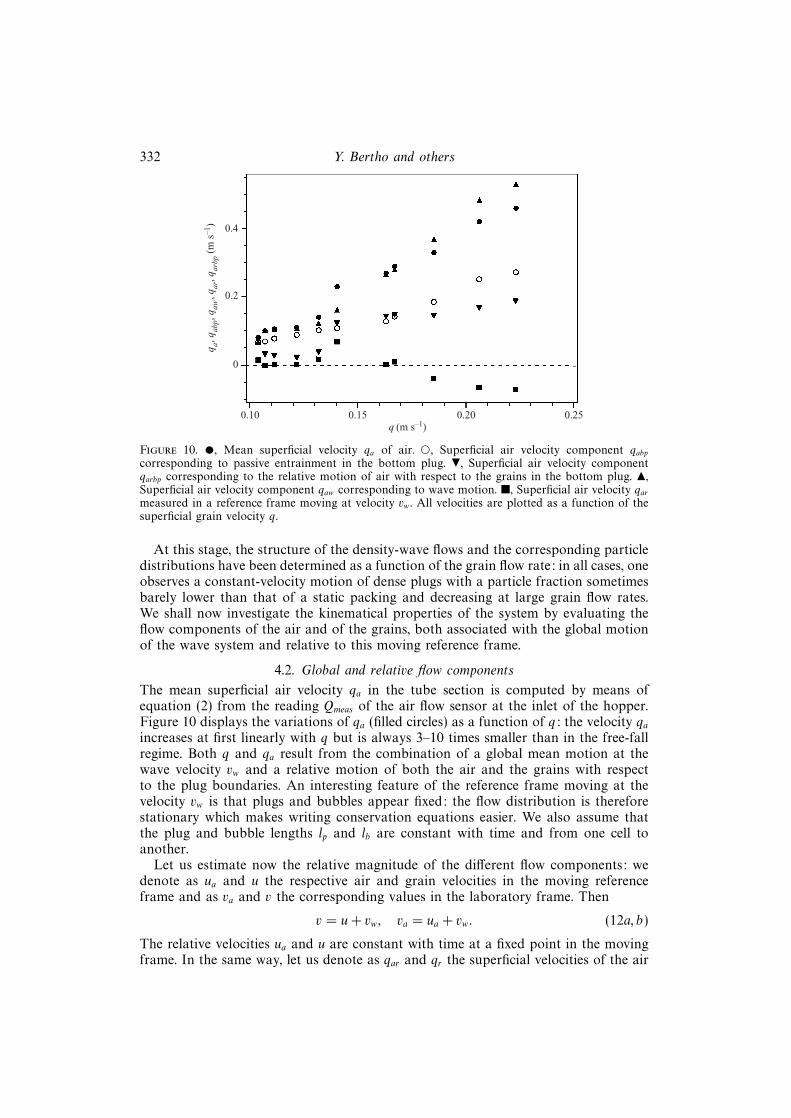
Figure 10. •, Mean superficial velocity qa of air. e, Superficial air velocity component qabpcorresponding to passive entrainment in the bottom plug. H, Superficial air velocity componentqarbp corresponding to the relative motion of air with respect to the grains in the bottom plug. N,Superficial air velocity component qaw corresponding to wave motion. �, Superficial air velocity qarmeasured in a reference frame moving at velocity vw . All velocities are plotted as a function of thesuperficial grain velocity q.
At this stage, the structure of the density-wave flows and the corresponding particledistributions have been determined as a function of the grain flow rate: in all cases, oneobserves a constant-velocity motion of dense plugs with a particle fraction sometimesbarely lower than that of a static packing and decreasing at large grain flow rates.We shall now investigate the kinematical properties of the system by evaluating theflow components of the air and of the grains, both associated with the global motionof the wave system and relative to this moving reference frame.
4.2. Global and relative flow components
The mean superficial air velocity qa in the tube section is computed by means ofequation (2) from the reading Qmeas of the air flow sensor at the inlet of the hopper.Figure 10 displays the variations of qa (filled circles) as a function of q: the velocity qaincreases at first linearly with q but is always 3–10 times smaller than in the free-fallregime. Both q and qa result from the combination of a global mean motion at thewave velocity vw and a relative motion of both the air and the grains with respectto the plug boundaries. An interesting feature of the reference frame moving at thevelocity vw is that plugs and bubbles appear fixed: the flow distribution is thereforestationary which makes writing conservation equations easier. We also assume thatthe plug and bubble lengths lp and lb are constant with time and from one cell toanother.
Let us estimate now the relative magnitude of the different flow components: wedenote as ua and u the respective air and grain velocities in the moving referenceframe and as va and v the corresponding values in the laboratory frame. Then
v = u+ vw, va = ua + vw. (12a, b)
The relative velocities ua and u are constant with time at a fixed point in the movingframe. In the same way, let us denote as qar and qr the superficial velocities of the air

Powder flow down a vertical pipe 333
and the grains in the moving frame: they are constant with both time and distance(due to mass conservation) and satisfy
qar = ua(1− c), qr = uc, (13a, b)
in which c is the local particle fraction. The differences between qar and qr and thecorresponding superficial velocities qa and q in the laboratory frame are the volume-averaged superficial velocities qw = vwc and qaw = vw(1− c) which represent the flowrates associated with the global wave motion. The relative superficial velocities in themoving frame thus satisfy
qar = ua(1− c) = qa − vw(1− c), qr = uc = q − vwc (14a, b)
Variations of these superficial velocities qar, qaw, qr, qw as function of the global grainsuperficial velocity q are plotted in figures 10 (for the air) and 11(a) (for the grains).In agreement with previous results (Raafat et al. 1996) the relative superficial velocityof the grains qr varies little with the flow rate (particularly for q > 0.12 m s−1) anddoes not vanish when the wave velocity goes to zero.
Grain and air velocities in the different parts of the flow can now be determinedby using equations (12a, b) and (13a, b) and the particle fractions from figure 8.Figure 11(b) displays variations of u and ua determined in this way both in the plugs(up and uap) and at the end of the bubbles (ub and uab). Since velocity is continuousat the lower plug–bubble boundaries, up is also the grain relative velocity at the topof the bubbles. Figure 11(b) shows therefore that this relative velocity u increases bya factor of 3 to 10 between the top and the bottom of the bubbles (in agreementwith the curvatures of the streaks in the spatio-temporal diagram); u is howeversmaller than in the free-fall regime since the acceleration distance is shorter (theterminal velocity is not reached) and the downflow of air accelerating the beads isnegligible. The relative air velocity qar is either very small or negative: this implies thatthe upward permeation of the air through the plugs induced by the mean pressuregradient balances the passive drag by the downwards motion of the grains.
An interesting issue is the value in the moving reference frame of the initial relativevelocity up of grains leaving a plug. We suggest that the bottom layers of the plugdetach sequentially one after another due to the dilatancy which is required to deformthe plug. Let us call τ the time interval between the detachment of two successivegrain layers, each of typical thickness 2a. Then up = 2a/τ. Let us assume that, afterthe detachment, the motion of the layer corresponds to a free fall, neglecting airfriction. Then, the spacing hR between two layers at the time when the second layerbecomes detached should be hR = 1
2gτ2. One expects the value of hR to be a few
microns – a small percentage of the grain diameter. The values of hR computed inthis way from the experimental values of up displayed in figure 11(b) range between4 and 15 µm, in agreement with these expectations (the variation is explained by thevariable particle fraction of the plugs which will modify the locking between grains).
A similar decomposition of the global air flow rate qa can be performed in thebottom plug (taking this time the flowing grains as the moving reference frame). Afirst component of qa is the volume qabp of air per unit time and unit area draggedby the flowing grains:
qabp =q
cbp(1− cbp). (15)
This value qabp and the difference qarbp = qa − qabp are also plotted in figure 10 (opencircle and downward triangle symbols). The difference qarbp would be equal to qa if

334 Y. Bertho and others
0.25
0.10 0.15 0.20 0.25
q, q
r, q w
(m
s–1
)
q (m s–1)
0.10
0
0.20
0.15
0.05
(a)
1.5
0.10 0.15 0.20 0.25
u p, u
ap, u
b, u
ab (
m s
–1)
q (m s–1)
0.5
0
1.0
(b)
q
Figure 11. (a) Variation of grain superficial velocity qr(N) measured in the moving frame and ofcomponent qw(∆) corresponding to the global wave motion, as a function of the total superficialvelocity q (also displayed as a continuous line as a reference). (b) Variation of local grain velocityrelative to reference frame of velocity vw for air (index a) and grains in plugs (uap( e) and up(•))and at the bottom of bubbles (uab(∆)) and ub(N)) as a function of grain superficial velocity q.
the air had no relative motion with respect to the grains in the bottom plug. Thisis indeed the case at low flow rates (q < 0.14 m s−1) for which the bottom plug islong (lbp > 200 mm from figure 9) and compact (cbp > 55% from figure 8). At higherflow rates both the particle fraction and lbp decrease so that the relative motion ofthe air and the grains is no longer negligible: as can be seen in figure 10, the globalflow rate qa is then markedly higher than qabp due to the downwards air flow inducedby the pressure gradient through the bottom plug (these permeation components areestimated below).
The previous discussion has demonstrated that the density-wave flows can beseparated into a component representing passive transport of the air and the grainsat the wave velocity vw and components corresponding to their relative motion with

Powder flow down a vertical pipe 335
4000
3000
2000
1000
0
0 250 500 1000z (mm)
P(P
a)
Figure 12. Pressure variations as a function of distance along the tube for different superficialgrain velocities: N, q = 0.2 m s−1; •, q = 0.19 m s−1; ∗, q = 0.16 m s−1; ⊗, q = 0.35 m s−1; �,q = 0.135 m s−1. Dotted lines correspond to linear regressions over the data and to assumedvariations in the bottom part of the tube.
respect to the plugs–bubbles sequence. The relative air and grain flow rates in thismoving frame are almost constant with q as well as the mean length of the plug–bubble pairs: this leads to the approximate picture of a flow with roughly constantcharacteristics in the moving frame but dragged along at the velocity vw varying withq. In order to obtain a more precise picture the pressure gradient distribution willnow be investigated: it plays a key role both in determining the permeation of the airthrough the dense parts and in the balance of the weight of the grains so that theyreach a constant velocity.
4.3. Pressure profiles and pressure gradient in the density-wave regime
Time-averaged pressures obtained from the four sensors are displayed in figure 12as a function of distance from the hopper, for different grain superficial velocities q.In contrast with the case of the free-fall regime (figure 3b), the pressure inside thetube is generally higher than the atmospheric pressure pat; even at the very top ofthe tube, it is of the order of pat. The pressure increases approximately linearly withdistance down the part of the pipe occupied by the sequence of plugs and bubbles.Inside the bottom plug, the flow is steady: the particle fraction and air and grainvelocities can then be assumed to be constant with both distance and time so that thepressure gradient is also constant with distance. Pressure decreases linearly, therefore,along the bottom plug down to atmospheric pressure at the outlet (see dashed lines).A data point fully compatible with this hypothesis is obtained for q = 0.35 m s−1 onthe pressure port located at z = 950 mm (figure 12) which at this flow rate is locatedinside the bottom plug (for other flow rates, all pressure ports are inside the waveregion).
Finally, one observes that the pressure drop across the packed grains in the hopperis small compared to that across the bottom plug (the pressure at the top of the tubeis close to atmospheric pressure). This is due to the fact that, in the hopper, pressuregradients are localized over a distance of a few mm from the outlet due to its conicalshape while the bottom plug is several cm long and of constant, small, diameter. Thepressure profile measurements demonstrate therefore the important contribution of
336 Y. Bertho and others
15000
10000
5000
0
0.10 0.15 0.20 0.25q (m s–1)
∂p∂z
(Pa m–1)
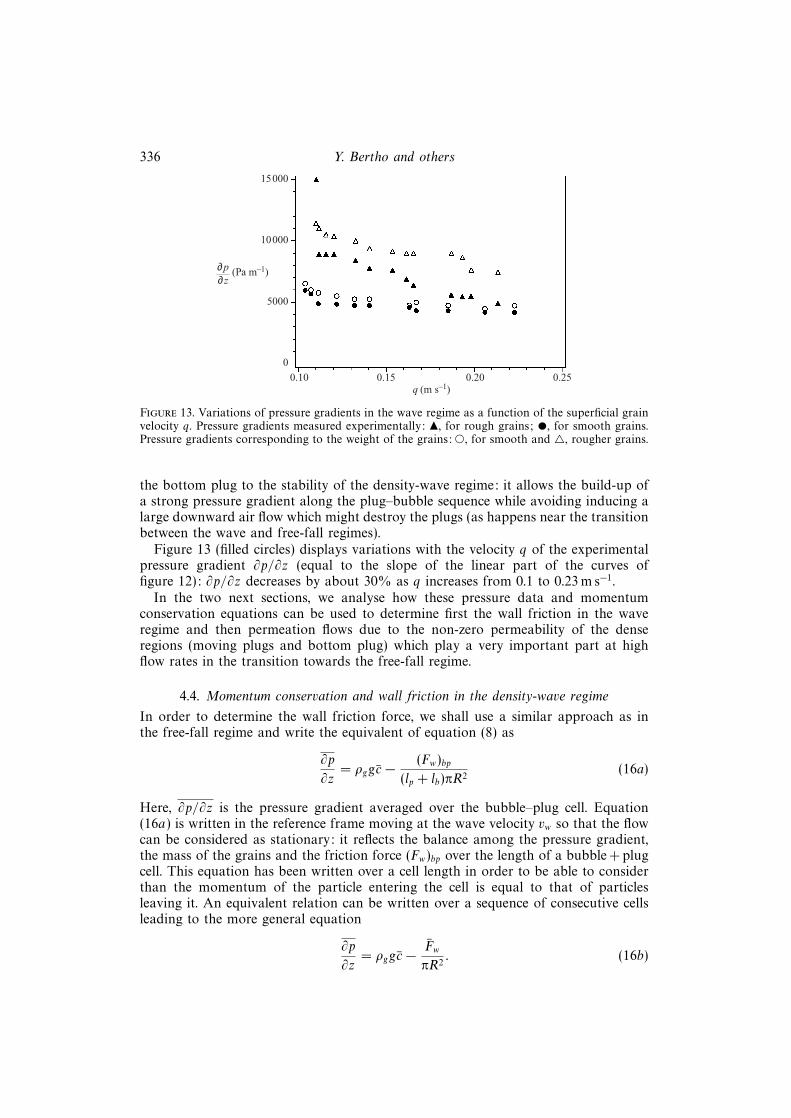
Figure 13. Variations of pressure gradients in the wave regime as a function of the superficial grainvelocity q. Pressure gradients measured experimentally: N, for rough grains; •, for smooth grains.Pressure gradients corresponding to the weight of the grains: e, for smooth and 4, rougher grains.
the bottom plug to the stability of the density-wave regime: it allows the build-up ofa strong pressure gradient along the plug–bubble sequence while avoiding inducing alarge downward air flow which might destroy the plugs (as happens near the transitionbetween the wave and free-fall regimes).
Figure 13 (filled circles) displays variations with the velocity q of the experimentalpressure gradient ∂p/∂z (equal to the slope of the linear part of the curves offigure 12): ∂p/∂z decreases by about 30% as q increases from 0.1 to 0.23 m s−1.
In the two next sections, we analyse how these pressure data and momentumconservation equations can be used to determine first the wall friction in the waveregime and then permeation flows due to the non-zero permeability of the denseregions (moving plugs and bottom plug) which play a very important part at highflow rates in the transition towards the free-fall regime.
4.4. Momentum conservation and wall friction in the density-wave regime
In order to determine the wall friction force, we shall use a similar approach as inthe free-fall regime and write the equivalent of equation (8) as
∂p
∂z= ρggc− (Fw)bp
(lp + lb)πR2(16a)
Here, ∂p/∂z is the pressure gradient averaged over the bubble–plug cell. Equation(16a) is written in the reference frame moving at the wave velocity vw so that the flowcan be considered as stationary: it reflects the balance among the pressure gradient,the mass of the grains and the friction force (Fw)bp over the length of a bubble + plugcell. This equation has been written over a cell length in order to be able to considerthan the momentum of the particle entering the cell is equal to that of particlesleaving it. An equivalent relation can be written over a sequence of consecutive cellsleading to the more general equation
∂p
∂z= ρggc− Fw
πR2. (16b)

Powder flow down a vertical pipe 337
Here, Fw is the mean friction force per unit length – taken positive when orientedtowards the bottom. Equation (16b) will remain approximately valid even if thesequence is not exactly periodical provided the momentum difference between particlesleaving and entering at the end of the sequence is not too large. As in the free-fallregime, and since the air flow velocity is much lower than in this latter case, we shallconsider that the friction force of the air with the walls is negligible and that Fw ismostly due to the friction force of grains with the walls.
In order to estimate Fw we have plotted on figure 13 (open circles for smooth newbeads) variations of ρggc computed from the data of figure 8. At a given q, the weightρggc is barely lower than ∂p/∂z so that, taking into account the experimental errors,Fw should not be higher than 10% of the grain weight, i.e. certainly lower than inthe free-fall regime. We conclude that, for the corresponding set of smooth beads, themomentum balance largely results from an almost ‘hydrostatic’ equilibrium betweenthe weight of the grains and the pressure gradient. Since most of the mass of thegrains is localized in the plugs, we expect the pressure gradient also to be higher insidethe plugs than inside the bubbles. This low wall friction and the weak dependenceof the pressure gradient on the grain flow rate confirm the previous intuitive picturealready suggested at the end of § 4.2, namely that the flow in the moving referenceframe depends very little on the global grain flow rate q, which affects only the globaldrift of the plug–bubble sequence.
4.5. Permeation of air through the moving plugs
The permeation of air through the plugs is a key factor limiting the stability of thedensity-wave regime: it is driven by the pressure drop across the plugs (which islarge enough to balance most of their weight) and limited by their permeability. Ifthe particle fraction in the plugs decreases with q (as in figure 8) their permeabilityincreases: the flow rate necessary to build up a pressure gradient balancing the weightof the grains becomes too large and the transition towards the free-fall regime occurs.The relative air–grain velocity of the permeation flow is related to the pressure drop∆pp over the length of a plug by Darcy’s law:
(uap − up)(1− cp) = −K(cp)
η
∆pplp
(17)
in which K(cp) is the permeability of the plug, η is the viscosity of air and thefactor (1 − cp) is used to determine the superficial flow rate per unit area. As a first
approximation, one can estimate that ∆pp, is of the order of the pressure drop lpb∂p/∂zover the full cell (the friction forces should be concentrated in the plugs and mostof the grain mass which controls the term ρggc(z) is also localized there). Table 1lists ∆pp values obtained in this way using data from figures 9 and 13. Estimatinglp from the spatio-temporal diagrams then allows determination of an experimentalplug permeability value K(cp) by applying (17) and using values of cp, up and uapdisplayed above in figures 8 and 11(b). The corresponding values of K(cp) and lpare also in table 1 together with a theoretical estimate KCK of the plug permeabilityobtained from the classical Carman–Kozeny relation:
KCK =(1− c)3d2
180 c2, (18)
valid for packings of monodisperse spheres of particle fraction c and diameter d (d isequal to 175 µm and c is taken to be cp). The two values are in fair agreement, takinginto account the uncertainty in the values of the plug length lp and of the pressure

338 Y. Bertho and others
q (m s−1) ∆pp (Pa) lp (m) K (Darcy) KCK (Darcy)
0.104 295 0.01 25 300.107 260 0.01 39.5 37.50.111 215 0.01 60 630.121 213 0.01 33.5 770.132 168 0.01 90 850.140 181 0.01 38 1040.163 208 0.008 85 140
Table 1. Variations with the grain superficial velocity in the density-waves regime of the pressuredrop on the plugs, the plug length lp and the plug permeability as estimated from the experimentalresults (K) and from Carman–Kozeny’s formula using the measured plug porosity (KCK ).
drop ∆pp over the plug. No values are listed for larger flow rates (q > 0.16 m s−1): theuncertainties are indeed too large due to the increase of the pressure gradient in thebubbles compared to that in the plug and to the decrease of lp which becomes verydifficult to determine precisely. An important feature of the results of table 1 is thestrong increase (by a factor of 4) of the permeability with the grain flow rate q (thisincrease should be even greater at higher flow rates): this confirms that the increaseof the permeation of air through the plugs at high flow rates will result in a transitiontowards the free-fall regime.
4.6. Permeation of air through the bottom plug
The bottom plug observed in the present experiments also plays an important role.First, it must withstand a pressure difference equal and opposite to that built upalong the plug–bubble sequence. The corresponding force is, in this case, orientedin the same direction as the weight of the grains. The downwards resultant forcemust then be balanced by friction forces on the walls and on the constriction at thebottom of the tube (the complex geometry of the latter makes a direct evaluationdifficult). But the influence of the constriction should be felt only over a verticaldistance of the order of the Janssen length. Second, the finite permeability of thebottom plug reduces the downflow of air induced by this pressure difference: if thispermeability is too large and/or the bottom plug is too short, the velocity of air(and the wave propagation velocity) increases and the plugs–bubbles system finallydisintegrates. The relative flow rate qarbp of air through the moving grains due to thefinite permeability of the bottom plug is equal to qa − qabp. The experimental valueqarbp computed in this way is plotted in figure 10 and listed in table 2 as a functionof the grain superficial velocity q. As for the moving plugs, a theoretical value qtharbpof this relative flow rate can be obtained by estimating the permeability K(cbp) of thebottom plug through the Carman–Kozeny relation (18) using the measured value cbpof the particle fraction; qtharbp is then obtained by applying Darcy’s law to the bottomplug:
qtharbp =K(cbp)
η
∣∣∣∣∂p∂z∣∣∣∣ L− lbplbp
. (19)
Here the pressure difference has been taken equal and opposite to the global pressuredifference along the total length (L − lbp) of the wave section and ∂p/∂z is thepressure gradient in this region. Both the values of qtharbp and those of the permeabilityK(cbp) are listed in table 2. Both sets of values are of the same order of magnitudeup to q = 0.18 m s−1: deviations seem due to experimental uncertainties. The larger
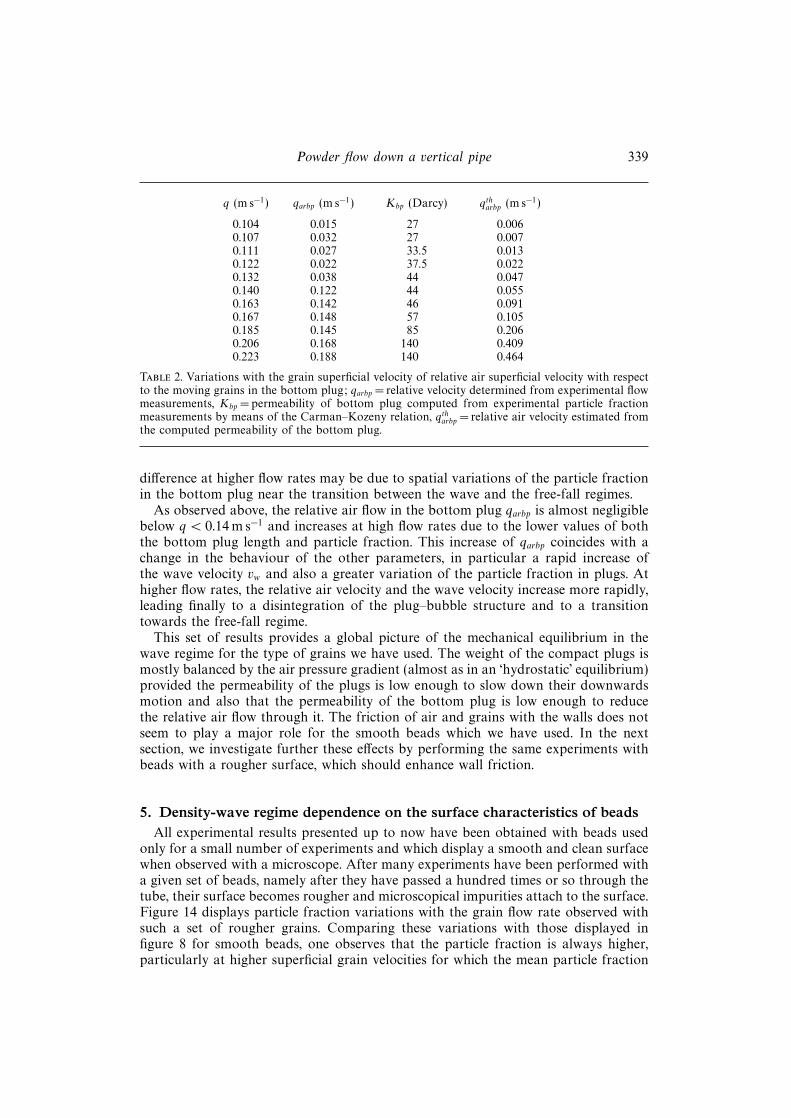
Powder flow down a vertical pipe 339
q (m s−1) qarbp (m s−1) Kbp (Darcy) qtharbp (m s−1)
0.104 0.015 27 0.0060.107 0.032 27 0.0070.111 0.027 33.5 0.0130.122 0.022 37.5 0.0220.132 0.038 44 0.0470.140 0.122 44 0.0550.163 0.142 46 0.0910.167 0.148 57 0.1050.185 0.145 85 0.2060.206 0.168 140 0.4090.223 0.188 140 0.464
Table 2. Variations with the grain superficial velocity of relative air superficial velocity with respectto the moving grains in the bottom plug; qarbp = relative velocity determined from experimental flowmeasurements, Kbp = permeability of bottom plug computed from experimental particle fractionmeasurements by means of the Carman–Kozeny relation, qtharbp = relative air velocity estimated fromthe computed permeability of the bottom plug.
difference at higher flow rates may be due to spatial variations of the particle fractionin the bottom plug near the transition between the wave and the free-fall regimes.
As observed above, the relative air flow in the bottom plug qarbp is almost negligiblebelow q < 0.14 m s−1 and increases at high flow rates due to the lower values of boththe bottom plug length and particle fraction. This increase of qarbp coincides with achange in the behaviour of the other parameters, in particular a rapid increase ofthe wave velocity vw and also a greater variation of the particle fraction in plugs. Athigher flow rates, the relative air velocity and the wave velocity increase more rapidly,leading finally to a disintegration of the plug–bubble structure and to a transitiontowards the free-fall regime.
This set of results provides a global picture of the mechanical equilibrium in thewave regime for the type of grains we have used. The weight of the compact plugs ismostly balanced by the air pressure gradient (almost as in an ‘hydrostatic’ equilibrium)provided the permeability of the plugs is low enough to slow down their downwardsmotion and also that the permeability of the bottom plug is low enough to reducethe relative air flow through it. The friction of air and grains with the walls does notseem to play a major role for the smooth beads which we have used. In the nextsection, we investigate further these effects by performing the same experiments withbeads with a rougher surface, which should enhance wall friction.
5. Density-wave regime dependence on the surface characteristics of beadsAll experimental results presented up to now have been obtained with beads used
only for a small number of experiments and which display a smooth and clean surfacewhen observed with a microscope. After many experiments have been performed witha given set of beads, namely after they have passed a hundred times or so through thetube, their surface becomes rougher and microscopical impurities attach to the surface.Figure 14 displays particle fraction variations with the grain flow rate observed withsuch a set of rougher grains. Comparing these variations with those displayed infigure 8 for smooth beads, one observes that the particle fraction is always higher,particularly at higher superficial grain velocities for which the mean particle fraction

340 Y. Bertho and others
60
50
40
30
20
10
00.10 0.15 0.20 0.25
c(%
)
q (m s–1)
Figure 14. Variations of the time-averaged particle fraction c(N), of particle fraction in plugs cp(•)and of minimum particle fraction cb(�) inside bubbles for rough grains in the wave regime as afunction of the superficial grain velocity q.
decreases much slower than in the previous case. The particle fraction in plugs isalso higher and is very close at low flow rates to the typical values (c = 63%) forstatic bead packings. It can also be seen in figure 6 that the wave velocity vw is lowerthan for smooth beads above q = 0.14 m s−1 and increases more linearly with q: thechange of regime above 0.15 observed for the smoother beads does not appear. Theseresults are confirmed by pressure gradient measurements displayed in figure 13. Thedifference between the measured pressure gradient and the term reflecting the weightof the beads is much higher than for smooth beads and represents up to 30–40% ofthe total gradient: this implies that the friction force Fw with the walls is increased inthe same proportion.
We conclude that increasing the roughness of the bead surface enhances, as ex-pected, the interaction between the grains and the walls; it also slows down signif-icantly the wave motion and increases the particle fraction in the plugs and in themean.
6. Oscillating-wave regime6.1. Experimental observations
At low grain superficial velocities near the transition towards the compact regime(typically 0.085 to 0.11 m s−1), the velocity of the plugs and of the bubbles is notalways constant but in some cases oscillates around a non-zero drift velocity. Sucheffects are particularly observed for grains with a rough surface used for a long timein experiments. Figure 15(a) displays pressure variations with time measured at adistance of 450 mm for q = 0.087 m s−1. The global amplitude of the oscillations isof the order of 10 000 Pa, which is very large and even higher than the mean value.The frequency spectrum of the pressure is displayed in figure 15(b): the first peakrepresents the oscillation frequency of order 5.7 Hz which is almost independent ofthe grain flow rate.
Physically, these oscillations may be modelled as vibrations of a sequence of masses(representing the plugs) connected by elastic springs (representing the bubbles): theirlow frequency results from the large density of the compact plugs and the high

Powder flow down a vertical pipe 341
0
–7200
0
–5
–10
0 5 10 15 20Frequency (Hz)
0 0.5 1.0 1.5 2.0Time (s)
(a)
(b)
Pre
ssur
e (P
a)lo
g (P
(f))
Figure 15. (a) Time variations of pressure in an oscillating density-wave flow (q = 0.087 m s−1) ata distance of 450 mm below the hopper. (b) Logarithm of power spectrum of pressure variations inthe same experiment.
compressibility of the low-particle-fraction bubbles. An alternative point of view is toconsider the system as a two-phase flow (similar to air–water for instance) in whichboth the mean density and the compressibility are high: they are characterized bya very small sound velocity of the order of a few m s−1 resulting in low resonancefrequencies. There are two main damping mechanisms: wall friction, mostly in theregion of the plugs, and viscous dissipation, due to the flow of air through the plugs.
6.2. Simplified set of equations describing the oscillating-wave regime
We model these oscillations by adding to the previous equations time-dependentterms corresponding to variations of the length lb of the bubbles, the plug velocityvp and pressure (the plug length and particle fraction are taken constant). Thesevariables vary from one plug + bubble cell (denoted by an index j) to the next andare assumed to oscillate about a mean value corresponding to the constant-velocityregime discussed above (for instance the wave propagation velocity is still vw). Eachparameter is then the sum of a constant part (no index) and of a periodic oscillatorycomponent (index 1), assumed to be small enough to neglect second-order terms. Allconservation equations are written in the reference frame moving at velocity vw . Thevolume conservation of grains and of air between sections of two successive plugs isthen
(cb(lb)− cp)dl1bjdt
= q1j − q1
j+1. (20)
and
(cp − cb(lb))dl1bjdt
= q1aj − q1
aj+1 − χlb(1− cb)dp1
j
dt(21)

342 Y. Bertho and others
(the superficial velocities q and qa are defined inside the plugs). The second equationincludes a term equal and opposite to the variation of the volume of grains and aterm due to the compressibility: χ = −1/v∂v/∂p of air. The particle fraction cb(lb) isthe particle fraction at the bottom of the bubbles (the minimum value) and cb is theaverage particle fraction in the bubbles.
The non-stationary part of the equation of motion of the plugs can be written as
ρglpdq1
j
dt= p1
j−1 − p1j −
F1wj
πR2, (22)
where F1wj is the varying part of the friction force (assumed localized on the plug) in
cell j. A final equation relates, through Darcy’s law, time-varying pressure differencesacross a plug to the relative velocity of air and grains inside it:
q1aj − 1− cp
cpq1j =
K(cp)
η
p1j−1 − p1
j
lp. (23)
Let us consider a progressive sine-wave perturbation of angular frequency ω andwave vector k: the length of bubble j (the index starts at 1 for the topmost plug andthe bubble just below) and the pressure inside it satisfy
l1bj(t) = l1b exp[i(ωt− jk(lp + lb))], (24)
p1j (t) = p1 exp[i(ωt− jk(lp + lb))]. (25)
The time-varying components q1j (t) and q1
aj(t)of the air and gas flow rates have similar
expressions with complex amplitudes q1 and q1a . Substituting these expressions into
(20–24) and neglecting the friction term F1w yields a system of linear equations which
has a solution if
−ω2 +4iωK(cp) sin2( 1
2k(lp + lb))
ηχlplb(1− cb) +4 sin2( 1
2k(lp + lb))
ρgχlplbcp(1− cb) = 0. (26)
This dispersion equation includes the damping effect of viscous dissipation of gasflowing through the plugs (middle term). If this term is neglected, (26) closely resemblesclassical dispersion relations for mass–spring chains. In the limit of long wavelengths(low wave vectors such that k(lp + lb) � 1), ω/k tends towards a constant limitrepresenting the propagation velocity cosc of low-frequency oscillations of the plugs:
cosc =ω
k=
lp + lb√ρgχlplbcp(1− cb) . (27)
This velocity is of the order of the sound velocity 1/√χρg corresponding to an
hypothetical fluid with the compressibility χ of the air and the density ρg of glass.Other factors are geometrical terms taking into account the relative volumes occupiedby air and grains.
6.3. Experimental orders of magnitude of the wave oscillation parameters
Using experimental values from previous sections (lb = 0.02 m, lp = 0.01 m), equation(27) provides the estimate cosc = 23 m s−1. The experimental oscillation frequencyfosc = 5.7 Hz corresponds therefore to a wavelength λosc = cosc/fosc = 4.1 m. Theoscillations observed can be considered as stationary resonant modes excited byvelocity fluctations at the outlet of the hopper: the hopper outlet (which communicateswith the outside atmospheric pressure through the low-hydraulic-impedance grain

Powder flow down a vertical pipe 343
packing inside the hopper) should be a pressure node. On the other hand, one expectsa maximum of the pressure oscillations at the bottom plug (there the displacementamplitudes should be minimal). The lowest-frequency resonance mode should thencorrespond to a length of the plugs–bubbles sequence equal to λosc/4 = 1 m. The actuallength is of order 0.8 m, so the agreement is reasonable in view of the crudeness ofthe approximations involved.
In the low-frequency limit, the imaginary term in (26) which is partly responsible forthe damping of the oscillations is found equal to iω3K(cp)ρgcp/η. It may be comparedto the two other terms which are of the order of ω2. The experimental values yield aratio of the order of 0.1. This term therefore contributes significantly to the dampingof the oscillations.
A second dissipative mechanism is wall friction. The ratio of the wall friction termF1wj/πR
2 in equation (22) and the acceleration term ρglpdq1j /dt is of order
F1wj
πρgcpR2lpg
g
ωu1=
F1wj
πρgcpR2lpg
g
ω2δz1:
the first factor corresponds to the ratio between the oscillating component of thefriction force and the weight of the plugs, δz1 is the typical amplitude of the plugoscillations and u1 the corresponding velocity. For an amplitude of a few centimetres,the second factor is of order unity so that the ratio of the fluctuations of the frictionforce to the weight of the plugs characterizes the attenuation. In some cases, theinstantaneous friction force (constant + oscillating components) is large enough toinduce a complete blockage of the flow (Aider et al. 1999). A periodic stick-slip-likemotion of the wave system is then observed and can be considered as a high-amplitudelimit of the oscillating-wave regime.
7. ConclusionIn this paper, we have shown that the complex nature of the various granular
flow regimes in a vertical tube can be analysed in detail experimentally by combiningglobal measurements (air and grain flow rates, mean pressure gradients and averageparticle fractions) with local information such as spatio-temporal diagrams and localparticle fraction variations. Combined with simple mass and momentum conservationequations, these measurements enable one to determine important parameters, difficultto measure directly experimentally, such as the wall friction or the permeation of airthrough dense regions. The experiments have been realized in a tube of small diameterwhich allows one to observe conveniently a variety of flow regimes. The same approachmight however be applied to other flow geometries and flow regimes.
In the stationary free-fall regime, particles accelerate under gravity until their weightis balanced by friction forces with the air and with the walls; at the same time, theparticle fraction decreases with distance to ensure mass conservation. Friction onthe walls can be determined without further assumptions by comparing the particlefraction and the pressure gradient at positions where the terminal velocity has beenreached (the wall friction is found to be of the order of 15% of the grain weight inour experimental set-up). The full pressure and particle fraction profiles and the flowdistribution in the various parts of the system can then be determined quantitativelyat given air and grain flow rates: this requires only this wall friction value and asimple model without adjustable parameters for the friction between air and theparticles.

344 Y. Bertho and others
In the steady wave regime, the upper part of the flow is occupied by a sequenceof plugs and bubbles moving down at a constant velocity: the weight of the plugs ismostly balanced by an adverse pression gradient and, for a smaller part, by frictionof the grains on the tube walls. These friction forces represent only 10% of the weightof the grains for beads with a clean, smooth surface and up to 20–30% for rougherones. In contrast with the free-fall case, pressure is higher inside than outside the tubeand the bottom part of the tube is occupied by a long, compact plug where pressuredecreases linearly towards atmospheric pressure at the outlet. Both the permeabilityof the bottom plug and that of the moving ones must be sufficiently low to limit thedownflow of air which, if it is too large, accelerates the motion of the waves and leadsto their disintegration. Overall, and particularly when wall friction is low, densitywaves appear as the superposition of a global drift of the plug–bubble sequenceand of a relative flow of grains with respect to the plugs of characteristics nearlyindependent of the global flow.
Combining measurements of the grain and air flow rates with spatio-temporaldiagrams and particle fraction and pressure profiles allowed an estimation of particleand gas velocities in the various regions of the flow. Other parameters difficult tomeasure directly, such as the permeability of the moving or bottom plugs and the wallfriction, could also be determined by using these measurements as inputs for simplemass and momentum conservation equations. In simple cases, the full pressure andparticle fraction profiles could be determined through simple additional hypotheses.A similar approach was used in a simple case of unsteady flow (the oscillating-waveregime) to predict the characteristic oscillation frequency.
Several problems remain to be solved, however, before a full understanding ofthese flows is achieved. First, a theory predicting quantitatively the lengths of theplugs and the bubbles still needs to be established (the size of the moving plugsseems to be related mainly to the tube diameter). Second, we assumed throughoutthe paper that the concentration and the velocity of particles is uniform across theflow section. Significant three-dimensional effects are however to be expected in somecases: for instance grains might tend to concentrate in the centre of the tube insidethe bubble regions which would induce a recirculation in the air flow. Indications ofsuch effects have been observed on close-up video recordings of flows in the density-wave regime: grains seemed to concentrate on one side of the tube section insidethe ‘bubbles’, which might be due to a residual tilt of the tube. Recent theoretical(Sinclair & Jackson 1989), Ocone, Sundaresan & Jackson 1993) and experimental(Srivastava et al. 1998) studies have analysed these segregation effects in verticaland inclined pipes: they predict significant variations of the particle concentration inthe radial direction, even for vertical tubes. However, more information, particularlyat the local scale, would be needed before attempting a quantitative comparisonwith these models. A third issue is the dependence of the flow regime on the grainshape and size and on the characteristics of their surface. Some preliminary re-sults reported in § 5 have demonstrated the relevance of these properties. Finally,other flow regimes such as an intermittent compact flow also provide challengingquestions.
We thank G. Chauvin, C. Saurine, O. Brouard and D. Vallet for their help in therealization of the experimental set-up and of the capacitance sensors, N. Sommierfor her valuable contribution to the development of the capacitive particle fractionmeasurement and of the spatio-temporal diagrams techniques and V. Terminassianfor his participation in the early phase of the experiments.

Powder flow down a vertical pipe 345
REFERENCES
Aider, J. L., Sommier, N., Raafat, T. & Hulin, J.-P. 1999 Experimental study of a granular flowin a vertical pipe: a spatio-temporal analysis. Phys. Rev. E. 59, 778–786.
Behringer, R. P. & Jenkins, J. T. (Eds.) 1997 Proc. 3rd Intl Conf. on Powders and Grains. A. A.Balkema.
Chen, Y. M., Rangachari, S. & Jackson, R. 1984 A theoretical and experimental investigation offlow in a vertical standpipe. Ind. Engng Chem. Fundam. 23, 354–370.
Duran, J. 1997 Sables, Poudres et Grains. Editions Eyrolles Sciences.
Ginestra, J. C., Rangachari, S. & Jackson, R. 1980 A one-dimensional theory of flow in a verticalstandpipe. Powder Techn. 27, 69–84.
Jackson, R. 2000 The Dynamics of Fluidized Particles, Chap. 7. Cambridge University Press.
Jaeger, H. M. & Nagel, S. R. 1992 Physics of the granular state. Science 255, 1523–1531.
Lee, J. 1994 Density-waves in the flows of granular media. Phys. Rev. 49, 281–298.
Lee, J. & Leibig, M. 1994 Density-waves in granular flow: a kinetic wave approach. J. Phys. I(Paris) 4, 507–514.
Leibig, M. 1994 Pattern-formation characteristics of interacting kinematic waves. Phys. Rev. E 49,184–191.
Le Pennec, T., Ammi, M., Messager, J.-C., Bideau, D. & Garnier, J. 1995 Effect of gravity onmass flow rate in an hour glass. Powder Technol. 85, 279–281.
Le Pennec, T., Maløy, K. J., Flekkøy, E. G., Messager J.-C. & Ammi, M. 1998 Silo hiccups:dynamic effects of dilatancy in granular flow. Phys. Fluids 10, 3072–3079.
Le Pennec, T., Maløy, K. J., Hansen, A., Ammi, M., Bideau, D. & Wu, X. L. 1996 Ticking hourglasses: experimental analysis of intermittent flow. Phys. Rev. E 53, 2257–2264.
Leung, L. S. & Jones, P. J. 1978 Flow of gas–solid mixtures in standpipes, a review. Powder Technol.20, 145–160.
Lighthill, M. J. & Whitham, G. B. 1955 On kinematic waves: I. Flood movement in long rivers,II. A theory of traffic flow on long crowded roads. Proc. R. Soc. Lond. A 229, 281–316 and317–345.
Mountziaris, T. J. & R. Jackson, R. 1990 The effects of aeration on the gravity flow of particlesand gas in vertical standpipes. Chem. Engng Sci. 46, 381–407.
Musha, T. & Higuichi, H. 1976 The (1/f) fluctuation of a traffic current on an express way, JapanJ. Appl. Phys. 15, 1271.
Nott, P. & Jackson, R. 1992 Frictional-collisional equations of motion for granular materials andtheir application to flow in aerated chutes, J. Fluid Mech. 241, 125–144.
Ocone, R., Sundaresan, S. & Jackson, R. 1993 Gas–particle flow in a duct of arbitrary inclinationwith particle–particle interactions. AIChE J. 39, 1261–1271.
Olson, R. M. 1970 Essential of Engineering Fluid Mechanics, 2nd edn. London: InternationalTextbook Co.
Peng, G. & Herrmann, H. J. 1994 Density-waves of granular flow in a pipe using lattice-gasautomata. Phys. Rev. E 49, R1796–R1799.
Poschel, T. 1994 Recurrent clogging and density-waves in granular material flowing through anarrow pipe. J. Phys. I (Paris) 4, 499–506.
Raafat, T., Hulin, J.-P. & Herrmann, H. 1996 Density-waves in dry granular media falling througha vertical pipe. Phys. Rev. E 53, 4345–4350.
Reydellet G., Rioual, F. & Clement, E. 2000 Granular hydrodynamics and density-wave regimesin a vertical chute experiment. Europhys Lett. 51, 27–33.
Richardson, S. F. & Zaki, W. N. 1954 Sedimentation and fluidisation: Part I. Trans. Inst. Chem.Engrs 32, 33–53.
Savage, S. B. 1979 Gravity flow of cohesionless granular materials in chutes and channels, J. FluidMech. 92, 53–96.
Sinclair J. L. & Jackson R. 1989 Gas–particle flow in a vertical pipe with particle–particleinteractions. AIChE J. 35, 1472–1486.
Srivastava, A., Agrawal, K., Sundaresan, S., Karri, S. B. R. & Knowlton, T. M. 1998 Dynamicsof gas–particle flow in circulating fluidized beds. Powder Technol. 100, 173–182.
Wang C. H., Jackson R. & Sundaresan S. 1997 Instabilities of fully developed rapid flow of agranular material in a channel. J. Fluid Mech. 342, 179–197.


![Neutron Discrete Velocity Boltzmann Equation and …radiative heat transfer [30,31], multi-phase flow [32], porous flow [33], thermal channel flow [34], complex micro flow [35,36],](https://static.fdocuments.net/doc/165x107/5fdf780d892f9768791d4093/neutron-discrete-velocity-boltzmann-equation-and-radiative-heat-transfer-3031.jpg)