Poverty reduction strategy _by dr malik khalid mehmood ph_d
427
Pakistan: Poverty Reduction Strategy By Dr Malik Khalid Mehmood PhD Chief Technical Adviser This paper was prepared by Dr Malik Khalid Mehmood based on the information available at the time it was completed on February 19, 2009. The views expressed in this document are those of the author and staff team and do not necessarily reflect the views of the government of Pakistan or the Executive Board of the IMF. The policy of publication of staff reports and other documents by the IMF allows for the deletion of market-sensitive information. International Monetary Fund ● Publication Services 700 19th Street, N.W. ● Washington, D.C. 20431 International Monetary Fund Washington, D.C.
-
Upload
malik-khalid-mehmood -
Category
Documents
-
view
1.398 -
download
1
Transcript of Poverty reduction strategy _by dr malik khalid mehmood ph_d
Pakistan: Poverty Reduction Strategy By Dr Malik Khalid Mehmood PhD
Chief Technical Adviser
This paper was prepared by Dr Malik Khalid Mehmood based on the information available at the time it was
completed on February 19, 2009. The views expressed in this document are those of the author and staff team
and do not necessarily reflect the views of the government of Pakistan or the Executive Board of the IMF.
The policy of publication of staff reports and other documents by the IMF allows for the deletion of market-sensitive information.
International Monetary Fund ● Publication Services 700 19th Street, N.W. ● Washington, D.C. 20431
International Monetary Fund
Washington, D.C.
Poverty Reduction Strategy Paper
(PRSP) - II
Government of Pakistan
Finance Division

FOREWORD
ii

ACKNOWLEDGEMENTS
iii
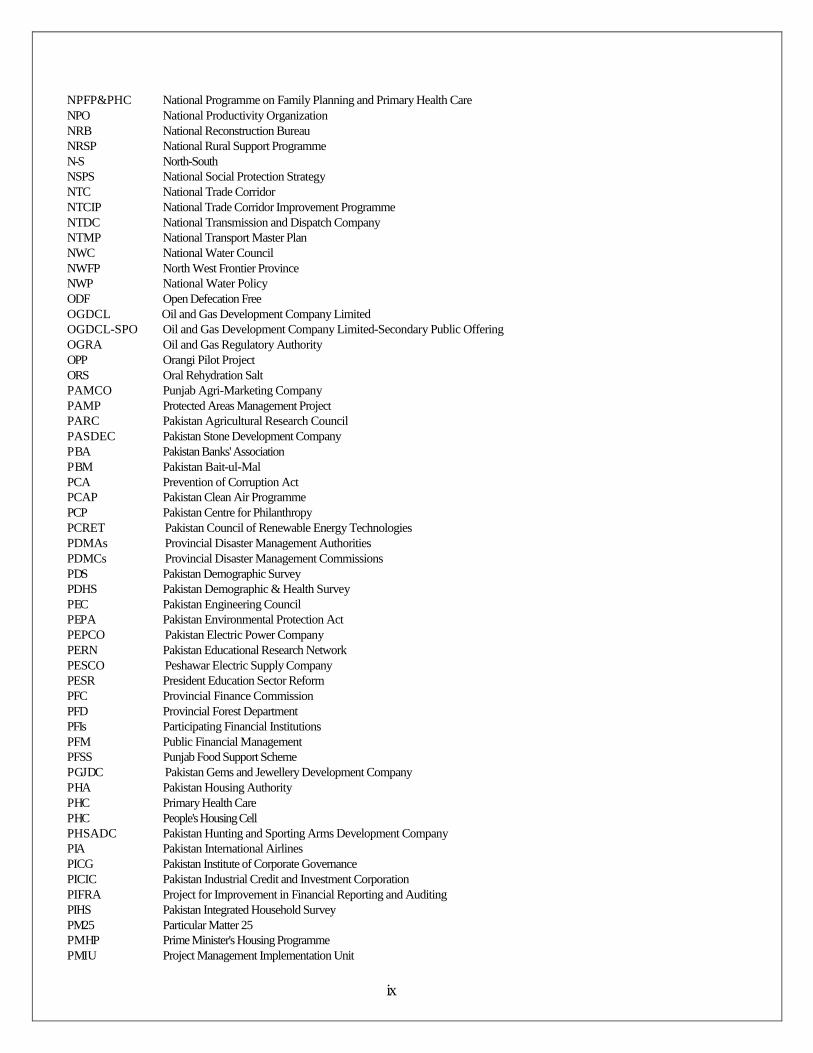
LIST OF ABBREVIATIONS AND ACRONYMS
AAOIFI ACP ADB ADP AEDB AHAN AJK ANC API APO ASF ATMs ATOM BCC BCG BCO B DS BHUs BISP B MR BOD B OT s B-PfA BTU Cab. Div. CAD CAM CCBs CCP CCSSC CCT CDC CDNS CDWA CDWI CDWP CED CEDAW CFIs CFCs CFC CFS CGA CGE CIET CIDA CIRC CLIS CLTS CMP CNG COT CPAR CPPA
Accounting and Auditing Organization for Islamic Financial Institutions Automated Clearance Procedures Asian Development Bank Annual Development Plan Alternative Energy Development Board Aik Hunar Aik Nagar Azad Jammu Kashmir Anti Natal Care Agricultural Policy Institute Asian Productivity Organization Agribusiness Support Fund Automated Teller Machines Activity to Output Based Monitoring Budget Call Circular Bacille Calmette-Guerin Banking Companies Ordinance Business Development Services Basic Health Units Benazir Income Support Programme Balancing, Modernization and Replacement Burden Of Disease Build Operate and Transfers Beijing Platform for Action British Thermal Unit Cabinet Division Computer Assisted Design Computer Assisted Manufacturing Citizens Community Boards Competition Commission of Pakistan Cabinet Committee for Social Sector Coordination Conditional Cash Transfer Central Depositary Company Central Directorate of National Saving Clean Drinking Water for All Clean Drinking Water Initiative Central Development Working Party Central Excise Duty Convention on Elimination of all form of Discrimination Against Women Commercial Financial Institutions Common Facility Centres Chloro-Flouro-Carbon Continuous Funding System Controller General of Accounts Computable General Equilibrium Community Information, Empowerment and Transparency Canadian International Development Agency Corporate & Industrial Restructuring Corporation Crop Loan Insurance Scheme Community Led Total Sanitation Crop Maximization Project Compressed Natural Gas Carry-Over Trade Country Procurement Assessment Report Central Power Purchase Agency
iv
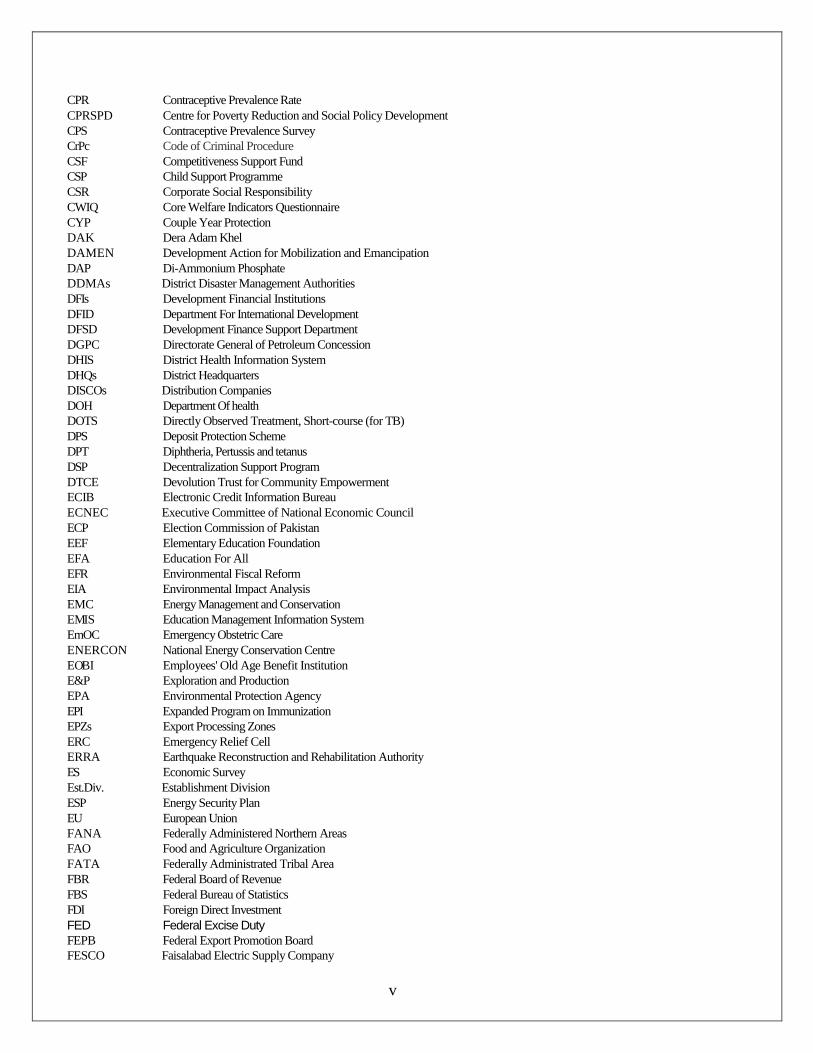
CPR CPRSPD CPS CrPc CSF CSP CSR CWIQ CYP DAK DAMEN DAP DDMAs DFIs DFID DFSD DGPC DHIS DHQs DISCOs DOH DOTS DPS DPT DSP DTCE ECIB ECNEC ECP EEF EFA EFR EIA EMC E MI S EmOC ENERCON E OB I E&P EPA EPI EPZs ERC ERRA ES Est.Div. ESP EU FANA FAO FATA FBR FBS FDI FED FEPB FESCO
Contraceptive Prevalence Rate Centre for Poverty Reduction and Social Policy Development Contraceptive Prevalence Survey Code of Criminal Procedure Competitiveness Support Fund Child Support Programme Corporate Social Responsibility Core Welfare Indicators Questionnaire Couple Year Protection Dera Adam Khel Development Action for Mobilization and Emancipation Di-Ammonium Phosphate District Disaster Management Authorities Development Financial Institutions Department For International Development Development Finance Support Department Directorate General of Petroleum Concession District Health Information System District Headquarters Distribution Companies Department Of health Directly Observed Treatment, Short-course (for TB) Deposit Protection Scheme Diphtheria, Pertussis and tetanus Decentralization Support Program Devolution Trust for Community Empowerment Electronic Credit Information Bureau Executive Committee of National Economic Council Election Commission of Pakistan Elementary Education Foundation Education For All Environmental Fiscal Reform Environmental Impact Analysis Energy Management and Conservation Education Management Information System Emergency Obstetric Care National Energy Conservation Centre Employees' Old Age Benefit Institution Exploration and Production Environmental Protection Agency Expanded Program on Immunization Export Processing Zones Emergency Relief Cell Earthquake Reconstruction and Rehabilitation Authority Economic Survey Establishment Division Energy Security Plan European Union Federally Administered Northern Areas Food and Agriculture Organization Federally Administrated Tribal Area Federal Board of Revenue Federal Bureau of Statistics Foreign Direct Investment Federal Excise Duty Federal Export Promotion Board Faisalabad Electric Supply Company
v
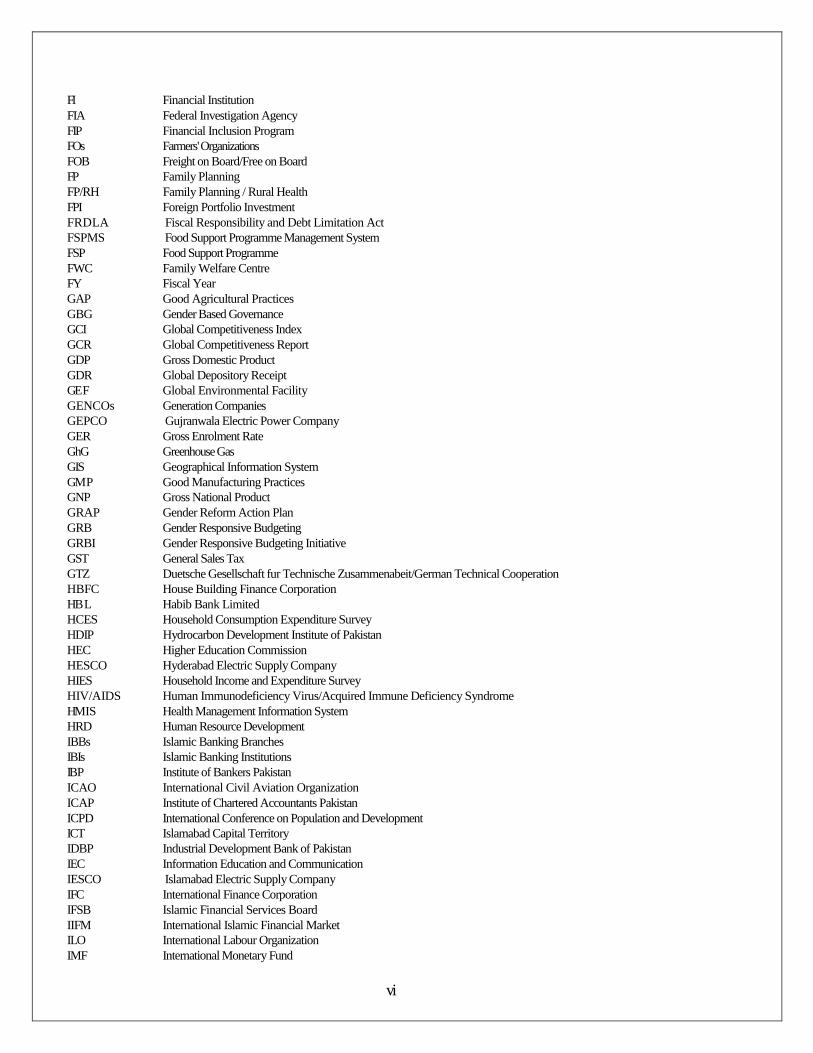
FI FIA FIP FOs FOB FP FP/RH FPI FRDLA FSPMS FSP FWC FY GAP GBG GCI GCR GDP GDR GE F GENCOs GEPCO GER GhG GIS GM P GNP GRAP GRB GRBI GST GTZ HBFC HB L HCES HDIP HEC HESCO HIES HIV/AIDS HM I S HRD IBBs IBIs IB P ICAO ICAP ICPD ICT IDBP IEC IESCO IFC IFSB IIFM ILO IMF
Financial Institution Federal Investigation Agency Financial Inclusion Program Farmers' Organizations Freight on Board/Free on Board Family Planning Family Planning / Rural Health Foreign Portfolio Investment Fiscal Responsibility and Debt Limitation Act Food Support Programme Management System Food Support Programme Family Welfare Centre Fiscal Year Good Agricultural Practices Gender Based Governance Global Competitiveness Index Global Competitiveness Report Gross Domestic Product Global Depository Receipt Global Environmental Facility Generation Companies Gujranwala Electric Power Company Gross Enrolment Rate Greenhouse Gas Geographical Information System Good Manufacturing Practices Gross National Product Gender Reform Action Plan Gender Responsive Budgeting Gender Responsive Budgeting Initiative General Sales Tax Duetsche Gesellschaft fur Technische Zusammenabeit/German Technical Cooperation House Building Finance Corporation Habib Bank Limited Household Consumption Expenditure Survey Hydrocarbon Development Institute of Pakistan Higher Education Commission Hyderabad Electric Supply Company Household Income and Expenditure Survey Human Immunodeficiency Virus/Acquired Immune Deficiency Syndrome Health Management Information System Human Resource Development Islamic Banking Branches Islamic Banking Institutions Institute of Bankers Pakistan International Civil Aviation Organization Institute of Chartered Accountants Pakistan International Conference on Population and Development Islamabad Capital Territory Industrial Development Bank of Pakistan Information Education and Communication Islamabad Electric Supply Company International Finance Corporation Islamic Financial Services Board International Islamic Financial Market International Labour Organization International Monetary Fund
vi
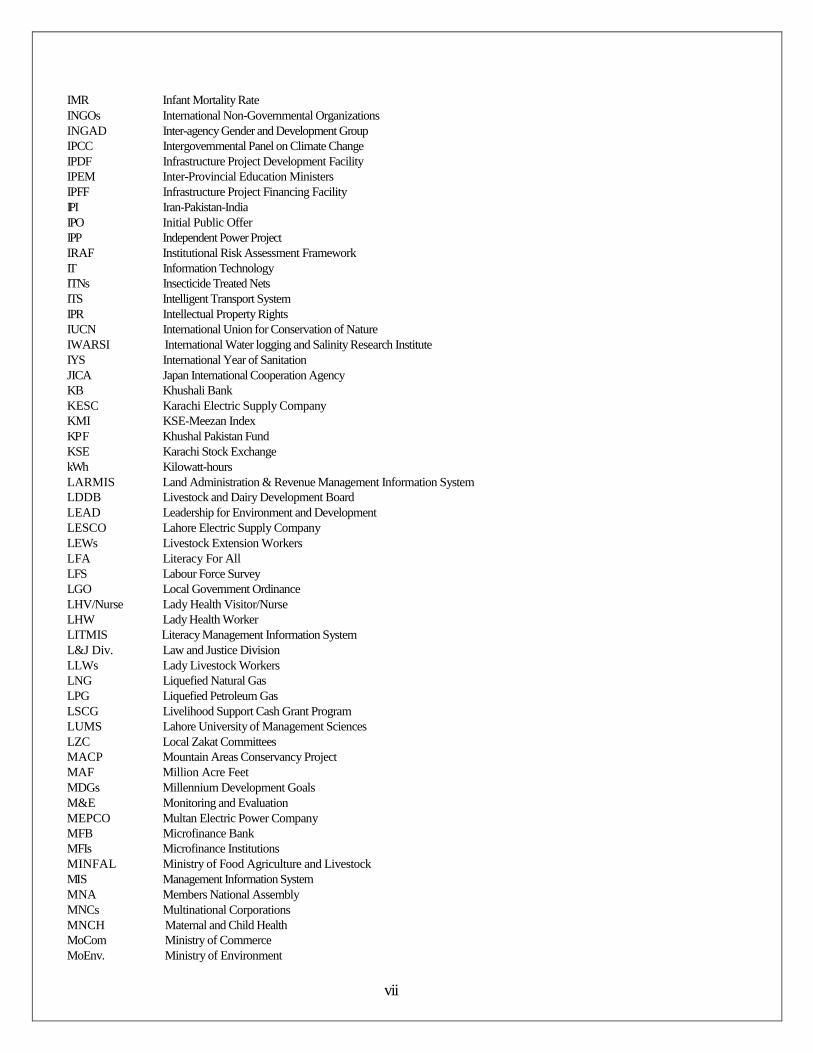
IMR INGOs INGAD IPCC IPDF IPEM IPFF IP I IPO IPP IRAF IT ITNs ITS IPR IUCN IWARSI IYS JICA KB KESC KMI KP F KSE kWh LARMIS LDDB LEAD LESCO LEWs LFA LFS LGO LHV/Nurse LHW LITMIS L&J Div. LLWs LNG LPG LSCG LUMS LZC MACP MAF MDGs M&E MEPCO MFB MFIs MINFAL MI S MNA MNCs MNCH MoCom MoEnv.
Infant Mortality Rate International Non-Governmental Organizations Inter-agency Gender and Development Group Intergovernmental Panel on Climate Change Infrastructure Project Development Facility Inter-Provincial Education Ministers Infrastructure Project Financing Facility Iran-Pakistan-India Initial Public Offer Independent Power Project Institutional Risk Assessment Framework Information Technology Insecticide Treated Nets Intelligent Transport System Intellectual Property Rights International Union for Conservation of Nature International Water logging and Salinity Research Institute International Year of Sanitation Japan International Cooperation Agency Khushali Bank Karachi Electric Supply Company KSE-Meezan Index Khushal Pakistan Fund Karachi Stock Exchange Kilowatt-hours Land Administration & Revenue Management Information System Livestock and Dairy Development Board Leadership for Environment and Development Lahore Electric Supply Company Livestock Extension Workers Literacy For All Labour Force Survey Local Government Ordinance Lady Health Visitor/Nurse Lady Health Worker Literacy Management Information System Law and Justice Division Lady Livestock Workers Liquefied Natural Gas Liquefied Petroleum Gas Livelihood Support Cash Grant Program Lahore University of Management Sciences Local Zakat Committees Mountain Areas Conservancy Project Million Acre Feet Millennium Development Goals Monitoring and Evaluation Multan Electric Power Company Microfinance Bank Microfinance Institutions Ministry of Food Agriculture and Livestock Management Information System Members National Assembly Multinational Corporations Maternal and Child Health Ministry of Commerce Ministry of Environment
vii
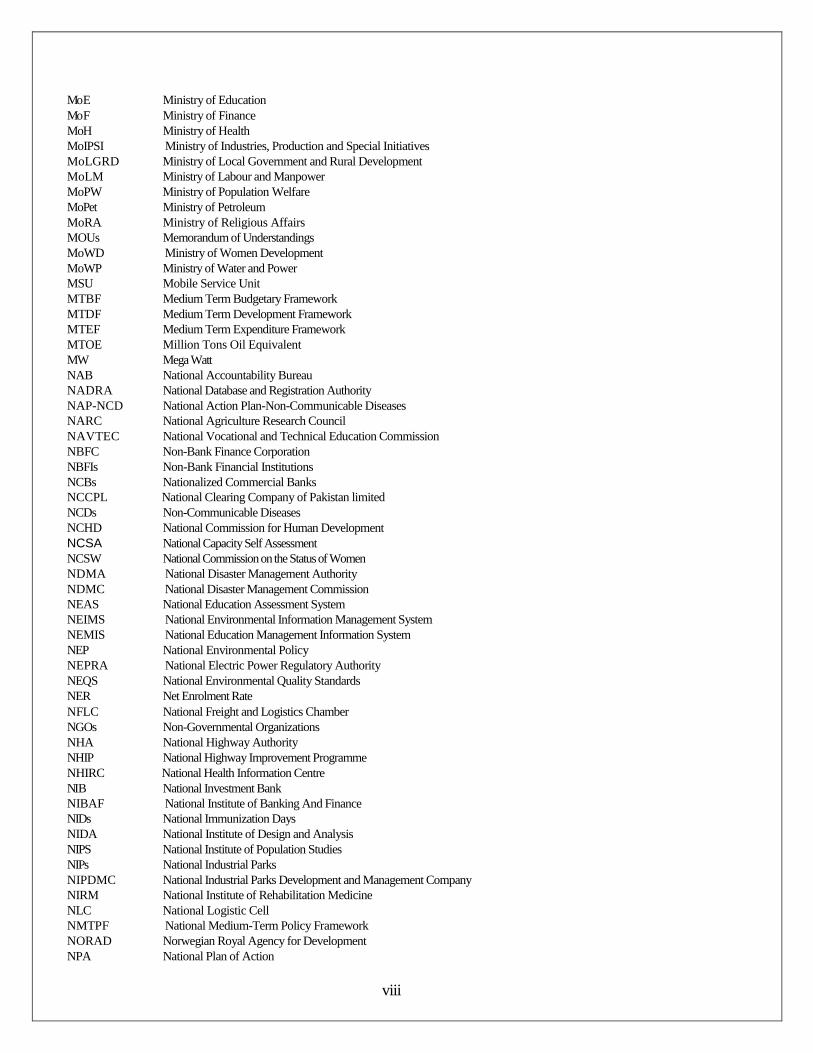
Mo E Mo F MoH MoIPSI MoLGRD MoLM MoPW MoPet MoRA MOUs MoWD MoWP MSU MTBF MTDF MTEF MTOE MW NAB NADRA NAP-NCD NARC NAVTEC NBFC NBFIs NCBs NCCPL NCDs NCHD NCSA NCSW NDMA NDMC NEAS NEIMS NEMIS NEP NEPRA NEQS NER NFLC NGOs NHA NHIP NHIRC NI B NIBAF NIDs NIDA NIPS NIPs NIPDMC NIRM NLC NMTPF NORAD NPA
Ministry of Education Ministry of Finance Ministry of Health Ministry of Industries, Production and Special Initiatives Ministry of Local Government and Rural Development Ministry of Labour and Manpower Ministry of Population Welfare Ministry of Petroleum Ministry of Religious Affairs Memorandum of Understandings Ministry of Women Development Ministry of Water and Power Mobile Service Unit Medium Term Budgetary Framework Medium Term Development Framework Medium Term Expenditure Framework Million Tons Oil Equivalent Mega Watt National Accountability Bureau National Database and Registration Authority National Action Plan-Non-Communicable Diseases National Agriculture Research Council National Vocational and Technical Education Commission Non-Bank Finance Corporation Non-Bank Financial Institutions Nationalized Commercial Banks National Clearing Company of Pakistan limited Non-Communicable Diseases National Commission for Human Development National Capacity Self Assessment National Commission on the Status of Women National Disaster Management Authority National Disaster Management Commission National Education Assessment System National Environmental Information Management System National Education Management Information System National Environmental Policy National Electric Power Regulatory Authority National Environmental Quality Standards Net Enrolment Rate National Freight and Logistics Chamber Non-Governmental Organizations National Highway Authority National Highway Improvement Programme National Health Information Centre National Investment Bank National Institute of Banking And Finance National Immunization Days National Institute of Design and Analysis National Institute of Population Studies National Industrial Parks National Industrial Parks Development and Management Company National Institute of Rehabilitation Medicine National Logistic Cell National Medium-Term Policy Framework Norwegian Royal Agency for Development National Plan of Action
viii
NPFP&PHC NPO NRB NRSP N-S NSPS NTC NTCIP NTDC NTMP NWC NWFP NWP ODF OGDCL OGDCL-SPO OGRA OPP ORS PAMCO PAMP PARC PASDEC P BA P BM PCA PCAP PCP PCRET PDMAs PDMCs P DS PDHS P EC P EP A PEPCO PERN PESCO PESR PFC PFD PFIs PFM PFSS P GJ DC P HA P HC P HC PHSADC P IA PICG PICIC PIFRA PIHS P M2 5 P M HP P MI U
National Programme on Family Planning and Primary Health Care National Productivity Organization National Reconstruction Bureau National Rural Support Programme North-South National Social Protection Strategy National Trade Corridor National Trade Corridor Improvement Programme National Transmission and Dispatch Company National Transport Master Plan National Water Council North West Frontier Province National Water Policy Open Defecation Free Oil and Gas Development Company Limited Oil and Gas Development Company Limited-Secondary Public Offering Oil and Gas Regulatory Authority Orangi Pilot Project Oral Rehydration Salt Punjab Agri-Marketing Company Protected Areas Management Project Pakistan Agricultural Research Council Pakistan Stone Development Company Pakistan Banks' Association Pakistan Bait-ul-Mal Prevention of Corruption Act Pakistan Clean Air Programme Pakistan Centre for Philanthropy Pakistan Council of Renewable Energy Technologies Provincial Disaster Management Authorities Provincial Disaster Management Commissions Pakistan Demographic Survey Pakistan Demographic & Health Survey Pakistan Engineering Council Pakistan Environmental Protection Act Pakistan Electric Power Company Pakistan Educational Research Network Peshawar Electric Supply Company President Education Sector Reform Provincial Finance Commission Provincial Forest Department Participating Financial Institutions Public Financial Management Punjab Food Support Scheme Pakistan Gems and Jewellery Development Company Pakistan Housing Authority Primary Health Care People's Housing Cell Pakistan Hunting and Sporting Arms Development Company Pakistan International Airlines Pakistan Institute of Corporate Governance Pakistan Industrial Credit and Investment Corporation Project for Improvement in Financial Reporting and Auditing Pakistan Integrated Household Survey Particular Matter 25 Prime Minister's Housing Programme Project Management Implementation Unit
ix
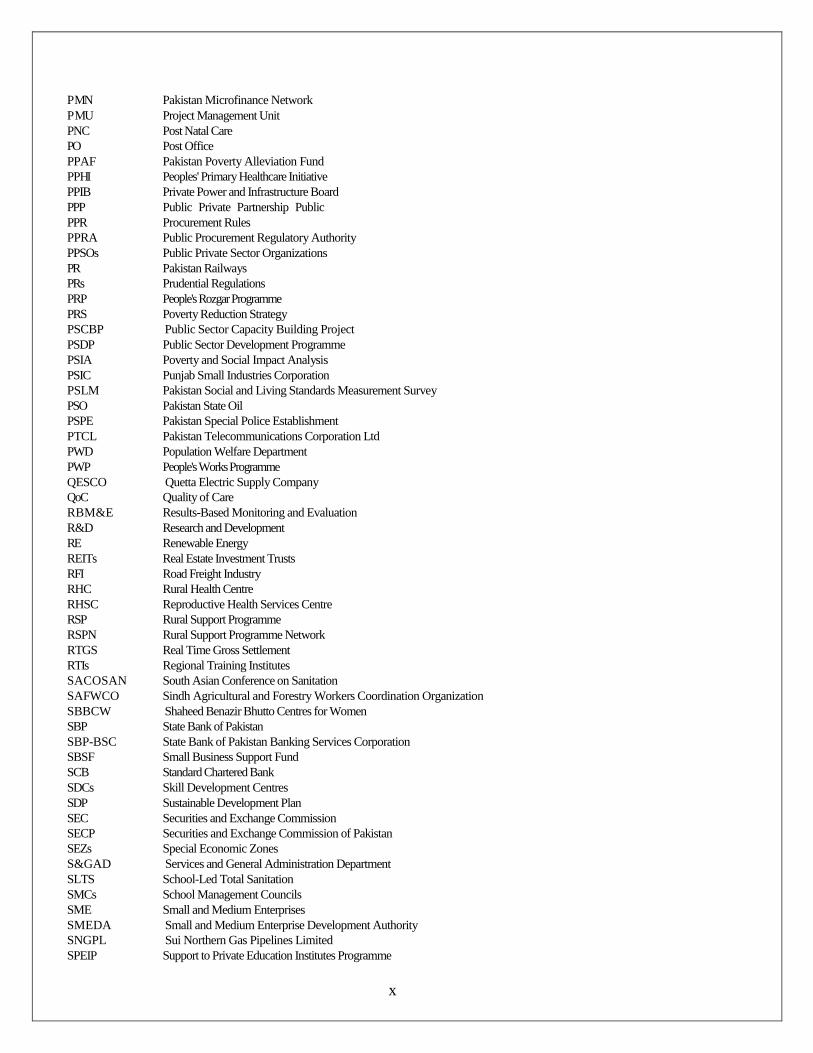
P MN P MU PNC PO PPAF P P HI PPIB PPP PPR PPRA PPSOs PR PRs PRP PRS PSCBP PSDP PSIA PSIC PSLM PSO PSPE PTCL PWD PWP QESCO QoC RBM&E R&D RE REITs RFI RHC RHSC RSP RSPN RTGS RTIs SACOSAN SAFWCO SBBCW SBP SBP-BSC SBSF SCB SDCs SDP SEC SECP SEZs S&GAD SLTS SMCs SME SMEDA SNGPL SPEIP
Pakistan Microfinance Network Project Management Unit Post Natal Care Post Office Pakistan Poverty Alleviation Fund Peoples' Primary Healthcare Initiative Private Power and Infrastructure Board Public Private Partnership Public
Procurement Rules Public Procurement Regulatory Authority Public Private Sector Organizations Pakistan Railways Prudential Regulations People's Rozgar Programme Poverty Reduction Strategy Public Sector Capacity Building Project Public Sector Development Programme Poverty and Social Impact Analysis Punjab Small Industries Corporation Pakistan Social and Living Standards Measurement Survey Pakistan State Oil Pakistan Special Police Establishment Pakistan Telecommunications Corporation Ltd Population Welfare Department People's Works Programme Quetta Electric Supply Company Quality of Care Results-Based Monitoring and Evaluation Research and Development Renewable Energy Real Estate Investment Trusts Road Freight Industry Rural Health Centre Reproductive Health Services Centre Rural Support Programme Rural Support Programme Network Real Time Gross Settlement Regional Training Institutes South Asian Conference on Sanitation Sindh Agricultural and Forestry Workers Coordination Organization Shaheed Benazir Bhutto Centres for Women State Bank of Pakistan State Bank of Pakistan Banking Services Corporation Small Business Support Fund Standard Chartered Bank Skill Development Centres Sustainable Development Plan Securities and Exchange Commission Securities and Exchange Commission of Pakistan Special Economic Zones Services and General Administration Department School-Led Total Sanitation School Management Councils Small and Medium Enterprises Small and Medium Enterprise Development Authority Sui Northern Gas Pipelines Limited Support to Private Education Institutes Programme
x
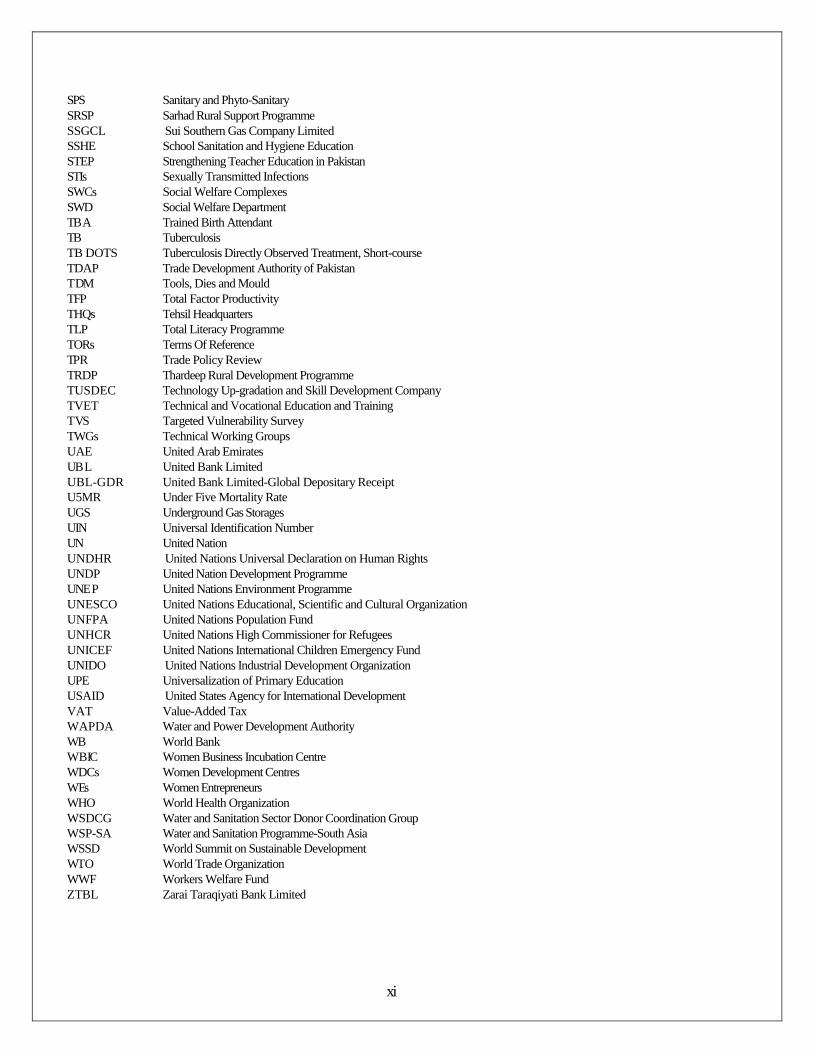
SPS SRSP SSGCL SSHE STEP STIs SWCs SWD TB A TB TB DOTS TDAP T DM TFP THQs TLP TORs TP R TRDP TUSDEC TVET T VS TWGs UAE UB L UBL-GDR U5MR UGS UIN UN UNDHR UNDP UNE P UNESCO UNFPA UNHCR UNICEF UNIDO UPE USAID VAT WAPDA WB W B IC WDCs W Es WHO WSDCG WSP-SA WSSD WT O WWF ZTBL
Sanitary and Phyto-Sanitary Sarhad Rural Support Programme Sui Southern Gas Company Limited School Sanitation and Hygiene Education Strengthening Teacher Education in Pakistan Sexually Transmitted Infections Social Welfare Complexes Social Welfare Department Trained Birth Attendant Tuberculosis Tuberculosis Directly Observed Treatment, Short-course Trade Development Authority of Pakistan Tools, Dies and Mould Total Factor Productivity Tehsil Headquarters Total Literacy Programme Terms Of Reference Trade Policy Review Thardeep Rural Development Programme Technology Up-gradation and Skill Development Company Technical and Vocational Education and Training Targeted Vulnerability Survey Technical Working Groups United Arab Emirates United Bank Limited United Bank Limited-Global Depositary Receipt Under Five Mortality Rate Underground Gas Storages Universal Identification Number United Nation United Nations Universal Declaration on Human Rights United Nation Development Programme United Nations Environment Programme United Nations Educational, Scientific and Cultural Organization United Nations Population Fund United Nations High Commissioner for Refugees United Nations International Children Emergency Fund United Nations Industrial Development Organization Universalization of Primary Education United States Agency for International Development Value-Added Tax Water and Power Development Authority World Bank Women Business Incubation Centre Women Development Centres Women Entrepreneurs World Health Organization Water and Sanitation Sector Donor Coordination Group Water and Sanitation Programme-South Asia World Summit on Sustainable Development World Trade Organization Workers Welfare Fund Zarai Taraqiyati Bank Limited
xi
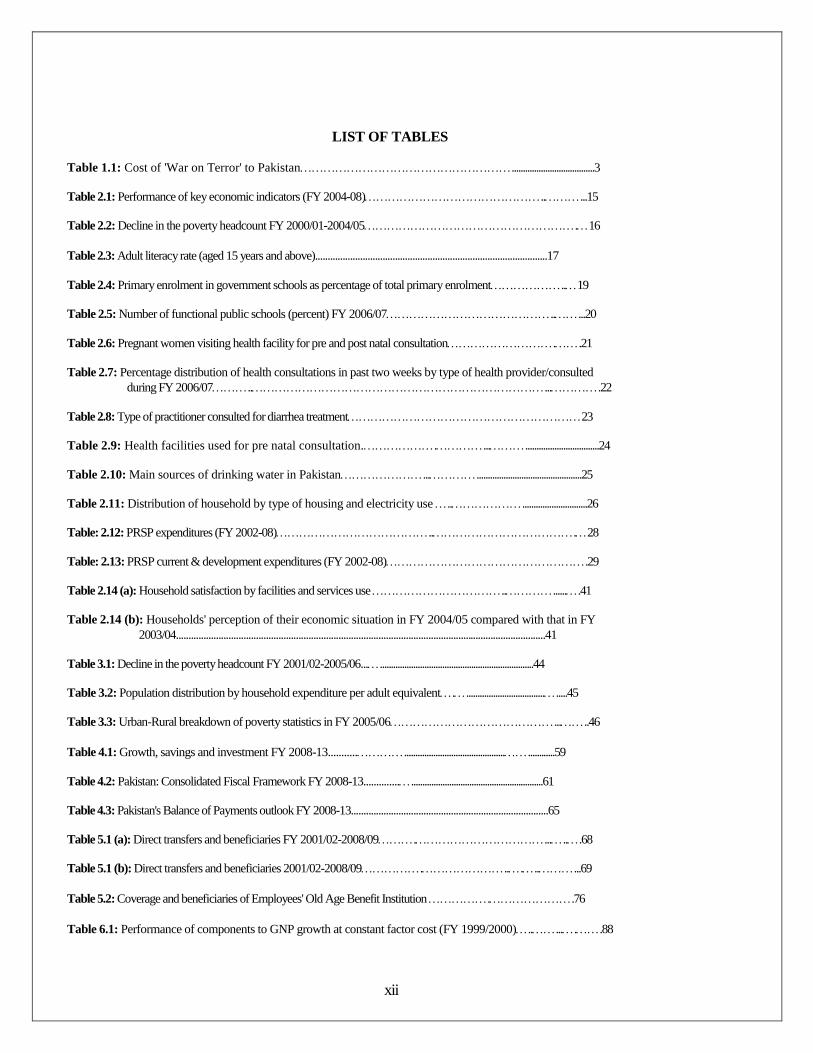
LIST OF TABLES
Table 1.1: Cost of 'War on Terror' to Pakistan.....................................3
Table 2.1: Performance of key economic indicators (FY 2004-08).....15
Table 2.2: Decline in the poverty headcount FY 2000/01-2004/05.16
Table 2.3: Adult literacy rate (aged 15 years and above).............................................................................................17
Table 2.4: Primary enrolment in government schools as percentage of total primary enrolment..19
Table 2.5: Number of functional public schools (percent) FY 2006/07.....20
Table 2.6: Pregnant women visiting health facility for pre and post natal consultation..21
Table 2.7: Percentage distribution of health consultations in past two weeks by type of health provider/consulted during FY 2006/07......22
Table 2.8: Type of practitioner consulted for diarrhea treatment23
Table 2.9: Health facilities used for pre natal consultation......................................24
Table 2.10: Main sources of drinking water in Pakistan..................................................25
Table 2.11: Distribution of household by type of housing and electricity use ...............................26
Table: 2.12: PRSP expenditures (FY 2002-08)...28
Table: 2.13: PRSP current & development expenditures (FY 2002-08).29
Table 2.14 (a): Household satisfaction by facilities and services use .........41
Table 2.14 (b): Households' perception of their economic situation in FY 2004/05 compared with that in FY 2003/04....................................................................................................................................................41
Table 3.1: Decline in the poverty headcount FY 2001/02-2005/06........................................................................44
Table 3.2: Population distribution by household expenditure per adult equivalent.........................................45
Table 3.3: Urban-Rural breakdown of poverty statistics in FY 2005/06.....46
Table 4.1: Growth, savings and investment FY 2008-13....................................................................59
Table 4.2: Pakistan: Consolidated Fiscal Framework FY 2008-13.........................................................................61
Table 4.3: Pakistan's Balance of Payments outlook FY 2008-13...............................................................................65
Table 5.1 (a): Direct transfers and beneficiaries FY 2001/02-2008/09.......68
Table 5.1 (b): Direct transfers and beneficiaries 2001/02-2008/09.........69
Table 5.2: Coverage and beneficiaries of Employees' Old Age Benefit Institution ..76
Table 6.1: Performance of components to GNP growth at constant factor cost (FY 1999/2000).......88
xii
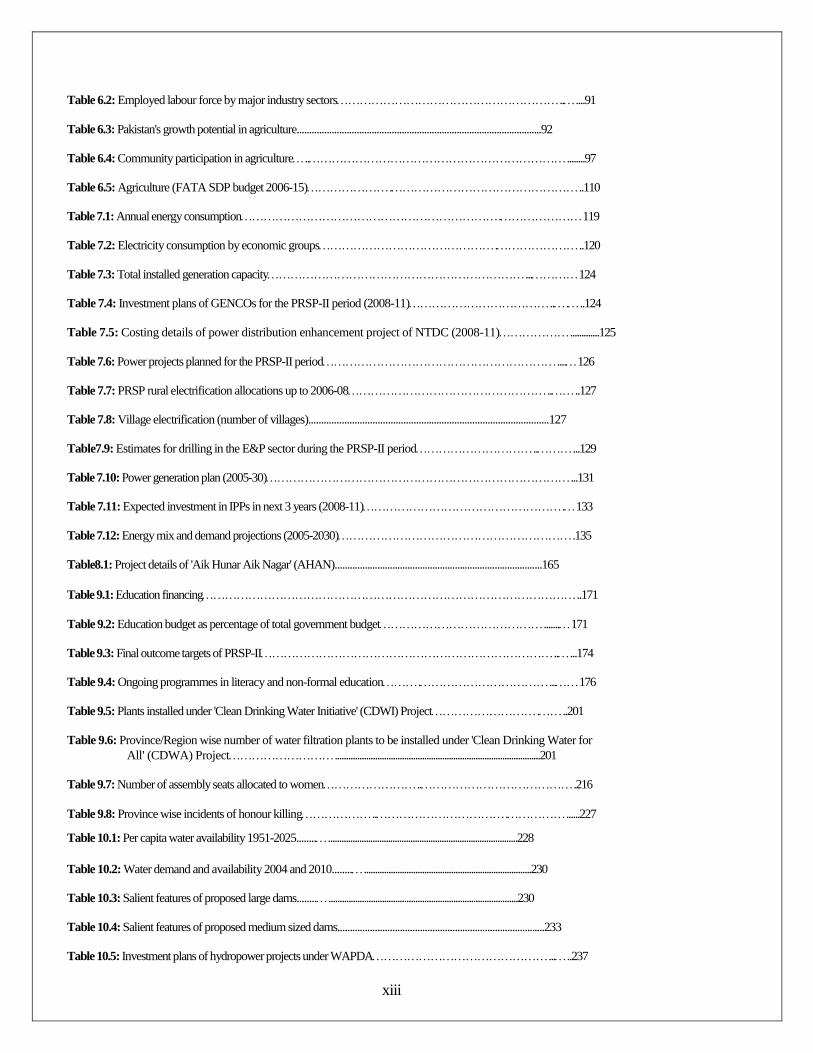
Table 6.2: Employed labour force by major industry sectors......91
Table 6.3: Pakistan's growth potential in agriculture..................................................................................................92
Table 6.4: Community participation in agriculture..........97
Table 6.5: Agriculture (FATA SDP budget 2006-15)...110
Table 7.1: Annual energy consumption.119
Table 7.2: Electricity consumption by economic groups...120
Table 7.3: Total installed generation capacity...124
Table 7.4: Investment plans of GENCOs for the PRSP-II period (2008-11).....124
Table 7.5: Costing details of power distribution enhancement project of NTDC (2008-11).............125
Table 7.6: Power projects planned for the PRSP-II period....126
Table 7.7: PRSP rural electrification allocations up to 2006-08....127
Table 7.8: Village electrification (number of villages)..............................................................................................127
Table7.9: Estimates for drilling in the E&P sector during the PRSP-II period.....129
Table 7.10: Power generation plan (2005-30)...131
Table 7.11: Expected investment in IPPs in next 3 years (2008-11).133
Table 7.12: Energy mix and demand projections (2005-2030).135
Table8.1: Project details of 'Aik Hunar Aik Nagar' (AHAN)...................................................................................165
Table 9.1: Education financing..171
Table 9.2: Education budget as percentage of total government budget.......171
Table 9.3: Final outcome targets of PRSP-II.....174
Table 9.4: Ongoing programmes in literacy and non-formal education....176
Table 9.5: Plants installed under 'Clean Drinking Water Initiative' (CDWI) Project...201
Table 9.6: Province/Region wise number of water filtration plants to be installed under 'Clean Drinking Water for All' (CDWA) Project............................................................................................201
Table 9.7: Number of assembly seats allocated to women...216
Table 9.8: Province wise incidents of honour killing.........227
Table 10.1: Per capita water availability 1951-2025.............................................................................................228
Table 10.2: Water demand and availability 2004 and 2010...................................................................................230
Table 10.3: Salient features of proposed large dams.............................................................................................230
Table 10.4: Salient features of proposed medium sized dams...................................................................................233
Table 10.5: Investment plans of hydropower projects under WAPDA.....237
xiii
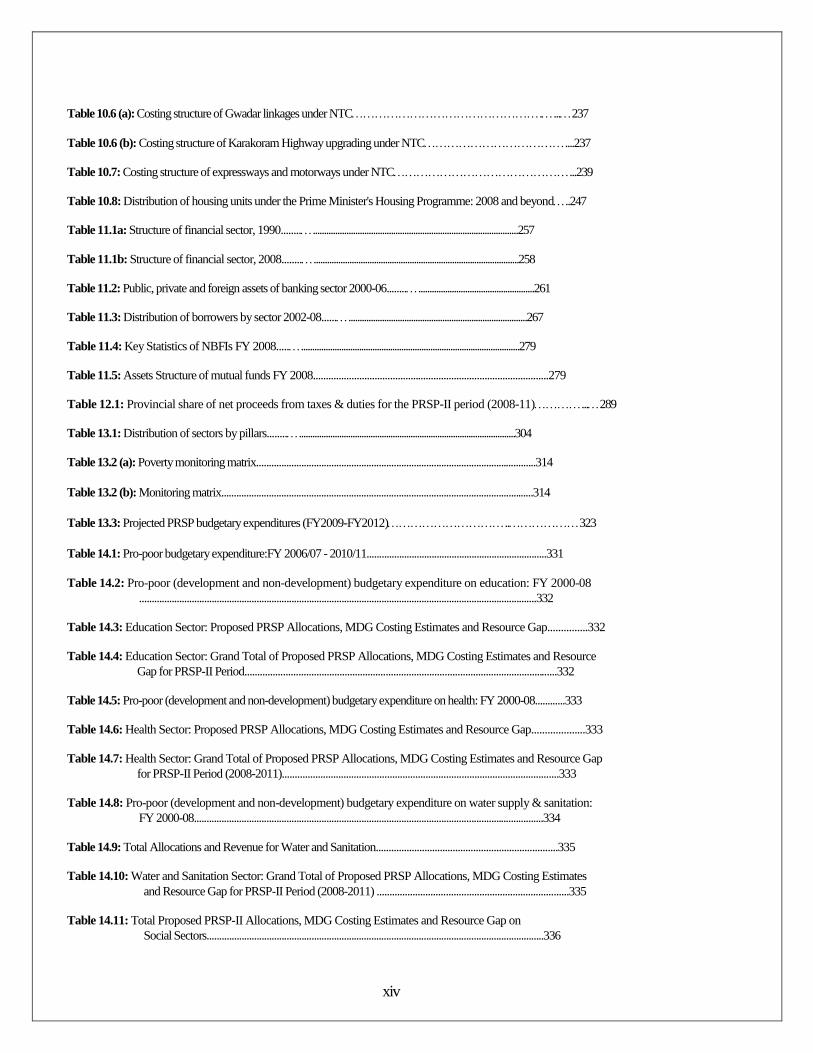
Table 10.6 (a): Costing structure of Gwadar linkages under NTC....237
Table 10.6 (b): Costing structure of Karakoram Highway upgrading under NTC....237
Table 10.7: Costing structure of expressways and motorways under NTC...239
Table 10.8: Distribution of housing units under the Prime Minister's Housing Programme: 2008 and beyond..247
Table 11.1a: Structure of financial sector, 1990....................................................................................................257
Table 11.1b: Structure of financial sector, 2008....................................................................................................258
Table 11.2: Public, private and foreign assets of banking sector 2000-06............................................................261
Table 11.3: Distribution of borrowers by sector 2002-08......................................................................................267
Table 11.4: Key Statistics of NBFIs FY 2008.......................................................................................................279
Table 11.5: Assets Structure of mutual funds FY 2008............................................................................................279
Table 12.1: Provincial share of net proceeds from taxes & duties for the PRSP-II period (2008-11)...289
Table 13.1: Distribution of sectors by pillars.........................................................................................................304
Table 13.2 (a): Poverty monitoring matrix................................................................................................................314
Table 13.2 (b): Monitoring matrix.............................................................................................................................314
Table 13.3: Projected PRSP budgetary expenditures (FY2009-FY2012)..323
Table 14.1: Pro-poor budgetary expenditure:FY 2006/07 - 2010/11........................................................................331
Table 14.2: Pro-poor (development and non-development) budgetary expenditure on education: FY 2000-08 ...............................................................................................................................................................332
Table 14.3: Education Sector: Proposed PRSP Allocations, MDG Costing Estimates and Resource Gap...............332
Table 14.4: Education Sector: Grand Total of Proposed PRSP Allocations, MDG Costing Estimates and Resource Gap for PRSP-II Period..........................................................................................................................332
Table 14.5: Pro-poor (development and non-development) budgetary expenditure on health: FY 2000-08............333
Table 14.6: Health Sector: Proposed PRSP Allocations, MDG Costing Estimates and Resource Gap....................333
Table 14.7: Health Sector: Grand Total of Proposed PRSP Allocations, MDG Costing Estimates and Resource Gap for PRSP-II Period (2008-2011)............................................................................................................333
Table 14.8: Pro-poor (development and non-development) budgetary expenditure on water supply & sanitation: FY 2000-08............................................................................................................................................334
Table 14.9: Total Allocations and Revenue for Water and Sanitation.......................................................................335
Table 14.10: Water and Sanitation Sector: Grand Total of Proposed PRSP Allocations, MDG Costing Estimates and Resource Gap for PRSP-II Period (2008-2011) ...........................................................................335
Table 14.11: Total Proposed PRSP-II Allocations, MDG Costing Estimates and Resource Gap on Social Sectors.......................................................................................................................................336
xiv
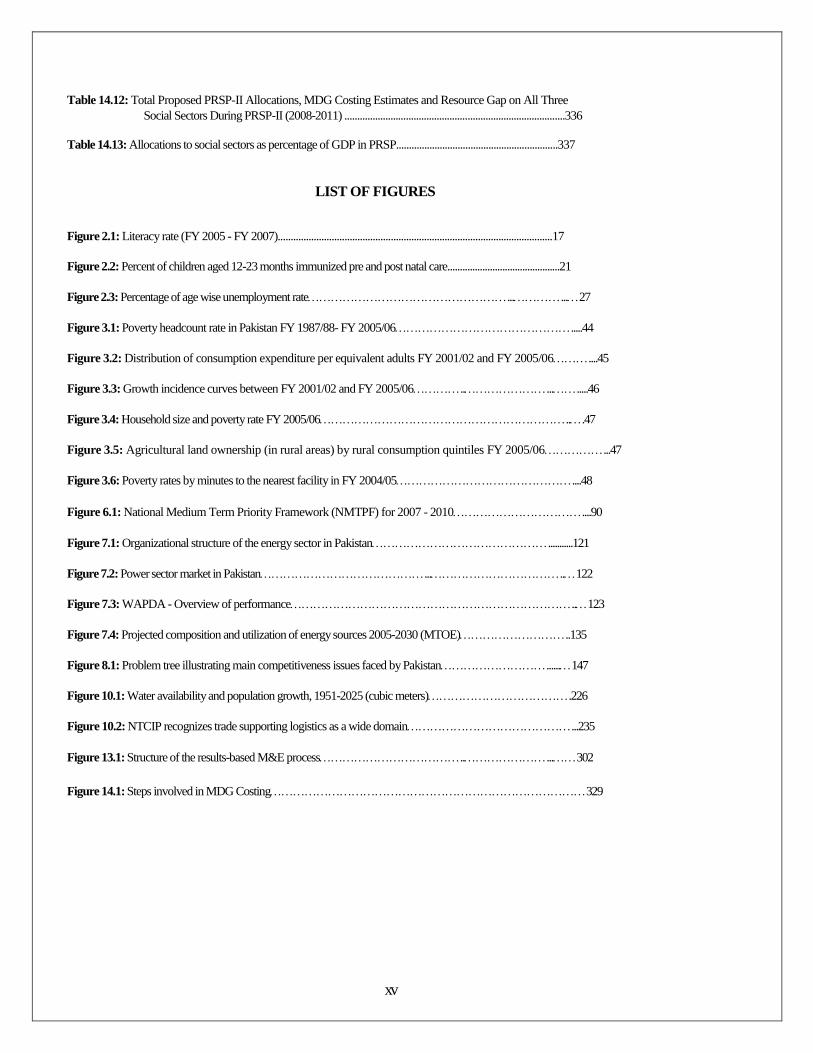
Table 14.12: Total Proposed PRSP-II Allocations, MDG Costing Estimates and Resource Gap on All Three Social Sectors During PRSP-II (2008-2011) ......................................................................................336
Table 14.13: Allocations to social sectors as percentage of GDP in PRSP...............................................................337
LIST OF FIGURES
Figure 2.1: Literacy rate (FY 2005 - FY 2007)...........................................................................................................17
Figure 2.2: Percent of children aged 12-23 months immunized pre and post natal care.............................................21
Figure 2.3: Percentage of age wise unemployment rate......27
Figure 3.1: Poverty headcount rate in Pakistan FY 1987/88- FY 2005/06.....44
Figure 3.2: Distribution of consumption expenditure per equivalent adults FY 2001/02 and FY 2005/06....45
Figure 3.3: Growth incidence curves between FY 2001/02 and FY 2005/06..........46
Figure 3.4: Household size and poverty rate FY 2005/06...47
Figure 3.5: Agricultural land ownership (in rural areas) by rural consumption quintiles FY 2005/06...47
Figure 3.6: Poverty rates by minutes to the nearest facility in FY 2004/05....48
Figure 6.1: National Medium Term Priority Framework (NMTPF) for 2007 - 2010....90
Figure 7.1: Organizational structure of the energy sector in Pakistan...........121
Figure 7.2: Power sector market in Pakistan.....122
Figure 7.3: WAPDA - Overview of performance..123
Figure 7.4: Projected composition and utilization of energy sources 2005-2030 (MTOE)..135
Figure 8.1: Problem tree illustrating main competitiveness issues faced by Pakistan......147
Figure 10.1: Water availability and population growth, 1951-2025 (cubic meters).226
Figure 10.2: NTCIP recognizes trade supporting logistics as a wide domain...235
Figure 13.1: Structure of the results-based M&E process.....302
Figure 14.1: Steps involved in MDG Costing329
xv
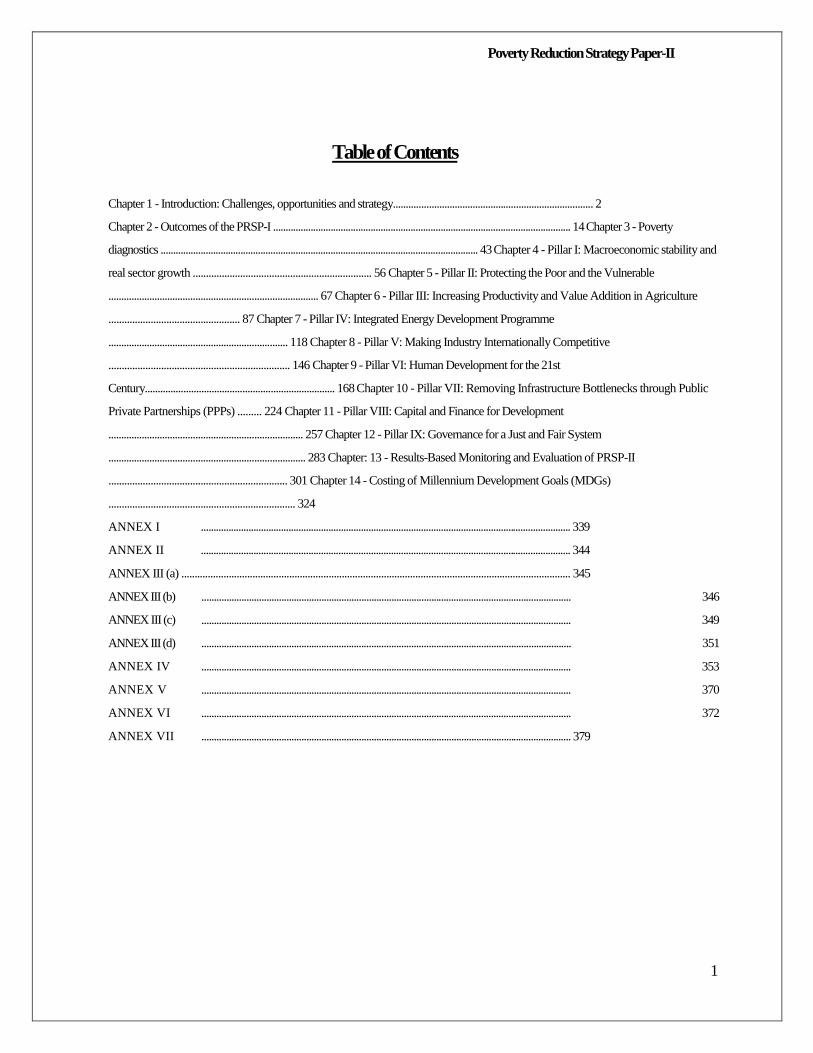
Poverty Reduction Strategy Paper-II
Table of Contents
Chapter 1 - Introduction: Challenges, opportunities and strategy.............................................................................. 2
Chapter 2 - Outcomes of the PRSP-I ....................................................................................................................... 14 Chapter 3 - Poverty
diagnostics ............................................................................................................................... 43 Chapter 4 - Pillar I: Macroeconomic stability and
real sector growth .................................................................... 56 Chapter 5 - Pillar II: Protecting the Poor and the Vulnerable
.................................................................................. 67 Chapter 6 - Pillar III: Increasing Productivity and Value Addition in Agriculture
.................................................. 87 Chapter 7 - Pillar IV: Integrated Energy Development Programme
...................................................................... 118 Chapter 8 - Pillar V: Making Industry Internationally Competitive
..................................................................... 146 Chapter 9 - Pillar VI: Human Development for the 21st
Century.......................................................................... 168 Chapter 10 - Pillar VII: Removing Infrastructure Bottlenecks through Public
Private Partnerships (PPPs) ......... 224 Chapter 11 - Pillar VIII: Capital and Finance for Development
............................................................................ 257 Chapter 12 - Pillar IX: Governance for a Just and Fair System
............................................................................. 283 Chapter: 13 - Results-Based Monitoring and Evaluation of PRSP-II
.................................................................... 301 Chapter 14 - Costing of Millennium Development Goals (MDGs)
....................................................................... 324
ANNEX I .................................................................................................................................................... 339
ANNEX II .................................................................................................................................................... 344
ANNEX III (a) .................................................................................................................................................... 345
ANNEX III (b)
ANNEX III (c)
ANNEX III (d)
ANNEX IV
ANNEX V
ANNEX VI
ANNEX VII
.................................................................................................................................................... 346
.................................................................................................................................................... 349
.................................................................................................................................................... 351
.................................................................................................................................................... 353
.................................................................................................................................................... 370
.................................................................................................................................................... 372
.................................................................................................................................................... 379
1
Poverty Reduction Strategy Paper-II Chapter 1 - Introduction: Challenges, opportunities and strategy
Chapter 1 - Introduction: Challenges, opportunities and
strategy
1.1
The new Poverty Reduction Strategy Paper (PRSP-II) draws upon lessons learnt from PRSP-I1 and takes into account recent political, economic and social events, both domestic
and international, which have adverse impacts for Pakistan. To steer Pakistan back on the path of
sustained and broad-based economic growth and to create jobs and reduce poverty, Pakistan requires
a prolonged period of macroeconomic stability, financial discipline and
consistently transparent policies that place poverty reduction at the centre of the country's
overall economic policies. Linking the economic growth-poverty reduction nexus are the
very elements that the new PRSP focuses on, which has been extensively chalked out in the entire
document. Meanwhile, this chapter aims primarily to set the stage for the subsequent discussion by
presenting a broad overview of the programme and underscores the main
points that underpin the Strategy.
1.2 Setting the Stage for the Strategy
1.2.1 Economic Environment: During the five years ending in FY 2006/07, Pakistan's
economy more than doubled in size with an annual GDP growth rate averaging 7 percent. With
relative price stability, the debt burden had reduced to one-half, foreign exchange reserves were
sufficient to provide import cover for almost six months, stock market was one of the best
performing in emerging markets; foreign direct investment touched close to 6 percent of GDP, and
Pakistan successfully launched sovereign bonds of maturity ranging from 5-30 years in the
international capital market with manifold oversubscription reflecting strong vote of
confidence of global investors. However, the last fiscal year, i.e. 2007/08 has caused turmoil for
Pakistan's economy with several political and economic events, both on domestic and external
fronts, occurring unexpectedly. The country suffered
a series of shocks since the eruption of the judicial crisis in March, 2007. The then
government went into policy inaction, delaying important decisions that were needed to
face these challenges. Root causes of macroeconomic instability included delay in passing the
effect of the oil price hike to the consumers, resulting in a very high budget deficit
which was financed by excessive borrowing from the State Bank of Pakistan (SBP). For this
reason, monetary growth is projected at close to 19 percent during the first half of the PRSP-II term,
further fueling the already high inflation. Domestic political and economic instability has led to
GDP growth plummeting from as high as 7.5 percent to barely 5.8 percent in FY 2007/08 and
an expected growth of 3.4 percent in the current fiscal year
(2008/09).
1.2.2 Three main structural weaknesses can be identified for the current economic difficulty: (i)
government spending in excess of revenue (fiscal deficit); (ii) imports in excess of exports (trade
deficit); and (iii) inadequate social services to allow the poor and the vulnerable to fully
participate in times of economic stability and prosperity and be protected during
1Performance during the PRSP-I period is reviewed in Chapter 2.
2
Poverty Reduction Strategy Paper-II Chapter 1 - Introduction: Challenges, opportunities and strategy
shocks. More recent reasons for the prevailing macroeconomic instability include domestic
law and order situation, an unprecedented global increase in prices of oil, food and other
essential commodities, instability in international financial markets and, most importantly,
bearing the direct and indirect costs being a frontline state in the 'War on Terror'. As a result of
these issues, Pakistan is currently facing major challenges including growing fiscal and current
account deficits; rising inflation; growth deterioration; and depleting
foreign exchange reserves.
1.2.3 Pakistan's Role in the Universal War on Terror: One important aspect that has severely
dented development in Pakistan is its role in the 'War on Terror'. Pakistan has sustained immense
socio-economic costs of being a partner in the international counter terrorism
campaign. The anti-terrorist campaign, which followed the 9/11 event in the United States
in 2001, over-strained Pakistan's budget as allocations for law enforcement agencies had to
be increased significantly which meant erosion of resources for development all over
Pakistan, particularly in FATA and nearby NWFP areas in addition to human sufferings and
resettlement costs. Several development projects, started earlier in the affected areas are afflicted
with delays which would ultimately result in large cost over-runs. Since the start of the anti-
terrorism campaign, an overall sense of uncertainty has contributed to capital flight, as well as,
slowed down domestic economic activity making foreign
investors jittery. It is apprehended that Foreign Direct Investment, which witnessed a steep rise over
the past several years may be adversely affected by the on-going anti-terrorism
campaign in FATA and other areas of NWFP in addition to an excessive increase in the
country's credit risk, which has made borrowing from the market extremely expensive.
Pakistan's sovereign bonds have alos under-performed owing to similar reasons.
1.2.4 Above all, Pakistan's participation in the anti-terrorism campaign has led to massive
unemployment in the affected regions. Frequent bombings, worsening law and order situation
and displacement of the local population have taken a toll on the socio-economic fabric of the
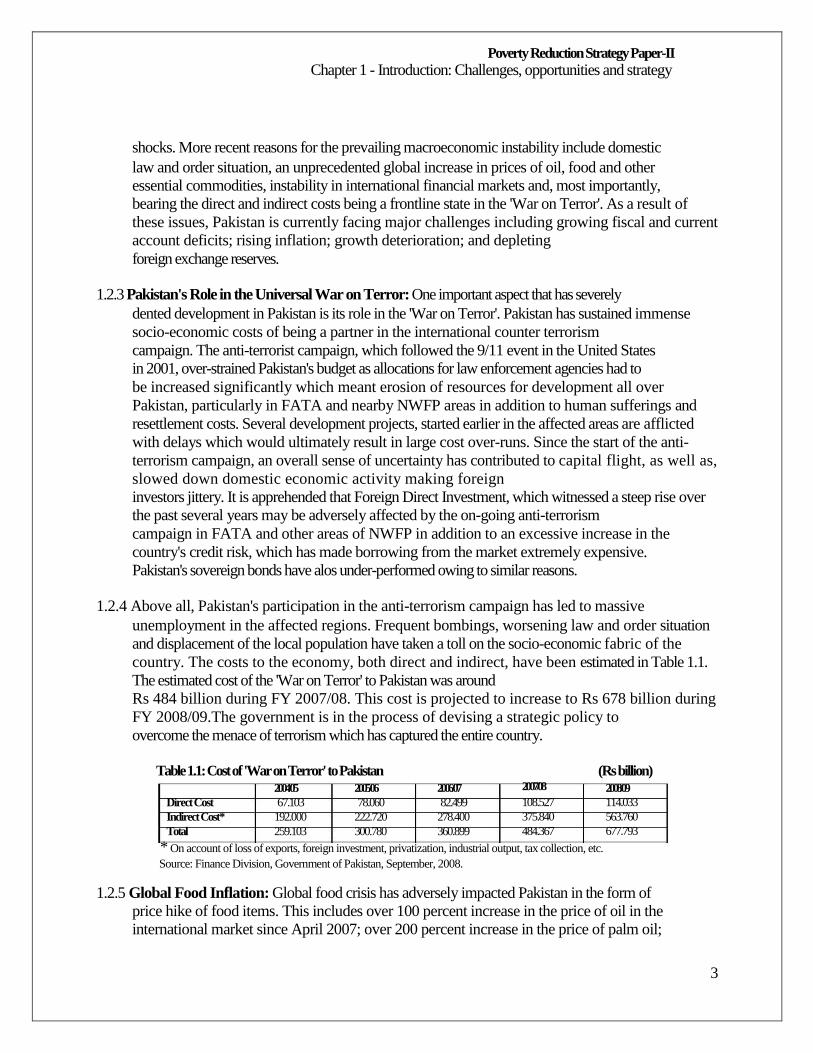
country. The costs to the economy, both direct and indirect, have been estimated in Table 1.1.
The estimated cost of the 'War on Terror' to Pakistan was around
Rs 484 billion during FY 2007/08. This cost is projected to increase to Rs 678 billion during
FY 2008/09.The government is in the process of devising a strategic policy to
overcome the menace of terrorism which has captured the entire country.
Table 1.1: Cost of 'War on Terror' to Pakistan 2004/05 2005/06 2006/07
Direct Cost 67.103 78.060 82.499 Indirect Cost* 192.000 222.720 278.400 Total 259.103 300.780 360.899
2007/08 108.527 375.840 484.367
(Rs billion) 2008/09 114.033 563.760 677.793
* On account of loss of exports, foreign investment, privatization, industrial output, tax collection, etc. Source: Finance Division, Government of Pakistan, September, 2008.
1.2.5 Global Food Inflation: Global food crisis has adversely impacted Pakistan in the form of
price hike of food items. This includes over 100 percent increase in the price of oil in the
international market since April 2007; over 200 percent increase in the price of palm oil;
3
Poverty Reduction Strategy Paper-II Chapter 1 - Introduction: Challenges, opportunities and strategy
and an increase of 150 percent in wheat prices. A review of price trends of essential items
in Pakistan during FY 2007/08, indicates that the major portion of food inflation during this period
stemmed from hike in the prices of wheat, flour, rice, edible oil, fruits, vegetables,
pulses, poultry and milk, etc. However, prices of other important food items like sugar,
potatoes and moong pulse have decreased owing to improved availability of these items in
the market.2
1.2.6
1.2.7
Social Protection: Despite all efforts at job creation, training, and so on, there will always
be individuals who for one reason or another are unable to benefit from the country's
economic growth. In March, 2008 the Prime Minister laid out a series of future
commitments (100 Days' Agenda) to benefit the poor during the PRSP-II period and beyond.
The coming of a new era of democracy in Pakistan has thus immediately resulted in promising
opportunities for people belonging to the lower middle class and poor segments of society.
Salient initiatives pledged by the government include: increased employment generation with
the help of a new Employment Commission planned to facilitate creation of jobs in the public
and private sectors and to provide employment to one member of every poor family from 50
percent of the districts in the country, revision of labour laws as per the requirements of the
International Labour Organization (ILO) (minimum wage of labourers will be fixed at Rs
6000 per month: see chapter 8), amendments in the Civil Service Regulations (June, 2008),
'Article 474 B Public' for eligibility of public servants who become disabled during service to
get full benefits of retirement, with ten years service condition being lifted immediately;
development at union council level; low cost housing; provision of medical insurance of Rs 15,000
- 20,000 per year to the poor; cases of political prisoners in the country to be reviewed under
the National Reconciliation Ordinance (2007) by a Committee headed by the Attorney General of
Pakistan; poor people to be provided free national identity cards; and provision of financial
assistance/scholarships to widows and children of innocent victims who lost their lives in terrorist
attacks. In context with the last commitment, an aid agenda has been issued to all Provincial
Governments and Finance Division with the approval of the Prime Minister for implementation.
The Government of Sindh in this regard allocated an amount of Rs 50 million in budget estimates
for FY 2008/09. The government has also launched the "Benazir Income Support Programme
(BISP)" to provide direct cash transfers to the
poor, details of which are covered later in the discussion.
The overall vision of PRSP-II is thus to regain macroeconomic stability and Pakistan's
growth of 5-7 percent per annum over the next five years; create adequate employment
opportunities; improve income distribution and global economic competitiveness through
economic liberalization; deregulation; and transparent privatization. To ensure that
macroeconomic difficulties do not further slow down the pace of job creation and hence,
ultimately adversely effect poverty reduction, the government has taken and will continue to
undertake a series of fiscal, monetary and exchange rate measures to stabilize the
economy. In this light, Pakistan has recently reached an agreement with IMF for a US $7.6
2Economic Adviser's Wing, Finance Division, Government of Pakistan, 2008
4
Poverty Reduction Strategy Paper-II Chapter 1 - Introduction: Challenges, opportunities and strategy
billion package with interest rate varying from 3.51 to 4.51 percent spread out over a
period of 23 months. For the first time, IMF has accepted Pakistan's own
proposals/programmes which have two main objectives: (i) to restore the confidence of domestic
and external investors by addressing macroeconomic imbalances through
tightening of fiscal and monetary policies; and (ii) to protect the poor and preserve social
stability through a well-targeted and adequately funded social safety nets.
1.2.4.1 In this light, the PRSP-II endeavours not only to address growth per se but pro-poor
growth, which is essential for improving the life of the common man. It is in this
perspective that PRSP-II emphasizes commodity producing sectors namely, agriculture and
manufacturing, alongside services. High employment intensity sectors such as housing &
construction; and Small & Medium Enterprises (SMEs) will also receive greater attention, as will
skill development and higher education. Tackling the energy crisis to avoid stifling of growth by
rapidly adding more power while simultaneously conserving energy will be
another top priority. Ensuring the implementation of policies and reform programmes to achieve
the desired results as set out in PRSP-II is a critical task. Support from bilateral and
multilateral institutions will play an important role in achieving these targets.
1.2.4.2 The Poverty Reduction Strategy covers the three-year PRSP-II period of FY 2008/09-
2010/11 but also provides a framework for thinking well beyond this timeframe. It should, therefore,
be viewed as an approach to a long-term national economic strategy that has its
main focus on reduction of poverty.
1.2
1.3.1
Building up the Strategy
Pakistan's PRSP is a fully participative process, incorporating the views and suggestions of all stakeholders - parliamentarians, line ministries, development partners, civil society,
media and the poor communities. Consultations are an integral element of the PRSP process.
PRSP welcomes participation at various stages of the overall process enabling it to
become representative of all stakeholder interests increasing the transparency of the
formulation process, ultimately, ensuring sustained ownership and successful
implementation of the Strategy. The PRSP-II has been compiled incorporating all such
feedback. Comprehensive consultations for PRSP-II started towards the end of the year 2005 and
have continued till the launch of the Paper in late 2008. This participatory process has included
national stakeholder workshops, regular meetings with all partners and
informal sharing of the draft for review/feedback. The PRSP-II Draft Summary was
launched at the platform of the Pakistan Development Forum, Islamabad in April, 2007. The
Draft Summary and the3 periodic PRSP expenditure reports are available at the Ministry of
Finance's website. Details of the entire consultative process are discussed in
the next chapter.
3For further details please visit: www.finance.gov.pk
5
Poverty Reduction Strategy Paper-II Chapter 1 - Introduction: Challenges, opportunities and strategy
1.4
1.4.1
The Strategy for Poverty Reduction
The Strategy consists of the following nine pillars: (i) Macroeconomic Stability and Real Sector Growth; (ii) Protecting the Poor and the Vulnerable; (iii) Increasing Productivity and Value Addition in Agriculture; (iv) Integrated Energy Development Programme; (v
st )
Making Industry Internationally Competitive; (vi) Human Development for the 21
Century; (vii) Removing Infrastructure Bottlenecks through Public Private Partnerships;
(viii) Capital and Finance for Development; and (ix) Governance for a Just and Fair
System. In addition, the government is putting in place a stringent results-based system to monitor
and evaluate the progress of the Poverty Reduction Strategy. Moreover, the government is
continuouslly determined to empower women and to reduce gender disparities. This, in
addition to environmental sustainability, is a cross-cutting theme and is regarded as an integral part of
the programme which is woven throughout the PRSP-II. The
following discussion gives a broad overview of the pillars.
1.4.2 Pillar I: Macroeconomic Stability and Real Sector Growth
1.4.2.1 First and foremost, the government's top priority is regaining macroeconomic stability,
which will act as an umbrella over all other government policies. It is on the basis of the
macroeconomic framework that assumptions and targets of all policies will be set. The
government's new broad-based programme for economic stabilization has already ensuring adjustment
in petroleum prices to reduce burden on the budget; significant cuts in expenditures to curb
the rising burden of subsidies; tight monetary policy to fight inflation;
and further cuts in development spending, etc. Details are discussed in chapter 4.
1.4.3 Pillar II: Protecting the Poor and the Vulnerable
1.4.3.1 Social safety nets that provide at least minimal safeguard for the poor and the vulnerable
which must form an essential element of any poverty reduction strategy. Pakistan has a
fairly elaborate network of direct and indirect social protection mechanisms. Direct
provisions include employment based guarantees (such as Employees' Old Age Benefit
Institution, Workers' Welfare Fund and provincial social security benefits), direct transfers (Zakat and
Pakistan Bait-ul-Mal) and market based interventions (microfinance). Indirect
provisions include the provision of the minimum wage, lifeline tariff on electricity, subsidy
on the price of flour and food subsidies through the Utility Stores Corporation of Pakistan.
1.4.3.2 Funding of specific safety net programmes has traditionally been insufficient given
programme objectives and target populations. As a result, safety net programmes are
fragmented and often duplicative; have limited coverage and are poorly targeted with small benefit
levels relative to household income and the poverty gap; payments are infrequent and irregular;
administrative arrangements are inadequate; and Monitoring and Evaluation (M&E) capacity is not
up to the mark, which negatively impact programme efficiency and quality of service delivery.
Consequently, these programmes have limited impact on
poverty and vulnerability.
6
Poverty Reduction Strategy Paper-II Chapter 1 - Introduction: Challenges, opportunities and strategy
1.4.3.3 In response to these challenges a National Social Protection Strategy (NSPS)4 was drafted
in 2007, building upon a detailed sectoral review and upon inputs provided by all relevant actors in
the sector, both at the federal and provincial levels. The NSPS aims to develop an
integrated and comprehensive protection system, covering the entire population especially
the poorest and the most vulnerable. The NSPS comprises a range of programmes and policies
such as social insurance and assistance; income transfers to the very poor; support to vulnerable
households to manage risks; and investment in human capital and physical
assets to strengthen their resilience.
1.4.3.4 With the aim to provide relief to the economically stressed segments of the society in the
face of spiraling prices of the essential commodities, the government has launched
"Benazir Income Support Programme (BISP)" with an initial allocation of Rs 34 billion to be
disbursed amongst the target households. The programme envisages cash grant of Rs 1000 per
month to each qualifying household through banks/post offices. The vision of
BISP is to ensure the government's role in amelioratating the conditions of the poorest of
the poor by directly accessing them through supplementing their sources of income.
1.4.3.5 Similarly, the Government of Punjab has announced a Punjab Food Support Scheme
(PFSS), originally designed to provide food stamps to the poorest households, now
converted into a cash grant programme of Rs 1000 per household per month. The scheme covers
both, rural and urban areas with total subsidy in the scheme amounting to Rs 21.60
billion (at Rs 1.8 billion per month) for 1.8 million families (at 6 persons per family).
1.4.4 Pillar III: Increasing Productivity and Value Addition in Agriculture
1.4.4.1 Agriculture contributes the largest share in the country's GDP. Agriculture will receive
high priority in the PRSP-II as the bulk of the poor are concentrated in rural areas. Self- reliance
in commodities, food security through improved productivity of crops as well as development of
livestock and dairy are being supported through: (i) development of new technologies; (ii) more
productive use of water through precision land leveling and high
efficiency irrigation systems; (iii) promoting production and export of high value crops;
(iv) accelerating the move towards high-value activities, such as livestock rearing, dairy
production, fisheries, and horticulture; (v) creating necessary infrastructure; and (vi)
ensuring availability of agricultural credit.
1.4.5 Pillar IV: Integrated Energy Development Programme
1.4.5.1 Ensuring energy security and energy efficiency will be amongst the government's top
priorities in order to tackle the current energy crisis and enable sufficient supply of energy for
domestic as well as commercial use. Rapid urbanization in Pakistan has brought
tremendous challenges as cities absorb higher populations. Promoting energy efficiency,
fuel diversity and interventions that take climate change into consideration transcend the
boundaries of energy policy and have a direct impact on the poor. Policies concerning the
development and sustenance of transportation, technology, environment, finance,
4Prepared by Planning Commission, now transferred to Ministry of Social Welfare, Government of Pakistan, 2008.
7
Poverty Reduction Strategy Paper-II Chapter 1 - Introduction: Challenges, opportunities and strategy
competition, and investment have an important role to play.5 It must be noted, however,
that unless the power sector is put on a financially sound footing, sustainable development
of the sector will not happen. Pakistan projects annual growth in energy at 7.2 percent by 2010 and
8.8 percent thereafter, whereas, the demand for power is expecte6d to increase by
8.5 percent for the period 2008-10 and 7.7 percent for the period 2010-15. Pakistan's total energy
requirements by 2030 will7 be 361 MTOE (Million Tons Oil Equivalent) compared
with 60.4 MTOE in FY 2006/07. The links between sustainable development and energy
requires even greater efforts for long term energy security. The government approved the
Energy Security Plan (ESP) 2005-15 in February 2005. Salient features of ESP include:
increasing exploratory efforts to significantly enhance annual production levels of gas and oil;
diversifying the energy mix by expanding the share of coal, nuclear and renewable energy
(such as wind and solar); and promoting energy conservation and demand
management measures.
1.4.6 Pillar V: Making Industry Internationally Competitive
1.4.6.1 The government realizes the need to improve the general business environment to provide
a conducive platform for efficient economic activity. Largely as a result of the inward- looking
trade policies that Pakistan followed until the 1990s, the country's share of world
trade remained less than 1 percent. The progressive liberalization of world trade and the country's
shift to a more outward-looking trade strategy has created opportunities for Pakistan to
become integrated into the global trading system and to fully exploit its comparative
advantages. Pakistan will have to upgrade its technological capacity and increase the focus on
skills development. Studies by international agencies have found that
policy changes since 2000 have improved the business climate in several respects but many
business-unfriendly legacies remain. Key policy related areas will include raising
investment levels; attraction of Foreign Direct Investment (FDI); and encouraging private sector
involvement in all spheres of the economy coupled with improvement in education and health
sectors to create a skilled and healthy labour force. This will ultimately lead to improvements in
the business environment through increasing competition, firm level
productivity and expansion and diversification of exports.
1.4.7 Pillar VI: Human Development for the 21st Century
1.4.7.1 The overarching philosophy informing the government's growth strategy is that the
country's productive structure must be responsive to the market, which is the most effective
means of ensuring that the country is able to meet fierce international competition to which
it will increasingly be exposed. Pakistan must seek to employ its entire labour force, both
male and female as income generation from employment constitutes the most effective
weapon in tackling poverty. Labour market dynamics reflect that with no major change over the
years in the overall labour force participation rate, it has grown rapidly because of large cohorts of
new entrants joining the market. The gender gap of more than 50
5 ADB & DFID, Energy Efficiency and Climate Change Considerations for On-road Transportation in Asia, (Philippines, 2006). 6 Ministry of Water and Power, Power Wing, Government of Pakistan, Islamabad, 2008. 7 Ministry of Petroleum and Natural Resources, Government of Pakistan, Islamabad, 2008.

8
Poverty Reduction Strategy Paper-II Chapter 1 - Introduction: Challenges, opportunities and strategy
percentage points in the labour force participation rate in Pakistan is much higher than the
average gap of 35 percentage points in South Asia. In this context, it will be important to
ensure gender equality in accessing social service and labour markets since neglecting
provision of equal access to women would forego the potential contribution of half of its
human resources.
1.4.7.2 The demographic transition, commonly referred to as the 'demographic dividend', results
in a smaller population at young dependent ages and relatively more people in the adult age
groups, who comprise the productive labour force. The period of the dividend is not infinite but will
come to an end as the working-age population grows older ultimately expanding the number of
dependants. Moreover, the dividend will not be repeated. However, the
event is a unique opportunity, which can, however, easily turn into a 'demographic liability' if
appropriate policy measures are not taken to fully utilize the expanding labour
force. This will depend crucially upon putting in place market-driven policies (including
open trade policies and incentives to generate capital formation and higher savings) that
will expand the number of meaningful jobs and increase economic efficiency to produce
more and also provide the wherewithal to care for the elderly as the population inevitably
ages.
1.4.7.3 The government has, therefore, adopted human resource development as a priority area. In
this light, the country's Poverty Reduction Strategy envisages massive investment in
strengthening its human resource base to produce a skilled and competent workforce that can
respond to the increasing demands of a steadily growing economy. To achieve these outcomes, the
National Education Policy emphasizes the need for educational reforms addressing financing
for the sector, which despite increasing, falls short of the
requirements. Significant reforms include: strengthening the planning and implementation capacity
of the government improved utilization of resources by educational institutions;
improving governance for greater accountability of education service providers to the
community; capacity building of district and local level institutions; and strengthening the role of
communities through school committees. The health strategy has been constructed on the key
principles of equity, universal access to essential health care, timeliness, results, accountability,
strong leadership and strategic coordination of the overall effort. The
Strategy envisages addressing special needs of the vulnerable population, especially
women and children particularly in the rural areas of Pakistan. Simultaneously, the
programme under the umbrella of Population Policy 2002 is striving hard to achieve
universal access to safe family planning methods by 2010. The Policy also aims to achieve
population stabilization by 2020 with the aim to reduce population growth rate from 1.9 to
1.3 percent per annum.
1.4.8 Pillar VII: Removing Infrastructure Bottlenecks through Public-Private Partnerships
1.4.8.1 The government's vision for economic growth and poverty reduction sets ambitious
targets, which will require massive investment in quality and affordable infrastructure
(roads and highways, dams, energy, transport) to sustain high rates of private sector led growth,
enhance economic competitiveness and optimize Pakistan's locational advantage.
9
Poverty Reduction Strategy Paper-II Chapter 1 - Introduction: Challenges, opportunities and strategy
This will be a primary objective during the PRSP-II period and beyond. The magnitude of
the investment is such that this will only partially be funded from the Budget. The large part of
financing will be leveraged through Public Private Partnerships. The government, with the
assistance of mainly the World Bank and the Asian Development Bank (ADB), launched a
major strategic initiative in 2005 to improve the trade and transport logistics chain along the north-
south corridor linking Pakistan's major ports with its main industrial centres and neighbouring
countries. With a disbursement of US $6 billion envisaged over the MTDF period (2005-2010),
the major focus areas of the 'National Trade Corridor Initiative Project' (NTCIP) include: (i)
Ports & Shipping (ii) Trade Facilitation (iii) Highways Modernization (iv) Trucking
Modernization (v) Railways Restructuring and
ii) Aviation and Air Transport Modernization.
1.4.8.2 The Housing sector is recognized as a hugely productive economic activity. This sector
contributes to inter-sectoral linkages which specify development in the construction
industry. Huge employment potential in construction and housing industry provides a rationale
for the government to establish it as one of the key policy sectors in the PRSP-II. Affordable
housing for low-income groups also contributes to poverty alleviation, income redistribution and
promotes individual productivity and household savings. The strategy for Housing aspires
institutional strengthening in support of the development of a commercially based
system of housing finance for land and house purchase; upgrading existing towns and cities with
better city planning through improvement of infrastructure; creation of employment opportunities;
and affordable housing under a phased programme for the low-income population through
community participation and squatter-settlement
regulation.
1.4.9 Pillar VIII: Capital and Finance for Development
1.4.9.1 Financial institutions allocate resources to the most efficient utilization ensuing rapid
accumulation of physical and human capital and technological progress, which in turn leads to
higher economic growth - a prerequisite for poverty alleviation. Financial sector development has
helped meet growing financing requirements of productive sectors, while generating consumption
demand. Key financial sector strategies include: focus on development finance to serve the
underserved markets; introduction of new products while increasing the geographical spread of
existing ones; further strengthening of the supervisory regime & strengthening risk
management; managing volatility and
encouraging greater depth and breadth in equity markets; and expansion of the financial
sector through SME financing, Islamic banking and microfinance.
1.4.10 Pillar IX: Governance for a Just and Fair System
1.4.10.1 Governance is the manner in which public institutions and officials acquire and exercise
authority to shape public policy and provide public goods and services. It is a critical pillar
of Pakistan's Poverty Reduction Strategy, because it is the poor that especially suffer from
lack of security, empowerment, and opportunities. In this connection, devolution reforms were
designed to move from a system managed by bureaucracy to a system where decisions are
made through a political hierarchy. This has put political representatives
10
Poverty Reduction Strategy Paper-II Chapter 1 - Introduction: Challenges, opportunities and strategy
incharge of service delivery at local levels. The functioning of local governments has been
kept under review and studies indicate that three broad issues must be addressed: (a) resources
of local governments are poorly aligned with their responsibilities; (b) power regarding personnel
matters remains fragmented; and (c) respective roles of the provincial and local governments in
development matters must be further clarified. The efficient
working of Provincial Finance Commissions, Local Government Commissions, Offices of
the Zila Mohtasib,8 Zila Mushawarat9 Committees, Accounts Committees, and Monitoring
Committees is an important pre-requisite for strengthening the decentralization process.
The Federal Government has also constituted a Committee to examine the Local
Government Ordinance in view of the performance of this system.
1.4.10.2 According to the Global Competitiveness Report prepared by the World Economic Forum,
2008, consistent military coups, political instability, corruption, volatile law and order
situation, and inadequate infrastructure also have an adverse impact on Pakistan's business
environment. The report also identifies crime and theft, tax and foreign currency
regulations, inadequately trained workforce and poor public health as having adverse
impacts on the global economic standing of Pakistan.
1.4.10.3 The Poverty Reduction Strategy recognizes the importance of strengthening institutions. To
this end, police reforms were introduced to protect the rights of citizens especially of the poor and
the vulnerable. The promulgation of Police Order, 2002 was a major step towards transforming
police into a professionally competent, politically neutral, non-authoritarian, and publicly
accountable organization. In cooperation with international agencies, the government
commenced a review of the legal system under the "Access to Justice Programme" in 2002.
Taking into consideration the useful findings of this extensive reform project, the objective of legal
reforms will continue to include cutting down the caseload of judges, lessening the time spent on
deciding each case (particularly in the commercial judicial system), and reducing the costs of
accessing justice. Institutions that have received
greater government attention over the years with a view to reform include the system of
taxation; regulations to facilitate fair and competitive business behaviour; fiscal
decentralization for transfer of funds; and transfer procedures with a view to making them
simpler and transparent. Further improvement will continue in on-going, as well as, new
initiatives.
1.4.10.4 Closely allied is further strengthening of the tax administration, public procurement and
public financial management reforms. The implementation of the Medium Term Budgetary
Framework is an important development which concentrates on government spending, within
the available resources in defined priority areas to achieve national goals and to
improve the quality of public spending.
8District Ombudsman 9District Consultation
11
Poverty Reduction Strategy Paper-II Chapter 1 - Introduction: Challenges, opportunities and strategy
1.5 Monitoring and Evaluation (M&E) of PRSP-II
1.5.1 Success in poverty reduction depends on the availability of resources, effective
implementation of the strategy, continuous Monitoring & Evaluation (M&E) of its impact and
regular feedback to policymakers for appropriate adjustment in policies. The PRSP M&E
framework aims to ensure improved capacity to formulate and implement pro-poor policies,
efficient and effective spending aimed at poverty reduction and an integrated system, which will
enable precise comparison of past achievements with future objectives. The PRSP constitutes a set
of input, intermediate and output indicators in seventeen pro-
poor sectors formulated through extensive consultations. These indicators have been
refined over the years with continued interaction with all stakeholders. To measure the progress
of implementation of the PRSP-II an M&E system has been designed, the purpose
of which is to put in place a sustainable system to deliver timely and reliable data against a set of
well-defined indicators, which feeds into the policy process and engages national and
sub-national levels.
1.5.2 A new project 'Strengthening Poverty Reduction Strategy Monitoring', a joint initiative of
the Ministry of Finance and UNDP, with a total budget of US $6.487 million covering the period
2008-12 is the right step in this direction. The PRS Monitoring Project has revised the M&E
framework identified during the PRSP-I term (2003-06). Being the most current feature of the
consultative process, six Technical Working Groups (TWGs) were formed to identify
monitorable indicators so as to regularly keep track of the progress of PRSP initiatives well
beyond the PRSP-II timeframe. It includes focus group discussions on six key areas of PRSP-II,
including health, education, labour/employment, environment/water & sanitation, gender and social
safety programmes from August, 2008 onwards to enhance
monitorable indicators from the relevant policy-makers.
1.6 Medium Term Expenditure Framework (MTEF) of PRSP-II
1.6.1 Given the significant resources required for its funding, the government will prioritize the
Poverty Reduction Strategy through the Medium Term Expenditure Framework (MTEF),
which provides the 'linking framework' that allows projected expenditures to be driven by policy
priorities reflected in the pillars laid out above and disciplined by budget realities. Still a rather
recent phenomenon, conceptually the MTEF can be an ideal tool for
translating PRSPs into public expenditure programmes within a coherent multi-year
macroeconomic and fiscal framework. This expenditure framework will adhere to the Fiscal
Responsibility and Debt Limitation Act (FRDLA) 2005 and will list projections in
the shape of seventeen medium term budgetary pro-poor expenditures, initiated in PRSP-I
(2003) and refined for PRSP-II. These cover: Market access and community services: (i)
roads, highways and buildings; (ii) water supply and sanitation; Human development: (iii)
education; (iv) health; (v) population planning; (vi) natural calamities, Rural
development: (vii) agriculture; (viii) land reclamation; (ix) rural development; (x) rural
electrification (People's Works Programme-II); Safety nets: (xi) subsidies; (xii) social security
and welfare including Benazir Income Support Programme; (xiii) food support programme
including Pakistan Bait-ul-Mal and Punjab Food Support Scheme; (xiv) Peoples' Works
Programme; (xv) low cost housing; Governance: (xvi) administration of
12
Poverty Reduction Strategy Paper-II Chapter 1 - Introduction: Challenges, opportunities and strategy
justice; and (xvii) law and order. Non-budgetary PRSP expenditures include: Zakat,
Pakistan Bait-ul-Mal, Employees' Old Age Benefit Initiative (EOBI) and micro-credit
disbursement. During FY 2007/08, budgetary expenditure on pro-poor sectors amounted to
Rs 573 billion, representing 5.46 percent of the GDP.
1.7
1.7.1
1.8
Costing
The costing framework of PRSP-II has largely been based on the Millennium Development
Goals (MDGs) Costing Report, resulting from the findings of a study jointly undertaken by
Ministry of Finance and UNDP (2007). The MDG costing exercise in Pakistan went
through an intensive process of training on costing techniques, which was provided during
December 2005. Three social sectors, education, health and water and sanitation were selected
to project the cost of achieving the proposed goals. The United Nations MDGs, agreed at the
Millennium Summit held in New York in September 2000, are linked to
Pakistan's MTEF, while the key focus of PRSP-II is also intertwined with the achievement
of MDGs.
Pakistan is a rich country in terms of both natural and human resources. However, it is
unfortunate that the country continues to find itself as a borderline case in terms of human
development as well as economic growth indicators: Over one half of the population is
unemployed and a little less than half of it remains illiterate. Clearly, Pakistan has not fully
exploited its potential. In the light of this scenario, the PRSP-II will pick up from where
PRSP-I left to ensure that clear cut priorities and pro-poor sectoral programmes are in place that will
provide the government an appropriate strategic framework to effectively reduce poverty. The
PRSP-II attempts to bring related challenges and opportunities together within an integrated and
holistic strategy to achieve the vision of a prosperous and poverty free
Pakistan.
13
Poverty Reduction Strategy Paper-II Chapter 2 - Outcomes of the PRSP-I
Chapter 2 - Outcomes of the PRSP-I
2.1
2.2
2.3
2.4
2.4.1
2.4.2
The Poverty Reduction Strategy Paper-I provided a broad policy framework outlining the road map for accelerating economic growth and poverty reduction in Pakistan. The strategy
was woven around four pillars, including (i) accelerating economic growth while maintaining
macroeconomic stability; (ii) improving governance; (iii) investing in human
capital; and (iv) targeting the poor and vulnerable. The Strategy launched a multifaceted
attack on poverty that combined macroeconomic stabilization, reduction in debt burden,
fundamental structural reforms and improved governance.
An exhaustive review of the outcomes of the PRSP-I specifically in sectors intrinsically
linked with poverty reduction is presented below in order to highlight the economic and
social sector policies behind improved outcomes on the one hand and to build the PRSP-II
around the lessons learnt from implementation of PRSP-I, on the other.
The chapter is divided into two parts where first portion presents evidence on
improvements in the economic environment of the country during PRSP-I period and the progress
made in achieving social sector outcomes. The second part contains lessons
distilled from consultations with various stakeholders including line ministries, provincial
departments, international development partners, civil society, and incorporates an
assessment of the perceptions of common people collected during a series of workshops in
the community about issues of social sector service delivery and economic well-being.
Section - I Macroeconomic Outcomes
The broad macroeconomic framework formulated under PRSP-I put Pakistan on a high growth trajectory. A comprehensive reforms agenda revamped considerable parts of the
financial sector; capital market, reform of the tax administration; fiscal transparency; reforms
in the privatization programme; governance reforms particularly with respect to
devolution and capacity building; and agricultural reforms mainly with regard to
agriculture pricing, movement of commodities and introducing private sector in wheat
operations. Most importantly, the Fiscal Responsibility and Debt Limitation Act (FRDLA) 2005
passed unanimously by both houses of the Parliament increased the transparency of fiscal operations
and injected firmer discipline into the government's borrowing and debt
strategies.
These reforms led to improved economic indicators, moving real GDP growth from 3.1
percent in FY 2001/02 to 9.0 percent in FY 2004/05 surpassing PRSP targets for the said
years and maintaining a striking average growth rate of 7.0 percent over the five years period
(2004-07). Table 2.1 shows the performance of key economic indicators against the figures as
projected in PRSP-I. The performance remained on track in almost all sectors
and exceeded targets for growth in GDP in the Manufacturing and Services sectors; and
investment, etc till FY 2006/07. This growth momentum, however, witnessed disturbances
14
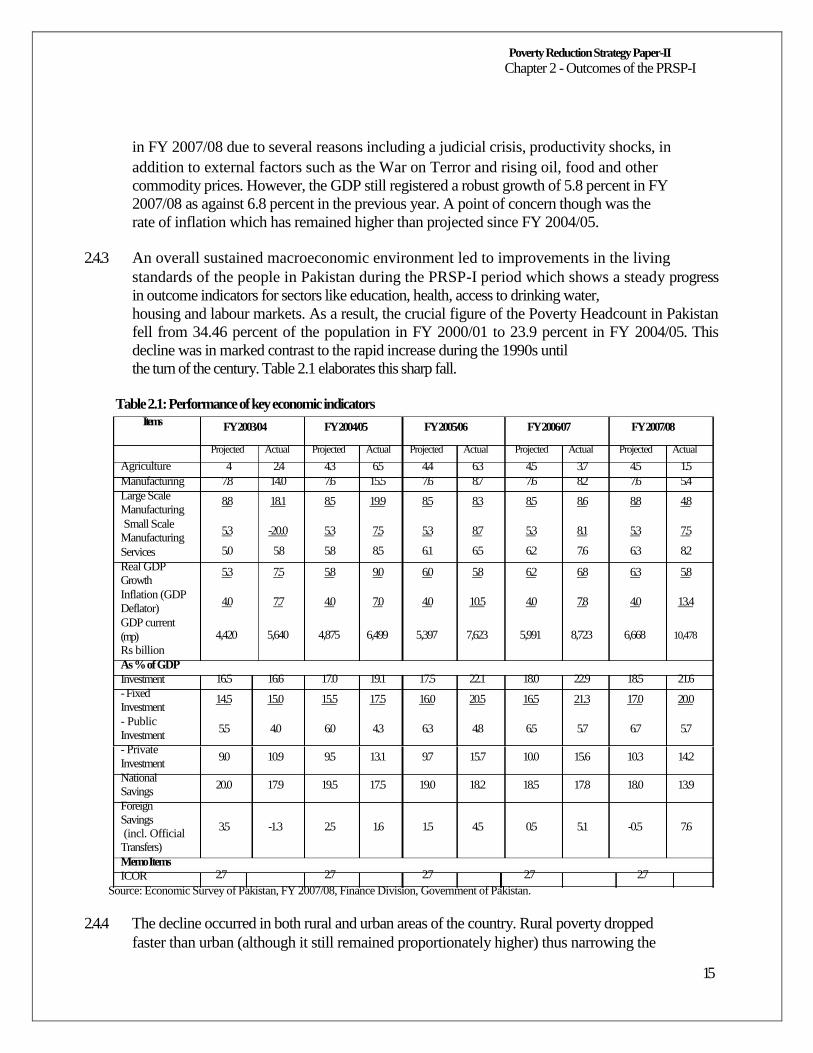
Poverty Reduction Strategy Paper-II Chapter 2 - Outcomes of the PRSP-I
in FY 2007/08 due to several reasons including a judicial crisis, productivity shocks, in
addition to external factors such as the War on Terror and rising oil, food and other
commodity prices. However, the GDP still registered a robust growth of 5.8 percent in FY
2007/08 as against 6.8 percent in the previous year. A point of concern though was the
rate of inflation which has remained higher than projected since FY 2004/05.
2.4.3
An overall sustained macroeconomic environment led to improvements in the living
standards of the people in Pakistan during the PRSP-I period which shows a steady progress
in outcome indicators for sectors like education, health, access to drinking water,
housing and labour markets. As a result, the crucial figure of the Poverty Headcount in Pakistan
fell from 34.46 percent of the population in FY 2000/01 to 23.9 percent in FY 2004/05. This
decline was in marked contrast to the rapid increase during the 1990s until
the turn of the century. Table 2.1 elaborates this sharp fall.
Table 2.1: Performance of key economic indicators
Items
Agriculture Manufacturing Large Scale Manufacturing Small Scale
Manufacturing Services Real GDP Growth Inflation (GDP Deflator) GDP current (mp) Rs billion As % of GDP Investment - Fixed Investment - Public Investment - Private Investment National Savings Foreign Savings (incl. Official
Transfers) Memo Items ICOR
FY 2003/04
Projected Actual 4 2.4
7.8 14.0
8.8 18.1
5.3 -20.0
5.0 5.8
5.3 7.5
4.0 7.7
4,420 5,640
16.5 16.6
14.5 15.0
5.5 4.0
9.0 10.9 20.0 17.9
3.5 -1.3
2.7
FY 2004/05
Projected Actual 4.3 6.5 7.6 15.5
8.5 19.9
5.3 7.5
5.8 8.5
5.8 9.0
4.0 7.0
4,875 6,499
17.0 19.1
15.5 17.5
6.0 4.3
9.5 13.1
19.5 17.5
2.5 1.6
2.7
FY 2005/06
Projected Actual 4.4 6.3 7.6 8.7
8.5 8.3
5.3 8.7
6.1 6.5
6.0 5.8
4.0 10.5
5,397 7,623
17.5 22.1
16.0 20.5
6.3 4.8
9.7 15.7
19.0 18.2
1.5 4.5
2.7
FY 2006/07
Projected Actual 4.5 3.7 7.6 8.2
8.5 8.6
5.3 8.1
6.2 7.6
6.2 6.8
4.0 7.8
5,991 8,723
18.0 22.9
16.5 21.3
6.5 5.7
10.0 15.6
18.5 17.8
0.5 5.1
2.7
FY 2007/08
Projected Actual 4.5 1.5 7.6 5.4
8.8 4.8
5.3 7.5
6.3 8.2
6.3 5.8
4.0 13.4
6,668 10,478
18.5 21.6
17.0 20.0
6.7 5.7
10.3 14.2
18.0 13.9
-0.5 7.6
2.7
Source: Economic Survey of Pakistan, FY 2007/08, Finance Division, Government of Pakistan.
2.4.4 The decline occurred in both rural and urban areas of the country. Rural poverty dropped
faster than urban (although it still remained proportionately higher) thus narrowing the
15
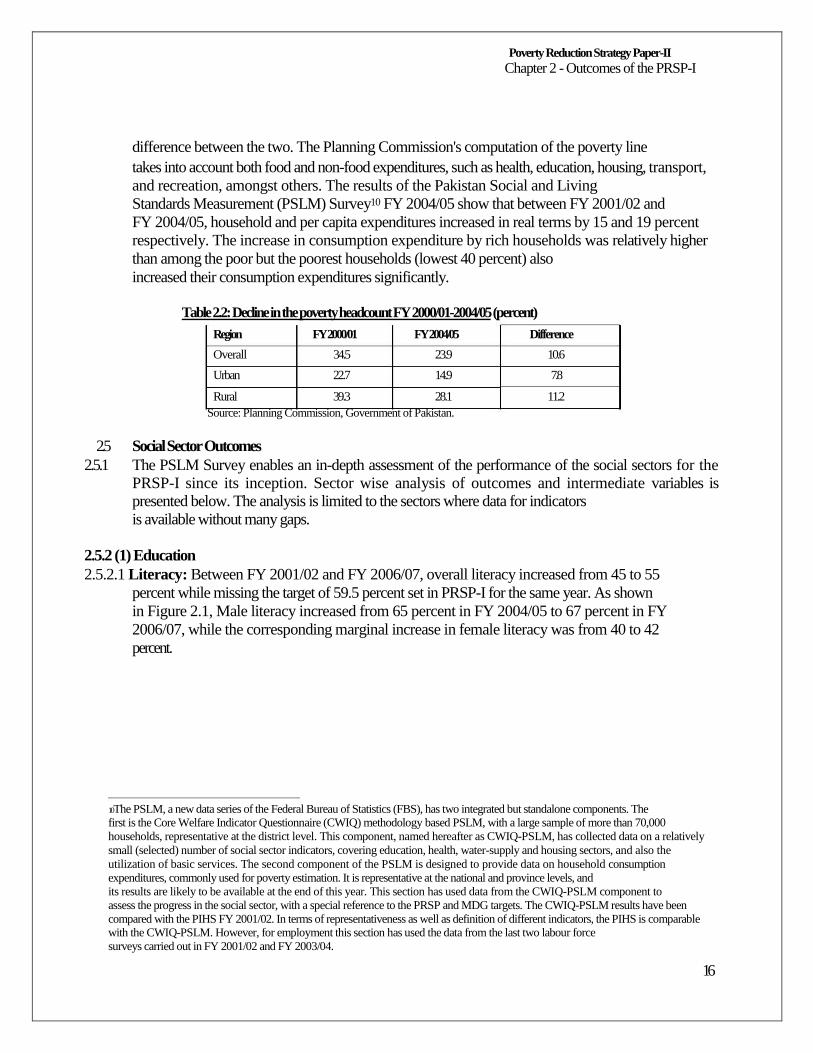
Poverty Reduction Strategy Paper-II Chapter 2 - Outcomes of the PRSP-I
difference between the two. The Planning Commission's computation of the poverty line
takes into account both food and non-food expenditures, such as health, education, housing, transport,
and recreation, amongst others. The results of the Pakistan Social and Living
Standards Measurement (PSLM) Survey10 FY 2004/05 show that between FY 2001/02 and
FY 2004/05, household and per capita expenditures increased in real terms by 15 and 19 percent
respectively. The increase in consumption expenditure by rich households was relatively higher
than among the poor but the poorest households (lowest 40 percent) also
increased their consumption expenditures significantly.
Table 2.2: Decline in the poverty headcount FY 2000/01-2004/05 (percent)
Region FY 2000/01 FY 2004/05 Difference
Overall 34.5 23.9 10.6
Urban 22.7 14.9 7.8
Rural 39.3 28.1 11.2
Source: Planning Commission, Government of Pakistan.
2.5
2.5.1
Social Sector Outcomes
The PSLM Survey enables an in-depth assessment of the performance of the social sectors for the PRSP-I since its inception. Sector wise analysis of outcomes and intermediate variables is presented below. The analysis is limited to the sectors where data for indicators
is available without many gaps.
2.5.2 (1) Education
2.5.2.1 Literacy: Between FY 2001/02 and FY 2006/07, overall literacy increased from 45 to 55
percent while missing the target of 59.5 percent set in PRSP-I for the same year. As shown
in Figure 2.1, Male literacy increased from 65 percent in FY 2004/05 to 67 percent in FY
2006/07, while the corresponding marginal increase in female literacy was from 40 to 42
percent.
10 The PSLM, a new data series of the Federal Bureau of Statistics (FBS), has two integrated but standalone components. The first is the Core Welfare Indicator Questionnaire (CWIQ) methodology based PSLM, with a large sample of more than 70,000
households, representative at the district level. This component, named hereafter as CWIQ-PSLM, has collected data on a relatively
small (selected) number of social sector indicators, covering education, health, water-supply and housing sectors, and also the
utilization of basic services. The second component of the PSLM is designed to provide data on household consumption
expenditures, commonly used for poverty estimation. It is representative at the national and province levels, and its results are likely to be available at the end of this year. This section has used data from the CWIQ-PSLM component to assess the progress in the social sector, with a special reference to the PRSP and MDG targets. The CWIQ-PSLM results have been
compared with the PIHS FY 2001/02. In terms of representativeness as well as definition of different indicators, the PIHS is comparable with the CWIQ-PSLM. However, for employment this section has used the data from the last two labour force surveys carried out in FY 2001/02 and FY 2003/04.
16
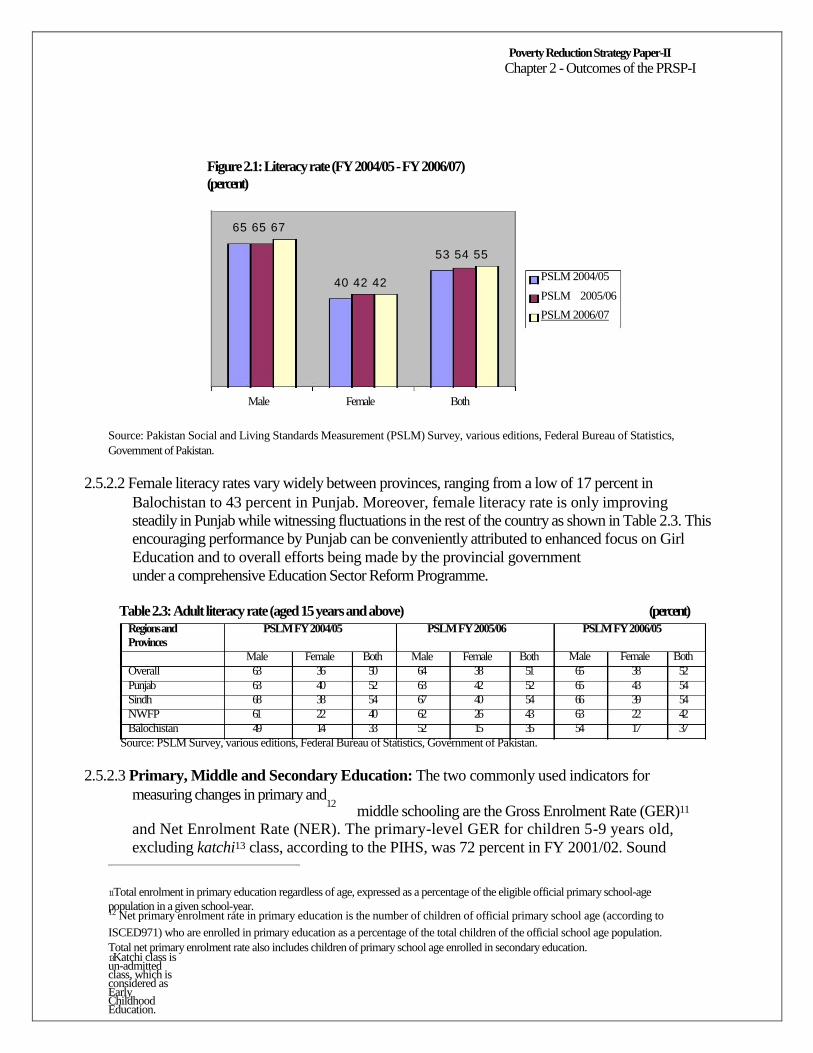
Poverty Reduction Strategy Paper-II Chapter 2 - Outcomes of the PRSP-I
Figure 2.1: Literacy rate (FY 2004/05 - FY 2006/07) (percent)
65 65 67
53 54 55
40 42 42
PSLM 2004/05
PSLM 2005/06
PSLM 2006/07
Male Female Both
Source: Pakistan Social and Living Standards Measurement (PSLM) Survey, various editions, Federal Bureau of Statistics, Government of Pakistan.
2.5.2.2 Female literacy rates vary widely between provinces, ranging from a low of 17 percent in
Balochistan to 43 percent in Punjab. Moreover, female literacy rate is only improving
steadily in Punjab while witnessing fluctuations in the rest of the country as shown in Table 2.3. This
encouraging performance by Punjab can be conveniently attributed to enhanced focus on Girl
Education and to overall efforts being made by the provincial government
under a comprehensive Education Sector Reform Programme.
Table 2.3: Adult literacy rate (aged 15 years and above) Regions and PSLM FY 2004/05 PSLM FY 2005/06 Provinces
Male Female Both Male Female Both Overall 63 36 50 64 38 51 Punjab 63 40 52 63 42 52 Sindh 68 38 54 67 40 54 NWFP 61 22 40 62 26 43 Balochistan 49 14 33 52 15 35
(percent) PSLM FY 2006/05
Male Female Both
65 38 52 65 43 54 66 39 54 63 22 42 54 17 37
Source: PSLM Survey, various editions, Federal Bureau of Statistics, Government of Pakistan.
2.5.2.3 Primary, Middle and Secondary Education: The two commonly used indicators for
measuring changes in primary and12
middle schooling are the Gross Enrolment Rate (GER)11 and Net Enrolment Rate (NER). The primary-level GER for children 5-9 years old,
excluding katchi13 class, according to the PIHS, was 72 percent in FY 2001/02. Sound
11 Total enrolment in primary education regardless of age, expressed as a percentage of the eligible official primary school-age
population in a given school-year. 12 Net primary enrolment rate in primary education is the number of children of official primary school age (according to ISCED971) who are enrolled in primary education as a percentage of the total children of the official school age population. Total net primary enrolment rate also includes children of primary school age enrolled in secondary education. 13 Katchi class is un-admitted class, which is considered as Early Childhood Education.

17
Poverty Reduction Strategy Paper-II Chapter 2 - Outcomes of the PRSP-I
progress has been made so far in improving both GER and NER and is evident when the
comparison is made between 2000-2001 and FY 2006/07 based on PSLM. The PSLM results
are encouraging in many aspects. The overall increase in primary school GER is
impressive in PRSP period, from 72 percent in FY 2001/02 to 91 percent in FY 2006/07.
2.5.2.4 The second most important indicator for measuring improvements at primary level is NER.
The PRSP target was 58 percent for FY 2005/06. A long term target of 100 percent NER by 2015
has been set by the Pakistan MDG Report 2004. Pakistan seems to have made good progress in
order to achieve the MDG target as the NER at the primary level (age 5-9)
has increased from 42 percent in FY 2001/02 to 56 in FY 2006/07.
2.5.2.5 The PRSP projected target for the middle-level GER of 53 percent in FY 2005/06 was
missed by a small margin. The middle-level GER increased from 46 percent in FY 2004/05 to 51
percent in FY 2006/07. The increase for males was 57 percent compared to females at
44 percent. The middle-level NER has remained constant at 18 percent since FY 2004/05. At the
matriculation level, the GER was 48 percent in FY 2006/07 registering an increase of 4 percent
from FY 2005/06. Provincial disaggregated analysis of GER and NER for
Primary and Middle schooling is given in Annex I.
2.5.2.6 Gender Disparities in Education: Gender disparity in education is a major challenge. The
disparity increased to 28 percent by FY 1998/99, as literacy among males grew much faster
than among females. Since then, however, 14
gap has begun to shrink, albeit very slowly. the
The only available data on gender disparity is for FY 2004/05 based on PSLM survey.
2.5.2.7 There has also been good progress in closing the gender gap in urban enrolments at
primary, middle and secondary levels. The data regarding gender disparities is only
available from PSLM FY 2004/05 and shows an overall decline in the gender gap in the GER at
the primary level, from 22 percent in FY 2001/02 to 17 percent in FY 2004/05. This decline
resulted from the relatively greater increase in the female GER compared to
the male GER between FY 2001/02 and FY 2004/05.
2.5.2.8 The gender gap15 in NER at the primary level remained unchanged at the country level
between FY 2001/02 and FY 2004/05. The gender gap in GER at the primary level declined
during the same period (as discussed above) implying thereby that the number of overage children
attending primary school is quite substantial. The gender gap in the NER
at the primary level is low in urban areas. However, it remained unchanged between FY
2001/02 and FY 2004/05. Provincial disaggregated analysis of gender gap is given in
Annex I.
14 Since PSLM FY 2005/06 & FY 2006/07 does not contain the data on Gender Gap in GER. Also, the data on Gender Gap in
Literacy is not available in PSLM FY 2005/06 and FY 2006/07 therefore it is not being reported. 15 This section has been taken from PRSP Annual Progress Report FY 2004/05, since PSLM FY 2005/06 & FY 2006/07 does
not contain the data on Gender Gap in NER. Also, the data on Gender Gap in Literacy is not available in PSLM FY 2005/06

and FY 2006/07 therefore, it is not being reported.
18
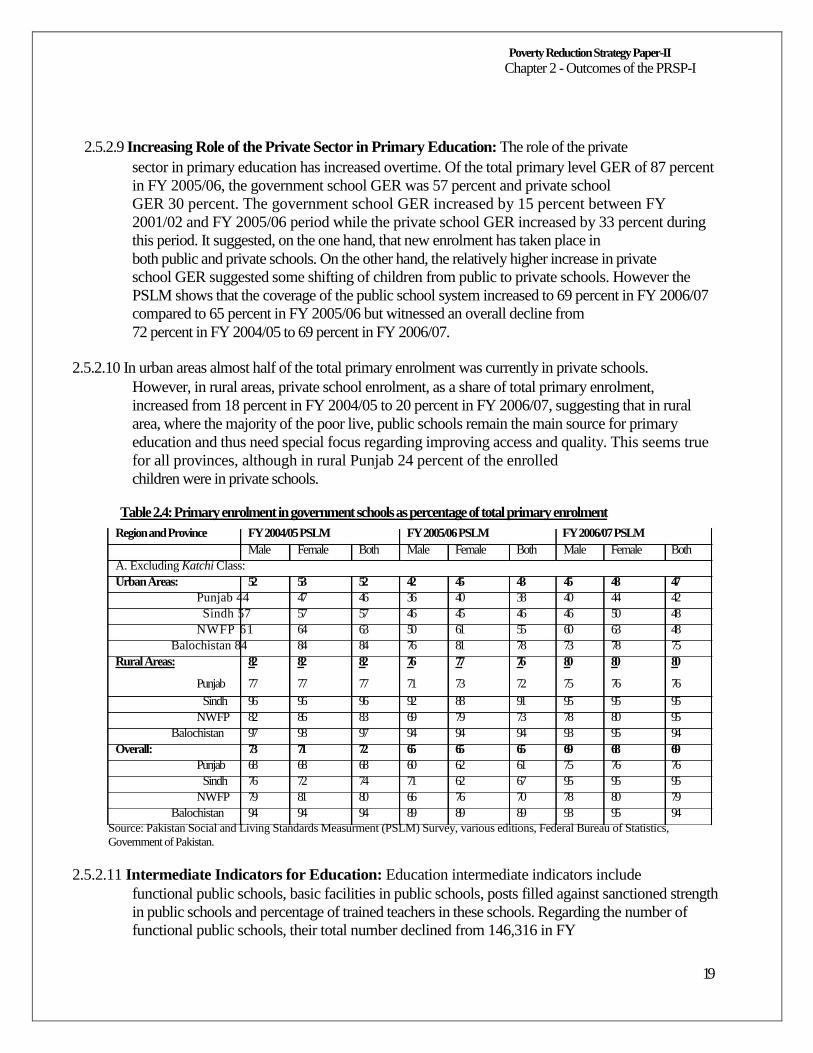
Poverty Reduction Strategy Paper-II Chapter 2 - Outcomes of the PRSP-I
2.5.2.9 Increasing Role of the Private Sector in Primary Education: The role of the private
sector in primary education has increased overtime. Of the total primary level GER of 87 percent
in FY 2005/06, the government school GER was 57 percent and private school
GER 30 percent. The government school GER increased by 15 percent between FY
2001/02 and FY 2005/06 period while the private school GER increased by 33 percent during
this period. It suggested, on the one hand, that new enrolment has taken place in
both public and private schools. On the other hand, the relatively higher increase in private
school GER suggested some shifting of children from public to private schools. However the
PSLM shows that the coverage of the public school system increased to 69 percent in FY 2006/07
compared to 65 percent in FY 2005/06 but witnessed an overall decline from
72 percent in FY 2004/05 to 69 percent in FY 2006/07.
2.5.2.10 In urban areas almost half of the total primary enrolment was currently in private schools.
However, in rural areas, private school enrolment, as a share of total primary enrolment,
increased from 18 percent in FY 2004/05 to 20 percent in FY 2006/07, suggesting that in rural
area, where the majority of the poor live, public schools remain the main source for primary
education and thus need special focus regarding improving access and quality. This seems true
for all provinces, although in rural Punjab 24 percent of the enrolled
children were in private schools.
Table 2.4: Primary enrolment in government schools as percentage of total primary enrolment
Region and Province FY 2004/05 PSLM FY 2005/06 PSLM FY 2006/07 PSLM Male Female Both Male Female Both Male Female Both
A. Excluding Katchi Class:
Urban Areas: 52 53 52 42 45 43 45 48 47 Punjab 44 47 46 36 40 38 40 44 42 Sindh 57 57 57 46 45 46 46 50 48
NWFP 61 64 63 50 61 55 60 63 48
Balochistan 84 84 84 76 81 78 73 78 75
Rural Areas: 82 82 82 76 77 76 80 80 80
Punjab 77 77 77 71 73 72 75 76 76 Sindh 96 96 96 92 88 91 95 95 95
NWFP 82 86 83 69 79 73 78 80 95 Balochistan 97 98 97 94 94 94 93 95 94
Overall: 73 71 72 65 65 65 69 68 69 Punjab 68 68 68 60 62 61 75 76 76 Sindh 76 72 74 71 62 67 95 95 95
NWFP 79 81 80 66 76 70 78 80 79 Balochistan 94 94 94 89 89 89 93 95 94
Source: Pakistan Social and Living Standards Measurment (PSLM) Survey, various editions, Federal Bureau of Statistics, Government of Pakistan.
2.5.2.11 Intermediate Indicators for Education: Education intermediate indicators include
functional public schools, basic facilities in public schools, posts filled against sanctioned strength
in public schools and percentage of trained teachers in these schools. Regarding the number of
functional public schools, their total number declined from 146,316 in FY
19
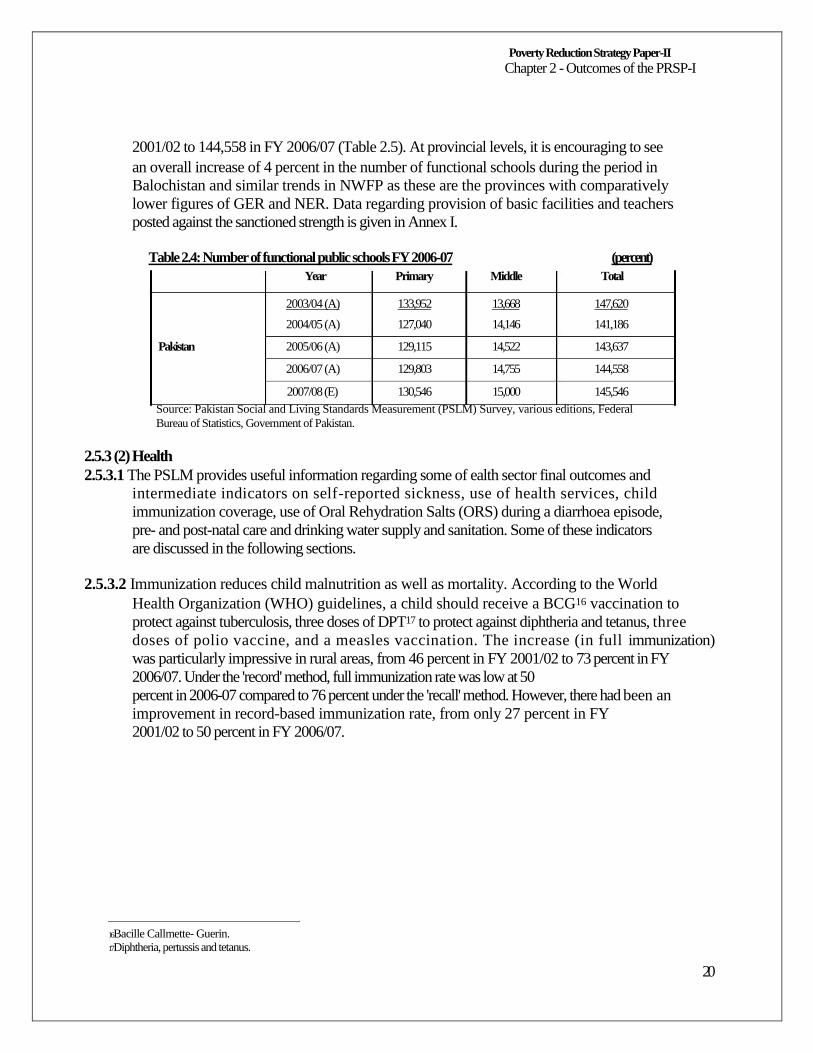
Poverty Reduction Strategy Paper-II Chapter 2 - Outcomes of the PRSP-I
2001/02 to 144,558 in FY 2006/07 (Table 2.5). At provincial levels, it is encouraging to see
an overall increase of 4 percent in the number of functional schools during the period in
Balochistan and similar trends in NWFP as these are the provinces with comparatively
lower figures of GER and NER. Data regarding provision of basic facilities and teachers
posted against the sanctioned strength is given in Annex I.
Table 2.4: Number of functional public schools FY 2006-07 Year Primary Middle
2003/04 (A) 133,952 13,668
2004/05 (A) 127,040 14,146
Pakistan 2005/06 (A) 129,115 14,522
2006/07 (A) 129,803 14,755
2007/08 (E) 130,546 15,000
(percent) Total
147,620
141,186
143,637
144,558
145,546
Source: Pakistan Social and Living Standards Measurement (PSLM) Survey, various editions, Federal Bureau of Statistics, Government of Pakistan.
2.5.3 (2) Health
2.5.3.1 The PSLM provides useful information regarding some of ealth sector final outcomes and
intermediate indicators on self-reported sickness, use of health services, child
immunization coverage, use of Oral Rehydration Salts (ORS) during a diarrhoea episode,
pre- and post-natal care and drinking water supply and sanitation. Some of these indicators
are discussed in the following sections.
2.5.3.2 Immunization reduces child malnutrition as well as mortality. According to the World
Health Organization (WHO) guidelines, a child should receive a BCG16 vaccination to
protect against tuberculosis, three doses of DPT17 to protect against diphtheria and tetanus, three
doses of polio vaccine, and a measles vaccination. The increase (in full immunization)
was particularly impressive in rural areas, from 46 percent in FY 2001/02 to 73 percent in FY
2006/07. Under the 'record' method, full immunization rate was low at 50
percent in 2006-07 compared to 76 percent under the 'recall' method. However, there had been an
improvement in record-based immunization rate, from only 27 percent in FY
2001/02 to 50 percent in FY 2006/07.
16 Bacille Callmette- Guerin. 17 Diphtheria, pertussis and tetanus.
20
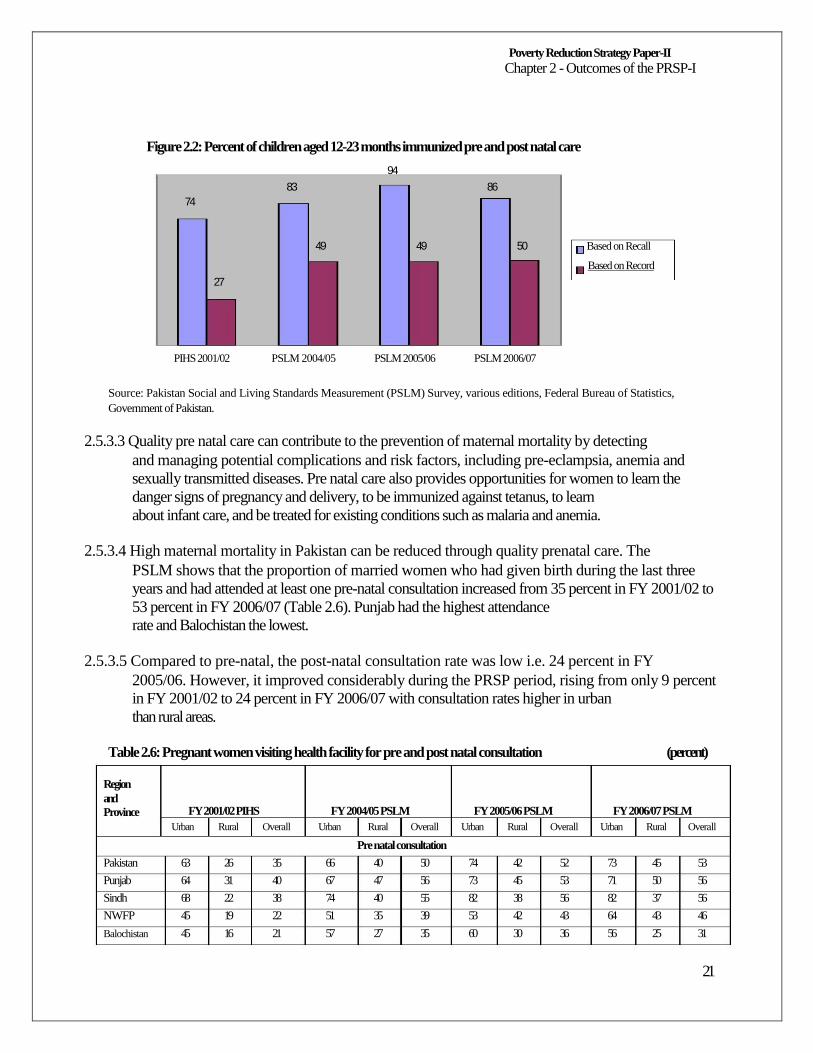
Poverty Reduction Strategy Paper-II Chapter 2 - Outcomes of the PRSP-I
Figure 2.2: Percent of children aged 12-23 months immunized pre and post natal care
94
83 86 74
49 49 50 Based on Recall
Based on Record 27
PIHS 2001/02 PSLM 2004/05 PSLM 2005/06 PSLM 2006/07
Source: Pakistan Social and Living Standards Measurement (PSLM) Survey, various editions, Federal Bureau of Statistics, Government of Pakistan.
2.5.3.3 Quality pre natal care can contribute to the prevention of maternal mortality by detecting
and managing potential complications and risk factors, including pre-eclampsia, anemia and
sexually transmitted diseases. Pre natal care also provides opportunities for women to learn the
danger signs of pregnancy and delivery, to be immunized against tetanus, to learn
about infant care, and be treated for existing conditions such as malaria and anemia.
2.5.3.4 High maternal mortality in Pakistan can be reduced through quality prenatal care. The
PSLM shows that the proportion of married women who had given birth during the last three
years and had attended at least one pre-natal consultation increased from 35 percent in FY 2001/02 to
53 percent in FY 2006/07 (Table 2.6). Punjab had the highest attendance
rate and Balochistan the lowest.
2.5.3.5 Compared to pre-natal, the post-natal consultation rate was low i.e. 24 percent in FY
2005/06. However, it improved considerably during the PRSP period, rising from only 9 percent
in FY 2001/02 to 24 percent in FY 2006/07 with consultation rates higher in urban
than rural areas.
Table 2.6: Pregnant women visiting health facility for pre and post natal consultation (percent)
Region and
Province FY 2001/02 PIHS FY 2004/05 PSLM FY 2005/06 PSLM FY 2006/07 PSLM
Urban Rural Overall Urban Rural Overall Urban Rural Overall Urban Rural Overall
Pre natal consultation
Pakistan 63 26 35 66 40 50 74 42 52 73 45 53 Punjab 64 31 40 67 47 56 73 45 53 71 50 56 Sindh 68 22 38 74 40 55 82 38 56 82 37 56 NWFP 45 19 22 51 35 39 53 42 43 64 43 46 Balochistan 45 16 21 57 27 35 60 30 36 56 25 31
21
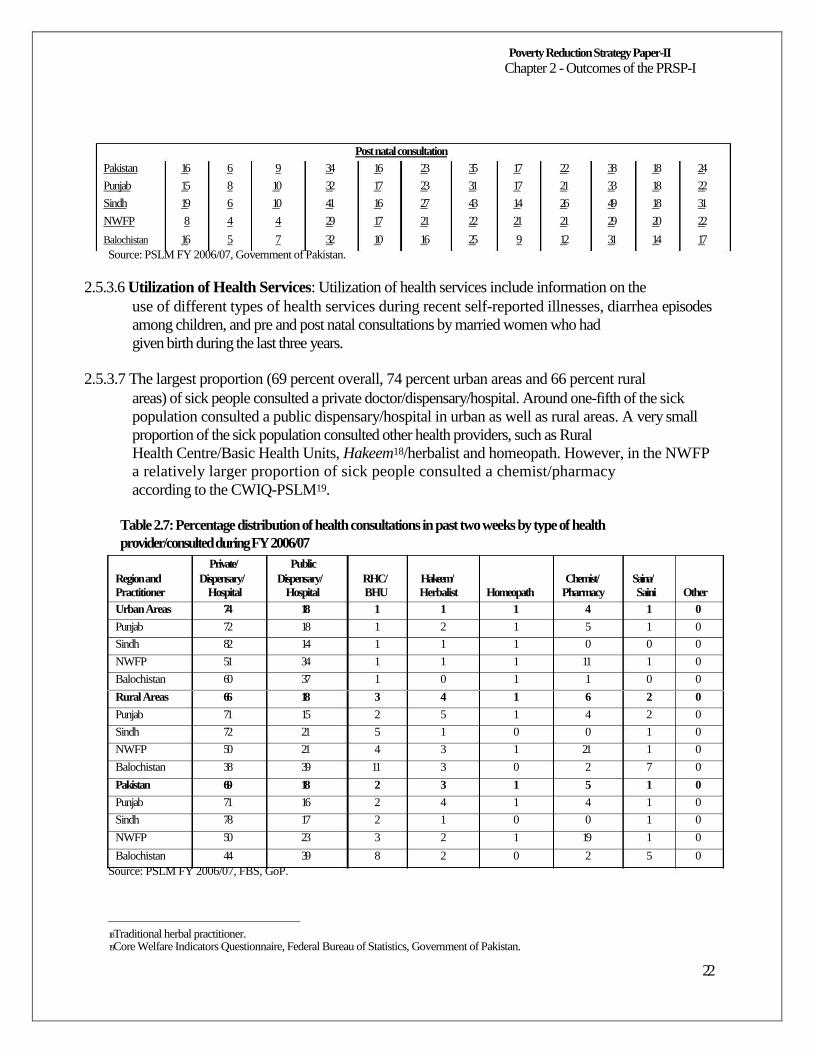
Poverty Reduction Strategy Paper-II Chapter 2 - Outcomes of the PRSP-I
Post natal consultation
Pakistan 16 6 9 34 16 23 35 17 22 38 18 24 Punjab 15 8 10 32 17 23 31 17 21 33 18 22 Sindh 19 6 10 41 16 27 43 14 26 49 18 31 NWFP 8 4 4 29 17 21 22 21 21 29 20 22
Balochistan 16 5 7 32 10 16 25 9 12 31 14 17
Source: PSLM FY 2006/07, Government of Pakistan.
2.5.3.6 Utilization of Health Services: Utilization of health services include information on the
use of different types of health services during recent self-reported illnesses, diarrhea episodes
among children, and pre and post natal consultations by married women who had
given birth during the last three years.
2.5.3.7 The largest proportion (69 percent overall, 74 percent urban areas and 66 percent rural
areas) of sick people consulted a private doctor/dispensary/hospital. Around one-fifth of the sick
population consulted a public dispensary/hospital in urban as well as rural areas. A very small
proportion of the sick population consulted other health providers, such as Rural
Health Centre/Basic Health Units, Hakeem18/herbalist and homeopath. However, in the NWFP
a relatively larger proportion of sick people consulted a chemist/pharmacy
according to the CWIQ-PSLM19.
Table 2.7: Percentage distribution of health consultations in past two weeks by type of health provider/consulted during FY 2006/07
Private/ Public Region and Dispensary/ Dispensary/ RHC/ Hakeem/ Chemist/ Saina/ Practitioner Hospital Hospital BHU Herbalist Homeopath Pharmacy Saini Other Urban Areas 74 18 1 1 1 4 1 0 Punjab 72 18 1 2 1 5 1 0 Sindh 82 14 1 1 1 0 0 0 NWFP 51 34 1 1 1 11 1 0 Balochistan 60 37 1 0 1 1 0 0 Rural Areas 66 18 3 4 1 6 2 0 Punjab 71 15 2 5 1 4 2 0 Sindh 72 21 5 1 0 0 1 0 NWFP 50 21 4 3 1 21 1 0 Balochistan 38 39 11 3 0 2 7 0 Pakistan 69 18 2 3 1 5 1 0 Punjab 71 16 2 4 1 4 1 0 Sindh 78 17 2 1 0 0 1 0 NWFP 50 23 3 2 1 19 1 0
Balochistan 44 39 8 2 0 2 5 0
Source: PSLM FY 2006/07, FBS, GoP.
18 Traditional herbal practitioner. 19 Core Welfare Indicators Questionnaire, Federal Bureau of Statistics, Government of Pakistan.
22
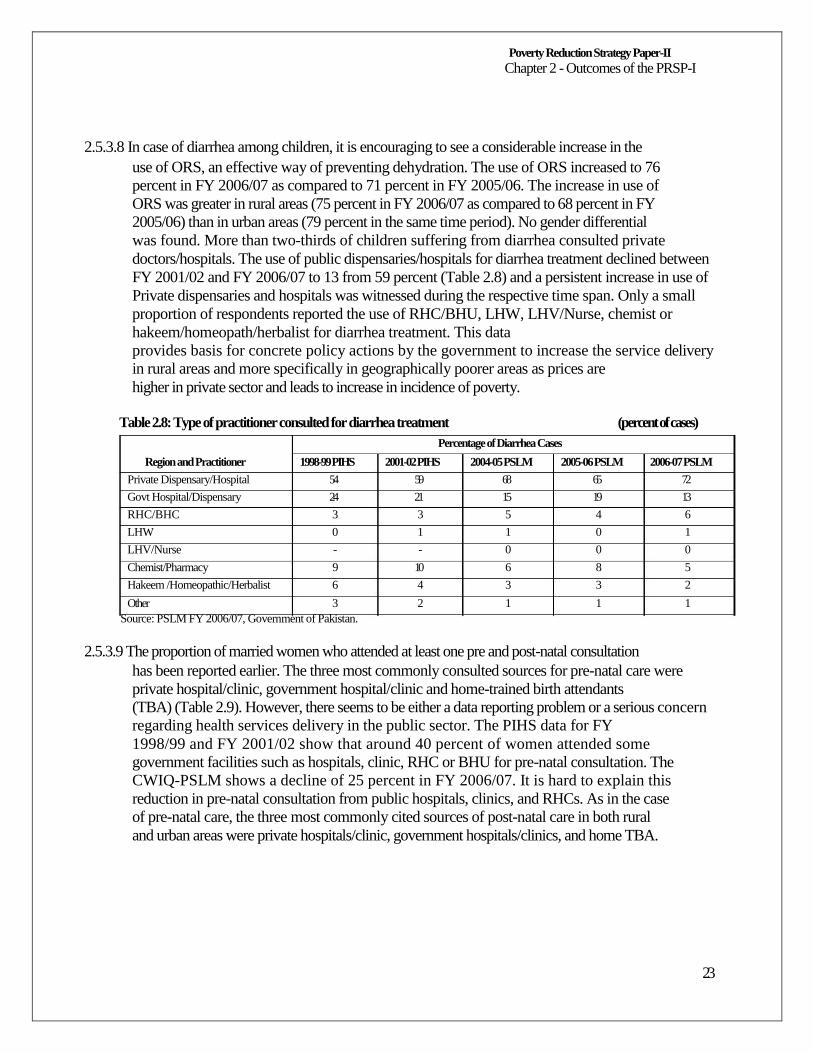
Poverty Reduction Strategy Paper-II Chapter 2 - Outcomes of the PRSP-I
2.5.3.8 In case of diarrhea among children, it is encouraging to see a considerable increase in the
use of ORS, an effective way of preventing dehydration. The use of ORS increased to 76
percent in FY 2006/07 as compared to 71 percent in FY 2005/06. The increase in use of
ORS was greater in rural areas (75 percent in FY 2006/07 as compared to 68 percent in FY
2005/06) than in urban areas (79 percent in the same time period). No gender differential
was found. More than two-thirds of children suffering from diarrhea consulted private
doctors/hospitals. The use of public dispensaries/hospitals for diarrhea treatment declined between
FY 2001/02 and FY 2006/07 to 13 from 59 percent (Table 2.8) and a persistent increase in use of
Private dispensaries and hospitals was witnessed during the respective time span. Only a small
proportion of respondents reported the use of RHC/BHU, LHW, LHV/Nurse, chemist or
hakeem/homeopath/herbalist for diarrhea treatment. This data
provides basis for concrete policy actions by the government to increase the service delivery
in rural areas and more specifically in geographically poorer areas as prices are
higher in private sector and leads to increase in incidence of poverty.
Table 2.8: Type of practitioner consulted for diarrhea treatment (percent of cases)
Percentage of Diarrhea Cases
Region and Practitioner 1998-99 PIHS 2001-02 PIHS 2004-05 PSLM 2005-06 PSLM 2006-07 PSLM Private Dispensary/Hospital 54 59 68 65 72 Govt Hospital/Dispensary 24 21 15 19 13 RHC/BHC 3 3 5 4 6 LHW 0 1 1 0 1 LHV/Nurse - - 0 0 0 Chemist/Pharmacy 9 10 6 8 5 Hakeem /Homeopathic/Herbalist 6 4 3 3 2
Other 3 2 1 1 1
Source: PSLM FY 2006/07, Government of Pakistan.
2.5.3.9 The proportion of married women who attended at least one pre and post-natal consultation
has been reported earlier. The three most commonly consulted sources for pre-natal care were
private hospital/clinic, government hospital/clinic and home-trained birth attendants
(TBA) (Table 2.9). However, there seems to be either a data reporting problem or a serious concern
regarding health services delivery in the public sector. The PIHS data for FY
1998/99 and FY 2001/02 show that around 40 percent of women attended some
government facilities such as hospitals, clinic, RHC or BHU for pre-natal consultation. The
CWIQ-PSLM shows a decline of 25 percent in FY 2006/07. It is hard to explain this
reduction in pre-natal consultation from public hospitals, clinics, and RHCs. As in the case
of pre-natal care, the three most commonly cited sources of post-natal care in both rural
and urban areas were private hospitals/clinic, government hospitals/clinics, and home TBA.
23
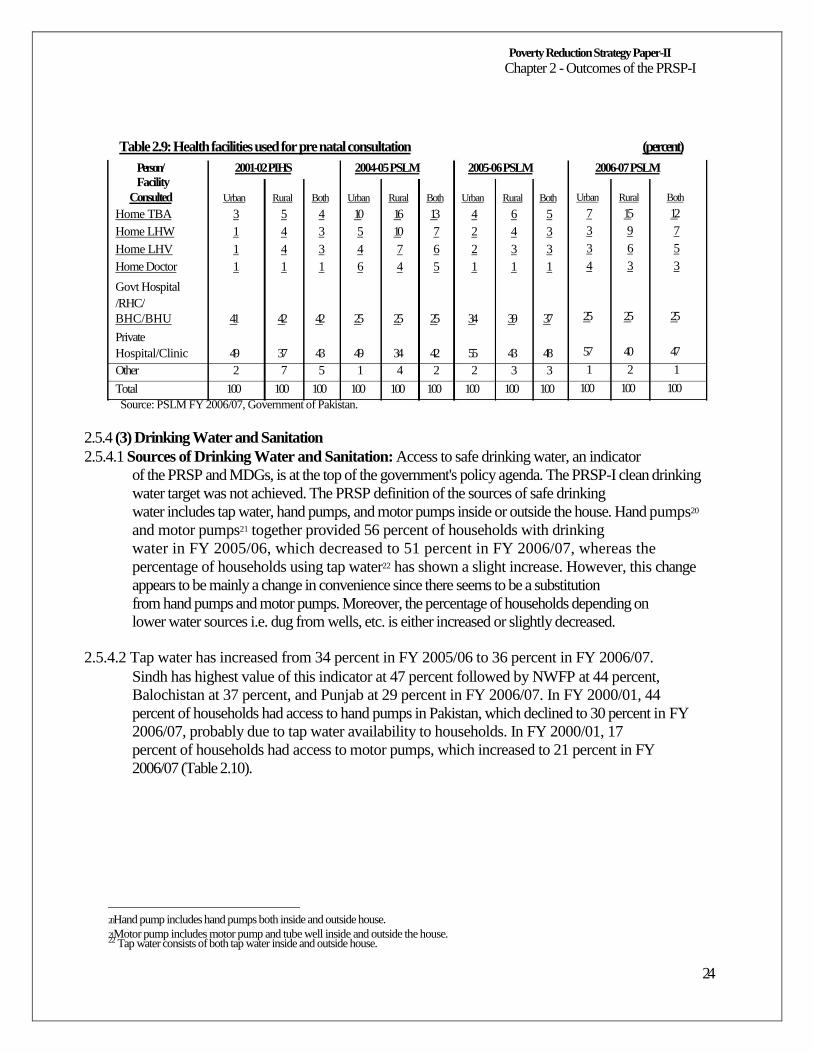
Poverty Reduction Strategy Paper-II Chapter 2 - Outcomes of the PRSP-I
Table 2.9: Health facilities used for pre natal consultation
Person/ 2001-02 PIHS 2004-05 PSLM 2005-06 PSLM Facility
Consulted Urban Rural Both Urban Rural Both Urban Rural Both Home TBA 3 5 4 10 16 13 4 6 5 Home LHW 1 4 3 5 10 7 2 4 3 Home LHV 1 4 3 4 7 6 2 3 3 Home Doctor 1 1 1 6 4 5 1 1 1
Govt Hospital /RHC/ BHC/BHU 41 42 42 25 25 25 34 39 37
Private Hospital/Clinic 49 37 43 49 34 42 55 43 48 Other 2 7 5 1 4 2 2 3 3
Total 100 100 100 100 100 100 100 100 100 Source: PSLM FY 2006/07, Government of Pakistan.
2.5.4 (3) Drinking Water and Sanitation
(percent)
2006-07 PSLM Urban Rural Both
7 15 12 3 9 7 3 6 5 4 3 3
25 25 25
57 40 47
1 2 1
100 100 100
2.5.4.1 Sources of Drinking Water and Sanitation: Access to safe drinking water, an indicator
of the PRSP and MDGs, is at the top of the government's policy agenda. The PRSP-I clean drinking
water target was not achieved. The PRSP definition of the sources of safe drinking
water includes tap water, hand pumps, and motor pumps inside or outside the house. Hand pumps20
and motor pumps21 together provided 56 percent of households with drinking
water in FY 2005/06, which decreased to 51 percent in FY 2006/07, whereas the
percentage of households using tap water22 has shown a slight increase. However, this change
appears to be mainly a change in convenience since there seems to be a substitution
from hand pumps and motor pumps. Moreover, the percentage of households depending on
lower water sources i.e. dug from wells, etc. is either increased or slightly decreased.
2.5.4.2 Tap water has increased from 34 percent in FY 2005/06 to 36 percent in FY 2006/07.
Sindh has highest value of this indicator at 47 percent followed by NWFP at 44 percent,
Balochistan at 37 percent, and Punjab at 29 percent in FY 2006/07. In FY 2000/01, 44
percent of households had access to hand pumps in Pakistan, which declined to 30 percent in FY
2006/07, probably due to tap water availability to households. In FY 2000/01, 17
percent of households had access to motor pumps, which increased to 21 percent in FY
2006/07 (Table 2.10).
20 Hand pump includes hand pumps both inside and outside house. 21 Motor pump includes motor pump and tube well inside and outside the house. 22 Tap water consists of both tap water inside and outside house.
24
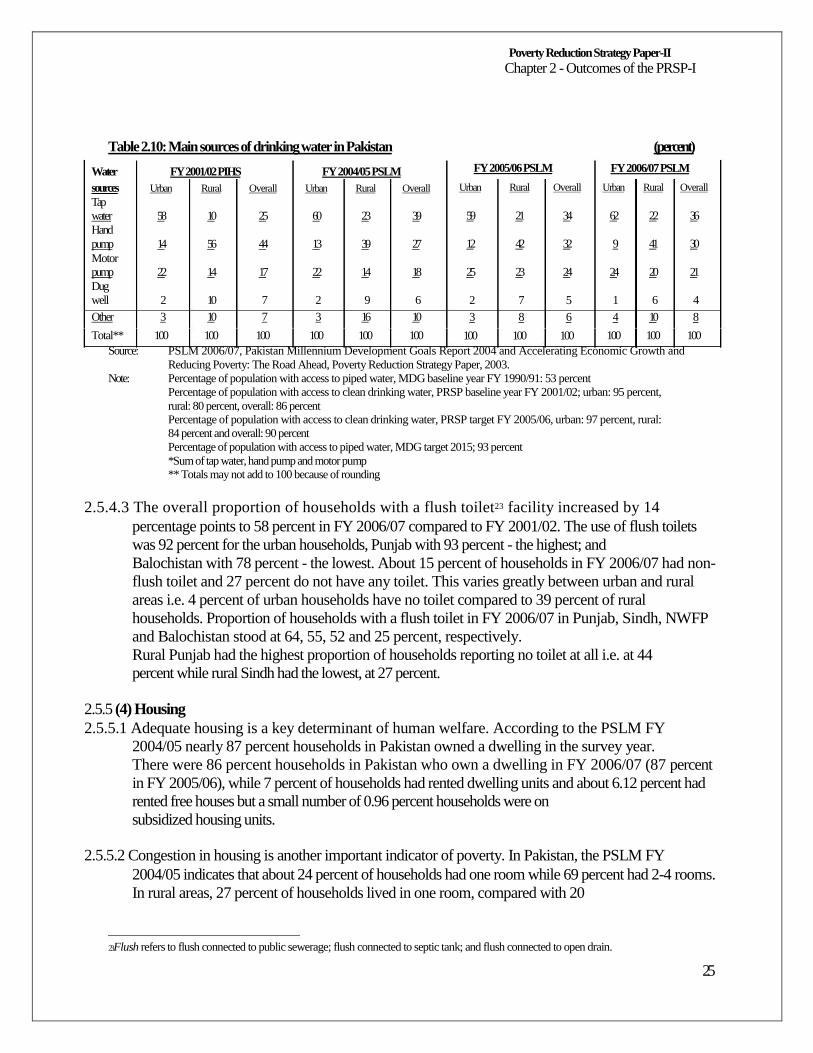
Poverty Reduction Strategy Paper-II Chapter 2 - Outcomes of the PRSP-I
Table 2.10: Main sources of drinking water in Pakistan
Water FY 2001/02 PIHS FY 2004/05 PSLM sources Urban Rural Overall Urban Rural Overall Tap water 58 10 25 60 23 39 Hand pump 14 56 44 13 39 27 Motor pump 22 14 17 22 14 18 Dug well 2 10 7 2 9 6 Other 3 10 7 3 16 10
Total** 100 100 100 100 100 100
FY 2005/06 PSLM
Urban Rural Overall
59 21 34
12 42 32
25 23 24
2 7 5 3 8 6
100 100 100
(percent)
FY 2006/07 PSLM
Urban Rural Overall
62 22 36
9 41 30
24 20 21
1 6 4 4 10 8
100 100 100
Source:
Note:
PSLM 2006/07, Pakistan Millennium Development Goals Report 2004 and Accelerating Economic Growth and Reducing Poverty: The Road Ahead, Poverty Reduction Strategy Paper, 2003. Percentage of population with access to piped water, MDG baseline year FY 1990/91: 53 percent Percentage of population with access to clean drinking water, PRSP baseline year FY 2001/02; urban: 95 percent, rural: 80 percent, overall: 86 percent Percentage of population with access to clean drinking water, PRSP target FY 2005/06, urban: 97 percent, rural: 84 percent and overall: 90 percent Percentage of population with access to piped water, MDG target 2015; 93 percent *Sum of tap water, hand pump and motor pump ** Totals may not add to 100 because of rounding
2.5.4.3 The overall proportion of households with a flush toilet23 facility increased by 14
percentage points to 58 percent in FY 2006/07 compared to FY 2001/02. The use of flush toilets
was 92 percent for the urban households, Punjab with 93 percent - the highest; and
Balochistan with 78 percent - the lowest. About 15 percent of households in FY 2006/07 had non-
flush toilet and 27 percent do not have any toilet. This varies greatly between urban and rural
areas i.e. 4 percent of urban households have no toilet compared to 39 percent of rural
households. Proportion of households with a flush toilet in FY 2006/07 in Punjab, Sindh, NWFP
and Balochistan stood at 64, 55, 52 and 25 percent, respectively.
Rural Punjab had the highest proportion of households reporting no toilet at all i.e. at 44
percent while rural Sindh had the lowest, at 27 percent.
2.5.5 (4) Housing
2.5.5.1 Adequate housing is a key determinant of human welfare. According to the PSLM FY
2004/05 nearly 87 percent households in Pakistan owned a dwelling in the survey year.
There were 86 percent households in Pakistan who own a dwelling in FY 2006/07 (87 percent
in FY 2005/06), while 7 percent of households had rented dwelling units and about 6.12 percent had
rented free houses but a small number of 0.96 percent households were on
subsidized housing units.
2.5.5.2 Congestion in housing is another important indicator of poverty. In Pakistan, the PSLM FY
2004/05 indicates that about 24 percent of households had one room while 69 percent had 2-4 rooms.
In rural areas, 27 percent of households lived in one room, compared with 20
23 Flush refers to flush connected to public sewerage; flush connected to septic tank; and flush connected to open drain.
25
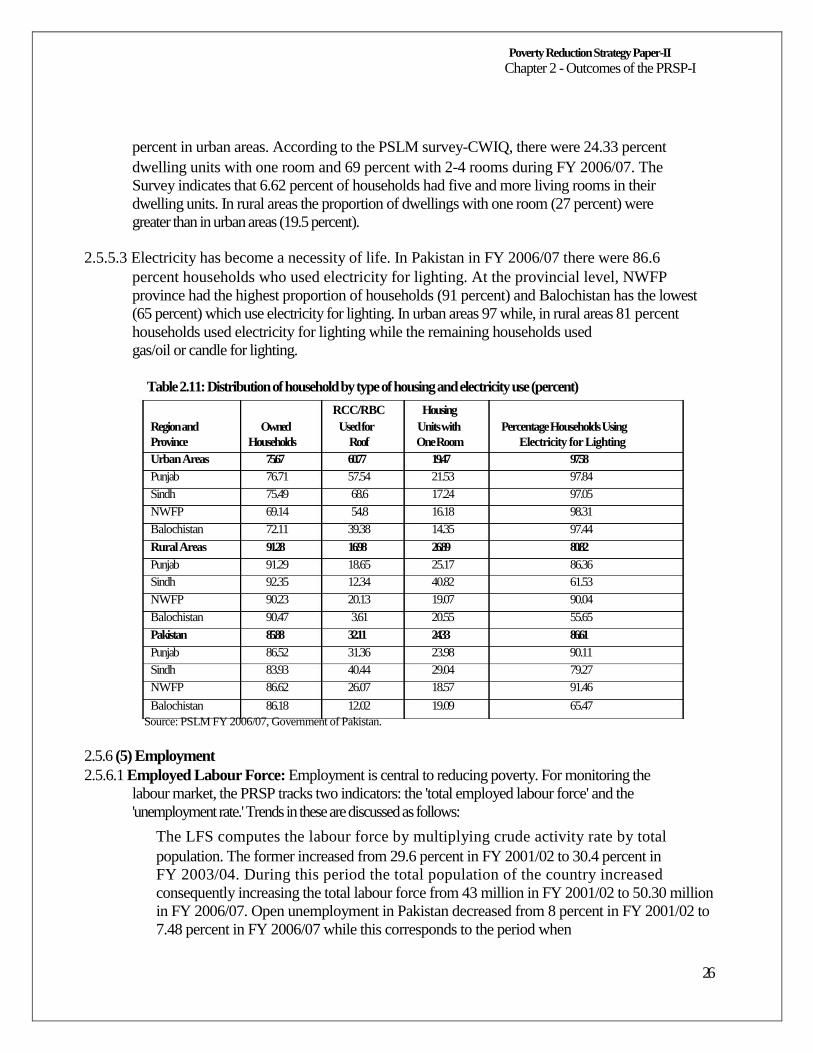
Poverty Reduction Strategy Paper-II Chapter 2 - Outcomes of the PRSP-I
percent in urban areas. According to the PSLM survey-CWIQ, there were 24.33 percent
dwelling units with one room and 69 percent with 2-4 rooms during FY 2006/07. The
Survey indicates that 6.62 percent of households had five and more living rooms in their
dwelling units. In rural areas the proportion of dwellings with one room (27 percent) were
greater than in urban areas (19.5 percent).
2.5.5.3 Electricity has become a necessity of life. In Pakistan in FY 2006/07 there were 86.6
percent households who used electricity for lighting. At the provincial level, NWFP
province had the highest proportion of households (91 percent) and Balochistan has the lowest
(65 percent) which use electricity for lighting. In urban areas 97 while, in rural areas 81 percent
households used electricity for lighting while the remaining households used
gas/oil or candle for lighting.
Table 2.11: Distribution of household by type of housing and electricity use (percent)
RCC/RBC Housing Region and Owned Used for Units with Percentage Households Using Province Households Roof One Room Electricity for Lighting Urban Areas 75.67 60.77 19.47 97.58 Punjab 76.71 57.54 21.53 97.84 Sindh 75.49 68.6 17.24 97.05 NWFP 69.14 54.8 16.18 98.31 Balochistan 72.11 39.38 14.35 97.44 Rural Areas 91.28 16.98 26.89 80.82 Punjab 91.29 18.65 25.17 86.36 Sindh 92.35 12.34 40.82 61.53 NWFP 90.23 20.13 19.07 90.04 Balochistan 90.47 3.61 20.55 55.65 Pakistan 85.88 32.11 24.33 86.61 Punjab 86.52 31.36 23.98 90.11 Sindh 83.93 40.44 29.04 79.27 NWFP 86.62 26.07 18.57 91.46
Balochistan 86.18 12.02 19.09 65.47
Source: PSLM FY 2006/07, Government of Pakistan.
2.5.6 (5) Employment
2.5.6.1 Employed Labour Force: Employment is central to reducing poverty. For monitoring the
labour market, the PRSP tracks two indicators: the 'total employed labour force' and the
'unemployment rate.' Trends in these are discussed as follows:
The LFS computes the labour force by multiplying crude activity rate by total
population. The former increased from 29.6 percent in FY 2001/02 to 30.4 percent in
FY 2003/04. During this period the total population of the country increased
consequently increasing the total labour force from 43 million in FY 2001/02 to 50.30 million
in FY 2006/07. Open unemployment in Pakistan decreased from 8 percent in FY 2001/02 to
7.48 percent in FY 2006/07 while this corresponds to the period when
26
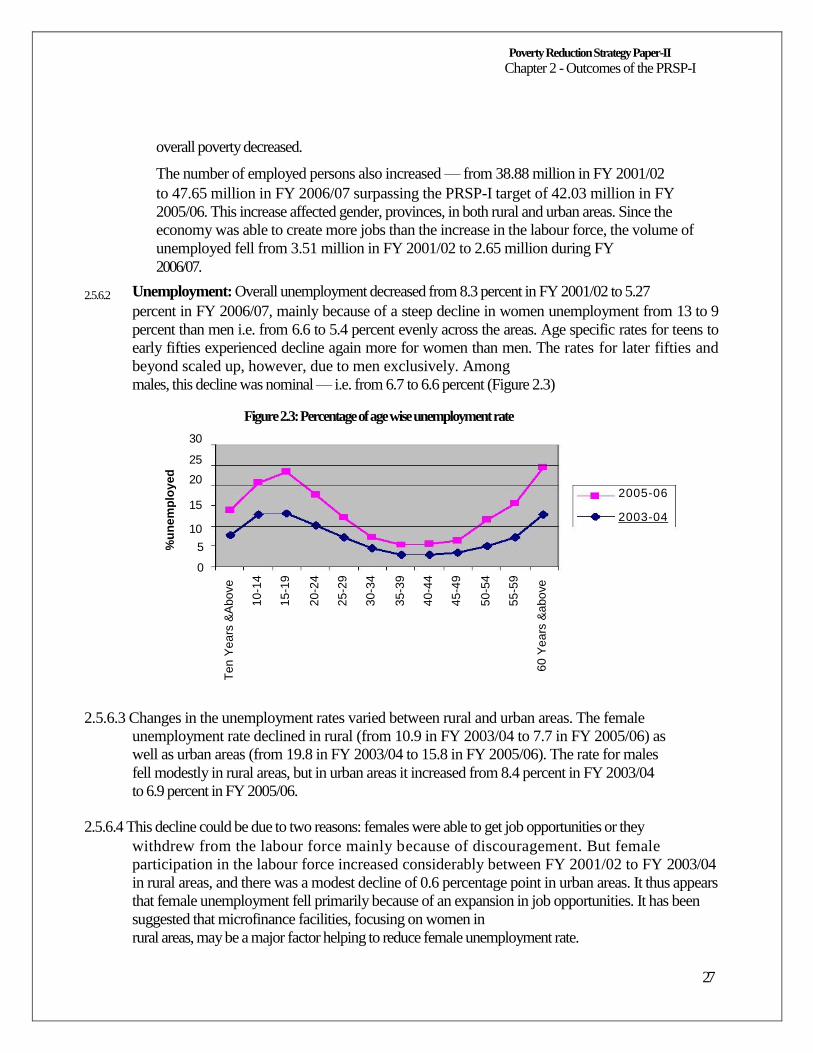
Poverty Reduction Strategy Paper-II Chapter 2 - Outcomes of the PRSP-I
overall poverty decreased.
The number of employed persons also increased — from 38.88 million in FY 2001/02
to 47.65 million in FY 2006/07 surpassing the PRSP-I target of 42.03 million in FY
2005/06. This increase affected gender, provinces, in both rural and urban areas. Since the
economy was able to create more jobs than the increase in the labour force, the volume of
unemployed fell from 3.51 million in FY 2001/02 to 2.65 million during FY
2006/07. 2.5.6.2 Unemployment: Overall unemployment decreased from 8.3 percent in FY 2001/02 to 5.27
percent in FY 2006/07, mainly because of a steep decline in women unemployment from 13 to 9
percent than men i.e. from 6.6 to 5.4 percent evenly across the areas. Age specific rates for teens to
early fifties experienced decline again more for women than men. The rates for later fifties and
beyond scaled up, however, due to men exclusively. Among
males, this decline was nominal — i.e. from 6.7 to 6.6 percent (Figure 2.3)
Figure 2.3: Percentage of age wise unemployment rate
30
25
20 2005-06
15 2003-04
10 5
0
2.5.6.3 Changes in the unemployment rates varied between rural and urban areas. The female
unemployment rate declined in rural (from 10.9 in FY 2003/04 to 7.7 in FY 2005/06) as
well as urban areas (from 19.8 in FY 2003/04 to 15.8 in FY 2005/06). The rate for males
fell modestly in rural areas, but in urban areas it increased from 8.4 percent in FY 2003/04
to 6.9 percent in FY 2005/06.
2.5.6.4 This decline could be due to two reasons: females were able to get job opportunities or they
withdrew from the labour force mainly because of discouragement. But female
participation in the labour force increased considerably between FY 2001/02 to FY 2003/04
in rural areas, and there was a modest decline of 0.6 percentage point in urban areas. It thus appears
that female unemployment fell primarily because of an expansion in job opportunities. It has been
suggested that microfinance facilities, focusing on women in
rural areas, may be a major factor helping to reduce female unemployment rate.
27
%u
ne
mp
loy
ed
Te
n Y
ea
rs &
Abo
ve
10
-14
15
-19
20
-24
25
-29
30
-34
35
-39
40
-44
45
-49
50
-54
55
-59
60
Ye
ars
&a
bo
ve
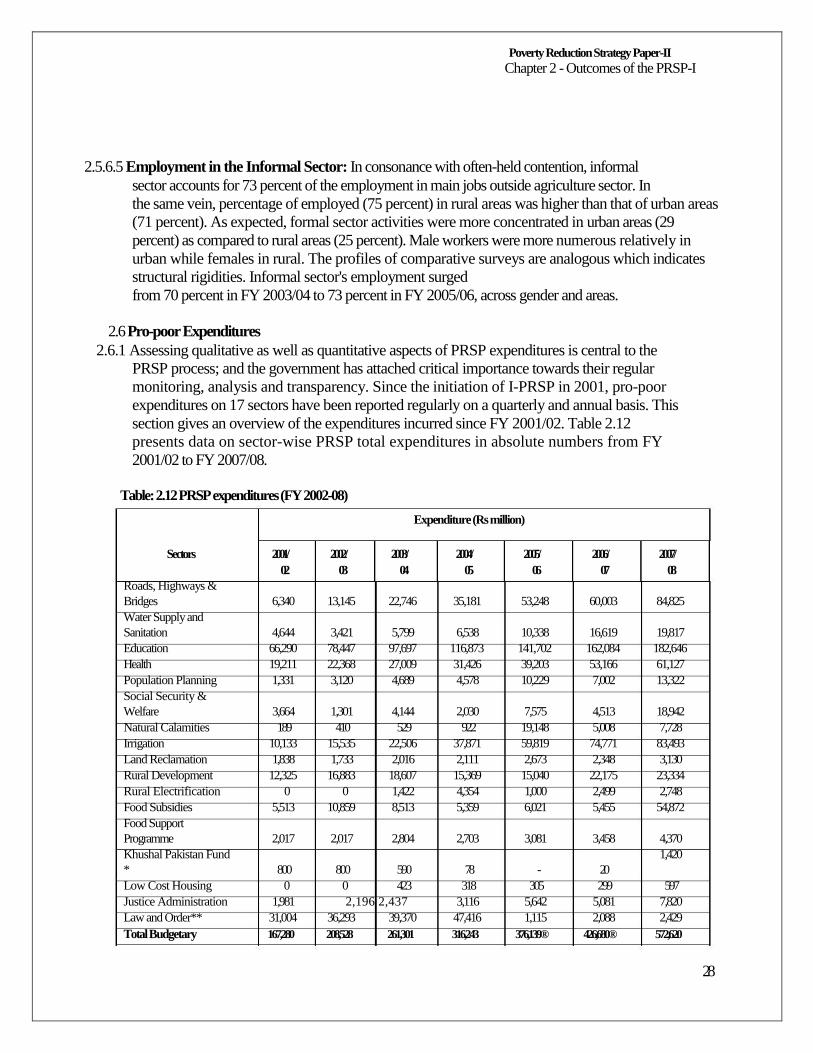
Poverty Reduction Strategy Paper-II Chapter 2 - Outcomes of the PRSP-I
2.5.6.5 Employment in the Informal Sector: In consonance with often-held contention, informal
sector accounts for 73 percent of the employment in main jobs outside agriculture sector. In
the same vein, percentage of employed (75 percent) in rural areas was higher than that of urban areas
(71 percent). As expected, formal sector activities were more concentrated in urban areas (29
percent) as compared to rural areas (25 percent). Male workers were more numerous relatively in
urban while females in rural. The profiles of comparative surveys are analogous which indicates
structural rigidities. Informal sector's employment surged
from 70 percent in FY 2003/04 to 73 percent in FY 2005/06, across gender and areas.
2.6 Pro-poor Expenditures
2.6.1 Assessing qualitative as well as quantitative aspects of PRSP expenditures is central to the
PRSP process; and the government has attached critical importance towards their regular
monitoring, analysis and transparency. Since the initiation of I-PRSP in 2001, pro-poor
expenditures on 17 sectors have been reported regularly on a quarterly and annual basis. This
section gives an overview of the expenditures incurred since FY 2001/02. Table 2.12
presents data on sector-wise PRSP total expenditures in absolute numbers from FY
2001/02 to FY 2007/08.
Table: 2.12 PRSP expenditures (FY 2002-08)
Expenditure (Rs million)
Sectors 2001/ 2002/ 2003/ 2004/ 2005/ 2006/ 2007/ 02 03 04 05 06 07 08
Roads, Highways & Bridges 6,340 13,145 22,746 35,181 53,248 60,003 84,825 Water Supply and Sanitation 4,644 3,421 5,799 6,538 10,338 16,619 19,817 Education 66,290 78,447 97,697 116,873 141,702 162,084 182,646 Health 19,211 22,368 27,009 31,426 39,203 53,166 61,127 Population Planning 1,331 3,120 4,689 4,578 10,229 7,002 13,322 Social Security & Welfare 3,664 1,301 4,144 2,030 7,575 4,513 18,942 Natural Calamities 189 410 529 922 19,148 5,008 7,728 Irrigation 10,133 15,535 22,506 37,871 59,819 74,771 83,493 Land Reclamation 1,838 1,733 2,016 2,111 2,673 2,348 3,130 Rural Development 12,325 16,883 18,607 15,369 15,040 22,175 23,334 Rural Electrification 0 0 1,422 4,354 1,000 2,499 2,748 Food Subsidies 5,513 10,859 8,513 5,359 6,021 5,455 54,872 Food Support Programme 2,017 2,017 2,804 2,703 3,081 3,458 4,370 Khushal Pakistan Fund 1,420 * 800 800 590 78 - 20 Low Cost Housing 0 0 423 318 305 299 597
Justice Administration 1,981 2,196 2,437 3,116 5,642 5,081 7,820 Law and Order** 31,004 36,293 39,370 47,416 1,115 2,088 2,429 Total Budgetary 167,280 208,528 261,301 316,243 376,139® 426,680® 572,620
28
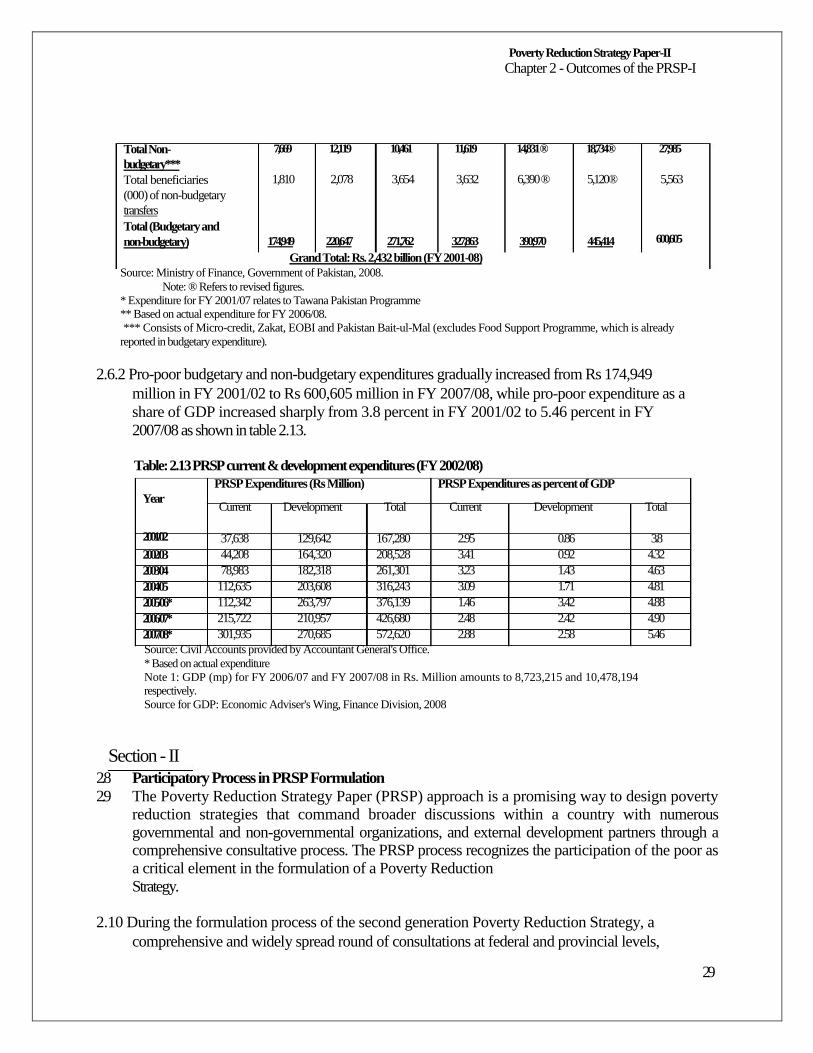
Poverty Reduction Strategy Paper-II Chapter 2 - Outcomes of the PRSP-I
Total Non- budgetary*** Total beneficiaries (000) of non-budgetary transfers Total (Budgetary and non-budgetary)
7,669
1,810
174,949
12,119
2,078
220,647
10,461
3,654
271,762
11,619
3,632
327,863
14,831 ®
6,390 ®
390,970
18,734®
5,120®
445,414
27,985
5,563
600,605
Grand Total: Rs. 2,432 billion (FY 2001-08) Source: Ministry of Finance, Government of Pakistan, 2008.
Note: ® Refers to revised figures. * Expenditure for FY 2001/07 relates to Tawana Pakistan Programme ** Based on actual expenditure for FY 2006/08. *** Consists of Micro-credit, Zakat, EOBI and Pakistan Bait-ul-Mal (excludes Food Support Programme, which is already
reported in budgetary expenditure).
2.6.2 Pro-poor budgetary and non-budgetary expenditures gradually increased from Rs 174,949
million in FY 2001/02 to Rs 600,605 million in FY 2007/08, while pro-poor expenditure as a
share of GDP increased sharply from 3.8 percent in FY 2001/02 to 5.46 percent in FY
2007/08 as shown in table 2.13.
Table: 2.13 PRSP current & development expenditures (FY 2002/08)
Year
2001/02 2002/03 2003/04 2004/05 2005/06* 2006/07* 2007/08*
PRSP Expenditures (Rs Million)
Current Development Total
37,638 129,642 167,280 44,208 164,320 208,528 78,983 182,318 261,301
112,635 203,608 316,243 112,342 263,797 376,139 215,722 210,957 426,680 301,935 270,685 572,620
PRSP Expenditures as percent of GDP
Current Development Total
2.95 0.86 3.8 3.41 0.92 4.32 3.23 1.43 4.63 3.09 1.71 4.81 1.46 3.42 4.88 2.48 2.42 4.90 2.88 2.58 5.46
Source: Civil Accounts provided by Accountant General's Office. * Based on actual expenditure Note 1: GDP (mp) for FY 2006/07 and FY 2007/08 in Rs. Million amounts to 8,723,215 and 10,478,194 respectively. Source for GDP: Economic Adviser's Wing, Finance Division, 2008
Section - II
2.8
2.9
Participatory Process in PRSP Formulation
The Poverty Reduction Strategy Paper (PRSP) approach is a promising way to design poverty reduction strategies that command broader discussions within a country with numerous governmental and non-governmental organizations, and external development partners through a comprehensive consultative process. The PRSP process recognizes the participation of the poor as a critical element in the formulation of a Poverty Reduction
Strategy.
2.10 During the formulation process of the second generation Poverty Reduction Strategy, a
comprehensive and widely spread round of consultations at federal and provincial levels,
29
Poverty Reduction Strategy Paper-II Chapter 2 - Outcomes of the PRSP-I
and with communities all over Pakistan was held. The objective of the participatory process
was to engage parliamentarians, line ministries and departments, development partners,
civil society, and above all the poor communities in policy formulation and to build
ownership for the reform programme. The aim of the government was to build Poverty
Reduction Strategy Paper (PRSP)-II on the outcomes of PRSP-I and understand
expectations of the stakeholders. For this purpose, the consultative process was initiated at two levels:
consultations at the district, provincial and national levels; and consultations with the
communities all over Pakistan, the lessons drawn from which are compiled in
subsequent paras as 'Voices of the Poor.'
2.11 A comprehensive process of consultations was initiated in 2005 including research studies,
seminars, poverty and social impact analysis (PSIA) and workshops to discuss various
elements of the evolving PRSP issues like poverty measurement, education, health and
population sector intermediate indicators, gender mainstreaming, environment,
employment and pro-poor growth policies. In addition, the World Bank and other key
development partners including Asian Development Bank, Department for International
Development (DFID), INGAD, UNDP, UNFPA, ILO, UNICEF, WHO, JICA, CIDA,
USAID, EU, GTZ, NORAD, etc remained actively involved in the PRSP-II process and
contributed towards policy design, implementation, and evaluation. DFID helped in
carrying out a PSIA in Microfinance sector of Pakistan. The study examined the impact of policy
and programmes in the PRSP-I time period and assessed the impact of proposed policy and
programmes ex-ante on poverty. As part of the assessment, a Financial Services
Survey was also conducted which, investigated the formal and informal financial
instruments used by poor households in general, and the impact of microfinance services
on beneficiary households in particular. The total number of participants at all consultative
workshops are listed in Annex II.
2.12 Federal Level workshops
2.12.1 A series of workshops have been held at national and provincial levels for consultations on
the PRSP II which are listed below:
Consultation with Academicians, Researchers and Civil Society (December 12th, 2005)
Consultation on Globalization, Unemployment, Gender, Inequality in income
distribution and Environment (May 5th - 6th , 2006)
Consultation on Health, Education and Governance (July 24th - 26th , 2006)
Consultation on MDG Costing at the national level (September 19th, 2006)
Launch of PRSP-II Draft Summary at the Pakistan Development Forum (April 25th -
27th, 2007)
National Workshop on 'Competitiveness', 'Infrastructure' and 'Financial Sector
Development' (July 17th, 2007)
Meeting of the Technical Working Group on Health (August 12th, 2008)
30
Poverty Reduction Strategy Paper-II Chapter 2 - Outcomes of the PRSP-I
Meeting of the Technical Working Group on Education (August 12th, 2008)
Meeting of the Technical Working Group on Labour (August 29th, 2008)
Meeting of the TechnicalthWorking Group on Environment/ Clean Drinking Water and
Sanitation (September 29 , 2008)
Meeting of the Technical Working Group on Gender (October 10th, 2008)
Meeting of the Technical Working Group on Social Safety Nets (October 15th, 2008)
2.13 Provincial Workshops 2.13.1 Following provincial workshops were arranged in the four provinces with the aim to
identify vulnerable areas where incidence of poverty is the highest and to conduct urban
and rural poverty comparisons:
Balochistan (July 29th, 2006 - Quetta)
Sindh (31st July, 2006 - Karachi)
Punjab (7th August, 2006 - Lahore)
NWFP (9th August, 2006 - Peshawar)
2.14 Research Studies 2.14.1 Several exclusive studies have been carried out by consultants, covering some of the key
areas of the PRSP-II. Keeping in view the crucial linkages between employment generation and
poverty reduction, a study on 'Employment Generation Strategy for PRSP II' was carried out. The
outcomes of this study strongly emphasized the importance of employment
as a crucial factor in attaining economic growth in Pakistan and its role in eradicating
poverty. The study also provided a detailed analysis of the tremendous scope of various service
sectors (trade, transport, non-farming sectors/meat-processing, floriculture, dairy,
fisheries, fruits, etc. housing & construction) to employ a large number of people.
2.14.2 Another study on 'Globalization and its impact on Poverty in Pakistan' suggests key
strategic steps necessary for the country to maximize its growth and poverty reduction, in
order to fully benefit from globalization.
2.14.3 The study on 'Income Inequalities in Pakistan and a Strategy to Reduce Income
Inequalities' undertook an in-depth review of income inequalities in the country. It suggested
various measures for a more equitable income distribution for incorporation in
the poverty reduction strategy.
2.14.4 A study on 'Reducing the Gender Gap/Engendering PRSP II' was also conducted which
highlighted the existence of gender disparities in Pakistan and lists certain key areas
identified by PRSP for effective integration of women in the economy. 'Environmental
Sustainability' was another study that developed the crucial linkages between
environmental sustainability and poverty reduction.
31
Poverty Reduction Strategy Paper-II Chapter 2 - Outcomes of the PRSP-I
2.14.5 Input from Ministries
2.15.1 To ensure that every government department relevant to the PRSP is fully engaged in the
formulation and implementation of the strategy to reduce poverty, all Line Ministries and
departments provided their strategic road maps with regard to related policy parametres
envisaged for the next three years. Exclusive brainstorming sessions to discuss the medium
term policies were held with Ministries of Education, Health, Food Agriculture &
Livestock, Commerce, Population Welfare, Petroleum & Natural Resources, etc.
2.16 Technical Working Groups
2.16.1 An effective Monitoring and Evaluation (M&E) framework is the key to the successful
implementation of any strategy. Keeping in view the importance of this critical issue
Technical Working Groups (TWGs) on Health, Education and Labour/Employment,
Gender, Environment, Water & Sanitation and Social Safety Nets have been constituted under
Strengthening Poverty Reduction Monitoring Project. The TWGs consist of sector
specialists from diverse backgrounds and includes officials from concerned
ministries/departments, experts from international development organizations, civil society and
academia. As mentioned above, six meetings of TWGs were held which critically
analyzed the monitoring indicators conceived during PRSP-I and developed new indicators
for the PRSP-II M&E framework. The TWGs also provided input for finalizing the data
sources and baseline for PRSP output and outcome indicators. The suggestions synthesized
from these technical meetings have been made part of PRSP-II's M&E framework.
2.18 Final Round of Consultations for Finalization of Draft PRSP-II
2.18.1 Embodied in the PRSP framework is the expectation that participation by national stakeholders and international development partners in developing and implementing the poverty
reduction strategies will create broad-based ownership. Translating these expectations
into operational recommendations the PRSP framework advocates participation of the poor
in poverty analysis; prioritization of public actions to be addressed in the Strategy; and monitoring
the government's delivery of the commitments made. Recognizing that the participation of various
stakeholders in the PRSP process needs to be
further bolstered for the strategy to become more effective, a final round of consultations to finalize
draft Poverty Reduction Strategy Paper (PRSP)-II was held at three levels in
November - December, 2008 including: (a) Consultation with national stakeholders; (b)
Consultations with international development partners; and (c) Consultation with
Parliamentarians.
2.18.2 National Workshop for Sharing Draft PRSP-II: To further deepen the sense of local
ownership of the PRSP process, and to institutionalize participation of national
stakeholders including government ministries/departments, academia, civil society, youth and
beneficiariesthat community level, a workshop for sharing the Draft PRSP-II was held on
November 14 , 2008 at the National Library Auditorium, Islamabad. The workshop was conducted
with the aim that it is vital for the public officials and representatives of civil society, as well
as the public in general, to have a greater voice in making and
32
Poverty Reduction Strategy Paper-II Chapter 2 - Outcomes of the PRSP-I
implementing policies like the PRSP, so that the fruits of prosperity are distributed more
equitably.
2.18.2.1 The participants were divided into the following three groups based on various pillars of
the draft poverty reduction strategy and their sectoral linkages:
Box 2.1: Breakout groups during consultative workshops
Group I
Group II
Group III
Pillar II: Protecting the Poor & the Vulnerable Pillar VIII: Capital and Finance for Development Pillar IX: Housing and Land Management Pillar X: Governance for a Just & Fair System Pillar III: Increasing Productivity and Value addition In Agriculture Pillar IV: Integrated Energy Development Programme Pillar V: Making Industry Internationally Competitiveness Pillar VII: Removing Infrastructure Bottlenecks (PPPs) Pillar VI: Human Development for the 21st Century:
Education; Health; Access to Clean Drinking Water & Sanitation; Population Programme; and Women Empowerment
2.18.2.2 The participants deliberated on the Draft PRSP-II and analyzed the document from
different perspectives. The officials from line ministries, provincial departments, civil
society, and academia examined the text in view of their previously contributed input
regarding sectoral policies, proposed interventions and targets given for the PRSP-II period.
They also verified the data and sources given in the document for effective monitoring and
evaluation of the PRSP's output and outcome indicators. The participants also scrutinized the
document with a view to identify missing interventions, errors and omissions. Their
recommendations and submissions were carefully recorded and at the end
of the day were presented in the plenary session of the workshop.
2.18.3 Consultative Workshop to Share Poverty Reduction Strategy Paper (PRSP-II) with
the International Development Partners: The global consensus on the importance of the Millennium Development Goals (MDGs) brings the discussion of poverty reduction strategies to the centre stage of the international development efforts. The development partners play not only a key role in sustained efforts for poverty reduction as outlined in
their specific country assistance plans and strategies but also provide guidance in the light of their
international experiences in poverty reduction. It is imperative that development
strategies and programmes of development partners must reflect the wishes and aspirations of the
people to build consensus and ownership. Foregoing in view, a consultative workshop to
share the Draft PRSP-II with international development partners was
organized on November 19th, 2008 at the Finance Division, Islamabad.
2.18.3.1 This full-day workshop was attended by a large number of representatives from
international development community including the World Bank, IMF, ADB, EU, USAID,
DFID, UNDP, UNFPA, UNHCR, UNESCO, UNICEF, UNIDO, UN World
Food
Programme, WHO, JICA, CIDA, SDC, and FAO, etc. Representatives from line ministries
and departments were also present.
33
Poverty Reduction Strategy Paper-II Chapter 2 - Outcomes of the PRSP-I
2.18.3.2 The participants deliberated on the various pillars of PRSP-II and synthesized their
comments and suggestions into presentations. These presentations based on
recommendations which were then presented in the plenary session of the workshop.
2.18.4 Consultative Workshop to share PRSP-II with the Parliamentarians: Involving the
elected representatives of the people in the consultative process of poverty-reduction is not
only necessary for sustainability of the process, but parliamentary oversight of the PRSP can
ensure long-term ownership of the strategies and generate the support necessary to
sustain reforms. Parliament is an institution where the voices and preferences of the public
and particularly of the poor can be heard. Parliamentarians' outreach to their constituencies
on issues of PRSP is particularly relevant in this context. Greater parliamentary
involvement in the poverty reduction process helps to ensure that a country's poverty
reduction strategy is generated, implemented and evaluated through national institutions with the
legitimacy to ensure ownership and sustainability. Parliamentarians also have a
significant role to play in influencing the government's poverty alleviation programmes
through the budgetary process.
2.18.4.1 To institutionalize the role of Parliamentarians in formulation of PRSP-II, a consultative
Workshop to share the Draft PRSP-II was held on December 4th, 2008 Islamabad.
2.18.4.2 During the workshop, the Parliamentarians stressed the need for legislative oversight of
government policies in general and of the budget process in particular to ensure that
government is effectively working towards poverty reduction. They unanimously
maintained that agriculture is the engine of growth needs to be specially highlighted in the
strategy for poverty reduction. In addition, focus on key areas of human development while
giving utmost importance to education health and access to clean drinking water for the
marginalized. The government's efforts in providing the poor relief in the form of Benazir
Income Support Programme in face of rising inflation were lauded. Parliamentarians
overwhelmingly supported government's efforts to improve governance and institutional
development. They were of the view that by instituting accountability and good governance in the
administration and management of pro-poor activities and programmes, we can
effectively continue the crusade against poverty.
2.19 PRSP-II Communication Strategy
2.19.1 The government firmly believes that the process of designing and updating the PRSP-II
remains inclusive so as to ensure that all voices (including those of the poor) are heard. In order to
further ensure general public participation and ownership of the Strategy, the
PRSP-II has been placed on the Website of Ministry of Finance (www.finance.gov.pk).
2.19.2 The PRSP Secretariat is working towards developing an all-inclusive communication
strategy to ensure ownership through sharing and dissemination of PRSP-II at all levels of society.
This would not only ensure accountability, participation and transparency in the implementation
process but will also provide food for thought and input for future
34
Poverty Reduction Strategy Paper-II Chapter 2 - Outcomes of the PRSP-I
strategies. Communication interventions would utilize diverse channels in accordance with
audience needs including electronic and print media, workshops and seminars, translation
of PRSP into national and regional languages, and special supplements in national dailies.
2.20 Voices of the Poor
2.21 This section summarizes results from consultations held with poor communities all over
Pakistan on the outcomes of the PRSP-I. It expresses the perspectives of the poor on poverty
reduction strategies adopted by Pakistan during the past few years, and their opinions on how
far they considered these strategies to have been successful. It thus helps
to frame policies for the future.
2.22 In late 2005, the Rural Support Programme Network was asked to organize community
consultations for formal feedback on the people's views about the on-going PRSP24. The
consultations with rural poor were intended to ascertain whether they thought PRSP had
made any difference in their lives and, if so, through what interventions and by how much.
2.23 During February 2006, 54 dialogues were held in 21 districts, with a total of 1,214
participants. The dialogues were held separately with a total of 646 male and 568 female
participants. An effort was made to include as diverse a group of participants as possible,
including small farmers, daily wage labourers, employees of public and private sectors,
unemployed members of the labour force, Mustahiqs25 of Zakat26, people engaged in small
enterprises, students, etc. A summary of these dialogues - highlighting the perceptions of
the people on what has worked and what has not, as well as their suggestions on how to
improve matters - is presented below.
2.24 Employment: A consensus emerged that the employment situation had improved slightly
in the formal sector during the last few years though the change was not substantial. The
improvement had resulted particularly from public sector development initiatives
especially at the village and Union Council levels. In general, people related access to
employment opportunities with education and with having the right contacts. They felt that
merit was often not the determining factor. There was a growing trend for women to seek jobs
including in non-traditional areas. The jobs mainly sought by women were in the
social sectors especially those of lady health workers and school teachers.
2.24.1 High unemployment persisted among young people and lack of technical education cited as
a major reason for the difficulty in finding employment. In the construction sector, work
opportunities were more easily available than earlier. Salaries as well as daily wage rates of skilled
and unskilled labour had risen substantially. However, majority of those consulted
believed that the rise in salaries and wages had been offset by increasing prices of daily
necessities and consumption goods. Participants in the dialogue emphasized that since the
24 The consultations were conducted with support from DFID. 25 Mustahiq is a person who is eligible to receive Zakat. 26 Zakat is the Islamic concept of tithing and alms. It is an obligation on Muslims to pay 2.5% of their wealth to specified categories in society when their annual wealth exceeds a minimum level (nisab).
35
Poverty Reduction Strategy Paper-II Chapter 2 - Outcomes of the PRSP-I
majority of rural population was engaged in farm-related work, a flourishing agriculture
and expanding agribusiness were crucial to increasing rural employment opportunities.
2.24.2 The participants recommended that policies and programmes for education and training
should take into account current and future employment opportunities. Technical education and
vocational skills training could give more people opportunities to contribute. Effective promotion
of self-enterprise and SMEs would provide many additional employment
opportunities.
2.25 Small Enterprise Development: Participants stressed that SMEs needed assistance in
making links with market centers; i.e. they lacked knowledge about market preferences. Overall, it
appears that in the view of dialogue participants, little progress had been made in facilitating small
enterprise development, particularly in the area of skill development
and establishing market linkages.
2.26 Micro-credit: During the last few years, access to micro-credit had considerably
improved, but the geographical coverage remained very limited relative to that required by
the population and what could potentially be achieved.
2.26.1 Recommendations included the expansion of geographical coverage of micro-credit
institutions to cover the entire country in addition to an increase in loan ceilings from micro-
credit institutions and for loaning to be tailored to client needs, for instance,
repayment schedules should be consonant with the cash flows of their clients' businesses. Demand for
new credit products to cater to client needs, such as, consumption loans was
also high such as insurance for agriculture and livestock.
2.27
Agriculture: The entire rural economy is directly or indirectly dependent upon agriculture
(including livestock). Most participants in the dialogues believed that there had not been much
improvement in this sector during the last few years. The general view was that, despite higher
prices for produce, profitability in this sector had not improved as costs of production had
increased. Services and facilities for small farmers continued to lack. Agricultural inputs were
expensive and in many places were not of good quality or were
completely spurious.
2.27.1 The National Programme for Improvement of Watercourses was widely appreciated. Many
participants thought that it was productive and would have long lasting benefits. However,
the prerequisites asked of small farmers and the procedures to be followed for such schemes
such as those relating to disbursement of funds by the government needed to be
streamlined while the amount of community contribution needed to be lowered.
2.27.2 The seasonality of the canal system was a major cause of concern. Growing scarcity of
water was affecting agricultural production both in rain fed and irrigated areas.
Furthermore, many small farmers believed that they did not get their fair share of irrigation
water, which they believed was usurped by influential farmers in collusion with the
36
Poverty Reduction Strategy Paper-II Chapter 2 - Outcomes of the PRSP-I
Irrigation Department.
2.27.3 In general, participants were not happy with the extension efforts of the Agriculture
Departments. The results of agricultural research, new and innovative techniques, and
seed/crop varieties, were not being effectively disseminated among the farming
communities. The management of natural resources had improved in districts where
area/development programmes had been working; people were more aware about improved farm
practices but more efforts were needed. Participants suggested that the government needed to further
facilitate farmers in the marketing of produce as well as in storage. The dialogue participants had
not experienced any change in tenancy rights. The landless
tenants remained at a disadvantage and were prone to exploitation.
2.28
Livestock: Livestock was an important source of income in the rural areas. In most
dialogues, participants believed that livestock-related services had not improved markedly during
the last 3-4 years. They expressed a need for technical services for improving livestock breeds
and for disease prevention and treatment. The majority also felt that few
people could actually avail of such services through the Livestock Department.
Nevertheless, in parts of the NWFP, participants thought that the services of the
Department of Livestock and Dairy Development had indeed improved.
2.28.1 Some of the women participants said that in their areas they had received training in
poultry farming through a government department. With the provision of Livestock
Extension Workers (LEWs), now livestock medication and vaccination services were
available which were previously not available. However, in most villages, veterinary facility
and access to qualified veterinary doctors was not available. That gap was filled by
quacks. It was suggested that the network of veterinary hospitals/dispensaries be expanded
and the presence of qualified staff be ensured. Moreover, since females were actively
involved in livestock and poultry keeping, more women veterinarians should be inducted by the
Livestock Department. This also strengthened the need for further village-based
LEWs.
2.28.2 Awareness about improved practices had risen in districts where area/rural development
programmes had been working, in particular and communities were socially organized.
Participants stressed that proper marketing facilities for dairy products were largely absent.
Participants felt that dairy activities offered a huge potential and should be supported in
rural areas by linking small farmers to commercial dairy businesses.
2.29
Governance: The general consensus on the devolved system was that the concept was
well-founded but was not being implemented in its true spirit. One of the main reasons why most
ordinary rural people appreciated the devolved setup was that it had improved access to government
institutions and their services. However, participants complained that in many cases funds were
allocated on the basis of allegiance to political parties. Some felt that the elected representatives did
not listen to the poor and cooperated with the influential and with their own relatives. Participants
complained of a lack of coordination between
37
Poverty Reduction Strategy Paper-II Chapter 2 - Outcomes of the PRSP-I
local elected representatives and government functionaries. Initially there was considerable
confusion about role, responsibility, and authority. The participation of women as elected
representatives at the local level was so far seen as more symbolic than substantive. However,
despite the current limitations, most people were glad that some at least among
them had access to power structures that could assist in resolving issues.
2.29.1 The general view was that accessing justice and curtailing corruption in the public sector
had not noticeably improved in the last few years. Rural people were especially unhappy
with what they had to go through in dealings with the police, revenue and with irrigation
departments. Court cases continued to be lengthy and costly. The legal system took years
before cases were concluded and judgments implemented.
2.29.2 People felt that most government departments had an uncooperative and occasionally even
hostile atmosphere unless they agreed to pay bribes or had a 'reference.' Some of the participants
did feel that problems in dealing with the police and other government
departments had been somewhat eased with the help of elected representatives. However,
most participants felt that the efficiency and effectiveness of public servants had not
improved significantly during the period under consideration
2.30
Education: Participants generally agreed that during the last few years, access to primary
level schooling had improved for both girls and boys. Beyond the primary level, access was often
more difficult, especially for girls, the distances involved and because of deficiencies in schools'
infrastructure particularly of boundary walls and toilets. Many schools, both,
for boys and girls lacked adequate facilities for providing clean drinking water.
2.30.1 Recruitment of teachers on contract by district governments had helped bridge the shortage
of teaching staff. Teacher absenteeism had been checked to a large extent during the last few years.
The free education policy of the government had enabled many poor families to enroll their children.
The provision of free books, waiver of school fees, and scholarships
to girls had significantly improved girls' enrolment in schools.
2.30.2 In the opinion of most participants, the quality of education had largely remained
unchanged. School Management Councils (SMCs) existed but in most cases were dormant
and did not play an active role in school management. Government schools often lacked
even the minimum requirements of laboratory facilities and other equipment. Technical
education centers were located in big towns and Tehsil/District headquarters making access
to them especially difficult for girls.
2.30.3 Private sector education was a growing and widespread trend. People preferred private
schools. In the view of some participants, government schools only served the poor as
those who could afford sent their children to private schools.
2.30.4 It was suggested that there should be a formal system for adult literacy with adequate
facilities and properly paid staff. Some participants expressed satisfaction with the current
38
Poverty Reduction Strategy Paper-II Chapter 2 - Outcomes of the PRSP-I
adult literacy programmes initiated by the government (e.g. through National Commission
for Human Development) and by NGOs. In none of the dialogues did anyone express
knowledge of any specialized education or training facilities for disadvantaged/special
children.
2.30.5 It appeared from the dialogues that there had been no improvement in higher education.
Access to higher education (beyond matriculation) was especially difficult for people in rural
areas as higher education institutions were usually located in towns or cities. This
made them more expensive because of travel time and transportation costs.
2.31
Healthcare: In the dialogues there was general agreement that during the last few years
there had been very little improvement in healthcare facilities besides some special
initiatives. Government hospitals (including at Tehsil/District levels) lacked doctors,
paramedic staff, lifesaving drugs, and diagnostic equipment. Since larger specialized
hospitals were located in urban areas, the rural population had to travel there to seek
secondary-level medical care which entailed a huge cost as well as inconvenience with
particular difficulties for women. People were forced to seek private healthcare facilities
for better service. Majority of the dialogue participants felt that the needy never got any
financial assistance in civil hospitals.
2.31.1 In the rural areas, in general, Basic Health Units (BHUs), Rural Health Centres and
Dispensaries were not fully functional and did not provide an acceptable level of service.
Participants stressed that life-saving medicines ought to be available free at BHUs. Some
participants mentioned the Punjab Chief Minister's Initiative for Primary Healthcare under which a
Public Private Partnership had been initiated for managing BHUs. It was claimed that subsequent
to this initiative, primary healthcare facilities had improved during the last
three years, doctors and other staff were now present and the supply of required medicines
had improved. This could be a model for wider replication.
2.31.2 One of the new initiatives that people thought a definite improvement during the last few
years was the Lady Health Workers (LHWs) programme. The LHWs were available where
needed in the villages, and they extended timely and effective services. People were generally
satisfied with immunization services for children and, in particular, were quite happy with the
anti-Polio immunization programme. Participants suggested that free and
easily accessible healthcare treatment be given to poor and marginalized families.
2.32
Water Supply and Sanitation: The dialogues revealed that in many locations the
situation had improved in this sector. In particular, many district governments had taken
steps to resolve water and sanitation issues in villages and towns. However, in remote and isolated
villages things had not changed. Even areas where progress had been made in
sanitation lacked a proper system for disposing of solid waste. Clean (safe for human
health) drinking water was not available for a majority of the rural population. Participants
in the dialogues emphasized that there was a tremendous need for more (safe for human
health) drinking water schemes.
39
Poverty Reduction Strategy Paper-II Chapter 2 - Outcomes of the PRSP-I
2.33
Social Safety Nets: Some participants estimated that as much as 25 percent of the
community might deserve financial support through safety nets, but perhaps just 15 percent of the
deserving got any assistance. Members of the Zakat Committees were nominated by the government.
There was a general perception that the selection of the deserving by the Committees is not
transparent. Some people said that the members of Zakat Committees usually gave
benefits27
only to their relatives and friends or on the basis of political affiliation or biraderi.
Participants thought that the process of obtaining social safety net assistance was lengthy and
complicated. The majority felt that the Guzara (living)
allowance provided through Zakat was insufficient for even subsistence living.
2.33.1 In some dialogues in the NWFP, participants said that in their area Zakat was now more
easily available to the deserving, however, the scheme still needed improvement. Majority of the
people recommended that the coverage of social safety nets must extend to all those
who merit assistance. The amount of Guzara allowance ought to be increased to ensure
subsistence. Besides the monthly financial living allowance, social safety nets ought to include
skills training, credit for setting up self-owned enterprises, basic healthcare for
family members, and support for children's education. The participants felt that the Zakat
fund should be administered in a fair and transparent way and be easily accessible to the deserving.
People need to be fully aware about what assistance is available for the deserving and the
Mustahiq ought to be able to receive what is due without hurdles and
delays.
2.33.2 In general, the dialogues revealed that socially mobilized communities were better able to
participate in and to access services and facilities that were available. They were also better able to
convey their needs and priorities to decision makers and to implementing agencies. This applied in
the economic field, e.g., micro-credit and agriculture; in the social sectors,
e.g., school management and oversight; and to social safety nets.
2.34 Satisfaction with Basic Services
2.34.1 The recently conducted CWIQ-PSLM, covering over 70,000 respondents all over the
country, substantiates most of the reflections coming out of the dialogues with the poor
reported above. The CWIQ-PSLM, for the first time, generated information on the
satisfaction from schooling, health facilities, family planning, veterinary hospital,
agriculture, and the police. Perception about health and education services based on this data set is
discussed here. The survey reported that 59.8 percent of respondents were satisfied with schools
in FY 2004/05 (Table 2.14a). The highest level of satisfaction from
schooling (67 percent) was found in the NWFP, while the lowest (48 percent) was in
Balochistan. The level of satisfaction from schooling was higher in urban areas than in rural.
However, only 36 percent of the population was satisfied with basic health units. Satisfaction
with the services of basic health units was more or less the same in all provinces, except the
NWFP, which recorded a higher level (52 percent). Rural areas
27 Kinship
40
Poverty Reduction Strategy Paper-II Chapter 2 - Outcomes of the PRSP-I
expressed greater satisfaction with the services of basic health units than did urban.
Table 2.14(a): Household satisfaction by facilities and services use (percent)
Facilities and Services Use in 2004-05
Region and Province
Urban Area Punjab Sindh NWFP Balochistan Rural Areas Punjab Sindh NWFP Balochistan Overall Punjab Sindh NWFP
Balochistan
Basic Health unit 29.36 20.47 31.35 58.78 36.67 40.96 38.89 40.98 48.76 36.62 35.94 30.04 36.33 51.92
36.64
School 66.38 67.63 61.57 72.98 66.71 54.85 59.11 47.87 64.7
40.89 59.84 63.2
54.49 67.31
48.29
Source: CWIQ-PSLM FY 2004/05-FY2006/07.
2.34.2 The CWIQ-PSLM FY 2004/05 for the first time assessed a qualitative aspect regarding
households and changes in their economic situation during the year preceding the survey. An answer
to this question does not, of course, substitute for poverty estimates based on income or
consumption data, however, it does provide useful insight. In both rural and
urban areas, half the households perceived no change in their economic situation during the year,
however, 27 percent of households in urban areas and 23 percent in rural areas reported an
improvement in their economic situation compared to the previous year (Table 2.14b).
Proportionately more households in the Punjab and the NWFP reported improvement in
their well-being than households in Sindh and Balochistan. One-quarter of
the rural households reported a worsening of their economic situation in the one-year
period suggesting they had not benefited from the high agricultural growth.
Table 2.14(b): Households' perception of their economic situation in FY 2004/05 compared with that in FY 2003/04 (percent)
Economic Situation of the Household
Region and Much Much Don't Province Worse Worse Same Better Better Know Total
Urban Areas 3.59 18.73 50.51 23.97 2.71 0.49 100 Punjab 3.06 18.24 48.37 26.75 3.08 0.49 100 Sindh 4.16 18.41 52.99 21.43 2.64 0.38 100 NWFP 5.36 23.85 44.88 23.32 2.13 0.45 100 Balochistan 2.25 15.42 63.95 16.1 1.36 0.93 100 Rural 4.49 20.66 52.27 20.42 1.81 0.36 100
41
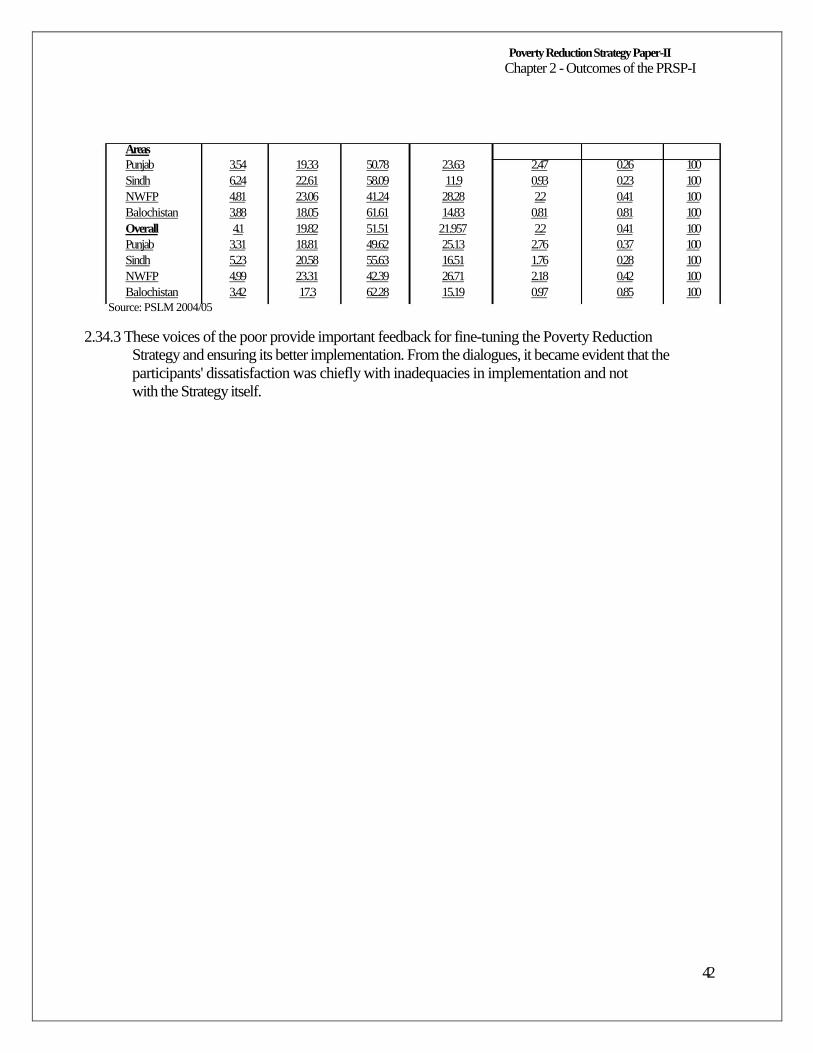
Poverty Reduction Strategy Paper-II Chapter 2 - Outcomes of the PRSP-I
Areas Punjab 3.54 19.33 50.78 23.63 2.47 0.26 100 Sindh 6.24 22.61 58.09 11.9 0.93 0.23 100 NWFP 4.81 23.06 41.24 28.28 2.2 0.41 100 Balochistan 3.88 18.05 61.61 14.83 0.81 0.81 100 Overall 4.1 19.82 51.51 21.957 2.2 0.41 100 Punjab 3.31 18.81 49.62 25.13 2.76 0.37 100 Sindh 5.23 20.58 55.63 16.51 1.76 0.28 100 NWFP 4.99 23.31 42.39 26.71 2.18 0.42 100 Balochistan 3.42 17.3 62.28 15.19 0.97 0.85 100
Source: PSLM 2004/05
2.34.3 These voices of the poor provide important feedback for fine-tuning the Poverty Reduction Strategy and ensuring its better implementation. From the dialogues, it became evident that the
participants' dissatisfaction was chiefly with inadequacies in implementation and not
with the Strategy itself.
42
Poverty Reduction Strategy Paper-II Chapter 3 - Poverty diagnostics
Chapter 3 - Poverty diagnostics
3.1
3.2
3.3 3.3.1
3.3.2
3.3.3
3.3.4
28
This chapter provides a brief review of the level and the correlates of poverty in Pakistan, which will form an empirical basis for the discussion of the strategy and policy measures to tackle
poverty laid out in subsequent chapters. Most of poverty related data in this chapter are drawn from a
key poverty monitoring instrument, i.e. a series of the Pakistan Integrated Household Survey (PIHS)
and the Pakistan Social and Living Standards Measurement Survey (PSLM). This chapter
pays special attention to the PRSP period, i.e. since FY 2001/02 and often compares major
poverty statistics between FY 2001/02 and the latest
available survey year.28
Poverty has many dimensions in Pakistan. The poor have not only low incomes but they
also lack access to basic needs such as education, health, clean drinking water and proper sanitation.
The latter undermines their capabilities, limits their opportunities to secure employment, results
in their social exclusion and exposes them to exogenous shocks. The
vicious cycle of poverty is accentuated when the governance structures exclude the most
vulnerable from the decision making process. These issues are discussed in detail in
different chapters of the report; strategies to address them constitute the main pillars of the
PRSP-II.
Poverty Trend
A long-term trend of poverty in Pakistan is shown in Figure 3.1. Poverty, measured in
terms of the headcount of the poor (the proportion of the population with consumption below the
official poverty line), shows a mixed trend throughout the 1990s until it peaked
at 34.5 percent in FY 2001/02.29
However, it can be seen from Figure 3.1 that there was a large turn-around in the poverty
trend in FY 2001/02. Poverty in the country declined by more than 12 percentage points between
FY 2001/02 and FY 2005/06 and reached 22.3 percent - its lowest level during the
PRSP period.
The overarching objective of the PRSP-II is to reduce poverty. This requires that existing
poverty estimates reflected in PRSP-II are realistic and based on surveys. The poverty estimates
are worked out at the national level using the PSLM data compiled by the Federal
Bureau of Statistics. The latest PSLM data is available only for FY 2005/06. The Planning
Commission considers that a Poverty Reduction Strategy based on FY 2004/05 or FY
2005/06 data would underestimate the extent of poverty.
The Planning Commission is of the view that no reliable data exist for estimating poverty
in recent years. Significant changes in the growth pattern; and an increase in food and fuel I-PRSP and full PRSP were completed in 2001 and 2003, respectively. Here, the PRSP period refers to the period since
2001. 29 See the end of the chapter for the methodology used for poverty line estimation.
43
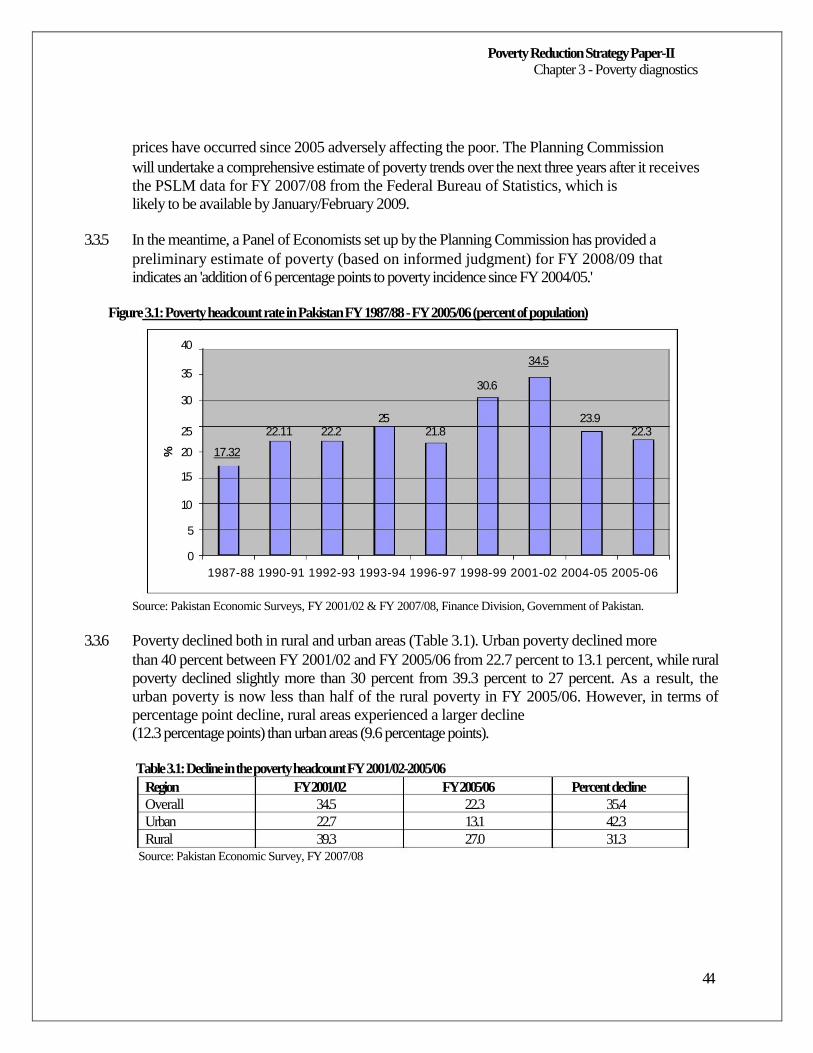
Poverty Reduction Strategy Paper-II Chapter 3 - Poverty diagnostics
prices have occurred since 2005 adversely affecting the poor. The Planning Commission
will undertake a comprehensive estimate of poverty trends over the next three years after it receives
the PSLM data for FY 2007/08 from the Federal Bureau of Statistics, which is
likely to be available by January/February 2009.
3.3.5 In the meantime, a Panel of Economists set up by the Planning Commission has provided a
preliminary estimate of poverty (based on informed judgment) for FY 2008/09 that
indicates an 'addition of 6 percentage points to poverty incidence since FY 2004/05.'
Figure 3.1: Poverty headcount rate in Pakistan FY 1987/88 - FY 2005/06 (percent of population)
40 34.5
35 30.6
30
25 23.9 25 22.11 22.2 21.8 22.3
20 17.32
15
10
5
0
1987-88 1990-91 1992-93 1993-94 1996-97 1998-99 2001-02 2004-05 2005-06
Source: Pakistan Economic Surveys, FY 2001/02 & FY 2007/08, Finance Division, Government of Pakistan.
3.3.6
Poverty declined both in rural and urban areas (Table 3.1). Urban poverty declined more
than 40 percent between FY 2001/02 and FY 2005/06 from 22.7 percent to 13.1 percent, while rural
poverty declined slightly more than 30 percent from 39.3 percent to 27 percent. As a result, the
urban poverty is now less than half of the rural poverty in FY 2005/06. However, in terms of
percentage point decline, rural areas experienced a larger decline
(12.3 percentage points) than urban areas (9.6 percentage points).
Table 3.1: Decline in the poverty headcount FY 2001/02-2005/06
Region FY 2001/02 FY 2005/06 Percent decline Overall 34.5 22.3 35.4 Urban 22.7 13.1 42.3 Rural 39.3 27.0 31.3
Source: Pakistan Economic Survey, FY 2007/08
44
%
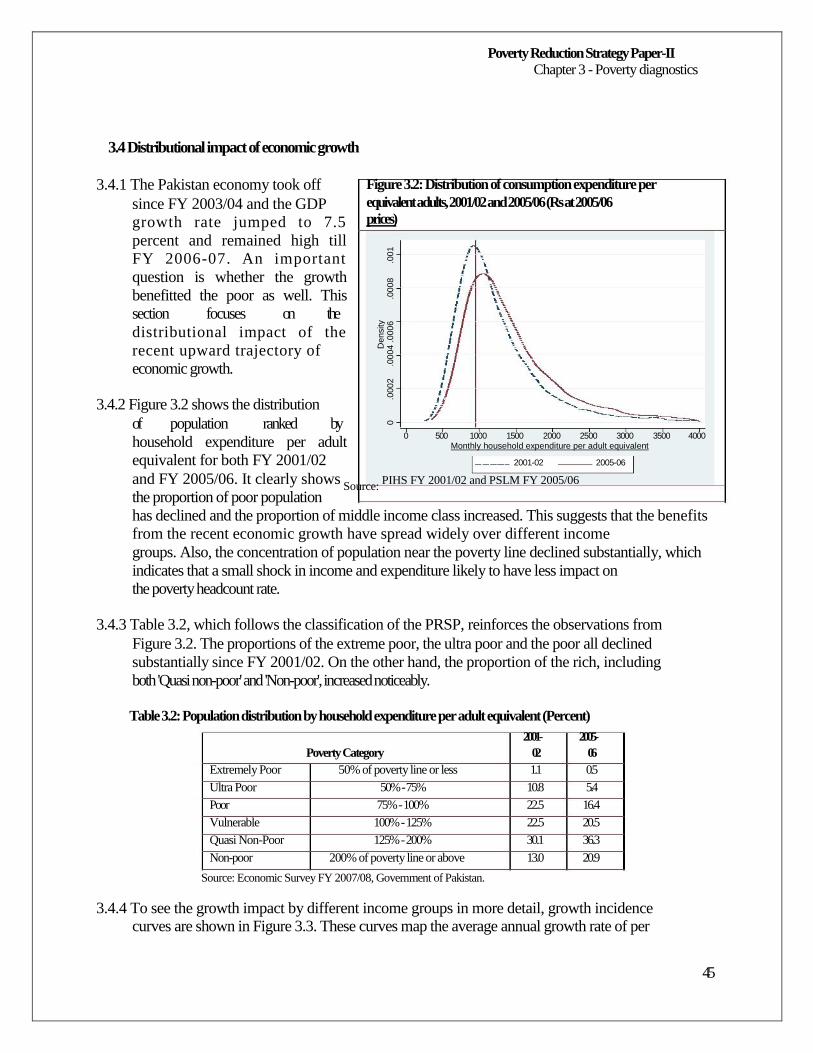
Poverty Reduction Strategy Paper-II Chapter 3 - Poverty diagnostics
3.4 Distributional impact of economic growth
3.4.1 The Pakistan economy took off
since FY 2003/04 and the GDP
growth rate jumped to 7.5
percent and remained high till
FY 2006-07. An important
question is whether the growth
benefitted the poor as well. This
section focuses on the
distributional impact of the
recent upward trajectory of
economic growth.
3.4.2 Figure 3.2 shows the distribution
of population ranked by
household expenditure per adult
equivalent for both FY 2001/02
Figure 3.2: Distribution of consumption expenditure per equivalent adults, 2001/02 and 2005/06 (Rs at 2005/06 prices)
0 500 1000 1500 2000 2500 3000 3500 4000 Monthly household expenditure per adult equivalent
2001-02 2005-06
and FY 2005/06. It clearly shows Source:
PIHS FY 2001/02 and PSLM FY 2005/06
the proportion of poor population
has declined and the proportion of middle income class increased. This suggests that the benefits
from the recent economic growth have spread widely over different income
groups. Also, the concentration of population near the poverty line declined substantially, which
indicates that a small shock in income and expenditure likely to have less impact on
the poverty headcount rate.
3.4.3 Table 3.2, which follows the classification of the PRSP, reinforces the observations from
Figure 3.2. The proportions of the extreme poor, the ultra poor and the poor all declined
substantially since FY 2001/02. On the other hand, the proportion of the rich, including
both 'Quasi non-poor' and 'Non-poor', increased noticeably.
Table 3.2: Population distribution by household expenditure per adult equivalent (Percent)
2001- 2005- Poverty Category 02 06
Extremely Poor 50% of poverty line or less 1.1 0.5 Ultra Poor 50% - 75% 10.8 5.4 Poor 75% - 100% 22.5 16.4 Vulnerable 100% - 125% 22.5 20.5 Quasi Non-Poor 125% - 200% 30.1 36.3 Non-poor 200% of poverty line or above 13.0 20.9
Source: Economic Survey FY 2007/08, Government of Pakistan.
3.4.4 To see the growth impact by different income groups in more detail, growth incidence curves are shown in Figure 3.3. These curves map the average annual growth rate of per
45
.001
.0008
.0004 .0006
De
nsity
.0002
0
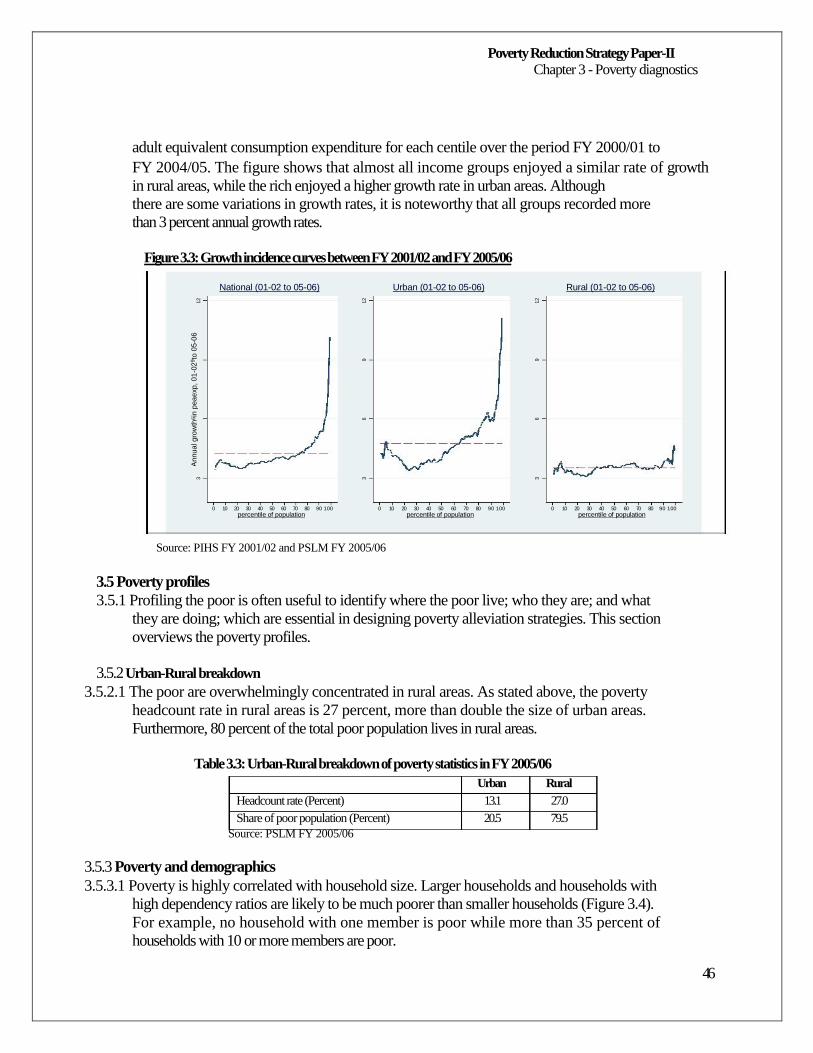
Poverty Reduction Strategy Paper-II Chapter 3 - Poverty diagnostics
adult equivalent consumption expenditure for each centile over the period FY 2000/01 to
FY 2004/05. The figure shows that almost all income groups enjoyed a similar rate of growth
in rural areas, while the rich enjoyed a higher growth rate in urban areas. Although
there are some variations in growth rates, it is noteworthy that all groups recorded more
than 3 percent annual growth rates.
Figure 3.3: Growth incidence curves between FY 2001/02 and FY 2005/06
National (01-02 to 05-06) Urban (01-02 to 05-06) Rural (01-02 to 05-06)
0 10 20 30 40 50 60 70 80 90 100 0 10 20 30 40 50 60 70 80 90 100 0 10 20 30 40 50 60 70 80 90 100
percentile of population percentile of population percentile of population
Source: PIHS FY 2001/02 and PSLM FY 2005/06
3.5 Poverty profiles
3.5.1 Profiling the poor is often useful to identify where the poor live; who they are; and what
they are doing; which are essential in designing poverty alleviation strategies. This section
overviews the poverty profiles.
3.5.2 Urban-Rural breakdown
3.5.2.1 The poor are overwhelmingly concentrated in rural areas. As stated above, the poverty
headcount rate in rural areas is 27 percent, more than double the size of urban areas.
Furthermore, 80 percent of the total poor population lives in rural areas.
Table 3.3: Urban-Rural breakdown of poverty statistics in FY 2005/06
Urban Rural Headcount rate (Percent) 13.1 27.0 Share of poor population (Percent) 20.5 79.5
Source: PSLM FY 2005/06
3.5.3 Poverty and demographics
3.5.3.1 Poverty is highly correlated with household size. Larger households and households with
high dependency ratios are likely to be much poorer than smaller households (Figure 3.4).
For example, no household with one member is poor while more than 35 percent of
households with 10 or more members are poor.
46
12
12
12
An
nu
al g
row
th6in
pea
exp
, 0
1-0
29to
05
-06
9
9
6
6
3
3
3
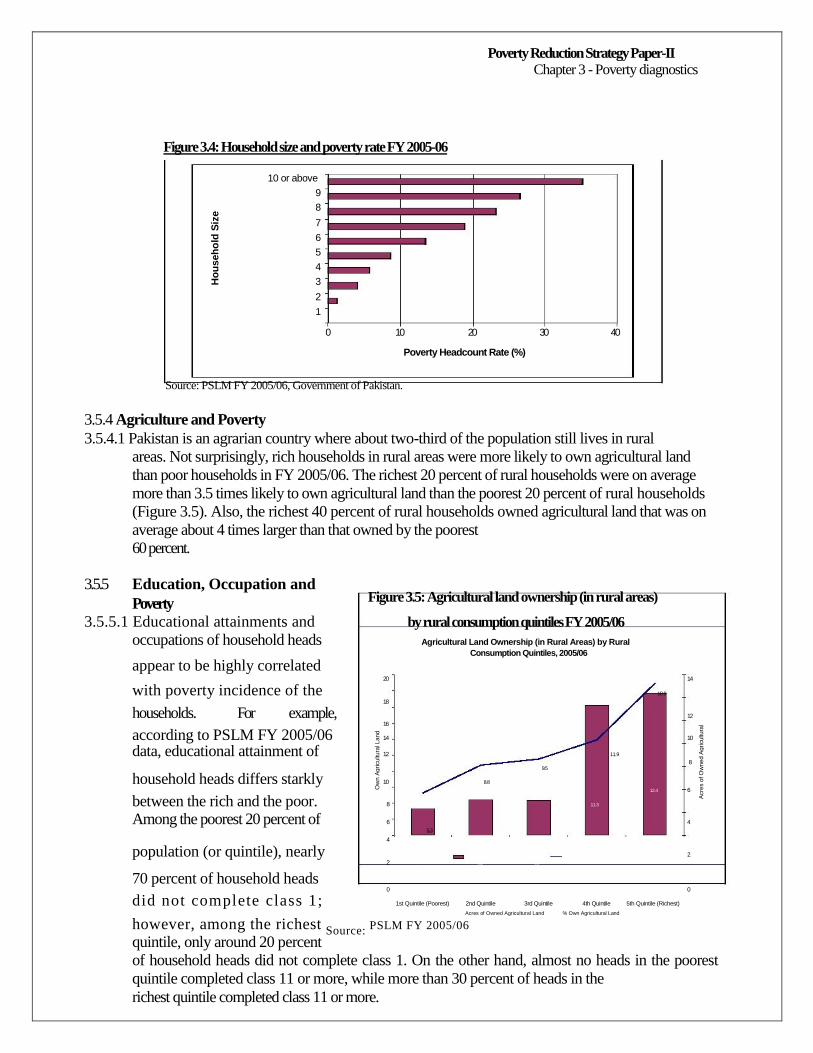
Poverty Reduction Strategy Paper-II Chapter 3 - Poverty diagnostics
Figure 3.4: Household size and poverty rate FY 2005-06
10 or above 9 8 7 6 5 4 3 2 1
0 10 20 30 40
Poverty Headcount Rate (%)
Source: PSLM FY 2005/06, Government of Pakistan.
3.5.4 Agriculture and Poverty
3.5.4.1 Pakistan is an agrarian country where about two-third of the population still lives in rural
areas. Not surprisingly, rich households in rural areas were more likely to own agricultural land
than poor households in FY 2005/06. The richest 20 percent of rural households were on average
more than 3.5 times likely to own agricultural land than the poorest 20 percent of rural households
(Figure 3.5). Also, the richest 40 percent of rural households owned agricultural land that was on
average about 4 times larger than that owned by the poorest
60 percent.
3.5.5
Education, Occupation and
Poverty
Figure 3.5: Agricultural land ownership (in rural areas)
3.5.5.1 Educational attainments and by rural consumption quintiles FY 2005/06
occupations of household heads Agricultural Land Ownership (in Rural Areas) by Rural Consumption Quintiles, 2005/06
appear to be highly correlated 20 14
with poverty incidence of the 18.9 18
households. For example, 12 16
according to PSLM FY 2005/06 14 10 data, educational attainment of 12 11.9
8 9.5
household heads differs starkly 10 8.8 12.4 6
between the rich and the poor. 8 11.3 Among the poorest 20 percent of 6 4
5.3 4
population (or quintile), nearly 2 2 3.1 3.0
2.3 70 percent of household heads
0 0 did not complete class 1; 1st Quintile (Poorest) 2nd Quintile 3rd Quintile 4th Quintile 5th Quintile (Richest)
Acres of Owned Agricultural Land % Own Agricultural Land
however, among the richest Source: PSLM FY 2005/06 quintile, only around 20 percent
of household heads did not complete class 1. On the other hand, almost no heads in the poorest
quintile completed class 11 or more, while more than 30 percent of heads in the
richest quintile completed class 11 or more.
Ho
us
eh
old
Siz
e
Acre
s o
f O
wned A
gricultura
l Land
Ow
n A
gricultura
l Land
(%)

47
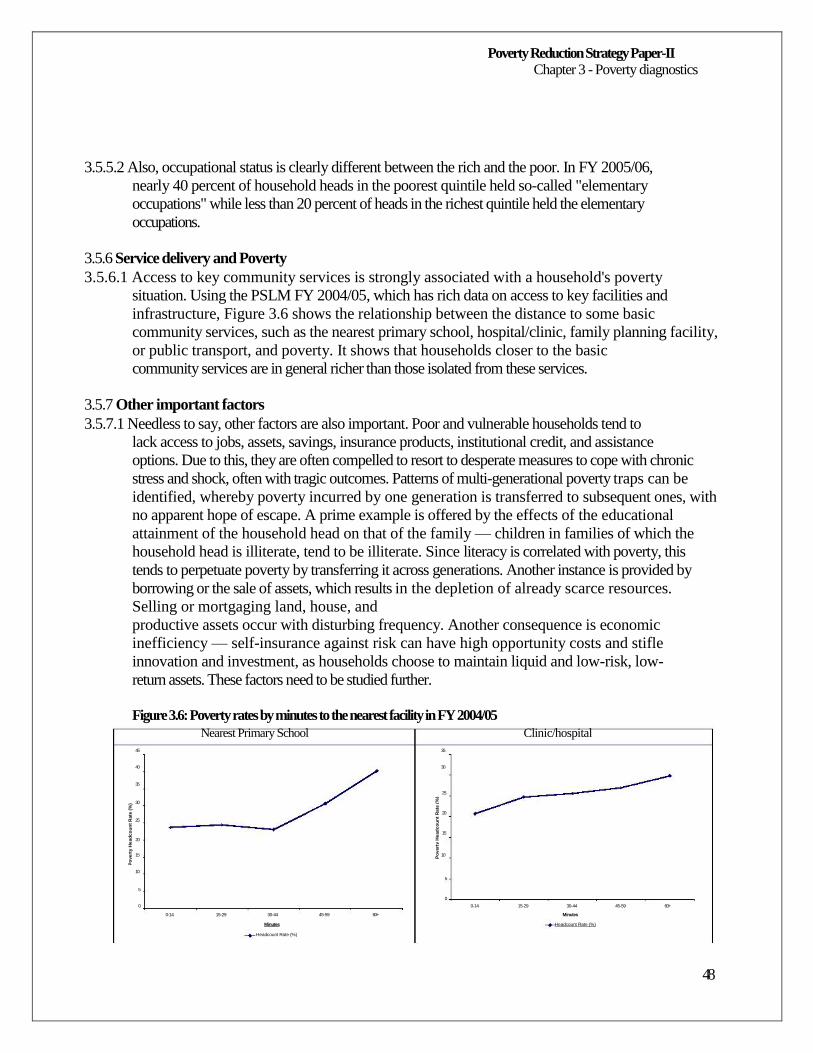
Poverty Reduction Strategy Paper-II Chapter 3 - Poverty diagnostics
3.5.5.2 Also, occupational status is clearly different between the rich and the poor. In FY 2005/06,
nearly 40 percent of household heads in the poorest quintile held so-called "elementary
occupations" while less than 20 percent of heads in the richest quintile held the elementary
occupations.
3.5.6 Service delivery and Poverty
3.5.6.1 Access to key community services is strongly associated with a household's poverty
situation. Using the PSLM FY 2004/05, which has rich data on access to key facilities and
infrastructure, Figure 3.6 shows the relationship between the distance to some basic
community services, such as the nearest primary school, hospital/clinic, family planning facility,
or public transport, and poverty. It shows that households closer to the basic
community services are in general richer than those isolated from these services.
3.5.7 Other important factors
3.5.7.1 Needless to say, other factors are also important. Poor and vulnerable households tend to
lack access to jobs, assets, savings, insurance products, institutional credit, and assistance
options. Due to this, they are often compelled to resort to desperate measures to cope with chronic
stress and shock, often with tragic outcomes. Patterns of multi-generational poverty traps can be
identified, whereby poverty incurred by one generation is transferred to subsequent ones, with
no apparent hope of escape. A prime example is offered by the effects of the educational
attainment of the household head on that of the family — children in families of which the
household head is illiterate, tend to be illiterate. Since literacy is correlated with poverty, this
tends to perpetuate poverty by transferring it across generations. Another instance is provided by
borrowing or the sale of assets, which results in the depletion of already scarce resources.
Selling or mortgaging land, house, and
productive assets occur with disturbing frequency. Another consequence is economic
inefficiency — self-insurance against risk can have high opportunity costs and stifle
innovation and investment, as households choose to maintain liquid and low-risk, low-
return assets. These factors need to be studied further.
Figure 3.6: Poverty rates by minutes to the nearest facility in FY 2004/05
Nearest Primary School Clinic/hospital 45 35 40 30 35
25 30
20 25
15 20 15 10 10
5 5
0 0 0-14 15-29 30-44 45-59 60+
0-14 15-29 30-44 45-59 60+ Minutes Minutes Headcount Rate (%)
Headcount Rate (%)
48
Po
vert
y H
ead
co
un
t R
ate
(%
)
Po
vert
y H
ead
co
un
t R
ate
(%
)
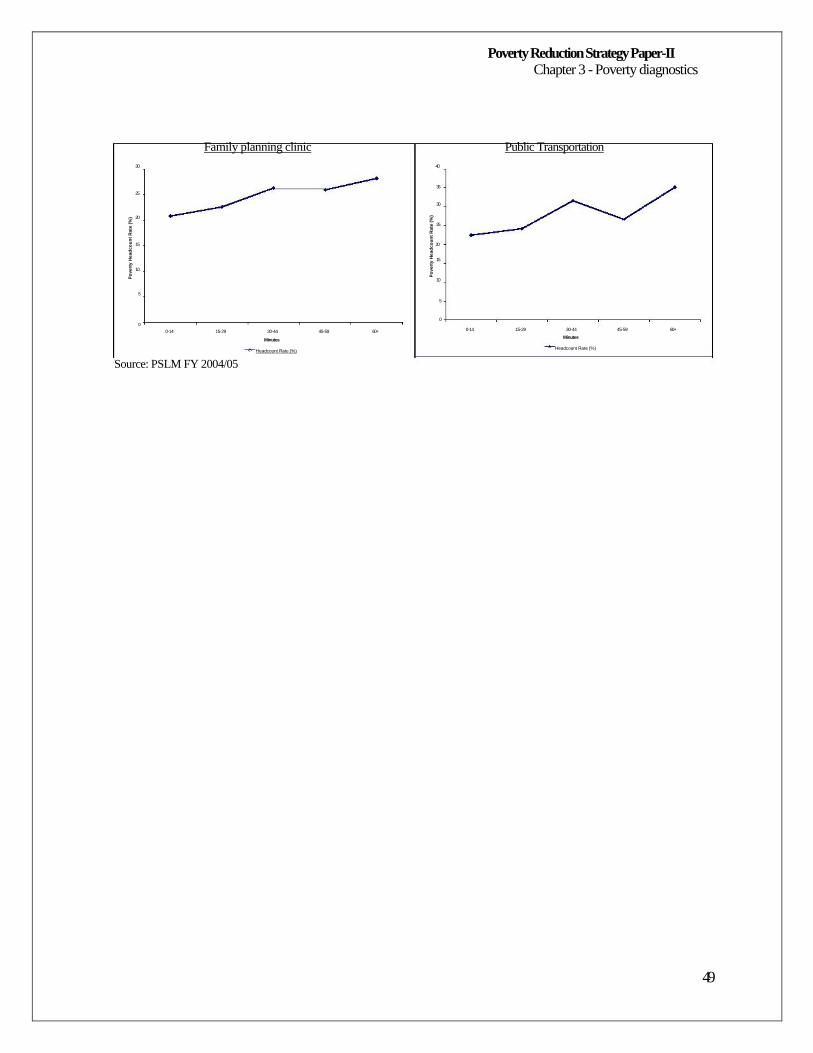
Poverty Reduction Strategy Paper-II Chapter 3 - Poverty diagnostics
Family planning clinic Public Transportation 30 40
35
25 30
20 25
15 20
15 10
10 5
5
0 0
0-14 15-29 30-44 Minutes
Headcount Rate (%)
45-59 60+ 0-14 15-29 30-44 Minutes
Headcount Rate (%)
45-59 60+
Source: PSLM FY 2004/05
49
Po
vert
y H
ead
co
un
t R
ate
(%
)
Po
vert
y H
ead
co
un
t R
ate
(%
)
Poverty Reduction Strategy Paper-II Chapter 3 - Poverty diagnostics
ANNEX: METHODOLOGY OF POVERTY LINE ESTIMATION
Among the many approaches and definitions in the theoretical literature and adopted by
various developing countries, the Planning Commission of Pakistan has used the following
definition for estimating the poverty line.
"Calorific requirement approach wherein all those households (or individuals) are
classified as poor who do not have income sufficient to allow a consumption pattern
consistent with minimum calorie requirements. It is also assumed that the households
earning incomes equivalent to poverty line not only have sufficient food to meet the
minimum nutrition requirements but also the non-food requirements".
It is to be noted that the current (FY 2005/06) estimates of poverty status (headcount ratio,
poverty gap and squared poverty gap) are updated by Consumer Price Index (CPI) from the revised
poverty estimates of FY 2000/01. The methodology of revised poverty estimates of the
FY 2000/01 involved the following steps:
I. Constructing Consumption Aggregate
The Aggregate Consumption Function (ACF) is constructed as follows:
Aggregate the various sub-components;
Adjust for cost of living differences; and
Adjust for household composition.
The Sub-components of ACF can be classified into four categories:
i. Food items;
ii. Non-food items;
iii. Consumer durables; and
iv. Housing.
(i) Food Items
It includes food consumed from all sources and needs data on the total values alongwith the
quantity of various food items consumed in the reference period:
Home produced food;
Food items received from the employer as payment in kind for services rendered; and
** Tobacco is not a food item
The whole of food consumption is transformed into a uniform reference period:
1 month = 2.71 * fortnights
1 year = 12 months
50
Poverty Reduction Strategy Paper-II Chapter 3 - Poverty diagnostics
There are some households that report zero quantities consumption but non-zero values of the
expenditure on few items. In such cases, prices for the data from other households are
constructed and median price paid by other households in the same cluster is used to come up
with the quantities.
(ii) Non-Food Items
The non-food items are heterogeneous in nature and hence data on values is available only;
quantities data is absent except in case of fuels. Following non-food expenditures have been
excluded from the non-food sub-aggregate:
es;
Purchases on financial assets, interest payments, and debts; and
Lumpy expenditures such as marriages/funerals.
(iii) Consumer Durables Appropriate measure of consumption of durable goods is the value of services that the household receives from all the durable goods in its possession over the relevant time period. It
is a tedious process and requires a lot of data which is not captured by HIES. Therefore, all
durable goods are excluded from ACF except Services and Repair Charges of household effect,
etc.
(iv) Housing
It is the most problematic of all sub-aggregations. It includes utilities (electricity, gas, water)
and the value of rent paid by the household. The rental value is not always reported, especially
in the rural areas. In such cases, implicit or imputed rental value is calculated by using
'Hedonic Housing Regression.'
For regression purpose, consider all the households that report a payment/benefit from the rent.
Regress this variable on some of the household characteristics that can affect the value of rent
such as:
Number of rooms, if missing use median number of rooms
Availability of electricity; dummy variable : 1 if yes, 0 if not
Availability of gas; dummy variable : 1 if yes, 0 if not
Availability of telephone; dummy variable : 1 if yes, 0 if not
Availability of water; dummy variable : 1 if yes, 0 if not
Availability of toilet; dummy variable : 1 if yes, 0 if not
Availability of garbage collection; dummy variable : 1 if yes, 0 if not
Location: dummy for strata in the survey: urban, rural, and provinces
51
Poverty Reduction Strategy Paper-II Chapter 3 - Poverty diagnostics
Take logarithm of the dependent as well as the independent variables for regression. Parameter
estimates from this model are used to calculate rent for the other segment of population.
II. Adult Equivalence Scale
Nutrition based adult equivalent scales which differentiate between households on the basis of sex and age are also used for transforming the number of persons in a household to adult equivalents. The application of nutrition based equivalent scales to any expenditure other than food expenditure is questionable from a methodological point of view. The "revised estimates" are based on a simple equivalent scale that weights 0.8 to individuals younger than 18 years old and 1 for all other individuals. The adult equivalent scale of Planning Commission is based on calorie requirements and therefore, applicable only to food consumption expenditure.
Moreover, food expenditure represents only about 50 percent of the total consumption
expenditure, therefore, an adult equivalent scale (0.8 for younger than 18 years old and 1 for
others) has been used to adjust the total household consumption expenditure.
III. Methodology of Poverty Line Estimation:
Poverty line is estimated from a regression of per adult equivalent monthly consumption expenditure (food and non-food) against estimated daily per adult equivalent calorie intake.
This methodology implicitly assumes that those households that reach the minimum
requirement of calorie also consume necessary nonfood items, otherwise they would have
increased calorie intake. The regression is run for the first three quintiles so that expensive and
luxury consumption habits of the rich may not overestimate the poverty line.
Regression Equation Form
The regression equation is as under:
LnY = a + bX + u
Where:
Y = Monthly per adult equivalent consumption expenditure (food and non-food)
X = Daily per adult equivalent calorie intake
Results
Ln Y = (6.112 + (2.019E-4*2350)) = Rs 723.40 (Updated Estimates)
R² = 0.195
Standard error of the estimate = 0.2112
Assumptions:
There exists specifically defined amount of calories that is considered essential. Here,
this per adult equivalent minimum calorie requirement (X) is 2350 calories per adult
equivalent per month;
52
Poverty Reduction Strategy Paper-II Chapter 3 - Poverty diagnostics
In case the minimum calorie requirement is achieved, then implicitly, the nonfood
essential items are also achieved;
Same goods basket is consumed in all the provinces.; and
The first three per adult equivalent consumption expenditure quintiles are used in the
regression equation estimating the poverty line so that the consumption pattern of the
rich does not affect the determination of the poverty line.
IV. Methodology of Poverty Indices Estimation
Poverty indices
Once the decision has been made regarding the choice of poverty line there is then choice of aggregator. This can range from a simple count of individuals below poverty line to more complicated measures which take account of the distribution of income amongst the poor. We use the poverty measures proposed by Foster, Greer, and Thorbeck (1984) that are the
headcount ratio (P0), average poverty gap (P1) and the squared poverty gap (P2).
Headcount ratio (P0)
The headcount ratio is defined as the proportion of people below the poverty line. This measure is easy to calculate but it has some disadvantages. It takes no account of the depth of
poverty. Someone just below the poverty line has the same weight as the very poorest of the poor. It
also fails to obey the principle of transfers i.e. a transfer of income from a poorer
person to a rich person does not increase headcount ratio. Indeed, if the recipient of the transfer is just below
the poverty line and the transfer raises him just above the poverty line then the transfer will have
reduced poverty. This gives rise to the situation where the most effective means of the reducing
poverty is to target the comparatively best-off the poor. Despite these
drawbacks, the headcount ratio is still perhaps the most widely used poverty measure.
Headcount:
1 if wi z
Poi = po (wi) = HC=1/N po
(wi)
{ 0 if wi
z
Where z is the value of the poverty line, wi is the per adult equivalent consumption expenditure of the individual i, and N is the total population. For all the indices, when the individual values are
summed up they are multiplied by the household size and properly weighted to represent
the whole population.
Poverty Gap (P1)
Poverty gap is the product of incidence and average distance between the incomes of the poor and the poverty line. It reflects the average shortfall of the incomes of the poor expressed as a

53
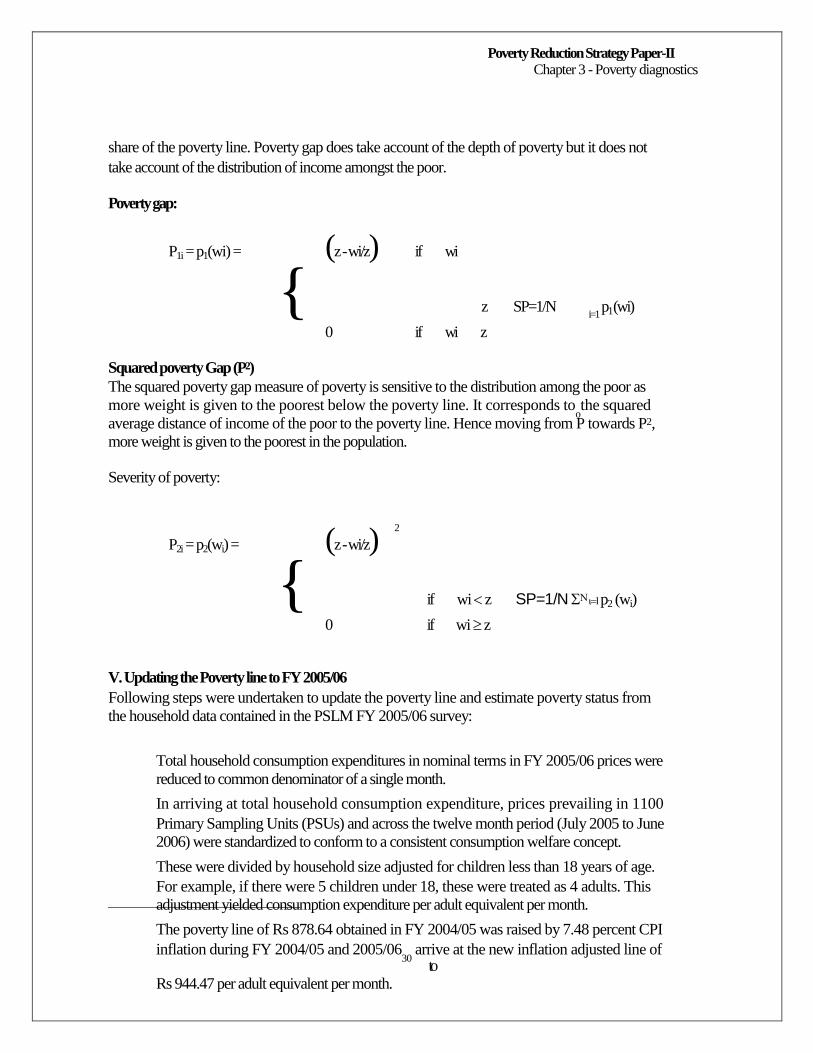
Poverty Reduction Strategy Paper-II Chapter 3 - Poverty diagnostics
share of the poverty line. Poverty gap does take account of the depth of poverty but it does not
take account of the distribution of income amongst the poor.
Poverty gap:
P1i = p1(wi) = (z - wi/z) if wi
{ z SP=1/N i=1
p1 (wi)
0 if wi z
Squared poverty Gap (P2)
The squared poverty gap measure of poverty is sensitive to the distribution among the poor as
more weight is given to the poorest below the poverty line. It corresponds toothe squared
average distance of income of the poor to the poverty line. Hence moving from P towards P2,
more weight is given to the poorest in the population.
Severity of poverty:
2
P2i = p2(wi) = (z - wi/z)
{ if wi z SP=1/Np2 (wi)
0 if wi z
V. Updating the Poverty line to FY 2005/06
Following steps were undertaken to update the poverty line and estimate poverty status from
the household data contained in the PSLM FY 2005/06 survey:
Total household consumption expenditures in nominal terms in FY 2005/06 prices were
reduced to common denominator of a single month.
In arriving at total household consumption expenditure, prices prevailing in 1100
Primary Sampling Units (PSUs) and across the twelve month period (July 2005 to June
2006) were standardized to conform to a consistent consumption welfare concept.
These were divided by household size adjusted for children less than 18 years of age.
For example, if there were 5 children under 18, these were treated as 4 adults. This
adjustment yielded consumption expenditure per adult equivalent per month.
The poverty line of Rs 878.64 obtained in FY 2004/05 was raised by 7.48 percent CPI
inflation during FY 2004/05 and 2005/0630
arrive at the new inflation adjusted line of to
Rs 944.47 per adult equivalent per month.

30 Note in order to arrive at poverty-status for FY 2004/05, the poverty line of Rs 723.40 obtained in FY 2001/02 by
methodology described above was adjusted by CPI inflation of 21.46 percent during the period to obtain poverty line of Rs 878.64 in FY 2004/05.
54

Poverty Reduction Strategy Paper-II Chapter 3 - Poverty diagnostics
By comparing the per adult equivalent per month expenditure of each sampled
individual with the FY 2005/06 poverty line of Rs 944.47, the above indicators on
poverty status were calculated.
55
Poverty Reduction Strategy Paper-II Chapter 4 - Pillar I: Macroeconomic stability and real sector growth
Chapter 4 - Pillar I: Macroeconomic stability and real sector
growth
4.1
4.2
4.3
4.4
The study of global and regional poverty as well as Pakistan's own experience from the PRSP-I period suggest that a country's economy must grow rapidly over a prolonged period in
order to reduce poverty. At the macro level, economic growth implies greater
availability of public resources to improve the quantity and quality of education, health and other
services. At the micro level, economic growth creates employment opportunities, increases the
incomes of the people, and therefore reduces poverty. Many developing countries have
succeeded in boosting economic growth for brief periods, but only those that have sustained high
growth over substantial periods (say, two or more decades) have seen a lasting reduction in poverty.
East Asian countries such as Korea, Malaysia, China,
Taiwan, Singapore, and Hong Kong offer clear examples of the effects of economic growth on
poverty alleviation. It is also evident from the experience of these countries that growth
does not come automatically — it requires policies. Macroeconomic stability is the key to sustain
high economic growth for longer periods. The persistence of high economic growth and not a short
sequence of bust and boom that characterized the Pakistan economy over
the years is the best hope for poverty alleviation.
The distribution of poor population in Pakistan suggests that almost 75 percent of the poor
are clustered around the poverty line. Thus a slight rise in the mean income pulls many
people above the poverty line whereas one crop failure or economic shock may send millions
below the poverty line. Pakistan has historically posted higher economic growth too often in its
checkered history of sixty years. The volatility in economic growth due to macroeconomic forces
is the basis of the asymmetric growth in Pakistan and played an important influence on
income distribution. The effects of income growth and the
distributive effect associated to structural change were positive on reducing poverty but the evolution
of relative prices and wage policies avoided a real income growth of urban and rural low skilled
labours. The volatility of the income has proved very costly for the poor.
The economy experienced longer spell of slower economic growth only in the 1990s and
the poverty level reached as high as 34 percent of the population in 2001.
The economy moved to a higher growth trajectory in the vicinity of 6-7 percent real GDP
growth during FY 2002-07 and resultantly the poverty declined substantially in FY
2004/05. However, the growth strategy relied heavily on external financing and use of sale
proceeds from some public sector assets to meet a growing current account deficit. The poor
resource mobilization efforts within the country remained hallmark of the economic
policy in this period and exacerbated vulnerabilities to external shocks.
The domestic factor behind higher growth during 2002-07 was a consumer boom on the
back of enhanced access to credit. The services sector and production of durables in the
manufacturing sector spearheaded the move to higher growth trajectory. The agriculture sector and
small and medium industry were largely ignored. These two areas were the best
56
Poverty Reduction Strategy Paper-II Chapter 4 - Pillar I: Macroeconomic stability and real sector growth
hope for poverty reduction. Financial businesses and telecommunication were the major
attractions of foreign investors and these two sectors registered double digit growth feeding into
higher growth in the services sector. The minimal potential of job creation and lower
level of forward and backward linkages has given rise to a 'jobless and joyless' growth.
4.5
4.6
4.7
4.8
4.9
The productive capacity of the economy remained alien to this higher growth and new
industrial capacity was hardly added to the economy. The agricultural policy was not
announced during the last eight years. The input prices of agriculture escalated at a faster pace while
output prices remained almost stagnant up to 2006 and it was only in the last two years the output
prices witnessed upsurge. Poor water resource management was another area of concern and no
serious efforts were made to augment smooth supply of the
irrigation water. The agriculture sector faced acute water and input shortages during the last
eight years but no conscious effort was being done to bridge demand-supply gap.
Severe macroeconomic pressure impacted economic activity in Pakistan in FY 2007/08.
Beside other factors, Pakistan has had to face significant costs during the last few years
being a frontline state in the 'War on Terror', thereby neutralizing buoyancy in capital inflows.
The law and order situation in certain parts of the country has deteriorated alarmingly.
Pakistan, with the rest of the world felt the force of a steep rise in the prices of
petroleum and primary products.
The fiscal year 2007/08 was a volatile year for Pakistan's economy both on domestic and
external fronts. Number of unfavourable and unexpected events occurred during the years, which
include: political unrest; law and order situation; supply shock; rising oil; food and
other essentials prices; and crisis in the international financial market together with
shortcomings in economic management. All these events have adversely affected the key
macroeconomic fundamentals of Pakistan. The economy suffered a setback as GDP
registered a growth of 5.8 percent against the target of 7.2 percent and a growth rate of 6.8 percent in
FY 2006/07. The major sectors, agriculture and manufacturing, performed poorly. Services
sector was the saving grace of economic growth in FY2007/08 which primarily stemmed from
better than expected performance achieving 8.2 percent as against
7.6 the previous year.
The FY 2007/08 saw the fragility of the growth model adopted by Pakistan during the last
several years. Surging oil, food and commodity prices accompanied by the turmoil in
international financial markets and the disturbed domestic political conditions had an
adverse impact on Pakistan's budgetary position. Furthermore, over a year of policy
inaction on account of political expediency for addressing the challenges, accentuated the
budgetary imbalances. Expenditures greatly exceeded their budgeted amounts, mainly
because of subsidies on oil, power, fertilizer, wheat and other foods.
The mismanagement of wheat operations led to an unanticipated import of 1.7 million tons
of wheat at high prices, despite a bumper wheat crop (23.3 million tons) in 2006/07. This imposed a
burden of Rs 40 billion on the government as payment for differential between
57
Poverty Reduction Strategy Paper-II Chapter 4 - Pillar I: Macroeconomic stability and real sector growth
the cheaper price in the domestic market and imported cost. In a similar fashion, the higher
cost of furnace oil used in power generation was not allowed to pass through to domestic
consumers of electricity. Therefore, against the budgeted subsidy of Rs 52.9 billion the
projected power subsidy stood at Rs 113 billion — a slippage of Rs 60 billion.
4.10 The fiscal deficit surpassed the target by 3.4 percentage points of GDP. The combined
impact of subsidies to the budget on account of oil and commodity shocks was estimated at
nearly 3.6 percent of the GDP. It means the overrun of the fiscal deficit was entirely driven by the
subsidies. Belated attempts to obtain savings from reductions in the development expenditures
were unsuccessful. The efforts to curb the fiscal deficit within the target were further undermined
by the huge overruns in interest payments. In the wake of major disruptions like domestic food
and energy shortages and a plummeting exchange rate with high inflation, and exceptionally
high macroeconomic imbalances, the required
contingency plan was missing.
4.11 With the beginning of the new fiscal year (2008/09), Pakistan economy faced four major
challenges: decelerating growth; rising inflation; growing fiscal deficit; and the widening gap in
merchandise trade leading to a sharp depletion of foreign exchange reserves and a
plummeting exchange rate.
4.12 The high price of food in the global arena threatens to push millions into poverty. Rising
food prices have pushed up overall inflation not only in Pakistan, but across the region,
particularly during 2007 and mid 2008. This is worrisome, because food price inflation is
the most regressive of all taxes, hurting the poor and fixed income groups the most.
4.13 The recent upsurge in inflation is unprecedented in Pakistan and the victim of this hike is
the lowest income group where incidence of inflation is the highest among all income groups.
Downward adjustments in fuel prices will be neutralized by upward adjustment in energy prices
but increase in support price of wheat will also play a role. Inflation has edged up due to
massive borrowing from the SBP for budget financing and the government has, therefore, committed
itself to restrict SBP financing to zero (on net basis) in order to
stabilize inflation.
4.14 Macroeconomic Framework
4.14.1 Macroeconomic imbalances are inimical to longer-term growth and macroeconomic
stability. The longer the imbalances persist, the greater the subsequent adjustment will be needed.
Macroeconomic stability is, therefore, found to be absolutely vital for improving
the investment climate and taking the economy at higher growth path on a sustained basis.
The objectives of Pakistan's stabilization programme are to reduce the 'twin deficits' (fiscal and
current account) to restore macroeconomic balance, to bring the balance of payment to a viable
position, and to build up foreign exchange reserves with a view to
strengthening shock absorbing capacity of the economy.
58
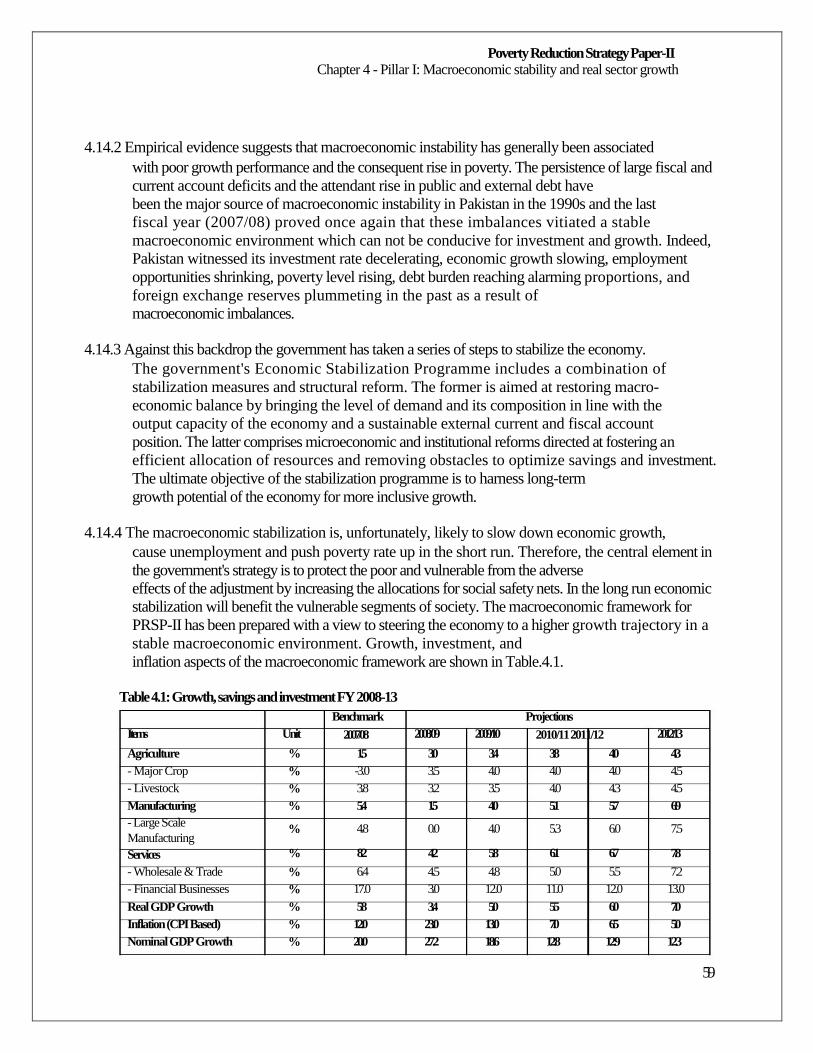
Poverty Reduction Strategy Paper-II Chapter 4 - Pillar I: Macroeconomic stability and real sector growth
4.14.2 Empirical evidence suggests that macroeconomic instability has generally been associated
with poor growth performance and the consequent rise in poverty. The persistence of large fiscal and
current account deficits and the attendant rise in public and external debt have
been the major source of macroeconomic instability in Pakistan in the 1990s and the last
fiscal year (2007/08) proved once again that these imbalances vitiated a stable
macroeconomic environment which can not be conducive for investment and growth. Indeed,
Pakistan witnessed its investment rate decelerating, economic growth slowing, employment
opportunities shrinking, poverty level rising, debt burden reaching alarming proportions, and
foreign exchange reserves plummeting in the past as a result of
macroeconomic imbalances.
4.14.3 Against this backdrop the government has taken a series of steps to stabilize the economy.
The government's Economic Stabilization Programme includes a combination of
stabilization measures and structural reform. The former is aimed at restoring macro-
economic balance by bringing the level of demand and its composition in line with the
output capacity of the economy and a sustainable external current and fiscal account
position. The latter comprises microeconomic and institutional reforms directed at fostering an
efficient allocation of resources and removing obstacles to optimize savings and investment.
The ultimate objective of the stabilization programme is to harness long-term
growth potential of the economy for more inclusive growth.
4.14.4 The macroeconomic stabilization is, unfortunately, likely to slow down economic growth,
cause unemployment and push poverty rate up in the short run. Therefore, the central element in
the government's strategy is to protect the poor and vulnerable from the adverse
effects of the adjustment by increasing the allocations for social safety nets. In the long run economic
stabilization will benefit the vulnerable segments of society. The macroeconomic framework for
PRSP-II has been prepared with a view to steering the economy to a higher growth trajectory in a
stable macroeconomic environment. Growth, investment, and
inflation aspects of the macroeconomic framework are shown in Table.4.1.
Table 4.1: Growth, savings and investment FY 2008-13
Items
Agriculture - Major Crop - Livestock Manufacturing - Large Scale Manufacturing Services - Wholesale & Trade - Financial Businesses Real GDP Growth Inflation (CPI Based) Nominal GDP Growth
Unit
% % % %
%
%
% % % % %
Benchmark
2007/08
1.5 -3.0 3.8 5.4
4.8
8.2
6.4 17.0 5.8
12.0 20.0
2008/09
3.0 3.5 3.2 1.5
0.0
4.2
4.5 3.0 3.4
23.0 27.2
2009/10
3.4 4.0 3.5 4.0
4.0
5.8
4.8 12.0 5.0
13.0 18.6
Projections
2010/11 2011/12
3.8 4.0 4.0 4.0 4.0 4.3 5.1 5.7
5.3 6.0
6.1 6.7
5.0 5.5 11.0 12.0 5.5 6.0 7.0 6.5
12.8 12.9
2012/13
4.3 4.5 4.5 6.9
7.5
7.8
7.2 13.0 7.0 5.0
12.3
59
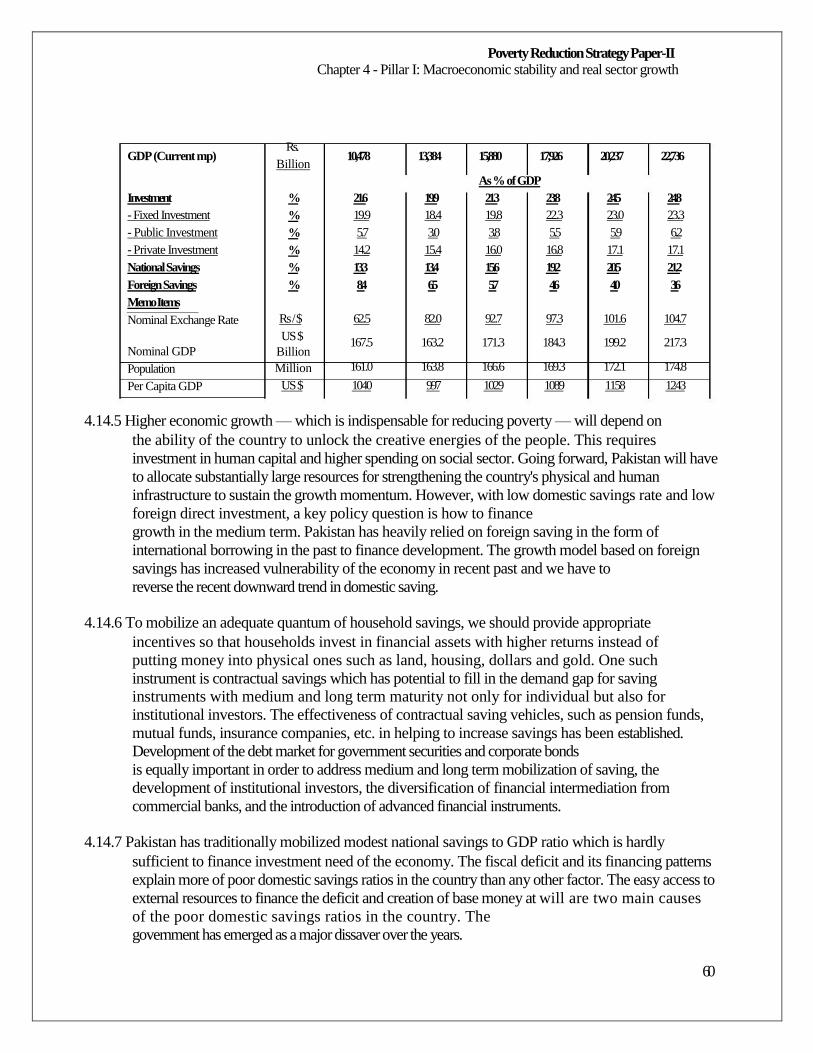
Poverty Reduction Strategy Paper-II Chapter 4 - Pillar I: Macroeconomic stability and real sector growth
GDP (Current mp)
Rs. Billion
10,478
13,384
15,880
17,926
20,237
22,736
As % of GDP
Investment - Fixed Investment - Public Investment - Private Investment National Savings Foreign Savings Memo Items Nominal Exchange Rate
Nominal GDP Population Per Capita GDP
% % % % % %
Rs / $ US $
Billion Million
US $
21.6 19.9 5.7
14.2 13.3 8.4
62.5
167.5
161.0
1040
19.9 18.4 3.0
15.4 13.4 6.5
82.0
163.2
163.8
997
21.3 19.8 3.8
16.0 15.6 5.7
92.7
171.3
166.6
1029
23.8 22.3 5.5
16.8 19.2 4.6
97.3
184.3
169.3
1089
24.5 23.0 5.9
17.1 20.5 4.0
101.6
199.2
172.1
1158
24.8 23.3 6.2
17.1 21.2 3.6
104.7
217.3
174.8
1243
4.14.5 Higher economic growth — which is indispensable for reducing poverty — will depend on
the ability of the country to unlock the creative energies of the people. This requires
investment in human capital and higher spending on social sector. Going forward, Pakistan will have
to allocate substantially large resources for strengthening the country's physical and human
infrastructure to sustain the growth momentum. However, with low domestic savings rate and low
foreign direct investment, a key policy question is how to finance
growth in the medium term. Pakistan has heavily relied on foreign saving in the form of
international borrowing in the past to finance development. The growth model based on foreign
savings has increased vulnerability of the economy in recent past and we have to
reverse the recent downward trend in domestic saving.
4.14.6 To mobilize an adequate quantum of household savings, we should provide appropriate
incentives so that households invest in financial assets with higher returns instead of
putting money into physical ones such as land, housing, dollars and gold. One such
instrument is contractual savings which has potential to fill in the demand gap for saving instruments with medium and long term maturity not only for individual but also for
institutional investors. The effectiveness of contractual saving vehicles, such as pension funds,
mutual funds, insurance companies, etc. in helping to increase savings has been established.
Development of the debt market for government securities and corporate bonds
is equally important in order to address medium and long term mobilization of saving, the
development of institutional investors, the diversification of financial intermediation from
commercial banks, and the introduction of advanced financial instruments.
4.14.7 Pakistan has traditionally mobilized modest national savings to GDP ratio which is hardly
sufficient to finance investment need of the economy. The fiscal deficit and its financing patterns
explain more of poor domestic savings ratios in the country than any other factor. The easy access to
external resources to finance the deficit and creation of base money at will are two main causes
of the poor domestic savings ratios in the country. The
government has emerged as a major dissaver over the years.
60
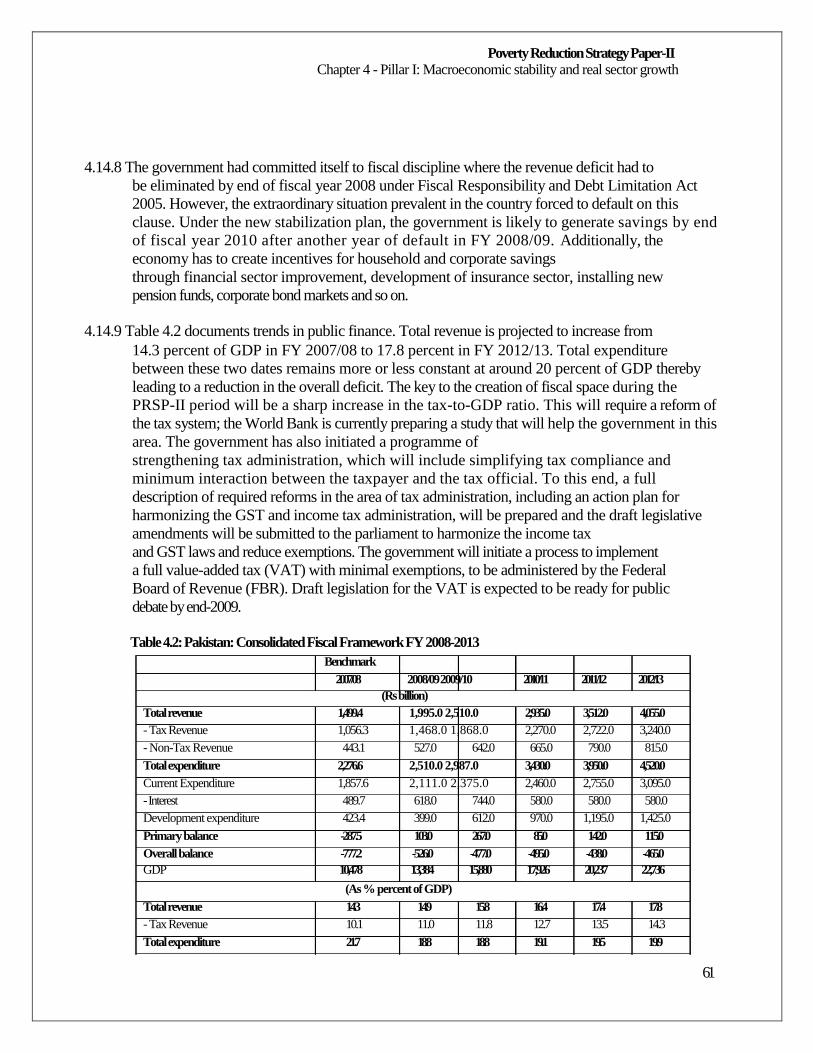
Poverty Reduction Strategy Paper-II Chapter 4 - Pillar I: Macroeconomic stability and real sector growth
4.14.8 The government had committed itself to fiscal discipline where the revenue deficit had to
be eliminated by end of fiscal year 2008 under Fiscal Responsibility and Debt Limitation Act
2005. However, the extraordinary situation prevalent in the country forced to default on this
clause. Under the new stabilization plan, the government is likely to generate savings by end
of fiscal year 2010 after another year of default in FY 2008/09. Additionally, the
economy has to create incentives for household and corporate savings
through financial sector improvement, development of insurance sector, installing new
pension funds, corporate bond markets and so on.
4.14.9 Table 4.2 documents trends in public finance. Total revenue is projected to increase from
14.3 percent of GDP in FY 2007/08 to 17.8 percent in FY 2012/13. Total expenditure
between these two dates remains more or less constant at around 20 percent of GDP thereby
leading to a reduction in the overall deficit. The key to the creation of fiscal space during the
PRSP-II period will be a sharp increase in the tax-to-GDP ratio. This will require a reform of
the tax system; the World Bank is currently preparing a study that will help the government in this
area. The government has also initiated a programme of
strengthening tax administration, which will include simplifying tax compliance and
minimum interaction between the taxpayer and the tax official. To this end, a full
description of required reforms in the area of tax administration, including an action plan for
harmonizing the GST and income tax administration, will be prepared and the draft legislative
amendments will be submitted to the parliament to harmonize the income tax
and GST laws and reduce exemptions. The government will initiate a process to implement
a full value-added tax (VAT) with minimal exemptions, to be administered by the Federal
Board of Revenue (FBR). Draft legislation for the VAT is expected to be ready for public
debate by end-2009.
Table 4.2: Pakistan: Consolidated Fiscal Framework FY 2008-2013
Benchmark
2007/08 2008/09 2009/10 2010/11 2011/12 2012/13 (Rs billion)
Total revenue 1,499.4 1,995.0 2,510.0 2,935.0 3,512.0 4,055.0 - Tax Revenue 1,056.3 1,468.0 1,868.0 2,270.0 2,722.0 3,240.0 - Non-Tax Revenue 443.1 527.0 642.0 665.0 790.0 815.0 Total expenditure 2,276.6 2,510.0 2,987.0 3,430.0 3,950.0 4,520.0 Current Expenditure 1,857.6 2,111.0 2,375.0 2,460.0 2,755.0 3,095.0 - Interest 489.7 618.0 744.0 580.0 580.0 580.0 Development expenditure 423.4 399.0 612.0 970.0 1,195.0 1,425.0 Primary balance -287.5 103.0 267.0 85.0 142.0 115.0 Overall balance -777.2 -526.0 -477.0 -495.0 -438.0 -465.0 GDP 10,478 13,384 15,880 17,926 20,237 22,736
(As % percent of GDP)
Total revenue 14.3 14.9 15.8 16.4 17.4 17.8 - Tax Revenue 10.1 11.0 11.8 12.7 13.5 14.3 Total expenditure 21.7 18.8 18.8 19.1 19.5 19.9
61
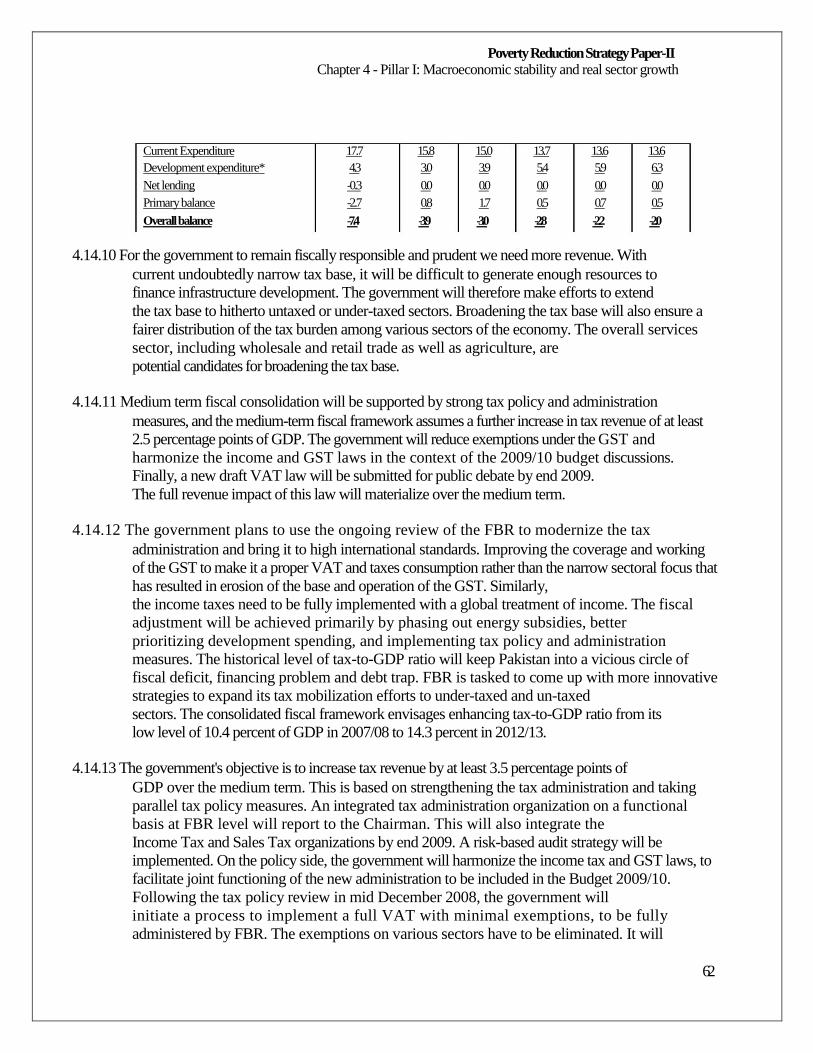
Poverty Reduction Strategy Paper-II Chapter 4 - Pillar I: Macroeconomic stability and real sector growth
Current Expenditure 17.7 15.8 15.0 13.7 13.6 13.6 Development expenditure* 4.3 3.0 3.9 5.4 5.9 6.3 Net lending -0.3 0.0 0.0 0.0 0.0 0.0 Primary balance -2.7 0.8 1.7 0.5 0.7 0.5 Overall balance -7.4 -3.9 -3.0 -2.8 -2.2 -2.0
4.14.10 For the government to remain fiscally responsible and prudent we need more revenue. With
current undoubtedly narrow tax base, it will be difficult to generate enough resources to
finance infrastructure development. The government will therefore make efforts to extend
the tax base to hitherto untaxed or under-taxed sectors. Broadening the tax base will also ensure a
fairer distribution of the tax burden among various sectors of the economy. The overall services
sector, including wholesale and retail trade as well as agriculture, are
potential candidates for broadening the tax base.
4.14.11 Medium term fiscal consolidation will be supported by strong tax policy and administration
measures, and the medium-term fiscal framework assumes a further increase in tax revenue of at least
2.5 percentage points of GDP. The government will reduce exemptions under the GST and
harmonize the income and GST laws in the context of the 2009/10 budget discussions.
Finally, a new draft VAT law will be submitted for public debate by end 2009.
The full revenue impact of this law will materialize over the medium term.
4.14.12 The government plans to use the ongoing review of the FBR to modernize the tax
administration and bring it to high international standards. Improving the coverage and working
of the GST to make it a proper VAT and taxes consumption rather than the narrow sectoral focus that
has resulted in erosion of the base and operation of the GST. Similarly,
the income taxes need to be fully implemented with a global treatment of income. The fiscal
adjustment will be achieved primarily by phasing out energy subsidies, better
prioritizing development spending, and implementing tax policy and administration
measures. The historical level of tax-to-GDP ratio will keep Pakistan into a vicious circle of
fiscal deficit, financing problem and debt trap. FBR is tasked to come up with more innovative
strategies to expand its tax mobilization efforts to under-taxed and un-taxed
sectors. The consolidated fiscal framework envisages enhancing tax-to-GDP ratio from its
low level of 10.4 percent of GDP in 2007/08 to 14.3 percent in 2012/13.
4.14.13 The government's objective is to increase tax revenue by at least 3.5 percentage points of
GDP over the medium term. This is based on strengthening the tax administration and taking
parallel tax policy measures. An integrated tax administration organization on a functional
basis at FBR level will report to the Chairman. This will also integrate the
Income Tax and Sales Tax organizations by end 2009. A risk-based audit strategy will be
implemented. On the policy side, the government will harmonize the income tax and GST laws, to
facilitate joint functioning of the new administration to be included in the Budget 2009/10.
Following the tax policy review in mid December 2008, the government will
initiate a process to implement a full VAT with minimal exemptions, to be fully
administered by FBR. The exemptions on various sectors have to be eliminated. It will
62
Poverty Reduction Strategy Paper-II Chapter 4 - Pillar I: Macroeconomic stability and real sector growth
enable the government to reduce marginal tax rates which will help further stimulate
investment and production and will promote voluntary tax compliance. It will also ensure
the fair distribution of the tax burden among various sectors of the economy.
4.14.14 Investment is the key driver of economic growth. In order to achieve the desired growth,
investment rate is projected to move from 21.6 percent of GDP in FY 2007/08 to 24.8
percent in FY 2012/13. Private investment will take the lead in reinvigorating directly the
production sectors — rising from 14.2 to 17.1 percent between the two dates, while public
sector investment will focus on human and infrastructure development. National savings
are projected to increase from 13.3 percent of GDP to 21.2 percent over this period. The
savings-investment gap is therefore projected at 6.5 percent of GDP in FY 2008/09 and 3.6 percent of
GDP in FY 2012/13 (Table 4.1). This shows that reliance on foreigner's savings will be reduced with
the passage of time and the investment demand for higher growth
would be financed from domestic savings.
4.14.15 The dynamics of macroeconomics of the country have undergone substantial change in
recent years. The strategy of financing growth through higher current account deficit is seen to
have failed, and the focus on production sector has to be enhanced for more
inclusive growth. The people at the bottom of the pyramid need more share of
opportunities in the process of economic development. Pakistan is introducing second
generation of reforms with a greater focus of inclusion of people at the bottom of pyramid by
creating more jobs and opportunities. The strategy will focus on small businesses which
will help in resolving the problem of income distribution.
4.14.16 These are all included in the stabilization plan. In implementing its new broad-based
programme for economic stabilization, the government has already taken the following
actions:
raised petroleum prices to reduce burden on the budget;
significantly cut expenditures, particularly on subsidies;
tightened monetary policy to fight inflation, as interest rates were raised by nearly 350
basis points (bps);
depreciated exchange rate by nearly 20 percent between March and December, 2008;
introduce additional measures (such as curbing forward booking of foreign exchange)
to cool off import demand;
put restrictions on the use of foreign exchange;
committed to remove all subsidies on oil and electricity by end December 2008 and
June 2009;
eschewed further borrowing from the State Bank (on a net basis);
imposed regulatory duties on non-essential imports; and
Cut development spending to adhere to the fiscal deficit target of 4.3 percent of GDP.
63
Poverty Reduction Strategy Paper-II Chapter 4 - Pillar I: Macroeconomic stability and real sector growth
4.14.17 In order to cushion the impact of this programme on the poor, the government initiated the
Benazir Income Support Programme (BISP) with an allocation of Rs 34 billion (this is
discussed in detail in the next chapter). The new macroeconomic framework reinforces
commitment to target vulnerable segments of the society and an increase of 0.6 percentage
points of GDP in FY 2008/09 in the social safety net spending to 0.9 percent of GDP, in
order to protect the poor and cushion the impact of the elimination of subsidies on
vulnerable groups.
4.14.18 The consolidated fiscal framework strikes a balance between resource availability and
expenditure spree. The latter are made to decline from 21.7 percent of GDP to 19.9 percent
in the medium term. The composition will shift towards growth-enhancing components —
current expenditure will fall from 17.7 percent of GDP to 13.6 percent, while development
expenditure is projected to rise from 4.3 percent of GDP to 6.3 percent. To keep the fiscal deficit
at a sustainable level, greater emphasis is placed on additional resource
mobilization. The fiscal deficit is envisaged to be reduced from 7.4 percent of GDP in FY
2007/08 to 2.0 percent in FY 2012/13.
4.14.19 A credible and prudent fiscal policy comprised of: (i) a balanced tax structure based on
rational and affordable rates with minimal exemptions covering a broad range of taxpayers; (ii) an
expenditure policy that aims to moderate growth in non-developmental expenditure and adequately
accommodative for pressing social and infrastructure needs of a developing
economy; and (iii) a prudent debt management policy.
4.14.20 The Fiscal Responsibility and Debt Limitation Act (FRDLA), 2005 binds the government
to achieve revenue balance (total revenue minus total current expenditure) by the end of the fiscal year
2007/08. This target was not achieved because of extraordinary developments in
the year, caused mainly by higher food and oil subsidies. The fiscal aspect of the
macroeconomic framework adheres to the limit set by the Act, and accordingly a revenue surplus
is maintained throughout the period of the Medium-Term Macroeconomic Framework.
Within this framework, current expenditures decline from nearly 17.7 percent of GDP in FY
2007/08 to 13.6 percent in FY 2012/13. This restraint is largely brought
about by declining payments for interest.
4.14.21 Pro-poor expenditures will be prioritized through a Medium Term Expenditure Framework
(MTEF) that will be consistent with the FRDL Act, 2005 which stipulates that expenditures on
social sectors would be 4.5 percent of GDP in any given year and that allocations for health and
education would double as a percentage of GDP over the next 10 years ending in FY 2013. The
targets for key macroeconomic aggregates presented in the Framework are the broad direction over
the medium term and are indicative; they are not intended to preempt any future adjustments that
may be required to achieve the desired targets. As a consequence of the divergent movements in
revenues and expenditures, public debt is
64
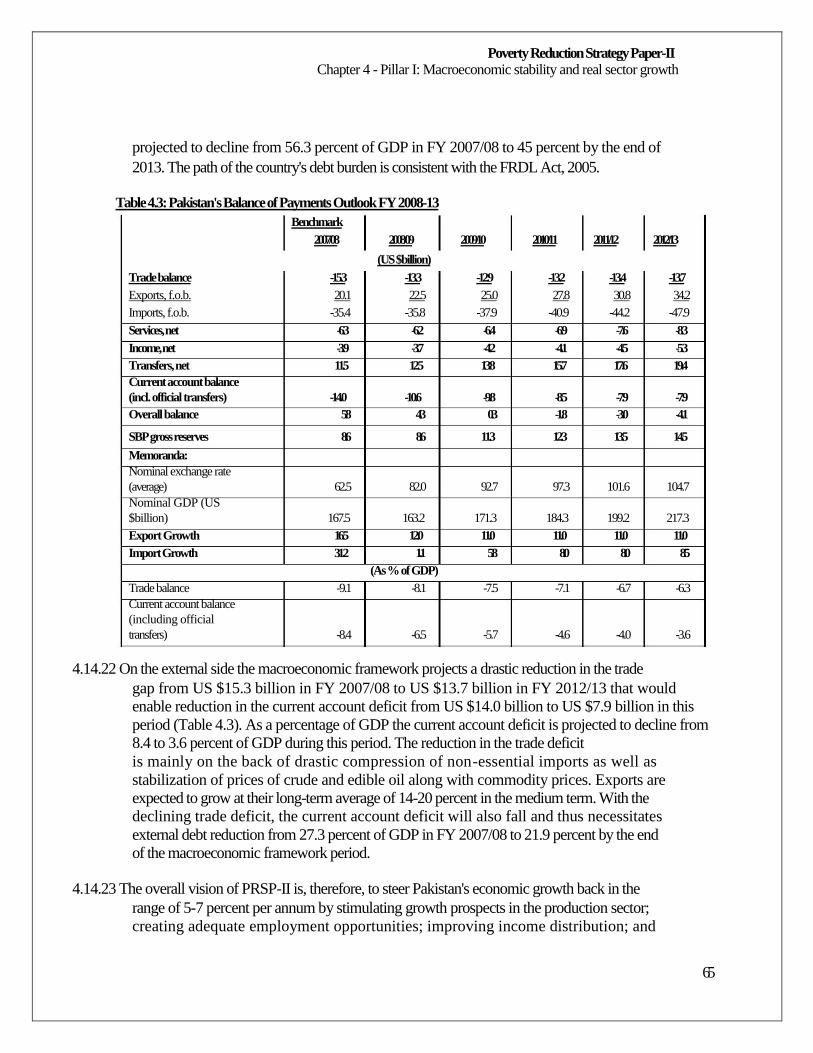
Poverty Reduction Strategy Paper-II Chapter 4 - Pillar I: Macroeconomic stability and real sector growth
projected to decline from 56.3 percent of GDP in FY 2007/08 to 45 percent by the end of
2013. The path of the country's debt burden is consistent with the FRDL Act, 2005.
Table 4.3: Pakistan's Balance of Payments Outlook FY 2008-13
Benchmark
2007/08 2008/09 2009/10 2010/11 2011/12 2012/13
(US $billion) Trade balance -15.3 -13.3 -12.9 -13.2 -13.4 -13.7 Exports, f.o.b. 20.1 22.5 25.0 27.8 30.8 34.2 Imports, f.o.b. -35.4 -35.8 -37.9 -40.9 -44.2 -47.9 Services, net -6.3 -6.2 -6.4 -6.9 -7.6 -8.3 Income, net -3.9 -3.7 -4.2 -4.1 -4.5 -5.3 Transfers, net 11.5 12.5 13.8 15.7 17.6 19.4 Current account balance (incl. official transfers) -14.0 -10.6 -9.8 -8.5 -7.9 -7.9 Overall balance 5.8 4.3 0.3 -1.8 -3.0 -4.1
SBP gross reserves 8.6 8.6 11.3 12.3 13.5 14.5
Memoranda: Nominal exchange rate (average) 62.5 82.0 92.7 97.3 101.6 104.7 Nominal GDP (US $billion) 167.5 163.2 171.3 184.3 199.2 217.3 Export Growth 16.5 12.0 11.0 11.0 11.0 11.0 Import Growth 31.2 1.1 5.8 8.0 8.0 8.5
(As % of GDP) Trade balance -9.1 -8.1 -7.5 -7.1 -6.7 -6.3 Current account balance (including official transfers) -8.4 -6.5 -5.7 -4.6 -4.0 -3.6
4.14.22 On the external side the macroeconomic framework projects a drastic reduction in the trade
gap from US $15.3 billion in FY 2007/08 to US $13.7 billion in FY 2012/13 that would
enable reduction in the current account deficit from US $14.0 billion to US $7.9 billion in this
period (Table 4.3). As a percentage of GDP the current account deficit is projected to decline from
8.4 to 3.6 percent of GDP during this period. The reduction in the trade deficit
is mainly on the back of drastic compression of non-essential imports as well as
stabilization of prices of crude and edible oil along with commodity prices. Exports are
expected to grow at their long-term average of 14-20 percent in the medium term. With the
declining trade deficit, the current account deficit will also fall and thus necessitates
external debt reduction from 27.3 percent of GDP in FY 2007/08 to 21.9 percent by the end
of the macroeconomic framework period.
4.14.23 The overall vision of PRSP-II is, therefore, to steer Pakistan's economic growth back in the
range of 5-7 percent per annum by stimulating growth prospects in the production sector;
creating adequate employment opportunities; improving income distribution; and
65
Poverty Reduction Strategy Paper-II Chapter 4 - Pillar I: Macroeconomic stability and real sector growth
harnessing the country's economic competitiveness through economic liberalization,
deregulation and transparent privatization.
4.14.24 The most crucial part of the Poverty Reduction Strategy is to regain macroeconomic
stability and establish an enabling environment for investment. The risk to macroeconomic stability
emanates from the security situation and from the turmoil in the world economy. The structural
reforms to be implemented in Pakistan during the next five years should
make higher domestic savings and investment a permanent feature. To ensure that
macroeconomic problems do not impede the pace of job creation and poverty reduction
efforts, the government will continue to review fiscal, monetary and exchange rate policies to
harmonize them with stabilization goal. The country's growth prospects would be further
enhanced by a more externally driven growth process, and by an acceleration of structural reforms
to further improve productivity and investment climate. In this light, the PRSP-II will also endeavour
to make growth more inclusive and with a human face, which is essential for improving the life of
the common man. The PRSP-II will revolve around
this macroeconomic framework.
66
Poverty Reduction Strategy Paper-II Chapter 5 - Pillar II: Protecting the Poor and the Vulnerable
Chapter 5 - Pillar II: Protecting the Poor and the Vulnerable
5.1
5.2
Assisting the poor and vulnerable is the key objective of a Poverty Reduction Strategy. Broadly speaking, Pakistan's Strategy intends to achieve its objectives in three ways. First, it seeks to
create productive employment by expanding the demand for labour through a rapid growth of GDP.
Second, it concentrates on the development of the country's human
resources so that the largest possible number can participate in and benefit from the
enlarged job offerings. However, third, the strategy recognizes that despite best efforts there will
always be sections of the population that require additional support. A humane society will try to
ensure that special measures are devised to deal with the problems of the disadvantaged. A particular
urgency to expand existing programmes and to institute new measures has been provided by the
rapid escalation in food prices in FY 2007/08, which is likely to have pushed significant numbers
below the poverty line. Special measures are also
required to deal with the results of natural disasters — such as earthquakes, floods,
prolonged drought — which Pakistan has suffered in recent years.
Other chapters in this report deal with the first two elements of the poverty reduction
strategy. This chapter takes up the third element, namely, the strategies and methods of providing
special protection. It should, of course, be understood that the chapter covers only the most significant policies that inform the strategy and the institutions that will implement it. It must
also be remembered that a considerable amount of social support is provided by private
philanthropies, and the description of these is beyond the scope of this
paper.
5.3 The social protection network
5.3.1 Over the years, a substantial safety net of direct and indirect social protection mechanisms
has evolved. The direct provisions include direct transfers such as Zakat and the Pakistan Bait-ul-
Mal (PBM); employment-based guarantees of income such as by the Employees'
Old Age Benefit Institution (EOBI), the Workers Welfare Fund (WWF); and provincial
social security benefits. Indirect provisions include subsidies on electricity, price of flour, other
food items and housing. In addition, there are special programmes to construct elements of the
infrastructure using labour-intensive methods, which both generates
income for the poor and increases the productive capacity of the country by adding to its
capital stock.
5.3.2 Between FY 2002/03 and FY 2007/08 the total expenditure on non-budgetary/social safety
programmes, directly targeting the poorest and the most vulnerable segments of the society increased
from Rs 16 billion in FY 2002/03 to Rs 62 billion in FY 2007/08, and the amount
projected to be spent on these programmes 32
FY 2008/09 is more than Rs 148.6 billion31 in
(about 1.1 percent of GDP and 3.74 percent of total budgetary expenditures for this year)
31 The projected amount excludes Microfinance and two components of Zakat 32 "Includes Pakistan Bait-ul-Mal, Benazir Income Support Programme, Punjab Food Support Scheme, People's Works
Programme only.
67
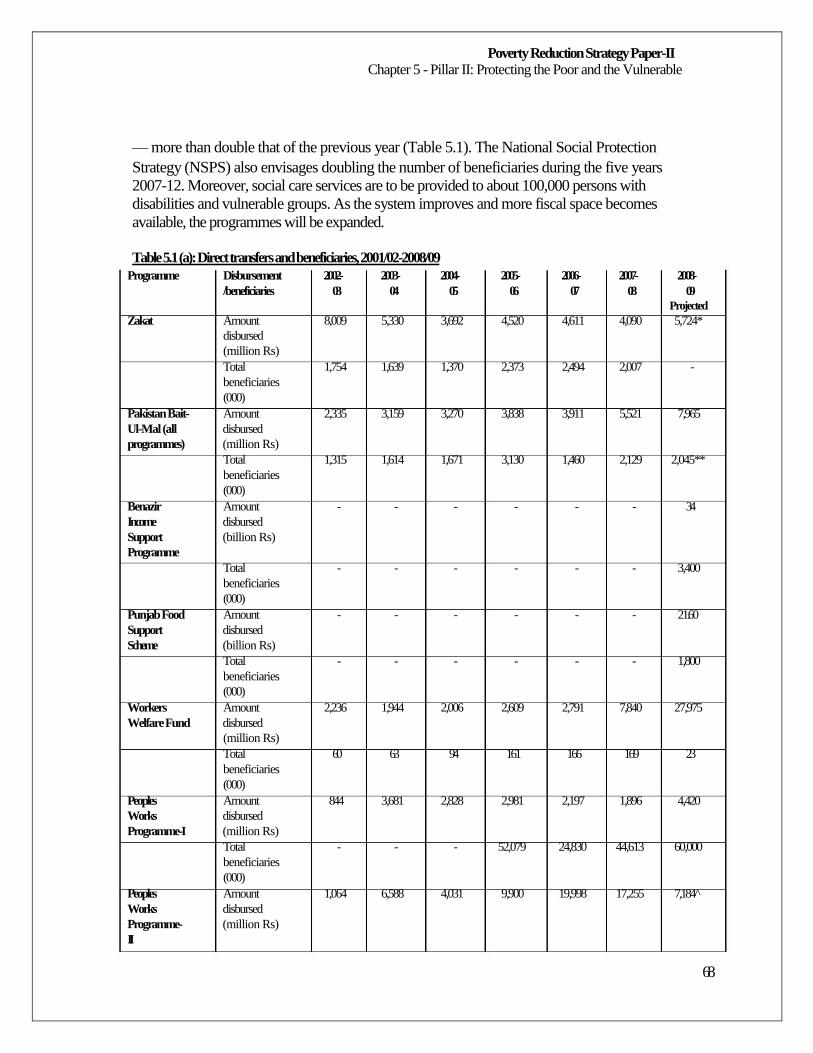
Poverty Reduction Strategy Paper-II Chapter 5 - Pillar II: Protecting the Poor and the Vulnerable
— more than double that of the previous year (Table 5.1). The National Social Protection
Strategy (NSPS) also envisages doubling the number of beneficiaries during the five years
2007-12. Moreover, social care services are to be provided to about 100,000 persons with
disabilities and vulnerable groups. As the system improves and more fiscal space becomes
available, the programmes will be expanded.
Table 5.1 (a): Direct transfers and beneficiaries, 2001/02-2008/09
Programme Disbursement 2002- 2003- 2004- 2005- 2006- 2007- 2008- /beneficiaries 03 04 05 06 07 08 09
Projected Zakat Amount 8,009 5,330 3,692 4,520 4,611 4,090 5,724*
disbursed (million Rs) Total 1,754 1,639 1,370 2,373 2,494 2,007 - beneficiaries (000)
Pakistan Bait- Amount 2,335 3,159 3,270 3,838 3,911 5,521 7,965 Ul-Mal (all disbursed programmes) (million Rs)
Total 1,315 1,614 1,671 3,130 1,460 2,129 2,045** beneficiaries (000)
Benazir Amount - - - - - - 34 Income disbursed Support (billion Rs) Programme
Total - - - - - - 3,400 beneficiaries (000)
Punjab Food Amount - - - - - - 2 1 .6 0 Support disbursed Scheme (billion Rs)
Total - - - - - - 1,800 beneficiaries (000)
Workers Amount 2,236 1,944 2,006 2,609 2,791 7,840 27,975 Welfare Fund disbursed
(million Rs) Total 60 63 94 161 166 169 23 beneficiaries (000)
Peoples Amount 844 3,681 2,828 2,981 2,197 1,896 4,420 Works disbursed Programme-I (million Rs)
Total - - - 52,079 24,830 44,613 60,000 beneficiaries (000)
Peoples Amount 1,064 6,588 4,031 9,900 19,998 17,255 7,184 Works disbursed Programme- (million Rs) II
68
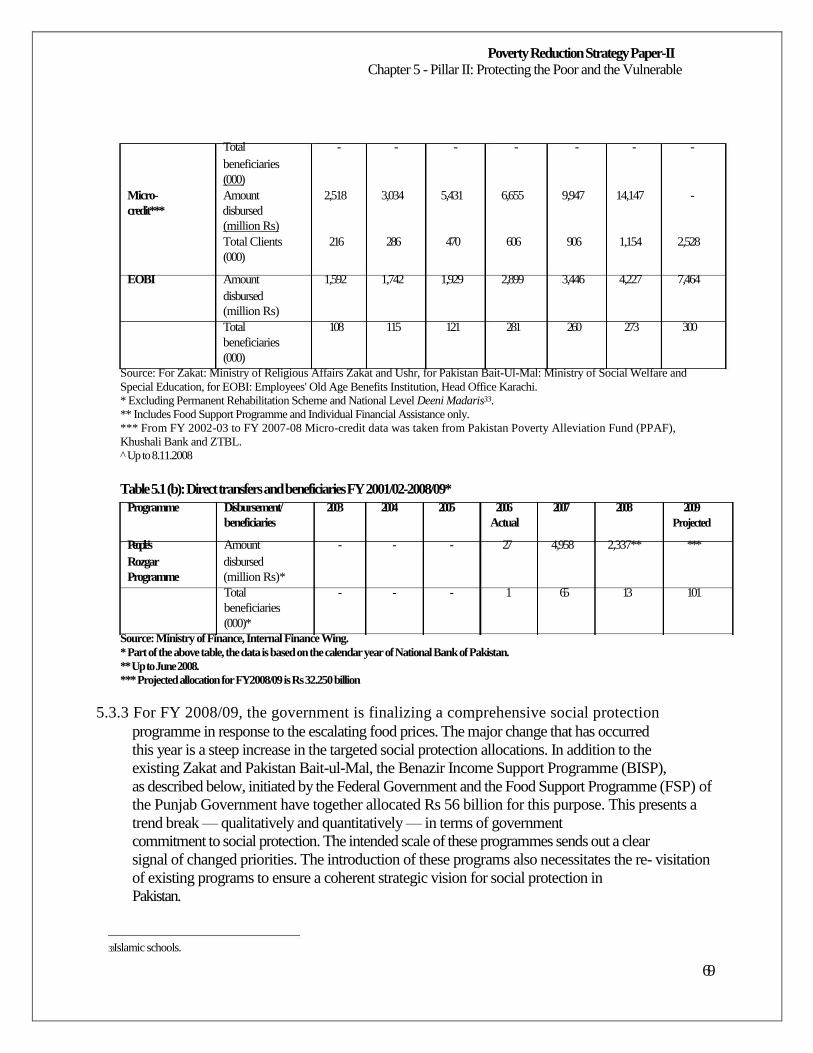
Poverty Reduction Strategy Paper-II Chapter 5 - Pillar II: Protecting the Poor and the Vulnerable
Total - - - - - - - beneficiaries (000)
Micro- Amount 2,518 3,034 5,431 6,655 9,947 14,147 - credit*** disbursed
(million Rs) Total Clients 216 286 470 606 906 1,154 2,528 (000)
EOBI Amount 1,592 1,742 1,929 2,899 3,446 4,227 7,464 disbursed (million Rs) Total 108 115 121 281 260 273 300 beneficiaries (000)
Source: For Zakat: Ministry of Religious Affairs Zakat and Ushr, for Pakistan Bait-Ul-Mal: Ministry of Social Welfare and Special Education, for EOBI: Employees' Old Age Benefits Institution, Head Office Karachi. * Excluding Permanent Rehabilitation Scheme and National Level Deeni Madaris33. ** Includes Food Support Programme and Individual Financial Assistance only. *** From FY 2002-03 to FY 2007-08 Micro-credit data was taken from Pakistan Poverty Alleviation Fund (PPAF), Khushali Bank and ZTBL. Up to 8.11.2008
Table 5.1 (b): Direct transfers and beneficiaries FY 2001/02-2008/09*
Programme Disbursement/ 2003 2004 2005 2006 2007 2008 2009 beneficiaries Actual Projected
People's Amount - - - 27 4,958 2,337** *** Rozgar disbursed Programme (million Rs)*
Total - - - 1 65 13 101 beneficiaries (000)*
Source: Ministry of Finance, Internal Finance Wing. * Part of the above table, the data is based on the calendar year of National Bank of Pakistan. ** Up to June 2008. *** Projected allocation for FY2008/09 is Rs 32.250 billion
5.3.3 For FY 2008/09, the government is finalizing a comprehensive social protection
programme in response to the escalating food prices. The major change that has occurred
this year is a steep increase in the targeted social protection allocations. In addition to the
existing Zakat and Pakistan Bait-ul-Mal, the Benazir Income Support Programme (BISP),
as described below, initiated by the Federal Government and the Food Support Programme (FSP) of
the Punjab Government have together allocated Rs 56 billion for this purpose. This presents a
trend break — qualitatively and quantitatively — in terms of government
commitment to social protection. The intended scale of these programmes sends out a clear
signal of changed priorities. The introduction of these programs also necessitates the re- visitation
of existing programs to ensure a coherent strategic vision for social protection in
Pakistan.
33 Islamic schools.
69
Poverty Reduction Strategy Paper-II Chapter 5 - Pillar II: Protecting the Poor and the Vulnerable
5.4 Pakistan's social protection net
5.4.1 Pakistan's safety net developed largely as a series of adhoc responses to problems thrown
up by particular circumstances. It is, therefore, not surprising that it contains duplicating and
overlapping programmes. Moreover, since it has grown up over a considerable number
of years, combines the interests of many different constituencies, and incorporates several
institutions, it would be unrealistic to expect that the different elements could be merged
into a seamless entity in a short period.
5.4.2 The intention, however, is to start working towards an overall social protection strategy
that is both efficient and well-targeted, and minimize duplication and overlaps of
programmes. It is also intended to make poverty interventions more gender-sensitive; the emphasis
in developing future programmes is to ensure that they do not neglect but
empower women. The ultimate aim of the government is to strengthen the safety net
programs through better targeting and devise programmes that also support graduation
from safety net to income generation and sustainable livelihoods.
5.5 The National Social Protection Strategy
5.5.1 In response to the challenges, a National Social Protection Strategy (NSPS) was drafted,
building on detailed sectoral reviews as well as on inputs provided by all the relevant actors,
both at the federal and provincial levels. The NSPS provides a framework for
addressing poverty alleviation that is consistent with the PRSP, the MTDF, the Vision 2030,
and other strategic documents. The vision for the Social Protection Strategy is to bring the poor
and vulnerable elements of the population and the backward regions into the
mainstream of development, thus reducing existing inequalities.
5.5.2 The Social Protection Strategy complements other strategies and action plans that pertain,
directly or indirectly, to social protection. National policies and action plans already exist for
specific vulnerable groups, for example, persons with disabilities, child labourers,
children at risk of trafficking, bonded labourers, and the most vulnerable in disaster- affected
areas. The NSPS seeks to complement these initiatives and to address poverty and vulnerability
broadly, wherever it exists. It also seeks to coordinate implementation of all
these plans.
5.5.3 One of the main objectives of the strategy is to provide a roadmap for the development of a
minimum social protection package for the poor and vulnerable. For this purpose the
document identifies priority areas for policy action and outlines a broad reform agenda aimed at
improving programme targeting, coverage, implementation and monitoring. These
priority actions are to:
Increase access to economic opportunities among the working and entrepreneurial poor:
Policies and interventions to be considered in this area are: (i) programmes aimed at
employment/income generation (or active labour market programmes) such as
training/skill development for vulnerable groups (disabled, youth drop-outs, and adult
70
Poverty Reduction Strategy Paper-II Chapter 5 - Pillar II: Protecting the Poor and the Vulnerable
workers), microfinance programmes, reduction in constraints to access product
markets, and public works; (ii) support for labour market institutions (e.g. unions,
collective bargaining, minimum wage, social security regulations, severance
programmes) that protect the poor, while ensuring labour market flexibility and
facilitating formal sector growth.
Prevent individuals (poor and nonpoor alike) from falling into poverty from income
shocks. Policies and interventions to be considered in this area are: (i) social security
programmes to help individuals for longevity, and to insure against disability,
sickness/health, or unemployment; (ii) other programmes that provide insurance for the
informal sector, such as micro-insurance, workfare, and social pensions.
Provide basic needs for the chronic poor, and those unable to work. Policies and
interventions to be considered in this area are: (i) social assistance/income support to the poor,
including stipend programmes and conditional cash transfer programmes that provide incentives
for human capital accumulation among the poor; (ii) programmes
that increase access to basic health/nutrition and education services/early childhood
development; and (iii) social welfare services (e.g., community-based rehabilitation,
foster/adoptive care, street children programmes).
5.5.4 Many of these needs are strongly linked and need to be addressed holistically — unless
health services are improved, the incidence of ill health will continue to rise; unless
educational retention is improved, children will never be able to exit from poverty because they will
be concentrated in low-return employment or remain unemployable. It is, therefore,
important to address primary needs via social protection, while simultaneously focusing on the
mechanisms that ensure that the exit from absolute poverty is permanent
for the majority of the vulnerable and a large proportion of the chronically poor.
5.6 The strategy
5.6.1 In discussing a strategy for social protection, it is more relevant to examine the issues that
such a strategy aims to address than to catalogue the different institutions that implement
the strategy. Since it is now widely recognized that poverty is a multifaceted state,
comprising not only low incomes but also the absence of capabilities that enable a person to lead
the sort of life of life that he or she values, Pakistan's poverty reduction strategy encompasses a
number of different aspects. Within the overall strategy, efforts to provide special protection to the
vulnerable are directed to five key elements: (1) income support; (2) nutrition support; (3) human
resource development; (4) natural disaster management;
and (5) facilitating the role of the non-government and private sector.
5.6.2 (1) Income support
5.6.2.1 The strategy envisages three main avenues for supporting the income of the indigent: (a)
direct income transfers; (b) pensions and similar social benefits; and (c) programmes to
boost employment. Each of these measures is supported by one or more institutions.
71
Poverty Reduction Strategy Paper-II Chapter 5 - Pillar II: Protecting the Poor and the Vulnerable
5.6.2.2 (a) Direct income transfers
5.6.2.3 Four institutions comprise the major agents for direct income transfers: Zakat; the Pakistan
Bait-ul-Mal (PBM); the Benazir Income Support Programme (BISP); and the Punjab Food
Support Scheme.
5.6.2.4 Zakat: The institution of Zakat plays a significant role in mitigating the sufferings of the
poor segment of the society, and derives from the injunction to Muslims to donate one-
fortieth of their wealth to charity. It is a key instrument for social rehabilitation and reducing
vulnerability to exogenous shocks. About 25 percent of the Zakat budget is given through
institutions while the remaining 75 percent is disbursed directly to individuals
through Local Zakat Committees (LZCs).
5.6.2.4.1 Zakat is disbursed under different programmes, such as: financial assistance (Guzara
Allowance), educational stipends, health care, Eid grant, assistance to leprosy patients,
national level health institutions, and marriage assistance. A total of Rs 4.1 billion was
disbursed among 2 million beneficiaries in FY08.
5.6.2.4.2 In order to overcome tendency of permanent reliance on Zakat, rehabilitation schemes and
technical education stipends have been introduced to support the move towards self- reliance.
For example, under the Permanent Rehabilitation programme, grants of Rs10,000-50,000
for starting a small business are provided. According to a Gallup Survey,
the first phase had a success rate of more than 90 percent.
5.6.2.4.3 Technical educational stipends have also helped increase the capacity of the poor.
Reportedly, 88 percent of the beneficiaries of this scheme get employment or are engaged
in self-employment.
5.6.2.4.4 The Zakat system is being computerized which will help ensure better control, monitoring
and reformation of both collection and distribution systems of Zakat. Objectivity has been assured
by subjecting families to a computer-based verification process. This process has
been entrusted to NADRA, which will apply software to screen out those not eligible
according to the specified criteria, and will transmit the final list of recipients electronically to
Pakistan Post. Work is under way to develop a 'smart card' system that will ultimately become the
medium for disbursement for the programme as well as for other supports that
the government is contemplating to launch in due course.
5.6.2.4.5 An internal monitoring mechanism is being put in place to verify actual delivery of exact
amount to the designated families. A proposal is under consideration to place the list of
recipients on the website to enable instant, round-the-clock Independent Third Party
Validation to verify that the families receiving the payouts do fulfill the specified criteria.
5.6.2.5 The Pakistan Bait-ul-Mal (PBM): The Pakistan Bait-ul-Mal has made a significant
contribution towards poverty reduction by providing assistance to destitute widows, orphans,
invalids, the infirm and other needy persons. The PBM disburses to the needy
72
Poverty Reduction Strategy Paper-II Chapter 5 - Pillar II: Protecting the Poor and the Vulnerable
under a wide variety of programmes that encompass food support, child support,
rehabilitation of child labour, vocational training, support to medical centres, and others. The
PBM, which disbursed Rs 6 million to 25,000 beneficiaries in its initial year of existence
(1992), disbursed Rs 5.52 billion in 2007/08 to around 2 million households, with
an increase of only 3.5 percent in administrative cost.
5.6.2.5.1 The Pakistan Bait-ul-Mal has taken important steps towards better targeting, administration
and management.
It has a Monitoring and Evaluation Wing, which carries on the spot visits to the
different districts throughout the year. The organization has developed a computerized Food
Support Programme Management System (FSPMS) which ensures efficient and transparent
delivery of the subsidy. Pakistan Post also monitors the programme through
its Vigilance Cell.
Similarly, the PBM's Child Support Programme (CSP) is monitored monthly and
quarterly to ensure that inputs are being delivered and work schedules are complied with.
The follow-up and monitoring mechanism help in preparing monthly reports
containing information on quantitative and qualitative efficacy of the programme. The World
Bank is also providing technical assistance to PBM on strengthening of the
monitoring and evaluation system for cash transfers.
The PBM has assigned the task of impact evaluation of the CSP to Gallup Pakistan.
The impact of the programme will be evaluated in the current financial year. If the
evaluation shows a successful operation, it will be scaled up in a phased way during the
period of the PRSP-II.
The PBM has developed a database of its beneficiaries that is the only available
computerized information of people living below poverty line. This information can
also be helpful for formulating other Poverty Alleviation Programmes. The network has
been expanded to all the districts.
5.6.2.5.2 A review of existing safety net programmes indicates that the vehicle with the highest
potential for scaling up is the PBM. During the PRSP-II period, steps will be taken to: (i)
enhance the rate of subsidy and coverage; (ii) build on existing PBM programmes to improve
design, selection, poverty targeting and coverage; (iii) institute formal, systematic procedures for
the review of entitlements and the exit of beneficiaries from the programmes; and (iv)
reduce leakages and improve targeting in Zakat programmes, particularly in rural areas.
Obviously, given the recent launch of the Benazir Income Support Programme (BISP), all these
plans will need to be carefully vetted and coordinated
with the BISP plans to avoid duplication and overlap.
5.6.2.6 The Benazir Income Support Programme (BISP): The government is conscious of the
cost being imposed on poor families from the sharp escalation in food prices. The
73
Poverty Reduction Strategy Paper-II Chapter 5 - Pillar II: Protecting the Poor and the Vulnerable
government is committed to a policy that combines macroeconomic stability and the
stability of family budgets. An important new programme is the Benazir Income Support
Programme (BISP), whose objective is to provide cash grants to the poorest families in the
country.
5.6.2.6.1 The programme has been allocated Rs 34 billion for the fiscal year 2008/09. It is the third
largest allocation in the current budget, constitutes 0.25 percent of GDP, and will cover up to 12-14
percent of the population in low income brackets in the entire country, including FATA, Northern
Areas and Azad Jammu Kashmir. Special attention has been accorded to
remote areas, including those in Balochistan, Chitral, North and South Waziristan,
Kohistan and Tharparkar. The next year's budget for BISP is expected to be expanded to
Rs 84 billion and intends to increase coverage to 7 million families.
5.6.2.6.2 The BISP is intended to compensate economically vulnerable families for the erosion of
their purchasing power. A multipurpose survey is being planned to ensure that the
disbursement goes to the right person; to check the impact of the assistance on the lives of poor by the
change in their nutritional intake; and to test the impact on the intra-family distribution of
resources. Its unique feature is that the payment will be made only to the female head of the
family. Impact on female empowerment is likely to be decisive, particularly in the context of
social development. The payout is not claimed to be able to remove a family's poverty, but it should
certainly serve to protect its nutritional intake to a
large extent.
5.6.2.6.3 The programme will disburse Rs 2000 every alternate month to around 3.4 million
families, at least for the remainder of the fiscal year 2008/09, that have a monthly income of less
than Rs 6000. The impact could be quite significant. For families earning, say Rs
5000 per month, a payout of Rs 1000 will amount to a 20 percent increase in their current
purchasing power. Families in low income brackets spend between 50-70 percent of their income
on food. At current flour prices, Rs 1000 a month amount will be sufficient to
finance 20-25 days of flour needs for a 5-6 member family.
5.6.2.6.4 At present, the BISP uses a combination of two methods for targeting. Beneficiaries must
apply through forms distributed by local MNAs. Forms require applicants to provide
information on a number of socio-economic characteristics, such as income, employment, formal
sector employment/pensions, disability, asset ownership, and household members abroad, etc.
which match the targeting criteria for the scheme. This information is verified
by the nominator and by the information held for or provided by the applicant to the
NADRA.
5.6.2.6.5 Selected beneficiaries must possess a NADRA National Identity Card, which will be
provided free of cost and expeditiously in case a beneficiary does not possess a card. Plans
are underway to incorporate a question in the forthcoming survey that will provide
information on the economic status of each household, through which a clear picture of the intended
beneficiaries can be seen. If all of the BISP beneficiaries are amongst the poor,
74
Poverty Reduction Strategy Paper-II Chapter 5 - Pillar II: Protecting the Poor and the Vulnerable
the scheme will cover around 6 percent of the national population, and upto a quarter of
those below the poverty line.
5.6.2.6.6 All members of Parliament have been provided equal opportunity to recommend deserving
families, based on specified criteria. A serious attempt has been made to ensure maximum
objectivity and transparency in the programme by separating the programme management,
recipient selection, verification, and disbursement processes.
5.6.2.6.7 However, the government is aware that despite the safeguards, there is still the possibility
of funds being misdirected. The authorities recognize that the design of the programme and
measures for its implementation need to be monitored and strengthened and are working on ways to
improve the current system to ensure that the poor are not excluded from the programme. They
intend to further refine the design by switching to an objective and transparent targeting tool
(such as the well-tested 'Poverty Scorecard'). With the new targeting tool rolled out/launched in
December 2008; the scorecard will be the way the
poor and vulnerable are identified in the country for the purpose of social protection.
5.6.2.7 Punjab Food Support Scheme (PFSS): The Punjab Food Support Scheme (PFSS) is a
provincial programme, also initiated in 2008. It was originally designed to provide food stamps
for the poorest households, but has now been converted to a cash grant of Rs 1000 per household per
month. In this sense it is exactly like the BISP, except run for the Punjab
Province. The targeting relies on local government officials (district and union councils)
and political appointees to propose an initial list of beneficiaries. The subsidy is aimed at:
Households that do not have a bread-earner;
Widows, orphans, and the destitute;
Chronically sick and/or disabled persons;
Elderly persons who have been abandoned by their family;
The poorest of the poor segments of the society with marginal income.
5.6.2.7.1 The scheme covers both rural and urban areas, with a total estimated subsidy of Rs 21.6
billion for 1.8 million families. The first two phases of the scheme have covered about 1
million beneficiaries.
5.6.2.7.2 The programme is being monitored in three ways: A strong database has been developed
by the Punjab Government to distinguish between various categories of beneficiaries
included in the scheme. The Pakistan Post Office has monitoring teams to ensure the
transparency in the disbursement process, plus district monitoring teams set up by the DCOs
provide a further check on implementation. Finally, an audit will be conducted by a
firm of good repute in accordance with international standards.
5.6.2.7.3 The government recognizes that targeted subsidies of all kinds, especially for food, are
more efficient than universal subsidies. However, while it is the government's intention to
move in this direction, a prior condition is that the targeting mechanism be improved. In
75
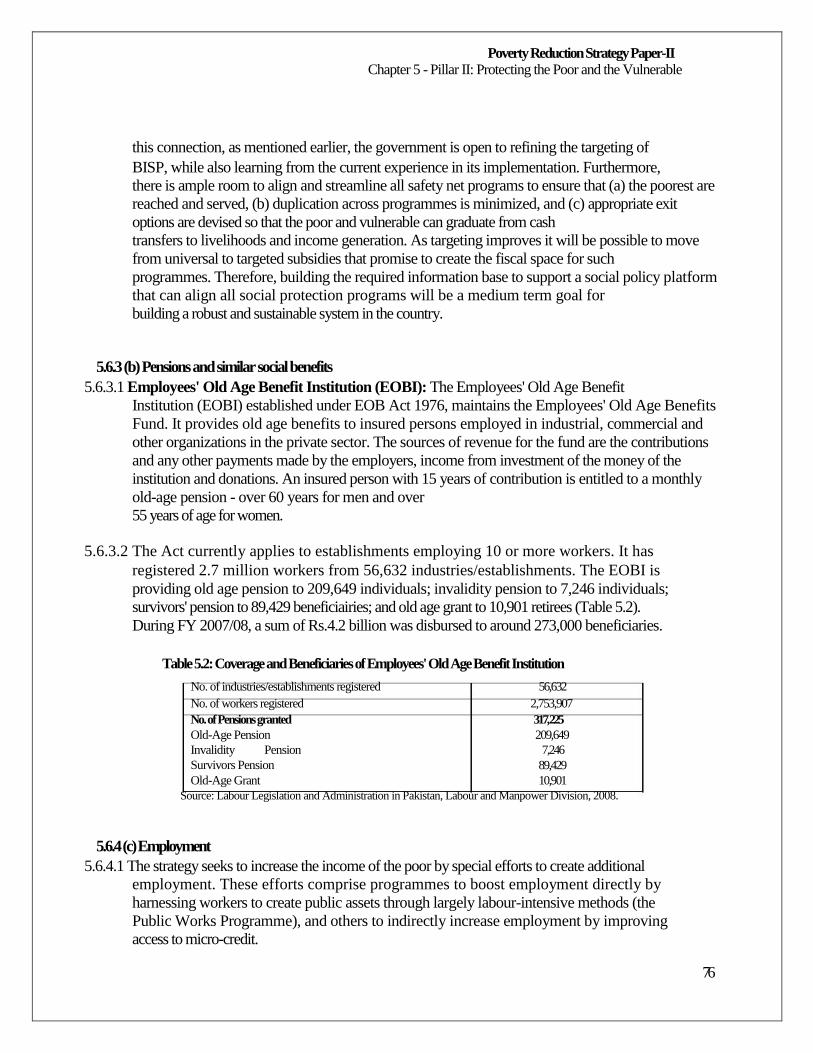
Poverty Reduction Strategy Paper-II Chapter 5 - Pillar II: Protecting the Poor and the Vulnerable
this connection, as mentioned earlier, the government is open to refining the targeting of
BISP, while also learning from the current experience in its implementation. Furthermore,
there is ample room to align and streamline all safety net programs to ensure that (a) the poorest are
reached and served, (b) duplication across programmes is minimized, and (c) appropriate exit
options are devised so that the poor and vulnerable can graduate from cash
transfers to livelihoods and income generation. As targeting improves it will be possible to move
from universal to targeted subsidies that promise to create the fiscal space for such
programmes. Therefore, building the required information base to support a social policy platform
that can align all social protection programs will be a medium term goal for
building a robust and sustainable system in the country.
5.6.3 (b) Pensions and similar social benefits
5.6.3.1 Employees' Old Age Benefit Institution (EOBI): The Employees' Old Age Benefit
Institution (EOBI) established under EOB Act 1976, maintains the Employees' Old Age Benefits
Fund. It provides old age benefits to insured persons employed in industrial, commercial and
other organizations in the private sector. The sources of revenue for the fund are the contributions
and any other payments made by the employers, income from investment of the money of the
institution and donations. An insured person with 15 years of contribution is entitled to a monthly
old-age pension - over 60 years for men and over
55 years of age for women.
5.6.3.2 The Act currently applies to establishments employing 10 or more workers. It has
registered 2.7 million workers from 56,632 industries/establishments. The EOBI is
providing old age pension to 209,649 individuals; invalidity pension to 7,246 individuals;
survivors' pension to 89,429 beneficiairies; and old age grant to 10,901 retirees (Table 5.2).
During FY 2007/08, a sum of Rs.4.2 billion was disbursed to around 273,000 beneficiaries.
Table 5.2: Coverage and Beneficiaries of Employees' Old Age Benefit Institution
No. of industries/establishments registered No. of workers registered No. of Pensions granted Old-Age Pension Invalidity Pension
Survivors Pension Old-Age Grant
56,632 2,753,907 317, 225 209,649
7,246 89,429 10,901
Source: Labour Legislation and Administration in Pakistan, Labour and Manpower Division, 2008.
5.6.4 (c) Employment
5.6.4.1 The strategy seeks to increase the income of the poor by special efforts to create additional
employment. These efforts comprise programmes to boost employment directly by
harnessing workers to create public assets through largely labour-intensive methods (the
Public Works Programme), and others to indirectly increase employment by improving
access to micro-credit.
76
Poverty Reduction Strategy Paper-II Chapter 5 - Pillar II: Protecting the Poor and the Vulnerable
5.6.4.2 Public Works Programme: The government has revived the People's Works Programme
(PWP) of small development schemes that would cover such basic areas as: provision of
electricity, gas, farm to market roads, and water supply. The programme would serve the
dual purpose of providing employment and improving infrastructure.
5.6.4.2.1
The Ministry of Local Government and Rural Development coordinates the
implementation of the PWP-I, for which Rs 4420 million were provided in the Public
Sector Development Programme (PSDP) for FY 2008/09. The PWP-II is a special
programme launched by Prime Minister's Secretariat for funding development schemes. The
programme supplements the government's development efforts by executing small schemes in
roads, electricity, education, health, water supply, sanitation, and other fields. These projects are
identified by local communities according to their needs. During FY 2008/09, an amount of
Rs 22 billion has been allocated under PWP-II. Year-wise
expenditures under this programme from FY 2002/03 to FY 2008/09 are given in Table 5.1
(a).
5.6.4.2.2 During FY 2006/07, 3590 schemes costing Rs 2197 million under PWP-I were funded, out
of which, 2729 schemes have been completed. Similarly, during FY 2007/08, 2021 schemes
were funded, costing Rs 18967 million, out of which 878 have been completed.
Projects in electrification and roads accounted for about three-quarters of the funds, and these will
remain the priority sectors, followed by drinking water supply, during the period
of the PRSP-II.
5.6.4.3 Microfinance: The microfinance industry grew at over 40 percent a year during the period
of the PRSP-I. By March 2008, the sector had reached more than 1.7 million savers, and had a
clientele of almost 1.6 million borrowers, of which nearly half were female. The
provision of these loans to businesses and individuals for economic purposes helped to create
additional employment in different parts of the country — microfinance service
providers are present in 105 districts, including some of the most far-flung, such as FATA.
5.6.4.3.1 Six specialized microfinance banks currently provide microfinance services, with a major
share of their advances going to the livestock sector, followed by micro-enterprises and
agricultural inputs. Several NGOs also provide microfinance services to marginalized
communities. The sector continues to grow rapidly and plans to reach 3 million borrowers
by 2010 and 10 million by 2015.
5.6.4.3.2 The private sector is very active in the provision of microfinance. The Pakistan
Microfinance Network (PMN) is a network for organizations engaged in microfinance and is
dedicated to improving the outreach and sustainability of microfinance in the country. It
also aims to establish performance measures, enhance the capacity of retail microfinance
institutions through specialized training, and promoting the financial transparency of such
institutions. The PMN is well-positioned with 95 percent of the total microfinance
coverage and with the 20 leading microfinance institutions and banks as its members.
77
Poverty Reduction Strategy Paper-II Chapter 5 - Pillar II: Protecting the Poor and the Vulnerable
5.6.4.3.3 An important player in this regard is the Pakistan Poverty Alleviation Fund (PPAF) which
has aligned itself with the evolving microfinance landscape in the country. The cumulative
outreach of PPAF has extended to around 85 districts of the country. About 800,000 persons
have been disbursed credit, with a considerable percentage of PPAF loans going exclusively to
women (375,000). Upto September 2008, the PPAF had disbursed a total
amount of Rs 27.5 billion to over 1.7 million borrowers.
5.6.4.3.4 The PPAF also helps to deal with special problems. Thus, in the wake of the October 8,
2005 earthquake, an amount of Rs 300 million was diverted from PPAF's existing
programme to the relief effort. During the rehabilitation and reconstruction phase, the
PPAF was assigned responsibility of 34 union councils in AJK and NWFP by the
Earthquake Reconstruction and Rehabilitation Authority. As of September 2008, an
amount of Rs 14.6 billion had been disbursed for housing reconstruction; Rs 404 million
for rehabilitation of infrastructure, and Rs 392 million for reconstruction of education and
health facilities.
5.6.4.3.5 Another important player is the People's Rozgar Programme (PRP). Creation of self-
employment opportunities has to form part of any programme for employment generation. For this
purpose, the government has made arrangements for the unemployed to have
access to credit to enable them to start a useful business.
5.6.4.3.6 The Government of Pakistan has extended its support to the scheme in the form of interest
rate subsidy (6 percent), credit loss sharing (up to the first 10 percent of total credit loss),
life/disability insurance, and other means. The National Bank of Pakistan has disbursed an amount
of Rs 6.059 billion in 42,382 cases up to June, 2008 under the Scheme.
Microfinance is discussed further in chapter 11 on the financial system.
5.6.5 (2) Nutrition Support
5.6.5.1 For nutritional support to the poor the strategy relies on three major institutions:
5.6.5.2 Food Support Programme of the Pakistan Bait-ul-Mal: The Food Support Programme
(FSP) of the Pakistan Bait-ul-Mal (PBM) is a social safety net that targets the poorest of the poor in
order to provide relief from the increase in wheat prices that has occurred since August 2000.
Since its inception, the programme has disbursed about Rs 23 billion. The
PBM has taken important steps towards better targeting, administration, and management
and has set up a monitoring and evaluation system which carries on-the-spot visits to different
districts throughout the year. The programme is also monitored through the
Pakistan Post Office.
5.6.5.3 The Punjab Sasti Roti34 Programme: Hunger is an important part of poverty. The
Government of the Punjab has put in place a programme to provide bread at prices that the
34 Cheap bread
78
Poverty Reduction Strategy Paper-II Chapter 5 - Pillar II: Protecting the Poor and the Vulnerable
poor could afford. This requires providing flour to participating breadmakers at subsidized
prices. Out of about 13,000 bread makers surveyed in the Punjab, over 5500 joined the
programme. The government intends to help set up more than 30,000 subsidized bread
making sites.
5.6.5.4 The programme will be monitored right down to the level of tehsils and mohallahs35.
District governments intend to utilize services of Revenue, Cooperative, Health, and Union
Council staff in the monitoring process.
5.6.6 (3) Human Resource Development
5.6.6.1 A number of institutions support the safety net by providing additional programmes for
education and health. The PBM is one such institution, and provides finance to vocational training
centre, hospitals and medical centres in addition to extending scholarships and
stipends to poor students.
5.6.6.2 The Government of Pakistan and the provincial governments are preparing plans to provide
medical insurance of about Rs 15,000-20,000 per year to the poor. The Government of Sindh has
set a target of about 100,000 households to be given health insurance in the first phase. The Sindh
government is also launching a scheme to provide free medical treatment for poor orphans and
widows in all its districts. The Government of the Punjab is preparing
similar projects.
5.6.7 (4) Natural Disaster Management
5.6.7.1 In recent years Pakistan has suffered a series of natural disasters, such as powerful
earthquakes in 2005 and 2008, and major floods in 2007. These calamities killed thousands
and were responsible for destroying the homes, animals, farms, and other assets of hundreds
of thousands. Since Pakistan is situated on major fault lines in the Earth's crust,
the likelihood of similar tragedies in the future remains significant.
5.6.7.2 A reactive emergency response remained the country's predominant way of dealing with
disasters. These events were dealt with mainly under the Calamity Act of 1958, which was
concerned mostly with organizing an emergency response. The country lacked a systematic approach
towards managing the effects of natural disasters. The Government has therefore,
established agencies namely: (a) the Earthquake Reconstruction and Rehabilitation
Authority (ERRA); and (b) the National Disaster Management Authority (NDMA) to
provide relief to the affectees.
5.6.7.3 (a) Earthquake Reconstruction and Rehabilitation Authority (ERRA)
5.6.7.3.1 The ERRA was established on October 24, 2005. The mandate of the ERRA is to plan,
monitor, and regulate reconstruction and rehabilitation in earthquake-affected areas. The
Social Protection Strategy (July 2006-June 2009) formulated a three-year plan of action to
support the most vulnerable groups. The aim of ERRA's Social Protection Strategy is to
35 Sectors.
79
Poverty Reduction Strategy Paper-II Chapter 5 - Pillar II: Protecting the Poor and the Vulnerable
ensure that the vulnerable in the earthquake affected areas are provided basic social
services, livelihood assistance, and support for rehabilitation, primarily within their own families
and communities and to establish linkages with the mainstream social welfare
structures and services.
5.6.7.3.2 The ERRA launched massive rescue and relief operations and has initiated the following
programmes to protect the poor in the earthquake-affected areas.
Livelihood Support Cash Grant Programme (LSCG): LSCG was implemented in all nine affected districts of NWFP and AJK from May 2006 to October 2007. LSCG
was further extended for six months for a total of 22, 2007 most vulnerable families.
Monthly support of Rs 3,000 per month has benefited 267,402 families.
ERRA Rural Landless Programme: The Project has been planned to provide package
of Rs. 250,000 to each verified landless household. The Project is being implemented in two
hases. Phase-I concluded on May 15, 2008 and Phase-II started on July 22, 2008
till March 2009. Total Project cost (Phase I &II) is US $50 million (Rs 3 billion)
funded by USAID as grant and project implementation cost of US $1.72 million is
provided by DFID.
Medical Rehabilitation of Persons with Disabilities: The Project involves:
Institutional strengthening of NIRM (National Institute of Rehabilitation Medicine)
Islamabad and DGQs/THQs at Battagram, Shangla, Bagh, Oghi, Atthmuqam, and
Hattian Bala;
Construction of 50 bed Rehabilitation Centers for persons with disabilities (PWDs)
at Muzaffarabad and Abbottabad; and
Establishment of Community Based Rehabilitation Centers in Muzaffarabad, Bagh
Shangla and Mansehra. Project implementation is underway.
Legal Aid Centres: This project is funded by ADB at the cost of US $512,900 which
aims to provide free legal assistance to vulnerable groups in the earthquake affected areas.
Under this project 18 Legal Aid Centres have been established at Tehsil level providing
assistance in the cases related to documentation, administration and courts. Till November,
2008 26,321 cases have been received out of which 20,519 cases have
been resolved and 5,802 cases are pending at various stages.
Targeted Vulnerability Survey (TVS): ERRA has conducted "Targeted Vulnerability
Survey" with a total cost of Rs. 40.237 million to identify the vulnerable population in
earthquake-affected areas of the NWFP & AJK. Affecters have been categorized
according to their basic socio-economic demographic details into four vulnerable
groups i.e. Orphans, Female Headed Households, Persons with Disabilities and the
Elderly. In this survey, a total of 459,467 individuals and households were identified in
the four categories (NWFP: 247,744 and AJK: 211723).
Social Welfare Complexes (SWCs) and Women Development Centres (WDCs):
ERRA has initiated establishment of SWCs and WDCs in all the nine affected districts
80
Poverty Reduction Strategy Paper-II Chapter 5 - Pillar II: Protecting the Poor and the Vulnerable
of AJK& NWFP with the aim to strengthen Social Welfare Departments and to provide
appropriate services to the vulnerable categories in an efficient and effective manner. SWC
will house District level Social Welfare Offices which will undertake the following
activities: existing SWD managed facilities (Kashana, Dar-ul-Aman, Darulfalah etc);
will provide new initiatives (old people's home, hostel for orphans and vulnerable women,
psychosocial support, legal assistance, child protection services; vocational training
programmes; Special Education; referrals; basic medical care and community re-integration
of the vulnerable groups. The WDCs will offer support and services for women in distress. It
will provide vocational skill development that would create opportunities for sustainable
income through skills enhancement production and marketing of goods; legal aid, psychological
counseling, basic medical care, and short term residential facilities. Total estimated cost of
SWC/WDC projects amount to US $15.607 million. The construction of SWC/WDC
Muzaffarabad would be functional in
the first quarter of 2009.
5.6.7.4 (b) National Disaster Management Authority 5.6.7.4.1 The Government is establishing an appropriate legal, institutional, and policy structures
under a strategy to minimize the vulnerability of the population to natural catastrophes. A Natural
Disaster Management Ordinance (2006) has been promulgated, which provides appropriate
institutional and policy structures. These structures have been created at the
federal, provincial, and district levels. They encompass responsibility for coordinating at
and between these administrative levels; for monitoring hazards and risks within districts,
provinces and regions; for integrating disaster risk management issues into sector
development plans; for implementing policies formulated under the National Disaster
Management Framework (see below); and for setting and ensuring compliance with hazard
and safety standards.
5.6.7.4.2 The strategy for responding to natural disasters has been laid out in the National Disaster
Management Framework. This guides the work of the entire system and has been developed
through wide consultation with stakeholders at the local, provincial, and national levels. A national
plan of action is being developed and will be finalized during the period
of the PRSP-II. This plan will cover the entire spectrum of disaster management, including
mitigation, prevention, preparedness, response, recovery and rehabilitation aspects of disaster
management. Disaster management plans for the provinces have been finalized, as have those for 12
of the most vulnerable districts; plans for the other districts are being formulated and will be
finalized during the PRSP-II period. The Framework will also
include contingency plans for industrial and chemical disasters.
5.6.8 (5) Role of non-government and the private sector
5.6.8.1 The efforts of the government will be supplemented by: (a) NGOs; and (b) elements in the
private sector. The government will work to facilitate the work of these organizations and attempt
to forge partnerships where necessary to ensure that these programmes
complement the government's efforts.
81
Poverty Reduction Strategy Paper-II Chapter 5 - Pillar II: Protecting the Poor and the Vulnerable
5.6.8.2 (a) Rural Support Programmes
5.6.8.2.1 The Rural Support Programmes (RSP) are the largest, non-government rural development
organizations in Pakistan, working currently with 2 million rural households in 3165 rural union
councils in 95 districts. These households have been mobilized into more than 130,000
Community Organizations; about 77,000 employment creation infrastructure schemes worth
Rs 8.9 billion have been financed; almost one million community members received training in
technical, vocational skills, and leadership; and micro-health insurance has been provided to more
than 960,000 persons. Communities have accessed a cumulative
micro-credit portfolio of Rs 35 billion, benefiting 2 million clients.
5.6.8.2.2 The RSP network has developed a five year, comprehensive Union Council Poverty
Reduction Plan, which proposes to mobilize and identify the poorest households. The plan
complements the objectives of the PRSP-II in the areas of a People's Works Programme,
employment generation, social safety net, vocational training, micro-health insurance, and micro-
finance for the poorest. The critical element of the plan is its methodology to identify the
various bands of the poor, through household-wise poverty ranking, with PRSP
inputs relevant to each band.
5.6.8.2.3 The plan's key component is its poverty targeting through the Grameen Foundation's
Poverty Score Card, a census method of ranking all households in a union council. A
database of ranked 900,000 households has already been created. The plan gives importance
to gender balances, with a parity of 50 percent between men's and women's social mobilization. The
key element of this plan is the institutional mechanism of
grassroots organizations of the poor, through which the proposed plan inputs will be
channelized and managed. The mechanism ensures widespread inclusion and participation,
thus ensuring that the poor retain a voice in decisions that affect their future.
5.6.8.2.4 The PPAF has also commenced implementation of a World Bank (US $75 million)
supported programme that focuses on social mobilization and community empowerment
that concentrates on the 25 poorest districts of the country. This is a part of Pakistan's
Medium Term Development Framework.
5.6.8.3 (b) The private sector and philanthropy
5.6.8.3.1 The government of an emerging country, such as Pakistan, does not have the resources to
develop an adequate safety net on its own. Fortunately, the country possesses a lively
tradition of private philanthropy — exemplified by organizations such as the Pakistan
Centre for Philanthropy — that supplements the government's efforts.
5.6.8.3.2 The Pakistan Centre for Philanthropy is an independent, non-profit, support organization. It
was established in August 2001 to lead the promotion of philanthropy in Pakistan. Central to this
promotion, remains the effort of mobilizing resources from the private sector, in
particular the corporate sector for development initiatives. In doing so, the Centre also
82
Poverty Reduction Strategy Paper-II Chapter 5 - Pillar II: Protecting the Poor and the Vulnerable
supplements the government's poverty reduction agenda.36 The Centre does not engage in
direct philanthropy; instead, it seeks to facilitate such efforts of others through support
services.37 Key stakeholders include corporate and individual philanthropists, citizen
organisations, communities and the government.
5.6.8.3.3 The Centre's mission is to increase the volume and effectiveness of philanthropy for social
development in Pakistan. Its long term vision is to link the primary actors in development, i.e. the
government, business, and civil society in a strengthened partnership for increased social
investments. The Centre's objectives and developmental activities of raising broad societal
understanding through communications and advocacy; creating an enabling
environment and influencing public policy through evidence-based research; bridging the
information and credibility gap between grant-makers and grant- seekers; and providing
philanthropy support services through public-private partnerships in education flow out of
its broader vision and mission, which ultimately supplement government's poverty reduction
and development efforts. The Centre has made important contributions to poverty
alleviation through support to the government's education sector reforms, to disaster relief
and management (after the 2005 earthquake, the PCP mobilized over US $1.2 billion
international philanthropy), and by providing inputs into the government's poverty
reduction policies.
5.7 Towards a medium term strategy
5.7.3 The foregoing sections have described the main elements in the social protection strategy
that will be important during the period of the PRSP-II. However, the strategy will be
implemented flexibly with improvements and adaptations introduced as experience is
gathered. This may be particularly likely for new initiatives, such as the BISP, or where
existing programmes are significantly scaled up. In most cases, the effort will be to reduce the
amount of unnecessary overlap and duplication. The process will begin during the
period of the PRSP-II, but reforms will continue beyond the end of the period. The strategy will pay
especial attention to two issues: the need for improved targeting, and the need to
improve coordination between the different levels of government.
5.8 Need for improved targeting
5.8.3 The new social protection programme aims primarily at improving the targeting system, so
that a social platform with a comprehensive database can be created on which all
programmes are built and to which they are aligned. The overall objective is to move
towards a well-integrated social protection system to provide social security to the poor and
vulnerable.
5.8.4 In order to fulfill their mandate, the existing social protection programmes need to
strengthen their targeting to ensure that they efficiently reach the intended beneficiaries. It is
proposed to approach the main short term objective of reaching the poorest by: (i)
36 Please visit: www.pakistan.gov.pk/finance-division/informationandservices/poverty-reduction.html 37 For more information on services offered by PCP, please visit their website: www.pcp.org.pk/services.html
83
Poverty Reduction Strategy Paper-II Chapter 5 - Pillar II: Protecting the Poor and the Vulnerable
keeping the current benefits working and effecting a transition to better and more
comprehensive systems; (ii) introducing new means testing and development of databases
through some pilots across chosen rural and urban areas; (iii) scaling up successful pilots across
the country following assessment and generation of lessons learned; (iv) extension
of the current level of benefits to the target population of the poorest of the poor; (v)
introduction of pilot Conditional Cash Transfer (CCT) programmes; and (vi) scaling up
successful pilots to the whole target population.
5.8.5 The government is currently in the process of (i) revising the NSPS to better reflect the
priorities of the new administration (including the creation of the BISP), and (ii) creating an
institutional structure for the implementation and monitoring of the strategy. A revised strategy,
together with a proposed institutional framework, should be ready by January
2009 and would then be presented for discussion and ratification by the Cabinet.
5.8.6 Given that the creation of the BISP is fully aligned with the priorities identified under the
NSPS, especially in what regards the provision of income support to poor and vulnerable
households, it is not expected that significant changes will be required to the document's
strategic framework. However, more significant revisions will have to be considered to the
institutional arrangements currently governing the sector to reflect the creation of the new
implementation agency.
5.8.7 Although the BISP, Zakat, and PBM share a similar objective of providing basic support to
the poorest households, they have different histories, target groups and financing
methodologies and their coordination and integration will need to be improved. Moreover,
numerous cash, conditional cash and in-kind transfer initiatives flourishing in various areas
of the country need to be integrated.
5.8.8 In terms of the number of beneficiaries, a small fraction of those below the poverty line are
covered. There are some important implications that arise from this comparison. First, the increase
in fiscal commitment to targeted schemes will require more resources. Second, duplication of
beneficiaries between the BISP and FSP must be avoided. The Federal and
Punjab governments will require to coordinate through sharing each others' lists to minimize
this occurrence. Lists of both schemes are likely to be made public so that independent third
party verification can take place. Third, given fiscal constraints, it is not possible for targeted cash
grants to reach all poor individuals or households. This implies that the resources will have to be
rationed amongst the poor. This makes the task of
targeting all the more pressing, and will require transparent and verifiable criteria.
5.8.9 The success and credibility of a targeting system depends on the ability of the state to: (a)
identify the poor/vulnerable in a credible, reliable, transparent and verifiable manner; (b)
reach the target group efficiently and cost-effectively; and (c) maintain the ability to
monitor progress so as to graduate those who do not need help any more and to enroll those
who may have fallen into bad times. Pakistan does not as yet have a comprehensive data base that
identifies each household as poor or non-poor, nor a system of regular and
84
Poverty Reduction Strategy Paper-II Chapter 5 - Pillar II: Protecting the Poor and the Vulnerable
independent verification of recipients (the PBM has had occasional external checks, but
these are not built into the design of the programme). Identifying the poor has been a
problem for all social protection programmes so far. Given this tenuous base of targeted
provisions, the new government has increased allocations and attempted to rectify some of the
arbitrary methods adopted in the schemes. Currently the government is exploring ways to support the
creation of a comprehensive database through a refined poverty scorecard that can help to create a
sound platform for (a) identifying the poor, and (b) aligning its
targeting of cash and other transfer programmes to this single unified database.
5.8.10 Well-implemented social protection reforms are likely to bring significant benefits in
human welfare and in productivity, both in the short and long run. Although each of the
individual initiatives in this proposal can be implemented at its own scale and speed, the overall
package put forward in the strategy is designed so that its parts jointly make a reasonable social
protection system that would result in higher and more stable incomes for
poor and vulnerable households; enhanced food security; a significant increase in school
enrolment, attendance, and completion, and reduction in child labour; reduced rural to
urban migration; and moderately lower income inequality.
5.9 Coordination between federal, provincial and local governments
5.9.3 The foregoing discussion highlights the importance of better coordination between the different executors of a social security system in order to make it efficient and equitable.
This emphasizes the need to clarify the roles of the federal, provincial, and local
governments and to improve coordination between them.
5.9.4 The strategy sets out to provide an effective institutional mechanism. The overall policy
guidance is provided by the Cabinet Committee for Social Sector Coordination (CCSSC), as
social protection is a cross-sectoral initiative. The SSCC will submit an annual report to the
parliament. The day-to-day implementation and coordination will be managed by the concerned
federal, provincial and local governments in consultation with the stakeholders. The main
responsibility for implementation will rest with the provinces, in collabouration with districts,
Bait-ul-Mal, Ministry of Religious Affairs, line departments, NGOs, community groups,
and the private sector. The monitoring will be carried out with national
and provincial data banks as the baseline for information, and through use of information
and communication technology. The evaluation of the programmes will rest with outside
and nongovernmental agencies besides the Planning Commission.
5.9.5 The federal government generally formulates strategies and policies, monitors and
evaluates the implementation of the strategy (including reporting back to elected and other bodies).
The role of the provinces, the districts and tehsil governments will be that of implementation
and, at the lower levels of government, beneficiary identification, local-
level monitoring, and evaluation of specific interventions. Given the number and different types of
stakeholders, well thoughtout, strong institutional coordination at the provincial
level between all stakeholders will be an important feature of the implementation of the
strategy.
85
Poverty Reduction Strategy Paper-II Chapter 5 - Pillar II: Protecting the Poor and the Vulnerable
5.9.6 The provinces will also play a major role in developing and formulating different strategies
and programmes. Some of these programmes are financed and implemented in
collaboration with the federal government while others are undertaken with the cooperation
of development partners. The success of these programmes depends crucially on the targeting
tool used for beneficiary selection, the quality of implementation of the programme, the
disbursement mechanism of the income support (to facilitate auditing and
transparency), well defined entry and exit criteria, and regular monitoring.
86
Poverty Reduction Strategy Paper-II Chapter 6 - Pillar III: Increasing Productivity and Value Addition in Agriculture
Chapter 6 - Pillar III: Increasing Productivity and Value
Addition in Agriculture
6.1
6.2
6.3
6.4
6.5
Being the single largest sector in the economy, agriculture plays an important role in Pakistan's growth and forms the major source of foreign exchange earnings. Over three-
quarters of the Pakistan population are in rural areas and are dependent mainly on
agriculture. About 69.5 percent of the country's labour force belongs to rural areas, out of
which 43.6 percent is employed in the agriculture sector.38
While it is clear that Pakistan is capable of adding significant value to agricultural raw
materials, demographic data show that much of the resources might not be available for
significant value-added processing, because it is needed for direct consumption by the local,
poor population who produce it. As the population grows, local demand for unprocessed
or semi-processed agricultural raw materials will increase, placing price pressure on raw
materials and reducing opportunities for food manufacturing and export. The solution adopted by
the government is to increase productivity in both crops and livestock to ensure an adequate
raw material supply and to combine this with increased value-added in downstream food
processing. The main objectives of agricultural development during the PRSP-II period will
be to ensure food security, improve the quality
of agricultural commodities and achieve productivity of crops.
These objectives are driven by a longer-term strategic vision. The vision of the agriculture
strategy is to raise productivity and profitability of the farming community; to enhance the living
standards of rural masses; to protect the natural resource base by protecting land and water and
countering situations of short water supply or drought; and to ensure food security, especially
for the rural and urban poor. Achieving pro-poor economic growth policy through Public
Private Partnerships in promoting agri-business, trade and
investment will also be part of the core strategy. The need is to innovatively increase
agricultural productivity with improved technologies and appropriate practices which also
ensure environmental sustainability and the health & safety of consumers and produceRs
The current development of agriculture is based on 19th and 20th century models of
development and these models which were built on the natural resource base and
exploitation of natural resources of a country. The fact now is that the previous envisaged
models are no longer tenable because of the increasing depletion of natural resources on the one hand
and the increasing population that have to be fed. The existing system requires a
complete overhaul.
Notwithstanding its declining share in GDP, agriculture is still the single largest economic
sector having contributed 20.9 percent to the GDP during FY 2007/08. Growth
38Board of Investment (BOI) and Ministry of Food, Livestock & Agriculture (MINFAL), Government of Pakistan, FY 2006-07.
87
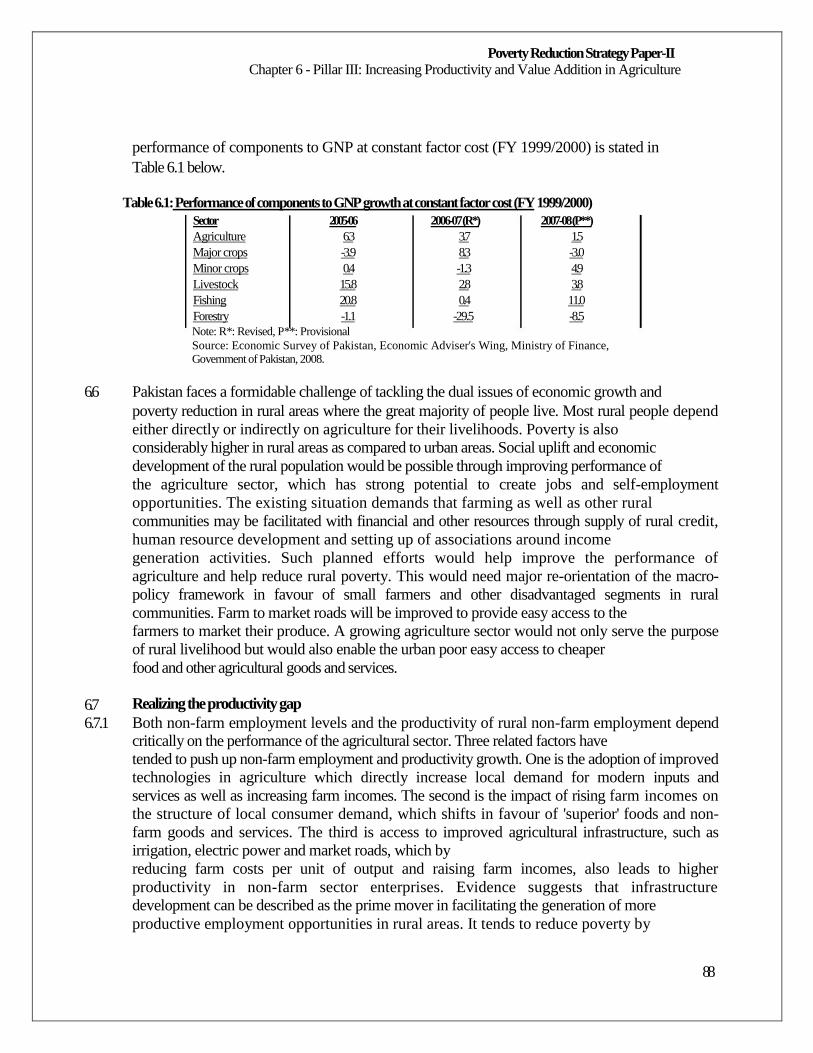
Poverty Reduction Strategy Paper-II Chapter 6 - Pillar III: Increasing Productivity and Value Addition in Agriculture
performance of components to GNP at constant factor cost (FY 1999/2000) is stated in
Table 6.1 below.
Table 6.1: Performance of components to GNP growth at constant factor cost (FY 1999/2000)
Sector 2005-06 2006-07 (R*) 2007-08 (P**) Agriculture 6.3 3.7 1.5 Major crops -3.9 8.3 -3.0 Minor crops 0.4 -1.3 4.9 Livestock 15.8 2.8 3.8 Fishing 20.8 0.4 11.0 Forestry -1.1 -29.5 -8.5
Note: R*: Revised, P**: Provisional Source: Economic Survey of Pakistan, Economic Adviser's Wing, Ministry of Finance, Government of Pakistan, 2008.
6.6
6.7
6.7.1
Pakistan faces a formidable challenge of tackling the dual issues of economic growth and
poverty reduction in rural areas where the great majority of people live. Most rural people depend
either directly or indirectly on agriculture for their livelihoods. Poverty is also
considerably higher in rural areas as compared to urban areas. Social uplift and economic
development of the rural population would be possible through improving performance of
the agriculture sector, which has strong potential to create jobs and self-employment
opportunities. The existing situation demands that farming as well as other rural
communities may be facilitated with financial and other resources through supply of rural credit,
human resource development and setting up of associations around income
generation activities. Such planned efforts would help improve the performance of
agriculture and help reduce rural poverty. This would need major re-orientation of the macro-
policy framework in favour of small farmers and other disadvantaged segments in rural
communities. Farm to market roads will be improved to provide easy access to the
farmers to market their produce. A growing agriculture sector would not only serve the purpose
of rural livelihood but would also enable the urban poor easy access to cheaper
food and other agricultural goods and services.
Realizing the productivity gap
Both non-farm employment levels and the productivity of rural non-farm employment depend critically on the performance of the agricultural sector. Three related factors have
tended to push up non-farm employment and productivity growth. One is the adoption of improved
technologies in agriculture which directly increase local demand for modern inputs and
services as well as increasing farm incomes. The second is the impact of rising farm incomes on
the structure of local consumer demand, which shifts in favour of 'superior' foods and non-
farm goods and services. The third is access to improved agricultural infrastructure, such as
irrigation, electric power and market roads, which by
reducing farm costs per unit of output and raising farm incomes, also leads to higher
productivity in non-farm sector enterprises. Evidence suggests that infrastructure
development can be described as the prime mover in facilitating the generation of more
productive employment opportunities in rural areas. It tends to reduce poverty by
88
Poverty Reduction Strategy Paper-II Chapter 6 - Pillar III: Increasing Productivity and Value Addition in Agriculture
increasing labour productivity in both farm and non-farm sectors by stimulating non-farm
sector development, and thereby pushing up real wage rates.
6.7.2
6.7.3
6.7.4
6.7.5
The public sector National Productivity Organization (NPO) endeavours to promote socio-
economic development in the country through productivity (see chapter 8 on
competitiveness). In collaboration with the NPO, Pakistan Agricultural Research Council
(PARC) has hosted 4 projects covering food safety, Intellectual Property Rights (IPR) in
agriculture, technology transfer and commercialization, and value addition of fishery
products; and two training courses covering organic farming and post-harvest of
horticultural crops.39
Over the years agriculture has been a beneficiary of massive investments and most of these
investments have not delivered the expected results. The need is to focus on small farmers so that they
may have a tradable surplus from their assets. This will depend not only on the input prices but also
on the pricing of outputs of the farmer. The small farmer will also require assistance to benefit
from new technological developments pertaining to the efficient utilization of factor inputs. In
particular, the farmer will require assistance in using water more economically, in distinguishing
the type of fertilizer (organic or chemical) that would be optimal for his soil, and in choosing the
correct pesticide. At the moment he sells short and buys expensive. Input factor prices are usually at
international retail prices while
the inelastic output prices are based on wholesale basis.
Farmer Friendly schools established with the help of Food and Agriculture Organization
(FAO) have enabled small farmers to embark on an integrated pest management system. This has
caught on and the two in tandem; organic fertilizer and bio-pesticide should work
to the advantage of farmers.40
Similarly, the Punjab Government has revived the Green Tractor Scheme during the
current financial year (2008-09) to facilitate small farmers. A subsidy of Rs 2.0 billion is to be
provided on 10,000 locally manufactured tractors.41 Eligibility criteria includes the fact that land is
self-cultivated by the applicant with landholding not to be less than five acres in a Tehsil; not more
than 25 acres in case of irrigated area; and not more than 50 acres in
case of barani42 area in the whole of Pakistan.
6.7.6 Such a scheme has also been approved at the federal level where it entails provision of
20,000 locally manufactured tractors with Rs 0.2 million subsidy, per unit.
39 Ministry of Industries, Production &Special Initiatives, Government of Pakistan, October, 2008. 40 Pakistan Agricultural Research Council, Islamabad, December, 2008. 41 Summary approved by the Government of Punjab in August, 2008. 42 Rain-fed.
89
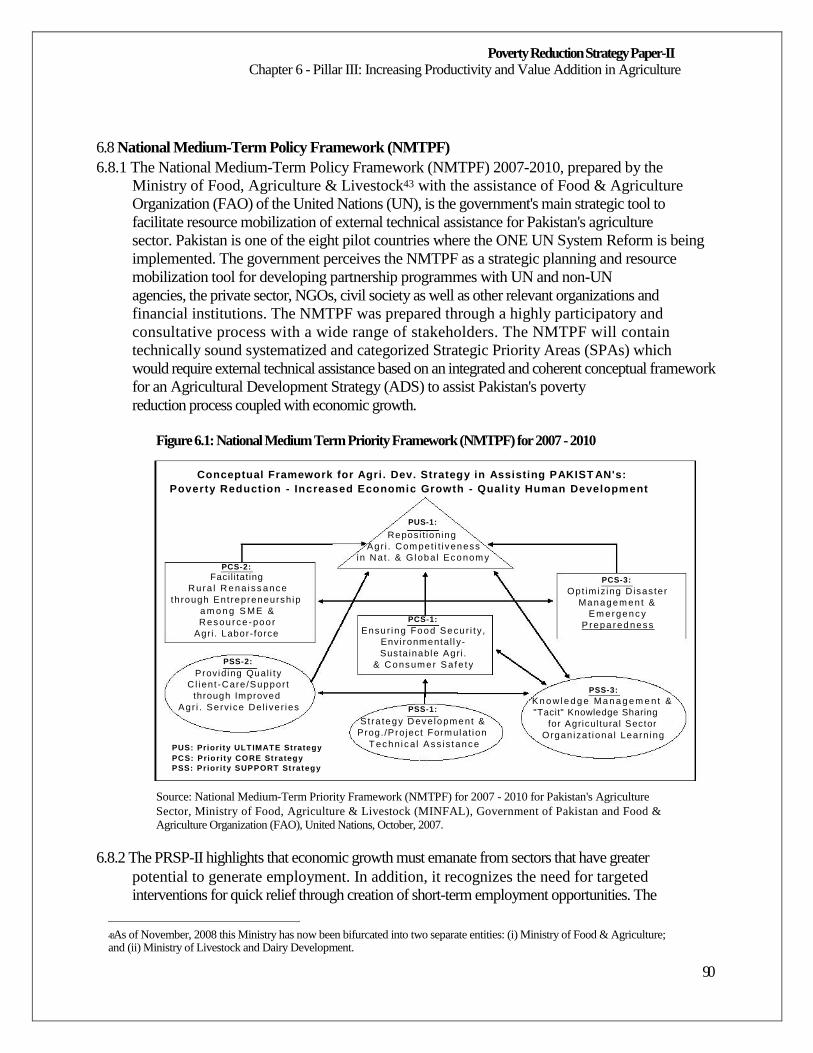
Poverty Reduction Strategy Paper-II Chapter 6 - Pillar III: Increasing Productivity and Value Addition in Agriculture
6.8 National Medium-Term Policy Framework (NMTPF)
6.8.1 The National Medium-Term Policy Framework (NMTPF) 2007-2010, prepared by the
Ministry of Food, Agriculture & Livestock43 with the assistance of Food & Agriculture
Organization (FAO) of the United Nations (UN), is the government's main strategic tool to
facilitate resource mobilization of external technical assistance for Pakistan's agriculture
sector. Pakistan is one of the eight pilot countries where the ONE UN System Reform is being
implemented. The government perceives the NMTPF as a strategic planning and resource
mobilization tool for developing partnership programmes with UN and non-UN
agencies, the private sector, NGOs, civil society as well as other relevant organizations and
financial institutions. The NMTPF was prepared through a highly participatory and
consultative process with a wide range of stakeholders. The NMTPF will contain
technically sound systematized and categorized Strategic Priority Areas (SPAs) which
would require external technical assistance based on an integrated and coherent conceptual framework
for an Agricultural Development Strategy (ADS) to assist Pakistan's poverty
reduction process coupled with economic growth.
Figure 6.1: National Medium Term Priority Framework (NMTPF) for 2007 - 2010
Conceptual Framework for Agri. Dev. Strategy in Assisting PAKIST AN's: Poverty Reduction - Increased Economic Growth - Quali ty Human Development
PUS-1: Reposi t ioning
Agr i . Com pet i t i veness i n Nat . & Globa l Econom y
PCS-2:
Facil itating Rura l R ena i ss ance
th rough Ent repreneursh ip a m o n g S ME & Resource -poo r
Agri . Labor-force
PSS-2: Providing Qual i ty
Cl ient -Care/Suppor t through Improved
Agr i . Service Del i ver ies
PUS: Priority ULTIMATE Strategy PCS: Prior ity CORE Strategy PSS: Prior ity SUPPORT Strategy
PCS-1: Ensur ing Food Secu r i t y ,
Envi ronmental l y- Susta inable Agri .
& Consum er S a fe t y
PSS-1: Stra tegy Deve lopment &
Prog./Project Formulat ion T echni ca l A ss i s tance
PCS-3: Opt im iz ing D isas ter
Managem en t & E m ergenc y
P repa red ness
PSS-3: K n o w le d g e Ma n a g em e n t & "Tacit" Knowledge Sharing
for Agricul tural Sector Organizat iona l Learn ing
Source: National Medium-Term Priority Framework (NMTPF) for 2007 - 2010 for Pakistan's Agriculture Sector, Ministry of Food, Agriculture & Livestock (MINFAL), Government of Pakistan and Food & Agriculture Organization (FAO), United Nations, October, 2007.
6.8.2 The PRSP-II highlights that economic growth must emanate from sectors that have greater
potential to generate employment. In addition, it recognizes the need for targeted
interventions for quick relief through creation of short-term employment opportunities. The
43 As of November, 2008 this Ministry has now been bifurcated into two separate entities: (i) Ministry of Food & Agriculture; and (ii) Ministry of Livestock and Dairy Development.
90
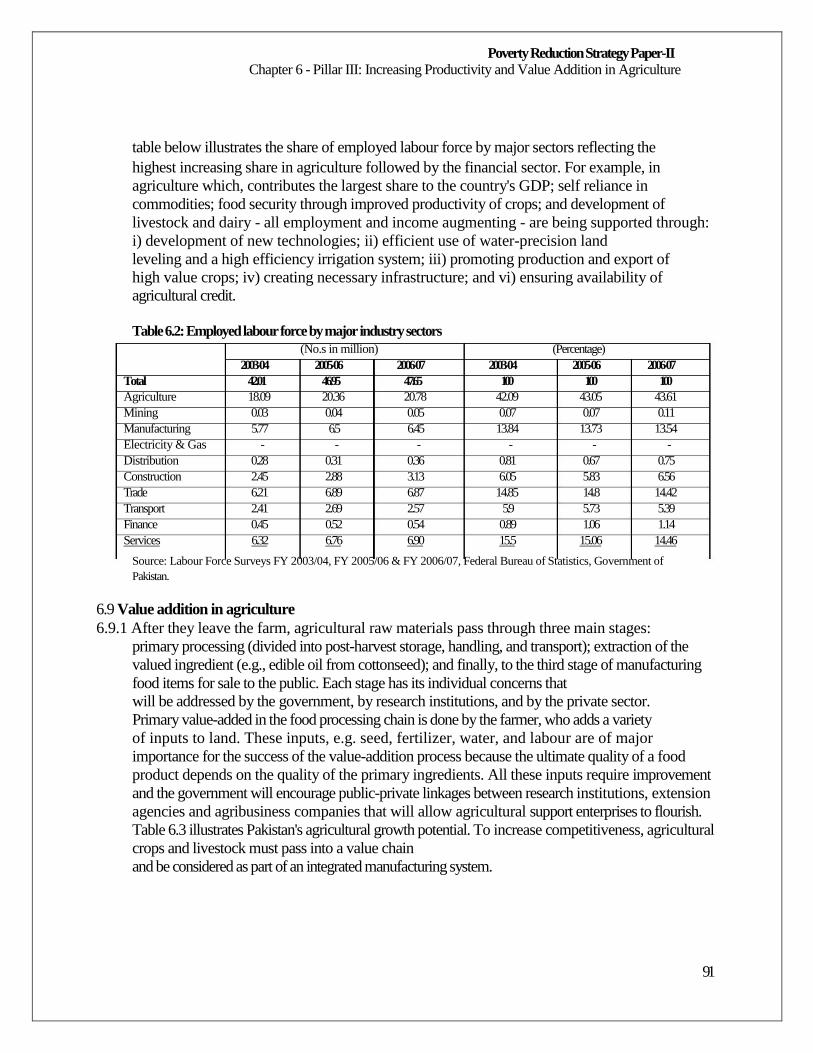
Poverty Reduction Strategy Paper-II Chapter 6 - Pillar III: Increasing Productivity and Value Addition in Agriculture
table below illustrates the share of employed labour force by major sectors reflecting the
highest increasing share in agriculture followed by the financial sector. For example, in
agriculture which, contributes the largest share to the country's GDP; self reliance in
commodities; food security through improved productivity of crops; and development of
livestock and dairy - all employment and income augmenting - are being supported through:
i) development of new technologies; ii) efficient use of water-precision land
leveling and a high efficiency irrigation system; iii) promoting production and export of
high value crops; iv) creating necessary infrastructure; and vi) ensuring availability of
agricultural credit.
Table 6.2: Employed labour force by major industry sectors
(No.s in million) (Percentage) 2003-04 2005-06 2006-07 2003-04 2005-06 2006-07
Total 42.01 46.95 47.65 100 100 100 Agriculture 18.09 20.36 20.78 42.09 43.05 43.61 Mining 0.03 0.04 0.05 0.07 0.07 0.11 Manufacturing 5.77 6.5 6.45 13.84 13.73 13.54 Electricity & Gas - - - - - - Distribution 0.28 0.31 0.36 0.81 0.67 0.75 Construction 2.45 2.88 3.13 6.05 5.83 6.56 Trade 6.21 6.89 6.87 14.85 14.8 14.42 Transport 2.41 2.69 2.57 5.9 5.73 5.39 Finance 0.45 0.52 0.54 0.89 1.06 1.14 Services 6.32 6.76 6.90 15.5 15.06 14.46
Source: Labour Force Surveys FY 2003/04, FY 2005/06 & FY 2006/07, Federal Bureau of Statistics, Government of Pakistan.
6.9 Value addition in agriculture
6.9.1 After they leave the farm, agricultural raw materials pass through three main stages:
primary processing (divided into post-harvest storage, handling, and transport); extraction of the
valued ingredient (e.g., edible oil from cottonseed); and finally, to the third stage of manufacturing
food items for sale to the public. Each stage has its individual concerns that
will be addressed by the government, by research institutions, and by the private sector.
Primary value-added in the food processing chain is done by the farmer, who adds a variety
of inputs to land. These inputs, e.g. seed, fertilizer, water, and labour are of major
importance for the success of the value-addition process because the ultimate quality of a food
product depends on the quality of the primary ingredients. All these inputs require improvement
and the government will encourage public-private linkages between research institutions, extension
agencies and agribusiness companies that will allow agricultural support enterprises to flourish.
Table 6.3 illustrates Pakistan's agricultural growth potential. To increase competitiveness, agricultural
crops and livestock must pass into a value chain
and be considered as part of an integrated manufacturing system.
91
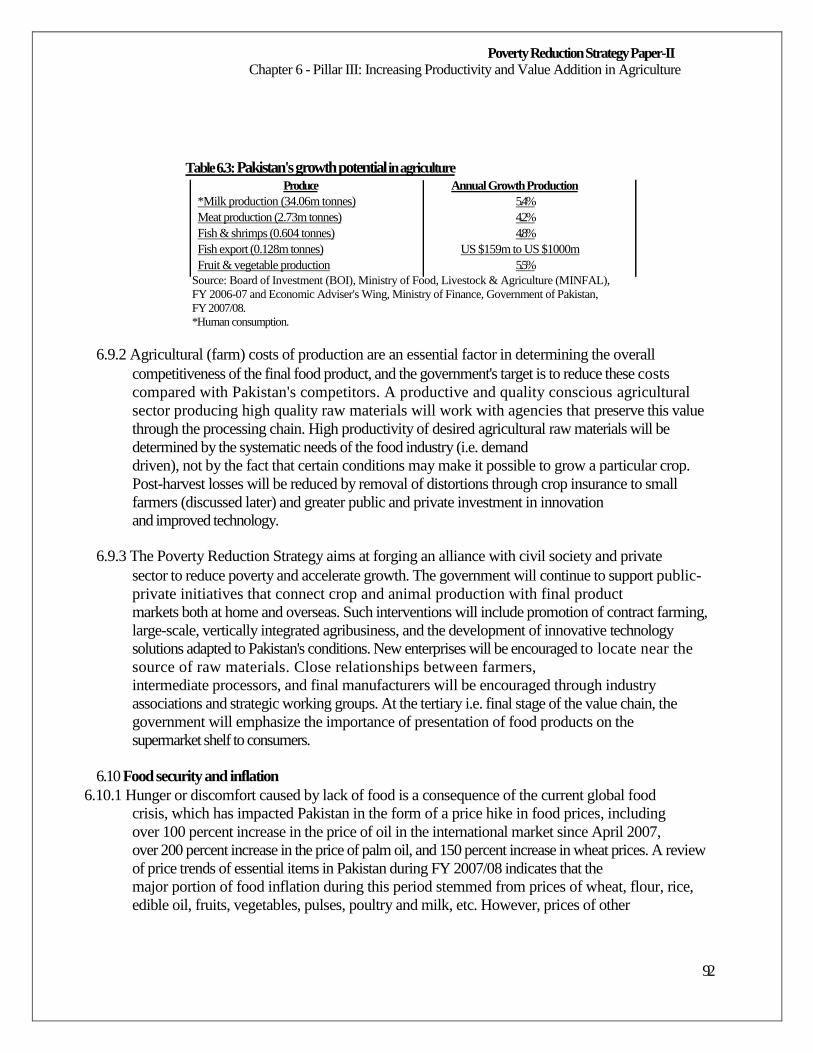
Poverty Reduction Strategy Paper-II Chapter 6 - Pillar III: Increasing Productivity and Value Addition in Agriculture
Table 6.3: Pakistan's growth potential in agriculture
Produce *Milk production (34.06m tonnes) Meat production (2.73m tonnes) Fish & shrimps (0.604 tonnes) Fish export (0.128m tonnes) Fruit & vegetable production
Annual Growth Production 5.4% 4.2% 4.8%
US $159m to US $1000m 5.5%
Source: Board of Investment (BOI), Ministry of Food, Livestock & Agriculture (MINFAL), FY 2006-07 and Economic Adviser's Wing, Ministry of Finance, Government of Pakistan, FY 2007/08. *Human consumption.
6.9.2 Agricultural (farm) costs of production are an essential factor in determining the overall
competitiveness of the final food product, and the government's target is to reduce these costs
compared with Pakistan's competitors. A productive and quality conscious agricultural
sector producing high quality raw materials will work with agencies that preserve this value
through the processing chain. High productivity of desired agricultural raw materials will be
determined by the systematic needs of the food industry (i.e. demand
driven), not by the fact that certain conditions may make it possible to grow a particular crop.
Post-harvest losses will be reduced by removal of distortions through crop insurance to small
farmers (discussed later) and greater public and private investment in innovation
and improved technology.
6.9.3 The Poverty Reduction Strategy aims at forging an alliance with civil society and private
sector to reduce poverty and accelerate growth. The government will continue to support public-
private initiatives that connect crop and animal production with final product
markets both at home and overseas. Such interventions will include promotion of contract farming,
large-scale, vertically integrated agribusiness, and the development of innovative technology
solutions adapted to Pakistan's conditions. New enterprises will be encouraged to locate near the
source of raw materials. Close relationships between farmers,
intermediate processors, and final manufacturers will be encouraged through industry
associations and strategic working groups. At the tertiary i.e. final stage of the value chain, the
government will emphasize the importance of presentation of food products on the
supermarket shelf to consumers.
6.10 Food security and inflation
6.10.1 Hunger or discomfort caused by lack of food is a consequence of the current global food
crisis, which has impacted Pakistan in the form of a price hike in food prices, including
over 100 percent increase in the price of oil in the international market since April 2007,
over 200 percent increase in the price of palm oil, and 150 percent increase in wheat prices. A review
of price trends of essential items in Pakistan during FY 2007/08 indicates that the
major portion of food inflation during this period stemmed from prices of wheat, flour, rice,
edible oil, fruits, vegetables, pulses, poultry and milk, etc. However, prices of other
92
Poverty Reduction Strategy Paper-II Chapter 6 - Pillar III: Increasing Productivity and Value Addition in Agriculture
important food items like sugar, potatoes and moong pulse have decreased owing to
improved availability of these items in the market.44
6.10.2 In order to deal with this problem, the government has adopted a threefold strategy. First,
it seeks to boost production by increasing the support price of key commodities. Thus, for
example, the government increased the support price for wheat from Rs 425/40 kg to Rs
625/40 kg for the wheat season FY 2007/08 and Rs 925/40 kg in FY 2008/09; this should both
encourage the farm to grow more wheat and also discourage hoarding of the commodity.
Second, imports have been liberalized to improve the supply situation of
essential commodities. Thus, the government has allowed duty-free imports of wheat and
essential consumer items to augment their supplies and reduce their prices. Third, in order to ensure
competition and fair play in the market, the Competition Commission of Pa46
n kista
(CCP) 45 has been empowered to prevent non-competitive behaviour in all markets. The
prices of essential commodities will be regularly monitored by a Secretaries Committee
chaired by the Minister of Finance.
6.10.3 Ensuring food security in the long-run can be met from the southern areas of Sindh and the
province of Balochistan. Palm oil in Sindh and Balochistan planted in FY 1993/94 has now been
very successfully cultivated and is ready for oil extraction. To the traditional edible oil crops can
be added a number of other varieties to increase employment in the rural
areas. Chagai in Balochistan has a great future as it has 4.5 million hectares of land ready
for mono cropping of wheat right away. Lower down is Kharan district which again has
substantial land available and water that can be harvested sensibly. With Mirani dam
coming in near Gwadar the scene particularly looks promising for Balochistan. The Kacchi
canal and the pat feeder as also the water from the drainage canal can be used.47
6.11 Crop Maximization Project
6.11.1 The Ministry of Food, Agriculture and Livestock (MINFAL) and the Rural Support
Programme Network (RSPN) signed a Rs 428 million contract in March to maximize crop
production in over 1,000 villages across the country as part of a national food security project.
Under the contract, the ministry and the RSPN will implement the social mobilization
component of the Special Programme for Food Security and Productivity Enhancement of
Small Farmers in 1,012 villages under the Crop Maximization Project
(CMP-II). The project is being implemented in 27 districts with the aim of ensuring
adequate food supply through increased production of food and cash crops. The project is expected
to generate employment and provide sustainable livelihood and income in the
food-insecure areas. The project will be implemented by the RSPN over a period of four
years (April 2007 and beyond) in partnership with its six rural support programmes — the Aga
Khan Rural Support Programme (AKRSP), National Rural Support Programme (NRSP)
and the four provincial Rural Support Programmes (RSPs). A pilot project,
44 Finance Division, Economic Adviser's Wing, Government of Pakistan, 2008. 45 Previously known as the Monopoly Control Authority (MCA). 46 Finance Division, Economic Adviser's Wing, Government of Pakistan, 2008. 47 Pakistan Agricultural Research Council, Islamabad, December, 2008.
93
Poverty Reduction Strategy Paper-II Chapter 6 - Pillar III: Increasing Productivity and Value Addition in Agriculture
popularly known as the Sargodha Model, was implemented in three districts with results
found to be quite encouraging.
6.12 Livestock and poultry sectors
6.12.1 While livestock accounts for 52.2 percent of agriculture and 11 percent of GDP, its
importance can be gauged by the fact that the livelihoods of about 30-35 million people in the rural
areas depend directly or indirectly on livestock and dairy sectors.48 The livestock sector is highly
labour-intensive and hence, has enormous potential to generate income for small farmers as well as
for the landless and for rural women. The following areas will be
in focus on during the PRSP-II period:
Micro-credit programmes covering provision of goats, sheep and dairy animals on
personal guarantee without any formal collateral. Support to livestock producers in the shape of
input supply. Livestock producers would be provided with improved animal
feed and artificial insemination facilities;
Improving feed and fodder resource base, which is under great stress and continuously
depleting. Similarly, knowledge of fodder grasses and fodder will be disseminated;
The present animal marketing system is misleading since the market functionaries and
middlemen exploit livestock producers. Therefore, a system of sale of live animals on
meat weight basis will be introduced which will be backed with necessary legislation.
6.13 Meat sector
6.13.1 Pakistan has not been able to exploit its large livestock population to become a major
player in the international meat trade. Major reasons for this include: non-development of specific
indigenous meat breeds, absence of modern meat processing plants and the low priority which
was accorded to this sector by policy makers in the past. Protein consumption is low by
international standards. There are very few large-scale animal
slaughterhouses and meat processing plants. During the PRSP-II period, the government will
address these issues by strengthening programmes for health and nutrition awareness, removing
distortions and improving hygiene in meat marketing, and by encouraging the production of halal
meat and products for export to Muslim communities overseas. The
government has recently announced a 'Livestock Development Policy', which is in the
process of adopting a legal framework and suggests strategies and action plans for
improving per animal productivity. Under this policy, the import of dairy and livestock
machinery, not manufactured locally, is allowed duty free. The policy will also encourage
the establishment of slaughterhouses in the private sector and allows access to credit to small
farmers. Quality of the animal herd has considerably improved, thanks to better
veterinary services. To further realize Pakistan's added advantage of exporting halal food products,
a Halal Certification Board will be set up under the Ministry of Science and
Technology to devise and enforce halal standards and certification mechanism for export of
halal food. In accordance with the Trade Policy for FY 2008/09, the available markup at 6
48 Board of Investment (BOI) and Animal Husbandry Commission, Ministry of Livestock & Dairy Development, Government
of Pakistan, 2008.
94
Poverty Reduction Strategy Paper-II Chapter 6 - Pillar III: Increasing Productivity and Value Addition in Agriculture
percent support on loans for setting up slaughterhouses is being increased to 8 percent or
50 percent of the markup, whichever is lower.49
6.13.2 If sensibly handled and projected in world markets, potential meat producing animals could
improve the quality of life of the herders in Balochistan. For example, cows in Bajaur, by
natural selection and by virtue of the surrounding harsh area are nutrient efficient and have
the ability to produce more milk than cows in other regions. Similarly, sheep breeds are
under investigation in Cholistan which have potential to provide good meat and wool; thus
enabling greater income generation possibilities for the population in that area.50
6.13.3 A Livestock & Dairy Development Board (LDDB) has been established as a private sector-
led government guaranteed not-for-profit company under the Ministry of Livestock and Dairy
Development in Public Private Partnership. The company has undertaken two mega projects in
meat production and milk collection respectively: The LDDB is implementing a
project on "Livestock Production and Development for Meat Production" which is of 5
years duration (2005-10). The objectives include establishment of 2590 feedlot fattening
farms by private farmers (1040 beef and 1550 mutton); eight slaughterhouses and 20 butcheries
in the private sector along with capacity building of all stakeholders, awareness
raising and legislation. The company has established its offices in all provinces mobilizing
private sector investment in livestock and cattle farming; establishme51
t of modern n
slaughter houses and butcheries; and increase in outreach of milk collection.
6.13.4 Poultry meat contributes 19 percent of the total meat production in the country. Current
investment in the poultry sector is about Rs 200 billion. The poultry sector has shown a growth
of 8-10 percent annually. This sector has faced a tough challenge on account of Avian Influenza
(AI) outbreak in the country. The government has provided additional
incentives to increase livestock and poultry production in the country. Recent regulatory
measures of the government include allowing import of high yielding animals, semen and embryos
for crossbreeding, modernization of laboratory facilities to diagnose and treat livestock
diseases, introduction of mobile animal health services at the doorsteps of farmers, and duty
free import of veterinary dairy and livestock machinery/equipment. Construction of Animal
Quarantine Facilities at various places including Northern Areas, Wahga Border, Lahore and
Khokrapar, costing Rs 336 million, is a five year project (2006-
2011). The project is aimed at improving quarantine facilities 52
and establishing new
entry/exit points to facilitate trade of animals and animal products. The government has allowed
import of incubators, brooders, evaporation cooling pads, grain storage silos for poultry, and milk
and meat processing machinery not manufactured locally at zero percent custom duty. The private
sector imported milk and meat processing equipment worth Rs 285 million during July-March,
2007/08. Sales exemption has been allowed for uncooked poultry meat; processed milk, yogurt,
cheese flavoured milk and butter cream. In addition,
49 Ministry of Commerce, Government of Pakistan, 2008. 50 Pakistan Agricultural Research Council, Islamabad, December, 2008. 51 Animal Husbandry Commission, Ministry of Livestock & Dairy Development, Government of Pakistan, December, 2008. 52 Animal Husbandry Commission, Ministry of Livestock & Dairy Development, Government of Pakistan, December, 2008.
95
Poverty Reduction Strategy Paper-II Chapter 6 - Pillar III: Increasing Productivity and Value Addition in Agriculture
poultry vaccines and feed additives used in poultry feed manufacturing have been allowed
at zero percent custom duty.
6.13.5 In terms of specific provincial initiatives, the following new livestock projects will be
undertaken in Sindh during the PRSP-II period: (i) establishment of cattle colonies with district
& private participation, Phase-I (Rs 3329 million); establishment of Centre of
Excellence for Modern Technology in Animal Breeding, Sindh at Red Sindhi Cattle
Breeding Farm in Tando Muhammad Khan (Rs 1466 million); construction of Taluka
Veterinary Dispensaries, Phase-I (Rs 500 million); and public-private participation for
developing livestock and dairy farming (Rs 500 million).53
6.14 Dairy sector
6.14.1 Pakistan is the fifth largest producer of milk in the world. Pakistan produced about 42.199
million tonnes of milk in FY 2007-08, with 55.1 percent of this production was contributed by the
province of Punjab. The rural sector provides 71.1 percent of total annual milk
production.
6.14.2 Only 3.5 percent of the total milk production is processed and marketed through formal
channels. However, despite significant recent increases in total production, milk prices have
still trended upwards (showing a 25 percent increase in the last 5 years). Although Pakistan is
one of the world's larger producers of milk, it currently imports over Rs 3
million worth of powder milk. Countrywide, per capita milk availability is about 215.5 litres
per annum, higher than most of the developing countries.54 While milk output is
relatively high, the channels by which milk reaches the consumer are rudimentary. Thus
much of the productivity increase at the farm level is lost in post-farm handling and
marketing. Dairy farming practices are very old and traditional and need overhauling.
Furthermore, the production of processed and packaged milk (e.g. UHT milk) lags behind
countries with equivalent milk supplies.
6.14.3 The government has attempted to tackle deficiencies in milk production by working with
the processing industry to overcome bottlenecks (e.g., by establishing milk collection
networks and promoting use of cooling tanks at the farm level). In this regards, the LDDB of
Ministry of Livestock & Dairy Development is currently implementing a project entitled 'Milk
Collection Processing and Dairy Production & Development Programme (2005-10)'. The project is
targeting to establish milk collection and marketing network for small and
landless farmers in 500 villages through provision of 300 Milk cooling units in 500
villages; to provide support to 10,000 market-oriented rural dairy farmers for production of quality
breeding animals and to strengthen/ initiate progeny testing programme in Punjab and Sindh for
production of progeny tested bulls of indigenous buffalo and dairy cattle
breeds.55
53 Government of Sindh, Planning and Development Department, November, 2008. 54 Animal Husbandry Commission, Ministry of Livestock & Dairy Development, Government of Pakistan, December, 2008. 55 Animal Husbandry Commission, Ministry of Livestock and Dairy Development, Government of Pakistan, November 2008.

96
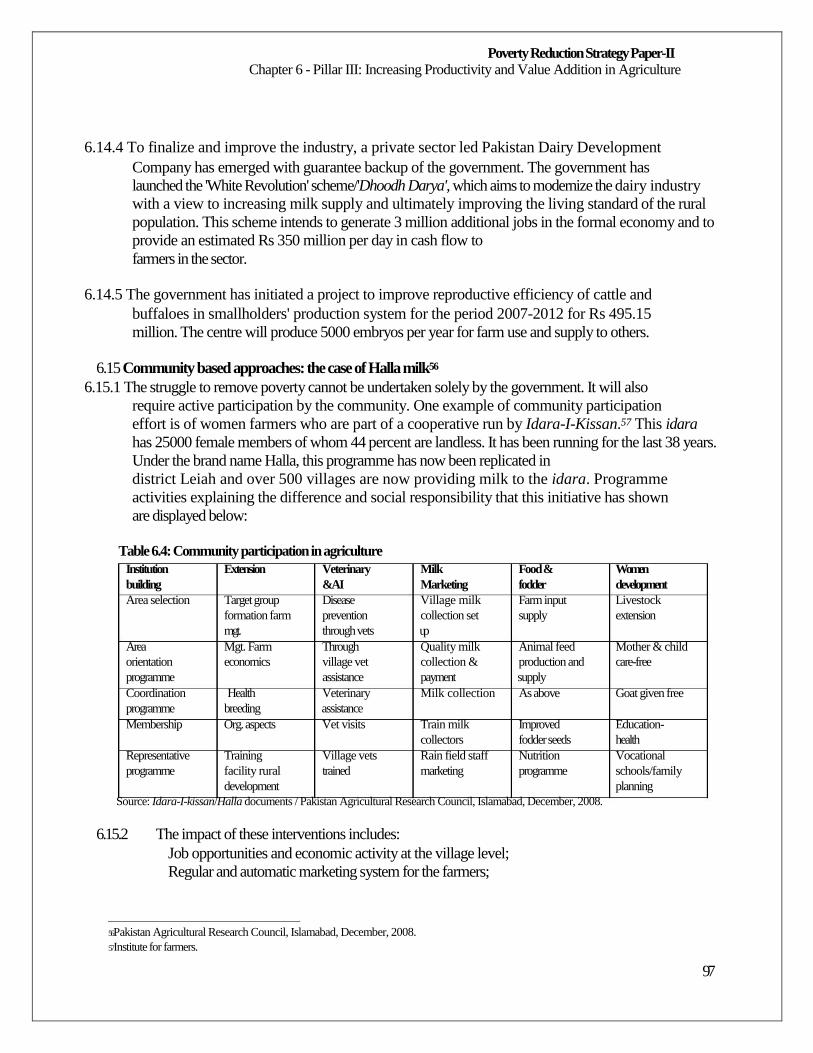
Poverty Reduction Strategy Paper-II Chapter 6 - Pillar III: Increasing Productivity and Value Addition in Agriculture
6.14.4 To finalize and improve the industry, a private sector led Pakistan Dairy Development
Company has emerged with guarantee backup of the government. The government has
launched the 'White Revolution' scheme/'Dhoodh Darya', which aims to modernize the dairy industry
with a view to increasing milk supply and ultimately improving the living standard of the rural
population. This scheme intends to generate 3 million additional jobs in the formal economy and to
provide an estimated Rs 350 million per day in cash flow to
farmers in the sector.
6.14.5 The government has initiated a project to improve reproductive efficiency of cattle and
buffaloes in smallholders' production system for the period 2007-2012 for Rs 495.15
million. The centre will produce 5000 embryos per year for farm use and supply to others.
6.15 Community based approaches: the case of Halla milk56
6.15.1 The struggle to remove poverty cannot be undertaken solely by the government. It will also
require active participation by the community. One example of community participation
effort is of women farmers who are part of a cooperative run by Idara-I-Kissan.57 This idara
has 25000 female members of whom 44 percent are landless. It has been running for the last 38 years.
Under the brand name Halla, this programme has now been replicated in
district Leiah and over 500 villages are now providing milk to the idara. Programme
activities explaining the difference and social responsibility that this initiative has shown
are displayed below:
Table 6.4: Community participation in agriculture
Institution Extension Veterinary Milk Food & Women building &AI Marketing fodder development Area selection Target group Disease Village milk Farm input Livestock
formation farm prevention collection set supply extension mgt. through vets up
Area Mgt. Farm Through Quality milk Animal feed Mother & child orientation economics village vet collection & production and care-free programme assistance payment supply Coordination Health Veterinary Milk collection As above Goat given free programme breeding assistance Membership Org. aspects Vet visits Train milk Improved Education-
collectors fodder seeds health Representative Training Village vets Rain field staff Nutrition Vocational programme facility rural trained marketing programme schools/family
development planning
Source: Idara-I-kissan/Halla documents / Pakistan Agricultural Research Council, Islamabad, December, 2008.
6.15.2 The impact of these interventions includes:
Job opportunities and economic activity at the village level;
Regular and automatic marketing system for the farmers;
56 Pakistan Agricultural Research Council, Islamabad, December, 2008. 57 Institute for farmers.
97
Poverty Reduction Strategy Paper-II Chapter 6 - Pillar III: Increasing Productivity and Value Addition in Agriculture
Low rate of disease prevalence and higher price of animals then the surrounding
areas;
Better price of milk for the farmers;
Improvement in health and education and income generation of the farmer's family.
Rural development that is sustained;
Consumers get quality products cheaper than the other market players - Multinational
Corporations (MNCs), surrogates, bakeries; and
Halla is cheaper for the consumer, milk paid to the farmer is the same as the MNCs
and the cost of production and selling is less than the MNCs resulting in a win-win
situation between the farmer, the consumer and the managers.
6.16 Fisheries sector
6.16.1 The fisheries sector accounts for 0.3 percent of GDP. It witnessed a growth of 11 percent in
FY 2007/08 against 0.4 percent during FY 2006/07. Components of fisheries such as marine
and inland fishing contributed to an overall increase in value addition in the
fisheries sector. New projects to be undertaken in the fisheries sector in Sindh during the PRSP-II
period include: strengthening and improvement of fish and shrimp hatcheries (Rs
784 million); model village for fisherman at Dabla Para in Badin (Rs 481 million);
rehabilitation and renovation of Karachi Fish Harbour (Rs 290 million); establishment of meat,
fish and vegetable market at Qasimabad, Hyderabad (Rs 1.9 billion); and construction of
model Fish Harbour at Keti Bunder, Thatta (Rs 500 million).58 The following proposed
programmes of the federal government aim to enhance value addition
in the fisheries sector.
Support to coastal fishermen: Programmes will target the boatless fishermen working
as labourers as well as small boat owners. The programme will focus on areas like
upgrading existing boats through enhancing modification and refrigeration of fish hold
capacities and equipping with modern gadgets to make them adjust to sea climate.
Support to coastal fisherwomen: Post-harvest handling of fish and fish products is
carried out by women in coastal areas who lack necessary training and modern
equipment, which results in enormous post harvest losses and deterioration of quality.
Therefore, a programme would be launched to supply improved processing equipment
backed up by training support to small-scale fishermen and women.
Support to inland fisheries: The fisheries sector lacks extension support in the country
resulting in poor growth and depriving it of necessary competitiveness. To address this issue a
programme of streamlining of existing extension service of fisheries would be undertaken.
The available diagnostic services are rudimentary and very limited which
results in substantial losses of fish. This would require strengthening/establishment of
diagnostic laboratories at provincial levels.
Introduction and promotion of fish and shrimp culture: A project aimed at
introduction and promotion of fish and shrimp culture in coastal areas of Sindh and
58 Government of Sindh, Planning and Development Department, November, 2008.
98
Poverty Reduction Strategy Paper-II Chapter 6 - Pillar III: Increasing Productivity and Value Addition in Agriculture
Balochistan will be started because of the enormous potential in these areas. This
programme will particularly focus on poor coastal communities.
6.17 Horticulture sector
6.17.1 Horticulture sector, which comprises production of fruits, vegetables and other high value
products, has the capacity to rapidly generate incomes and jobs. Further, Pakistan has a
competitive advantage in production of fruits and vegetables given their export potential.
Horticulture projects, therefore, will be launched during the period of the PRSP-II targeting
small farmers and women.
6.17.2 While many developing countries have seen a fairly rapid expansion in agricultural exports
over the past decade, with China, Malaysia, Thailand, and India among the strongest
regional performers, Pakistan's share in total world horticultural exports has actually declined.
By contrast, India's total exports rose more than three-fold. Pakistan's exports
have also remained heavily concentrated in low value added goods, while other regional
producers such as India and Sri Lanka have improved product technology and value addition.
Even in the low technology segment, such as in fresh fruits, Pakistan's exports have declined or
stagnated in recent years. This stagnation is largely because of the demand
in world markets for better quality products and improved traceability, related to World
Trade Organization (WTO) regulations and standards, and other increasingly stringent
standards in developed markets.
6.17.3 The last comprehensive survey of the manufacturing sector estimated that there were 4,474
firms based across all sectors and that the food and beverages sector accounted for 984
firms. It is estimated that about 1.5 million people may be employed in small and medium
horticultural enterprises. The enterprises engaged in hortibusiness are generally either
micro-scale village based activities, or large-scale operations being undertaken by
nationally recognized companies.59
6.18 Agriculture, globalization and international competitiveness
6.18.1 Increasing global inter-linking due to globalization has made it mandatory for Pakistan to
introduce new regulatory rules and bring fundamental changes in its agricultural production regimes
including: the adoption of Sanitary & Phyto-Sanitary (SPS) measures; Good Agricultural
Practices (GAP); and Good Manufacturing Practices (GMP) in agricultural production and
processing. By meeting World Trade Organization (WTO) agreements and
requirements, agricultural export commodities from Pakistan can have a better opportunity to
compete globally in meeting the demand of a dynamic market and shift in consumer
preferences for high-value crops. With evolving of WTO Regime and Regional Trade
Agreements, the country needs to know/monitor the development of tradable commodities both
domestically and internationally and suggest steps to position the Pakistan Agriculture in the
emerging environment. Investments in transport & preservation technologies are
59 Agribusiness & Diversification Project, MinFAL, Government of Pakistan, November 2008.
99
Poverty Reduction Strategy Paper-II Chapter 6 - Pillar III: Increasing Productivity and Value Addition in Agriculture
already underway in Pakistan through appropriate government interventions and triggers,
which will improve the entire value chain in agro-industries.
6.18.2 Capacity building on WTO issues is an area of high priority,60
and for this purpose, an
Agricultural Policy Institute (API) was established in 2006 to develop MinFAL's
capacity for improving its negotiation strategies on WTO issues and other trade-related analysis
and intelligence for promoting export of agricultural commodities and value-added
food-related products. The purpose of the API is to advise the government on formulating
agriculture policy in order to make Pakistani agriculture profitable, competitive and
sustainable in light of emerging global and domestic policy issues in the agriculture sector.
6.18.3 Taking the case of Balochistan, the rural population increased from 1.5 million in FY
1998/99 to 3.2 million in FY 2006/07. While poverty rose in rural areas, it declined slightly
in the urban areas. Balochistan's main drivers of economic recovery i.e. small scale trade; agriculture
product markets; and government spending & services, have generated incomes in cities.61 The
principle challenge is that rural households obtain a share of the overall national economic
growth. The province is unfortunately a regular victim of drought and
earthquakes62. More public resources need to be allocated to lower the incidence of poverty
in the region. In this light, the Agricultural Planning Directorate (APD) was established in FY
1992/93 under the Directorate General of Agriculture Extension in Quetta. According to a study
undertaken by the APD in Balochistan, agriculture is the largest sub-sector consuming 97.3
percent of total available water resources in the province. In addition, agriculture provides
majority livelihood to rural communities in the region. Restructuring of APD to convert it into a
'High Performance Planning Institution' is being considered to
be done in three phases spread over a period of three years to overcome its deficiencies.63
6.19 Establishment of agro-based industries
6.19.1 There is enormous potential for establishment of agro-processing and other related
industries for which agriculture is the source of raw material. This arrangement would help in
increasing job opportunities for the rural poor as well as help reduce the present trend of
rural migration to urban centres.
6.19.2 Agribusiness sector has the potential to be a source of economic growth and income
generation with small farmers as major beneficiaries. There is a need for implementation of a project
that will help to enhance the quantum of export especially of horticulture and floriculture items
and value addition. The government signed a loan agreement with Asian Development Bank, and
approved Agribusiness Development and Diversification Project. This is a five year (2006-
2010) project aimed at addressing constraints impeding
development of the agribusiness sector, and exploiting domestic and export market
60 The Government of Pakistan reconstituted APCom as API in December, 2006. 61 Government of Balochistan, Planning and Development Department, October, 2008. 62 See chapter 5 for a discussion on government efforts in disaster management. 63 "Water for Balochistan: Policy Briefings", Volume (4), No. 11, 2008, Department of Agriculture, Government of
Balochistan, ADB and Royal Government of Netherlands, 2008.
100
Poverty Reduction Strategy Paper-II Chapter 6 - Pillar III: Increasing Productivity and Value Addition in Agriculture
opportunities 64
the sector, thereby contributing to increased economic growth and rural
in employment.
6.19.3 The project objectives are to support economic growth and job creation through
competitive and sustainable agribusiness development. The project focuses on development
of horticulture, hortibusiness, livestock and dairy sub-sectors. Project objectives are to
support economic growth and employment generation through competitive and sustainable
agribusiness development. The project interventions focus on increased productivity, product
quality, and value addition by removing constraints facing agribusiness that occur throughout the
product value chain from production and input supply to processing and
exports. Interventions include: (i) improving the managerial; production, and processing
skill levels of entrepreneurs and farmers to ensure the production of good quality raw
material and uniform and high standard products; (ii) supporting identified banks in
increasing agribusiness lending to allow stakeholders exploit market opportunities; (iii) re- orienting
government institutions to become facilitators of agribusiness development using
Public Private Partnerships; (iv) improving the policy, regulatory, and financial
environment to make it more responsive to private sector needs, and encourage producers and
entrepreneurs to invest in agribusiness; and (v) establishing the framework and standards to
comply with stringent international standards. The project components include
the following:65
6.19.3.1 Agribusiness Support Service Provision: The project includes a component that aims to
facilitate increased access to Business Development Services (BDS) through agribusiness
enterprises by financing eligible services for capacity building, including technical,
managerial, financial, and marketing skills. To achieve this objective the Project has
established Agribusiness Support Fund (ASF) as a not-for-profit company under Public Private
Partnerships that is providing matching grants to eligible agribusiness enterprises,
farmers, research and extension service providers, and BDS providers.
6.19.3.2 Agribusiness Finance Development: The project will also support development of
financial services, particularly credit, to agribusiness enterprises that do not have ready access to
such services. The project has through State Bank of Pakistan identified 6 participating
financial institutions (PFIs) to develop their understanding of the potential
agribusiness finance market, and to enhance their capacity to undertake agribusiness
lending. Agreement has been signed with an international consultancy firm for capacity building
of participating financial institutions. These banks would be in a position to launch
their financial products within 20 to 24 months.
6.19.3.3 Agribusiness Capacity Building: The capacity building focus is on horticulture,
hortibusiness, livestock and dairy sub sectors. The objective of this component is to increase
private sector participation in provision of services currently provided by public
64 Agribusiness & Diversification Project, MinFAL, Government of Pakistan, November 2008. 65Agribusiness & Diversification Project, MinFAL, Government of Pakistan, November 2008.
101
Poverty Reduction Strategy Paper-II Chapter 6 - Pillar III: Increasing Productivity and Value Addition in Agriculture
sector institutions. To facilitate agribusiness development and international compliance, the
Project will support the rationalization, restructuring, and coordination of relevant
MINFAL agencies and offices concerned in alignment with WTO regulations and
international product standards.
6.19.3.4 Market Information Services: The objective is to improve availability of market
information, identified as a significant constraint to agro-enterprise expansion. The Project
will promote the development of information through outsourcing. This component is to be executed
by the Department of Agriculture and Livestock Products Marketing and Grading
(DALPMG) under which an appropriate private sector provider will be supported to
develop a system that will initially focus on 11 major wholesale markets in the county and
Pakistan's major export markets for fruits and vegetables.
6.19.3.5 Horticulture Project Unit: This Unit has been established within Pakistan Horticulture
Development and Export Board (PHDEB) with the objective to develop more effective
linkages between the public sector and private agribusiness. The unit has developed a
comprehensive programme that will help implement project activities in the horticulture
sub sector and facilitate interaction with agribusiness enterprises. In accordance with its mandate,
the Unit is assisting by: (i) contributing to and supporting provincial and special area horticultural
policy task forces in developing horticulture policies for each province and special area; (ii) in
association with provincial and special area project implementation offices (PlOs), identification
of potential recipients for ASF cost-sharing grants, and forwarding grant applications to the
ASF; (iii) identification of enterprises, farmer group
enterprises, and processors to determine training, extension, and research needs; and
organize their training; (iv) identification of farmer groups, exporters, packers, and
processors that wish to become internationally compliant, and help them obtain project support;
and (v) work closely with the project horticulture and hortibusiness consultants to
support their activities.
6.19.3.6 The project also comprises components that deal with export quality certification, seed and
planting material certification, and training and capacity building.
6.19.4 Development of Agribusiness Policy
6.19.4.1 This component will assist the Government to develop an appropriate policy and enabling
environment for private-sector-led agribusiness development. This includes national and
provincial interventions to redefine roles and responsibilities in the sector; strengthen
regulatory framework, in particular for alignment with international standards; and create effective
public-private partnerships to promote sector development. The project will support the
development of the regulatory framework, and establish quality and certification
requirements for locally produced products to align with international standards. In
particular, the project will assist the WTO cell in MinFAL to formulate amendments to the
legal framework to align with commitments made in regard to sanitary and phytosanitary measures in
Pakistan's agreements with WTO. The project will also help
102
Poverty Reduction Strategy Paper-II Chapter 6 - Pillar III: Increasing Productivity and Value Addition in Agriculture
MINFAL develop programmes to collate and disseminate information relating to
international standards to relevant stakeholders in both private and public sectors.
6.19.4.2
6.19.4.3
Agro Food Processing Facilities (APC), Multan: Small Medium Enterprise Development
Authority (SMEDA), in collaboration with Punjab Small Industries Corporation (PSIC),
Mango Growers Association Multan (MGAM) and Multan Chamber of Commerce and
Industry (MCCI) is establishing Agro Food Processing Facilities. The Facility is expected
to be operational by June 2008. Nature has blessed Pakistan with an ideal climate for growing
a large variety of vegetables and fruits. Agricultural sector is directly or indirectly
contributing 25 percent towards GDP. Pakistan has a total fruit and vegetable production of
about 5,900,881 and 6,171,986 tonnes respectively. According to Agriculture Department,
30 percent of vegetables/fruits are wasted due to negligence and lack of processing facilities,
which could convert them into non-perishable form, permitting its transportation and storage
without wastage. With the spread of education, change in habits of populace, growth in working
women force and increase in per capita income & urbanization, the
demand for processed vegetable/fruit products is increasing progressively. The introduction of agro
food-based Common Facility Centres enables minimal post harvest losses. The Centre will
comprise of fruit processing (Mango and Guava Pulp) and vegetable processing (Fresh
Fruit/Vegetable Grading and Packing) facilities and also provide training and
consultancy services to SMEs. It is envisaged that the Project will minimize post harvest
losses, increase income of growers and exports from the country.
Punjab Agrimarketing Company (PAMCO): The Punjab Agrimarketing Company
(PAMCO) has been formed by the Government of Punjab, Pakistan under the public- private
initiative to energize the agriculture business in Punjab. Investments in agribusiness which PAMCO
will initiate and will in turn, improve the lot of the common farmer through targeted interventions
to accomplish the following objectives: providing easy market access, adding value to farm
produce, making farm products competitive and reducing post harvest losses. PAMCO is a
corporate entity backed by the Government of Punjab ad managed by highly qualified
private sector professionals. PAMCO operations are
overviewed by a Board of Directors to ensure autonomy of the Company. PAMCO's
mandate is to attract private sector investment in agribusiness with special focus on:
facilitating investors, providing advisory services, investing in projects, supporting
entrepreneurs and promoting trading activities.
6.19.4.3.1 PAMCO's immediate concern is increasing the marketability period of perishable
commodities in Punjab which include fruits and vegetables, dairy, fisheries, livestock,
floriculture and poultry. This will be accomplished by encouraging private investment in (i) cold
chain infrastructure - cold storage facilities at airports, urban and production areas,
refrigerated transport via road, rail and air and (ii) food processing units - mango pulping,
kinnow66 processing/concentrate, onion processing/dehydration, tomato preservation and
potato processing.
66 Oranges.
103
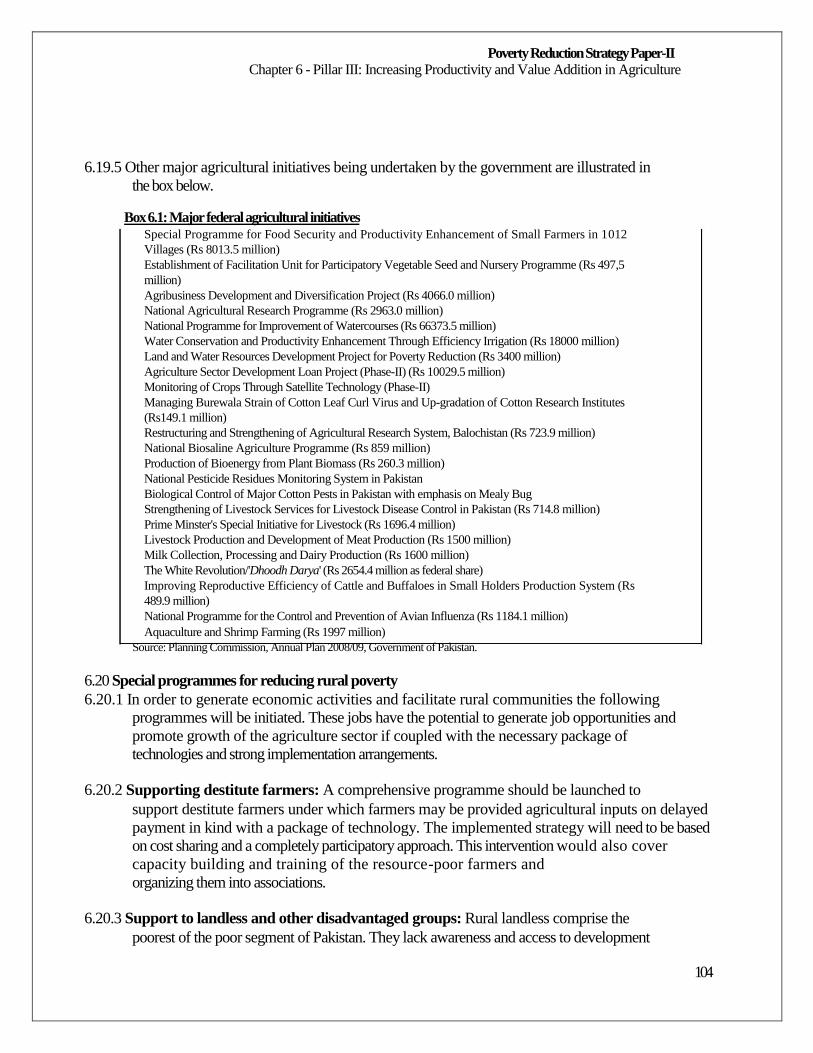
Poverty Reduction Strategy Paper-II Chapter 6 - Pillar III: Increasing Productivity and Value Addition in Agriculture
6.19.5 Other major agricultural initiatives being undertaken by the government are illustrated in
the box below.
Box 6.1: Major federal agricultural initiatives Special Programme for Food Security and Productivity Enhancement of Small Farmers in 1012 Villages (Rs 8013.5 million) Establishment of Facilitation Unit for Participatory Vegetable Seed and Nursery Programme (Rs 497,5 million) Agribusiness Development and Diversification Project (Rs 4066.0 million) National Agricultural Research Programme (Rs 2963.0 million) National Programme for Improvement of Watercourses (Rs 66373.5 million) Water Conservation and Productivity Enhancement Through Efficiency Irrigation (Rs 18000 million) Land and Water Resources Development Project for Poverty Reduction (Rs 3400 million) Agriculture Sector Development Loan Project (Phase-II) (Rs 10029.5 million) Monitoring of Crops Through Satellite Technology (Phase-II) Managing Burewala Strain of Cotton Leaf Curl Virus and Up-gradation of Cotton Research Institutes (Rs149.1 million) Restructuring and Strengthening of Agricultural Research System, Balochistan (Rs 723.9 million) National Biosaline Agriculture Programme (Rs 859 million) Production of Bioenergy from Plant Biomass (Rs 260.3 million) National Pesticide Residues Monitoring System in Pakistan Biological Control of Major Cotton Pests in Pakistan with emphasis on Mealy Bug Strengthening of Livestock Services for Livestock Disease Control in Pakistan (Rs 714.8 million) Prime Minster's Special Initiative for Livestock (Rs 1696.4 million) Livestock Production and Development of Meat Production (Rs 1500 million) Milk Collection, Processing and Dairy Production (Rs 1600 million) The White Revolution/'Dhoodh Darya' (Rs 2654.4 million as federal share) Improving Reproductive Efficiency of Cattle and Buffaloes in Small Holders Production System (Rs 489.9 million) National Programme for the Control and Prevention of Avian Influenza (Rs 1184.1 million) Aquaculture and Shrimp Farming (Rs 1997 million)
Source: Planning Commission, Annual Plan 2008/09, Government of Pakistan.
6.20 Special programmes for reducing rural poverty
6.20.1 In order to generate economic activities and facilitate rural communities the following
programmes will be initiated. These jobs have the potential to generate job opportunities and
promote growth of the agriculture sector if coupled with the necessary package of
technologies and strong implementation arrangements.
6.20.2 Supporting destitute farmers: A comprehensive programme should be launched to
support destitute farmers under which farmers may be provided agricultural inputs on delayed
payment in kind with a package of technology. The implemented strategy will need to be based
on cost sharing and a completely participatory approach. This intervention would also cover
capacity building and training of the resource-poor farmers and
organizing them into associations.
6.20.3 Support to landless and other disadvantaged groups: Rural landless comprise the
poorest of the poor segment of Pakistan. They lack awareness and access to development
104
Poverty Reduction Strategy Paper-II Chapter 6 - Pillar III: Increasing Productivity and Value Addition in Agriculture
programmes since traditional development has generally failed to focus on them.
Therefore, a programme to include these groups in mainstream development would be
initiated at grassroots level. This programme will include launching of income generation
activities, and schemes for training disadvantaged groups to be more vocal for their rights
and wages, etc.
6.20.4 Support to rural women: Rural women are key players of crop production activities with
no or little institutional support. As a case study, the role of cotton picking women would be
focused and programmes may be initiated to improve their situation. They will be
provided with necessary knowledge support in efficient picking; informed of measures to protect
them from environmental hazards caused by increased chemical spraying of the
cotton crop; and providing training and information on income-generating activities.
6.20.5 Facilitating access to inputs: Measures have been taken in the Budget FY 2008/09 to help
increase farmer productivity including supply of fertilizers at subsidized rates. An amount
of Rs 35 billion has been allocated to subsidize the cost of urea and to enhance subsidy on
DAP from Rs 470 to Rs 1000 per bag; availability of agricultural credit will be ensured;
fertilizers and pesticides have been exempted from sales tax; and numerous schemes to improve
water availability and conserve water wastage have been initiated (described below). Special
focus is being given to small irrigation projects in Balochistan. The
government has negotiated projects for US $38 million to improve management of water resources
in the Indus River basin and for US $25 million for Balochistan Small-Scale
Irrigation Project.
6.20.6 Facilitating means of irrigation for farmers:67 The binding constraint on agriculture in
Pakistan is water. While water shortages affect almost all the provinces, Balochistan is the most
arid and is particularly hard hit. A special effort, therefore, will be made to increase
the supply of irrigation water in that province. The irrigation system in the province of
Sindh has also deteriorated, and measures to restore it will continue during the PRSP-II
period.
6.20.6.1 The government has approved Rs 12.963 billion for rehabilitation of irrigation and
drainage systems in Sindh and Rs 2.15 billion for construction of 20 delay action dams in
Balochistan. A meeting of the Executive Committee of the National Economic Council
(ECNEC), presided by the Prime Minister also approved Rs 2.637 billion for construction of
Shadi Kaur Dam and related projects in Balochistan. The Shadi Kaur Dam will be built
50km north of Pasni (Balochistan) and will contain storage capacity of 37,000 acre feet of water. It
will irrigate 7,600 acres of agricultural land and provide drinking water to 15,000
people.
6.20.6.2 The dams falling on fan areas will store water during the rainy season and let it percolate in
order to create artificial recharge for a sustained flow during dry months. The dams will be
67 Government of Pakistan, November, 2008.
105
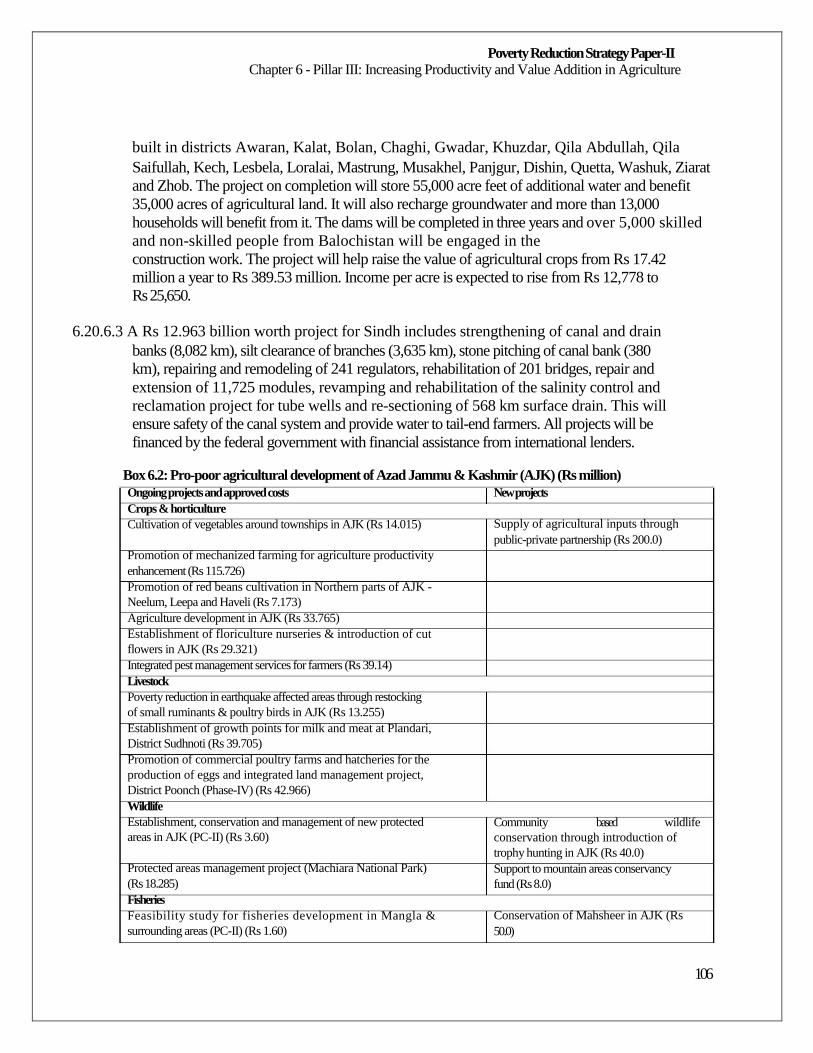
Poverty Reduction Strategy Paper-II Chapter 6 - Pillar III: Increasing Productivity and Value Addition in Agriculture
built in districts Awaran, Kalat, Bolan, Chaghi, Gwadar, Khuzdar, Qila Abdullah, Qila
Saifullah, Kech, Lesbela, Loralai, Mastrung, Musakhel, Panjgur, Dishin, Quetta, Washuk, Ziarat
and Zhob. The project on completion will store 55,000 acre feet of additional water and benefit
35,000 acres of agricultural land. It will also recharge groundwater and more than 13,000
households will benefit from it. The dams will be completed in three years and over 5,000 skilled
and non-skilled people from Balochistan will be engaged in the
construction work. The project will help raise the value of agricultural crops from Rs 17.42
million a year to Rs 389.53 million. Income per acre is expected to rise from Rs 12,778 to
Rs 25,650.
6.20.6.3 A Rs 12.963 billion worth project for Sindh includes strengthening of canal and drain
banks (8,082 km), silt clearance of branches (3,635 km), stone pitching of canal bank (380
km), repairing and remodeling of 241 regulators, rehabilitation of 201 bridges, repair and
extension of 11,725 modules, revamping and rehabilitation of the salinity control and
reclamation project for tube wells and re-sectioning of 568 km surface drain. This will
ensure safety of the canal system and provide water to tail-end farmers. All projects will be
financed by the federal government with financial assistance from international lenders.
Box 6.2: Pro-poor agricultural development of Azad Jammu & Kashmir (AJK) (Rs million)
Ongoing projects and approved costs Crops & horticulture Cultivation of vegetables around townships in AJK (Rs 14.015)
Promotion of mechanized farming for agriculture productivity enhancement (Rs 115.726) Promotion of red beans cultivation in Northern parts of AJK - Neelum, Leepa and Haveli (Rs 7.173) Agriculture development in AJK (Rs 33.765) Establishment of floriculture nurseries & introduction of cut flowers in AJK (Rs 29.321) Integrated pest management services for farmers (Rs 39.14) Livestock Poverty reduction in earthquake affected areas through restocking of small ruminants & poultry birds in AJK (Rs 13.255) Establishment of growth points for milk and meat at Plandari, District Sudhnoti (Rs 39.705) Promotion of commercial poultry farms and hatcheries for the production of eggs and integrated land management project, District Poonch (Phase-IV) (Rs 42.966) Wildlife Establishment, conservation and management of new protected areas in AJK (PC-II) (Rs 3.60)
Protected areas management project (Machiara National Park) (Rs 18.285) Fisheries Feasibility study for fisheries development in Mangla & surrounding areas (PC-II) (Rs 1.60)
New projects
Supply of agricultural inputs through public-private partnership (Rs 200.0)
Community based wildlife conservation through introduction of trophy hunting in AJK (Rs 40.0) Support to mountain areas conservancy fund (Rs 8.0)
Conservation of Mahsheer in AJK (Rs 50.0)
106
Poverty Reduction Strategy Paper-II Chapter 6 - Pillar III: Increasing Productivity and Value Addition in Agriculture
Establishment of modern trout fish hatcheries, District Neelum (Rs 37.206)
Source: Planning & Development Department, Azad Government of the State of Jammu & Kashmir, Pakistan, October, 2008.
6.21 Sustainable Development Plan in the Federally Administered Tribal Areas68
6.21.1 The Federally Administered Tribal Areas (FATA) of Pakistan are located along the
country's border with Afghanistan. The last three decades have seen turmoil and instability
across the border spillover into FATA. Increasingly impoverished and marginalized, its people
have also become vulnerable to exploitation at the hands of criminal and extremist elements. Today
the region is once again in the spotlight, not simply for reasons of internal
security but also because of its status as a staging post for geopolitical developments with
global repercussions.
6.23.1.2 The economy in FATA is based on agriculture and the subsistence-level use of natural
resources. However, agricultural production is low and natural resources are severely
depleted. Commerce and industry provide jobs to many FATA residents but these sectors operate
on a small scale and cannot absorb more than a limited share of the working
population. The workforce is largely unskilled, further hindering commercial and industrial
expansion. Infrastructure is thin, depriving the population of access to sufficient education facilities
and healthcare. Development initiatives undertaken so far show a marked absence of cohesive
planning and have instead been carried out in a compartmentalized fashion, concentrating
narrowly around specific sectoral activities At this critical juncture, a long- term strategy is needed
to steer development planning so that flux and uncertainty may give
way to positive change that will create stability, security and hope for the future.
6.23.1.3 The FATA Sustainable Development Plan (SDP) aims to steer development planning in
a new direction, focusing on the people at the grassroots level. It identifies the people as its main
focus of development and its instigators. The key objective is to foster social and economic
development based on the principles of equity and participation. The SDP
outlines measures to improve services, upgrade infrastructure, promote sustainable use of
natural resources, and generate activity in the industrial, trade and commerce sectors. It
also provides an independent monitoring and evaluation framework to support, assess and
strengthen development initiatives.
6.23.1.4 Rather than replicating the narrow focus of the past, the SDP takes an integrated approach
to development planning, combining economic and social development with environmental integrity
and poverty alleviation. While the core components of the plan are structured around specific
sectors, the vision is holistic taking into account major cross-cutting themes ranging from broad
structural concerns such as governance and institutional capacity to the
more normative considerations of social cohesion and cultural identity. The Plan is flexible
and adaptable, comprising of a two-phased implementation schedule. Priority interventions are
planned for the first phase, spanning a period of five years, followed by a second four-
68 FATA Sustainable Development Plan (2006-2015), Civil Secretariat (FATA), Government of Pakistan, 2006.
107
Poverty Reduction Strategy Paper-II Chapter 6 - Pillar III: Increasing Productivity and Value Addition in Agriculture
year assessment and consolidation period. Primary responsibility of preparing the FATA
SDP lies with the Civil Secretariat in FATA, in partnership with the World Conservation
Union (IUCN), Pakistan. The total cost for implementation of the long-term SDP is Rs
124.108 billion, which will be met through the federal Public Sector Development
Programme (PSDP) and assistance from development partners.69
6.23.2
6.23.3
Agriculture in FATA: Agriculture is the lifeline of the people of FATA. Small
landholders, who make up the majority of farmers, practice agriculture mainly at the
subsistence level characterized by the underutilization of land and the prevalence of risk- averse
behaviour patterns such as the cultivation of low input crops. The soil and climatic
conditions favour the cultivation of cereals, fruits and vegetables but agricultural
productivity has remained low. The irrigated midland agricultural system is based on
wheat, oilseed and pulses, with some fodder and vegetables, mainly onion in the winter (October-
March), while maize, sugarcane, rice, potato and tomato are grown in the summer (April-September).
Household income is supplemented by the cultivation of high-value
produce such as apple, apricot, date, fig, grape, peach, persimmon, plum, pomegranate and walnut.
Significant scope exists to increase off-season vegetable cultivation. Wheat
production falls far short of needs and the deficit is obtained from other parts of the country or abroad.
Women play a major role in agricultural activities. They work in orchards while
men are primarily responsible for land leveling, sowing and irrigation. In areas where women
are relatively mobile, both men and women share responsibility for weeding,
harvesting, threshing and seed storage.
Main issues: There is poor coordination between various actors involved in land and
agriculture management, and procedural problems arise particularly when it comes to
purchasing dry land agriculture machinery. Farmers lack access to improved seed varieties and do
not have the relevant skills to produce high-yield seeds. Other inputs such as pesticides and
fertilizers are also in short supply. Where inputs are available, quality is suspect, and no
legislation exists in the tribal areas for the purpose of regulating the standard of reliability of
farm inputs. Credit is not available through mainstream financial institutions. As a result, farmers
turn to private lenders that offer highly unfavourable
terms. Marketing problems persist in the absence of adequate infrastructure such as grading plants,
cold storage facilities and farm-to-market roads. This creates waste and lowers the
sale price of agricultural produce.
6.23.2.1 Forests are an integral part of the rural economy, playing a significant role in the local
livelihoods particularly in the mountainous regions. Forests meet the fuel, fodder and
timber requirements of the rural population, besides providing critical ecological services. Forests
create jobs, particularly in operations such as felling, transportation, saw mills and sale depots.
Commercial undertakings including charcoal kilns and furniture factories also
rely on forest resources. At the subsistence level, the collection and sale of medicinal plants,
work generally done by women, helps provide much-needed income support for
69 Planning & Development Department, FATA Secretariat, Government of Pakistan, November, 2008.
108
Poverty Reduction Strategy Paper-II Chapter 6 - Pillar III: Increasing Productivity and Value Addition in Agriculture
poorer households. However, forest area in FATA is declining rapidly as a result of timber
extraction (legally for local use and sale and for export to areas outside FATA), prolonged periods
of drought, uncontrolled grazing, and pressure from fuel wood and fodder collection. The
gap between production and use is widening, and the current levels of
extraction are unsustainable. Over-exploitation has affected the natural regenerative
capacity of forests. With forest resources rapidly disappearing, environmental services provided
by natural ecosystems have also diminished. Land erosion has led to denuded hills unable to
retain soil or water. Erosion increases the incidence of flash floods which wipe away crops,
farmland and valuable infrastructure, while lower water retention has led to a drawing down of the
water table, creating scarcity where none existed a few
generations ago.
6.23.3 Objective and strategies: The SDP aims to increase the contribution of agriculture to the
local economy, making it a key source for sustainable livelihoods in the area. A people- centered
approach is critical so that inputs and support can be provided where they are
needed most and where they will provide the most benefit. This plan will be implanted by
means of the following strategies:
Support the shift from subsistence agriculture towards market-oriented production;
Adopt a 'pocket area' approach to designate zones where one specific crop with a
comparative advantage will be promoted, providing necessary facilities, inputs and
extension services. This effort will involve collaboration between the government, local
farmers and the relevant industries. Industries will play a major role in agriculture
extension services including phytosanitary measures, storage pre-processing and
marketing, as well as the provision of appropriate seeds;
Reclaim cultivable wasteland for the benefit of poor households;
Expand the availability of water and improve the efficiency of supply systems in
collaboration with the irrigation and water management sector;
Increase the income of farmers by providing loans, access to makers and quality
agricultural inputs;
Maximize soil efficiency, minimize farm inputs, improve the quality of farm products
and reduce post harvest losses by introducing environmentally friendly and area
specific research-based technological packages;
Improve agriculture data collection, compilation and analysis for effective planning and
monitoring;
Develop institutional and human resources of government and non-government service
providers; and improve the working of existing farm service centres. Introduce
performance-based budgeting;
Improve water management practices in collaboration with the relevant management
authorities by introducing efficient water use technologies, and constructing small
dams, ponds and reservoirs. Carry out a technical assessment of groundwater;
109
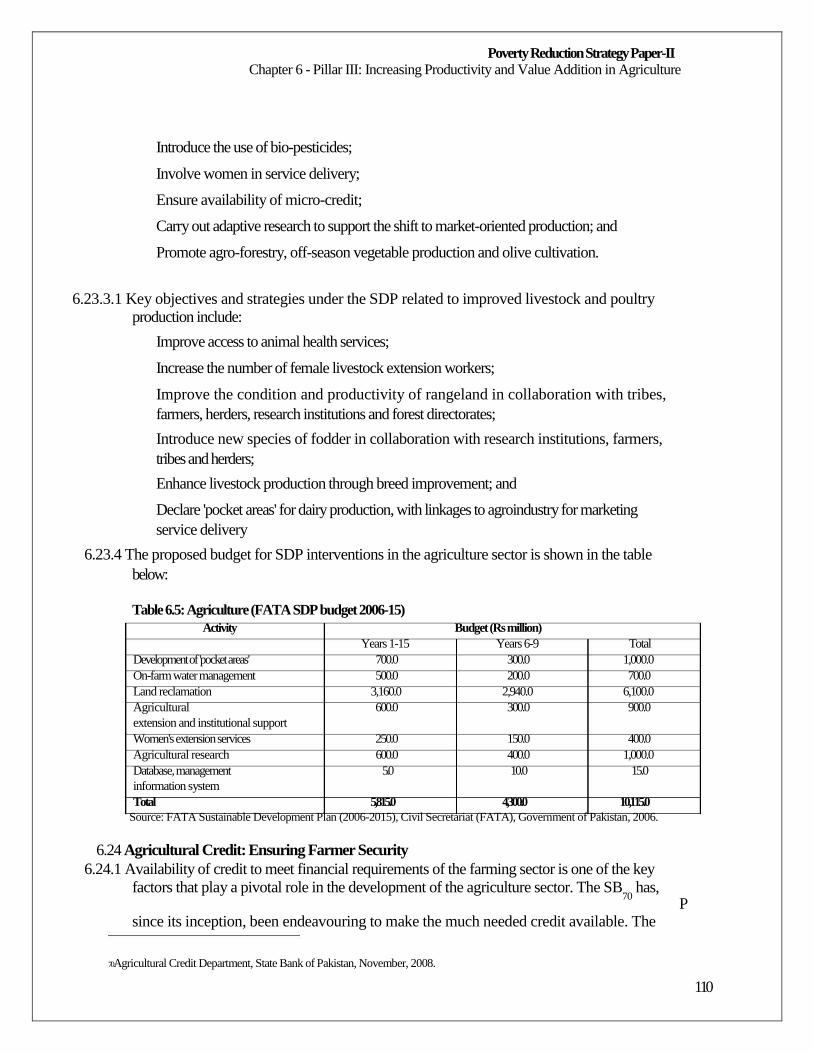
Poverty Reduction Strategy Paper-II Chapter 6 - Pillar III: Increasing Productivity and Value Addition in Agriculture
Introduce the use of bio-pesticides;
Involve women in service delivery;
Ensure availability of micro-credit;
Carry out adaptive research to support the shift to market-oriented production; and
Promote agro-forestry, off-season vegetable production and olive cultivation.
6.23.3.1 Key objectives and strategies under the SDP related to improved livestock and poultry production include:
Improve access to animal health services;
Increase the number of female livestock extension workers;
Improve the condition and productivity of rangeland in collaboration with tribes,
farmers, herders, research institutions and forest directorates;
Introduce new species of fodder in collaboration with research institutions, farmers,
tribes and herders;
Enhance livestock production through breed improvement; and
Declare 'pocket areas' for dairy production, with linkages to agroindustry for marketing
service delivery
6.23.4 The proposed budget for SDP interventions in the agriculture sector is shown in the table
below:
Table 6.5: Agriculture (FATA SDP budget 2006-15)
Activity Budget (Rs million) Years 1-15 Years 6-9 Total
Development of 'pocket areas' 700.0 300.0 1,000.0 On-farm water management 500.0 200.0 700.0 Land reclamation 3,160.0 2,940.0 6,100.0 Agricultural 600.0 300.0 900.0 extension and institutional support Women's extension services 250.0 150.0 400.0 Agricultural research 600.0 400.0 1,000.0 Database, management 5.0 10.0 15.0 information system Total 5,815.0 4,300.0 10,115.0
Source: FATA Sustainable Development Plan (2006-2015), Civil Secretariat (FATA), Government of Pakistan, 2006.
6.24 Agricultural Credit: Ensuring Farmer Security
6.24.1 Availability of credit to meet financial requirements of the farming sector is one of the key
factors that play a pivotal role in the development of the agriculture sector. The SB70
has, P
since its inception, been endeavouring to make the much needed credit available. The
70 Agricultural Credit Department, State Bank of Pakistan, November, 2008.
110
Poverty Reduction Strategy Paper-II Chapter 6 - Pillar III: Increasing Productivity and Value Addition in Agriculture
SBP has taken various initiatives to create an enabling environment and facilitate banks in
increasing the outreach of agricultural credit since the last several years. Initiatives include
induction of 14 domestic private banks in agricultural credit scheme in FY 2003/04, besides
five big banks and two specialized banks. List of eligible items for agri-financing
was enlarged by including more than 150 items in addition to allowing banks to provide
financing for complete value chain of activities of agriculture by farmers. Wholesale
financing to farmers through microfinance institutions, NGOs, etc. has also been allowed
under agri-financing by banks.
6.24.2 In order to facilitate banks in diversification of their portfolios of non-crop sector and the
development of specialized products, guidelines for livestock, fisheries, poultry and
horticulture financing were issued. Local Credit Advisory Committees were established at 16
offices of SBP to help banks and local farming community in resolving agri. credit
related issues at the grassroots level. Similarly, to ensure sustainability in flow of
agricultural credit and effective implementation of SBP's initiatives, a separate
Development Finance Support Department (DFSD) and its subsequent units were
established at SBP BSC Offices. These units are focusing on developing a network in
collaboration with local banks and farming community. The forum will provide a platform
for the awareness of banks and farming community about SBP's schemes and policies on agri-
finance. There has always been a great demand from agricultural customers for Islamic
financing products for agriculture sector. Islamic banks and Islamic Banking
Branches (IBBs) of conventional banks have also shown their great interest in adopting
Shariah71 compliant agriculture finance as a viable business line. Therefore, draft.
Guidelines on Islamic Financing for Agriculture have been developed aimed at facilitating
banks in this process.
6.24.3 Separate Prudential Regulations (PRs) for agriculture financing, prepared in consultation
with banks and other stakeholders, were issued to banks to provide broader regulatory
framework to banks. Banks are also allowed unsecured financing up to Rs 500,000. With the
consensus of all banks, SBP has simplified/standardized agricultural loan documents for the
benefit and convenience of the farming community. For production loans, number of documents
have been reduced from 14 to 5, and for development loans, from 21 to 6. These documents/forms
have also been translated/printed into Urdu and other regional languages for the benefit of
farming community. Around 85 percent of the farming communities having land holdings up
to 12.5 acres (as per Agriculture Census 2000) and majority of them have no collateral to offer.
Therefore, a small farmers' scheme based on group lending methodology was introduced to address
the issues of these small farmers. Under this scheme members of the group may borrow up to
Rs 200,000 without any
collateral from financial institutions.
6.24.4 After privatization of banks, many non-profitable rural branches had either been closed
down or had been shifted to urban areas. In order to increase the rural branch network, SBP
71 Islamic Law.
111
Poverty Reduction Strategy Paper-II Chapter 6 - Pillar III: Increasing Productivity and Value Addition in Agriculture
has made it mandatory for banks to open at least 20 percent rural branches while opening
new ones. Moreover, to reduce operational/administrative costs of agri/rural financing and increasing
the outreach of financial services to rural community, SBP has allowed banks to adopt concepts of
branchless banking and open sub-branches, special booths and service
centres in remote areas.
6.24.5 A Revolving Credit Scheme for a period of 3 years for production loans with one time
documentation was introduced to meet the seasonal requirements of the farming/rural
community and to avoid unnecessary delays in the documentation procedures. The limit
automatically renews on the cleaning of the account (principle and mark-up), with date
convenient to borrower, once a year. The scheme is a huge success and most of the
agricultural financing products are being covered under this structure.
6.24.6 In order to facilitate farmer borrowers in meeting their credit requirement due to increase in
prices for inputs like seed, fertilizer, pesticides, fuel, etc. per acre credit limit for crops,
horticulture and social forestry has been enhanced by an average of 70 percent from Rabi crop FY
2008/09. These credit initiatives have paid dividend in the form of increase in agricultural
credit to Rs 212 billon in FY 2007/08 from Rs 39 billion in FY 1999/00. The
target for FY 2008/09 has been fixed at Rs 250 billion. SBP is looking forward to
establishing a farmer-friendly market based financial sector in the country to meet the
increasing credit requirements of the agriculture sector and also to meet the financing needs
of rural community. The financial inclusion of rural community will ultimately facilitate
meeting of national goals of agricultural growth and poverty alleviation in the rural areas.
6.24.7 The SBP is also working on a strategy to double agricultural credit disbursement and the
number of agri borrowers in next 3-4 years under the Financial Inclusion Programme
financed by DFID.
6.24.8 The SBP initiated training & awareness programmes at the district level wherein
representatives of local banks were invited to provide farming communities details of
available agri-financing facilities and to discuss issues being faced by them in this regard.
Around 50 such programmes have been conducted successfully so far. For the capacity
building of agricultural credit officers of banks, one week crash training programmes are
being arranged at offices of SBP-BSC. In the first phase, 500 officers would be trained in 15
programs and till now around 350 agricultural credit officers of banks have successfully
completed their training in 12 such programmes.
6.25 Benazir Zarai72 Credit Card
6.25.1 To improve farmers' access to institutional credit, the government has decided to introduce
'Benazir Zarai Credit Card' for farmers/growers to enable them to avail credit facility with
convenience and dignity in their respective areas. The objective of the Credit Card is to improve
farmers' access, especially small farmers, to agricultural credit and enable to
72 Agri-based
112
Poverty Reduction Strategy Paper-II Chapter 6 - Pillar III: Increasing Productivity and Value Addition in Agriculture
purchase quality farm inputs such as seed, fertilizer, pesticide, etc. without visiting bank
branches. Under the scheme, participating banks will issue Benazir Zarai Card to farmers
against their three years' revolving credit limits parallel to the existing chequing facility. The Card
can only be used for the purchase of inputs like seeds, fertilizers, pesticides and other inputs from
any of the vendors as per prescribed list. No fixed investment including purchase of tractors, farm
implements etc. will be allowed through Benazir Zarai Card. The Credit limit will be determined
based on annual inputs requirements of the farmer as per SBP per acre indicative credit limits or
as prescribed by the bank. The Card holder may execute any number of transactions within the
limit approved by the bank. To ensure the
smooth implementation of the scheme, the government will develop a vendor network and
Information Technology structure.
6.26 Crop Insurance Plan
6.26.1 Agriculture is susceptible to natural calamities. Since banks have been reluctant to adopt
agricultural credit as a viable business line mainly due to non-availability of crop loan
insurance in the country, the SBP formed a task force on Crop Loan Insurance Framework
comprising of all stakeholders for the development of a commercially viable and
sustainable Crop Loan Insurance Scheme. A framework has been finalized and largel73
y
agreed upon by banks, representatives of farming community and insurance companies.
The SBP Task Force will introduce mandatory CLIS for five major crops viz. wheat, rice,
cotton, sugarcane and maize from Rabi 2008-09. It was also decided that the government will bear
the cost of premium on account of subsistence farmers up to a maximum of 2
percent per crop.
6.26.2 Under the scheme, all agri. lending banks are required to insure the agri. production loans
through any of the insurance companies offering crop loan insurance products. The risks covered
include losses against natural calamities like excessive rain, hail-storm, frost, flood, drought,
etc. Crop related diseases like viral and bacterial attacks, or any other damage caused to the
crop like locust attack will also be covered. This scheme has been
launched from Rabi season FY 2008-09. In case of natural calamity, it will help the farming
community in the settlement of their outstanding loans and they will also be eligible to draw
fresh loans for future crops. This scheme will not only safeguard the interests of banks and
farmers, but will also save huge funds spent by the government in
the shape of frequent write-offs/waivers of agricultural loans of ZTBL's borrowers.
6.27 Agriculture and Environmental Sustainability
6.27.1 The country's population is predominantly rural and dependent on agricultural lands,
rangelands and forests. Natural resources and their sustainable management are, therefore, central to
economic growth and people's livelihoods. The PRSP-II provides an opportunity for mainstreaming
environment in all sectors and themes that target poverty reduction, thus maximizing the benefits of
interventions and eliminating or minimizing the adverse impacts of the initiatives and
interventions. Environment is a cross-cutting issue; the
73 The Cabinet approved the Crop Loan Insurance Scheme (CLIS) in its meeting held on August 5th, 2008.
113
Poverty Reduction Strategy Paper-II Chapter 6 - Pillar III: Increasing Productivity and Value Addition in Agriculture
solution to the environmental problems lies beyond the restricted jurisdiction of
environmental agencies. Environmental governance, therefore, needs to be integrated into economic
decision-making at all levels. However, strategic policy making is obstructed by lack of
awareness, information on several critical issues and limited data coverage. Enhancing
information and data base in key environmental sectors and dissemination of
environmental information should, therefore, be a high policy priority.
6.27.1.1 The poor live in places which are ecologically more vulnerable and are forced to earn their
living from low-productivity natural resources. In rural areas, indoor air pollution poses a health
hazard to villagers, due to which respiratory diseases are commonly found. The rural poor often live
in low-lying, flood-prone areas, on steep mountain slopes or on dry land and possess low-
productivity marginal land devoid of any irrigation facilities. The urban
poor are found in shanty towns of big cities, which are often built on flood prone, low-lying areas or
around city drains; many of the poor earn their livelihood from environmentally
hazardous scavenging. Environmental deterioration in the form of land degradation, frequent
flood, increased pollution and other hazards reduces the income of both the rural and urban poor
making them more vulnerable to environmental shocks than the rich in both
rural and urban areas. Against the background of the observation that the poor, especially
in rural areas, derive a large part of their livelihood income from environmental resources,
especially land resources used for agriculture, some of the practices they follow can be
damaging to the environment. Clearing forest areas to create land for agricultural use,
including slash-and-burn practices, is an example showing that the poor are responsible for
environmental degradation. Certain consumption practices of the poor, such as damaging the forest
to acquire firewood to be used for cooking and heating could also be detrimental to the environment.
The urban poor, most of whom live in shanty towns, slums/katchi abadis often create unhygienic
sanitary conditions because of their lack of access to formal
toilet facilities.
6.27.1.2 The rate of deforestation in Pakistan is high. Although forests cover a relatively small
proportion of land area in Pakistan, they remain a vital source of direct benefits including fuel-
wood, livelihood and government revenue. Forests also provide several indirect services
such as watershed protection, soil conservation, carbon sequestration and
biodiversity habitat. A major immediate cause of forest loss is over exploitation for
subsistence and commercial purpose. Much of the rural population relies on forest
resources, while the high timber value gives perverse incentives to harvest in an
unsustainable manner. The opportunity cost associated with forests loss can be large
considering a wide range of benefits and services they provide.
6.27.2 National Capacity Self Assessment (NCSA)
6.27.2.1 The Ministry of Environment initiated the National Capacity Self Assessment (NCSA) in
June 2007 with assistance from UNDP. The total cost of the project is US $1999,000 with
expenditure incurred during June-December, 2007 amounting to US $27,298. The NCSA is
an assessment and planning exercise to identify country level priorities and needs for
capacity building to address global environmental issues, focusing on capacity
114
Poverty Reduction Strategy Paper-II Chapter 6 - Pillar III: Increasing Productivity and Value Addition in Agriculture
requirements to implement the three 'Rio Conventions' - biodiversity, land degradation
and climate change. The NCSA will come out with an Action Plan and a Final Report,
which will recommend goals, objectives and strategies for national capacity development
including identified priority actions, timeframe, possible funding, responsibilities and
means of monitoring and evaluation of outcomes and impacts.
6.27.3 National Land Use Plan Project
6.27.3.1 While the original version of the project was approved in April, 2001 for a period of three
years, the Rs 39.21 million worth project has been extended twice since then, and is planned
to end by June, 2009. The project aims to compile and integrate isolated information about
land and prepare a digital database on land resources inventory in Geographical Information
System (GIS) to interpret the state of the country's environment relating to forestry, climate change,
biodiversity, desertification, land degradation, soil
erosion, hydrology, hydrogeology, geology and soil types, etc; and also to facilitate
adoption of appropriate policy measures to address environmental threats and
vulnerabilities. The action plan includes: generation of digital base maps on 1:500,000 scale;
generating thematic information; and compiling data relating to depth and quality of ground water,
water logging and canal commands provided through IWASRI74 (WAPDA), etc. The National
Agriculture Research Council (NARC)75 is engaged in generating field
data on agro-climate, aridity index, crop growth index, rainfall, cropping pattern,
vegetation classes, population density and agro-based industries.
6.28 Going forward
6.28.1 In brief, the strategy for agriculture during the period of the PRSP-II will focus on
increasing productivity, economizing on water, and starting to change the composition of
production towards higher value-added items.
6.28.2 Crop productivity will be enhanced through development of high yielding varieties, use of
improved and hybrid seed, balanced use of fertilizers and micro-nutrients, integrated pest
management, and judicious application of other plant protection measures. The production of high
value crops, fruits, vegetables and flowers will be increased and their export will be promoted by
improving their quality. The private sector will be encouraged to establish
processing, grading, packaging and cold storage facilities through provision of liberal
credit and other facilities to promote exports. Additional water storage capacity will be
created to bring additional area under cultivation and increase cropping intensity and
productivity. Water use efficiency will be improved through precision land leveling, lining
of water courses and promoting drip, sprinkler and trickle irrigation system. Timely
availability of institutional credit will be ensured and the focus shifted towards
disadvantaged groups. Steps will be taken for provision of cheap agricultural inputs to
74 The International Water logging and Salinity Research Institute (IWARSI) was established in 1986, working under general
supervision and control of Ministry of Water and Power through high powered Board of Directors and to be administratively controlled by WAPDA. 75 The National Agricultural Research Centre (NARC) established in 1984, based in Islamabad is the largest research institution of Pakistan Agricultural Research Council (PARC).
115
Poverty Reduction Strategy Paper-II Chapter 6 - Pillar III: Increasing Productivity and Value Addition in Agriculture
farmers. Sunflower cultivation will be promoted to meet cooking oil needs. The
government's decision to increase wheat procurement price is an attempt to ensure frequent supply of
wheat at normal prices and maintenance of an adequate stock. The support price
for wheat will be further revised before the next sowing season.
6.28.3 Initiatives/programmes planned for the future:
6.28.3.1 (a) Short and medium term:
Improving services through transfer of technology to growers;
Water resource management;
Income diversification at farm and village levels;
Improving the agricultural marketing system;
Introduction of high value crops in horticulture and medicinal herbs;
Promoting productivity in the livestock and poultry sectors;
Improving the farm input-output relationship;
Improving access to rural credit ;
Value addition and inculcating quality improvement/technologies at farm level in the
production system; and
Replacing subsistence farming agriculture with agricultural entrepreneurship.
6.28.3.2
(b) Long term
Improvement in water distribution systems, building water reservoirs, improving
water resources and propagating water conservation technologies;
Minimizing post harvest losses at the farm level including crops, livestock, fisheries
and allied pursuits;
Establishing cold chains/warehouses in the private sector to minimize post harvest
losses;
Establishing a market information system to display prices of agricultural
commodities on the pattern of stock exchange; and
Building cool chain infrastructure at ports and airports to facilitate exports of
agricultural commodities.
6.28.4 In short, poverty reduction in Pakistan requires rapid growth in agriculture, which has
strong potential to create jobs and associated self-employment opportunities. This situation therefore,
calls for planned efforts to improve the performance of agriculture to achieve
116

Poverty Reduction Strategy Paper-II Chapter 6 - Pillar III: Increasing Productivity and Value Addition in Agriculture
pro-poor growth; help reduce the rising trend of rural poverty in addition to enabling food
security by keeping supplies intact, on the one hand, and prices in check, on the other.
117
Poverty Reduction Strategy Paper-II Chapter 7 - Pillar IV: Integrated Energy Development Programme
Chapter 7 - Pillar IV: Integrated Energy Development
Programme
7.1 Over the last 30 years, Asia's energy consumption has grown by 230 percent. Vehicle fleets are doubling every 5 to 7 years and this reinforces the urgency of producing cost-
effective greenhouse gas (GhG) reduction solutions for transport. Pakistan's development, too, will
demand enormous amounts of energy. Alongside other Asian countries, Pakistan must put its
energy consumption on a more sustainable path. Rapid urbanization in
Pakistan has brought tremendous challenges as cities work to absorb higher populations.
Promoting energy efficiency, fuel diversity as well as climate change-friendly actions
transcend the boundaries of energy policy and have a direct impact on the poor masses. Policies
concerning the development and sustenance of transportation, technology,
environment, finance, competition, and investment all have an important role to play.76 The links
between sustainable development and energy will require even greater efforts for long term energy
security. Ensuring availability of usable affordable energy is therefore the
bedrock of Pakistan's current and future development.
7.2 The private sector ranks problems with electricity among the top three or four most
important impediments to investment (Chapter 11). The Poverty Reduction Strategy, which relies on
the private sector as the main propellant of growth in Pakistan, must, therefore, pay considerable
attention to developing the country's power resources. Indeed, the remit of the Strategy must be
wider and must cover all forms of energy as different sources of
energy are required for different purposes, including for transportation, household cooking
and power generation. One of the major challenges facing Pakistan is the energy crisis that is intense,
costly and multidimensional. Recent power and gas shortages underscore urgent attention to prevent
serious derailment of the economy. Tackling the current energy crisis
to avoid stifling of growth by rapidly adding more power while simultaneously conserving
energy will be a top priority of PRSP-II.
7.3 The demand for energy increases as the growth of a country's GDP accelerates. Pakistan's
Poverty Reduction Strategy is founded on regaining growth of the GDP; hence one expects the
demand for energy to escalate rapidly. Based on historical trends and drawing on the experience of
other fast-growing economies, Pakistan projects annual growth in energy of
7.2 percent up to 2010 and 8.8 percent thereafter.77 According to the updated demand
forecast prepared by National Transmission and Dispatch Company (NTDC), the power
demand is expected 78
increase by 8.5 percent for the period 2008-10 and 7.7 percent for to
the period 2010-15. Pakistan's total energy requirements by 2030 will be 361 MTOE
(Million Tons Oil Equivalent) compared with 60.4 MTOE in FY 2006/07.79
76 ADB & DFID, Energy Efficiency and Climate Change Considerations for On-road Transportation in Asia, (Philippines, 2006). 77 Ministry of Petroleum and Natural Resources, Government of Pakistan, Islamabad, 2008. 78 Ministry of Water and Power, Power Wing, Government of Pakistan, Islamabad, 2008. 79 Ministry of Petroleum and Natural Resources, Government of Pakistan, Islamabad, 2008.
118
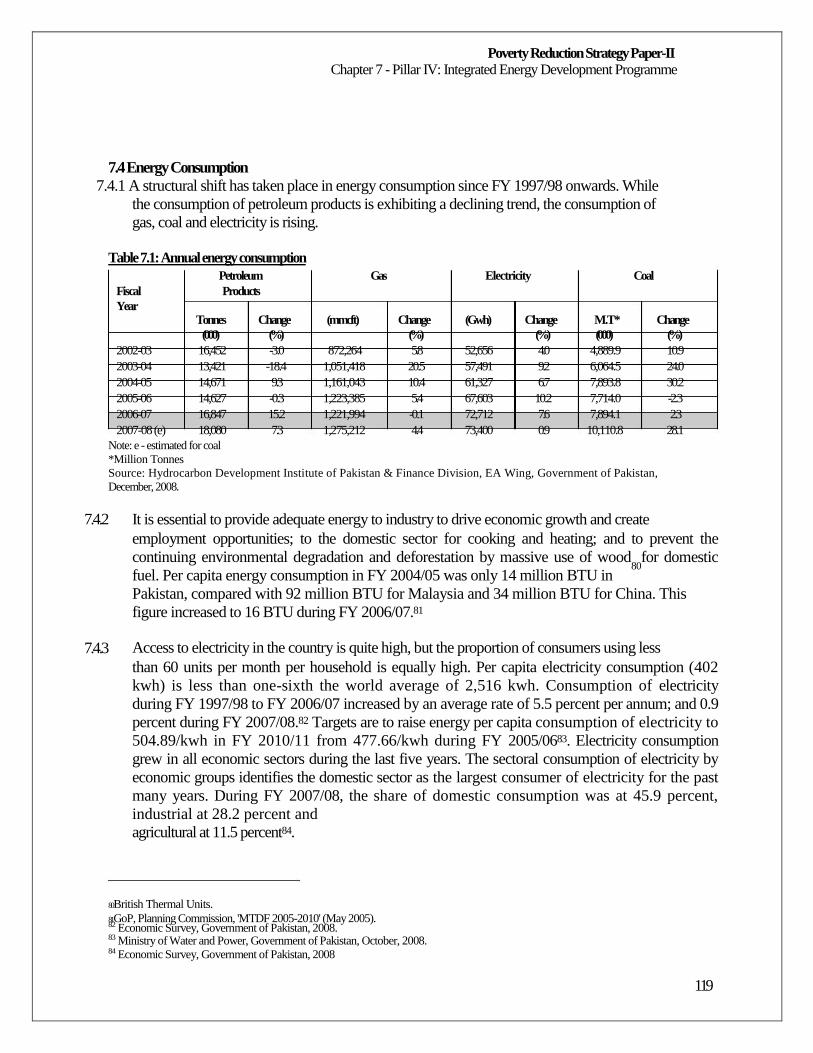
Poverty Reduction Strategy Paper-II Chapter 7 - Pillar IV: Integrated Energy Development Programme
7.4 Energy Consumption
7.4.1 A structural shift has taken place in energy consumption since FY 1997/98 onwards. While
the consumption of petroleum products is exhibiting a declining trend, the consumption of
gas, coal and electricity is rising.
Table 7.1: Annual energy consumption
Petroleum Gas Electricity Coal Fiscal Products Year
Tonnes Change (mmcft) Change (Gwh) Change M.T* Change (000) (%) (%) (%) (000) (%)
2002-03 16,452 -3.0 872,264 5.8 52,656 4.0 4,889.9 10.9 2003-04 13,421 -18.4 1,051,418 20.5 57,491 9.2 6,064.5 24.0 2004-05 14,671 9.3 1,161,043 10.4 61,327 6.7 7,893.8 30.2 2005-06 14,627 -0.3 1,223,385 5.4 67,603 10.2 7,714.0 -2.3 2006-07 16,847 15.2 1,221,994 -0.1 72,712 7.6 7,894.1 2.3 2007-08 (e) 18,080 7.3 1,275,212 4.4 73,400 0.9 10,110.8 28.1
Note: e - estimated for coal *Million Tonnes Source: Hydrocarbon Development Institute of Pakistan & Finance Division, EA Wing, Government of Pakistan, December, 2008.
7.4.2
7.4.3
It is essential to provide adequate energy to industry to drive economic growth and create
employment opportunities; to the domestic sector for cooking and heating; and to prevent the
continuing environmental degradation and deforestation by massive use of wood80
for domestic
fuel. Per capita energy consumption in FY 2004/05 was only 14 million BTU in
Pakistan, compared with 92 million BTU for Malaysia and 34 million BTU for China. This
figure increased to 16 BTU during FY 2006/07.81
Access to electricity in the country is quite high, but the proportion of consumers using less
than 60 units per month per household is equally high. Per capita electricity consumption (402
kwh) is less than one-sixth the world average of 2,516 kwh. Consumption of electricity
during FY 1997/98 to FY 2006/07 increased by an average rate of 5.5 percent per annum; and 0.9
percent during FY 2007/08.82 Targets are to raise energy per capita consumption of electricity to
504.89/kwh in FY 2010/11 from 477.66/kwh during FY 2005/0683. Electricity consumption
grew in all economic sectors during the last five years. The sectoral consumption of electricity by
economic groups identifies the domestic sector as the largest consumer of electricity for the past
many years. During FY 2007/08, the share of domestic consumption was at 45.9 percent,
industrial at 28.2 percent and
agricultural at 11.5 percent84.
80 British Thermal Units. 81 GoP, Planning Commission, 'MTDF 2005-2010' (May 2005). 82 Economic Survey, Government of Pakistan, 2008. 83 Ministry of Water and Power, Government of Pakistan, October, 2008. 84 Economic Survey, Government of Pakistan, 2008
119
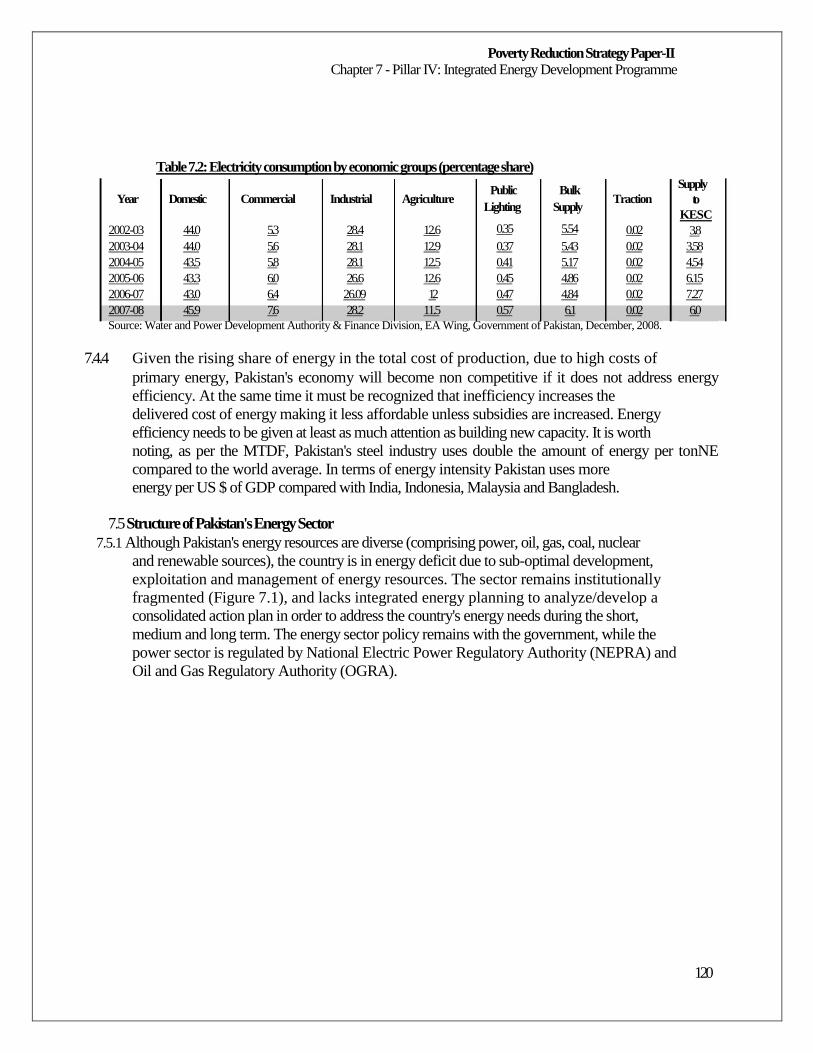
Poverty Reduction Strategy Paper-II Chapter 7 - Pillar IV: Integrated Energy Development Programme
Table 7.2: Electricity consumption by economic groups (percentage share)
Year
2002-03 2003-04 2004-05 2005-06 2006-07 2007-08
Domestic
44.0 44.0 43.5 43.3 43.0 45.9
Commercial
5.3 5.6 5.8 6.0 6.4 7.6
Industrial
28.4 28.1 28.1 26.6
26.09 28.2
Agriculture
12.6 12.9 12.5 12.6 12
11.5
Public Lighting
0.35 0.37 0.41 0.45 0.47 0.57
Bulk Supply
5.54 5.43 5.17 4.86 4.84 6.1
Traction
0.02 0.02 0.02 0.02 0.02 0.02
Supply to
KESC 3.8
3.58 4.54 6.15 7.27 6.0
Source: Water and Power Development Authority & Finance Division, EA Wing, Government of Pakistan, December, 2008.
7.4.4
Given the rising share of energy in the total cost of production, due to high costs of
primary energy, Pakistan's economy will become non competitive if it does not address energy
efficiency. At the same time it must be recognized that inefficiency increases the
delivered cost of energy making it less affordable unless subsidies are increased. Energy
efficiency needs to be given at least as much attention as building new capacity. It is worth
noting, as per the MTDF, Pakistan's steel industry uses double the amount of energy per tonNE
compared to the world average. In terms of energy intensity Pakistan uses more
energy per US $ of GDP compared with India, Indonesia, Malaysia and Bangladesh.
7.5 Structure of Pakistan's Energy Sector
7.5.1 Although Pakistan's energy resources are diverse (comprising power, oil, gas, coal, nuclear
and renewable sources), the country is in energy deficit due to sub-optimal development,
exploitation and management of energy resources. The sector remains institutionally
fragmented (Figure 7.1), and lacks integrated energy planning to analyze/develop a
consolidated action plan in order to address the country's energy needs during the short,
medium and long term. The energy sector policy remains with the government, while the
power sector is regulated by National Electric Power Regulatory Authority (NEPRA) and
Oil and Gas Regulatory Authority (OGRA).
120
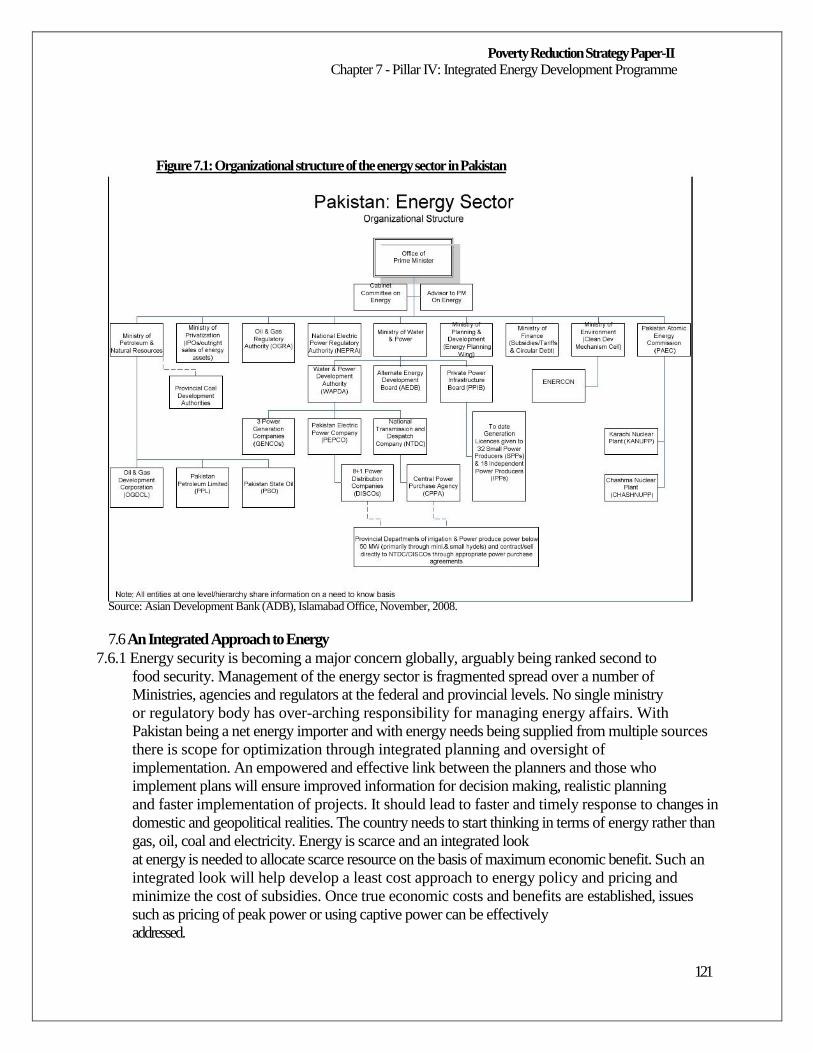
Poverty Reduction Strategy Paper-II Chapter 7 - Pillar IV: Integrated Energy Development Programme
Figure 7.1: Organizational structure of the energy sector in Pakistan
Source: Asian Development Bank (ADB), Islamabad Office, November, 2008.
7.6 An Integrated Approach to Energy
7.6.1 Energy security is becoming a major concern globally, arguably being ranked second to
food security. Management of the energy sector is fragmented spread over a number of
Ministries, agencies and regulators at the federal and provincial levels. No single ministry
or regulatory body has over-arching responsibility for managing energy affairs. With
Pakistan being a net energy importer and with energy needs being supplied from multiple sources
there is scope for optimization through integrated planning and oversight of
implementation. An empowered and effective link between the planners and those who
implement plans will ensure improved information for decision making, realistic planning
and faster implementation of projects. It should lead to faster and timely response to changes in
domestic and geopolitical realities. The country needs to start thinking in terms of energy rather than
gas, oil, coal and electricity. Energy is scarce and an integrated look
at energy is needed to allocate scarce resource on the basis of maximum economic benefit. Such an
integrated look will help develop a least cost approach to energy policy and pricing and
minimize the cost of subsidies. Once true economic costs and benefits are established, issues
such as pricing of peak power or using captive power can be effectively
addressed.
121
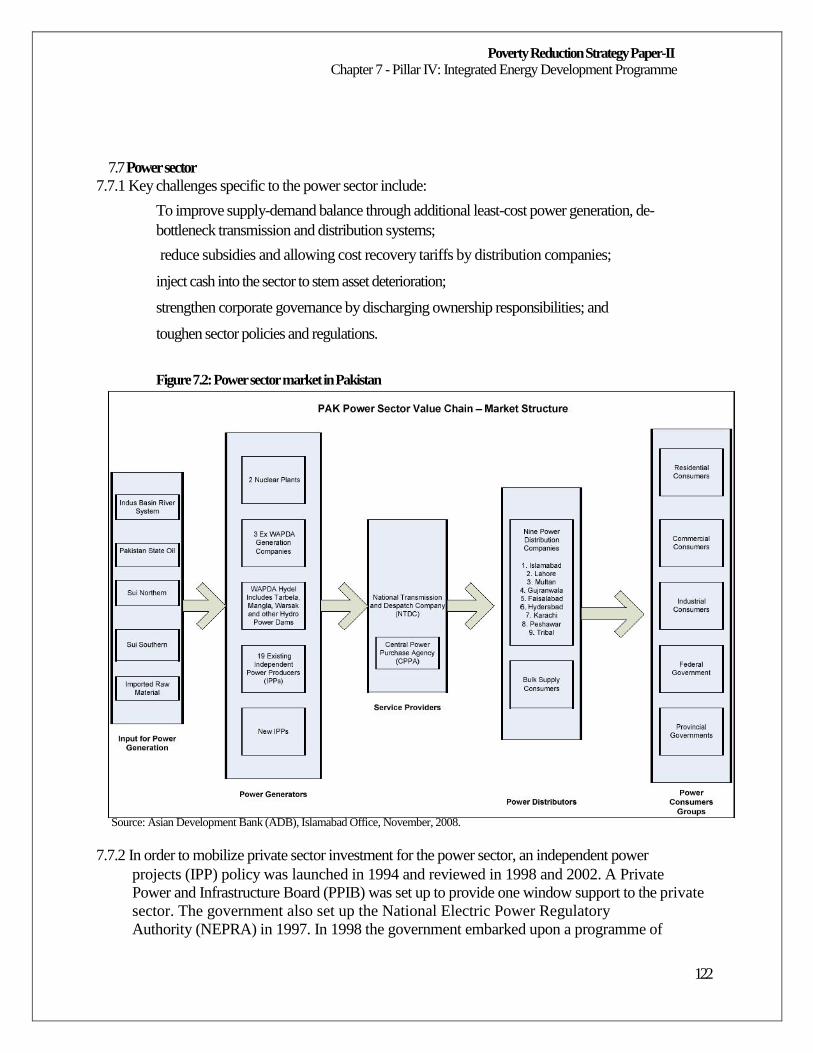
Poverty Reduction Strategy Paper-II Chapter 7 - Pillar IV: Integrated Energy Development Programme
7.7 Power sector
7.7.1 Key challenges specific to the power sector include:
To improve supply-demand balance through additional least-cost power generation, de-
bottleneck transmission and distribution systems;
reduce subsidies and allowing cost recovery tariffs by distribution companies;
inject cash into the sector to stem asset deterioration;
strengthen corporate governance by discharging ownership responsibilities; and
toughen sector policies and regulations.
Figure 7.2: Power sector market in Pakistan
Source: Asian Development Bank (ADB), Islamabad Office, November, 2008.
7.7.2 In order to mobilize private sector investment for the power sector, an independent power
projects (IPP) policy was launched in 1994 and reviewed in 1998 and 2002. A Private
Power and Infrastructure Board (PPIB) was set up to provide one window support to the private
sector. The government also set up the National Electric Power Regulatory
Authority (NEPRA) in 1997. In 1998 the government embarked upon a programme of
122
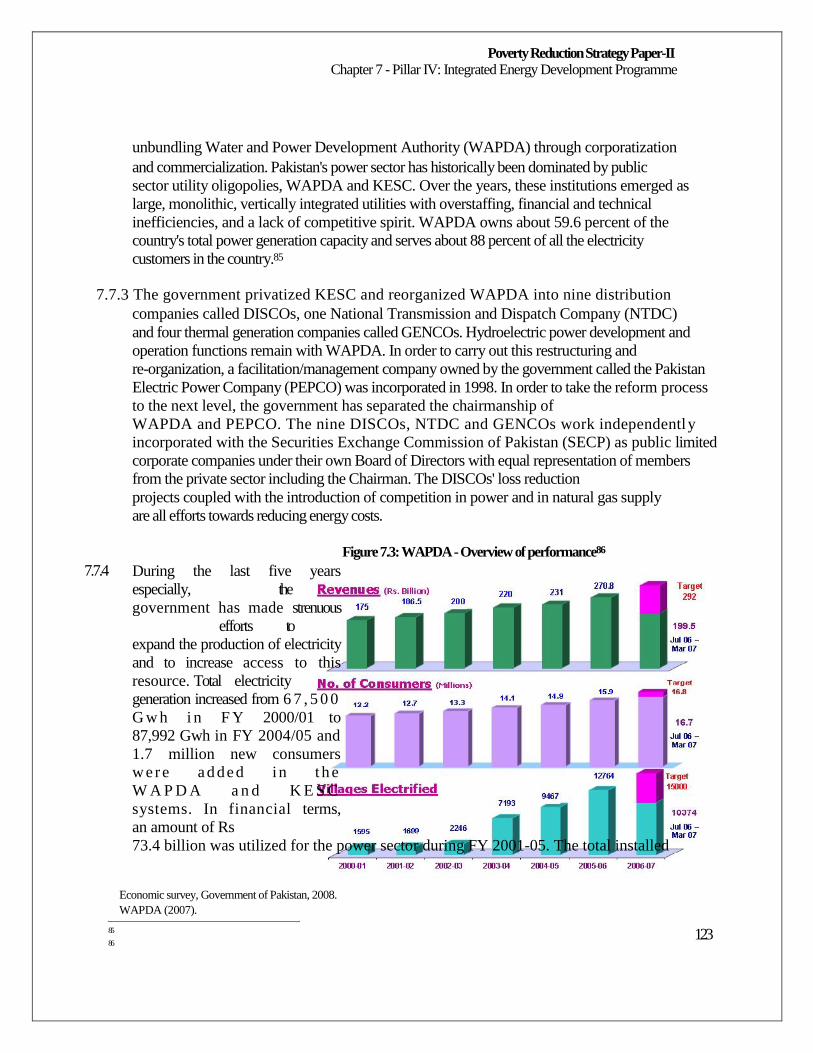
Poverty Reduction Strategy Paper-II Chapter 7 - Pillar IV: Integrated Energy Development Programme
unbundling Water and Power Development Authority (WAPDA) through corporatization
and commercialization. Pakistan's power sector has historically been dominated by public
sector utility oligopolies, WAPDA and KESC. Over the years, these institutions emerged as
large, monolithic, vertically integrated utilities with overstaffing, financial and technical
inefficiencies, and a lack of competitive spirit. WAPDA owns about 59.6 percent of the
country's total power generation capacity and serves about 88 percent of all the electricity
customers in the country.85
7.7.3 The government privatized KESC and reorganized WAPDA into nine distribution
companies called DISCOs, one National Transmission and Dispatch Company (NTDC)
and four thermal generation companies called GENCOs. Hydroelectric power development and
operation functions remain with WAPDA. In order to carry out this restructuring and
re-organization, a facilitation/management company owned by the government called the Pakistan
Electric Power Company (PEPCO) was incorporated in 1998. In order to take the reform process
to the next level, the government has separated the chairmanship of
WAPDA and PEPCO. The nine DISCOs, NTDC and GENCOs work independently
incorporated with the Securities Exchange Commission of Pakistan (SECP) as public limited
corporate companies under their own Board of Directors with equal representation of members
from the private sector including the Chairman. The DISCOs' loss reduction
projects coupled with the introduction of competition in power and in natural gas supply
are all efforts towards reducing energy costs.
Figure 7.3: WAPDA - Overview of performance86
7.7.4
85 86
During the last five years
especially, th e
government has made strenuous
efforts to
expand the production of electricity
and to increase access to this
resource. Total electricity
generation increased from 6 7 , 5 0 0
G w h i n F Y 2000/01 to
87,992 Gwh in FY 2004/05 and
1.7 million new consumers
w e r e ad ded in t h e
W A P D A a n d K E S C
systems. In financial terms,
an amount of Rs
73.4 billion was utilized for the power sector during FY 2001-05. The total installed
Economic survey, Government of Pakistan, 2008. WAPDA (2007).
123
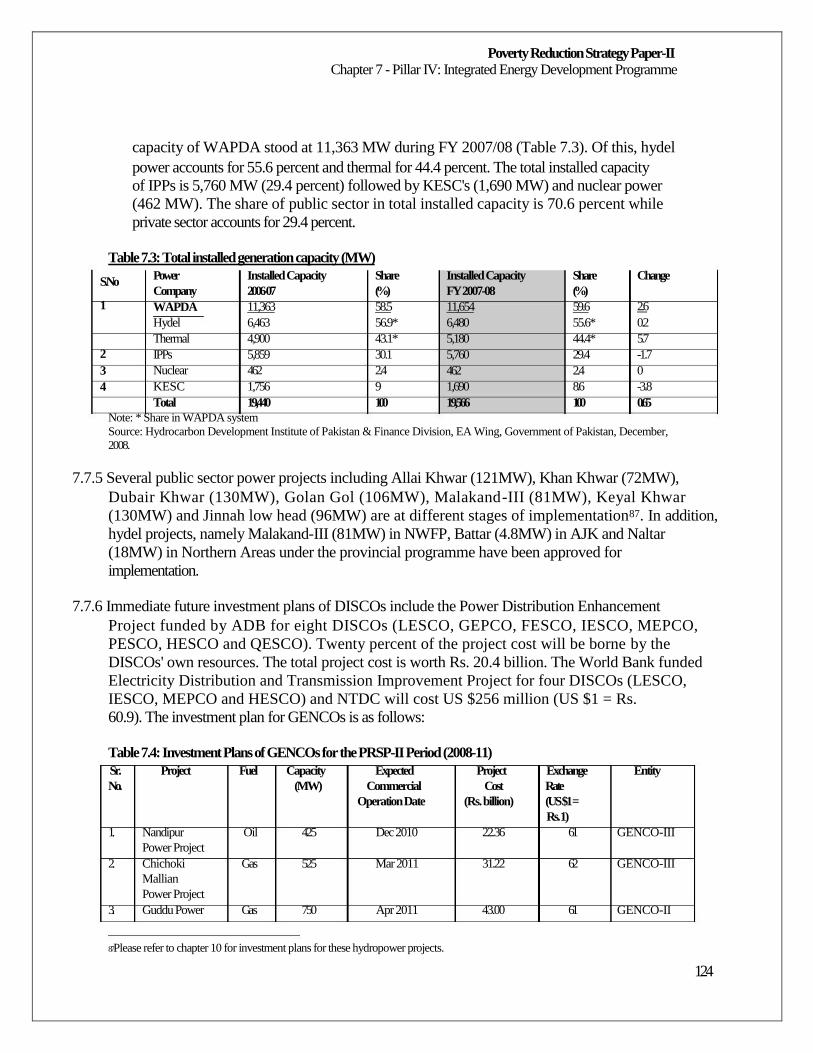
Poverty Reduction Strategy Paper-II Chapter 7 - Pillar IV: Integrated Energy Development Programme
capacity of WAPDA stood at 11,363 MW during FY 2007/08 (Table 7.3). Of this, hydel
power accounts for 55.6 percent and thermal for 44.4 percent. The total installed capacity
of IPPs is 5,760 MW (29.4 percent) followed by KESC's (1,690 MW) and nuclear power
(462 MW). The share of public sector in total installed capacity is 70.6 percent while
private sector accounts for 29.4 percent.
Table 7.3: Total installed generation capacity (MW)
S.No
1
2 3 4
Power Company WAPDA Hydel Thermal IPPs Nuclear KESC Total
Installed Capacity 2006-07 11,363 6,463 4,900 5,859 462 1,756 19,440
Share (%) 58.5 56.9* 43.1* 30.1 2.4 9 100
Installed Capacity FY 2007-08 11,654 6,480 5,180 5,760 462 1,690 19,566
Share (%) 59.6 55.6* 44.4* 29.4 2.4 8.6 100
Change
2.6 0.2 5.7 -1.7 0 -3.8 0.65
Note: * Share in WAPDA system Source: Hydrocarbon Development Institute of Pakistan & Finance Division, EA Wing, Government of Pakistan, December, 2008.
7.7.5 Several public sector power projects including Allai Khwar (121MW), Khan Khwar (72MW),
Dubair Khwar (130MW), Golan Gol (106MW), Malakand-III (81MW), Keyal Khwar
(130MW) and Jinnah low head (96MW) are at different stages of implementation87. In addition,
hydel projects, namely Malakand-III (81MW) in NWFP, Battar (4.8MW) in AJK and Naltar
(18MW) in Northern Areas under the provincial programme have been approved for
implementation.
7.7.6 Immediate future investment plans of DISCOs include the Power Distribution Enhancement
Project funded by ADB for eight DISCOs (LESCO, GEPCO, FESCO, IESCO, MEPCO,
PESCO, HESCO and QESCO). Twenty percent of the project cost will be borne by the
DISCOs' own resources. The total project cost is worth Rs. 20.4 billion. The World Bank funded
Electricity Distribution and Transmission Improvement Project for four DISCOs (LESCO,
IESCO, MEPCO and HESCO) and NTDC will cost US $256 million (US $1 = Rs.
60.9). The investment plan for GENCOs is as follows:
Table 7.4: Investment Plans of GENCOs for the PRSP-II Period (2008-11)
Sr. Project Fuel Capacity Expected Project Exchange Entity No. (MW) Commercial Cost Rate
Operation Date (Rs. billion) (US $1 = Rs. 1)
1. Nandipur Oil 425 Dec 2010 22.36 61 GENCO-III Power Project
2. Chichoki Gas 525 Mar 2011 31.22 62 GENCO-III Mallian Power Project
3. Guddu Power Ga s 750 Apr 2011 43.00 61 GENCO-II
87 Please refer to chapter 10 for investment plans for these hydropower projects.
124
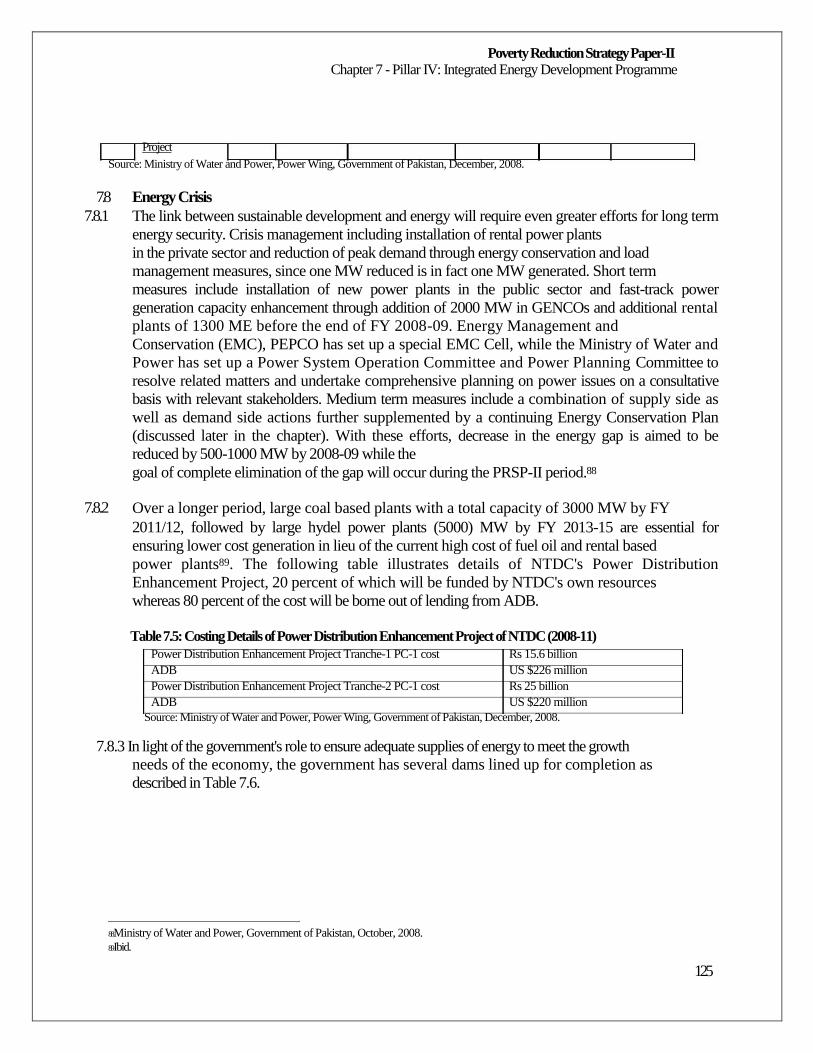
Poverty Reduction Strategy Paper-II Chapter 7 - Pillar IV: Integrated Energy Development Programme
Project Source: Ministry of Water and Power, Power Wing, Government of Pakistan, December, 2008.
7.8
7.8.1
7.8.2
Energy Crisis
The link between sustainable development and energy will require even greater efforts for long term
energy security. Crisis management including installation of rental power plants
in the private sector and reduction of peak demand through energy conservation and load
management measures, since one MW reduced is in fact one MW generated. Short term
measures include installation of new power plants in the public sector and fast-track power
generation capacity enhancement through addition of 2000 MW in GENCOs and additional rental
plants of 1300 ME before the end of FY 2008-09. Energy Management and
Conservation (EMC), PEPCO has set up a special EMC Cell, while the Ministry of Water and
Power has set up a Power System Operation Committee and Power Planning Committee to
resolve related matters and undertake comprehensive planning on power issues on a consultative
basis with relevant stakeholders. Medium term measures include a combination of supply side as
well as demand side actions further supplemented by a continuing Energy Conservation Plan
(discussed later in the chapter). With these efforts, decrease in the energy gap is aimed to be
reduced by 500-1000 MW by 2008-09 while the
goal of complete elimination of the gap will occur during the PRSP-II period.88
Over a longer period, large coal based plants with a total capacity of 3000 MW by FY
2011/12, followed by large hydel power plants (5000) MW by FY 2013-15 are essential for
ensuring lower cost generation in lieu of the current high cost of fuel oil and rental based
power plants89. The following table illustrates details of NTDC's Power Distribution
Enhancement Project, 20 percent of which will be funded by NTDC's own resources
whereas 80 percent of the cost will be borne out of lending from ADB.
Table 7.5: Costing Details of Power Distribution Enhancement Project of NTDC (2008-11) Power Distribution Enhancement Project Tranche-1 PC-1 cost Rs 15.6 billion ADB US $226 million Power Distribution Enhancement Project Tranche-2 PC-1 cost Rs 25 billion ADB US $220 million
Source: Ministry of Water and Power, Power Wing, Government of Pakistan, December, 2008.
7.8.3 In light of the government's role to ensure adequate supplies of energy to meet the growth
needs of the economy, the government has several dams lined up for completion as
described in Table 7.6.
88 Ministry of Water and Power, Government of Pakistan, October, 2008. 89 Ibid.
125
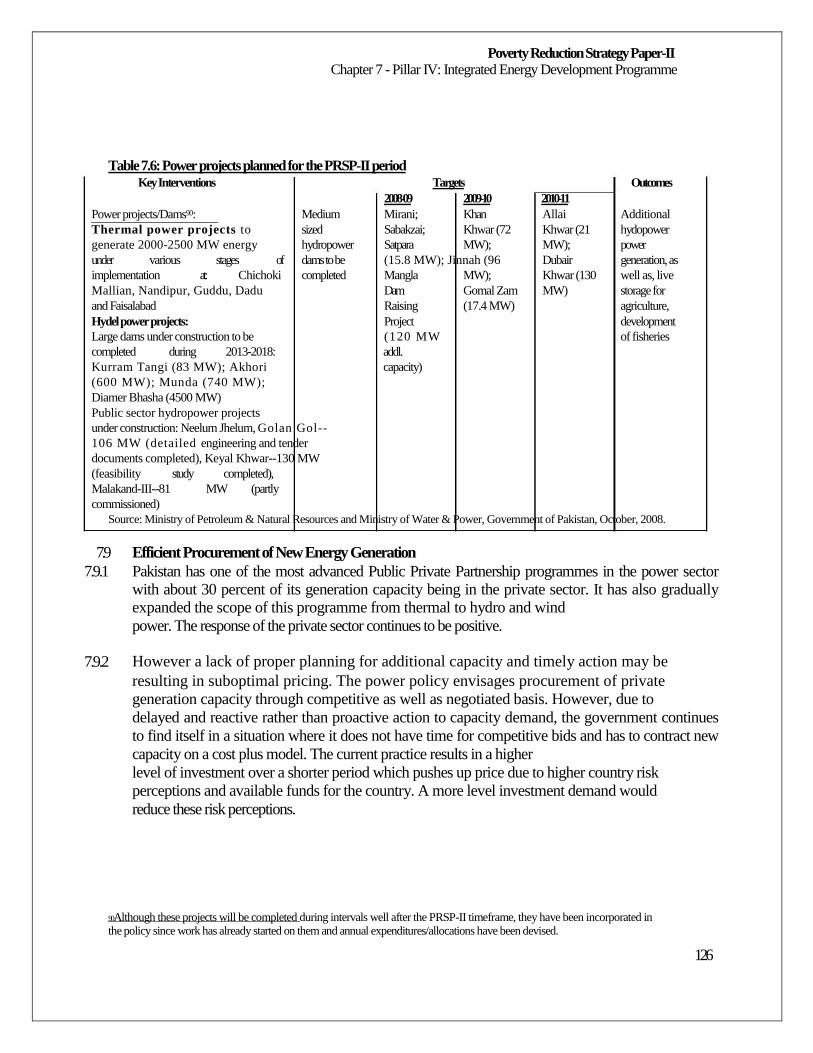
Poverty Reduction Strategy Paper-II Chapter 7 - Pillar IV: Integrated Energy Development Programme
Table 7.6: Power projects planned for the PRSP-II period Key Interventions Targets Outcomes
2008-09 2009-10 2010-11 Power projects/Dams90: Medium Mirani; Khan Allai Additional
Thermal power projects to sized Sabakzai; Khwar (72 Khwar (21 hydopower generate 2000-2500 MW energy hydropower Satpara MW); MW); power
under various stages of dams to be (15.8 MW); Jinnah (96 Dubair generation, as
implementation at: Chichoki completed Mangla MW); Khwar (130 well as, live
Mallian, Nandipur, Guddu, Dadu Dam Gomal Zam MW) storage for and Faisalabad Raising (17.4 MW) agriculture, Hydel power projects: Project development Large dams under construction to be (120 MW of fisheries completed during 2013-2018: addl. Kurram Tangi (83 MW); Akhori capacity) (600 MW); Munda (740 MW); Diamer Bhasha (4500 MW) Public sector hydropower projects under construction: Neelum Jhelum, Golan Gol--
106 MW (detailed engineering and tender
documents completed), Keyal Khwar--130 MW (feasibility study completed), Malakand-III--81 MW (partly commissioned)
Source: Ministry of Petroleum & Natural Resources and Ministry of Water & Power, Government of Pakistan, October, 2008.
7.9
7.9.1
7.9.2
Efficient Procurement of New Energy Generation
Pakistan has one of the most advanced Public Private Partnership programmes in the power sector with about 30 percent of its generation capacity being in the private sector. It has also gradually expanded the scope of this programme from thermal to hydro and wind
power. The response of the private sector continues to be positive.
However a lack of proper planning for additional capacity and timely action may be
resulting in suboptimal pricing. The power policy envisages procurement of private
generation capacity through competitive as well as negotiated basis. However, due to
delayed and reactive rather than proactive action to capacity demand, the government continues
to find itself in a situation where it does not have time for competitive bids and has to contract new
capacity on a cost plus model. The current practice results in a higher
level of investment over a shorter period which pushes up price due to higher country risk
perceptions and available funds for the country. A more level investment demand would
reduce these risk perceptions.
90 Although these projects will be completed during intervals well after the PRSP-II timeframe, they have been incorporated in the policy since work has already started on them and annual expenditures/allocations have been devised.
126
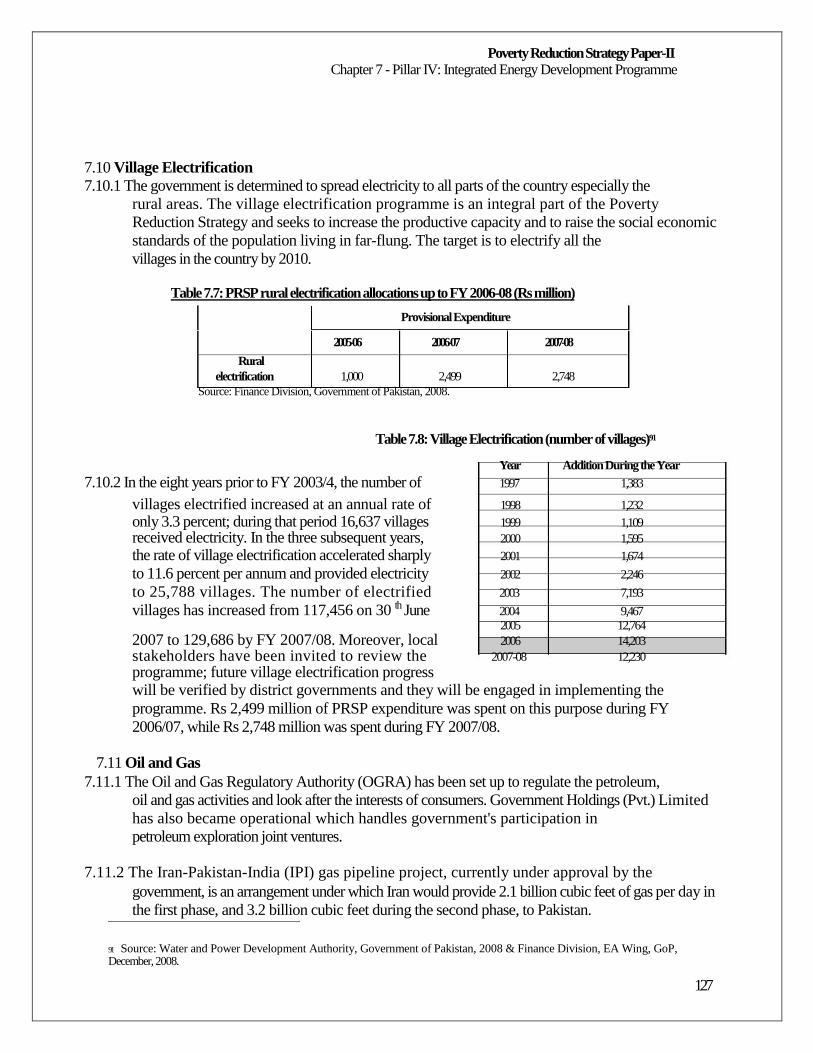
Poverty Reduction Strategy Paper-II Chapter 7 - Pillar IV: Integrated Energy Development Programme
7.10 Village Electrification
7.10.1 The government is determined to spread electricity to all parts of the country especially the
rural areas. The village electrification programme is an integral part of the Poverty
Reduction Strategy and seeks to increase the productive capacity and to raise the social economic
standards of the population living in far-flung. The target is to electrify all the
villages in the country by 2010.
Table 7.7: PRSP rural electrification allocations up to FY 2006-08 (Rs million)
Provisional Expenditure
2005-06 2006-07 2007-08
Rural electrification 1,000 2,499 2,748
Source: Finance Division, Government of Pakistan, 2008.
Table 7.8: Village Electrification (number of villages)91
Year Addition During the Year 7.10.2 In the eight years prior to FY 2003/4, the number of 1997 1,383
villages electrified increased at an annual rate of 1998 1,232 only 3.3 percent; during that period 16,637 villages 1999 1,109 received electricity. In the three subsequent years, 2000 1,595 the rate of village electrification accelerated sharply 2001 1,674
to 11.6 percent per annum and provided electricity 2002 2,246
to 25,788 villages. The number of electrified 2003 7,193
villages has increased from 117,456 on 30 th June 2004 9,467 2005 12,764
2007 to 129,686 by FY 2007/08. Moreover, local 2006 14,203 stakeholders have been invited to review the 2007-08 12,230 programme; future village electrification progress will be verified by district governments and they will be engaged in implementing the
programme. Rs 2,499 million of PRSP expenditure was spent on this purpose during FY
2006/07, while Rs 2,748 million was spent during FY 2007/08.
7.11 Oil and Gas
7.11.1 The Oil and Gas Regulatory Authority (OGRA) has been set up to regulate the petroleum,
oil and gas activities and look after the interests of consumers. Government Holdings (Pvt.) Limited
has also became operational which handles government's participation in
petroleum exploration joint ventures.
7.11.2 The Iran-Pakistan-India (IPI) gas pipeline project, currently under approval by the
government, is an arrangement under which Iran would provide 2.1 billion cubic feet of gas per day in
the first phase, and 3.2 billion cubic feet during the second phase, to Pakistan.
91 Source: Water and Power Development Authority, Government of Pakistan, 2008 & Finance Division, EA Wing, GoP, December, 2008.
127
Poverty Reduction Strategy Paper-II Chapter 7 - Pillar IV: Integrated Energy Development Programme
The construction work of the pipeline, worth approximately US $3 billion, will begin next
year, while the first gas delivery is expected in 2012. Regional linkages will be established
and possibilities explored for importing power from Central Asian Countries. Current
linkages with Iran will be expanded for importing power particularly in remote areas of
Balochistan.
7.11.3 In order to augment the transmission system of gas utilities, the Gas Infrastructure
Development Project has been completed. About 1 billion cubic feet of gas per day was injected
into the system for supply to both the power sector and industry. Moreover work
on the 817 km cross-country White Oil Pipeline has also been completed. Utilization of
Compressed Natural Gas (CNG) was encouraged in the transport sector to improve urban air
quality and reduce carbon emissions. About 650,000 vehicles would be converted on
CNG. The Government issued directives to promote CNG in the transport sector as an
alternate fuel. About 700 CNG stations are aimed to be established in different parts of the country.
The use of CNG would be expanded as about 100,000 cars and 10,000 buses
would be added every year to the existing stock of the country. A programme of dedicated
CNG city buses would be undertaken, initially in federal and provincial capitals, and
subsequently, the programme will be extended to other urban centres.
7.11.4 The main objectives of the CNG Policy, initiated by the government in 2007 are: to
encourage CNG as a substitute of liquid fuel to reduce import bill; to provide cheaper and
environmental friendly fuel; to discourage mushrooming growth of CNG outlets, with the
announcement that there should be at least one km distance between two CNG stations; enforcing
better industry discipline & safety culture in the CNG sector; introducing CNG technology for
import of natural gas; using CNG for town gasification where supply of pipeline gas is not
viable. Other gas initiatives include the Underground Gas Storages (UGS) Project. The ultimate
goal of these efforts is: to increase exploration and production of crude oil, coal and gas; enhance
the number of wells drilled; increase the use of Liquefied Petroleum Gas (LPG) supply
(tonnes/day) to overcome energy shortage; and to
promote the use of CNG in the transport sector as an alternate fuel.
7.12 Petroleum Exploration and Production (E&P) Policy 2008
7.12.1 The Government of Pakistan (GoP) is committed to accelerate an exploration and
development programme in order to reverse the decline in crude oil production, to increase
the domestic gas production and supply and to reduce the burden of imported energy which otherwise
will have adverse effect on the balance of payments & trade. The Petroleum Exploration and
Production (E&P) Policy, initially approved by the government in November, 2007,
unfortunately could not take off due to the following reasons; seismic and E&P work could not be
undertaken in new areas to assess potential due to the law and order situation in the prospective areas
particularly Balochistan and NWFP provinces, and
the non-availability of rigs in the country. However, the Ministry of Petroleum has
prepared a new Petroleum (E&P) Policy, 2008, which has been circulated to the relevant
128
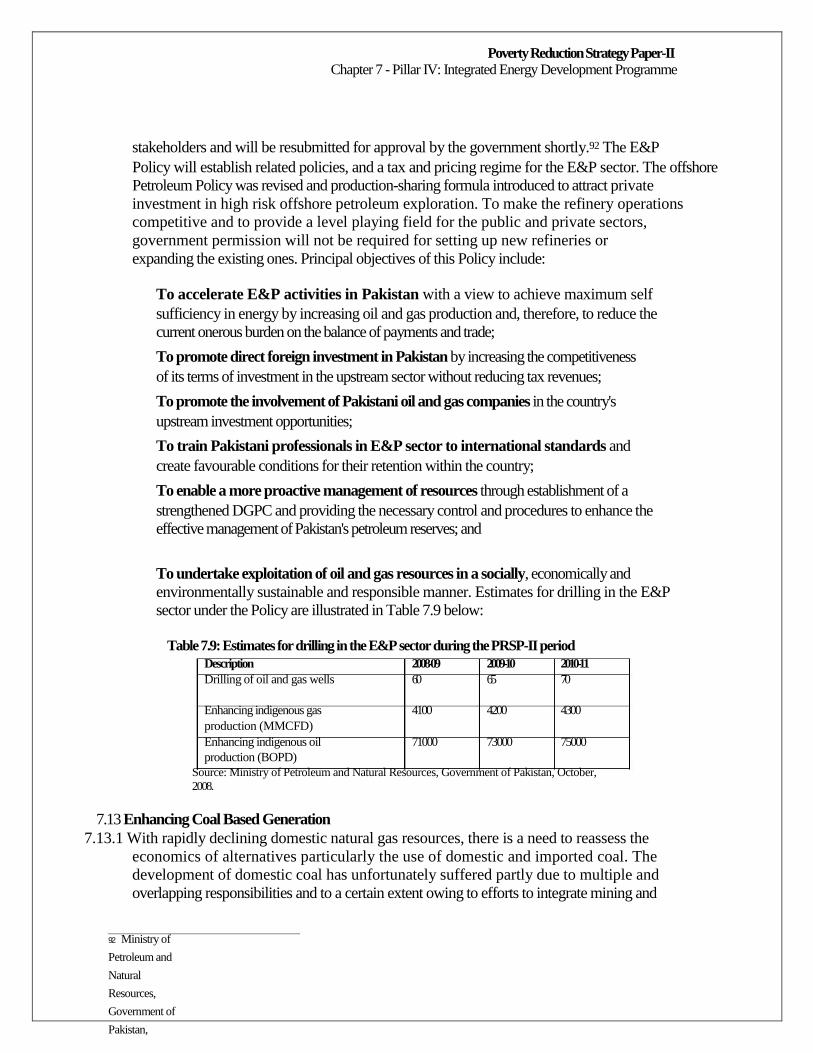
Poverty Reduction Strategy Paper-II Chapter 7 - Pillar IV: Integrated Energy Development Programme
stakeholders and will be resubmitted for approval by the government shortly.92 The E&P
Policy will establish related policies, and a tax and pricing regime for the E&P sector. The offshore
Petroleum Policy was revised and production-sharing formula introduced to attract private
investment in high risk offshore petroleum exploration. To make the refinery operations
competitive and to provide a level playing field for the public and private sectors,
government permission will not be required for setting up new refineries or
expanding the existing ones. Principal objectives of this Policy include:
To accelerate E&P activities in Pakistan with a view to achieve maximum self
sufficiency in energy by increasing oil and gas production and, therefore, to reduce the
current onerous burden on the balance of payments and trade;
To promote direct foreign investment in Pakistan by increasing the competitiveness
of its terms of investment in the upstream sector without reducing tax revenues;
To promote the involvement of Pakistani oil and gas companies in the country's
upstream investment opportunities;
To train Pakistani professionals in E&P sector to international standards and
create favourable conditions for their retention within the country;
To enable a more proactive management of resources through establishment of a
strengthened DGPC and providing the necessary control and procedures to enhance the
effective management of Pakistan's petroleum reserves; and
To undertake exploitation of oil and gas resources in a socially, economically and
environmentally sustainable and responsible manner. Estimates for drilling in the E&P
sector under the Policy are illustrated in Table 7.9 below:
Table 7.9: Estimates for drilling in the E&P sector during the PRSP-II period
Description 2008-09 2009-10 2010-11 Drilling of oil and gas wells 60 65 70
Enhancing indigenous gas 4100 4200 4300 production (MMCFD) Enhancing indigenous oil 71000 73000 75000 production (BOPD)
Source: Ministry of Petroleum and Natural Resources, Government of Pakistan, October, 2008.
7.13 Enhancing Coal Based Generation
7.13.1 With rapidly declining domestic natural gas resources, there is a need to reassess the
economics of alternatives particularly the use of domestic and imported coal. The
development of domestic coal has unfortunately suffered partly due to multiple and
overlapping responsibilities and to a certain extent owing to efforts to integrate mining and
92 Ministry of
Petroleum and
Natural
Resources,
Government of
Pakistan,

Islamabad,
October, 2008.
129
Poverty Reduction Strategy Paper-II Chapter 7 - Pillar IV: Integrated Energy Development Programme
power production. At the same time, imported coal was seen as a replacement for domestic
coal and thus not encouraged when in reality imported coal is a substitute for imported oil
and both domestic and imported coal are needed if Pakistan's cost of power generation is to
be competitive. Countries like China and India have also entered the international coal
market to ensure long term supplies as part of their energy security plan. It may be noted that the
world's coal reserves to production ratio are 5 times that of oil and three times that
of natural gas.93 Pakistan's initiative of starting work on 2000 MW based on imported coal is in the
right direction and it needs to build further on this initiative. Development of domestic coal
should be addressed in a more systematic manner including the option of
segregating mining from power generation where initial cost of mining development may
be high as in the case of Thar. Enhanced use of coal would not only diversify Pakistan's fuel base
but will also reduce the cost of power generation and improve the country's
competitiveness.
7.14 Energy Conservation Programme
7.14.1 An energy conservation programme will be undertaken including enactment of necessary
laws by Ministry of Science and Technology and ENERCON (National Energy
Conservation Centre, Ministry of Environment), for energy efficient building designs, use and
manufacturing of energy efficient appliances. Co-generation technologies to conserve energy
would be promoted. ENERCON would develop a mechanism to monitor strict
compliance of energy conservation laws. The power sector is one of the major contributors of
emission of greenhouse gases accounting for over 80 percent of total carbondioxide
(CO2) emission. The main source of these emissions is due to heavy use of fuel oil in power
generation. During the MTDF period (2005-10), conversion of existing thermal
power stations from 94
uel oil to natural gas would substantially reduce the CO2 and f
particulate emission. It is estimated by National Energy Conservation Centre
(ENERCON) that energy conversion and implementation of low cost and medium cost
measures at the national scale can bring about a saving of around 250,000 tonnes of oil
equivalent i.e. an estimated saving of about Rs. 4 billion per annum. The cost of retrofit
measures would only be a fraction of the cost of these savings. The Pakistan Council of
Renewable Energy Technologies (PCRET) has also designed five types of efficient
cooking stoves suitable for rural areas. These cooking stoves, which provide fuel saving
against traditional stoves in the range of 25 to 45 percent, would also be marketed.
7.14.2 Pakistan is responding to its energy development challenge by pursuing a wide range of
domestic and imported energy options. These include import of gas as LNG and through pipeline
and import of power from Central Asia & Iran. At the same time, development of
significant but challenging Thar coal is being pursued. In addition, two 1000 MW private sector
power generation projects based on imported coal, are also at advanced feasibility
stages. A number of Independent Power Projects (IPPs) projects have been contracted and are in
different stages of development. The Government has also come out with a new
93 Asian Development Board (ADB), Islamabad Office, November, 2008. 94 GoP, Planning Commission, 'MTDF 2005-2010' (May 2005).
130
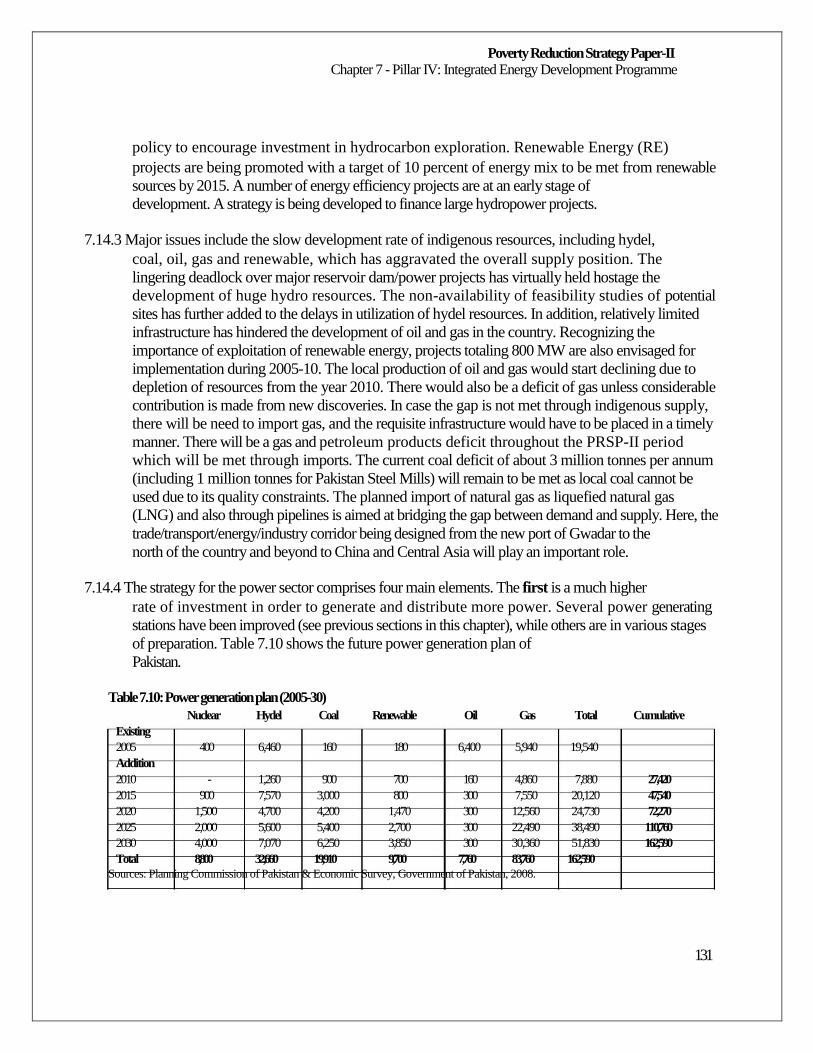
Poverty Reduction Strategy Paper-II Chapter 7 - Pillar IV: Integrated Energy Development Programme
policy to encourage investment in hydrocarbon exploration. Renewable Energy (RE)
projects are being promoted with a target of 10 percent of energy mix to be met from renewable
sources by 2015. A number of energy efficiency projects are at an early stage of
development. A strategy is being developed to finance large hydropower projects.
7.14.3 Major issues include the slow development rate of indigenous resources, including hydel,
coal, oil, gas and renewable, which has aggravated the overall supply position. The
lingering deadlock over major reservoir dam/power projects has virtually held hostage the
development of huge hydro resources. The non-availability of feasibility studies of potential
sites has further added to the delays in utilization of hydel resources. In addition, relatively limited
infrastructure has hindered the development of oil and gas in the country. Recognizing the
importance of exploitation of renewable energy, projects totaling 800 MW are also envisaged for
implementation during 2005-10. The local production of oil and gas would start declining due to
depletion of resources from the year 2010. There would also be a deficit of gas unless considerable
contribution is made from new discoveries. In case the gap is not met through indigenous supply,
there will be need to import gas, and the requisite infrastructure would have to be placed in a timely
manner. There will be a gas and petroleum products deficit throughout the PRSP-II period
which will be met through imports. The current coal deficit of about 3 million tonnes per annum
(including 1 million tonnes for Pakistan Steel Mills) will remain to be met as local coal cannot be
used due to its quality constraints. The planned import of natural gas as liquefied natural gas
(LNG) and also through pipelines is aimed at bridging the gap between demand and supply. Here, the
trade/transport/energy/industry corridor being designed from the new port of Gwadar to the
north of the country and beyond to China and Central Asia will play an important role.
7.14.4 The strategy for the power sector comprises four main elements. The first is a much higher
rate of investment in order to generate and distribute more power. Several power generating
stations have been improved (see previous sections in this chapter), while others are in various stages
of preparation. Table 7.10 shows the future power generation plan of
Pakistan.
Table 7.10: Power generation plan (2005-30)
Nuclear Hydel Coal Renewable Oil Gas Total Cumulative Existing 2005 400 6,460 160 180 6,400 5,940 19,540 Addition 2010 - 1,260 900 700 160 4,860 7,880 27,420 2015 900 7,570 3,000 800 300 7,550 20,120 47,540 2020 1,500 4,700 4,200 1,470 300 12,560 24,730 72,270 2025 2,000 5,600 5,400 2,700 300 22,490 38,490 110,760 2030 4,000 7,070 6,250 3,850 300 30,360 51,830 162,590 Total 8,800 32,660 19,910 9,700 7,760 83,760 162,590
Sources: Planning Commission of Pakistan & Economic Survey, Government of Pakistan, 2008.
131
Poverty Reduction Strategy Paper-II Chapter 7 - Pillar IV: Integrated Energy Development Programme
7.14.5 To overcome the growing shortage of electricity; gas, oil and coal-based power generation
can help Pakistan to meet its requirements in the short-to-medium-term. Due to escalating
oil prices and shortage of gas supply, coal-based electricity generation is the best option as Pakistan
possesses 185 billion tonnes of coal reserves. The government has planned for transmission of
an additional 2,200 MW within a period of 12 months by April 2009.
These projects comprise 81 MW of hydel a95
1,007 MW of thermal power in the public nd
sector and 1,020 MW in the private sector. The government has also launched effective
conservation measures which include distribution of 10 million energy saver bulbs to
consumers. These measures are expected to save about 1,000 MW at peak hours. In the medium
term, small hydro dam projects can make significant contribution to the national energy supply,
while in the long run hydel power generation and alternative renewable
energy can solve these problems.
7.14.6 The second element in the Strategy relates to finance. The total investment for the power
sector during the MTDF is estimated at Rs 1102 billion, and of which the government expects
to mobilize Rs 445 billion from the private sector. The overall investment level will be kept
under constant review, and in case the private sector falls short of mobilizing
expected resources, the government is prepar96
a contingency strategy that includes, inter ing
alia, offering enhanced sovereign guarantees.
7.14.7 Certain strategic actions need to be taken in parallel and on a priority basis to arrest energy
shortages and to support related initiatives since the energy sector requires huge financial resources.
There are limits to raising funds against the government's contingent liability and steps are required
to strengthen the revenue and cash flows of the sector entities and improve their credit ratings. This
financial weakness has placed an unsustainable burden on the government's budgetary position,
impacting the entire economy. The government's initiative in encouraging Public Private
Partnerships is the right step in this direction. The
success in attracting private investment to a certain extent is dependent on the financial strength
of the contracting public sector given its tendency to cause delays and attempt
partial implementation of necessary and agreed reforms. In the power sector distribution
companies have not been able to charge cost recovery rates, whereas generation companies and IPPs
have had real cost adjustments for their tariffs. The deficit amount is covered by
the government as a subsidy to electricity customers. However, the total cost of this
subsidy, along with the subsidy in tariffs is not sustainable.97 Alongside, the government is
encumbered with liabilities to oil companies for differential between the regulator approved
prices and consumer prices on petroleum products. The absorption of the increase in oil prices by the
government is straining its budgetary position and negatively impacting the ability of the public
sector to carry out necessary capital and attract private investments. The recent adjustment to
petroleum prices and electricity tariffs is a step in the right
95 Finance Division, Corporate Finance Wing, Government of Pakistan, December, 2008. 96 This is keeping in mind the limit of state guarantees needing to be below 2 percent of GDP annually by law and the planned
PPPs in others areas generating contingent liabilities. Source: MTDF (2005-10), Planning Commission, Government of Pakistan. 97 Source: Asian Development Bank (ADB), Islamabad Office, November, 2008.
132
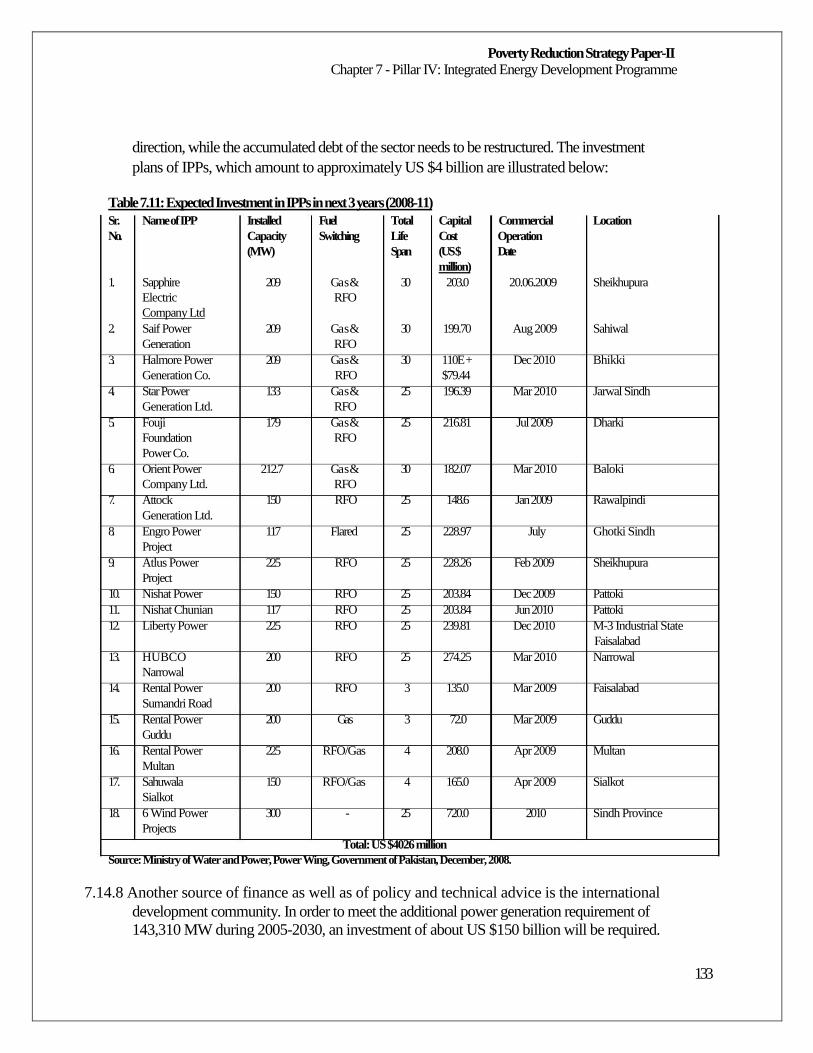
Poverty Reduction Strategy Paper-II Chapter 7 - Pillar IV: Integrated Energy Development Programme
direction, while the accumulated debt of the sector needs to be restructured. The investment
plans of IPPs, which amount to approximately US $4 billion are illustrated below:
Table 7.11: Expected Investment in IPPs in next 3 years (2008-11)
Sr. Name of IPP Installed Fuel Total Capital Commercial Location No. Capacity Switching Life Cost Operation
(MW) Span (US $ Date million)
1. Sapphire 209 Ga s & 30 203.0 20.06.2009 Sheikhupura Electric RFO Company Ltd
2. Saif Power 209 Ga s & 30 199.70 Aug 2009 Sahiwal Generation RFO
3. Halmore Power 209 Ga s & 30 110E + Dec 2010 Bhikki Generation Co. RFO $79.44
4. Star Power 133 Ga s & 25 196.39 Mar 2010 Jarwal Sindh Generation Ltd. RFO
5. Fouji 179 Ga s & 25 216.81 Jul 2009 Dharki Foundation RFO Power Co.
6. Orient Power 212.7 Ga s & 30 182.07 Mar 2010 Baloki Company Ltd. RFO
7. Attock 150 RFO 25 148.6 Jan 2009 Rawalpindi Generation Ltd.
8. Engro Power 117 Flared 25 228.97 July Ghotki Sindh Project
9. Atlus Power 225 RFO 25 228.26 Feb 2009 Sheikhupura Project
10. Nishat Power 150 RFO 25 203.84 Dec 2009 Pattoki 11. Nishat Chunian 117 RFO 25 203.84 Jun 2010 Pattoki 12. Liberty Power 225 RFO 25 239.81 Dec 2010 M-3 Industrial State
Faisalabad 13. HUBCO 200 RFO 25 274.25 Mar 2010 Narrowal
Narrowal 14. Rental Power 200 RFO 3 135.0 Mar 2009 Faisalabad
Sumandri Road 15. Rental Power 200 Ga s 3 72.0 Mar 2009 Guddu
Guddu 16. Rental Power 225 RFO/Gas 4 208.0 Apr 2009 Multan
Multan 17. Sahuwala 150 RFO/Gas 4 165.0 Apr 2009 Sialkot
Sialkot 18. 6 Wind Power 300 - 25 720.0 2010 Sindh Province
Projects
Total: US $4026 million Source: Ministry of Water and Power, Power Wing, Government of Pakistan, December, 2008.
7.14.8 Another source of finance as well as of policy and technical advice is the international
development community. In order to meet the additional power generation requirement of
143,310 MW during 2005-2030, an investment of about US $150 billion will be required.
133
Poverty Reduction Strategy Paper-II Chapter 7 - Pillar IV: Integrated Energy Development Programme
The average government investment per year is planned at US $2 billion, with the balance
of US $4 billion per year met through international development agencies and the private
sector (including through BOT projects and Public Private Partnerships).
Box 7.1: Private Sector Investments -- Potential Pipeline The Asian Development Bank is Pakistan's single largest development partner in the energy sector followed by the World Bank and JBIC and has strong presence (through investment projects and analytical and project preparatory assistance) across the power supply chain in the country.
(i) Axor/Dawood Wind Power Project: The project will be a 50-MW wind power IPP in Southern Sindh. Tariff for the project has been notified and the project's CCP stands approved.
(ii) Rajdhani Power Project: Hydro IPP following ADB's participation in the New Bong Escape Hydro IPP. No major environmental risks.
(iii) LNG Project: Integrated LNG project for supplying gas to Sui Southern Gas Company distribution network.
(iv) Landhi Cattle Colony Biofuel Project: Involves converting (currently polluting) dung from 400,000 cows to 25MW of electric power, 2,000tpd of fertilizer, and 1.1 mtpa of carbon emission credits. The cost of the project is US $100 million. The project is currently in pilot stages.
Source: Asian Development Bank (ADB), Islamabad Office, November, 2008.
7.14.9 The third prong in the strategy is strengthening of institutions. Public Sector companies
such as Sui Northern Gas Pipelines Ltd (SNGPL), Sui Southern Gas Company Ltd
(SSGCL) and other energy sector entities will be privatized during FY 2009/10.98
7.14.10 In 1998 the government unbundled WAPDA, splitting it into companies that are expected
to be leaner and more agile in responding to changing circumstances. However, the
successor companies have not yet been given financial autonomy, and WAPDA continues to
tightly manage the affairs of the power sector. The main efforts during the PRSP, therefore,
will be directed towards deepening sector structural reforms by enhancing the corporate
autonomy of WAPDA's successor companies (especially in distribution). In particular, the
government will transfer all responsibilities for financial management of sector revenues from
consumers and the government budget (in the form of subsidies) to
the distribution companies. Other objectives of the strategy are to strengthen the
management and operation of the wholesale market, and to improve sector governance and regulation
in order to increase the efficiency of the sector. One way of doing this could be
to reduce peak loads by shifting usages from peak to of-peak times and thereby deferring
construction of new facilities. This shift could be achieved through the use of time-of-day
or seasonal tariffs.
7.14.11The fourth critical element in the government's strategy is to diversify the energy mix.
Pakistan's energy sources include hydropower, coal, oil and gas, uranium, and alternate
98 Privatization Commission, Government of Pakistan, 2008.
134
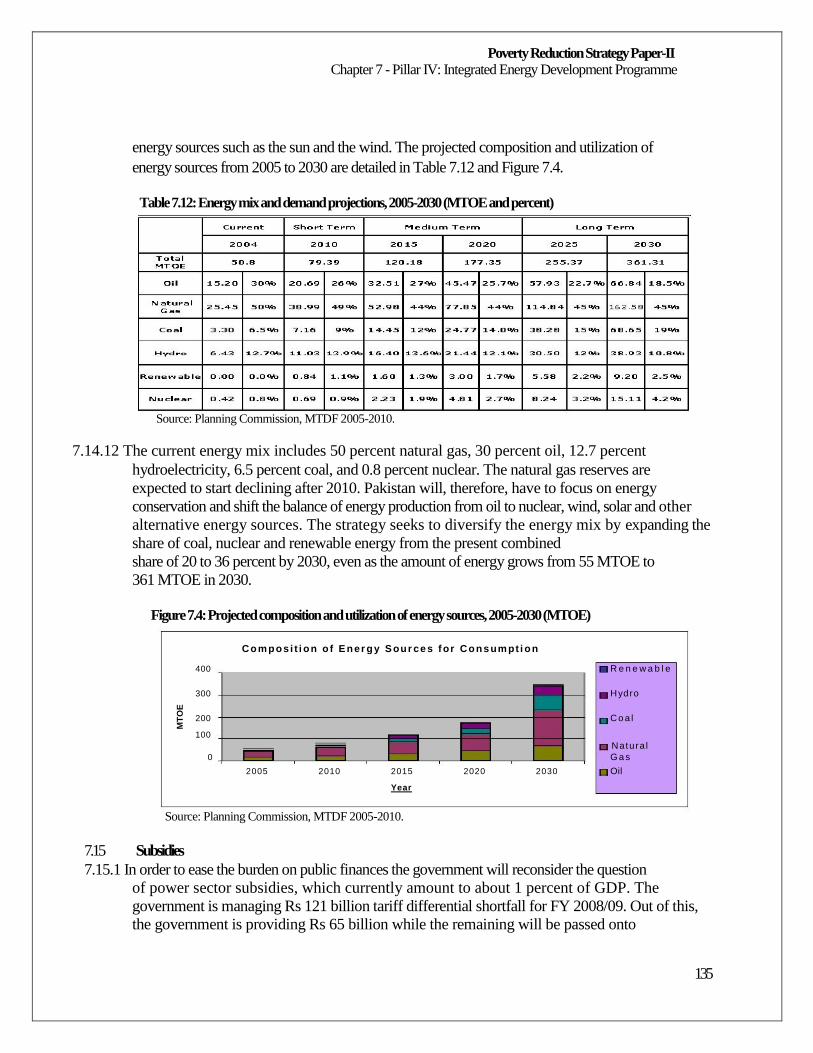
Poverty Reduction Strategy Paper-II Chapter 7 - Pillar IV: Integrated Energy Development Programme
energy sources such as the sun and the wind. The projected composition and utilization of
energy sources from 2005 to 2030 are detailed in Table 7.12 and Figure 7.4.
Table 7.12: Energy mix and demand projections, 2005-2030 (MTOE and percent)
Source: Planning Commission, MTDF 2005-2010.
7.14.12 The current energy mix includes 50 percent natural gas, 30 percent oil, 12.7 percent
hydroelectricity, 6.5 percent coal, and 0.8 percent nuclear. The natural gas reserves are
expected to start declining after 2010. Pakistan will, therefore, have to focus on energy
conservation and shift the balance of energy production from oil to nuclear, wind, solar and other
alternative energy sources. The strategy seeks to diversify the energy mix by expanding the
share of coal, nuclear and renewable energy from the present combined
share of 20 to 36 percent by 2030, even as the amount of energy grows from 55 MTOE to
361 MTOE in 2030.
Figure 7.4: Projected composition and utilization of energy sources, 2005-2030 (MTOE)
Com posi t i on o f E ner gy S our ce s f or Cons um pt i on
400 R e n e w a b l e
300 Hydro
200 Co a l 100
Natura l 0 G a s
2005 2010 2015 2020 2030 Oil Year
Source: Planning Commission, MTDF 2005-2010.
7.15 Subsidies
7.15.1 In order to ease the burden on public finances the government will reconsider the question
of power sector subsidies, which currently amount to about 1 percent of GDP. The
government is managing Rs 121 billion tariff differential shortfall for FY 2008/09. Out of this,
the government is providing Rs 65 billion while the remaining will be passed onto
135
MT
OE
Poverty Reduction Strategy Paper-II Chapter 7 - Pillar IV: Integrated Energy Development Programme
consumers.99 Average annual subsidy given to lifeline consumers is Rs 10.35 billion out of
which Rs 3.04 billion have been built in the tariff. The government has a firm commitment to
remove all subsidies on oil and electricity by end 2008 and June 2009 in pursuance of which, 31
percent increase in electricity tariff was already made in September, 2008, while
the petr100
um subsidy was brought down to less than Rs 7/litre from a high of Rs ole
50/litre.
7.16 Renewable Energy Sources
7.16.1 The objectives of policy for the Development of Renewable Energy for Power Generation,
2006 include increasing the deployment of renewable energy technologies in Pakistan so as to
provide a higher targeted proportion of the national energy supply mix and also help
ensure universal access to electricity in all regions of the country. As a first step,
Alternative Energy Development Board (AEDB) has been established to facilitate
development of renewable energy i.e. solar energy, wind energy, and bio-fuels. The
authorities will accelerate programmes for the use of alternate energy (especially wind),
which have the potential to provide more than 5 percent of the electricity supply needed in
2030.
7.16.2 Wind Energy: Since 2001, global wind capacity has nearly doubled to 47,760 MW101 and
is cheaper than natural gas. Pakistan has some excellent sites to exploit wind energy. A section of
the coastal area of Sindh has been identified as having wind power potential of 50,000 MW. With
improved site studies, better project planning, R&D and learning, cost of wind energy projects can
be reduced to acceptable levels of around US 6.0 cents/kwh and even below. The government is
preparing a contingency strategy that includes, inter alia,
offering enhanced sovereign guarantees. Moreover, managing power projects up to 50 MW
have already been delegated to the provinces.
7.16.3 Solar Energy: Pakistan has not so far used its solar potential to save on conventional
energy, although its central and southern parts can be used for solar thermal power plants. Despite the
high generation cost of solar power at present, the mid-term prospects are promising due to the
expected technological improvements and economies of mass production. AEDB will also
undertake a comprehensive plan for the development of solar products like solar lights, solar
fans, solar cookers and solar geysers through the
participation of private sector.102
7.16.4 Bio-fuels: Pakistan has started work on bio-fuels (ethanol and bio diesel) for provision of
efficient and sustainable energy. Under AEDB a pilot project of using Ethanol as an
alternative fuel for vehicles has been launched in cooperation with HDIP and PSO.
Furthermore, a pilot project for production of bio-diesel has been successfully implemented and
using local agriculture bio-diesel for village electrification. The government has
99 Ministry of Water and Power, Power Wing, Government of Pakistan, October, 2008. 100 Finance Division, Corporate Finance Wing, Government of Pakistan, December, 2008. 101 Megawatts. 102 GoP, Planning Commission, 'MTDF 2005-2010' (May 2005).
136
Poverty Reduction Strategy Paper-II Chapter 7 - Pillar IV: Integrated Energy Development Programme
introduced 'The National Policy for Power Co-Generation' by sugar industries (the Co-Gen
Policy). Co-Generation is a highly-efficiency energy system that produces both electricity
(mechanical Power) and valuable heat from a single fuel source. Pakistan has a potential of
generating more than 3,000 MW of electricity through co-generation from its existing
sugar industry.
7.17 Energy Security Plan (ESP)
7.17.1 Considering the critical importance of maintaining energy efficiency and security for
ensuring sustainable growth, a Task Force was set up by the government to prepare a
comprehensive report, based on which the government approved the Energy Security Plan
(ESP), 2005-15 on 15th February 2005. Salient features of the ESP include:
Increasing exploratory efforts to significantly enhance the annual production levels of
gas and oil. Offshore exploration will also be intensified;
Improving and expanding oil-gas distribution networks, both within the country and
internationally;
Facilitating Oil and Gas Development Corporation and other local oil and gas
exploration companies in entering into joint ventures for overseas projects for securing
oil and gas reserves;
Diversifying the energy mix, by expanding the share of coal, nuclear and renewable
energy from its current combined share of 20 percent to 36 percent by 2030, even as the
amount of energy grows from 55 MTOE to 361 MTOE in 2030;
Accelerating current programmes in alternate energy (especially wind), which have the
potential to provide more than 5 percent of the electricity supply needed in 2030 as
incorporated in the ESP;
Promoting extensive use of coal-fired plants based on indigenous and imported coal,
with strong policies for making its use eco-friendly. Carbon capture and sequestration
will be aggressively promoted;
Increasing storage capacity, so that strategic reserves which currently stand at 29 days
of demand or less are brought closer to the United States' 60-day supply by 2015 and
Europe's 90 days by 2030;
Developing hydropower resources being cheap and eco-friendly;
Reducing vehicle emissions through accelerating the use of mass transit systems in
major cities to meet the mobility needs of the public as well as hybrid vehicles;
Promoting efficient use of energy through energy conservation and demand
management measures;
Building up the local power engineering industry with power plant equipment, steam
turbines, and generators; and
Initiating research in emerging thrust areas such as fusion, fuel cells, and hydrogen for
energy generation and storage.
137
Poverty Reduction Strategy Paper-II Chapter 7 - Pillar IV: Integrated Energy Development Programme
7.17.2 During the last four years 48 oil/gas discoveries were made in the country. Out of these
production from 19 discoveries have started whereas the other discoveries are at
appraisal/development stage. It is expected that oil/gas extraction from 16 fields will start in 2009.
These discoveries have so far resulted in 2.949 TCF of gas and 948 million US
barrels of oil. Another component of the Energy Security Plan is to expedite development of Tal
(district Kohat), which has the potential to meet the entire energy demand of North Pakistan. In
this regard, Manzalai well is producing gas since February, 2005. Current
production is 21.5 MMCFD gas and 224 barrels of condensate; the second phase of the
development plan is expected to be completed in the first half of 2009. Makori field of Tal block is
also currently producing 30 MMCFD of gas and 2256 barrels of condensate; development
will be completed in 2011. Exploration of Manikhel field is expected to start
in July 2009 and will be tentatively completed within a period of two years.103
7.17.3 With reference to the country's present power shortage, new power plants will be installed
on emergency basis, which would start generating 220MW by the end of 2008. An austerity
campaign will be launched to save power, through which 500MW electricity is aimed to be
saved. Water course lining and urgent construction of small water dams will
further overcome the problem of water and power shortage. The government will initiate
'Electricity Distribution and Transmission Project' (mentioned above) and 'Power
Transmission Enhancement Investment Programmes' jointly with the World Bank and the
Asian Development Bank (ADB). PEPCO has been directed to ensure provision of 10
million energy saving bulbs at a reasonable price. Capacity of Thar-Coal Power Project
will be enhanced to produce electricity from 5,000 MW to 20,000 MW.
7.17.4 Through electricity market development, the government aims to promote the efficiency of
electricity generation, transmission, distribution, export import and consumption by
developing reliable, fair and stable relationships among licensees. The market rules from the
framework which define the rights and obligations between electricity participants include:
criteria for participation; rights and obligations of participants; roles and responsibilities
of the CPPA and the system operator; commercial arrangements and dispute management.
Such a development will help to gradually develop competition in the
power sector by creating the necessary environment for attracting investment.104
7.17.5 With assistance from the Asian Productivity Organization (APO), Japan and GTZ
Germany, the National Productivity Organization (NPO) team (see chapter 8 on
competitiveness) has conducted energy audits in 11 textile units, which have been termed highly
successful by entrepreneurs and the business community. Recognizing the importance of
the project in light of the prevailing energy crisis in the country, the
government has played a very positive role and sanctioned Rs 39.68 million for NPO to continue
with the implementation of best practices of the energy efficiency programme in
103 104
Ministry of Petroleum & Natural Resource, Government of Pakistan, October, 2008. Ministry of Water and Power, Power Wing, Government of Pakistan, December, 2008.
138
Poverty Reduction Strategy Paper-II Chapter 7 - Pillar IV: Integrated Energy Development Programme
the textile sector and enlarge its scope to expand the operation105
more industries based on
in its institutional strength, experienced team and overall mission.
7.18
The overall current status in the energy sector is as follows:
Government road map to eliminate the current circular debt in the sector, as well as
timeline to address power subsidies. Petroleum subsidies have already been
removed;
Energy efficiency and conservations strategy; renewable energy policy and
roadmap;
Power sector reforms - creation of CPPA, unbundling and corporatization of power
providers;
Regional energy trade - imports of power and gas from Central Asia, Iran and
SAARC countries;
Integrated energy modeling;
Private Sector - LNG options, imported coal power generation;
Investment programme in power generation, power transmission and power
distribution sectors;
Privatization road map;
Carbon credits regime;
Hydel development programme - linking Northern Areas with national grid to
promote private sector hydel generation and electricity trade within the country;
Transmission infrastructure for power imports from Iran (which has been recently
agreed at Presidential level); and
Expedite development of Renewable Energy; mini-small run of river hydros to
meet local demand are already being developed with the assistance of ADB.
7.19 Poverty Reduction and Environmental Sustainability: The Nexus
7.19.1 Development based on utilization of natural resources, pressures of population growth and
a subsequent increase in demand and poverty can all take a heavy toll on environmental
assets. Conversely, the degradation of natural resources can have a devastating impact on the poor
given that they tend to be strongly dependent on the exploitation of such resources.
Environment is a cross-cutting issue which runs across all PRSP-II pillars. While linkages between
environmental sustainability and agricultural development (chapter 6), industrial competitiveness
(chapter 8) and infrastructure planning (chapter 10) have been catered to in various chapters, details
of new initiatives that aim to promote environmental
sustainability are discussed in this section.
7.19.2 Environment degradation is a major cause of poverty in Pakistan which costs the country
around 6 percent of GDP, or about Rs 365 billion per year. These costs fall
disproportionately upon the poor. The most significant causes of environmental damage in Pakistan
include illness and premature mortality caused by indoor and outdoor air pollution
105
Ministry of Industries, Production & Special Initiatives, Government of Pakistan, October, 2008.
139
Poverty Reduction Strategy Paper-II Chapter 7 - Pillar IV: Integrated Energy Development Programme
and lead exposure, which represent almost 50 percent of the total damage cost. Diarrheal
diseases and typhoid due to inadequate water supply, sanitation and hygiene are another significant
cause of environmental damage amounting to about 30 percent of the cost of environmental
damages. The remaining 20 percent of the total cost results from reduced
agricultural productivity due to soil degradation, particularly salinization, erosion, and
water logging, which has a drastic effect on the livelihoods of the rural poor.
7.19.3 Environmental degradation has a far-reaching impact on the health of the population,
which inturn has a direct effect on the productivity of the country's labour force, its
competitiveness and the overall potential for economic growth. Environmentally related factors
cause roughly one third of all child mortality in Pakistan, which is the highest in
South Asia. High children mortality and morbidity rates, and the impacts of environmental
quality on cognitive development of children reduce their opportunities to attend school
and become skilled workers, hence limited their ability to escape the poverty cycle they
have been trapped in from generations.
7.19.4 National Environmental Policy, 2005
7.19.4.1 Pakistan's institutional environmental framework has evolved since the adoption of the
Pakistan Environmental Protection Ordinance in 1983. Currently, the National
Environmental Policy (NEP) of 2005 constitutes the Government's overarching strategy for
achieving the goals of sustainable development. However, NEP implementation and
enforcement of environmental regulations has been slow, as evidenced by dismal
environmental conditions, which are worse in Pakistan than in other similar or lower income
countries, particularly when measured in terms of environmental health indicators. Key constraints
that hinder the environmental sector's capacity include weaknesses in the
institutional and regulatory framework, limited human, technical, and financial resources,
and gaps in incentives and accountability.
7.19.4.2 The National Environment Policy covers not only the standalone environmental focus of
PRSP but extends it to other relevant sectors and themes linking them with mainstreaming
environment. The Policy is a valuable and timely contribution and a prelude to poverty-
environment focus of PRSP-II. For example, the policy mainstreams environment in the energy
sector by: (i) formulating energy conservation guidelines and audit standards, (ii)
strengthening financial mechanisms, institutions, and associated policies and regulations to provide
innovative lending specially in the demand side efficiency improvement, (iii)
developing and implementing a plan for conversion of public transport to CNG, (iv)
promoting renewable forms of energy (wind, solar, biomass, biogas, and others) at a wider
scale.
7.19.4.3 The Pakistan Environment Protection Act of 1997 transferred environmental management
powers to provincial governments. While major environmental policies and guidelines are
dictated at the national level by the MoE and Pakistan EPA, it is the role of the provinces to
implement and enforce them. However, there is currently little coordination between federal
and provincial agencies, and limited coordination between provincial authorities
140
Poverty Reduction Strategy Paper-II Chapter 7 - Pillar IV: Integrated Energy Development Programme
and district as well as sub-district-level authorities. Institutional mechanism need to be
strengthened to involve environmental management agencies in a consultative process for priority-
setting, development of long term action plans, and assessment of
performance/impacts of specific initiatives. Inter-sectoral coordination for the oversight of
cross-cutting issues, as those outlined in the NEP, is limited to the establishment of Focal
Points within other non-environment ministries.
7.19.4.4 The development of large hydropower resources will involve resettlement of the displaced
people and give rise to other environmental and social issues. Similarly, the development
of coal mining and coal use in power generation will have local, regional and global
environmental impacts. Pakistan needs to strengthen its policy and institutional framework and
capacity to mitigate these negative impacts in line with the best international practices. Integrating
these practices into the project process from planning to implementation will
improve the long term sustainability of these projects.
7.19.4.5 In order to address linkages between environmental protection, sustained economic growth
and poverty reduction, efforts will be undertaken to strengthen the institutional capacity for
environmental management, consistent with the provisions of the NEP, both at the federal and the
provincial levels. This will include providing federal and provincial governments with the tools
and resources needed to identify and develop priority setting and coordination
mechanisms, increase the effectiveness and efficiency of the national environmental
management system, and engage a broad range of stakeholders to
continuously improve environmental policies.
7.19.4.6 Making an efficient use of the country's scarce resources, priority will be given to address
the causes of environmental degradation that affect primarily the poor and the
environmental risks that have been identified as the leading causes of children mortality
such as air pollution and inadequate water supply, sanitation, and hygiene. Actions
undertaken to arrest environmental degradation will be consistent with the MDGs.
Considering the potential of climate change to reverse progress in achieving the MDGs, a climate
change strategy will be developed to identify priorities for action to increase private and
public sectors' abilities to mitigate and adapt to the environmental and socio-
economic impacts of climate change while simultaneously contributing to address the national
environmental challenges identified by NEP. These efforts will aim to take
advantage of opportunities to access carbon financing in various sectors, including carbon
sequestration through afforestation and reforestation.
7.19.4.7 Taking into account the importance of developing a solid infrastructure base, another
priority will be to develop the institutional capacity to manage the environmental effects of the
development of infrastructure and key economic sectors. This will include the
strengthening of the Environmental Impact Analysis (EIA) system and the adoption of
environmental management systems that contribute to enhance competitiveness.
141
Poverty Reduction Strategy Paper-II Chapter 7 - Pillar IV: Integrated Energy Development Programme
7.19.4.8 In response to the cross-cutting nature of environment, coordination mechanisms will be
strengthened to foster collaboration among governmental agencies to incorporate
environmental considerations in the sectors that can have a more important impact in
poverty reduction. Areas that will be targeted include the development of policies aiming to enhance
industrial competitiveness while simultaneously yielding environmental benefits, through the
adoption of practices that foster energy efficiency, quality control, Corporate
Social Responsibility and compliance with the environmental standards of export markets.
7.19.5 PRSP Alignment with UN MDG 7
7.19.5.1 The PRSP has aligned itself with Millennium Development Goal 7, which is specific to
environmental sustainability. Its targets include integration of the principles of sustainable
development into country policies and programmes and reversing the loss of environmental resources
including: biodiversity conservation, climate change mitigation and adaptation, phasing out
ozone depletion substances; sustainable access to safe drinking water, sanitation and
hygiene; controlling outdoor and indoor air pollution, reduction of
vulnerability to natural disasters, and significant improvement in the lives of slum
dwellers e.g. by providing access to secure tenure.
7.19.6
The government has declared 2009 the 'National Year of Environment.' The Fourth report
of the Intergovernmental Panel on Climate Change (IPCC)106 suggested that South Asia is
one of the world's regions more at risk from climate change in terms of adverse impacts to the poor.
The socio-economic costs of climate change-related impacts can be significant for Pakistan, and also
have the potential to severely reverse the progress made by the country on development and poverty
alleviation. Potential consequences of changes in climate
patterns may include: flooding followed by reduced availability of fresh water as a result of
glacier melting in the Himalayan-Hindu Kush mountain ranges, lower rates of rainfall in arid
and semi-arid zones, declining agricultural yields, and growing incidence of diseases linked to
rising temperatures and rainfall variability such as diarrheal diseases. The power sector is one of the
major contributors of emission of greenhouse gases accounting for a large percentage of total CO2
emission. The main source of these emissions is due to heavy
use of fuel oil in the power generation. During the period 2005-10, conversion of existing thermal
power stations from fuel oil to natural gas would substantially reduce the CO2 and particulate
emission.107 In October, 2008, the Planning Commission of Pakistan constituted a 'Task Force on
Climate Change', which includes representatives from the Commission, WAPDA, Ministry of
Environment, Pakistan Meteorological Department, Global Change Impact Studies Centre,
LEAD Pakistan and United Nations Environment Programme
(UNEP). The Terms of References (TORs) of the Task Force are as follows:
To contribute to the formulation of a climate change policy that would assist the
government in pursuing the goal of economic growth by appropriately addressing
environmental challenges including: measures for ensuring water security of the
106 107
"Climate Change 2007", Fourth IPCC Assessment Report. GoP, Planning Commission, 'MTDF 2005-10' (May 2005).
142
Poverty Reduction Strategy Paper-II Chapter 7 - Pillar IV: Integrated Energy Development Programme
country through planning; coordinating in-depth studies of the impact of climate
change and the melting of Himalayan glaciers on the Indus River inflows; and policy
guidelines to ensure food and energy security security of the country in the wake of overall
warming, the changing temporal and seasonal water situation in the Indus River
System, and the rise of sea level caused by global warming;
To assess existing institutional capacities of various organizations and recommend
measures for their strengthening; and
To recommend measures for enhancing understanding and awareness of issues
pertaining to climate change among all stakeholders including the general public.
7.19.7 While significant investment in infrastructure development is needed to enhance Pakistan's competitiveness, it is equally crucial to improve environmental quality and achieve
progress in terms of environmental health. In the long-term, the sustainability of
infrastructure investments and their influence on development and economic growth will be a
function of the extent to which their associated environmental impacts are evaluated
and, if necessary, mitigated. A process of thorough assessment of the risks, potential
alternatives and long-term monitoring actions for new infrastructure must be an integral
part of the overall national planning process, and the institutional framework must be set up
to guarantee coordination between agencies to: (i) develop and put in place such process
given the specific context of the country; and (ii) ensure that the process is consistently
carried out.
7.19.8 Environmental Fiscal Reforms (EFR)
7.19.8.1 Environmental fiscal reform (EFR) is an important policy instrument that can address
environmental hazards by making greater use of tax sources, cost recovery and removing
environmentally harmful subsidies. Some key factors of degradation of the environment are market
failure (under pricing, under-valuation), institutional failure (e.g. property rights) and policy
failure (perverse incentives, deliberate under-pricing or bias). The EFR refers to the introduction,
application and a range of taxation and pricing measures including: (i) tax on natural resources
extraction; (ii) removal of environmentally damaging subsidies; (iii)
Introduction of specific product taxes, levies and user charges; (iv) pollution charges; and
(v) reforming other taxes in favour of the environment. More specific uses of EFR in
Pakistan include:
User charges to consumption of water, energy and other resources;
Minimization of subsidies to reduce inefficient energy and water use e.g. tubewells and
electricity;
Subsidy on energy and water efficient technologies for poor households e.g. efficient
stoves; energy efficient insulation, siding and windowing; clean fuels substituting
fuelwood, efficient water and energy appliances; and
Payment for environmental services (e.g. compensating the farmers for water shed
management practices to reduce silting of mega dams).
143
Poverty Reduction Strategy Paper-II Chapter 7 - Pillar IV: Integrated Energy Development Programme
7.19.8.2
The Global Environmental Facility (GEF), UNDP, UNICEF, European Union, the
World Bank, Asian Development Bank are amongst the multilateral development
partners and CIDA, RNE, SDC, NORAD and DFID are the major bilateral
development partners that have made substantial financial contribution to support the country's
environmental projects. Major achievements related to environmental
sustainability in Pakistan include:
CNG stations and conversion of vehicles to CNG;
Environmental awareness;
The ever increasing use of information technology and government disseminating
Information through websites;
Creation of enabling environment for the private sector and civil society for
enhancing their contribution to environmental sustainability; Promoting Corporate
Social Responsibility (CSR), etc.;
Large-scale poverty reduction demonstration projects in rural areas focusing on
community participation and sustainable use of natural resources, e.g. Mountain Areas
Conservancy Project-MACP, Environmental Rehabilitation in NWFP and
Punjab Project-ERNP, Protected Areas Management Project-PAMP and Pakistan
Wetlands Conservation and Management Project-PWP);
Supportive role of civil society environmental/rural development organizations;
Gradually increasing use of environmental impact assessment for investment
programmes; and
Integrating environment in disaster management.
7.19.9 National Environmental Information Management System (NEIMS) 7.19.9.1 In Pakistan, environmental data is collected, compiled and published by a host of
organizations, which includes federal agencies, provincial agencies, research institutes and NGOs.
The Ministry of Environment has a vision which includes focusing on establishing
a reliable database of country's environmental resources, monitoring of environmental
information to ascertain trends and provision of timely and accurate environmental data to
users. The overall objective of the project worth US $2.1 million108 running over a duration of 4
years, is to contribute to promotion of sustainable development through building national
capacity in developing, managing and utilizing environmental information for
informed decision-making.
7.19.9.2 Major objectives include reviewing and analyzing the current state of environmental
data/information management, establishing institutional and technical frameworks for
108
Funded by Royal Netherlands Embassy and UNDP.
144
Poverty Reduction Strategy Paper-II Chapter 7 - Pillar IV: Integrated Energy Development Programme
NEIMS, developing an agency specific and inter-agency database, and integrating
application of the database with existing projects.
7.20 Energy is the lifeline of economic development. Pakistan's integrated energy development
programme and its related policy/institutions and regulatory framework are thus, an essential
part of the government's overall infrastructure development plans and will be a major initiative
targeting improvement in the competitiveness of the private sector,
removing infrastructural bottlenecks to sustain and strengthen private sector led growth.
145
Poverty Reduction Strategy Paper-II Chapter 8 - Pillar V: Making Industry Internationally Competitive
Chapter 8 - Pillar V: Making Industry Internationally
Competitive
8.1
8.2
8.3
8.4
8.5
Improving the competitiveness of an economy requires action on many fronts. The country must ensure a stable macroeconomic environment, improve its infrastructure, strengthen its human
resources, make its institutions responsive to changing requirements, and take other
steps to reduce the cost of doing business. These topics are discussed in different chapters of this
document. This chapter outlines the broad strategy that will be followed regarding
the key elements that bear on the competitiveness of the country.
A strategy for improving competitiveness involves several different actors and must be
sustained over the long run. A competitiveness strategy is not a once-for-all exercise, but
rather is a continuous process that requires an institutionalized way of involving the
different players.
The government plans to institutionalize the process and to ensure that a continuous and
long-term look is taken of competitiveness by establishing a Trade Competitiveness Forum.
This body would incorporate representatives from the public sector, the private sector, as well as
from civil society and academia. The Forum would ensure a strong public-private
dialogue and sustained interaction among governmental and other public agencies. It could also help
with two crucial interfaces: (i) between the private and the public sector to ensure that key constraints
encountered by the private sector are addressed by the government. In
a sense, this would replicate some of the procedures undertaken by countries — especially
France, the Netherlands, Korea, and Japan (for industrial planning) — that practice some form of
'indicative' planning; (ii) between different elements of the government, where there is a need for
an entity to advocate and support reforms by a range of line administrations. The
government will look into the issues (such as the identity of the key stakeholders, the checks and
balances on such an institution to function effectively, how to provide expertise and economic
intelligence to this group, etc.) connected with the
establishment and functioning of such a Forum.
The competitiveness of an economy is closely related to productivity, especially firm-level
productivity compared with costs. The immediate source of Pakistan's competitiveness
weakness is that its wages are broadly similar to those in China or India, but it has much
lower factor productivity. Moreover, it has about the same factor productivity as
Bangladesh but its wages are nearly 50 percent higher. As a result, it has trouble competing
with any of these neighbours.
The smaller contribution of productivity to the growth process in Pakistan than in several
of its neighbours is also well documented. Studies of Pakistan's growth performance over the
period 1960-2005 show that while capital accumulation and labour force expansion
explained about 80 percent of the GDP growth rate, growth in total factor productivity
(TFP) provided a significant contribution of 20 percent. However, the contribution of TFP
146
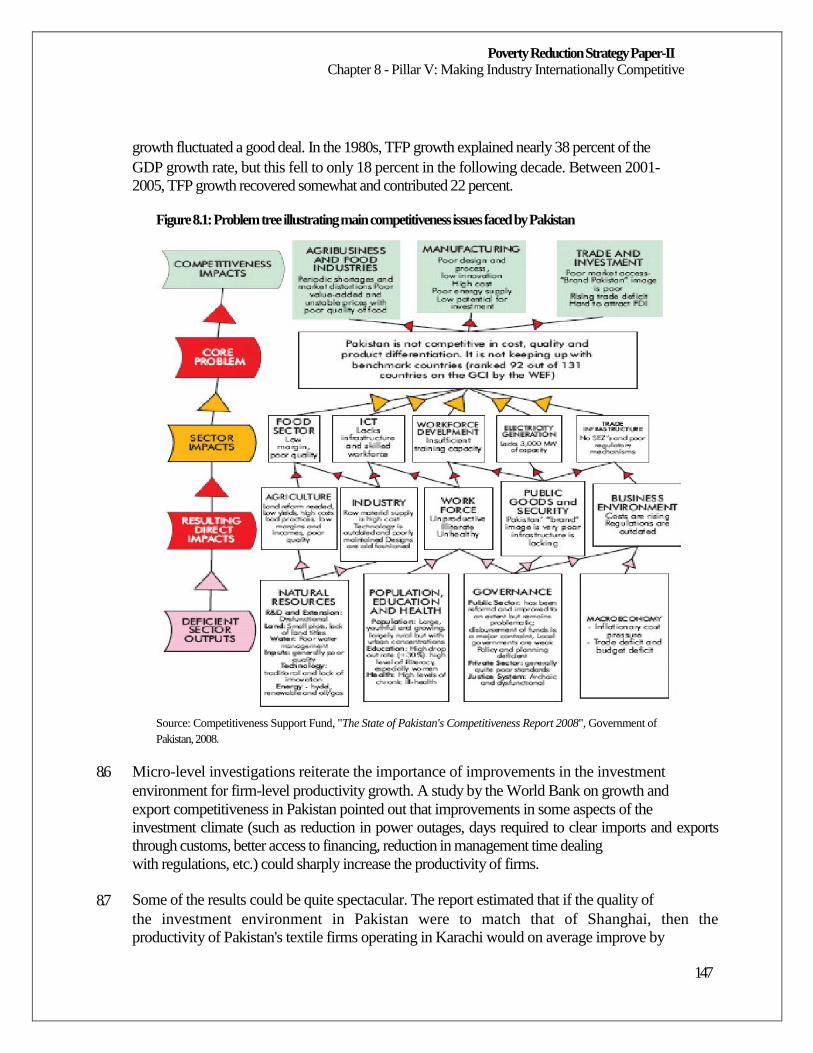
Poverty Reduction Strategy Paper-II Chapter 8 - Pillar V: Making Industry Internationally Competitive
growth fluctuated a good deal. In the 1980s, TFP growth explained nearly 38 percent of the
GDP growth rate, but this fell to only 18 percent in the following decade. Between 2001-
2005, TFP growth recovered somewhat and contributed 22 percent.
Figure 8.1: Problem tree illustrating main competitiveness issues faced by Pakistan
Source: Competitiveness Support Fund, "The State of Pakistan's Competitiveness Report 2008", Government of Pakistan, 2008.
8.6
8.7
Micro-level investigations reiterate the importance of improvements in the investment
environment for firm-level productivity growth. A study by the World Bank on growth and
export competitiveness in Pakistan pointed out that improvements in some aspects of the
investment climate (such as reduction in power outages, days required to clear imports and exports
through customs, better access to financing, reduction in management time dealing
with regulations, etc.) could sharply increase the productivity of firms.
Some of the results could be quite spectacular. The report estimated that if the quality of
the investment environment in Pakistan were to match that of Shanghai, then the
productivity of Pakistan's textile firms operating in Karachi would on average improve by
147
Poverty Reduction Strategy Paper-II Chapter 8 - Pillar V: Making Industry Internationally Competitive
81 percent; the rate of return to capital by 36 percent; and wages would rise by 23 percent.
The report went on to point out that the increased profitability would in turn encourage
more investment, leading to faster capital accumulation and output growth. And, of course, since
technology generally comes embodied in physical capital, a higher rate of capital
accumulation would provide the country with greater access to technology.
8.8
8.9
Even without going to the level of China, much could be accomplished simply by bringing
the rest of Pakistan to the level of its best performing areas. There are regions of Pakistan in which
the investment climate is much better than in the country as a whole. If the country as a whole
adopted the practice of its best-performing regions, the business
environment would improve very substantially. The World Bank estimates that if each
Pakistani region adopted Lahore's regulations on starting a business; Peshawar's regulations
on dealing with licenses, employing workers, and enforcing contracts; and Karachi's regulations
on bankruptcy, taxes, and property, Pakistan's ranking would jump
from 74th to 52nd on the World Bank's index of the ease of doing business. Such an
improvement would play a major role in encouraging business investment and absorbing
technology, and thus increasing productivity and competitiveness.
The strategy for increasing productivity and thereby building a more competitive economy
that will be followed during the period of PRSP-II rests on action in five broad areas: (i)
infrastructure and services; (ii) product and factor markets; (iii) market governance; (iv) selective
direct interventions; and (v) attention to specific problems encountered by Small and Medium
Enterprises (SMEs). Actions to address all these areas, however, must take
place within the framework of stable macroeconomic conditions.
8.10 Macroeconomic stability provides an environment in which businesses can be reasonably
assured of the continuity of policies, the functioning of institutions, and the durability of key
economic variables such as the exchange rate and the interest rate. A balance in the fiscal accounts
also provides reassurance that the requirements of public sector borrowing will not crowd out the
private sector from the financial markets. These factors help to minimize risks to businesses. A
reduction in risks gives businesses the confidence to create capital assets for the long term and to feel
it is worthwhile to invest in training labour. The outlook for the macroeconomy and the
policies to be pursued during PRSP-II are elaborated in Chapter 4. To the extent that these
policies aim at expanding exports in order
to narrow the current-account deficit, the issues examined in the present chapter feedback
into the macroeconomic discussion.
8.11 Brief details on the strategy for increasing productivity are as follows:
8.11.1 Infrastructure and services
8.11.1.1 Pakistan must substantially improve its infrastructure and basic services so as to reduce the
cost of doing business. The parts of the infrastructure that would have the greatest impact on
increasing productivity are power, transport, and telecommunications. Issues related to
148
Poverty Reduction Strategy Paper-II Chapter 8 - Pillar V: Making Industry Internationally Competitive
the development of a world-class infrastructure are discussed in chapter 10; the present
chapter touches only upon the highlights of the strategy.
8.11.1.2 Power: Surveys of the private sector consistently put power shortages among the top three
or four most serious problems. Indeed, as the GDP growth rate accelerates, the demand for
energy can be expected to increase rapidly. Pakistan's total energy requirements by 2030 will be
361 MTOE. In brief, the strategy comprises a much higher rate of investment, a strengthening
of the main institutions (such as WAPDA's successor companies), and a
diversification of the energy mix to increase the share of coal, nuclear, and renewable
energy.
8.11.1.3 Transportation: Value-added in transport in all its forms contributes about 10 percent to
the GDP and accounts for over 6 percent of employment. Improved competitiveness of the economy
demands increased productivity in all the elements of the transport sector—roads,
railways, ports and aviation.
8.11.1.4 Road transport: Road transport accounts for 90 percent of the country's passenger traffic
and 96 percent of its freight. Despite its crucial importance, the public transport system has received
insufficient investment and suffers from neglect of essential maintenance. It is clear that without
a carefully thought out strategy, the sector in its existing shape will not be able to support a
sustained growth of GDP. The strategy for the development of the
sector during the PRSP-II period comprises four main elements: (a) a comprehensive
investment programme, projected at US $6 billion; (b) a complete overhaul of the logistics system
that will include reforms to procedures, services, and infrastructure; (c) a prioritization of
investment and institutional reform, with the main emphasis on
improvements along the National Trade Corridor (the north-south axis that links Pakistan's major
ports with its main industrial centers and neighboring countries); and (d) a
significant expansion and upgrading of the rural roads network.
8.11.1.5 Ports: It is obvious that if Pakistan is to become more competitive in international trade,
then it will have to improve the working of its ports. The strategy for accomplishing this is being
developed in the form of a master plan that will include projects to reduce costs;
improve logistics; outsource several port activities such as dredging, piloting, and the
operation of tugboats to the private sector; and improve cost recovery so as to strengthen
port finances.
8.11.1.6 Railways: The strategy envisages a railway system that is increasingly commercially-
oriented. The main focus will be on increasing the efficiency of the railways and reducing
government subsidies. Increases in efficiency are expected to come through strategic
investments in physical facilities; making finances, especially of loss-making services, more
transparent; and opening the track to private operators by implementing a track
access policy that is currently being developed by Pakistan Railways.
149
Poverty Reduction Strategy Paper-II Chapter 8 - Pillar V: Making Industry Internationally Competitive
8.11.1.7 Aviation: It is recognized that roads, railways, and ports are the most important elements
in Pakistan's transportation system. However, there are expanding areas in which high value-
added items can best be transported by air; these include fresh fruits, flowers, electronic parts,
surgical instruments, and so on. A number of these items are already being exported to the Middle East
and to Europe by air, and Pakistan's share in these markets can be significantly increased if transport
costs are reduced. The strategy for the aviation sector includes construction of new airports and
upgrading of some of the existing facilities. The
policy will also open skies to private sector airlines for operating on international routes.
8.11.2 Product and Factor Markets
8.11.2.1 The second broad area that the strategy to improve competitiveness must address is to
make product and factor markets more competitive and flexible.
8.11.2.2 Product markets: The most effective way to make product markets more competitive is to
adopt a trade policy that levels the playing field between domestic and foreign producers.
Pakistan has been moving quite vigorously towards liberalizing its trade regime with the
government fully recognizing the benefits that accrue to a more open economy.
8.11.2.2.1 In general, most non-tariff barriers have been removed with the exception of some that
have been retained for moral and religious reasons. Import and export procedures have
been liberalized while a legal framework has been put in place that protects domestic
industry from internationally-recognized unfair trade practices, such as dumping. As a
result, maximum tariffs have been scaled down from as high as 225 to 25 percent.
8.11.2.2.2 Due to Pakistan's dependence on agriculture and agricultural-based manufacturers (such as
cotton textiles), considerable attention will be paid to restructuring trade in agricultural products.
The Poverty Reduction Strategy envisages special efforts to increase access of
Pakistan's agricultural exports to international markets. Towards this end, the government
is entering into negotiations with Pakistan's trading partners to persuade them to reduce their
import tariffs on items that are of particular interest to Pakistan; these include fruits
and vegetables, meat products, cereals, dairy products, and processed hides and leather.
More specifically, the trade strategy during the PRSP-II period will:
Maintain open markets. The country recognizes that it has gained in knowledge and
efficiency by opening its markets to international trade, and this openness will be steadily
increased during the period of the PRSP-II;
Emphasize quality improvement. The government will work with Pakistani industries and
the global community to ensure that domestic producers are able to achieve the standards imposed
internationally relating to quality, responsiveness, labour, the environment,
product origin and security in transport;
Expand and modernize the framework for special economic zones, export processing
zones, industrial parks, and IT-enabled service exports; and
150
Poverty Reduction Strategy Paper-II Chapter 8 - Pillar V: Making Industry Internationally Competitive
Encourage export industries to identify unnecessary policy, regulatory, institutional or
other bottlenecks that stand in the way of efficient production and export. The government will then
reduce these constraints especially where multiple industries have identified
similar bottlenecks.
8.11.2.2.3 Competition in the domestic market will not be neglected either. The poverty reduction
strategy aims to increase this competition in two principal ways. First, the government will continue
its privatization programme with particular vigour. This has already picked up speed — from the
programme's inception since 1991, the government has completed 175
transactions (total value Rs 287 billion), half of which were done between 2002-2007.
8.11.2.2.4 The second measure will be to diminish the major impediments to domestic competition,
whether they are due to physical shortages (such as deficiencies in infrastructure) or to
more intangible reasons (such as legal constraints on the exit and entry of firms, or the
inadequate functioning of institutions, such as the commercial legal system or the financial
sector). Business indicators in the Global Competitiveness Index (GCI) place Pakistan's
private sector behind its international rivals in business activities such as corporate
governance, staff training, quality control, process innovation and maintenance, and ability
to respond to consumers' requirements. Pakistan's ranking dropped from 91st place in 2007
to 92nd place in 2008 amongst 131 countries. This is not to say that all enterprises fail in
these respects—there are world class Pakistani companies that export globally (for
example, a state-of-the-art sugar refinery was recently shipped to Europe) but the majority
of firms are unable to meet the standards needed to compete globally. During the period of
PRSP-II, the government will devote particular attention to the 'software' side of the
equation, offering fiscal incentives and support for more training, quality control, and
innovation by private firms.
8.11.2.3 Factor Markets
8.11.2.3.1 Labour: A competitive economy requires a well-functioning market for labour. Creating
and maintaining such a market calls for a judicious balance. Workers must be protected from
arbitrary or discriminatory actions by employers; they must be provided adequate
measures of health, safety, and environmental standards; and they should be provided
wages commensurate with their productivity. On the other hand, excessive labour
regulation raises the costs of hiring and using labour, and can thereby stifle job creation.
8.11.2.3.2 Labour regulation in Pakistan is more pervasive than those of its neighbours. Pakistan's
overall indicators for restrictiveness of employment laws are the highest in the South Asian
region and much higher than those for the fast-growing East Asian countries. As a
consequence, employers tend to evade labour laws on the books by relying more on
temporary workers than those in neighbouring countries, for example, the share of
temporary workers in Pakistani businesses in 2006 was nearly 36 percent, compared with 15
percent in India and 3 percent in Bangladesh. Another unfortunate consequence of raising the
cost of labour is that fewer jobs are created than the increase in the labour force and, indeed, than
the increase in the GDP. Thus, from FY 1993/94 - FY 2005/06
151
Poverty Reduction Strategy Paper-II Chapter 8 - Pillar V: Making Industry Internationally Competitive
employment increased at an average rate of 2.4 percent a year, compared with a growth in
the labour force of 2.7 percent and a GDP growth of 3.6 percent. A World Bank study found
that the slow rate of job creation was not compensated for by improvements in the quality of jobs
— wages in existing jobs remained low and stagnated in real terms during this period. This is a
matter of concern from the point of view of poverty reduction as
incomes in a modern economy are principally derived from jobs. It is also a matter of
societal disquiet, because the burden of unemployment falls disproportionately on youth —
particularly the urban educated youth — and on women.
8.11.2.3.3
8.11.2.3.4
The strategy for making labour markets more flexible during the period of the PRSP-II
follows a multidimensional approach. The strategy will look into the following areas and
make appropriate recommendations:
Hiring and firing costs: The labour strategy will examine measures to reduce the time
required to resolve industrial grievances and to set a fair level of severance pay. At present,
severance pay as a proportion of base wages for a given period of continuous
employment in Pakistan is twice the rate in India or Bangladesh;
Redundancy as fair grounds for dismissal: Employers have repeatedly stressed that if
they cannot fire excess workers (subject, of course, to the legal requirements of giving notice
and providing financial compensation) in times of slack demand, they will be less likely to
hire in times of high demand. This hurts both the worker and the
employers by restricting job growth and decreasing the ability of the firm to expand. In
Pakistan's neighbourhood, Malaysia, Thailand, and Vietnam are some economies that
permit redundancy as grounds for reducing employment;
Time limits on term contracts: Pakistan permits term contracts for a maximum of only
nine months for temporary jobs. This inflexibility limits the creation of jobs, thereby
reducing incomes and making it more difficult for workers to break out of poverty;
Compliance costs associated with labor regulation: Surveys of firms in all the provinces
of Pakistan have shown that employers considered existing practices of labour
inspection, compliance with safety regulations, working condition norms, and so on are
conducted in an uncoordinated, apparently haphazard and intrusive manner. These increase
the costs of using labour and thereby act as a brake on the growth of
employment; and
Vocational and technical training: A strategy is being developed to reform and
strengthen the system of vocational and technical training, both for youth of school age
and for the substantial numbers, who have dropped out of school but are seeking entry
to productive jobs.
A number of steps — principally the Labour Protection Policy, the National Labour
Inspectorate, and the Employment and Service Conditions Act — have been taken to
address the foregoing issues. The Labour Protection Policy, 2006 covers four main areas:
152
Poverty Reduction Strategy Paper-II Chapter 8 - Pillar V: Making Industry Internationally Competitive
Basic rights, such as the right to join a trade union and bargain collectively, equal
treatment and non-discrimination, the absence of forced labour, and the absence of
child labour;
Working conditions, including minimum wages and above minimum wage issues,
allowances and benefits, hours of work, overtime work, rest breaks and leave
arrangements, including annual leave, sick leave and special leave issues, and job
security provisions;
Working environment, including protection against the effect of hazards in the work
place involving issues of work safety as well as protection from work-related diseases
and illness; and
Social security, including protection against the effects of economic and social
hardship resulting from a reduction in earnings because of work accidents, work illness,
unemployment or retirement.
8.11.2.3.5 National Labour Inspectorate, in conformity with the International Labour Organization
(ILO) Convention 81, is to place inspection under the supervision and control of a central
authority. This is an extension of the Labour Inspection Policy approved in 2006 which: (i)
introduced a range of approaches to labour inspection that were flexible, transparent, fair, and
impartial; (ii) supported the extension of labour protection services to persons engaged
in informal economic activities; and (iii) encouraged the private sector to participate in
providing a range of inspection services. However, the capacity of the labour inspection
machinery remains constrained. The authorities will convert inspection policy to model
regulation and will undertake other reforms that will serve the purposes intended by
inspection but without the disruption caused by the present practice.
8.11.2.3.6 The government will pass and implement the Employment and Service Conditions Act
(ESCA) 2008. This Act aims at consolidating a number of related laws and at the same time
increasing flexibility in the labour market. It spells out (i) conditions of employment; (ii)
regulations relating to wages and bonuses, and minimum wage determination; (iii) priority of
wages over other debts; (iv) liability of principal employer and contractor; and (v) punishment and
termination of employment. Every worker is to be provided with an order in writing specifying
the terms and conditions of service and the manner in which
contracts are to be terminated by either party. The Act prohibits the employment of:
a child for any reason whatsoever;
a young person in any occupation identified as hazardous;
a woman in any part of a mine that is below ground; and
a woman in a mine above ground between 7 pm to 6 am, except those who do not
perform manual work.
8.11.2.3.7 Land: The high price of land is frequently cited as an important deterrent to establishing new manufacturing facilities. This is particularly the case in the traditional industrial
153
Poverty Reduction Strategy Paper-II Chapter 8 - Pillar V: Making Industry Internationally Competitive
centres, such as Karachi and Lahore. The government has begun to address this issue along
two paths.
8.11.2.3.8 The first path concerns zoning land and reserving it for industry, and by setting up
industrial estates that will provide land for manufacturing enterprises at reasonable rates. Such
estates have already been established in Korangi and Port Qasim for Karachi and in the
neighbourhood of Lahore, while that in Multan is being doubled in size. Similar measures
are underway in Faisalabad, Sialkot, Peshawar, Hub, Rahim Yar Khan, and
Gwadar. The government is acquiring land for industrial estates near other cities in all the
provinces; over 30 such estates are planned for the period covered by the PRSP-II. Some of these
estates have already become operational, for example, all 667 plots in the Sundar Industrial
Estate have been sold; 40 factories have started production; 105 are under
construction; and another 125 are being processed for permission to start construction.
8.11.2.3.9
Special Economic Zones (SEZs): The second route consists of setting up Special
Economic Zones (SEZs).109 These Zones are intended to generate employment, attract
foreign investment, increase exports, build clusters, and transfer technology and skills. In
setting up such Zones and associated industrial parks and clusters, the government will
ensure that land is available to the participating enterprises at reasonable rates.
8.11.2.3.10 The Poverty Reduction Strategy envisages that SEZs and associated industrial parks and
clusters will play an important role in increasing the competitiveness of Pakistan.110 The
planning of SEZs will take into consideration the unique geographical, social and political
characteristics of each location. There are already some excellent examples of industrial
parks, such as the 'Marble City' and the Lasbela Industrial Estate in Balochistan. The government
has also declared that the area around Gwadar Port city will be an SEZ. Cluster development in the
Punjab — e.g. in Sialkot, around Sargodha, and in the 'Textile City' of
Faisalabad — has been extremely successful. Furthermore, the National Industrial Parks
Development and Management Company (NIPDMC) has been established as a Public Private
Partnership to foster the approach. Initial activities include Korangi Industrial Park
and Bin Qasim Industrial Park in Karachi in addition to others being developed in
Peshawar and Bahawalpur. Industrial parks are planned during the PRSP-II period for
Jhang, Rahim Yar Khan, Sialkot, Gujrat, and other cities.
8.11.2.3.11 The hallmarks of successful SEZs include high-quality infrastructure; a well thought out
plan for attracting industry; carefully crafted incentive policies; access to a productive labour
pool; a critical mass of support industries; streamlined bureaucratic processes; and a suitable
regulatory framework. For SEZs to succeed, they also require support for factors that lie beyond
their designated borders and authorities. These factors are regional and
societal and can only be provided by the government at the national level.
109
The term SEZ itself encompasses a range of nomenclatures because zones can function as Industrial Estates, Industrial
Zones, Industrial Parks, Economic Development Zones, Free Trade Zones and Export Processing Zones. 110 The term SEZ itself encompasses a range of nomenclatures because zones can function as Industrial Estates, Industrial Zones, Industrial Parks, Economic Development Zones, Free Trade Zones, and Export Processing Zones.
154
Poverty Reduction Strategy Paper-II Chapter 8 - Pillar V: Making Industry Internationally Competitive
8.11.2.3.12 There is considerable movement towards having zones bring in labour by integrating
residential, retail, and recreational components to the SEZ. By providing a decent living
environment, workers can be attracted to a zone on the outskirts of a city or another region
entirely through the prospect of a better quality of life. These types of development require
larger investments and higher risk, thus the government must provide the necessary support
to ensure that they are designed and executed using best practices exhibited by successful
mixed-use zones.
8.11.2.3.13The government has evolved a model of Private Public Partnership for effective
development of SEZs. In order to work together for the development of different sectors, a model has
been adopted for their promotion, giving the lead role to the private sector allowing space for
free market mechanism to take its due course while the government
assumes its role of a facilitator. Through joint efforts of SMEDA and USAID, the
following Sector Development Companies have been set up with the aim that the
government will provide resources for the implementation of sector strategies through
these companies.
Box 8.1: Industrial Growth through Public-Private Partnerships The Government of Pakistan has established independent companies as subsidiaries of the Pakistan Industrial Development
Corporation, which are based on the principle of public-private partnership and has kick started the much needed
industrialization process in provincial headquarters and prominent urban industrial clusters. Progress is as follows:
National Industrial Parks (NIPs) Development and Management Company: The NIPs was established in March, 2005. The main objective of the company is to develop new industrial parks and upgrade older ones, and to
manage infrastructure within the industrial parks through the respective Board of Management. Current
projects under the development phase include: Korangi Creek Industrial Park (Karachi), Bin Qasim Industrial Park
(Karachi), Auto Cluster Industrial Park (Sheikhupura) and Marble Cities (Risalpur and FATA). Pakistan Gems and Jewellery Development Company (PGJDC): The PGJDC will work across regions to establish
Pakistan as an internationally competitive, world-class hub for precious stone-cutting, jewellery designing and manufacturing. It aims to enhance the value chain from mine to market through facilitation,
technology up-grading, skill development and marketing/branding. In order to achieve its objectives, the Company has come up with a Sector Development Project, which includes establishment of Gems
Exchanges, Development of Cutting and Polishing Centers, Quality Control Hallmarking for Gold Jewellery and Gem
Testing Laboratories for Certification, undertaking Marketing and Branding Initiatives and conducting Geological Surveys for scientific quantification of deposits and identification of new ones. The total cost
of the project is Rs 1400 million. ECNEC approved the project in September, 2007 and an amount of Rs 250 million was allocated through PSDP during the FY 2007/08. The Company has now started work
on the project components and is in the process of establishing Common Facility and Training Centers at Karachi, Lahore and Gilgit and Gems labs at Peshawar and Quetta. Technology Up-gradation and Skill Development Company (TUSDEC): The TUSDEC was incorporated in
January, 2005 by the Securities and Exchange Commission of Pakistan (SECP). Since inception, TUSDEC has been
developing technology database and support for technology acquisition. Projects being implemented by TUSDEC under sponsorship of Ministry of Industries & Production include: 2 Tools, Dies and Mould (TDM) Centers at Karachi and Gujranwala aim to provide local state-of-the-art design, training,
consultancy and manufacturing facilities, as well as, practical demonstration of modern technology applied to TDM in
Pakistan. The TDM Centre at Karachi, at Rs 450 million initiative, is
155
Poverty Reduction Strategy Paper-II Chapter 8 - Pillar V: Making Industry Internationally Competitive
operational and has started providing services. TUSDEC has also initiated a 3-year project to establish Computer Assisted Design (CAD) / Computer Assisted
Manufacturing (CAM) Centers throughout the country at different strategic locations with a total cost of Rs 321.12
million. This project is being implemented by National Institute of Design and Analysis (NIDA) at Lahore, while
TUSDEC is monitoring progress. CAD / CAM Centers at Lahore, Quetta, Sialkot, Peshawar and Karachi are already operational. Following the earthquake in October 8, 2005, a Rs 200 million worth project is underway to establish eight Skill Development Centers (SDCs) at Batgram, Khaki, Bagh and Muzaffarabad with two SDCs in each of the approved
areas. The objective is to expdite rehabilitation in the earthquake stricken area on a 'Teaching Factory' concept with
free of cost courses in 14 different disciplines. Two SDCs at Batagram and Khaki are operational with free of cost training
being provided to students in construction, hospitality and tourism. Technical Up-gradation of the Garment Industry, a Rs 286.74 million project, under TUSDEC is providing
consultancy services and technical guidance. Seventeen foreign experts have been engaged with various areas of expertise
such as dyeing and finishing, knitting, sewing, industrial engineering, printing, design and mechanical maintenance, etc. Pakistan Stone Development Company (PASDEC): The PASDEC, established as a public Ltd. Company in
June, 2006, is a subsidiary of the Pakistan Industrial Development Corporation. Achievements include model quarries and
upgrading machinery pools at Risalpur (Punjab) and Khuzdar (Balochistan), Common Facility and Training Center in Marble City in Gaddani and establishment of Marble Cities in FATA (300
acres of land), Risalpur (180 acres of land) and Karachi (300 acres of land at Northern Bypass). A Marble Mosaic Display Center has been proposed, which will also be a selling point. Pakistan Hunting and Sporting Arms Development Company (PHSADC): Formed in September, 2006, main
objectives include; (i) upgrading existing traditional "Cottage Level" skill available in the hunting and sporting arms industry of Pakistan. There will be special focus in Dera Adam Khel (DAK) to develop it into an organized industrial cluster. It aims to help Pakistan acquire significant share in the World Hunting,
Sporting Arms and Accessories trade market; (ii) maintaining warehouse, display centre and weapons archives and
library; (iii) development and export of copies and replicas of vintage weapons, spares and equipment and arranging and facilitating seamless exports; (iv) undertaking capacity and quality building initiatives at DAK by developing Common Facility and Training Centre and Industrial Estate and
Gunsmith School in Peshawar; and (v) overall supervision and monitoring of hunting sporting arms and accessories industries.
Source: Ministry of Industries and Production, Government of Pakistan, 2008.
8.11.2.3.16 Apart from availability, another major weakness bedevils the land market. Perhaps the
most formidable constraint to the efficient functioning of land markets is the failure of the land
management system to establish ownership in urban properties. The system of maintaining
land records contains much ambiguity and multiplicity of authorities, each with its own
systems and procedures for determining title or regulating property
transactions.
8.11.2.3.17In Pakistan the records of rights in land are essentially of the fiscal variety. The person
mentioned in the records is liable for land revenue or property tax. Pakistani law does not view
registration or any other record of rights in land as a guarantee from the government
or its agencies that the person mentioned in the records of any agency is the rightful owner. In
transactions involving property transfers, the documents of 'title' provided by the seller
to the buyer do not certify title. These are private documents that confirm one of the
transactions in the entire chain of transactions. By entering the transaction in respect of any property
in the official records, the Registrar only confirms that the transaction has been
156
Poverty Reduction Strategy Paper-II Chapter 8 - Pillar V: Making Industry Internationally Competitive
recorded and does not provide any guarantee for either the validity or the accuracy of the
document. Moreover, many of the transactions relating to an immovable property do not require
to be registered; for example, under Islamic law, immovable property can be
transferred to someone verbally.
8.11.2.3.18This deep-seated problem has existed for a very long time. The government proposes to
examine solutions to this issue in some detail (including those tried out in other countries), and will
take significant steps during the PRSP-II period. Elements of the solution include the creation of a
centralised registry system, staffed by trained manpower, and provided
with adequate finance, hardware and software.
8.11.2.3.19Finance: The government will continue to modernize the banking sector and adopt
measures to improve the working of the financial system; these issues are discussed in detail in
Chapter 8. The government will monitor movements in credit provided to the
private sector as a percentage of GDP as one important gauge of the efficiency of the financial
system. Foreign direct investment has been used to great effect to increase jobs
and introduced new technology in many countries. The government will consult with
foreign investors already in Pakistan to identify ways to encourage more investment by these
firms, as half the incremental foreign investment tends to come from those already
here.
8.11.3 Market Governance
8.11.3.1 The experience of rapidly growing countries demonstrates that the surest path to
developing a more competitive economy is to use a market-responsive private sector as the main
engine of growth. The economic history of Pakistan reiterates this conclusion. The
government, therefore, intends to push vigorously to enable this sector to play its due role
in driving the economy. This does not mean that the role of the government is abridged
rather the role becomes more nuanced. In the economic sphere, the government will act as
a referee, ensuring that the rules of a responsible competitive market are observed and that the drive for
private profit does not come at the expense of the country's fundamental social objectives. The
challenge for the government is to provide the space for the private sector
to develop, to provide public services and administrative frameworks that underpin private sector
development, to police markets to limit anti-competitive and unethical behaviour, and to provide
support that allows the private sector to build its own capabilities and stand
on its own feet.
8.11.3.2 These issues are generally considered to fall under 'governance'a term which itself is very
wide, and has been used to cover anything from the country's law and order situation to
considerations of national ideology and identity. This chapter touches rather more narrowly
on topics that have a direct bearing on business competitiveness. These comprise the judicial
system, the bureaucracy, tax administration, and measures that have been taken to ensure a healthy,
contested economy. Moreover, this chapter touches only upon some of the highlights connected
with the foregoing subjects; issues relating to the commercial
157
Poverty Reduction Strategy Paper-II Chapter 8 - Pillar V: Making Industry Internationally Competitive
judicial system, the bureaucracy, and tax administration are discussed in more detail in
chapter 12 on governance.
8.11.3.3 The Judicial System: Pakistan's judicial process works slowly and, as a consequence, the
costs of accessing justice mount up. The case backlog — around half of which concerns disputes
of a commercial nature — in the High Courts of Sindh and the Punjab numbers over one hundred
thousand, and for the lower courts in millions. The costs comprise not
only the financial expense of hiring lawyers and ancillary staff for extended periods,
repeatedly traveling to the courts, and so on, but also the opportunity costs occasioned by
the owners and senior managers of businesses having to neglect their duties at frequent intervals in
order to prepare for and to appear in courts. Moreover, the implementation of court decisions can
be very slow, and add substantially to the costs of even successful litigation. The World Bank
estimates that it takes, on average, almost one-third of the
contract value to enforce a contract.
8.11.3.4 The uncertainty and the long delays in repossessing collateral impacts with particular
severity on transactions in the financial sector. Financial institutions and leasing companies
are therefore reluctant to deal with parties whom they do not know well, or they require excessive
amounts of collateral, guarantees, and security. Many firms, especially the
smaller enterprises, are not able to provide these and hence must forego access to the financial
sector or can only do so to a very limited extent. The judicial delays, higher costs, and the inability
to readily obtain adequate funds from the financial system can greatly restrict the capacity of
enterprises to expand or to obtain improved technology, and this can
severely constrain their potential to increase their productivity and competitiveness.
8.11.3.5 The government, in conjunction with international agencies, has started programmes to
reduce these delays and to improve access to justice. These programs not only add to the
hardware of the judicial system — in the shape of more and better court buildings,
computers, etc — but also to its software in the form of more and better trained and better paid judges
and support staff, and revisions to procedures to speed up the legal process.
This process will be vigorously pursued during the period of the PRSP-II, but one must
recognize that completion of the entire undertaking will take several years.
8.11.3.6 Competition: In addition to the strategies and policies identified throughout this chapter,
competitiveness will also be enhanced through a new competition law passed in 2007 and by the
creation of the Competition Commission of Paksitan. The law provides equal opportunities
for all entities to participate in economic activities and mandates much stiffer penalties for
monopolistic behaviour than were previously prescribed under the
Monopolies and Restrictive Trade Practices Ordinance, 1971. The Competition
Commission will monitor the state of competition, weed out practices that interfere with
contestability, and generally ensure that the economy continues to develop rapidly in the direction
of market responsiveness. Key principles embedded in the new competition law
and in the institutional framework for its application include the following:
158
Poverty Reduction Strategy Paper-II Chapter 8 - Pillar V: Making Industry Internationally Competitive
Nondiscrimination: The law's nondiscriminatory approach makes its interpretations
predictable and transparent, which should increase confidence in its application;
Protection of competition, not competitors: The assessment of competition in the law
tolerates single firm growth on the principle that competition law should not punish those who have
gained dominance by innovating and using resources efficiently and have not
resorted to exclusionary and anticompetitive tactics; and
Integrity in the application of law: This includes (i) a collegiate body of commissioners
possessing integrity, stature, ability, substantial experience and (collectively) a range of relevant
expertise; (ii) transparency and speed in the investigation of serious infractions without undue
burdens on individuals and businesses; (iii) public proceedings with safeguards for
proprietary information; (iv) published decisions subject to review on
appeal; and (v) annual reporting based on third party audits.
8.11.3.7 Enhancing Pakistan's global competitiveness requires not only establishing an environment
to spur the productivity of firms but, just as importantly, ensuring that new entrepreneurial, productive
firms can easily enter the market while unproductive, loss-making enterprises
exit in an expedient and orderly way.
8.11.3.8 On the entry side, Pakistan has made some improvements in procedures for a business to
register as a limited liability company. According to the Doing Business indicators, the
time and cost to register a business has fallen from 53 to 26 days. While this was a major
improvement at the time, since then there has been little movement in shortening the time
and lowering the cost. It still remains a cumbersome process as compared with many
countries globally. Moreover, the other aspects of starting a business — obtaining a
construction license, acquiring land, getting utility connections — is fraught with long
delays and can be subject to "speed payments."
8.11.3.9 The Government of Pakistan has commissioned two studies to examine some of the aspects
associated with entry: an Investment Climate Assessment which takes the perspective of the firm, and a
National Doing Business Study which examines localized differences in the practice of starting
and operating a new business. At the same time, the Competition Commission of Pakistan is
conducting competition impact assessments to examine public
and private sources of barriers to entry into key sectors. Based on this analytical work, the
government will have a comprehensive understanding of the barriers to entry and will be
better able to ensure that new entrepreneurs can enter the market as easily as possible.
8.11.3.10For the economic structure to remain flexible and competitive, it is also important to reduce
the barriers that impede the exit of unsuccessful firms. The principal barriers to exit have
been identified as the regulations relating to employment and labour compensation.
8.11.3.11A weakness in the legislation relating to the exit of enterprises is that, for all practical
purposes, the relevant Ordinance regards the solution for a company under financial
159
Poverty Reduction Strategy Paper-II Chapter 8 - Pillar V: Making Industry Internationally Competitive
distress not as rehabilitation but as liquidation. Moreover, the process of liquidation
provided under the Ordinance is cumbersome and time-consuming.
8.11.3.12Many of these shortcomings will be rectified during the PRSP-II period. The World Bank
will provide assistance in developing a code dealing with insolvency and credit rights. It is
expected that the Ministry of Finance will receive detailed recommendations on these matters
by mid 2009. The liquidation/winding up of banks, including special provisions for
more quickly completing disposal proceedings, has been included in the draft Banking Act, 2006,
which is expected to attain the force of law during the period of the PRSP-II. However, the
government recognizes that these enterprises remained uncovered, and for
that reason it will act expeditiously.
8.11.3.13The government will target for reform other badly designed or outdated regulations that
restrict the competitive advantage of Pakistani commercial enterprises. The reform process will avoid
procedures that impose unnecessary transaction or compliance costs for firms, will not become an
obstacle to beneficial mergers and acquisitions, and will not stand in the
way of gaining efficiencies from linkages between companies. Under the Poverty
Reduction Strategy, the government will increasingly play the role of a referee who will
establish a level playing field for all enterprises, who will enforce the rules, and who will ensure
that the thrust for private profit does not come at the expense of society's most
cherished goals.
8.11.4 Selective Direct Intervention
8.11.4.1 In addition to the economy-wide policies to enhance productivity and growth that has been
described earlier, Pakistan will consider a range of more focused enterprise and worker
interventions to support product diversification and global competitiveness in specific
product niches. These interventions will be carefully previewed in order to ensure that they do not
work against efficiency or distort market signals. Pre-requisites to maximize the
effectiveness of interventions and be able to spot and correct inevitable failures include:
an institutionalized and inclusive process of consultation with the private sector in the
design, monitoring and evaluation of interventions;
transparency in the subsidies involved in the interventions, including regarding the
beneficiaries;
clear, measurable, and transparent indicators of success of each intervention;
arms-length relations between the government and the private sector; and
a public governance set-up that ensures that the government is bound by sufficient
accountability to be able to prevent capture and to interrupt failing interventions.
8.11.4.2 Interventions could include:
8.11.4.2.1 Improved quality systems and standards for a competitive edge, including
environment management and social development standards: The government will
160
Poverty Reduction Strategy Paper-II Chapter 8 - Pillar V: Making Industry Internationally Competitive
improve the diffusion and absorption of metrology, standards, testing and quality services
to enterprises.
8.11.4.2.2 Promotion of global knowledge flows and technology for development: Given the
important role that public goods play in helping to create and commercialize knowledge for
development, and in helping to improve the capabilities of enterprises to better absorb
existing knowledge, Pakistan will consider:
risk-sharing competitive matching grant funding of early-stage enterprise-driven R&D;
matching grant support to enterprises with advisory, strategic, and legal inputs for the
appropriate use of domestic/global IPR protection;
an appropriate build-up of capabilities of diaspora networks; and
the use of government procurement as an instrument to stimulate productivity
upgrading by raising the bar on 'sophisticated demand' requirements.
8.11.4.2.3 Other direct export promotion activities: Other specific policies to support exporters that
Pakistan will examine include:
a single and strong Export Promotion Agency focused on non-traditional export
promotion, with a special attention to large firms that are not yet exporters, and with a
large share of the executive board in the hands of the private sector;
a strengthened Export Processing/Economic Zone programme to test and showcase
additional facilitating policies;
a strengthened linkage programme, helping build up the capacities of smaller upstream
and downstream firms to meet the requirements of larger (as well as FDI) exporters and
global buyers; and
a programme of cooperation with strategic working groups from export-oriented
industries. Under these initiatives, the industries will be challenged to come up with
strategies for boosting their competitiveness in a manner that does not rely on subsidies
and protection in order to compete in world markets. The strategies could include
labour training; research and development; design improvement; branding; technology
acquisition; supply chain management; and other initiatives.
8.11.4.2.4 Ensuring 'opportunities for all' through improved safety nets and worker training: In addition to enterprise support programmes, Pakistan will also consider complementary worker
support to help displaced workers, the unemployed, and existing workers requiring
skills upgrading meet the challenges of globalization, such as:
strengthened social safety nets to support workers in transition between jobs and those
suffering prolonged unemployment and dislocation from trade, including a means- tested
cash transfer programme targeted to the poor (for more details, see chapter 5 on
social protection); and
161
Poverty Reduction Strategy Paper-II Chapter 8 - Pillar V: Making Industry Internationally Competitive
matching grant support for enterprise-based training programmes (only 15 percent of
the 2,300 manufacturing enterprises from the World Bank's latest Enterprise Survey
provide in-service training in India, but those that do are roughly 25 percent more
productive).
8.11.5 Small and Medium Enterprises (SMEs) 8.11.5.1 Inadequacies of the infrastructure, inflexibility of product and factor markets, and the
unsatisfactory working of some key elements of governance, impact on the productivity
and competitiveness of all enterprises in Pakistan. However, larger enterprises, because of their
more plentiful resources and greater ability to lobby the government for special treatment,
are much better able to deal with these shortcomings. The deficiencies,
therefore, impact disproportionately on the smaller enterprises.
8.11.5.2 Increasing the overall productivity of the economy will require attention to the major issues
that impact disproportionately on the SMEs. Two important structural facts of Pakistan's economy
are that SMEs account for about 95 percent of all enterprises, and that in general
larger firms are more efficient than smaller. The government will, therefore, seek to remove
the main constraints that restrict the growth of the SMEs so that these enterprises
can expand and reap the benefits of economies of scale. The enlargement of these firms
will not only increase their competitiveness, but by expanding the numbers of productive
jobs it will contribute directly to reducing poverty.
8.11.5.3 What gives urgency to devoting special attention to the SMEs is that they account for
nearly 95 percent of the 3.2 million business enterprises in Pakistan. They contribute over 30
percent to the GDP, account for around one-fourth of export earnings, and provide about
80 percent of the nation's jobs.
8.11.5.4 Constraints on the growth of SMEs: Studies show that in Pakistan, as in most other
countries, larger firms are more profitable than smaller. This, therefore, raises the question: why do
SMEs not grow to a size at which they can reap the economies of scale? A complete answer
could encompass a rather large number of reasons, such as an inclination on the part of some SME
owners to restrict their enterprise to a size that remains comfortably within their (or their
family's) span of control, or the desire to 'remain below the government radar' so as to more easily
evade regulations relating to minimum wages,
safety, location, and so on.
8.11.5.5 However, the three most frequently cited constraints are finance, market environment, and
access to technology. The evidence is especially clear where finance is concerned —
according to studies conducted by international organizations, banks provide only 7-8 percent of
the total funding requirement of SMEs. Access to finance as the single most important
impediment to growth was also highlighted by the Lahore University for Management
Sciences (LUMS) in a 2006 study on 'Barriers to SME Growth in Pakistan:
An Analysis of Constraints.'
162
Poverty Reduction Strategy Paper-II Chapter 8 - Pillar V: Making Industry Internationally Competitive
8.11.5.6 The recommendations by a government task force on the three fore-mentioned issues are
described below. However, since the availability of finance is cited in studies on Pakistan
and most other countries as the single most important constraint on the growth of SMEs, it
is worth exploring the reasons for that difficulty in a little more detail.
8.11.5.7 The key problem regarding finance for SMEs is structural, and arises from what is known
as 'asymmetric information'. This means that the borrower (i.e. the SME) knows more about the
financial condition of his enterprise than does the lender. The latter must expend
resources in order to ascertain the exact position and, given the relatively small size of the
individual loans required by SMEs, in many cases the amount of money that has to be spent in
conducting the enquiry is large in relation to the size of the loan. Because overhead
costs per loan are relatively fixed, the smaller size of loan can render it unprofitable for the
lender to make the investigation, and the loan is, therefore. not made.
8.11.5.8 When loans are extended, smaller firms are regarded as riskier borrowers and charged
higher interest rates. The perceived risk of lending to SMEs is accentuated by the slow
working of Pakistan's legal system, which makes it time-consuming and expensive for a lender to
repossess collateral in the event of a default. It is, therefore, not surprising that a survey found that
57 percent of new investment by SMEs and 67 percent of working
capital came from internal finance or retained earnings, while only about 7 percent of funds
for new investment or working capital came from banks and other financial institutions.
8.11.5.9 The State Bank of Pakistan has issued separate prudential regulations for SMEs that permit
banks and other financial institutions the option of extending credit to SMEs on the basis of
cash-flow evaluations, in addition to the normal assets/collateral-based lending. The latter, which
explicitly links loans to the liquidation value of assets, works against SMEs because
they tend to be asset and collateral poor.
8.11.5.10The government will intensify its efforts to provide SMEs suitable locations to work in and
opportunities to benefit from economies of scale, both external and internal. Industrial estates
(discussed above) have been encouraged as has the development of clusters to
overcome problems of scale. Organizations such as the Small Business Support Fund
(SBSF), the Agribusiness Support Fund (ASF), and the Competitiveness Support Fund
(CSF) will all contribute to supplying SMEs with capital and technical expertise.
8.11.5.11A number of significant measures have already been taken to support SME development.
The SME Policy of Pakistan was approved by the Federal Cabinet in January 2007 after a two-
year round of consultations in which over a thousand stakeholders participated. The
SME Policy outlines priorities and provides recommendations in the following areas:
8.11.5.11.1(a) Business environment: The aim is to create a more favourable business climate for
SMEs by simplifying the process of complying with regulations. The fiscal, labour, and
enterprise regulations of the Federal and Provincial Governments do not provide for a
163
Poverty Reduction Strategy Paper-II Chapter 8 - Pillar V: Making Industry Internationally Competitive
focus on SMEs that is in line with their specific needs. The support and grievance redressal
regime of the government does not differentiate between enterprises on the basis of their size, thus
making it difficult for SMEs to access public support programs and the attention
of public authorities when competing for them with the large firms. Some policy
recommendations specific to SMEs that were made by a government task force are listed
below:
An SME Act be promulgated that (among other issues related to SMEs) identifies fiscal,
registration, labour, and inspection laws that may be simplified for Small and/or Medium
Enterprises;
A periodic review of labour legislation be undertaken with a view to relaxing the
applicability of certain laws for SMEs for a specified period of time;
An SME Desk be established at the Federal, Provincial, Banking and Tax Ombudsman
Offices for addressing SME grievances;
A minimum quota be established for allocation of land in the Industrial Estates and Export
Processing Zones (EPZs) for SMEs at a concessional rate (on a now profit no loss
basis) as compared with the cost offered to large scale enterprises; and
A regulatory regime for specialized sectors (such as mining) in provinces be developed
with the specific requirements of SMEs in mind.
8.11.5.11.2 (b) Marketing
Encourage establishment of SME sector-specific export marketing companies by
providing matching grants for international marketing research, preparing marketing
strategies, packaging, branding, participating in and conducting trade fairs, and
undertaking promotional and marketing activities;
Offer matching grants for developing 'world-class' trade and product directories for
major SME clusters;
Compile and disseminate data on local markets using manufacturers, distributors and
retailers data;
Support SME associations in exploiting local market opportunities by holding domestic
product exhibitions; and
Provide annual SME Awards for outstanding performance in domestic and international
markets, technology innovation, HRD practices, etc.
Box 8.2: Dignified employment for the poor Aik Hunar Aik Nagar (AHAN): 'Aik Hunar Aik Nagar' (AHAN) aimed at enhancing non-farm rural based income has been launched to serve as a vehicle for the
development of rural areas. It enhances and encourages local people's creativeness and entrepreneurial initiations in
production and development of competitive products and marketing from the community. The project specifically targets
poverty alleviation and encourages income generation activity in rural
164
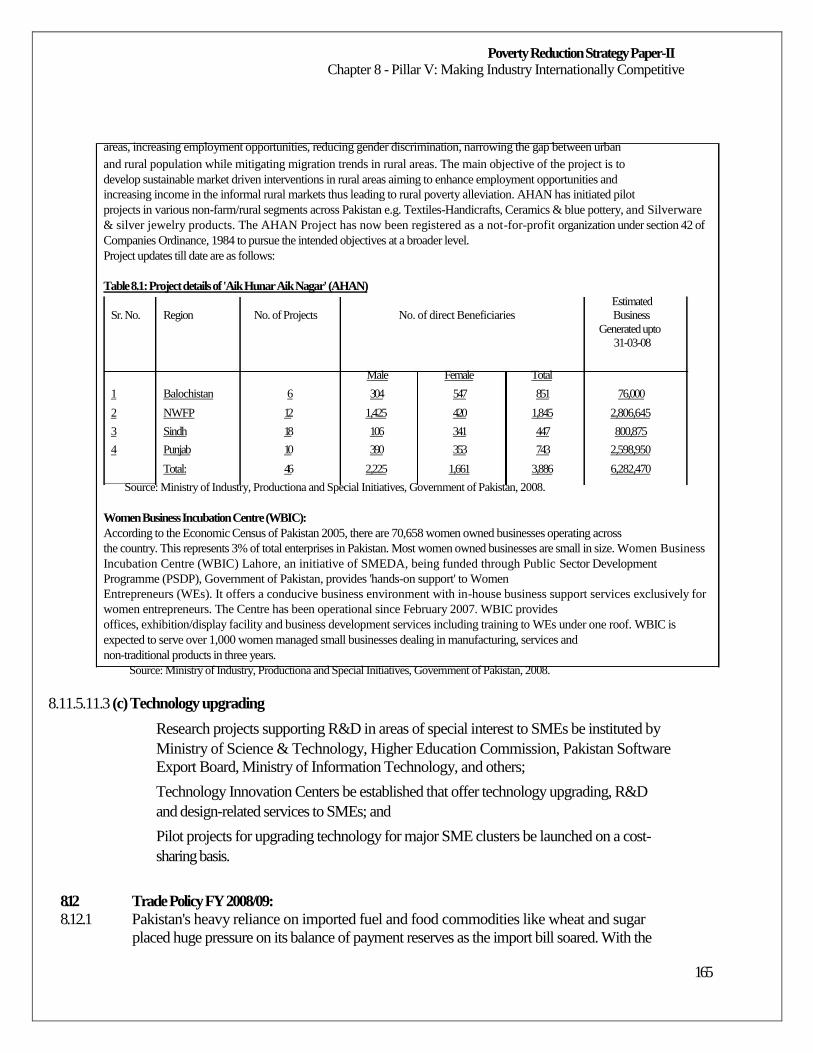
Poverty Reduction Strategy Paper-II Chapter 8 - Pillar V: Making Industry Internationally Competitive
areas, increasing employment opportunities, reducing gender discrimination, narrowing the gap between urban and rural population while mitigating migration trends in rural areas. The main objective of the project is to develop sustainable market driven interventions in rural areas aiming to enhance employment opportunities and increasing income in the informal rural markets thus leading to rural poverty alleviation. AHAN has initiated pilot projects in various non-farm/rural segments across Pakistan e.g. Textiles-Handicrafts, Ceramics & blue pottery, and Silverware
& silver jewelry products. The AHAN Project has now been registered as a not-for-profit organization under section 42 of
Companies Ordinance, 1984 to pursue the intended objectives at a broader level. Project updates till date are as follows:
Table 8.1: Project details of 'Aik Hunar Aik Nagar' (AHAN) Estimated
Sr. No. Region No. of Projects No. of direct Beneficiaries Business Generated upto
31-03-08
Male Female Total
1 Balochistan 6 304 547 851 76,000
2 NWFP 12 1,425 420 1,845 2,806,645
3 Sindh 18 106 341 447 800,875
4 Punjab 10 390 353 743 2,598,950
Total: 46 2,225 1,661 3,886 6,282,470
Source: Ministry of Industry, Productiona and Special Initiatives, Government of Pakistan, 2008.
Women Business Incubation Centre (WBIC): According to the Economic Census of Pakistan 2005, there are 70,658 women owned businesses operating across the country. This represents 3% of total enterprises in Pakistan. Most women owned businesses are small in size. Women Business
Incubation Centre (WBIC) Lahore, an initiative of SMEDA, being funded through Public Sector Development
Programme (PSDP), Government of Pakistan, provides 'hands-on support' to Women Entrepreneurs (WEs). It offers a conducive business environment with in-house business support services exclusively for
women entrepreneurs. The Centre has been operational since February 2007. WBIC provides offices, exhibition/display facility and business development services including training to WEs under one roof. WBIC is
expected to serve over 1,000 women managed small businesses dealing in manufacturing, services and non-traditional products in three years.
Source: Ministry of Industry, Productiona and Special Initiatives, Government of Pakistan, 2008.
8.11.5.11.3 (c) Technology upgrading
Research projects supporting R&D in areas of special interest to SMEs be instituted by
Ministry of Science & Technology, Higher Education Commission, Pakistan Software
Export Board, Ministry of Information Technology, and others;
Technology Innovation Centers be established that offer technology upgrading, R&D
and design-related services to SMEs; and
Pilot projects for upgrading technology for major SME clusters be launched on a cost-
sharing basis.
8.12 Trade Policy FY 2008/09: 8.12.1 Pakistan's heavy reliance on imported fuel and food commodities like wheat and sugar
placed huge pressure on its balance of payment reserves as the import bill soared. With the
165
Poverty Reduction Strategy Paper-II Chapter 8 - Pillar V: Making Industry Internationally Competitive
aim to mitigate the negative effects of this situation by pursuing the ongoing export led
growth strategy more vigorously the new Trade Policy intends on bridging the trade gap by
focusing on reducing the cost of doing business, enhancing productivity and
competitiveness of our manufacturing sector. The Federal Export Promotion Board
(FEPB), chaired by the Prime Minister, is the highest export related decision-making body.
The Board will be reconstituted to make it more proactive. The Trade Dispute Settlement
Organisation, under the administrative control of Ministry of Commerce, will be set up to deal
with trade disputes arising from export activities. Legal cover, in consultation with the
Law Division will be worked out. The newly constituted Trade Development Authority of
Pakistan (TDAP) has so far not been able to come up to expectations. A summary will
shortly be submitted to the Cabinet with a draft bill for approval of the National Assembly
proposing amendments in the current TDAP law. The new export strategy has been
designed in a manner so that:
Instead of providing cash incentives or subsidies to exporters, emphasis would be to
support their capacity building in areas like productivity enhancement, and in providing
training facilities to upgrade human resource skills;
Diversification will be encouraged via proposals drawn up specifically to promote
higher trade in agricultural products. In the manufacturing sector this diversification
policy will also facilitate SMEs. The advantage of this approach is that SMEs create
more employment with less investment and they can trigger the production of higher
value added, innovative and knowledge based products; and
Enhancing competitiveness of exports will be a major objective of the export policy.
Various measures have been announced to simplify procedural requirements including
reducing costs through comprehensive zero-rating of various export sectors.
8.12.2 8.12.2.1
Zero-rating of exports To reduce the cost of doing business the government has decided to completely zero-rate
exports by refunding the whole amount paid as indirect taxes on inputs used for
manufacturing for exports. To encourage value added products, particularly those being produced
by SMEs, the drawback rate has been increased by 1 percent of FOB value on this account for 14
products: (i) tents, canvas and tarpaulin, (ii) electric machinery, (iii)
carpets, rugs and mats, (iv) sports goods, (v) footwear, (vi) surgical goods/medical
instruments, (vii) cutlery, (viii) onyx manufactured, (ix) electric fans, (x) furniture, (xi) auto
parts, (xii) handicraft, (xiii) jewellery, and (xiv) pharmaceuticals. In addition to existing ones,
TDAP will establish the flowing new export clusters: surgical instruments in Sialkot; gloves and
personal protective equipment in Sialkot; sports wear in Sialkot; leather and leather products in
Sialkot and Charsadda; sports goods in Sialkot; weaving and textile processing sector in
Faisalabad; light engineering sector in Gujranwala; auto parts in Lahore; ceramics in Multan
and Halla; Ajrak and bangles in Hyderabad/Halla; and
embroidery in Balochistan. UNIDO will provide training to Cluster Development Agents
and Coordinators who will work in these clusters.
166
Poverty Reduction Strategy Paper-II Chapter 8 - Pillar V: Making Industry Internationally Competitive
8.12.3
8.12.3.1
Leather industry
In accordance with the Trade Policy FY 2008/09, currently available 6 percent markup support on loans for setting up in-house effluent treatment plants has been increased to 8 percent or 50 percent of the markup, whichever is lower. Only three years ago, leather and leather products joined the billion dollars export club. These fetched US $1.2 billion export in FY 2007/08 up almost 20 percent over US $1 billion in FY 2006/07. Leather exports appear to be coming under dark clouds of global recession. However, the footwear segment offers some light in the tunnel. Footwear export has managed to make some inroads in
European markets but without any presence in the US where annual demand for shoes is more than
US $10 billion. China controls over 50 percent of the US market followed by
Brazil which shares around 7 percent. Supply orders from the US are very big and at much
competitive rates. While the shoe industry is gradually coming of age, it still does not have
the capacity to service such huge orders.
8.12.4 Industry and Environmental Issues
8.12.4.1 Industrial development has been associated with some of Pakistan's most significant
environmental challenges, which are expected to intensify in the future. In addition to industry's
contribution to air pollution, it is estimated that industrial wastewater accounts for as high as 30
percent of total wastewater generated. Currently, there is little investment
in environmentally sound technologies despite strong evidence pointing at the significant health
and economic benefits that would result from the employment of cleaner production methods. The
industrial sector however, offers opportunities to develop strategic actions
that can reduce the costs of environmental degradation while simultaneously contributing to
enhance the country's competitiveness, such as the adoption of practices to foster energy
efficiency, quality control, Corporate Social Responsibility, and compliance of
environmental and social standards of export markets. As a consequent step, the Trade
Policy FY 2008-09 has, in compliance with the Montreal Protocol, banned import of CFC gas
based refrigerator and freezing equipments. In order to avoid any possibility of misuse, import of
CFC based compressors has also been banned. Details of government efforts to
promote environmental sustainability were given in chapter 7.
167
Poverty Reduction Strategy Paper-II Chapter 9 - Pillar VI: Human Development for the 21st Century
Chapter 9 - Pillar VI: Human Development for the 21st
Century
9.1
Along with meeting basic needs, sustainable human development is a fundamental right of all citizens of Pakistan, as guaranteed in the Constitution. Human development is also an
essential prerequisite and a major engine for reducing encompassing an improvement in all aspects
of the quality of life of citizens, and is, therefore, an important pillar of the
government's Poverty Reduction Strategy. The PRSP-II envisages that the ongoing
demographic transition in Pakistan has created a window of opportunity in the form of
changing age structure and declining child dependency to invest more in human
development, focusing on education, skill development, health, family planning, nutrition, safe
water and sanitation and redressing gender inequalities. As in East Asia, this
investment should lead to sustained high economic growth and poverty reduction.
9.2
9.3
9.4
Pakistan has made progress in areas of human development in recent years. However, these
improvements have been particularly slow in reducing both child, infant and maternal
mortality, in enhancing the provision of reproductive health services, increasing primary and
secondary school enrollment and retention rates. The government is aware that these indicators are
not improving rapidly enough, while gender and urban/rural disparities remain important issues
of concern. With the current rate of progress, it may be difficult to
achieve many MDG targets set for education, health and population sectors. It has,
therefore, adopted human resource development as a priority area and the country's
development strategy envisages massive investment in strengthening its human resource
base to produce a skilled and competent workforce that can respond to the increasing
demands of a steadily growing economy.
Population size presents a big challenge as it becomes the denominator for all investments
and is the deflating factor for all efforts to improve socio-economic indicators. Currently
there is an opportunity of significant changes in the age composition due to fertility decline and
resultant fall in the dependency ratio which will influence the development framework and the
achievement of numerical targets in education, skill investment, employment, health and
population welfare. During the period of the PRSP-II, and beyond, there will be a rise in the
proportion of the working age population in relative terms to the school age population. There is
an urgent need to capitalize on this potential opportunity which also
coincides with the goal of achieving the MDGs, and of catching up with South and West
Asian neighbouring countries in terms of human development indicators.
The extent of gender inequality that cuts across all the human development indicators is a
serious issue requiring immediate redress through strongly stated political commitment before
the policy or planning stages. Gender equality is a basic human right, and it also has
serious social and economic implications for the entire society. Empowering women
through provision of primary and reproductive health care; and through eliminating the gap in
enrollments and retention rates; and redressing the even larger gap in labour force
168
Poverty Reduction Strategy Paper-II Chapter 9 - Pillar VI: Human Development for the 21st Century
participation, are key affirmative action measures for a comprehensive poverty reduction
strategy. They will also allow the harnessing of the potential of that half of the population
which hitherto has not been adequately recognized and involved in the development of the country.
The PRSP-II endorses this mainstreaming approach by aiming to create an
environment that is more welcoming to women, by focusing on policies and legislative
reforms that result in improvements in women's human development indices.
9.5
9.6
9.6.1
9.6.2
9.6.3
9.6.4
Major levers required are to ensure: (i) catching up to increase enrollments and to capture
out-of-school children; (ii) ensuring that the fertility decline is rapid and continuous; (iii)
ensuring a rapid decline in infant and child mortality with an improvement in their
nutritional status; and (iv) enhancing employment opportunities for youth particularly for young
women. Investments now rather than later in terms of financial outlay, innovative programmes,
harnessing support in private and non-governmental sectors, and creating strong inter linkages
between major sectors that fall under the broad umbrella of human development will pay off huge
dividend economically and socially. The private sector and NGOs will be encouraged to continue
to play a dominant role alongside the government to cover some of the gaps in health, education
and population sectors without the latter
abdicating its fundamental obligations.
(1) Education
Sustainable development begins with the development of a nation's human resources. The experience of all countries that developed rapidly shows that the acquisition of knowledge and its effective utilization is a key driver of economic growth and poverty reduction. Indeed, after the eradication of extreme poverty and hunger, the most important of the
MDGs is the attainment of universal primary education. The government has, therefore, adopted
human resource development as a priority area and the country's development
strategy envisages massive investment in strengthening its human resource base to produce a skilled
and competent workforce that can respond to the increasing demands of a steadily
growing economy.
Education forms the key to sustainable economic development. In Pakistan, the progress of
the last sixty-one years has been below par and has become a matter of concern for all.
Resultantly, the provincial and federal governments have in the last few years raised the
political commitment to education and some changes have begun to manifest themselves.
The Constitution of Pakistan sets out a broad based egalitarian view of education, based on
values, and responding to the requirements of economic growth. 'Article 38 (d)' speaks of instilling
moral values and of providing education to all citizens irrespective of gender, caste, creed, or
race. 'Article 37(b)' explicitly states that the state of Pakistan shall endeavour "to remove
illiteracy and provide free and compulsory secondary education
within minimum possible period."
The subject of education falls within the 'Concurrent List' of the Constitution where both
the federal and the provincial levels have the right to legislate. Under the present
169
Poverty Reduction Strategy Paper-II Chapter 9 - Pillar VI: Human Development for the 21st Century
arrangement, provinces have autonomy in planning and implementation in all areas of
education except curriculum preparation and approval of textbooks. The last two functions
are undertaken by the federal government. The National Education Policy (NEP) is also
prepared at the federal level through provincial inputs.
9.6.5
9.6.6
9.7
9.7.1
9.7.2
111
The provinces play a key role in education service delivery. Therefore, to improve access
to education and bring improvements in quality, the provinces are implementing their
programs for education reforms. The main elements of the provincial efforts include targeted
interventions with an initial focus on improving public sector schools. Many are
targeted at girls or geographically vulnerable areas.
In addition to the provinces, there are three special areas the Federally Administered Tribal
Areas (FATA), the Federally Administered Northern Areas (FANA) and the Islamabad
Capital Territory (ICT). All these areas fall within the jurisdiction of the Federal
government but they have autonomous directorates that run education in their respective areas. The
only exception is the Federal Directorate of Education that runs education for
ICT, which is an attached department of the Ministry of Education.
An Overview of the Sector
There has been a steady improvement in access to primary education during the past few years.
Primary Net Enrolment Rates (NER) have risen from 42 percent in FY 2001/02 to 56 percent in FY
2006/07 while primary gross enrolment rates (GER)111 have risen from 72 to 91 percent during the
same period. At the middle and secondary (Grade X) level, GER has risen from 46 percent to 51
percent and from 42 percent to 48 percent respectively.
However NER at both middle and secondary levels have remained stagnant since 2005. Adult
literacy has increased to 55 percent and female literacy, while very low at 42 percent in FY 2006/07
has shown an improvement of 31 percent from FY 2001/02. The share of the private sector in
education service delivery has expanded considerably, with a significant presence of low cost
schools in rural and urban areas. The private sector now accounts for over 36 percent of total
enrolments, and 37112
percent of all private sector
enrolments (over 4.5 million children) are now in rural areas.
There has also been progress in closing the gender gap in urban enrolments at primary,
middle and secondary levels. However, overall net primary level female enrolment at 51 percent
is still 9 percentage points less than male enrolment as female rural enrolment at 46
percent lags behind male enrolment of 57 percent. While enrolment trends are improving in all
provinces, there are considerable inter-regional disparities. Primary net enrolment in Punjab is
62 percent compared to 41 percent in Balochistan. Balochistan also has wide
gender and rural-urban disparities. Net primary female enrolment is 32 percent in
Balochistan, which compares unfavorably to the national average of 51 percent. NWFP Primary Net enrolment rate (NER) denotes primary age children (5-9 years) enrolled in schools. Gross Enrolment Rate
(GER) is always higher as includes overage and underage children. 112 Source - PSLM and National Education Census.
170
Poverty Reduction Strategy Paper-II Chapter 9 - Pillar VI: Human Development for the 21st Century
also falls 10 percent below the national average. Access to middle and secondary levels is
restricted, and poses a major challenge in the forward looking agenda.
9.7.3
9.7.4
9.7.5
113
While enrolments are increasing, low quality remains a challenge for education managers.
The Government has introduced certain initiatives to improve the quality of education. The National
Education Assessment System (NEAS) tests students in key subjects in Grade IV and Grade VIII.
These show low levels of learning across the country. Not only are the results below the mean,
the average score for mathematics has declined from 421 to 404.
Student performance in language is better than mathematics, particularly in Punjab where
the score is above the mean. In addition to the difference in learning across rural/urban
schools, there is considerable disparity among provinces, with Sindh and NWFP reporting
the lowest achievement scores in language and mathematics.
Education sector funding has improved but remains below the level of expenditures in
comparable countries. The share of expenditure on education is at 2.48 percent (public
sector) of GDP in FY 2006/07, increased from 1.79 percent of GDP in FY 2001/02.
Table 9.1: Education financing (percent) Year Recurring Development Total Percent of Private Percent of
GDP Sector GDP* 2000/01 69.5 6.4 75.9 1.82 16.8 2.22 2001/02 70.4 8.5 78.9 1.79 22.0 2.28 2002/03 79.5 10.4 89.9 1.86 26.3 2.41 2003/04 94.3 30.0 124.3 2.20 31.1 2.75 2004/05 106.6 33.3 139.9 2.13 36.0 2.67 2005/06 128.9 41.9 170.8 2.21 40.7 2.74 2006/07 160.0 56.6 216.6 2.48 45.5 2.96 2007/08 191.0 65.0 256.0 2.44 - -
Source: Demands for grants, Budget books of Government of Punjab, Sindh, NWFP, Balochistan & AJ&K, Federal Ministries/Divisions, District Governments.
The education budget as percentage of total government budget has also been increased
from 11.2 percent in FY 2001/02 to 14.1 percent in FY 2006/07.
Table 9.2: Education budget as percentage of total government budget113 Year Percentage 2000/01 11.7 2001/02 11.2 2002/03 10.0 2003/04 13.2 2004/05 12.5
2005/06 12.0 2006/07 14.1
Source: Pakistan Economic Survey FY 2006/07, Finance Division & Financing of Education in the Public Sector, Ministry
of Environment, GoP, 2008.
171
Poverty Reduction Strategy Paper-II Chapter 9 - Pillar VI: Human Development for the 21st Century
9.7.6
To respond to the challenges faced by the education sector, Ministry of Education has
developed a new NEP for guiding education sector development in the country. This NEP
articulates two overarching priorities: (i) improving access to education for all to help
Pakistan come closer to the MDGs and to achieve Education For All (EFA) goals of
universal primary enrolment, including removing urban-rural and gender imbalances; and
(ii) enhancing the quality of education and student learning at all levels (including higher
education). The Policy recognizes that improvements in governance and management
underpin any improvements in the sector.
9.7.7 Issues in Education
9.7.7.1 Education is a huge sector with many interlinked issues. For the purpose of this paper the
issues have been divided into four broad areas:
Governance;
Access and Equity;
Literacy and Non-Formal Education; and
Quality.
9.7.7.2 Governance: Pakistan has a very large population and hence a huge education sector. The
education department is by far the largest, in terms of personnel, in every province. Given
the huge numbers, governance becomes a critical but difficult process. Some of the key
areas under governance and management that need redressal are:
Lack of clarity in inter-tier roles and responsibilities;
Fragmented governance and planning; and
Poor management capacity.
9.7.7.2.1
At the federal level the draft NEP, and earlier the White Paper on Education, have called
for clear demarcation of roles and responsibilities between the federal and provincial (and
area governments) and then between the provincial and the district levels. The Inter-
provincial Education Ministers' Conference (IPEM) is the forum for inter-provincial and
Federal coordination. While it has been functioning for some years now it suffers from
absence of an institutionalized mechanism and its functionality depends on the goodwill of
the incumbent set of ministers.
9.7.7.2.2 To overcome this issue, a proposal for institutionalization was sent to all provincial and
area governments by the Ministry of Education (MoE). All federating units have agreed with
the fundamental principle although details need to be finalized before formal
institutionalization is possible.
172
Poverty Reduction Strategy Paper-II Chapter 9 - Pillar VI: Human Development for the 21st Century
9.7.7.2.3
9.7.7.2.4
9.7.7.2.5
9.7.7.2.6
9.7.7.2.7
9.7.7.2.8
9.7.7.2.9
Education works as an integrated system, but presently suffers from issues of fragmented
governance. At the federal level it is being dealt with by at least four different
organizations with no coordination mechanism: MoE, Higher Education Commission
(HEC), Ministry of Special Education and National Vocational and Technical Education
Commission (NAVTEC). Similarly with some variations the sector remains fragmented at
the provincial level also again with little or no coordination.
As already mentioned, education is a very large sector. This creates serious management
issues. Over the years there has been a weakening of management capacity due to
expansion on the one hand and the absence of trained specialized managers on the other. Teachers
with some seniority are appointed as managers. Most of them do not have
adequate training for the position. The problem permeates all levels starting from
Executive District Officer (Education) right to the school level where most head teachers do not
have relevant training or competence for the job. The effective mobilization of
community to participate in school management also remains a challenge.
An important area of governance is meritocratic recruitment and deployment of teachers.
The problem appears as a collective legacy of many years. On the positive side there is
increased recognition of the problem and some efforts are under way to reduce and
eventually eliminate the problem.
Given that development partners play a very important role in supporting education
development in Pakistan, an area of focus for both the government as well as the
development partners has been to improve aid effectiveness. Over the years there have been
issues of overlap and non-coordination of support from development partners. Now
efforts are underway in all provinces to rectify the situation.
Sector planning is considered a pre-requisite for alignment of objectives, harmonization of
procedures & approaches and coherent policy and financing arrangements in education sector
development. The government recognizes the importance of shifting from a fragmented
project mode development to sector-wide approaches for education sector development. In this
context, the draft National Education Policy Implementation Framework provides guidelines
for the development of sector plans for each sub-sector of
education.
The Government of Punjab has initiated strict measures for meritocratic recruitment of
teachers and has also established a database that contains information on teachers'
deployment in the Punjab Education Management Information System (EMIS). The Project
Management Implementation Unit (PMIU) manages a number of areas through an overall plan. An
important component includes monitoring to check teacher absenteeism. A
separate management cadre is also being developed.
The Government of Sindh is working on an overall education sector plan to improve. The
province also plans to introduce reforms to improve the functioning capacity and
173
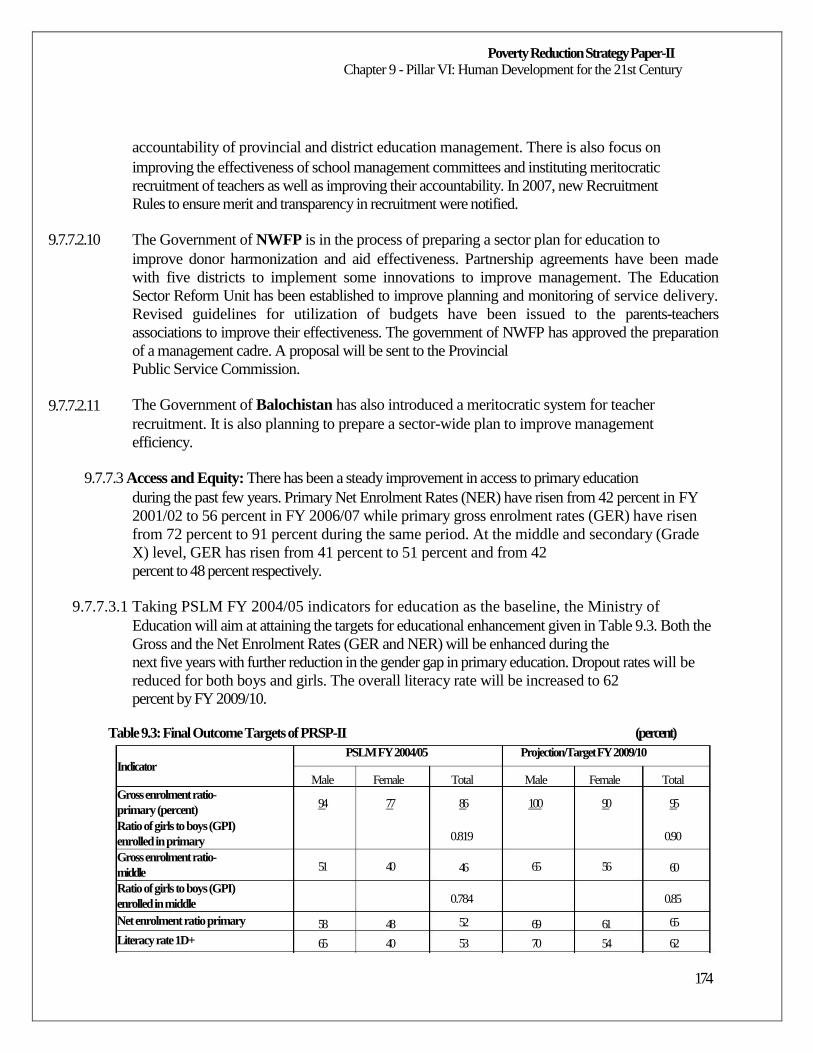
Poverty Reduction Strategy Paper-II Chapter 9 - Pillar VI: Human Development for the 21st Century
accountability of provincial and district education management. There is also focus on
improving the effectiveness of school management committees and instituting meritocratic
recruitment of teachers as well as improving their accountability. In 2007, new Recruitment
Rules to ensure merit and transparency in recruitment were notified.
9.7.7.2.10
9.7.7.2.11
The Government of NWFP is in the process of preparing a sector plan for education to
improve donor harmonization and aid effectiveness. Partnership agreements have been made
with five districts to implement some innovations to improve management. The Education
Sector Reform Unit has been established to improve planning and monitoring of service delivery.
Revised guidelines for utilization of budgets have been issued to the parents-teachers
associations to improve their effectiveness. The government of NWFP has approved the preparation
of a management cadre. A proposal will be sent to the Provincial
Public Service Commission.
The Government of Balochistan has also introduced a meritocratic system for teacher
recruitment. It is also planning to prepare a sector-wide plan to improve management
efficiency.
9.7.7.3 Access and Equity: There has been a steady improvement in access to primary education
during the past few years. Primary Net Enrolment Rates (NER) have risen from 42 percent in FY
2001/02 to 56 percent in FY 2006/07 while primary gross enrolment rates (GER) have risen
from 72 percent to 91 percent during the same period. At the middle and secondary (Grade
X) level, GER has risen from 41 percent to 51 percent and from 42
percent to 48 percent respectively.
9.7.7.3.1 Taking PSLM FY 2004/05 indicators for education as the baseline, the Ministry of
Education will aim at attaining the targets for educational enhancement given in Table 9.3. Both the
Gross and the Net Enrolment Rates (GER and NER) will be enhanced during the
next five years with further reduction in the gender gap in primary education. Dropout rates will be
reduced for both boys and girls. The overall literacy rate will be increased to 62
percent by FY 2009/10.
Table 9.3: Final Outcome Targets of PRSP-II (percent)
PSLM FY 2004/05 Projection/Target FY 2009/10 Indicator
Gross enrolment ratio- primary (percent) Ratio of girls to boys (GPI) enrolled in primary Gross enrolment ratio- middle Ratio of girls to boys (GPI) enrolled in middle Net enrolment ratio primary
Literacy rate 1D+
Male
94
51
58
65
Female
77
40
48
40
Total
86
0.819
46
0.784
52
53
Male
100
65
69
70
Female
90
56
61
54
Total
95
0.90
60
0.85
65
62
174
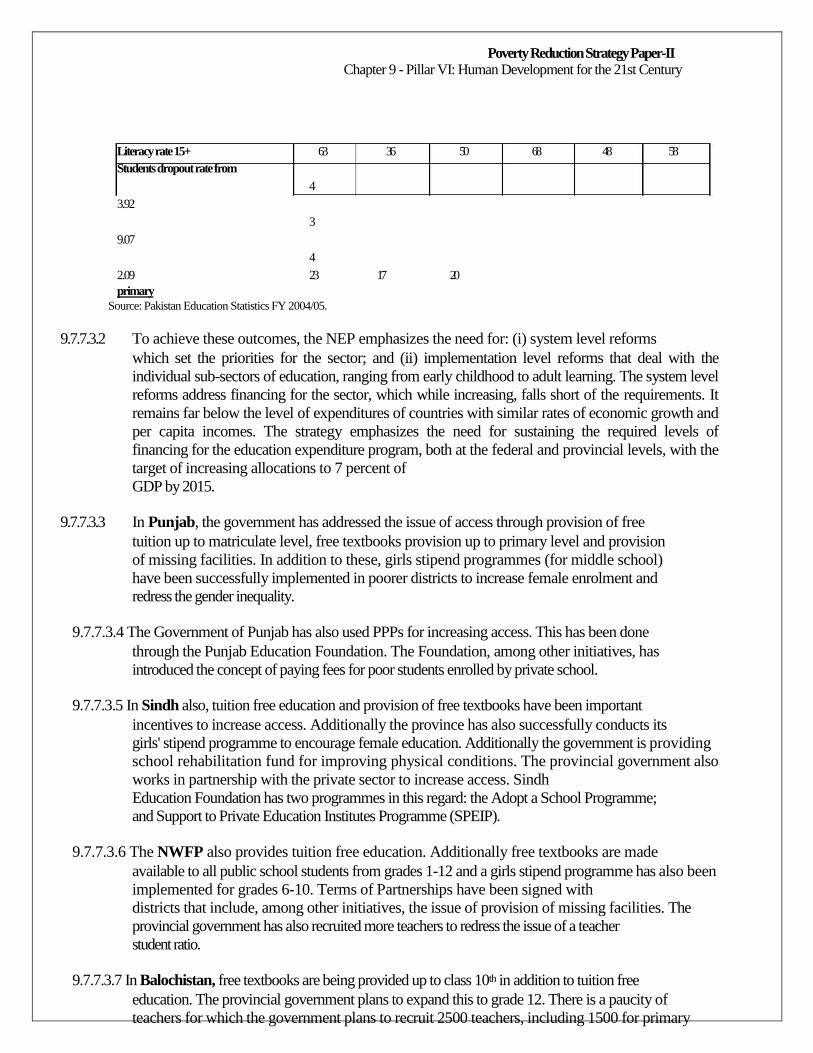
Poverty Reduction Strategy Paper-II Chapter 9 - Pillar VI: Human Development for the 21st Century
Literacy rate 15+ 63 36 50 68 48 58 Students dropout rate from
4
3.92
3
9.07
4
2.09 23 17 20 primary
Source: Pakistan Education Statistics FY 2004/05.
9.7.7.3.2
9.7.7.3.3
To achieve these outcomes, the NEP emphasizes the need for: (i) system level reforms
which set the priorities for the sector; and (ii) implementation level reforms that deal with the
individual sub-sectors of education, ranging from early childhood to adult learning. The system level
reforms address financing for the sector, which while increasing, falls short of the requirements. It
remains far below the level of expenditures of countries with similar rates of economic growth and
per capita incomes. The strategy emphasizes the need for sustaining the required levels of
financing for the education expenditure program, both at the federal and provincial levels, with the
target of increasing allocations to 7 percent of
GDP by 2015.
In Punjab, the government has addressed the issue of access through provision of free
tuition up to matriculate level, free textbooks provision up to primary level and provision
of missing facilities. In addition to these, girls stipend programmes (for middle school)
have been successfully implemented in poorer districts to increase female enrolment and
redress the gender inequality.
9.7.7.3.4 The Government of Punjab has also used PPPs for increasing access. This has been done
through the Punjab Education Foundation. The Foundation, among other initiatives, has
introduced the concept of paying fees for poor students enrolled by private school.
9.7.7.3.5 In Sindh also, tuition free education and provision of free textbooks have been important
incentives to increase access. Additionally the province has also successfully conducts its
girls' stipend programme to encourage female education. Additionally the government is providing
school rehabilitation fund for improving physical conditions. The provincial government also
works in partnership with the private sector to increase access. Sindh
Education Foundation has two programmes in this regard: the Adopt a School Programme;
and Support to Private Education Institutes Programme (SPEIP).
9.7.7.3.6 The NWFP also provides tuition free education. Additionally free textbooks are made
available to all public school students from grades 1-12 and a girls stipend programme has also been
implemented for grades 6-10. Terms of Partnerships have been signed with
districts that include, among other initiatives, the issue of provision of missing facilities. The
provincial government has also recruited more teachers to redress the issue of a teacher
student ratio.
9.7.7.3.7 In Balochistan, free textbooks are being provided up to class 10th in addition to tuition free
education. The provincial government plans to expand this to grade 12. There is a paucity of
teachers for which the government plans to recruit 2500 teachers, including 1500 for primary

schools. It also plans to expand tertiary level institutions and provision of quality
175
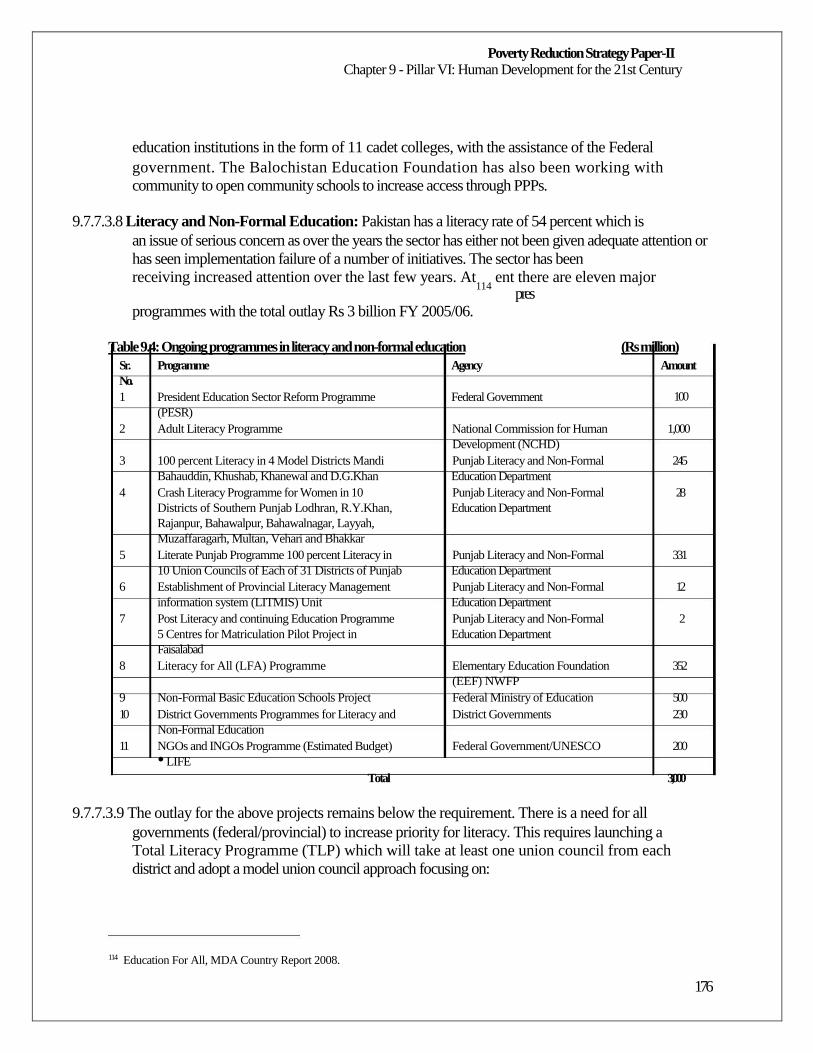
Poverty Reduction Strategy Paper-II Chapter 9 - Pillar VI: Human Development for the 21st Century
education institutions in the form of 11 cadet colleges, with the assistance of the Federal
government. The Balochistan Education Foundation has also been working with
community to open community schools to increase access through PPPs.
9.7.7.3.8 Literacy and Non-Formal Education: Pakistan has a literacy rate of 54 percent which is
an issue of serious concern as over the years the sector has either not been given adequate attention or
has seen implementation failure of a number of initiatives. The sector has been
receiving increased attention over the last few years. At114
ent there are eleven major pres
programmes with the total outlay Rs 3 billion FY 2005/06.
Table 9.4: Ongoing programmes in literacy and non-formal education Sr. Programme Agency No. 1 President Education Sector Reform Programme Federal Government
(PESR)
(Rs million) Amount
100
2 Adult Literacy Programme National Commission for Human 1,000 Development (NCHD)
3 100 percent Literacy in 4 Model Districts Mandi Punjab Literacy and Non-Formal 245 Bahauddin, Khushab, Khanewal and D.G.Khan Education Department
4 Crash Literacy Programme for Women in 10 Punjab Literacy and Non-Formal 28 Districts of Southern Punjab Lodhran, R.Y.Khan, Education Department Rajanpur, Bahawalpur, Bahawalnagar, Layyah, Muzaffaragarh, Multan, Vehari and Bhakkar
5 Literate Punjab Programme 100 percent Literacy in Punjab Literacy and Non-Formal 331 10 Union Councils of Each of 31 Districts of Punjab Education Department
6 Establishment of Provincial Literacy Management Punjab Literacy and Non-Formal 12 information system (LITMIS) Unit Education Department
7 Post Literacy and continuing Education Programme Punjab Literacy and Non-Formal 2 5 Centres for Matriculation Pilot Project in Education Department Faisalabad
8 Literacy for All (LFA) Programme Elementary Education Foundation 352 (EEF) NWFP
9 Non-Formal Basic Education Schools Project Federal Ministry of Education 500 10 District Governments Programmes for Literacy and District Governments 230
Non-Formal Education 11 NGOs and INGOs Programme (Estimated Budget) Federal Government/UNESCO 200
• LIFE Total 3,000
9.7.7.3.9 The outlay for the above projects remains below the requirement. There is a need for all
governments (federal/provincial) to increase priority for literacy. This requires launching a
Total Literacy Programme (TLP) which will take at least one union council from each
district and adopt a model union council approach focusing on:
114
Education For All, MDA Country Report 2008.
176
Poverty Reduction Strategy Paper-II Chapter 9 - Pillar VI: Human Development for the 21st Century
Establishment of adult literacy centers by adopting integrated approach i.e. basic
literacy, functional literacy (post literacy) and income generating skills;
Establishment of non-formal basic education schools for out of school children and
child labour;
Universalization of Primary Education (UPE) in respective union councils; and
PPPs.
9.7.7.3.10 In addition to the above, Pakistan has, for the first time, developed a curriculum for literacy
along with guides to assist implementation.
9.7.7.8 Quality:
9.7.7.8.1 Curriculum: As shown by results of NEAS and PEAS quality of educations remains a
concern for the country. There has been an increase in attention to this area but much more
needs to be done. The main components impacting quality are: curriculum; textbooks;
teachers; assessments; and school environment. The Federal government prepares the
curriculum and the provincial governments prepare the textbooks. However, the final
approval of textbooks lies with the federal government.
9.7.7.8.2 Starting with curriculum, the Federal government has revised curricula for 24 subjects and
introduced standards based curricula in these. Revision process for other subjects
continues. The USAID through its ED-LINKS programme has assisted the Ministry of
Education (MoE) in developing National Teacher Pacing Guides for new curriculum.
9.7.7.8.3 Additionally, in recognition of the changes in the modern world, the MoE plans to realign
the curriculum to the knowledge era. Creations and sharing of knowledge will be key assets
to this era. Designing education for the knowledge era will involve the followings:
To define a curriculum for the compulsory school years that is foundational for lifelong
learning;
To design a curriculum that is free from the shackles imposed by the use of schools as a
fitting and sorting devices for limited territory places;
To design and develop assessment practices which measure what we value rather than
value what we can currently measures; and
To continue to develop educational practices for transformative learning.
9.7.7.8.4 Textbooks & Learning Materials: To improve the quality of textbooks, the MoE has introduced National Textbook & Learning Materials Policy in 2007. It will provide a choice
to learners and healthy competition among publishers. The schools will have the opportunity to
choose from a set of textbooks as opposed to the current situation of a single
prescribed textbook. With competition it is expected that the quality of textbooks will also
improve.
177
Poverty Reduction Strategy Paper-II Chapter 9 - Pillar VI: Human Development for the 21st Century
9.7.7.8.5 Under the new policy, MoE will introduce a well regulated system of competitive
publishing of textbooks and learning materials while promoting PPPs. There is also a
provision in the policy to transform Textbook Boards into competent facilitating, regulating
and monitoring authorities which shall review and approve textbooks for use in schools in
their respective areas of jurisdiction.
9.7.7.8.6 Salient Provisions include:
Establishment of an "Inter-Provincial Standing Committee on Textbook Policy" to
regulate operational and procedural issues, and monitor and coordinate further
implementation process;
Formation of a Provincial Committee to select and prescribe textbooks for use in public
schools in the respective province or areas of jurisdiction;
Federal and Provincial Governments will increase public investment in school libraries
and school educational materials, teacher resource books and guides, and will provide
adequate regular budgets to schools for that matter; and
Resource Centers will be established at Federal and Provincial levels with the support
of Federal Government through development partners.
9.7.7.8.7
9.7.7.8.8
9.7.7.8.9
Already the provincial governments have embarked on implementing the policy and private publishers are involved in preparation of textbooks. The Government of Punjab has also initiated a programme for improving capacity of the private publishers to develop
textbooks. Government of Sindh has also initiated work on development of multiple
textbooks.
Teachers and Teachers Professional Development: Quality, status and conditions of
teachers remain a challenge. There are weaknesses and gaps in the quality of teacher
training, and in the system of teachers' professional development.
The majority of teacher educators and teacher training institutions are out of touch with the
day-to-day realities of student needs and classroom experiences. In fact, teacher training
programmes are supply-driven, lecture-oriented, and not in line with the much needed
professional development of teachers. The programmes focus on addressing the symptoms of the
problems rather than the root causes. However, a number of recommendations exist, made by line
departments, donor agencies, head-trainers and teachers themselves. These have been collated to
formulate a Strategic Framework for Teachers' Professional
Development.
9.7.7.8.10 The MoE's 'Strengthening Teacher Education in Pakistan' (STEP) programme is to
completely overhaul the teacher education system in terms of policy, organization,
jurisdictional and institutional roles and responsibilities, contents and delivery at the school level. To
improve the quality of teacher's training, the setting up of standards for teacher's
178
Poverty Reduction Strategy Paper-II Chapter 9 - Pillar VI: Human Development for the 21st Century
certification and accreditation at national level as well as the policy framework gets
significant importance. The specific objectives of STEP are the followings:
To support development of a national policy framework for teacher education;
To support establishment of a national body for teacher certification and accreditation
of teacher training institutions and programmes;
To strengthen the networks of teacher's professional development initiatives and
institution and PPPs; and
To identify, scale up and disseminate information on best practices in teacher training
and education.
9.7.7.8.11 The Government of the Punjab has developed a cluster based teacher professional
development process with delivery system centered in the district. The modules and other
software as well as planning is housed in the Department for Staff Development.
9.7.7.8.12 The Government of Sindh is initiating work on teachers' professional development to
establish a competency based teacher education and continuous professional development.
9.7.7.8.13 The Government of the NWFP has been working through a cascade model for teachers
training for the last many years.
9.7.7.8.14 Assessment: Assessments remain a very weak link in the education delivery chain. Over
the years the assessment style has encouraged rote learning. The Federal Board was one of the first
ones to change the assessment mechanism to move towards an examination system
that tests concepts rather than simple information. A number of Boards in the country are
now replicating this model.
9.7.7.8.15 The Government of Punjab has established the Punjab Examination Commission to revamp
the assessment system in the province. It is still in a nascent state and will require
sometime before it can be evaluated. However, it expected to improve the quality of
assessment in the province and provide a good example for others to follow.
9.7.7.8.16 A number of reforms have been proposed in the draft NEP to improve the assessment
systems. These include moving towards curriculum based assessment and also rationalizing
the number of examination boards to reduce standardization issues.
9.7.7.8.17 For overall system assessment and measurement of quality, the National Education
Assessment System and the Provincial Education Assessment Systems for all provinces
and area governments were initiated with the assistance of the World Bank in 2005. It was
a pioneering effort in the country as previously the only measure of quality was the local
examination systems which themselves suffered from issues of standardization. In any case these
were specific to certain levels in the education system and their purpose was
primarily to test the student for the next level.
179
Poverty Reduction Strategy Paper-II Chapter 9 - Pillar VI: Human Development for the 21st Century
9.7.7.8.18 The government has taken over the recurrent budget while the World Bank and Department
for International Development continue to fund the development components. Currently
NEAS has not been able to develop linkages with system inputs to identify weaknesses and
propose system changes. There are plans to institutionalize the results into a feedback
mechanism for all qualitative inputs like curriculum, textbooks and teacher training.
9.7.7.9 Inclusion of Marginalized Children
9.7.7.9.1 The inclusion of marginalized children into mainstream education is placed on high
priority. Rural girls with disabilities are doubly discriminated against — disability and
gender.
9.7.7.10 Education Sector in Federally Administered Tribal Areas (FATA)
9.7.7.10.1 The Federally Administered Tribal Areas are some of the most underdeveloped regions of
Pakistan and thus need special focus. Only 17 percent of the overall population is literate
and among women literacy is as low as 3 percent. The low level of literacy is a significant cause for
concern, along with poor enrolment and high dropout rates. For both boys and
girls, factors that deter primary enrollment and discourage continuation into secondary schooling
include poverty, the perceived low economic impact of education, improperly sited schools
where they are most needed. An overly theoretical curriculum coupled with
poorly trained teachers, makes schooling less engaging for students.
9.7.7.10.2 Among girls, enrolment is affected by the shortage of girls' school and female teachers, as
well as social factors such as early marriages, cultural taboos and tribal enmities that make travel
hazardous. Poverty also affects girls more severely, since poor families who may be
able to invest in some education for their children will invariably award priority to sons.
9.7.7.10.3 Federal government programmes address quality assurance, school rehabilitation, training
and resource centers, technical and science education, adult literacy, and the Education for All
Programme. Other federal initiatives include streamlining madrassah; introducing the use of
information technology; scholarship for girls, talented students and teachers; and training of
school teachers. The Sustainable Development Programme (SDP) for FATA envisage
following objectives and strategies for development and progress of Education
sector.
9.7.7.10.4 The SDP aims to improve the functioning of the education system in order to make
education a major agent of change in the tribal areas. To achieve this objective, the
following broad strategic measures are required:115
Enhance awareness of the value of education;
Increase access to education at all levels, and across all agencies;
Raise the number of local teacher's particularly female teachers;
115
For details of SDP please see chapter 6.
180
Poverty Reduction Strategy Paper-II Chapter 9 - Pillar VI: Human Development for the 21st Century
Substantially decrease dropout and repetition rates;
Promote the acquisition of basic knowledge and skills;
Regularly assess classroom teaching and student learning; and
Develop accountability mechanisms for effective monitoring and evaluation.
9.7.7.10.5 Under these strategic measures, a detailed set of priority interventions in various sub-
sectors of education including: enrolment; capacity development; governance, student
learning and empowerment; and job relevance and role of private sector have been
designed.
9.7.7.11 Technical and vocational education and training (TVET)
9.7.7.11.1 Issues
9.7.7.11.2 The Technical and Vocational Education and Training (TVET) system has remained
fragmented, supply-driven, and lacking a national direction. The education strategy for the
PRSP-II period envisages a major overhaul of the system.
9.7.7.11.3 The philosophy behind the strategy for reforming the TVET system is to change it from a
supply-driven system to one that responds to the demand of the marketplace. The strategy
envisages the following major initiatives during the PRSP-II period: (i) adoption and
implementation of a National Qualifications Framework to ensure coherence of national
qualifications within the TVET system; (ii) shift to a system that is competency-based rather
than curriculum-based; (iii) to create a PPPs, in which the private sector can give much clearer
and more definite indications of the skills that they are seeking; and (iv) to
make a significant increase in the budget of the system so as to improve its physical
infrastructure and to attract the requisite amount and quality of teachers.
9.7.7.11.4 In order to cope with the requirements of fast developing economy, to gear up employment
generation and meet the challenges of Word Trade Organization and globalization, it was
absolutely imperative to realign Technical and Vocational Education & Training (TVET)
system in the country to cater for these requirements. National Vocational and Technical
Education Commission (NAVTEC) was established in 2006 to oversee:
Policy and Planning;
Standards setting and Regulation;
Curricula Development;
Certification and Accreditation;
Demand Assessment and Research; and
Others such as facilitating PPPs, establishing national and international linkages,
coordination with provincial governments, training of trainers etc.
9.7.7.11.5 The National Vocational and Technical Education Commission is assisting provincial
181
Poverty Reduction Strategy Paper-II Chapter 9 - Pillar VI: Human Development for the 21st Century
governments in the area of skill development, facilitating PPP at the national level,
coordinating national sectoral training policies and acting as a catalyst. The NAVTEC is
paying special attention to creation of linkages with the labour market. One of the intended
directions of the Commission's work will be to transform the current supply driven TVET system
into a demand driven one. The TVET trainees can thus be ensured of their
employability in the labour market.
9.7.7.12
The Way Forward for TVET
TVET institutes will be subject to performance evaluation by provincial authorities
based on expected outcomes, which will include development of linkages with local
industry;
A TVET Quality Council shall be set up to oversee the operation of the quality training
framework. This Council will work according to clearly defined powers and functions.
Uniform national standards for registration of training providers will be framed while actual
registration will remain with provincial governments. A system of federal audits
will be introduced for quality assurance of the system. 'Employer Satisfaction Surveys'
will be carried out to guide major policy decisions regarding relevance and quality;
Competency standards for TVET teachers and assessors will be developed. To remain
current with industry practices, two weeks' attachment in industry in a year of a TVET
teacher will be compulsory;
The Apprenticeship Ordinance, 1962 will be revisited and stakeholders consulted, in
order to make it more attractive for the industry as well as trainees. Incentives will be
introduced for employers and apprentices, rather than coercion and control. The new
apprenticeship model will have a support system: for attracting new apprentices and where
viable, for providing incentives to employers and benefits (such as stipends, tools
allowance) to apprentices. The qualifications earned by an apprentice will be reflected in
the National Qualifications Framework. Incentives will be targeted to
encourage apprenticeships in areas in which skills are short;
Currently only 3 percent of all students enrolled at all levels of education pursue a
career path by choosing the TVET stream of education. It is intended to double this
percentage during the PRSP-II period, and to aim that by the year 2030 at least 50
percent of students should be expected to choose a career through this system;
The TVET coverage will be extended to 100 percent of tehsils all over the country;
Females account for only about 30 percent of students enrolled in TVET programmes.
By expanding the number of scholarships for female students and bringing in more
female teachers, the aim is to raise this to 35 percent (of a substantially larger total) by
the end of the PRSP-II period, and thereafter to keep increasing it until by 2030 females
account for 50 percent of enrollment in the TVET sector;
Currently only 3.45 percent of the pubic sector budgetary allocation for Education goes
to TVET. This allocation will be doubled by the end of the PRSP II period and steadily
182
Poverty Reduction Strategy Paper-II Chapter 9 - Pillar VI: Human Development for the 21st Century
increased in each subsequent PRSP period so that it reaches 40 percent by 2030;
Regulations will be reformed so that TVET institutions become more autonomous in
their day-to-day operations. TVET institutes will be able to retain part of their earnings
generated through commercial activities;
A National Qualifications Framework will be adopted to ensure coherence of all
national qualifications within the TVET system;
Introduction of TVET at the secondary school level will be encouraged so that an
increasing percentage of school pass-outs enter the TVET stream each year;
A sector-based approach will be adopted to measure demand in sectors of importance.
This will be done through research led or undertaken by Sector Skills Councils
supported by the government. Research into demand for skills will feed into national
and provincial training plans. Demand for skilled labour abroad, especially in countries
where Pakistani labour force is exported, will also be assessed;
Access to TVET will be increased. Each district of Pakistan will have at least one
technical education institute and each tehsil of Pakistan will have at least one
vocational training institute. While expanding the geographical coverage of the TVET, it will
be ensured that training in the new TVET institutes conforms to the needs of the
local economy; and
Regions such as Balochistan, Federally Administered Tribal Areas (FATA), and
Northern Areas have a relatively low coverage of TVET compared with other regions and
provinces. Special seats in TVET institutes, country-wide, will be reserved for youth from
disadvantaged regions. To ensure their employability at home and abroad, apprenticeships of
shorter duration will be arranged in industrial areas. Flexible
learning methods will be used to reach far-flung communities.
9.7.7.13 Higher Education
9.7.7.13.1 The Higher Education Commission (HEC) aims at creating the necessary foundations on
which excellence can flourish and Pakistan can enter effectively into the global knowledge- based
economy. Three major issues need to be addressed in order to develop the higher
education sector. These are: (a) access; (b) quality; and (c) relevance to national needs.
9.7.7.13.2 The present MTDF of HEC aims at increasing the access to Pakistan's higher education
institutions by doubling the enrolment (from 341,168 in 2007 to 513,533 in 2010). This will be
achieved by increasing the capacity of existing higher education institutions and,
where necessary, establishing new ones.
9.7.7.13.3 The present quality of higher education falls short of requirements. Not a single Pakistani
University is ranked among the top 500 of the world. A number of steps to improve quality are
planned, which include: faculty development; infrastructure improvement; attainment
of excellence in research; and making the system relevant to national priorities.
183
Poverty Reduction Strategy Paper-II Chapter 9 - Pillar VI: Human Development for the 21st Century
9.7.7.14 Faculty development
9.7.7.14.1 At present, out of 7000 faculty members in Pakistani universities, only 1700 have PhD
degrees. Each of the 60 public sector universities needs to have a faculty of at least 300-
400 persons with a PhD (i.e., at least 15-20 per department) before it can be regarded as a
genuine university. For this purpose an additional 15,000-20,000 persons will need to be sent for
PhD level training to suitable foreign institutions in fields of national priority. This
foreign PhD level training will help to develop a cadre of highly qualified men and women
who can carry out teaching and research in universities and also act as consultants to
industry. This foreign PhD level training, combined with the indigenous PhD programme and the
foreign faculty-hiring programme, will provide the core element of quality human
resources essential for public sector university education.
9.7.7.15 Infrastructure upgrading
9.7.7.15.1 Each public sector university will be upgraded in terms of availability of books, journals,
scientific equipment, consumables, teaching aids, and high-speed Internet connectivity. It will also
be equipped with sports and other facilities so as to provide the requisite
environment for quality education.
9.7.7.16 Research quality
9.7.7.16.1 International linkages, access to research grants and post-doctoral training programmes will
also help to improve quality. Governance; financial management systems; curricula;
examination system; and quality assurance systems in the universities will be constantly
improved in order to bring these to international standards.
9.7.7.16.2 The Pakistan Educational Research Network (PERN) will be expanded and its performance
further improved so that the materials available on the internet can be readily accessed, and
faculty resources can be shared through video-conferencing.
9.7.7.16.3 Relevance to National Priorities
9.7.7.16.4 In order to transform Pakistan into a 'knowledge-economy,' specific projects and
programmes have been identified as priority national programmes. The human resource
development effort will be tailored to meet the human resource requirements of these
programmes. These include transition of the agriculture sector to one that is engaged in
high value-added production, information technology, biotechnology, engineering sciences,
pharmaceuticals, material sciences, basic sciences, social sciences, economics, finance, and
other disciplines.
9.7.7.16.5 The curricula for these fields have already been modified in consultation with experts and
the private sector to make them relevant to market demands and the needs of the society as well as
emerging international opportunities. During the PRSP-II period, these curricula will
progressively be adopted by higher education institutions; the HEC will monitor and ensure that
this is done. The establishment of technology parks, business incubators, and funding of joint
projects with industry are expected to transform the universities to creative
184
Poverty Reduction Strategy Paper-II Chapter 9 - Pillar VI: Human Development for the 21st Century
and vibrant institutions where new ideas are born and transformed into commercial
products and processes.
9.7.7.16.6 The role of education in poverty eradication, in close cooperation with other social sectors,
is crucial. No country has succeeded if it has not educated its people. Not only is education
important in reducing poverty, it is also a key to wealth creation. As investment in
education as a poverty reduction strategy can enhance the skills and productivity among poor
households, on the one, and eliminate role of poverty as a constraint to educational
achievement as children of poor households receive less education, on the other. The
PRSP-II presents a holistic medium term policy framework covering all the tiers of
education sector with an aim to achieve MDG targets for education, thus leading to
creation of knowledge economy and a more prosperous future.
9.8
9.8.1
(2) Health
The Universal Declaration of Human Rights states, "Everyone should have access to health
care, education, water and sanitation and, when times are hard, social security." The health- poverty
nexus is well established. Ill health contributes to poverty: 'catastrophic costs' of illness which can
rapidly plunge households into poverty; reduced earning capacity when ill; and the need to
consider how this impacts on adult men, who are likely to remain the main income earners in many
households; and the burden of caring for the sick, which falls unduly on women. Poor people suffer
disproportionately from disease; and women and
children are particularly vulnerable.
9.8.2 Health Status of the People of Pakistan
9.8.2.1 Pakistan's estimated population of 163.8 million is growing at an annual rate of 1.9; the total fertility rate is currently reported at 4.1, which is 30 percent higher than its South
Asian neighbours. Both the Infant Mortality Rate (IMR) and Under Five Mortality Rate
(U5MR) have steadily declined since 1990; however, the rate of decline over the last fifteen
years has been considerably slower than its South Asian neighbours — IMR declined by
21percent in Pakistan during 1990 and 2005, less than half the decline in Bangladesh and
Nepal where IMR declined 46 and 44 percent respectively — and Neonatal Mortality Rate
has remained relatively intransigent. In addition, available data suggest that there has been no
change in malnutrition levels in children, with the percentage of under-five children who are
under-weight ranging from 33-45 percent. This snapshot of health status indicates that Pakistan is
far from achieving the health related MDG targets. To achieve these targets Pakistan will have
to significantly improve the
performance of its health sector.
9.8.2.2 Despite the slow progress towards health related MDGs and other health outcomes, there is
evidence that Pakistan has made some level of progress particularly at the intermediate
outcome level. This can be attributable, in part to the increase in public expenditure on
health as envisaged in the I-PRSP and PRSP-I and to the sustained focus on prevention and
control of preventable diseases. Expansion of the Lady Health Workers Programme in the rural
areas has contributed to improving primary health care, although many gaps still
185
Poverty Reduction Strategy Paper-II Chapter 9 - Pillar VI: Human Development for the 21st Century
remain to be addressed. In addition, intermediate maternal and child health outcomes have
also shown improvement during the last five years; this is evidenced by the increase in antenatal
and post natal care — ANC increased from 35 to 61 percent and PNC increased from 9 to 22
percent during this period of time, as reported by the PSLM surveys. Similarly, skilled
attendance at birth increased from 24 to 36 percent during the last five years; the percentage of
fully immunized children increased from 53 to 76 percent, and
TT2 coverage in women improved from 35 to 58 percent during the same timeframe.
9.8.2.3 In addition, recent reports of the TB case detection rate at 69 percent and cure rates at 87
percent are encouraging despite limitations of the reporting system in terms of its inability
to take into account cases which report to private sector healthcare providers.
9.8.2.4 Despite these achievements, the sector continues to face significant challenges, which pose
an impediment to progress. Key issues are summarized below:
9.8.3 Key Issues and Challenges
9.8.3.1 Slow progress in achieving health specific MDGs and other health outcomes remain the
major challenge faced by the health sector. This can be attributed to contributing factors both
external and internal to the sector. External factors largely include causes implicit in the social
determinants of health; these include illiteracy, unemployment, gender
inequality, social exclusion, lack of access to safe drinking water and inadequate sanitation
and food insecurity; the stresses of urbanization and a range of environmental determinants of health
add to these challenges. Inherent factors contributing to inadequate performance of the health sector
are deep rooted. These include weak management and governance systems; partially
functional logistics and supply systems; poorly motivated and inadequately compensated
staff, lack of adequate supportive supervision, lack of evidence based planning and decision
making, low levels of public sector expenditures and their
inequitable distribution. As a result coverage and access to essential basic services remains
limited and unequal with poor quality of services which are generally perceived to be less
responsive to community needs. The key programmatic and management challenges for the
sector can be summarized as follows:
9.8.3.2 Limited coverage of quality services
9.8.3.2.1 The delivery and coverage of quality essential health services needs to be ensured on a
universal basis especially in rural and underdeveloped areas. Access issues emerge as a result of
staff unavailability; absenteeism; security risks; poor supervision; and interrupted supply chains.
Additional investments in the health sector are needed to offer and ensure better access to quality
essential services, which should include reproductive and child health, nutrition and control of
communicable diseases as well as the emerging challenge of non-communicable diseases (NCDs)
and to develop strategies to address risk factors
related to NCDs and injuries. Health delivery system is not properly equipped to deal with
emergency and disaster situations. All these issues are known to have major impacts on
macroeconomic growth and on poverty. A key challenge is rapidly rising population which
continues to undermine health gains and needs strong political commitment and priority
186
Poverty Reduction Strategy Paper-II Chapter 9 - Pillar VI: Human Development for the 21st Century
ensuring provision of family planning services across all health outlets and at the
community level.
9.8.3.3 Management and governance issues:
9.8.3.3.1 The public health sector at all the three levels of management and governance — federal,
provincial and district — is overly centralized and faces serious management and
governance challenges, which in turn limit its ability to deliver. Management challenges arise
due lack of clear roles, responsibilities and prerogatives at the three levels of government
and multiple, often conflicting directions coming from different levels. Devolution in the
sector is incomplete with weak accountability mechanisms and management capacity at the
district level. Recent analyses indicate that services delivery at the district level and below
continue to face many of the systemic problems, which
characterized the earlier centralized arrangements; as a result, the benefits that devolution
could deliver to the population are not being actualized. The recent initiative to strengthen
management or contract out management at the primary healthcare level has shown
improved utilization of services at first level care facilities. However, the initiative needs a
comprehensive overall assessment before further expansion and ways and means to
institutionalize it.
9.8.3.4 Unharnessed role of private providers:
9.8.3.4.1 Pakistan has a large and growing private, philanthropic and non-state health sector
providing services at various levels, particularly in the domain of curative care. The is
cognizant of the fact that improving health outcomes and access to essential services is unlikely
to be achieved without working closely with the non state sector; in this regard,
unevenness of services, absence of appropriate regulatory and institutional frameworks to
protect the rights of the consumers pose a challenge. An additional overarching issue,
which complicates the public private divide further is dual practice of public providers.
9.8.3.5 Weak stewardship functions:
9.8.3.5.1 The existing health system lays little emphasis on stewardship functions of the state
agencies in health; these functions include setting strategic policy directions; monitoring and
evaluation; measuring performance; detecting disease trends and epidemics; regulating quality
standards of healthcare; and guiding human resource production and development
and deployment. An additional issue is clearly defining health sector policy and its
monitoring. At present strategic direction and sector priorities are not synchronized among
various policy, strategic and programme's documents — a gap that is currently being
bridged through an effort that will be described later.
9.8.3.6 Low levels of public health investments:
9.8.3.6.1 The public sector in Pakistan continues to spend less on health than most countries at the
same level of GDP despite the commitments enshrined in macro-policy documents— PRSP-
I, the Medium Term Development Framework and the Fiscal Responsibility Debt
and Limitation Act, 2005. Despite increasing expenditures in nominal terms, the real
expenditures as percentage of GDP have stagnated below 0.6 percent against the target of
187
Poverty Reduction Strategy Paper-II Chapter 9 - Pillar VI: Human Development for the 21st Century
0.92 percent. According to a recent civil society review on health financing the public
sector spends 0.54 percent of the GDP. Increasing resources without addressing
management challenges and appropriate prioritization is unlikely to improve performance
significantly. However, as the system starts to improve performance by programmatic and
management reforms, additional resources will be needed.
9.8.4 PRSP-II: Changing for the Better
9.8.4.1 The PRSP-II is an opportunity to bridge many of the aforementioned gaps and weaknesses
in the health system. It is opportune that the development of PRSP-II has commenced at a
time cycle when two other overarching strategic planning exercises relevant to the health
sector are coming to fruition: (i) chalking out of a new vision for the Medium Term
Development Framework (MTDF) of the Planning Commission for the years 2011-2016; and (ii)
ongoing work to develop a new vision for a National Health Policy. With regard to the latter there
are two planning and consultative exercises running in parallel which are meant to complement
each other. One is the work of the 'Health Policy Task Force', which has six working groups and has
come up with recommendations after a set of consultative
deliberations. The other relates to the process of setting directions for the new health policy by the
civil society, which has culminated in the creation of the 'Gateway Health Policy Scaffold', under
an agreement with the Ministry of Health. Regarding this as an ideal setting to revise goals,
objectives and strategic directions with reference to health in these
three planning instruments — PRSP-II, MTDF and the National Health Policy — state
agencies in partnership with a civil society think-tank have developed a unified vision for the
health sector in Pakistan, which draws on the Policy Objectives of the Gateway Health Policy
Scaffold. This takes cognizance of the need to strengthen health systems to deliver on program
targets, addressing weaknesses in existing programmes and drawing on a broader constituency
of actors in the inter-sectoral scope to improve health outcomes in
Pakistan.
Box 9.1: Government commitments during PRSP-II timeframe Save 350,000 addirional lives of children; Save additional 7,000 lives of mothers; Eradicate polio; Prevent 1.5 million children from becoming malnourished; Provide family planning services to 2.5 million additional couples; Avert 5 million new TB cases; Immunize12 million children against Hepatitis B; and Reach 40 million poorest people of Pakistan to ensure provision of essential package of service delivery.
9.9 Policy Objectives
9.9.1 The policy objectives for health systems reform set a vision for a future health system that:
Effectively addresses social inequities and inequities in health and is fair, responsive
and pro-poor;
188
Poverty Reduction Strategy Paper-II Chapter 9 - Pillar VI: Human Development for the 21st Century
Supports people and communities to attain the highest possible level of health and well-
being;
Reduces excess mortality, morbidity and disability and care-givers burden — especially
in poor and marginalized populations;
Mitigates risks to health that arise from environmental, economic, social and behavioral
causes;
Meets the specific needs of health promotion as well as treatment, prevention and
control of diseases; and
Is there when you need it — a health system that encourages you to have your say, and
ensures that your views are taken into account.
9.9.2
9.9.3
The principles that support this vision are grounded in the principles of equity, solidarity,
social justice, people-centered priorities, gender mainstreaming, community empowerment, universal
coverage for essential services, evidence-based decision-making the inter-sectoral approach to health,
outcome orientation, fair financing, quality management, subsidiary
and technical and allocative efficiency.
The broad goals of the policy objectives and envisaged agenda for policy reform and their
respective strategies fall within the following eight domains and their corresponding
objectives:
Evidence and information: to garner an unyielding political and institutional
commitment to base decisions on evidence and institutionalize rational accountability of the
decision-making process; and to develop a sustainable health information infrastructure
and capacity within the health system to systematically collect,
consolidate, analyze, and interpret health data and information and relay it in a timely
manner for actions at appropriate levels.
Health in all policies: to regard health within an inter-sectoral scope in a broad
national and international policy context to ensure that people receive a clear benefit
from the health system in terms of health gain, which is concerned with health status
and social gains that is concerned with broader aspects of quality of life; to support
vulnerable households in managing hazards and risks and to build equity safeguards
with respect to the emergence of health as a sector within the market economy.
Health promotion: to enable people and communities to make appropriate use of
health services and to exercise control over their own health and well-being by ensuring their
participation in decisions related to the environment, which impacts their quality
of life.
Leadership and governance: to enhance transparency, effectiveness, efficiency and
responsiveness in governance by improving accountability to the people and to foster
evidence-based decision-making as the norm
189
Poverty Reduction Strategy Paper-II Chapter 9 - Pillar VI: Human Development for the 21st Century
Health financing: to maximize public sources of financing (revenues and social health
insurance) over private sources (out-of-pocket payments and private insurance) and to
enable universal coverage for a certain set of essential interventions through revenues
and provide alternative means of health financing for achieving the equity objective.
Service delivery: to ensure the delivery of a package of essential health services to all
citizens leveraging the strength and outreach of all stakeholders in the health sector — both state
and non-state and to ensure quality and equity and uphold ethical values in
service delivery.
Health workforce: to develop a health workforce appropriate to the needs of the
country's health system giving due attention to numerical inadequacies, issues relating to mal-
distribution and deployment, lack of diversity, problems with capacity building
and training and regulation; and to take into account the impact of reform in the areas of
decentralization, outsourcing, granting autonomy, PPPs, and other areas on the
health workforce and vice versa.
Medicines and related technologies: to make quality essential medicines and
technologies, critical for the delivery of the essential health package accessible,
affordable and consumer friendly on an equitable basis and to promote their rational
use in the health system.
9.9.4 The strategic priorities for the health sector articulated in a subsequent section emanate
from this vision, principles and broad goals.
9.10 Health priorities in PRSP-II
9.10.1 Analysis of the burden of disease (BOD) conducted in 1996 indicated that Pakistan bears a
double burden of disease; although the burden of communicable diseases, childhood illnesses,
reproductive health problems and malnutrition is high and remains to be tacked, non-
communicable diseases (NCDs) are fast emerging as the major contributors of death and
disability. The major brunt of all these diseases are borne by the poor —
communicable diseases and malnutrition are commoner amongst the poor and the
vulnerable whereas NCDs affect the economically productive workforce, lead to income losses,
lost productivity and are known to be the major contributors to health shocks. The
focus of the PRSP will therefore be to address all these disease dimensions which have
implications for poverty.
9.10.2 In previous years, the government of Pakistan placed poverty reduction at the heart of its
development policies, but focused only on dealing with diseases that occur predominantly among
the poor; it did not take into account other poverty reduction health related
approaches that could be embedded in service delivery and financing reforms. These
alternative entry points to health-related poverty reduction efforts, as stated by the Gateway
Health Policy Scaffold involve a number of restructuring arrangements which have now
been adopted by PRSP-II and include:
190
Poverty Reduction Strategy Paper-II Chapter 9 - Pillar VI: Human Development for the 21st Century
Prioritizing public sources of financing and prepayment mechanisms as a form of
financing health rather than at the time of service expenditures on the premise that this
is essential for macro-economic poverty reduction measures;
Using cash transfers/waiver and exemption systems as a targeting approach in order to
benefit the poor and institutionalizing this as part of Pakistan's existing Social
Protection Strategy and by establishing a legal and regulatory framework;
Prioritizing services relevant to the poor and reorienting government services towards
the disadvantaged through means that target benefits by virtue of certain characteristics
or eligibility criteria or adopt targeted approaches to reach specific population groups in which
the prevalence of poverty is high, such as women, who constitute over 73
percent of the poor in Pakistan and geographical areas inhabited mostly by the poor;
Prioritizing addressing diseases that affect the economically productive workforce and
therefore contribute to lost productivity, undermining of the income-generating capacity
and precipitating an acute poverty crisis and lastly, plugging leakages with
respect to coverage for the non-poor such as in the case of non-communicable diseases;
Ensuring that access issues do not emerge at the service delivery level where
management of state-owned Basic Health Units (BHUs) is handed over to the non-state sector
and ensuring that the package of essential health services is delivered regardless of management
arrangements. Additionally, ensuring that public resources in autonomous hospitals are
used to ensure that the poor are not excluded and support
objectives, which directly serve the equity objective;
Broadening the scope of heath related poverty reduction efforts will enable the state to
deliver health services more equitably and efficiently.
9.11 Strategic priorities
9.11.1 The strategic priorities of the health sector emanate from within the aforementioned
framework which include the following:
9.11.2 Enhancing resource availability: The Health Plan in the MTDF period envisages
increasing revenue allocations for health to deliver the essential health package. An amount of Rs 85
billion has been allocated for the development programme during the MTDF period 2005-10;
it includes Rs 53 billion for federal development health programmes and Rs 32 billion for
provincial development health programmes. However, the strategy will attempt to provide more
resources to the health sector and aims to increase public health expenditure from 0.6 percent to
0.85 percent by the end of PRSP-II period (in FY 2011-
12).
9.11.3 Essential services: The PRSP-II envisaged the following as being included within the
essential health services package:
Maternal & Child Health (MNCH) and Family Planning: Pakistan needs to improve the
performance of the health sector significantly to achieve targets articulated as part of Goals
191
Poverty Reduction Strategy Paper-II Chapter 9 - Pillar VI: Human Development for the 21st Century
4 and 5 of the Millennium Declaration. In addition to strengthening maternal and child
health services within the existing health system, this would warrant scaling up essential health
services through the National EPI Programme, the Lady Health Workers Programme (Family
Planning and Primary Health Care) and the newly launched National MNCH
Program and to maximize the synergies between these interlinked programs and further reinforce
linkages with existing nutrition programs. Ministry of Health has already developed a
framework to reinforce sector specific nutrition interventions; these will be
translated into a new Nutrition Programme.
Expanded Programme on Immunization (EPI) has played a key role in reduced
morbidity and mortality from childhood vaccine preventable diseases; coverage of fully
immunized children is reported to have increased over the last two decades; however data from the
Pakistan Demographic and Health Survey, 2006 indicates lower coverage (47 percent) than
what has been reported by PSLM survey data for earlier years. The immunization
programme is trying to respond to the systems level challenges by beefing up the cold chain and
district immunization programme, increasing coverage by focusing on low performing areas,
attempting to reduce dropouts and improving monitoring and
supervision systems; e.g. EPI programme has expanded its scope with the introduction of
Hepatitis V vaccination in addition to pentavalent vaccine; the feasibility of introducing
other vaccines is also being explored.
The programme is also attempting to get around overarching issues, such as the security
situation in NWFP and large scale population movements, which are responsible for the increase
in the Polio transmission during 2008 by continuing with the momentum built around the
National Immunization Days (NIDs) in NWFP and Balochistan; there will also be an emphasis
on improving the quality of the campaign in some districts of Sindh. The
Programme will continue with NIDs with implementing a new strategy to continue with NIDs in
security compromised areas and expand the use of monovalent vaccine during the
next three years.
To address the persistence challenge of child mortality at facility and community level, the
National MNCH and Lady Health Workers (LHW) Programmes will implement standard
protocols for management of common childhood illnesses and strengthen emergency neonatal
care at secondary level hospitals. In addition 12,000 CMWs will be deployed in different parts of
the country to reduce low birth weight babies, help in clean delivery to minimize sepsis, and
manage asphyxia and hypothermia at birth. To reduce mortality due
to diarrhea and respiratory infection, a BCC campaign to enhance hand washing will be
initiated through the LHWs Programme.
The health sector will specially focus on provision of Family planning (FP) services
through the health care network and community based workers by: (i) ensuring financing and
provision of at least three modern contraceptive methods and skilled manpower in all health outlets
of Departments of Health (DoHs)over the three years; (ii) strengthening the
provision of FP services and products through the LHWs at the doorstep of community,
192
Poverty Reduction Strategy Paper-II Chapter 9 - Pillar VI: Human Development for the 21st Century
especially in rural areas and exploring use of social marketing techniques and (iii)
Fostering greater functional integration between the two vertical institutional entities,
(MoH and DoHs vis-à-vis Ministry of Population Welfare and Public Works Department) in
order to maximize synergies for ensuring the introduction of a minimum uniform and
comprehensive reproductive health package in health and population outlets and move towards
better functional integration at the service delivery levels. The main constraint to be addressed
through above measures is to ensure commodity security and availability of
contraceptives in each and every health outlet.
In relation to maternal health, the National MNCH Programme will ensure training and
deployment of the new cadre of community midwifes—over the next three years, 12,000 CMWs
will be deployed in their own community. In addition, the LHW Programme will be
further expanded in line with the priorities of the new government from 92,000 to 120,000; further
expansion will be decided upon as part of strategic planning. The LHW Programme
intends to expand the scope of services focusing on introduction new methods of FP, low
osmolality ORS, zinc supplementation and non-communicable disease prevention, control and
health promotion. The National MNCH Programme will also expand provision of round the
clock comprehensive EmONC services through 214 DHQ/THQ hospitals and
round the clock basic EmONC services through 662 RHCs/THQ; it will promote the use of
standard management protocols to deal with obstetrical and neonatal emergencies with training
of doctors in anesthesiology and obstetrical surgical services to manage risk pregnancies at
sub-district hospital. To provide leadership and strengthen management of
maternal health services fully functional federal, provincial and district MNCH cells are
being created.
Pakistan's nutrition outcomes have been relatively intransigent over the last two decades, as
a result of which a significant burden of malnutrition and micronutrient deficiencies affects children
and women of child bearing age. The current global increase in food prices, which is affecting
Pakistan as well, is likely to compromise these outcomes further. The MoH will develop a
practical programme with an objective of improving the nutrition status of women of child-
bearing age and children below 3 years by improving the coverage of effective nutrition
interventions with a focus on the poor and marginalized. The focus of the proposed programme
will also be to scale up three interventions — salt iodization, promotion of breast feeding,
wheat flour fortification, and provision of zinc during
treatment of diarrhea. The program will pilot test interventions before scaling up including
management of severe malnutrition in young children, Vitamin A supplementation during the
neonatal period, use of "sprinkles" to see if it can also improve feeding practices as well, multiple
micronutrient supplementation for pregnant women and a conditional cash
transfer scheme targeted at the poor. A new National Nutrition Survey is being planned to
assess the situation and to establish benchmark for the new programme.
9.11.4 Communicable Disease Prevention and Control: The TB DOTS programme continues to
make progress and recent results are encouraging in terms of case detection and treatment
193
Poverty Reduction Strategy Paper-II Chapter 9 - Pillar VI: Human Development for the 21st Century
success. The programme will continue to follow its strategic plan with a special emphasis
on expanding TB DOTS through large network of tertiary care hospitals and working with the
private sector for provision through its large network. In addition, the Programme will expand its
laboratory network to ensure implementation of quality assurance guidelines for sputum
microscopy. A critical challenge will be to ensure uninterrupted availability of
DOTs medicines; this will be addressed by strengthening the logistics and procurement
system with adequate financing. The Programme's strategic plan will be updated based on the results
of TB prevalence survey and independent third party assessment of the
Programme.
9.11.4.1 In response to the endemic Malaria burden in Pakistan, the Programme will continue to
implement the Roll Back strategy with an emphasis on effective implementation of the
strategy in high risk districts, expand the use of ITNs and use of intermittent presumptive treatment.
In addition, a comprehensive strategy will to be developed to respond to other
vector borne diseases especially the ongoing epidemic of dengue fever.
9.11.4.2 The National HIV & AIDS Control Programme will enhance its response significantly to
the growing challenge of spread of HIV among injecting drug users and male sex workers. The
Programme will continue to contract out service provision through private and NGO sector. Over
the PRSP-II timeframe, focus would be on scaling up HIV preventive services
to the high risk groups, provision of treatment and care to the positive cases; control of sexually
transmitted infections (STIs), ensuring safe blood transfusion, changing behaviors
especially to address issues of stigma and discrimination and enhancing capacity of the
implementing partners. The Programme has developed contracting procedures and a rigorous
behavior and sero-prevalence surveillance which will be continued. A monitoring
mechanism to oversee service provision will be operationalized.
9.11.4.3 To address the growing burden and spread of Hepatitis infections, the National Programme
for Hepatitis Control is reviewing its strategic plan to focus on primary prevention through
expanding immunization for Hepatitis B in children, vaccination of high-risk groups,
establishing 150 screening and diagnostic centers and provision of Hepatitis treatment facilities
in tertiary hospitals in a phased manner. A behavior change communication
strategy would be implemented in order to target the general population.
9.11.4.4 The Ministry of Health has started taking initial steps towards an integrated Disease
Surveillance System. A field based epidemiological training program for young public health
professional has started. Over the PRSP-II time period, operational surveillance units will be
established at the federal and provincial headquarters linked with public health
laboratory networks. National Institute of Health and four Provincial reference labs will
provide laboratory backup for integrated communicable disease surveillance. As the system
develops, existing disease specific surveillance activities will be integrated.
9.11.5 Non-communicable diseases, mental health and injuries: During the PRSP II time
frame, the scope of public health interventions will be broadened to address diseases that
194
Poverty Reduction Strategy Paper-II Chapter 9 - Pillar VI: Human Development for the 21st Century
have remained neglected to date, but which paradoxically are the leading causes of death
and disability. Non-communicable diseases, which include diseases of the heart, diabetes, and
some cancers and chronic lung conditions account for 59 percent of the mortality in Pakistan
according to the Pakistan Demographic Survey data. These diseases affect the economically
productive workforce, result in income loss and lost productivity and lead to
catastrophic spending in health. The PRSP II will build further on the National Action Plan for the
prevention and Control of Non-Communicable diseases and Health Promotion in Pakistan
(NAP-NCD), a multi-stakeholder consensus driven plan of action to incorporate NCDs into
county health systems planning; a new national programme on NCDs will be
based on the NAP-NCD strategy, and will focus on health systems strengthening and
address issues that were part of earlier vertical disease planning.
9.11.6 Health systems interventions: The government's priorities, which gel with the vision,
principles and strategic of 'Policy 8/67' and on which work will commence in a phased
manner during the PRSP-II period are as follows:
National Health Scheme: The new government is working on the concept of a
National Health Scheme. Through this, the government is committed to ensuring access
to services and more explicitly access to a doctor for every citizen of Pakistan. The scheme
envisages registering all citizens at the level of the union council or sub district level and issuing
a health card with basic health characteristics; the card will entitle
citizens to services not provided by the state through private providers. The providers
will be compensated according to the number of patients seen — or by capitation. The provider
will refer cases of critical illness to district level hospitals (or whatever higher tier that is
required). The design, modalities and strategies will be pilot-tested before
nationwide expansion.
Management and Governance Reforms: The government has devolved political,
administrative and financial powers to the district governments in order to improve the
effectiveness of social services and accountability to the local population. The district system
has not yet achieved the desired success in improving quality of services. It is envisaged that
the district system will be reorganized under new statutes and
administrative arrangements.
Peoples' Primary Healthcare Initiative (PPHI): The PPHI has been started to
strengthen the management of PHC facilities, and the management of BHUs has been
contracted out to the rural support programmes. While administratively demanding, the reform is
very promising but need vigorous assessment to generate evidence for better value for money, as
compared with the present model of in-house provision. The new health policy will provide a
framework for PPP and outline ways and means to monitor
results.
There is considerable momentum towards granting greater managerial and financial
autonomy to tertiary government hospitals, especially in the province of Punjab and
195
Poverty Reduction Strategy Paper-II Chapter 9 - Pillar VI: Human Development for the 21st Century
NWFP and some of the hospitals under the MoH. However, a recent assessment
indicates that hospital autonomy has not been associated with any significant
improvements in provision of good quality services and that wherever improvements have
been reported, they are in the area of revenue generation and incentive sharing. During the
PRSP-II, hospital management and governance will be revisited with a view to exploring
avenues to match efficiency with equity in outcomes. The focus would be to strengthen
governance, increased efficiency and resource mobilization. In addition,
hospital reforms will also focus to developing information systems to reduce errors and costs,
promoting greater transparency, rational use of pharmaceuticals, development and
implementation of patients management protocols, in-service training of staff
maintenance of electro-medical equipment, etc.
Current Human Resource Planning, Development and Management: is focused on
doctors thus neglecting other important cadres such as nurses, midwives and
paramedics, other categories of female paramedics and professionals with competencies
in health systems domain. The MoH intends to pursue policies to minimize existing
imbalances, especially to improve the production and deployment of nurses, lady health visitors
and community midwives. Options will be explored for ensuring the
availability of the female health care providers at the community level through offering
better financial incentives and catering for their residential needs, etc. As part of this work it
will undertake a detailed analytical exercise to prepare a human resource strategic and
implementation plan. In addition, the new health policy will pursue the development and
strengthening of the health management cadre, separating clinical and management cadres and also
investing in training of hospital managers and ensure that investments are made to train, recruit
and retain people with the right health systems competencies. The plan will explore options
to initiate formal continuing education
through public health institutions and professional associations of healthcare providers
linked to their career development.
Emergencies and disasters: The health sector in Pakistan has inadequate arrangements
to respond to emergencies and disasters needing health care actions; in addition it has limited
ability to comply with the stipulations of the International Health Regulations. It is important
to learn lessons from different disasters during last few years and
establish a well-coordinated response and disaster relief efforts. Ministry and
Departments of Health will take the initiative to build capacity of the health sector for disaster
management, respond to emerging and reemerging infections devising an institutional
arrangement and implementing disaster management protocols; and plan at
national, provincial and district levels for an effective emergency response.
The MoH intends to ensure availability, affordability and access to essential medicines,
vaccines, supplies and commodities in all public health facilities. The MOH & DOH will
undertake health facility assessments on a regular basis to assess availability of medicines
and vaccines in the facilities. A Drug Regulatory Authority Act is also being
introduced along with measures to ensure quality of medicines with appropriate price.
196
Poverty Reduction Strategy Paper-II Chapter 9 - Pillar VI: Human Development for the 21st Century
Existing public financial management and procurement systems in the health sector are evolving
with changes in overarching civil service procedures. A strict financial discipline will
be maintained to avoid pilferage and promote judicious use of scarce public resources.
The existing internal audit system would be reviewed and strengthened. In addition,
work on the use of PPRA guidelines — to strengthen and ensure transparency of procurement
in the health sector — will be continued and will
be further strengthened.
9.11.7 Fostering partnership with the Private Sector: Over the last several years, the health
sector has initiated interventions where the 'financing' vis-à-vis 'provision' split in the
service delivery functions of the state has been used as a policy tool on the premise that this
makes service delivery more efficient and responsive. This has been tested in the case of
contracting out primary healthcare curative services to NGOs or private health sector mainly
for the HIV & AIDS and TB programmes and the Primary HealthCare restructuring initiative in
Rahim Yar Khan and later in the rest of the country. Most of these initiatives
have yielded some encouraging results and the challenge now is to sift evidence from pilot
interventions to upscale these models where feasible and needed.
9.11.7.1 An overarching issue in mainstreaming the role of the Private Health Sector in health for
service delivery is the lack of a regulatory framework for the sector. Although this is a difficult
area of public policy, the government will take initiatives to improve the quality of private health
services. Besides development of a conducive regulatory system for health
care, the MoH will: (i) encourage continuing education through professional associations of
healthcare providers; (ii) empower professional associations to manage a system of
certification/licensing of health care providers; (iii) introduce a voluntary accreditation system
for private clinics and hospitals; and (iv) mount public campaigns to educate consumers about
the dangers of seeking care from untrained healthcare providers and
through self-medication and helping to identify various categories of providers.
9.11.8 Strengthening Stewardship functions of the State: The federal Ministry of Health and
provincial Departments of Health have traditionally spent less time and effort on
strengthening their stewardship role. A greater emphasis on policy formulation, setting
strategic directions, outlining and safeguarding priorities, regulation, monitoring and
evaluation, financing and surveillance will enable the MoH and DoHs to perform more
effectively. The aim is to reorganize both the MoH and the provincial departments to
develop structures manned by skilled manpower to perform these functions.
9.11.8.1 The MoH will undertake a review of existing health related regulatory mechanisms and
will introduce new regulatory mechanisms, which will be focused towards standardization, quality
control and implementation by biomedical ethics in line with appropriate guidelines. The
process of development of regulatory authority would be undertaken in collaboration with the
private sector, other stakeholders and provincial governments, albeit
with careful attention to ethics and conflict of interest related considerations.
197
Poverty Reduction Strategy Paper-II Chapter 9 - Pillar VI: Human Development for the 21st Century
9.11.9 Testing innovations: During the PRSP II timeframe, the MoH will pilot test innovations in
service delivery and financing to guide future restructuring of the health system. Three specific
types of reforms that could be considered for piloting would include: (i) expansion of Employees
Social Security Institutions to broaden its base and specifically provide
social protection to employees of small units and farm workers; (ii) piloting community
financing schemes for households outside the formal sector; (iii) testing conditional cash transfer
and vouchers schemes in rural areas to protect the poor against catastrophic health
expenditures.
9.11.10Health information systems: The MoH and its partner organizations have taken many
steps to streamline health information systems. A performance assessment health sector has been
visualized; this process will be institutionalized and will be undertaken every year. Through the
collaborative efforts of a civil society think-tank, a mechanism has been developed to
periodically report on health indicators; this exercise has also garnered a
consensus on the current gaps within individual health information streams and the way
forward in terms of bridging them.
9.11.10.1 The Health Management Information System (HMIS) is being revised and a new District
Health Information System (DHIS) has been designed and is ready for roll out after
assessment. Over the PRSP-II time period DHIS will be made fully operational across all
facilities (DHQ and below) by activation of NHIRC (National Health Information Centre) and
in close collaboration with the provinces. In addition, MoH will develop an integrated
disease surveillance system initially focusing on communicable diseases and later
expanding to risk factors behavioral surveillance for non-communicable diseases; the
infectious disease component will be compliant with the stipulations of International
Health Regulations, 2005.
9.12 Measuring the Performance of Health component of PRSP-II
9.12.1 The MoH will work closely with the PRSP Secretariat and Federal Bureau of Statistics to
ensure timely collection of the desired data to tract trends especially by income quintiles. The
specific goal of performance measurement under the PRSP-II framework would be to ascertain that
data are segregated by income quintiles and by other variables relevant to
considerations of equity.
9.12.2 National Health Systems & Policy Unit established under the MoH will be strengthened to
serve the strategic function of reviewing, refining and reformulating the evidence based national
health policy with identification of cost effective pro-poor policy interventions. The unit will
be responsible for monitoring progress on PRSP-II indicators and will undertake regular
health sector performance assessments on key indicators disaggregated
by income, gender and geographical areas (including provinces and districts). The unit will
disseminate it through MoH's website and via media and will additionally report data on
the template provided by the publication entitled 'Health Indicators of Pakistan'. The
process was initiated under PRSP-I and will be institutionalized as part of PRSP-II. These
198
Poverty Reduction Strategy Paper-II Chapter 9 - Pillar VI: Human Development for the 21st Century
assessments would also become the basis for federal and provincial dialogue and setting
resource priority.
9.13 Health Sector in Federally Administered Tribal Areas (FATA):
9.13.1 Health indicators for FATA are incomplete and in many cases only estimates are available
highlighting the poor status of health care system. Infant mortality is estimated to be as high as 87
deaths per 1,000 live births while maternal mortality is thought to exceed 600 deaths per 100,000
live births. Access to health services is severely limited, with just one
dispensary, basic health unit or rural health center reported in 2004 for ever116
50 square y
kilometers of area, and these facilities are concentrated near the settled areas. Available
bed strength in the same year stands at 1,762 for all of FATA.
9.13.2 The major issue confronting the health sector is restricted access to health services,
especially for more vulnerable segments of the population. These restrictions are physical, as a result
of the great distances between health facilities; cultural, from the tribal custom of strict pardah
(veiling) among women, which limits their movement in the public sphere; and administrative,
owing to widespread absenteeism among staff, the prevalence of rent- seeking behaviour, the
allocation of health centers for public favour, and the practice of landowners nominating their own
chowkidars (watchmen) and peons. Ongoing initiatives of the federal government include:
national priority programmes including Expanded Programme on Immunization; Lady Health
Workers; and the control of HIV, malaria and
tubercolulosis; in addition to mobile hospitals; construction of new hospitals; rehabilitation of
existing facilities; and strengthening of the health directorate. The federal government is
currently in the process of finalizing a national maternal, newborn and child health
programme which, once implemented, will cover FATA with a proposed allocation of 700
million rupees for five years.
9.13.3 The SDP aims to ensure equitable access to health and guarantee quality services to all
segments of the population, particularly vulnerable and disadvantaged groups. The SDP presents
a comprehensive strategic plan and priority interventions to achieve this objective.
Some of these are presented below:
Focus on human resources and provide opportunities for the development of local
human resources by establishing paramedical schools and a medical college. This will also
help to strengthen the private sector by increasing the pool of available technical
personnel;
Upgrade the knowledge and skills of existing health care providers;
Empower communities to take action for better health care. This will be achieved
through an intensive information, education and communication strategy. Knowledge is
a vital tool in empowering individuals, households and communities. Communities will
be equipped with information about preventive and curative care; and
116
FATA Sustainable Development Plan (2006-2015), Civil Secretariat (FATA), Government of Pakistan, 2006.
199
Poverty Reduction Strategy Paper-II Chapter 9 - Pillar VI: Human Development for the 21st Century
Encourage the private sector and civil society to provide services in remote and
inaccessible areas, or areas where security is an issue.
9.13.4 Key priority interventions for the revamping of health care system in FATA include
dissemination of information to increase awareness; strengthening of health system through forging
of partnerships with civil society, religious organization and national and international
non-government agencies and by providing incentives to private sector; and
through establishing a comprehensive HMIS.
9.13.5 The PRSP-II takes into account health as a key determinant of economic growth and
development, as ill health is both a cause and effect of poverty. The strategy takes into account
the fact that aside from the serious consequences for social welfare, ill health deprives a country
of human resources and the high cost of ill health reduces economic growth and limits the
resources available for investment in public health. As a result, improving health is essential in
order to reduce poverty and is one of the primary objectives
of the human development strategy for reducing poverty.
9.14 (4) Access to Clean Drinking Water and Sanitation
9.14.1 Present situation and issues
9.14.2 It is estimated that at present more than 65 per cent of the total population in the country
has access to safe drinking water, including 85 percent of persons living in more than 500
urban places. About 55 percent of the rural population, living in about 30,000 large villages,
is served with planned water supply, while in about 20,000 rural settlements water supply schemes
are yet to be developed. Most of the urban water is supplied from groundwater, except for
the cities of Karachi, Hyderabad and part of the supply to Islamabad, which mainly use
surface water. Rural water supply is mostly from groundwater except in saline
groundwater areas, where irrigation canals are the main
source of domestic water.
9.14.3 The Ministry of Environment initiated a major Clean Drinking Water Programme117 under
two parallel phases: (i) Clean Drinking Water Initiative (CDWI) project, whereby 409 plants
have been installed one in each tehsil across country; and (ii) Clean Drinking Water for All
(CDWA) project, whereby 6035 filtration plants will be installed, one in each union
council. Work on the first phase has been completed whereas on the second phase it is in
progress.
9.14.3.1 The CDWI Project
9.14.3.1.1 Initially the project cost was Rs 495 million. Technical survey of 549 sites was completed
and work orders for 409 plants, (including three containerized plants) were released to complete
the task in a specific time schedule. Installation of all plants has been completed on schedule. The
authorities carried out a marathon consultation process with stakeholders
117
Now being run by the Ministry of Industries, Production & Special Initiatives, GoP.
200
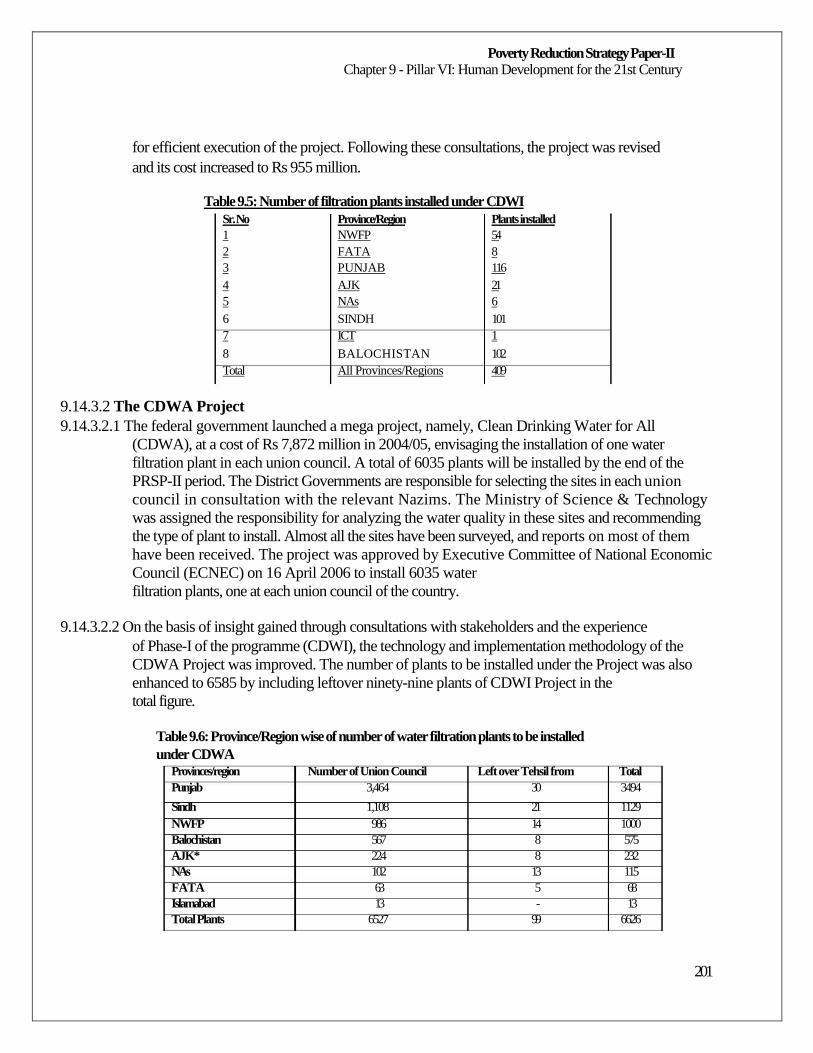
Poverty Reduction Strategy Paper-II Chapter 9 - Pillar VI: Human Development for the 21st Century
for efficient execution of the project. Following these consultations, the project was revised
and its cost increased to Rs 955 million.
Table 9.5: Number of filtration plants installed under CDWI
Sr. No 1 2 3 4 5 6 7
8 Total
9.14.3.2 The CDWA Project
Province/Region NWFP FATA PUNJAB AJK NAs SINDH ICT
BALOCHISTAN All Provinces/Regions
Plants installed 54 8 116 21 6 101 1
102 409
9.14.3.2.1 The federal government launched a mega project, namely, Clean Drinking Water for All
(CDWA), at a cost of Rs 7,872 million in 2004/05, envisaging the installation of one water
filtration plant in each union council. A total of 6035 plants will be installed by the end of the
PRSP-II period. The District Governments are responsible for selecting the sites in each union
council in consultation with the relevant Nazims. The Ministry of Science & Technology
was assigned the responsibility for analyzing the water quality in these sites and recommending
the type of plant to install. Almost all the sites have been surveyed, and reports on most of them
have been received. The project was approved by Executive Committee of National Economic
Council (ECNEC) on 16 April 2006 to install 6035 water
filtration plants, one at each union council of the country.
9.14.3.2.2 On the basis of insight gained through consultations with stakeholders and the experience
of Phase-I of the programme (CDWI), the technology and implementation methodology of the
CDWA Project was improved. The number of plants to be installed under the Project was also
enhanced to 6585 by including leftover ninety-nine plants of CDWI Project in the
total figure.
Table 9.6: Province/Region wise of number of water filtration plants to be installed under CDWA
Provinces/region Number of Union Council Left over Tehsil from Total Punjab 3,464 30 3494
Sindh 1,108 21 1129 NWFP 986 14 1000 Balochistan 567 8 575 AJK* 224 8 232 NAs 102 13 115 FATA 63 5 68 Islamabad 13 - 13 Total Plants 6527 99 6626
201
Poverty Reduction Strategy Paper-II Chapter 9 - Pillar VI: Human Development for the 21st Century
* 41 sites of Town/Municipal Committee of AJK have recently been included by the National Project Steering Committee on 4th July 2008, thus increasing the number of sites 6626.
9.14.3.2.3 Volume/Categories of plants as per new design
500 gallons per hour for rural areas; and
1000 gallons per hour for urban areas.
9.14.3.2.4 The implementation of the CDWA project is proceeding well. Contracts for the NWFP, FATA, NAs, Sindh and Balochistan have been awarded, and the contractors have started
their work. The award of contract for Punjab, AJK and ICT will be completed shortly.
9.14.3.2.5 After the completion of CDWA, the Government of Pakistan may consider initiating Phase
-III of the clean drinking water programme, which envisages installation of one water
filtration plant in every village of the country having population of 1000 individuals or
more. This Phase is, however, in its planning stage.
9.15 The way forward
9.15.1 The World Summit on Sustainable Development (WSSD) 2002 held in Johannesburg set
its Plan of Action in line with MDGs. This summit recommended: (i) halving by 2015 the
proportion of people without sustainable access to safe drinking water; and (ii)
safeguarding human health by improving the quality of drinking water. In the case of
Pakistan, these recommendations translate to increasing water supply and sanitation
coverage to 93 percent and 90 percent respectively by 2015. While the water supply and
sanitation programmes are being accelerated, it is likely that the envisaged MDG targets of water
supply and sanitation coverage might not be fully met. However, the target of regularizing 75
per cent of katchi abadis (temporary settlements) with adequate access to
water supply and sanitation will be fully met by the end of the PRSP-II period.
9.15.2 Considering the present resource position and sectoral constraints, the safe water supply
coverage will be increased from 65 percent population in FY 2004/05 (urban 85 percent,
rural 55 percent) to 76 percent by 2010 (urban 95 percent, rural 65 percent), thereby
serving an additional 27 million persons in five years. Water requirements in 2005-10 include (i)
7.8 million acre feet for domestic and municipal and rural potable water supply and sanitation; (ii)
industrial water requirement of 4 million acre feet, and (iii) 1.5 million acre feet to meet water
requirement for environment for the wetland areas, environmental
protection, and irrigated forestry along railway lines and roads.
9.15.3 In rural areas, safe drinking water will be provided in accordance with the stipulated norms
on a sustainable basis to all the villages. The stipulated norms of supply in rural areas are a minimum
of 5 gallon or 20 liters per capita per day safe drinking water within a walking distance of 1.5
kilometers, or at an elevation difference of 100 meters in hilly areas.
MTDF's rural water supply and sanitation programmes will ensure that by 2010 (i.e. the
end of the PRSP-II period) all villages with a population of 100 households or 1000
202
Poverty Reduction Strategy Paper-II Chapter 9 - Pillar VI: Human Development for the 21st Century
persons and above are served with planned drinking water supply, along with sanitation
and drainage schemes on a sustainable basis.
9.15.4 A National Drinking Water and Sanitation Policy along with the Clean Drinking Water for
All Programme will be launched by the Ministry of Environment as an integral part of
MTDF, focusing on provision of clean drinking water to the entire population; improving and
expanding delivery of water services; ensuring conservation of water and increasing system
efficiencies; and maximizing the coverage of sanitation services in both urban and
rural areas. The policy will link the water and sanitation to national development goals and to protect
the environment through: (i) improving water and sanitation management so as to reduce the
inefficient use of water and excessive groundwater pumping; and (ii) reducing pollution by
urban and industrial users through on-site or combined wastewater
treatment and reuse.
9.15.5 The main aim of the strategy is to improve the performance and utilization of water supply
and sanitation systems and reduce financial dependence on the federal/provincial
governments. It aims to do this by improving planning and management of capabilities of the
involved agencies; by encouraging the involvement of communities in general and women in
particular; and by promoting community responsibility, particularly for operation and
maintenance. The strategy includes: (i) adoption of an integrated approach,
rational resource use, and the introduction of water efficient techniques; (ii) containment of
environmental degradation; (iii) strengthening of institutional capacity building and human resource
development; (iv) improvement of sanitation through sewerage and drainage
schemes; and (vii) strengthening understanding of the linkages between hygiene and health
through community education campaigns, especially among women and children.
9.15.6 To make the programmes people-friendly, the rural water supply and sanitation schemes
will be designed to be simple, community-based, and use locally familiar technologies. The preferred
schemes include hand pumps; gravity schemes; street pavements; and drains that minimize
environmental damage. Priority will be given to reducing water losses through
wastages and leakages, and to the rehabilitation of existing networks.
9.16 (3) Sanitation and Solid Waste Management
9.16.1 According to a recent World Bank report the mean estimated annual cost from inadequate
water supply, sanitation and hygiene is about Rs 112 billion. The Government of Pakistan
recognizes that there are clear links between sanitation, water, health and economic
productivity. The government is aware that progress in sanitation not only has direct impact
on MDG 7, in relation to environmental sustainability, but also has impact on MDGs 1, 2, 3 and
4118, and indirect impact on other MDGs. The government recognizes the cost of sanitation in
the far-reaching effects it has on the dignity and fundamental rights of all its
population, but on women and girls in particular. In addition to the above, poor solid and
118
MDG 1 - poverty and hunger; MDG 2 - Universal Primary Education; MDG 3 - gender equality and empowerment of
women; and MDG 4 - child mortality.
203
Poverty Reduction Strategy Paper-II Chapter 9 - Pillar VI: Human Development for the 21st Century
liquid waste management systems cause an increase in the threat posed by bird hits to the
aircrafts as well as damage our assets in oceans. The challenge is how to scale up coverage
of improved sanitation and waste management facilities to poor households.
9.17 Key challenges
9.19.1 Coverage of sanitation facilities: Improved sanitation facilities are available to only 58
percent of the total population of Pakistan. With the exception of a few big cities sewerage
is almost non-existent causing serious public health problems. Nearly 25 percent of all
households do not have access to latrines, about 9 percent in urban areas and 40 percent in
rural areas; 51 percent of all households are not connected to any form of drainage; 35
percent to open drains and 16 percent to underground sewerage or open drains.
9.19.2 Poor management of underground sewage systems: Large and intermediate cities have
underground sewage systems which are subject to danger of collapse due to poor
management and negligence. Most of the sewage is released untreated into the natural
water bodies resulting in severe contamination of natural water bodies, making water
injurious to human and aquatic life.
9.19.3 Urbanization and katchi abadis: About 30 percent of urban population lives in katchi
abadis and slums with inadequate sanitation facilities. With an urban growth rate of 3.5 percent,
almost twice the rate of population growth, Pakistan is facing a rapid urban
transition. Amongst the issues this creates is that of poor and unplanned urban services, including
inadequate housing conditions and water supply and sanitation, particularly in
low income areas. Current incremental demand for housing is estimated at 570,000 units
annually, with only 370,000 units being built annually in urban areas.119 T120
is gap h
exacerbates the situation in relation to the formation of slums and 'katchi abadis '. The
government's policy is to legalize and improve these settlements i.e. 'regularize' them.
This supports Target 11 of MDG 7, 'Have achieved by 2020 a significant improvement in the lives
of slum dwellers.' The MDG Progress Report121 notes that by FY 2004/05, 60 percent of katchi
abadis had been regularized against an MDG target of 95 percent. However, with the growth
of low-income settlements outside officially recognized katchi abadis, there is a need to take a
wider view of the issue, and target services at all low income areas which remain under or un-
serviced. Public toilets are highly inadequate in
cities and are not properly managed and maintained. These are virtually absent in small and medium
size towns and villages. Treatment plants exist in a few cities but are inappropriately
located and hence receive little or no sewage. Solid waste management systems exist only in large
and a few intermediate cities. Only 50 percent of the garbage
119
Mid Term Review of the Medium Term Development Framework (2005-10), Planning Commission, Government of
Pakistan, May 2008. 120 Katchi abadis are informal settlements created through squatting or informal subdivisions of state and private lands. These settlements have often been occupied for significant periods of time by their residents, and have grown organically, making the provision of services a challenge. Katchi abadis are distinct from slums, where security of tenure is a rule, but which remain under-serviced or un-serviced. 121 Planning Commission, Government of Pakistan, 2006.
204
Poverty Reduction Strategy Paper-II Chapter 9 - Pillar VI: Human Development for the 21st Century
generated by major cities is lifted and that too is taken to informal dumping sites since
formal sites have not been adequately developed. Major part of hospital waste is not safely disposed
off and disposal systems only partially exist in some big cities like Lahore and
Karachi.
9.19.4 Declining water resources and its impact on sanitation: Majority of the population
relies on groundwater for drinking purposes, though it is estimated that about 40 million
residents122
y on irrigation (surface) water for domestic use, particularly in areas which are rel
brackish . Water quality issues are all pervasive, with arsenic and fluoride contamination
becoming a serious problem, in addition to bacteriological contamination. The country is water
stressed - water availability on a per capita basis has been declining at a disturbing
rate, and has decreased from 5,000 cubic meters per capita in 1951 to about 1,100 cubic
meters per capita in 2006. It is estimated to go down to 700 cubic meters by 2025. The
declining water resources may further enhance the sanitation problems in the country.
9.19.5 Resource allocation and opportunity for Public Private Partnerships (PPPs): GDP
allocation for water supply and sanitation is not sufficient to meet the targets for sanitation
component where most of it is utilized for water supply. In Pakistan PPP has successfully
implemented the provisions of household sanitation and supported communities in
financing and managing the construction of their neighbourhood sanitation infrastructure through
self-help. Government-NGO/CBO and private company partnership has been
successfully built, where the local government has complimented the work by providing
trunk sewers in addition to solid waste disposal.
9.19.6 Technical capacity of government agencies and the local communities: There is also a
lack of technical capacity and capability in government agencies to plan design and
implement sanitation programmes in the absence of management information systems. The local
communities lack the capacity of operation and management of the sanitation related
infrastructure built with their collaboration.
9.20 The Overall Policy Framework
9.20.1 The policy and regulatory framework of sanitation sector includes Pakistan Environmental
Protection Act, 1997; National Environmental Action Plan, 2001; National Environment
Policy, 2005; The National Sanitation Policy, 2006; and Local Government Ordinance,
2001. Under PEPA the discharge of any pollutant in excess of the National Environmental
Quality Standards (NEQS) is prohibited and carries a penalty. NEQS were revised in 2000. The
Pakistan Environmental Protection Agency (EPA) is the regulatory agency but has devolved
responsibility to provincial EPAs. If applied, there is considerable room for
maneuvering through this Act, including the creation of environmental tribunals. The
National Sanitation Policy which was formulated through country-wide consultative
process supported by Government and UNICEF was approved by the Cabinet in October
122
'Pakistan's Waters at Risk', World Wide Fund For Nature (WWF), February 2007.
205
Poverty Reduction Strategy Paper-II Chapter 9 - Pillar VI: Human Development for the 21st Century
2006. The overall goals and objectives of sanitation efforts as described in the policy are as
follows:
9.21 Overall Goal
9.21.1 The National Sanitation Policy aims at providing adequate sanitation coverage for
improving the quality of life of the people of Pakistan and to provide physical environment
necessary for healthy life. The objectives of the sanitation efforts in the country are:
To ensure an open defecation free environment; the safe disposal of liquid, solid,
municipal, industrial and agricultural wastes; and the promotion of health and hygiene
practices;
To link and integrate sanitation programmes with city and regional planning policies,
health, environment, housing and education;
To facilitate access of all citizens to basic level of services in sanitation including the
installation of sanitary latrines in each household, in rural and urban areas, schools, bus
stations and important public places and also community latrines in densely populated
areas;
To promote Community Led Total Sanitation (CLTS);
To develop guidelines for the evolution of an effective institutional and financial
framework;
To enhance capacity building of government agencies and other stakeholders at all
levels for better sanitation, particularly avoiding incidents of waterborne diseases;
To develop and implement strategies for integrated management of municipal,
industrial, hazardous and hospital and clinical wastes of national, provincial and local
levels;
To meet international/regional obligations effectively in line with the national
aspirations;
To change the attitude and behaviour on the use of sanitation; and
To increase mass awareness on sanitation and community mobilization.
9.22 Ongoing Initiatives and the Way Forward
9.22.1 Selected government, nongovernmental and private sector initiatives are highlighted to
demonstrate how programmes are driving change and are indicative of sector trends.
9.22.2 National Sanitation Policy Roll Out - Provincial Sanitation Strategies: The National
Sanitation Policy was approved immediately after Second South Asian Conference on
Sanitation (SACOSAN II), and since then all four provinces/Federally Administered
206
Poverty Reduction Strategy Paper-II Chapter 9 - Pillar VI: Human Development for the 21st Century
Northern Areas/AJK have formulated policies/strategies which have a significant focus on
a system of 'fiscal incentives for local governments that deliver improved sanitary outcomes
to all.' With the line provincial agencies taking the lead in policy and strategy
development, these provincial processes were supported by a range of partners like UNICEF
and WSP-SA. Balochistan and AJK Governments have approved their provincial
sanitation strategies.
9.22.3 National Environmental Information Management System (NEIMS): The overall
objective of the NEIMS is to contribute to promotion of sustainable development through
building the national capacity in developing, managing and utilizing environmental
information for informed decision-making.
9.22.4 Rural Strategy: CLTS takes root in Pakistan: Community Led Total Sanitation (CLTS)
is based on the principle of triggering collective behaviour change. In this approach,
communities are facilitated to take collective action to adopt safe and hygienic sanitation
behaviour and ensure that all households have access to safe sanitation facilities. This process
has been supported by key sector partners including UNICEF, WSP-SA and DFID.
Many NGOs and Rural Support Programmes are also aligning with the new policy by
adjusting previously subsidy and hardware based approaches. About 600 villages are now
Open Defecation Free (ODF), and over 1500 activists have been trained in the distinctive
'triggering' techniques that are intrinsic to the methodology. Importantly, the Khushal
Pakistan Fund (KPF), a facility for community driven projects, has dove-tailed its
programme with the approach. It is likely that close to a million people have been reached
in villages that have been 'triggered.'
9.22.5 IYS and Global Hand-washing Day- catalyzing behaviour change: The Ministry of
Environment, with provincial and regional governments, and partners developed a
comprehensive country plan for the International Year of Sanitation (IYS). The IYS targets
included: (i) finalization and approval of provincial strategies and action plans by
respective cabinets; (ii) dissemination of hygiene messages focusing on hand-washing with soap,
construction and use of latrines and use of safe water to 20 percent of the population;
(iii) provision of improved sanitation facilities to at least 6 percent of the population
lacking sanitation; and (iv) finalization and approval of the National Drinking Water Policy
and development of an action plan. Over 11 million people have been reached with hygiene messages,
including hand-washing with soap, through a multi-pronged and comprehensive communication
strategy involving the Ministries of Health and Environment. In accordance with
Pakistan's IYS targets, the corporate sector (e.g. Proctor and Gamble, Unilever), agencies (e.g.
UNICEF, USAID), have come together with line agencies in the
provinces to undertake extensive hygiene campaigns country-wide.
9.22.6 Water, Sanitation and Hygiene in Schools - Transforming a Generation: Adequate
water and sanitation facilities in schools are essential to reduce disease, increase enrolment
and retention as well as enhance learning capacity. About 40 percent of schools in Pakistan
207
Poverty Reduction Strategy Paper-II Chapter 9 - Pillar VI: Human Development for the 21st Century
lack water supply while 48 percent do not have access to a toilet facility.123 A study
conducted in Punjab during 2007 has shown that of the total available latrines in schools, only 72
percent are functional and the remaining 28 percent suffer from construction deficiencies, non-
availability of water and poor operation and management. It is also a matter of great concern that
the current student per available latrine ratio is around 250 students, six times higher than the
recommended standard. The lack of appropriate facilities
affects girl students in particular, reducing already low enrolment and retention rates.
9.22.6.1
9.22.6.2
The Ministry of Education has prepared draft standards for school water and sanitation
facilities which are currently undergoing consultations. In addition, detailed designs,
drawings, specifications, and cost estimates for these facilities are also being developed. Federal,
provincial and regional governments with support from UNICEF, USAID and other partners,
are also implementing several water and sanitation programmes to enhance
water and sanitation coverage in schools and to promote hygiene education. The Ministry
of Education has also established a working group on school water and sanitation.
The School-Led Total Sanitation (SLTS) project was piloted in AJK in mid 2007. The
programme initiates change by developing useful health and hygiene skills in school to
encourage life-long positive habits. The school is the 'entry point', with children replicating
practices in the family environment, and advocating for the use of latrines. During the past two
years, nearly 4,500 primary school teachers were trained, and more than 316,000 students
received instruction in school sanitation and hygiene education. SLTS is one strategic approach
which can be instrumental in increasing sanitation coverage and bringing about behaviour change.
To strengthen the capacity of teachers in life skills- based hygiene education, the Government of
NWFP has set up a School Sanitation and Hygiene Education Centre at the Provincial Institute of
Teachers Education, in 2007. Work
on establishing similar centers in other provinces is on-going.
9.22.7 Sector Coordination: For improving coordination in the sanitation sector, several forums
meet monthly for exchange e.g. the Water and Sanitation Sector Donor Coordination Group
(WSDCG) co-chaired by DFID and UNICEF. Seven meetings have been held. Water and
sanitation coordination committees have been formed at the provincial and regional levels. A
Community Led Total Sanitation (CLTS) Core Group has been notified
by the Ministry of Environment and been tasked with speeding the roll out the Sanitation
Policy in consultation with the provinces and ensuring the mainstreaming of efforts. A
National Working Group on School Sanitation and Hygiene Education (SSHE) has been
notified and had its first meeting. This draws in the federal ministries of Health,
Environment, Religious Affairs, and Education, as well as the Environmental Protection
Agency (Pak-EPA), and provincial Education departments. The intent behind these
initiatives is not just to improve coordination, but to catalyze the sector, provide oversight
and ensure that resource flows are well targeted and sustained.
123
Pakistan Education Statistics, Government of Pakistan, FY 2005/06.
208
Poverty Reduction Strategy Paper-II Chapter 9 - Pillar VI: Human Development for the 21st Century
9.22.8 Sindh Cities Improvement Programme: The Programme will support a comprehensive
programme of reform for improved urban service planning and management, including
increased private sector participation, complemented by priority investments in water
supply, wastewater and solid waste management improvements. The Investment
Programme comprises four parts. Part A supports the establishment of professionalized urban
service providers, urban planning capacity, and technical back-stopping for program
implementation. Parts B and C will finance targeted infrastructure improvements in water supply
and wastewater and in solid waste management, respectively. Part D provides
revenue shortfall support for the newly established urban services corporation.
9.22.9 Water and Sanitation Sector in One UN Joint Programme: Water and sanitation is
considered a major component of 'One UN Joint Programme on Environment'. The outcome of
Joint Programme Component 2: 'Integrated Programme on Access to Safe
Water and Improved Sanitation', is safe and healthy living and working conditions for all people in
demonstration regions and secured access to environmentally sustainable water, sanitation, air, fuel,
shelter and food. The outputs of the component include: (i) enhanced access to improved drinking
water and sanitation services in rural areas; (ii) enhanced access to water and sanitation
facilities as per standards in child friendly schools and
healthcare facilities; (iii) improved hygiene practices amongst healthcare workers, families and
school children; (iv) strengthened water quality monitoring, surveillance and improved
systems; (v) enhanced water and sanitation sector coordination and knowledge
management; and (vi) enhanced disaster risk management and humanitarian response
capacity for water and sanitation sector at the federal, provincial and district level.
9.23 (4) Population Programme
9.23.1 Present Situation and Key Issues 9.23.2 Pakistan, currently with a population of 163.8 million and with a growth rate of 1.9 percent
per annum and an annual addition of 2.87 million persons, presents a challenge to address the issue of
economic development and poverty reduction. It is estimated that, population
of Pakistan will reach 194 million by 2020, and will double in 34 years.
9.23.3 To maintain the current rate of literacy in future, around 111,654 additional primary
schools and 244,475 additional primary school teachers would be required by 2020. The housing
requirement will increase from 2 million to 33.7 million units at the present growth
rate. It is argued that birth averted cost translates into huge saving in te124
s of costs rm
incurred on the upbringing, education and health of the child till the age of 16.
9.23.4 The Population Welfare Programme aims to reduce poverty by lowering the population
growth rate. This programme addresses issues and challenges such as poverty, high
maternal mortality, high infant and child mortality, poor access to health facilities, low
socioeconomic status of women through advocacy/community mobilization, through safe
124
Ministry of Population Welfare, Government of Pakistan, Assessment 2001.
209
Poverty Reduction Strategy Paper-II Chapter 9 - Pillar VI: Human Development for the 21st Century
and effective contraceptive methods, and by training women and so providing them with
employment opportunities.
9.23.5 Programme Strategy
9.23.5.1 The population programme is operating through a multi-pronged strategy which entails:
Generating FP/RH demand through:
Advocacy/ IEC;
Population Education; and
Inter Personnel Communication.
Ensuring supplies of safe and effective FP/RH services through:
Programme service delivery network;
Health outlets (functional integration);
Partnership with public and private sector; and
Involvement of NGOs.
Improving programme efficiency and efficacy and quality of care through:
Research (social and clinical);
Training (technical and non-technical); and
Strengthening Monitoring.
9.23.5.2
Strategic Focus of the Programme:
Develop and launch advocacy campaign focussed to policy makers, opinion leaders,
youth and adolescents;
Increase ownership of population issues by the stakeholders and strengthen their
participation in the processes of service delivery and program design;
Reduce unmet need for family planning services by making available quality family
planning & RH services;
Adopt a shift from target oriented to need based and people-centered approach;
Ensure provision of services to the poor, under-served and un-served populations;
Coordinate and monitor an overall network of family planning & RH services in
Pakistan public and private sectors;
Collaborate with concerned ministries, provincial line departments particularly Health;
Build strong partnerships with private sector and civil society players, particularly
NGOs and media;
210
Poverty Reduction Strategy Paper-II Chapter 9 - Pillar VI: Human Development for the 21st Century
Expand the role of the private sector by making contraceptives accessible and
affordable; and
Harness support, cooperation and involvement of men in strengthening the family as
the basic unit of society.
9.23.5.3
9.23.5.4
9.23.5.5
9.23.5.6
Presently the population welfare programme operates within the broader framework of Population Policy, 2002; the National Perspective Plan (2001-2011); and in accordance with Devolution of Power Plan. The programme has adopted a holistic approach to population by linking it with human development and poverty alleviation efforts. Pakistan Reproductive Health & Family Planning Survey (FY 2000/01) and Pakistan Demographic and Health Survey FY 2006/07 have revealed that Population Welfare Programme had entered a new phase and there was almost universal knowledge (96 percent) about contraceptive methods. Contraceptive Prevalence Rate (CPR) had increased from 24.8 in
1998 to 27.6 in 2001 and was estimated at 34 percent in 2007. Information Education and
Communication (IEC) efforts have played an important role in recording this increase.
There is still, however, a significant portion (33 percent unmet need) of the married women of child
bearing age who wanted spacing or did not want any more children but were not practicing family
planning. There is still a high degree of misconception and fear of side
effects of contraceptives; this and some other factors have resulted in a high unmet need
and warrant attention.
In 2001, the programme implementation was shifted to provinces; the federal Ministry
continues to fund the programme while its implementation has been transferred to
provincial governments. The provincial government will devolve the implementation of the
programme to the local governments. The Devolution of Power Plan assigns administrative
and fiscal authority to the local governments to manage staff and budgets according to local
needs and priorities. The community participation is a vital aspect of development
planning. It is expected that community involvement in local development will create
accountability mechanisms that will improve the effectiveness, accessibility and efficiency
of the delivery of public services.
The programme is operationalized through the service delivery outlets of Family Welfare
Centers (FWC), Mobile Service Units (MSU), Reproductive Health Services Centers
(RHSC-A), Male Involvement of Health Outlets of Line Departments, Registered Medical
Practitioners, Hakeems/Homoeopaths, Male Mobilizers, National Institute of Population Studies,
National Research Institute of Fertility, Population Welfare Training Institutes and
Regional Training Institutes (NIPS, 2005).
The Population Welfare Programme has been successful to bring down the annual
population growth rate. However, the general shortcomings of the programme are
identified as lack of holistic approach to population welfare, lack of coordinated multi-
dimensional and multi-sectoral efforts; lack of male involvement in family planning; lack
211
Poverty Reduction Strategy Paper-II Chapter 9 - Pillar VI: Human Development for the 21st Century
of capacity of the programme field staff and managers; weak system of accountability; and
inadequate monitoring and supervision.
9.24 The way forward
9.24.1 During the PRSP-II implementation phase the Population Welfare Programme will adopt a
multi- pronged strategy by:
Generating FP/RH demand through advocacy/inter personnel communication;
Ensuring supplies of safe and effective contraceptive methods; and
Recognizing and promoting men as partners in the Population Welfare Programme for
supporting overall family health and wellbeing and generating a sense of responsible
parenthood for uplifting the status of girls/women in the society is also one of the main
focuses of the programme.
9.24.2 The programme under the umbrella of Population Policy 2002 is striving to achieve
universal access to safe family planning methods by 2010. The Policy also aims to achieve
population stabilization by 2020.
9.24.3 The short term objective of the strategy is:
to reduce population growth rate to 1.9 percent per annum; and
to reduce fertility through enhanced voluntary contraception to 4 births per woman.
9.24.4 Long term objectives include:
to reduce population growth rate from 1.9 percent per annum to 1.3 percent per annum
by the year 2020;
to reduce fertility through enhanced voluntary adoption of contraception to the
replacement level of 2.1 births per woman by 2020; and
to attain universal access to safe family planning methods by 2010.
9.24.5 The policy aims to achieve the above mentioned short and long term objectives through
emphasizing the following principles:
Attain a balance between resources and population with in the broad parameters of the
paradigm of the International Conference on Population and Development (ICPD), held
in Cairo in 1994;
Address various dimensions of the population issues, development priorities while
remaining within our national, social and cultural norms;
Increase awareness of the adverse consequences of rapid population growth both at the
national, provincial, districts and community levels;
Promote Family Planning as an entitlement based on informed and voluntary choice;
Attain a reduction in fertility through improvement in access and quality of
reproductive health services; and
212
Poverty Reduction Strategy Paper-II Chapter 9 - Pillar VI: Human Development for the 21st Century
Reduce population momentum through a delay in the first birth, changing spacing
patterns and reduction in fertility size desires.
9.24.6 During the PRSP-II period, strategies proposed to achieve the goals and objectives set in
the Population Policy of Pakistan include:
Focused IEC and Advocacy: The overall goals for the communication, mobilization
and advocacy strategy is to ensure delivery of culturally correct and linguistic-
appropriate message about family planning and reproductive health to all Pakistan in order to
encourage informed decision-making about adoption of positive family planning and
reproductive health behaviour. In this regard, the message in the media campaign are blended
into educational and recreational programmes like drama series, comedy shows, melodies, panel
discussions, interviews, seminars, workshops, and meet
the person session. Orientation programmes for community and policy makers are
being organized. Print material is also being produced and widely distributed. Articles,
press conferences and advertisements are published regularly to maintain knowledge about
family planning/reproductive health (FP/RH) and to create demand for the
services as well.
Provision of safe, affordable and quality contraceptives: In order to ensure
coordinated and uninterrupted supply, the contraceptives are provided to clients with
needs through both of Population Welfare Programme and non-programme outlets on
subsidized rates.
Reaching out to couples, with unmet needs: Mobile Service Unit provides FP/RH
services at the doorsteps of underserved communities in the rural areas through a pre-
determined and well communicated camp schedule. This also helps in mustering local support
for programme through interaction with elected councilors and other opinion
makers for promoting better understanding and need for reproductive healthcare.
Strengthening Public-Private Partnerships (PPPs): Involvement of Public Private
Sector Organizations (PPSOs) for catering FP/RH services is one of the initiatives being
launched by the government. So far, 90 Memorandum of Understandings (MOUs) have
been signed between Ministry of Population Welfare (MOPW) and PPSOs for the
provision of FP/RH services through private sector outlets, 35 new centers have been
established under Army, Navy, Air Force, Railways and Pakistan
Steel Mills, etc.
Clinical and Non-Clinical Training: The clinical activities conducted by Regional
Training Institutes (RTIs) include 24 month basic training of family Welfare Workers,
3-6 months advance training of Field Technical Officer/Assistant Sister Tutor/Family
Welfare Counselors, Pre-service training of Family Welfare Assistant and Refresher
training of Paramedics. Non-Clinical trainings are provided through Population welfare
Training Institute. These institutes serve as capacity building machinery and provide in
213
Poverty Reduction Strategy Paper-II Chapter 9 - Pillar VI: Human Development for the 21st Century
service, pre-service and refresher trainings to update knowledge and understanding of
population issues.
Improved Quality Care Reproductive Health Services: Quality of Care (QoC) is a
client-centered approach to provide high-quality health care as a basic human right; it is
considered a critical element for FP/RH services and being promoted by all
stakeholders in public and private sectors as well as by NGOs, as affirmed at
international conferences. High quality services ensure that clients receive the care that they
deserve. Furthermore, providing better services at reasonable price attract more clients,
increase the use of FP methods, and reduce the number of unintended pregnancies.
Improving QoC for clients means understanding their cultural values, precious
experiences, and perceptions of the role of the health system, and then bringing
reproductive health service providers and the community together to map out a shared vision of
quality. Similarly, enhancing QoC for healthcare providers requires
identifying their motivations, addressing their needs (including general administrative
and logistic support), and helping them to better understand and address clients' concepts of
quality. Creating a shared vision for improved QoC requires that Program
Managers, service providers, researchers, and consumers advocate the idea that quality matters.
Given time and effort, the ongoing attempt to improve the QoC will translate
into services that meet minimum quality standards, satisfy the needs of clients and
providers to bridge the gap of unmet need.
Social Marketing of Contraceptives: Population Welfare Programme is supplemented
by Social Marketing intervention providing a complete range of contraceptives at
subsidized rates with focus on low and middle income groups of population in the
urban and semi urban areas indicating a reasonable presence involved through active private
sector providers and retailer etc. the social marketing operation are supported
with grant assistance provided by the development partners and is making 30 percent
contribution to the national programme in terms of couple year protection (CYP).
Reaching Youth through population education: Based on the broader objective of
Population Stabilization under the new holistic approach to Population and
Development, the focus of these activities is to sensitize policy and decision makers
and to initiate the public partnerships for adoption of small family norms.
9.24.7 The government has foreseen the far reaching implications of high population rate for the
social and economic development and have recognized the prospects for improvements, and have
among other things, undertaken volitional fertility moderation measures. The ultimate goal of
population stabilization as a development priority to attain sustainable development is high on
the priority list and there has been an ever increasing realization of cross cutting effects of population
factor on the socio-economic development canvas. Thus, the programme has been accorded high
priority in the development framework and
supported as an important component of the PRSP-II.
214
Poverty Reduction Strategy Paper-II Chapter 9 - Pillar VI: Human Development for the 21st Century
9.25 (5) Mainstreaming Gender and Empowering Women
9.25.1 Women empowerment is more than simply increases in their incomes: it requires a
transformation of their status in power relations. Aim to empower women requires going beyond
income generation and provision of low-paid and part-time work which often merely serve to
reinforce existing inequalities. It is essential to address both micro and macro level inequalities
in order to enable women to exercise choice and fulfill their
potential.
9.25.2 PRSP-I provided a framework under which the government initiated various measures to
achieve gender equalities within the parameters of the 'National Policy for Development and
Empowerment of Women' for political, social and economic empowerment of women. Some of the
specific programmes that were highlighted in PRSP-I in the context of gender
equity and equality included: (a) The National Programme for Women's Political
Participation, which provided leadership training to women councilors and members of the
provincial assemblies; (b) National Framework for Family Protection, which provided legal
aid, medical and rehabilitation facilities to women; (c) Gender Reform Action Plan, which
facilitated the restructuring of national machinery dealing with gender issues; (d) Gender
Responsive Budgeting (GRB) through a pilot study in the education sector; (e) provision of easy
access to micro-credit, improved earning by better access to sources of livelihood, particularly in
agriculture and livestock production; and (f) fulfilling the quota of 5 percent
in government services.
9.25.3 The PRSP-II endorses this mainstreaming approach by aiming to create an environment
that is more welcoming to women, focusing on policies that initiate improvements in female
human development to achieve the desired results. The MoWD had launched development
programmes and projects primarily within the available financial resources in the following areas of
female empowerment: (a) political; (b) economic; (c) social; and (d)
legal empowerment.
9.25.3.1 (a) Political Empowerment
9.25.3.1.1 Increased political participation of women in the Assemblies, especially in the local
bodies, has opened a whole new political space. The Ministry of Women Development has prepared
a comprehensive programme for capacity development for women councillors.
This programme is intended to impart needs-based training so as to maximize the impact of
the presence of women by enhancing their participation in the formulation, advocacy, and
implementation of a gender-sensitive economic strategy.
215
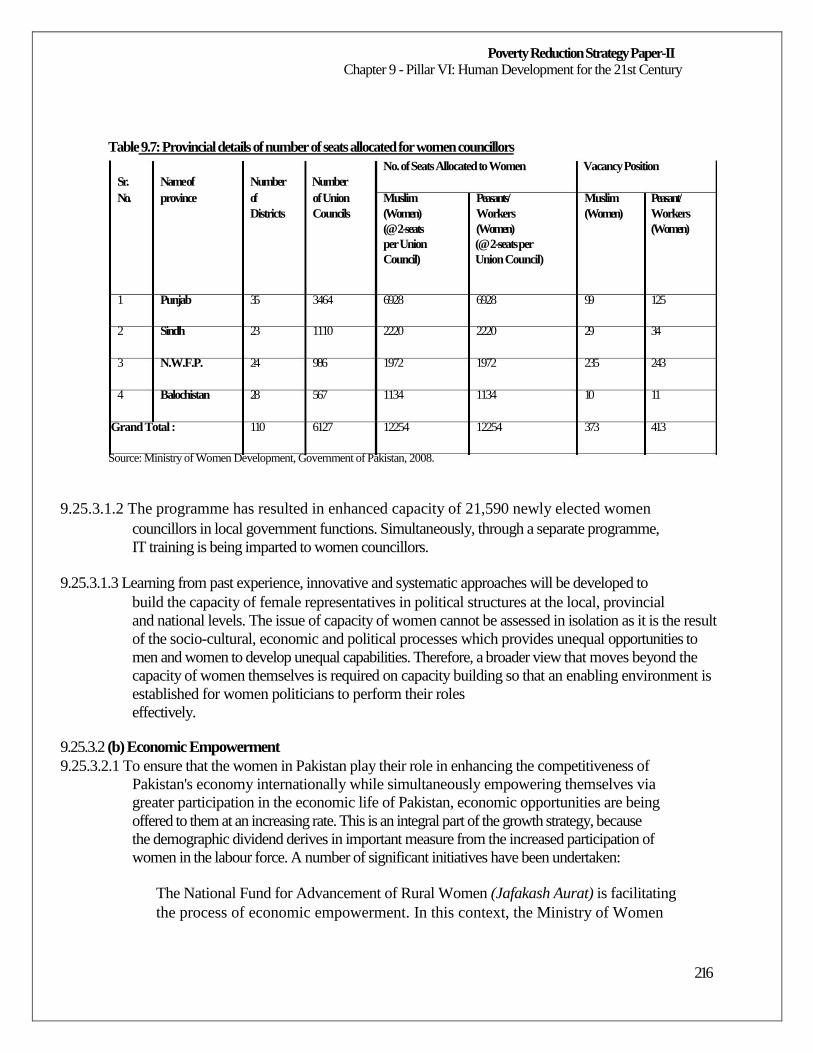
Poverty Reduction Strategy Paper-II Chapter 9 - Pillar VI: Human Development for the 21st Century
Table 9.7: Provincial details of number of seats allocated for women councillors
No. of Seats Allocated to Women Vacancy Position Sr. Name of Number Number No. province of of Union Muslim Peasants/ Muslim Peasant/
Districts Councils (Women) Workers (Women) Workers (@ 2-seats (Women) (Women) per Union (@ 2-seats per Council) Union Council)
1 Punjab 35 3464 6928 6928 99 125
2 Sindh 23 1110 2220 2220 29 34
3 N.W.F.P. 24 986 1972 1972 235 243
4 Balochistan 28 567 1134 1134 10 11
Grand Total : 110 6127 12254 12254 373 413
Source: Ministry of Women Development, Government of Pakistan, 2008.
9.25.3.1.2 The programme has resulted in enhanced capacity of 21,590 newly elected women
councillors in local government functions. Simultaneously, through a separate programme,
IT training is being imparted to women councillors.
9.25.3.1.3 Learning from past experience, innovative and systematic approaches will be developed to
build the capacity of female representatives in political structures at the local, provincial
and national levels. The issue of capacity of women cannot be assessed in isolation as it is the result
of the socio-cultural, economic and political processes which provides unequal opportunities to
men and women to develop unequal capabilities. Therefore, a broader view that moves beyond the
capacity of women themselves is required on capacity building so that an enabling environment is
established for women politicians to perform their roles
effectively.
9.25.3.2 (b) Economic Empowerment
9.25.3.2.1 To ensure that the women in Pakistan play their role in enhancing the competitiveness of
Pakistan's economy internationally while simultaneously empowering themselves via
greater participation in the economic life of Pakistan, economic opportunities are being
offered to them at an increasing rate. This is an integral part of the growth strategy, because
the demographic dividend derives in important measure from the increased participation of
women in the labour force. A number of significant initiatives have been undertaken:
The National Fund for Advancement of Rural Women (Jafakash Aurat) is facilitating
the process of economic empowerment. In this context, the Ministry of Women
216
Poverty Reduction Strategy Paper-II Chapter 9 - Pillar VI: Human Development for the 21st Century
Development has initiated three pilot projects in remote areas aimed at diversifying
women's skills and training them to be competitive in the labour market.
Micro-credit schemes through First Women Bank, Khushhali Bank, and Zarai
Taraqiyati Bank Limited (ZTBL) have started creating a new entrepreneur class among poor
women on a local basis. The total number of female beneficiaries under Pakistan Poverty
Alleviation Fund (PPAF), Khushali Bank, and ZTBL increased from 174,000
in FY 2005/06 to 318,000 in FY 2006/07.125
Moreover, Benazir Income Support Programme intended to compensate economically
vulnerable families for the erosion that their purchasing power has suffered. Its unique feature is
that the payment will be made only to the female head of the family. The women's
empowerment impact is likely to be decisive, particularly in the context of social development.
The payout is not claimed to be able to alleviate their poverty, but
it should certainly serve to protect their nutrition intake to a large extent.
A 'five-marla scheme' has been launched in rural areas for homeless citizens where
government land is available. The land title will be given to the female member of the
house to boost her confidence and financial independence.
9.25.3.2.2 The experience of PRSP-I shows that provision of micro-credit has met the objective of
increasing the income of poor households. However, it may not have met the objective of women's
empowerment. If women creditors are provided support in skill development, developing linkages
with markets, skills in business management and marketing, then there is a stronger possibility that
they would graduate from income-generating activities and micro-entrepreneurship to big
businesses. Similarly when credit schemes are designed for women to work in groups, this brings
additional benefits to women in terms of increased
self-confidence and greater say in decision-making within their families.
9.25.3.2.3 Lady Livestock Workers (LLWs) are being trained to disseminate knowledge and training
to other women in their areas for better rearing of livestock to enhance their incomes. Some
3500 women will be trained with the support of the University of Veterinary and Animal
Science. It will ensure sustainable growth and speed up poverty alleviation process in rural
areas where 60-70 percent of the population resides.
9.25.3.2.4 The government's strong affirmative and proactive policy in engendering public services at
all levels of entry are bearing fruit by placing women in high positions of office in various
services. Women's share in the Pakistan Foreign Service, especially at ambassadorial positions,
is also growing consistently. The last Governor of the SBP was a woman. Progressively
larger numbers of women are entering the legal profession, and the higher judiciary is
increasingly inducting women. With encouragement of the government,
125
PRSP Annual Progress Report, FY 2006/07, Finance Division, Government of Pakistan.
217
Poverty Reduction Strategy Paper-II Chapter 9 - Pillar VI: Human Development for the 21st Century
Pakistani women are now joining the armed forces, including Air Force, and various other
new fields.
9.25.3.3 (C) Social Empowerment
9.25.3.3.1 Several measures are in place for increasing the social empowerment of women, and
additional initiatives will be pursued during the period of the PRSP-II. Some of the more
significant steps are:
Shaheed Benazir Bhutto Centers for Women (SBBCW): Ministry of Women Development has established 25 women centres (now called SBBCW) throughout the country to provide relief/support on emergent basis and rehabilitate the survivors of violence and women in distress. This support facility is in line with National and International commitments under the United Nations Declaration on Human Rights
(UNDHR); Convention on Elimination of All form of Discrimination Against Women
(CEDAW); and Beijing Platform for Action (B-PfA). The objectives of the crises
centres are to protect women against all types of violence and to eliminate all forms of
discrimination against women. In the short run, these centres will provide temporary shelter to
victims of violence in emergencies; provide medical/first aid; provide/arrange free legal
assistance/aid; investigate cases of violence/prejudice; and liaison with
agencies component to redress grievances of women at individual and collective levels,
especially those concerned with combating violence against women. At present 25
centers are functional while 30 more centers are planned to be established during current
financial year, after approval of the project by CDWP. Similarly, 9 centers will be established
in the earthquake affected area of NWFP and AJK in collaboration with
Earthquake Rehabilitation and Reconstruction Authority (ERRA).
Awareness Campaign through Electronic/Print Media: The Ministry of Women
Development launched a project entitled 'Community Campaign to Prevent Violence against
Women.' This will rely on the media, both print and electronic. Its chief objectives are: to
enable women to understand and exercise their rights across social,
economic, political & legal streams; sensitize rural and urban communities, especially
men, about gender issues and women's rights; and to encourage and facilitate women in distress to
avail of protection against violence by accessing services provided through
women's centers.
9.25.3.4 (d) Legal Empowerment 9.25.3.4.1 Violence against women with its various manifestations has been coming under increasing
national and international scrutiny. "Honour" killing is one of the heinous crimes prevalent
in various countries, including Pakistan. Women, who bring dishonour to their families because
of alleged sexual misconduct, are forced to pay a terrible price at the hands of male family members.
In case of Pakistan where extra-marital sex is an offence, the manipulation of men on this
pretext extends to depriving women of their fundamental rights of choice to marry or inherit
property. This manifestation of punishment affects not only a small percentage of women but it has
grave consequences for female emancipation.
218
Poverty Reduction Strategy Paper-II Chapter 9 - Pillar VI: Human Development for the 21st Century
The Ministry of Women Development to preserve the rights of women to security and life
has taken the initiative by promulgating a law that makes changes in the existing criminal
law to deal more effectively with offenders.
9.25.3.4.2 Salient Features of the New Law:
Offences committed in name of or on the pretext of 'honour' (e.g. karo kari, siyah kari
or similar other customs or practices) shall be treated as normal offences and will get
no concession;
'Wali' (legal heir) will not include the accused or the convict when 'qatal' (murder) is
committed in name or on the pretext of honour. In other words, the accused would not
be able to compound or waive the offence;
Punishment of qisas (death for death), death or imprisonment for life can be imposed
keeping in view the facts of the each case;
A female cannot be given in exchange for compounding and whosever, violates this
prohibition may be punished up to ten years but not less than three years;
In 'attempt to murder' case, the court may punish up to ten years but can not award less
than five years;
In hurt cases caused in the name of 'honour', ta'zir (normal punishment) shall not be
less than one-third of the maximum imprisonment provided by the law for the hurt;
The court may not accept compounding or waiver even if all the parties agree. The
court may award death sentence or imprisonment for life but can not award less than
ten years imprisonment;
The court will accept the compounding (forgiving the culprit after taking something) or
waiver by the heirs (forgiving the culprit without taking something) subject to such
conditions as it may deem fit to impose;
The Provincial government shall have no power to suspend or remit (to lessen) the
sentence in such cases; and
In zina (illegal sexual relations) cases when the accused is a female, the police cannot
arrest the women without permission of the court. Furthermore, the investigation shall
have to be conducted by an officer not below the rank of superintendent of police.
9.25.3.4.3 The government has taken additional measures to increase the legal protection of women.
The following are some of the more significant.
Code of Criminal Procedure (CrPc) Amendment Ordinance, 2006: In an Ordinance
promulgated on 8th July, 2006 amending section 497 of CrPc to grant of bail to women in jails on charges other than terrorism and murder. A large number of female prisoners
have been released from different prisons of Pakistan under this new law.
219
Poverty Reduction Strategy Paper-II Chapter 9 - Pillar VI: Human Development for the 21st Century
The Protection of Women (Criminals Laws Amendment) Act, 2006: Protection of
Women (Criminals Laws Amendment) Act, 2006 has been enacted on 1st December, 2006 to
provide relief and protection to women against misuse and abuse of law and to prevent their
exploitation. The object of this Bill is to bring the laws relating to zina
and qazf126, in particular, in conformity with the stated objectives of the Islamic
Republic of Pakistan and the Constitutional mandate and in particular to provide relief and
protection to women against misuse and abuse of law. This Act is providing 30 important
amendments in the existing 'Offence of Zina and Qazf (Enforcement of Hadood Ordinance
1979)', the 'Pakistan Penal Code (Act XLV of 1860)', the Code of Criminal Procedure 1898 (Act V
of 1898)', and the 'Dissolution of Muslim Marriages
Act 1939.'
Domestic Violence against Women and Children (Prevention and Protection) Bill
2008: There is a need to provide legal mechanism for protection of victims of domestic violence in line with the provisions of the Constitution. To address this issue, comments/views have been gathered from various Ministries/Divisions/Departments,
NGOs and civil society organizations on the draft Domestic Violence against Women
and Children (Prevention and Protection) Bill, 2008.
Harassment of Women at Workplace: The Federal Cabinet has in November, 2008
approved the following draft bills: (i) Protection against Harassment at the Workplace Bill,
2008; and (ii) Criminal Law (Amendment) Bill, 2008. The draft Bills
comprehensively address the issue of sexual harassment at the workplace in the public and private sectors. These legislations when enacted would serve as a deterrent to the
issue of harassment at the workplace.
9.25.4 Gender Reform Action Plan (GRAP)
9.25.4.1 The Gender Reform Action Plan (GRAP) proposes a coherent gender reform agenda to
align policies, structures, processes, programmes and projects for enabling the government to
implement its national and international commitments on gender equality. It is aimed at
introducing government-wide reforms to engender the machinery at the federal, provincial, and
district levels with a positive bias for women. GRAP seeks to address gender gaps
through reforms in four major areas, namely: (i) political reforms; (ii)
administrative/institutional reforms; (iii) reforms in public sector employment; and (iv) policy
and fiscal reforms. Substantial capacity building and support actions are being added
to this programme, which is to be implemented over four years.
9.25.4.2 Gender Development Grant is one of the core components of the national GRAP with a
total budget of Rs 250 million. This amount is to be utilized primarily for mainstreaming gender
in the provincial and district governments. This amount has been released by the Ministry of
Women Development to all the provinces in FY 2005/06 which is being further
126
Form of Islamic punishment.
220
Poverty Reduction Strategy Paper-II Chapter 9 - Pillar VI: Human Development for the 21st Century
distributed to all the 111 districts of Pakistan. This grant will be utilized by the districts for
supporting women-specific activities/projects, which have a need-based priority with the support
of elected women councilors in the District Councils. The GRAP Secretariats are now fully
operational at the federal and the provincial levels and focal persons have been
placed in all partner ministries/agencies.
9.25.4.3 The PRSP-II includes GRAP in its monitoring and evaluation framework. Through regular
and systematic monitoring, it will be ensured that progress in all four key areas of GRAP is
effectively made during the PRSP-II period.
9.25.5 National Commission on the Status of Women (NCSW)
9.25.5.1 National Commission on the Status of Women (NCSW), a statutory body, was established
in 2000 by the President of Pakistan. The main goal of NCSW is emancipation of women,
equalization of opportunities and socio-economic conditions amongst women and men, and
elimination of discrimination against women.
9.25.5.2 The main functions of the Commission include the examination of the policy, programmes
and other measures taken by the government for women development and the review of all policies,
laws, rules and regulations affecting the status and rights of women and gender equality in
accordance with the Constitution. The Commission is providing valuable input
on various gender issues.
9.25.6 National Plan of Action (NPA) for Women
9.25.6.1 As an outcome of Beijing Declaration and Platform for Action, 1995 in the Ministry of
Women Development prepared and launched a National Plan of Action (NPA) for Women on 14th
August 1998 as a partial fulfillment of our national and international commitment.
The NPA for Women sets out 184 actions in twelve critical areas namely Women and
Poverty; Education and Training of Women; Women and Health; Violence Against
Women; women and the Armed Conflict; Women and Economy; Women in Power and
Decision-Making; Institutional Mechanism for Advancement of Women; Human Rights of
Women; Women and Media; Women and Environment; and The Girl Child.
9.25.6.2 Implementation of the National Plan of Action for Women is the responsibility of entire
Government of Pakistan i.e. all line Ministries/Departments/Organizations at the federal level
and relevant Departments/Organizations at the provincial level. Being focal
machinery, the Ministry of Women Development acts as coordinator for implementation of NPA.
In the Ministry of Women Development there is an ongoing project titled
'Implementation of National Plan of Action for Women', under which one NPA Unit at
federal level and four NPA Units at Provincial Headquarters exist.
9.25.6.3 In 2005, a National Report on Beijing + 10 was prepared in consultation with line
Ministries, Divisions and Organizations and was presented in the 49th Session of UN
221
Poverty Reduction Strategy Paper-II Chapter 9 - Pillar VI: Human Development for the 21st Century
Commission on Status of Women in New York. Apart from this the report was shared with
National and International Organizations, development partners and NGOs.
9.26.7 Convention on Elimination of all Forms of Discrimination against Women (CEDAW)
9.26.7.1 Implementation of Convention on Elimination of all forms of Discrimination Against
Women (CEDAW) is one of Pakistan's key international commitments. The Ministry of
Women Development, with a broad consensus of public and private sector
organizations/agencies, prepared the combined initial, second and third compliance report
on implementation of CEDAW.
9.26.8 Gender Responsive Budgeting (GRB)
9.26.8.1 Gender Responsive Budgeting (GRB) is a powerful tool for mainstreaming gender
dimension into all stages of the budget cycle and for measuring progress on national and
international gender related commitments. In general, gender responsive budgeting aims at
analyzing the differential impacts of a state's national and local expenditure as well as
revenue policy on women and girls, and men and boys, respectively. However, it is
important to appreciate the fact that gender-responsive budgets are not separate budgets for
women or for men, but rather are analyses of actual budgets through a gender lens.
9.26.8.2 The government, with the support of its development partners, initiated a Gender
Responsive Budgeting Initiative project in 2005 at the federal level and in Punjab. It was piloted in
the sectors of health, education and population welfare. Various GRB tools such as gender aware
policy appraisal, gender aware beneficiary assessment survey and gender budget statement have
been employed. These have provided useful insights and the
research findings have been disseminated to concerned quarters. The first nationwide Time Use
Survey has also been initiated to reveal the macro economic implications of unpaid care work.
Activities of the project also include carrying out awareness rising at the federal, provincial and
district levels of the government supplemented by development of resource
material. Targeted capacity building of government officials and other stakeholders was carried
out along with development of training manuals and handbooks. As part of its commitment to
introducing gender-responsive budgeting, both the Finance Division and Finance Department,
Government of Punjab have introduced gender-responsive
amendments in the government's Budget Call Circular (BCC). The gender sensitive
amendment in the MTBF Budget Call Circular now requires that the mission and
objectives clearly specify gender commitments and that input, output and outcome
indicators are disaggregated on gender basis. Gender responsive amendments in BCC help
institutionalize a gender perspective in the government's established budgetary procedures.
9.26.8.3 The Gender Responsive Budgeting Initiative project on its completion has merged into a
bigger umbrella project titled: Strengthening PRS Monitoring Project.127 The work initiated
under GRBI will continue as one of the major components under the new project. Under the
Strengthening PRS Monitoring project GRB will now not only be extended to cover all
127
For details, please visit: www.prsm.gov.pk
222
Poverty Reduction Strategy Paper-II Chapter 9 - Pillar VI: Human Development for the 21st Century
the four provinces of Pakistan but will also involve expansion to other social sector. In the
longer term, government commitment to gender responsive budgeting (GRB) in analyzing,
federal, provincial and district government budgets and determining the extent to which
resources are allocated to address gender inequality and impact budgetary expenditure on
different gender groups needs to be continued.
9.26.8.4 Human development is the ultimate objective of economic development and is also a
means for promoting development. Access to education, healthcare services (including
reproductive health), clean drinking water and sanitation, gender equality and women
empowerment are key aims to achieve this goal. The government is conscious that in
formulating development policies it is important to put people first, and to specify
objectives in terms of the enhancement of human capabilities. The strategy behind the PRSP-II
emphasizes that development is not just a change in incomes, but also a change in
capabilities that improves, expands and strengthens the control of poor people over their
lives.
223
Poverty Reduction Strategy Paper-II Chapter 10 - Pillar VII: Removing Infrastructure Bottlenecks through Public Private Partnerships
(PPPs)
Chapter 10 - Pillar VII: Removing Infrastructure Bottlenecks
through Public Private Partnerships (PPPs)
10.1 Infrastructure represents the framework of physical facilities through which goods and services are provided to the public. While the term includes educational and health facilities,
these components have been discussed separately in this strategy. The present chapter deals with
issues and strategies for water (except drinking water, which has been
covered in Chapter 9); transport & communications; and housing.
10.2 Pakistan's Poverty Reduction Strategy takes a holistic approach to development. It
recognizes that infrastructure by itself will not create economic potential; rather, growth
possibilities are generated where the appropriate inputs of labour, capital, and supportive institutions
exist. Given these conditions, infrastructure contributes to economic growth by reducing costs of
production, contributing to the diversification of the economy, facilitating
the absorption of modern technology, and increasing the productivity of workers. The gender
analysis of infrastructural development deepens our understanding on the nexus of poverty-
infrastructure and makes us aware about gender issues in infrastructural development.
These elements are crucial for Pakistan, because its strategy for poverty
reduction is anchored in the performance of a competitive and market-responsive private
sector. The development of a world-class infrastructure is therefore essential.
10.3 Developing such an infrastructure will require a considerable amount of capital investment.
In view of the limitations on the government's own resources, public private partnerships (PPPs)
employing a variety of financing and ownership mechanisms (for example, Build-
Operate-Transfer) will be adopted. The strategy also recognizes that if infrastructure is to provide
enduring benefits, it must be used efficiently and be provided with the resources to maintain it in a
proper state of repair. The government must therefore devote attention to
pricing policies, such as setting appropriate user charges.
10.4 Physical Infrastructure Investment by Public Sector
10.4.1 Financial allocations under various investment initiatives give concrete evidence of the
importance that the government has assigned to building up the infrastructure. The Medium
Term Development Framework (MTDF) covering the period 2005-2010 allocates nearly
half the proposed total investment of Rs 2042 billion to infrastructure.
10.4.2 Even these allocations do not tell the entire story. The government's allocations are
expected to be supplemented by the private sector. The government is adopting investor-
friendly policies that will create an environment conducive to private investment in
infrastructure. One step in this direction is the establishment of PPPs.
10.4.3 The PPPs involve the investment of private capital to design, finance, construct, operate,
and maintain a project for public use for a specific term during which a private investment
consortium is able to collect revenue from the users of the facility. While privatization
224
Poverty Reduction Strategy Paper-II Chapter 10 - Pillar VII: Removing Infrastructure Bottlenecks through Public Private Partnerships
(PPPs)
represents a take-over of a publicly owned entity, PPPs are more like mergers, with both
sides sharing the risks and benefits.
10.4.4 Infrastructure Project Development Facility (IPDF)
10.4.4.1 The public sector has been the main provider of basic infrastructure in Pakistan. However,
fiscal and other constraints limit the government's capacity to meet growing infrastructure needs.
Recognizing the need for PPPs and the benefits associated with this form of
partnership, the government (Finance Division) established a company titled,
'Infrastructure Project Development Facility' (IPDF) under Section 42 of the Companies Ordinance,
1984 in May, 2006. The IPDF is to act as a catalyst and facilitator to generate PPP projects with
public implementing agencies (line ministries, provincial governments, local bodies, state
owned enterprises, etc.) undertaking PPPs. The IPDF will help the implementing agencies to
improve their proposals and prepare them for tendering. Once approved by IPDF, proposals can
be submitted for complementary financing to an
independent financing body, the Infrastructure Project Financing Facility (IPFF).
10.4.4.2 While IPDF will act as the principal coordinator of PPPs, IPFF will provide the residual
long-term financing to financially feasible PPP projects. Although IPDF and IPFF have been
established by the federal government, they will support projects across all tiers of the
government. Provinces and local governments may set up their own implementation structures
and processes that complement federal government support. The Government of Punjab and the City
District Government of Karachi have already started setting up a
dedicated capacity to look into structuring infrastructure projects that attract private
investment.
10.4.4.3 The IPDF will focus primarily on: transport and supply chain logistics (including
provincial and municipal roads, rail, seaports, airports, trucking, fishing harbours, as well
as warehousing, wholesale markets, seaports, slaughter houses, and cold storage); mass urban
public transport (including buses and intra- and inter-city rail); municipal services (including
water supply, sanitation, solid waste management, low-cost housing, and education
facilities); and small-scale energy projects, other than those facilitated by the Private Power
Infrastructure Board (PPIB) and the Alternative Energy Development Board
(AEDB).
10.5 (1) Water
10.5.1 Pakistan is one of the world's most arid countries, with an average rainfall of under 240
mm a year. The population and the economy are heavily dependent on an annual influx into
the Indus river system (including the Indus, Jhelum, Chenab, Ravi, Beas and Sutlej rivers) of about
180 billion cubic metres of water. This water emanates from neighboring countries
and is derived mostly from snowmelt in the Himalayas.128 Although Pakistan possesses the
world's largest contiguous irrigation system, that is, the Indus Basin Irrigation system, which
commands an area of about 14.3 million hectares (35 million acres), the demand for
128
World Bank, "Pakistan: Country Water Resources Assistance Strategy" (2005), p. vii.
225
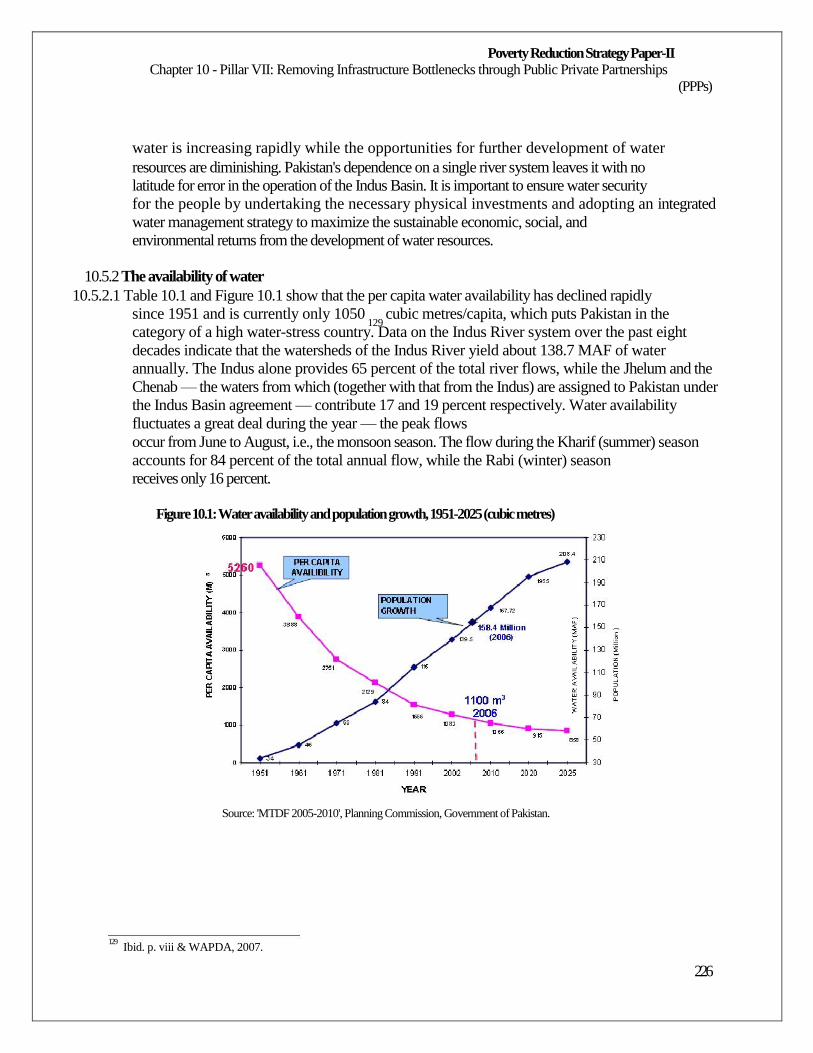
Poverty Reduction Strategy Paper-II Chapter 10 - Pillar VII: Removing Infrastructure Bottlenecks through Public Private Partnerships
(PPPs)
water is increasing rapidly while the opportunities for further development of water
resources are diminishing. Pakistan's dependence on a single river system leaves it with no
latitude for error in the operation of the Indus Basin. It is important to ensure water security
for the people by undertaking the necessary physical investments and adopting an integrated
water management strategy to maximize the sustainable economic, social, and
environmental returns from the development of water resources.
10.5.2 The availability of water
10.5.2.1 Table 10.1 and Figure 10.1 show that the per capita water availability has declined rapidly
since 1951 and is currently only 1050 129
cubic metres/capita, which puts Pakistan in the
category of a high water-stress country. Data on the Indus River system over the past eight
decades indicate that the watersheds of the Indus River yield about 138.7 MAF of water
annually. The Indus alone provides 65 percent of the total river flows, while the Jhelum and the
Chenab — the waters from which (together with that from the Indus) are assigned to Pakistan under
the Indus Basin agreement — contribute 17 and 19 percent respectively. Water availability
fluctuates a great deal during the year — the peak flows
occur from June to August, i.e., the monsoon season. The flow during the Kharif (summer) season
accounts for 84 percent of the total annual flow, while the Rabi (winter) season
receives only 16 percent.
Figure 10.1: Water availability and population growth, 1951-2025 (cubic metres)
Source: 'MTDF 2005-2010', Planning Commission, Government of Pakistan.
129
Ibid. p. viii & WAPDA, 2007.
226
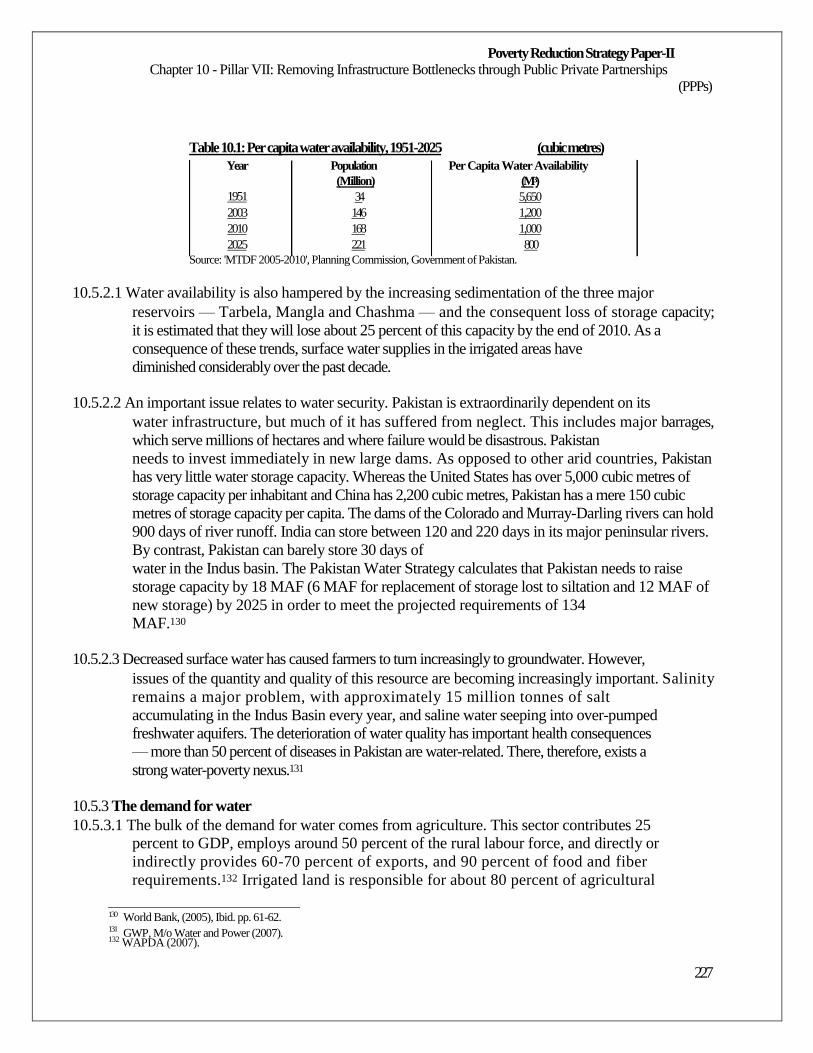
Poverty Reduction Strategy Paper-II Chapter 10 - Pillar VII: Removing Infrastructure Bottlenecks through Public Private Partnerships
(PPPs)
Table 10.1: Per capita water availability, 1951-2025 (cubic metres)
Year
1951 2003 2010 2025
Population (Million)
34 146 168 221
Per Capita Water Availability (M3) 5,650 1,200 1,000 800
Source: 'MTDF 2005-2010', Planning Commission, Government of Pakistan.
10.5.2.1 Water availability is also hampered by the increasing sedimentation of the three major
reservoirs — Tarbela, Mangla and Chashma — and the consequent loss of storage capacity;
it is estimated that they will lose about 25 percent of this capacity by the end of 2010. As a
consequence of these trends, surface water supplies in the irrigated areas have
diminished considerably over the past decade.
10.5.2.2 An important issue relates to water security. Pakistan is extraordinarily dependent on its
water infrastructure, but much of it has suffered from neglect. This includes major barrages,
which serve millions of hectares and where failure would be disastrous. Pakistan
needs to invest immediately in new large dams. As opposed to other arid countries, Pakistan
has very little water storage capacity. Whereas the United States has over 5,000 cubic metres of
storage capacity per inhabitant and China has 2,200 cubic metres, Pakistan has a mere 150 cubic
metres of storage capacity per capita. The dams of the Colorado and Murray-Darling rivers can hold
900 days of river runoff. India can store between 120 and 220 days in its major peninsular rivers.
By contrast, Pakistan can barely store 30 days of
water in the Indus basin. The Pakistan Water Strategy calculates that Pakistan needs to raise
storage capacity by 18 MAF (6 MAF for replacement of storage lost to siltation and 12 MAF of
new storage) by 2025 in order to meet the projected requirements of 134
MAF.130
10.5.2.3 Decreased surface water has caused farmers to turn increasingly to groundwater. However,
issues of the quantity and quality of this resource are becoming increasingly important. Salinity
remains a major problem, with approximately 15 million tonnes of salt
accumulating in the Indus Basin every year, and saline water seeping into over-pumped
freshwater aquifers. The deterioration of water quality has important health consequences
— more than 50 percent of diseases in Pakistan are water-related. There, therefore, exists a
strong water-poverty nexus.131
10.5.3 The demand for water
10.5.3.1 The bulk of the demand for water comes from agriculture. This sector contributes 25 percent to GDP, employs around 50 percent of the rural labour force, and directly or
indirectly provides 60-70 percent of exports, and 90 percent of food and fiber
requirements.132 Irrigated land is responsible for about 80 percent of agricultural
130 131
World Bank, (2005), Ibid. pp. 61-62. GWP, M/o Water and Power (2007).
132 WAPDA (2007).
227
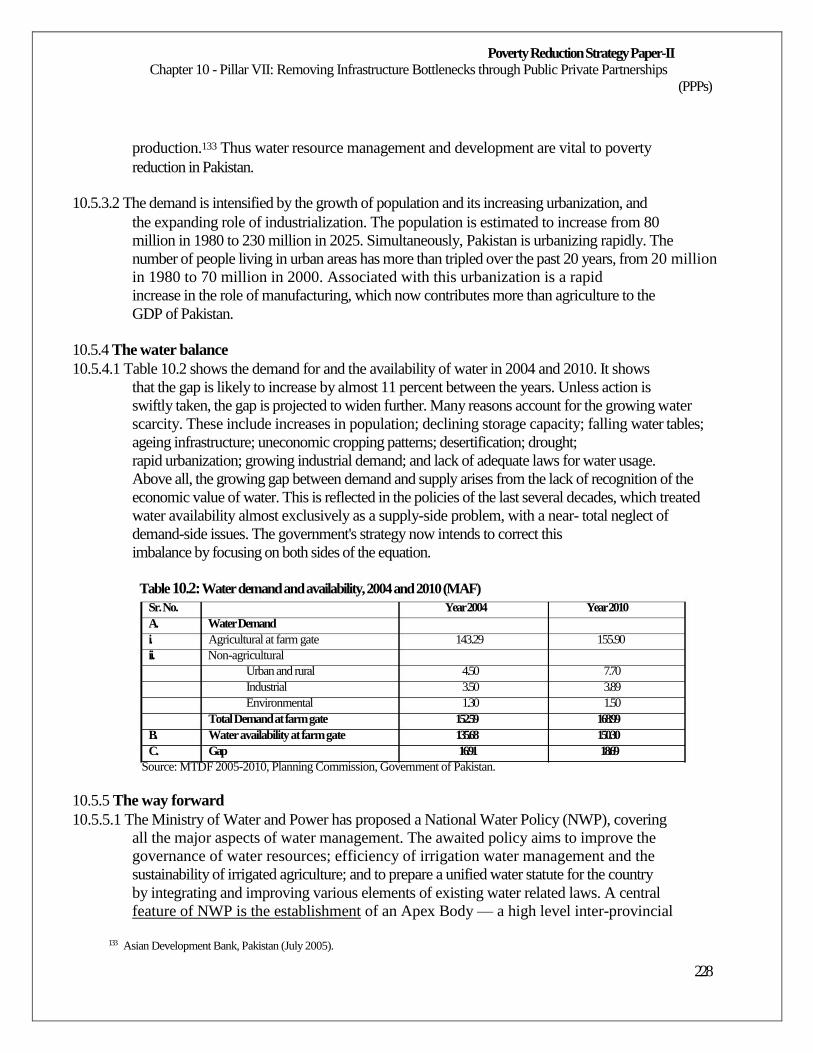
Poverty Reduction Strategy Paper-II Chapter 10 - Pillar VII: Removing Infrastructure Bottlenecks through Public Private Partnerships
(PPPs)
production.133 Thus water resource management and development are vital to poverty
reduction in Pakistan.
10.5.3.2 The demand is intensified by the growth of population and its increasing urbanization, and
the expanding role of industrialization. The population is estimated to increase from 80
million in 1980 to 230 million in 2025. Simultaneously, Pakistan is urbanizing rapidly. The
number of people living in urban areas has more than tripled over the past 20 years, from 20 million
in 1980 to 70 million in 2000. Associated with this urbanization is a rapid
increase in the role of manufacturing, which now contributes more than agriculture to the
GDP of Pakistan.
10.5.4 The water balance
10.5.4.1 Table 10.2 shows the demand for and the availability of water in 2004 and 2010. It shows
that the gap is likely to increase by almost 11 percent between the years. Unless action is
swiftly taken, the gap is projected to widen further. Many reasons account for the growing water
scarcity. These include increases in population; declining storage capacity; falling water tables;
ageing infrastructure; uneconomic cropping patterns; desertification; drought;
rapid urbanization; growing industrial demand; and lack of adequate laws for water usage.
Above all, the growing gap between demand and supply arises from the lack of recognition of the
economic value of water. This is reflected in the policies of the last several decades, which treated
water availability almost exclusively as a supply-side problem, with a near- total neglect of
demand-side issues. The government's strategy now intends to correct this
imbalance by focusing on both sides of the equation.
Table 10.2: Water demand and availability, 2004 and 2010 (MAF)
Sr. No. Year 2004 Year 2010 A. Water Demand i. Agricultural at farm gate 143.29 155.90 ii. Non-agricultural
Urban and rural 4.50 7.70 Industrial 3.50 3.89 Environmental 1.30 1.50
Total Demand at farm gate 152.59 168.99 B. Water availability at farm gate 135.68 150.30 C. Gap 16.91 18.69
Source: MTDF 2005-2010, Planning Commission, Government of Pakistan.
10.5.5 The way forward
10.5.5.1 The Ministry of Water and Power has proposed a National Water Policy (NWP), covering
all the major aspects of water management. The awaited policy aims to improve the
governance of water resources; efficiency of irrigation water management and the
sustainability of irrigated agriculture; and to prepare a unified water statute for the country
by integrating and improving various elements of existing water related laws. A central
feature of NWP is the establishment of an Apex Body — a high level inter-provincial
133
Asian Development Bank, Pakistan (July 2005).
228
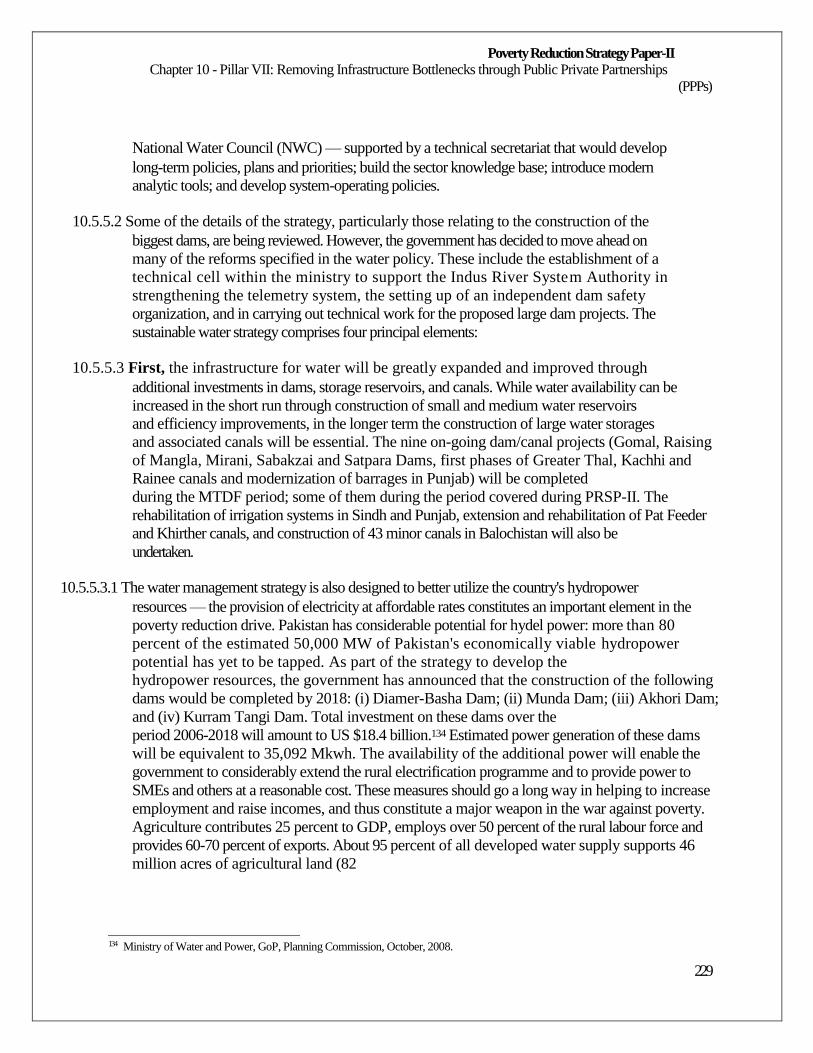
Poverty Reduction Strategy Paper-II Chapter 10 - Pillar VII: Removing Infrastructure Bottlenecks through Public Private Partnerships
(PPPs)
National Water Council (NWC) — supported by a technical secretariat that would develop
long-term policies, plans and priorities; build the sector knowledge base; introduce modern
analytic tools; and develop system-operating policies.
10.5.5.2 Some of the details of the strategy, particularly those relating to the construction of the
biggest dams, are being reviewed. However, the government has decided to move ahead on
many of the reforms specified in the water policy. These include the establishment of a
technical cell within the ministry to support the Indus River System Authority in
strengthening the telemetry system, the setting up of an independent dam safety
organization, and in carrying out technical work for the proposed large dam projects. The
sustainable water strategy comprises four principal elements:
10.5.5.3 First, the infrastructure for water will be greatly expanded and improved through
additional investments in dams, storage reservoirs, and canals. While water availability can be
increased in the short run through construction of small and medium water reservoirs
and efficiency improvements, in the longer term the construction of large water storages
and associated canals will be essential. The nine on-going dam/canal projects (Gomal, Raising
of Mangla, Mirani, Sabakzai and Satpara Dams, first phases of Greater Thal, Kachhi and
Rainee canals and modernization of barrages in Punjab) will be completed
during the MTDF period; some of them during the period covered during PRSP-II. The
rehabilitation of irrigation systems in Sindh and Punjab, extension and rehabilitation of Pat Feeder
and Khirther canals, and construction of 43 minor canals in Balochistan will also be
undertaken.
10.5.5.3.1 The water management strategy is also designed to better utilize the country's hydropower
resources — the provision of electricity at affordable rates constitutes an important element in the
poverty reduction drive. Pakistan has considerable potential for hydel power: more than 80
percent of the estimated 50,000 MW of Pakistan's economically viable hydropower
potential has yet to be tapped. As part of the strategy to develop the
hydropower resources, the government has announced that the construction of the following
dams would be completed by 2018: (i) Diamer-Basha Dam; (ii) Munda Dam; (iii) Akhori Dam;
and (iv) Kurram Tangi Dam. Total investment on these dams over the
period 2006-2018 will amount to US $18.4 billion.134 Estimated power generation of these dams
will be equivalent to 35,092 Mkwh. The availability of the additional power will enable the
government to considerably extend the rural electrification programme and to provide power to
SMEs and others at a reasonable cost. These measures should go a long way in helping to increase
employment and raise incomes, and thus constitute a major weapon in the war against poverty.
Agriculture contributes 25 percent to GDP, employs over 50 percent of the rural labour force and
provides 60-70 percent of exports. About 95 percent of all developed water supply supports 46
million acres of agricultural land (82
134
Ministry of Water and Power, GoP, Planning Commission, October, 2008.
229
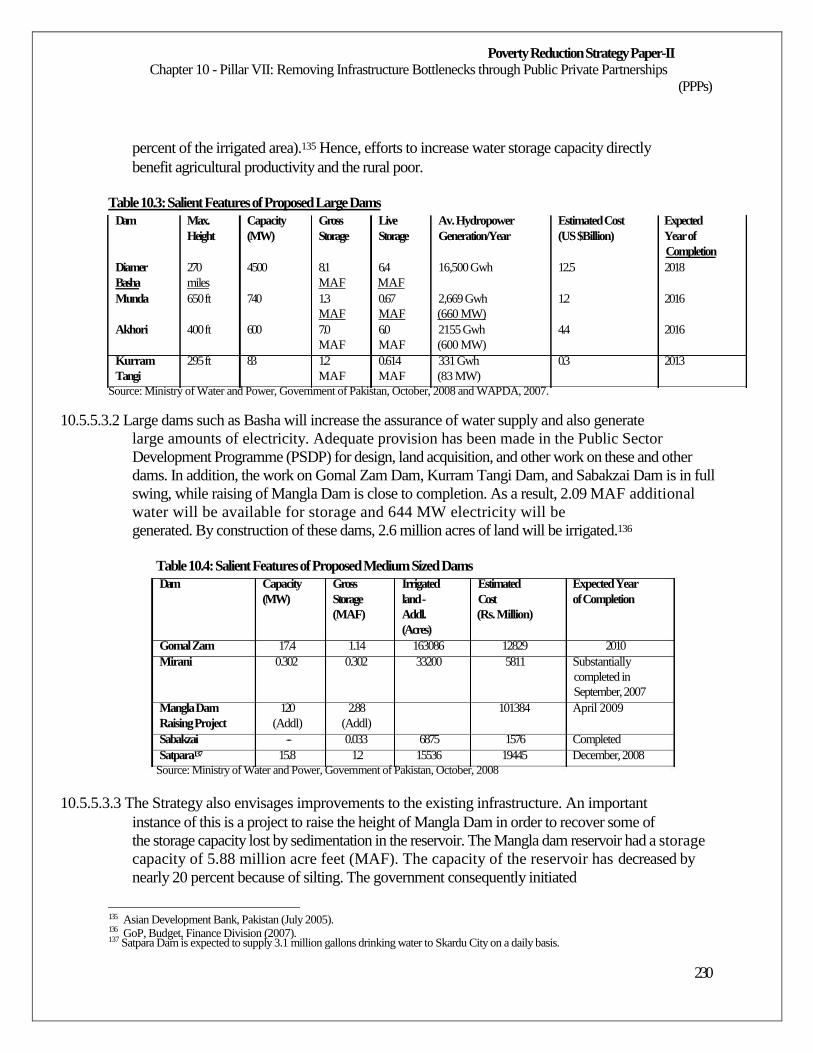
Poverty Reduction Strategy Paper-II Chapter 10 - Pillar VII: Removing Infrastructure Bottlenecks through Public Private Partnerships
(PPPs)
percent of the irrigated area).135 Hence, efforts to increase water storage capacity directly
benefit agricultural productivity and the rural poor.
Table 10.3: Salient Features of Proposed Large Dams
Dam Max. Capacity Gross Live Av. Hydropower Estimated Cost Expected Height (MW) Storage Storage Generation/Year (US $Billion) Year of
Completion Diamer 270 4500 8.1 6.4 16,500 Gwh 12.5 2018 Basha miles MAF MAF Munda 650 ft 740 1.3 0.67 2,669 Gwh 1.2 2016
MAF MAF (660 MW) Akhori 400 ft 600 7.0 6.0 2155 Gwh 4.4 2016
MAF MAF (600 MW) Kurram 295 ft 83 1.2 0.614 331 Gwh 0.3 2013 Tangi MAF MAF (83 MW)
Source: Ministry of Water and Power, Government of Pakistan, October, 2008 and WAPDA, 2007.
10.5.5.3.2 Large dams such as Basha will increase the assurance of water supply and also generate
large amounts of electricity. Adequate provision has been made in the Public Sector
Development Programme (PSDP) for design, land acquisition, and other work on these and other
dams. In addition, the work on Gomal Zam Dam, Kurram Tangi Dam, and Sabakzai Dam is in full
swing, while raising of Mangla Dam is close to completion. As a result, 2.09 MAF additional
water will be available for storage and 644 MW electricity will be
generated. By construction of these dams, 2.6 million acres of land will be irrigated.136
Table 10.4: Salient Features of Proposed Medium Sized Dams
Dam Capacity Gross Irrigated Estimated Expected Year (MW) Storage land - Cost of Completion
(MAF) Addl. (Rs. Million) (Acres)
Gomal Zam 17.4 1.14 163086 12829 2010 Mirani 0.302 0.302 33200 5811 Substantially
completed in September, 2007
Mangla Dam 120 2.88 101384 April 2009 Raising Project (Addl) (Addl) Sabakzai -- 0.033 6875 1576 Completed Satpara137 15.8 1.2 15536 19445 December, 2008
Source: Ministry of Water and Power, Government of Pakistan, October, 2008
10.5.5.3.3 The Strategy also envisages improvements to the existing infrastructure. An important
instance of this is a project to raise the height of Mangla Dam in order to recover some of
the storage capacity lost by sedimentation in the reservoir. The Mangla dam reservoir had a storage
capacity of 5.88 million acre feet (MAF). The capacity of the reservoir has decreased by
nearly 20 percent because of silting. The government consequently initiated
135 136
Asian Development Bank, Pakistan (July 2005). GoP, Budget, Finance Division (2007).
137 Satpara Dam is expected to supply 3.1 million gallons drinking water to Skardu City on a daily basis.
230
Poverty Reduction Strategy Paper-II Chapter 10 - Pillar VII: Removing Infrastructure Bottlenecks through Public Private Partnerships
(PPPs)
the raising of Mangla Dam by an additional 30 feet as a fast-track project. The primary aim
of this project is to prolong the life of the Mangla reservoir through improved methods of land-use
and better watershed management practices in the catchment area above the dam. The raising of
Mangla dam will increase the storage capacity by 2.9 MAF. The average
energy output is also likely to increase by an estimated 644 Gwh138.
10.5.5.3.4 The government is also giving due consideration to construction of small dams in the
country. For this purpose an allocation of Rs 920 million has been made in PSDP 2008-09. Work
on Plai, Kundal and Sanam Dams is being started. Feasibility and design of Nai Gaj Dam in
Sindh; and Hingol Naulong, Sukleji and Winder dams in Balochistan is being
finalized. Punjab is financing construction of 13 small dams from its own Annual
Development Plan (ADP).139
10.5.5.3.5 Although large and medium-sized dams will be completed during intervals well after the
PRSP-II timeframe, they have been incorporated in PRSP-II since work has already started
on them and annual expenditures/allocations have been made.
10.5.5.3.6 It is also essential to assign sufficient financial resources to maintain the water
infrastructure in good shape. Pakistan's large stock of major irrigation140
bulk water and
infrastructure has an estimated replacement cost of about US $60 billion . Much of this
infrastructure is very old, with major structures operating well beyond their designed life.
International experience suggests that a typical figure for replacement and maintenance is
about 3 percent of the value of the capital stock of water infrastructure. Thus Punjab, which
has US $20 billion of water infrastructure, will require about US $0.6 billion a year for the
replacement and maintenance of its irrigation assets.
10.5.5.4 Second, the Poverty Reduction Strategy will encompass a plan to pay for the costs of
adding to the irrigation infrastructure especially of increasing the storage capacity so as to
provide more reliable and secure water supplies for the country. The government's own funds
will be supplemented by resources from the private sector and assistance from
development partners. An enabling environment will be created for consultations with
stakeholders and for their participation at all levels and in all aspects of the water resources
including: irrigation; drainage; domestic water supply; flood protection; drought
mitigation; waste water treatment; and pollution control. The government will promote
management practices that enable community participation in the performance, operation,
and ownership of water assets.
10.5.5.5 Third, the government recognizes that water usage will be changing in the coming years.
While irrigation will remain by far the largest user of water, more and more water will have to be
reallocated from agricultural to urban use. This means that large investments will be required for
collecting and treating urban and industrial waste, and major changes will need
138 139
Ministry of Water and Power, Government of Pakistan, October, 2008. Ministry of Water and Power, Government of Pakistan, October, 2008.
140 World Bank, (2005), Ibid., pp. 58 & 110.
231
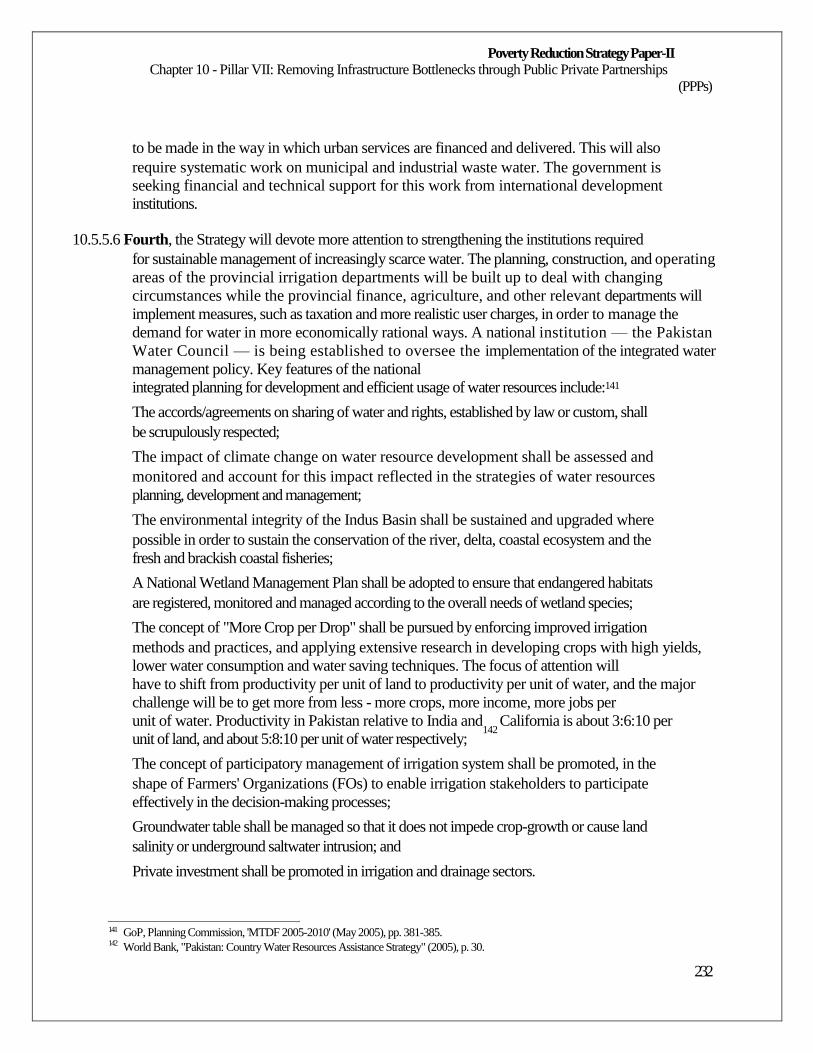
Poverty Reduction Strategy Paper-II Chapter 10 - Pillar VII: Removing Infrastructure Bottlenecks through Public Private Partnerships
(PPPs)
to be made in the way in which urban services are financed and delivered. This will also
require systematic work on municipal and industrial waste water. The government is
seeking financial and technical support for this work from international development
institutions.
10.5.5.6 Fourth, the Strategy will devote more attention to strengthening the institutions required
for sustainable management of increasingly scarce water. The planning, construction, and operating
areas of the provincial irrigation departments will be built up to deal with changing
circumstances while the provincial finance, agriculture, and other relevant departments will
implement measures, such as taxation and more realistic user charges, in order to manage the
demand for water in more economically rational ways. A national institution — the Pakistan
Water Council — is being established to oversee the implementation of the integrated water
management policy. Key features of the national
integrated planning for development and efficient usage of water resources include:141
The accords/agreements on sharing of water and rights, established by law or custom, shall
be scrupulously respected;
The impact of climate change on water resource development shall be assessed and
monitored and account for this impact reflected in the strategies of water resources
planning, development and management;
The environmental integrity of the Indus Basin shall be sustained and upgraded where
possible in order to sustain the conservation of the river, delta, coastal ecosystem and the
fresh and brackish coastal fisheries;
A National Wetland Management Plan shall be adopted to ensure that endangered habitats
are registered, monitored and managed according to the overall needs of wetland species;
The concept of "More Crop per Drop" shall be pursued by enforcing improved irrigation
methods and practices, and applying extensive research in developing crops with high yields,
lower water consumption and water saving techniques. The focus of attention will
have to shift from productivity per unit of land to productivity per unit of water, and the major
challenge will be to get more from less - more crops, more income, more jobs per
unit of water. Productivity in Pakistan relative to India and142
California is about 3:6:10 per
unit of land, and about 5:8:10 per unit of water respectively;
The concept of participatory management of irrigation system shall be promoted, in the
shape of Farmers' Organizations (FOs) to enable irrigation stakeholders to participate
effectively in the decision-making processes;
Groundwater table shall be managed so that it does not impede crop-growth or cause land
salinity or underground saltwater intrusion; and
Private investment shall be promoted in irrigation and drainage sectors.
141 142
GoP, Planning Commission, 'MTDF 2005-2010' (May 2005), pp. 381-385. World Bank, "Pakistan: Country Water Resources Assistance Strategy" (2005), p. 30.
232
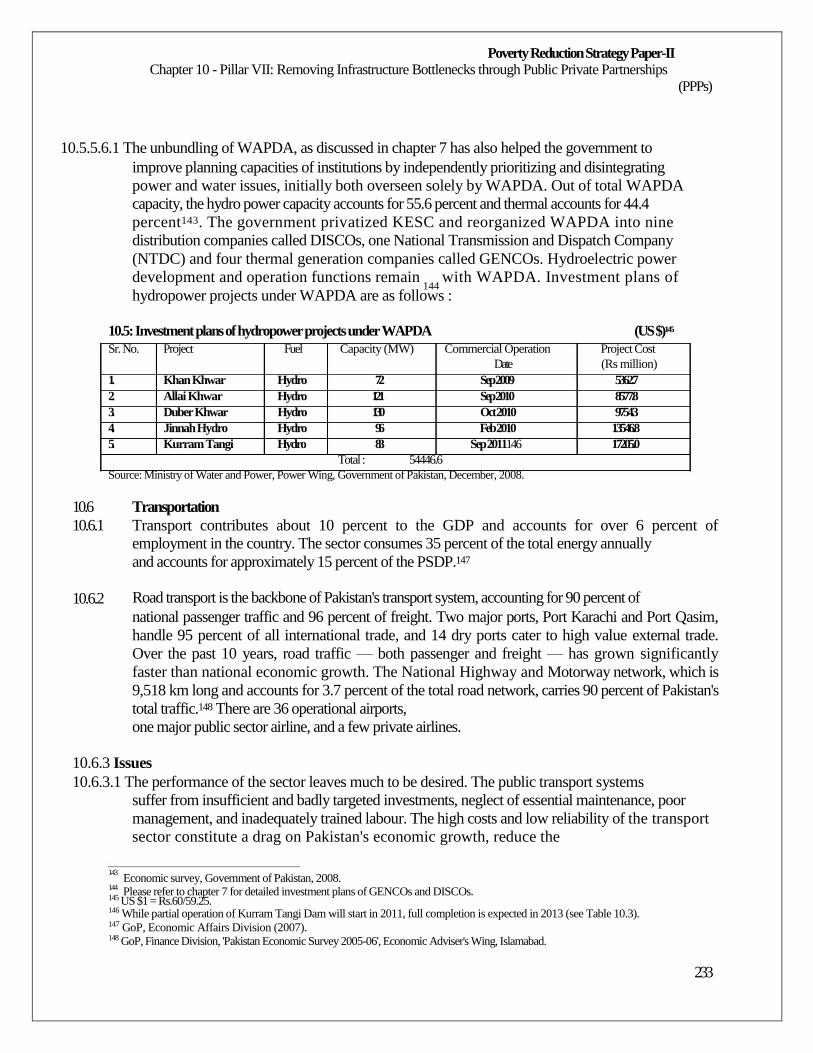
Poverty Reduction Strategy Paper-II Chapter 10 - Pillar VII: Removing Infrastructure Bottlenecks through Public Private Partnerships
(PPPs)
10.5.5.6.1 The unbundling of WAPDA, as discussed in chapter 7 has also helped the government to
improve planning capacities of institutions by independently prioritizing and disintegrating
power and water issues, initially both overseen solely by WAPDA. Out of total WAPDA
capacity, the hydro power capacity accounts for 55.6 percent and thermal accounts for 44.4
percent143. The government privatized KESC and reorganized WAPDA into nine
distribution companies called DISCOs, one National Transmission and Dispatch Company
(NTDC) and four thermal generation companies called GENCOs. Hydroelectric power
development and operation functions remain 144
with WAPDA. Investment plans of
hydropower projects under WAPDA are as follows :
10.5: Investment plans of hydropower projects under WAPDA Sr. No. Project Fuel Capacity (MW) Commercial Operation
Date 1. Khan Khwar Hydro 72 Sep 2009 2. Allai Khwar Hydro 121 Sep 2010 3. Duber Khwar Hydro 130 Oct 2010 4. Jinnah Hydro Hydro 96 Feb 2010 5. Kurram Tangi Hydro 83 Sep 2011146
Total : 54446.6 Source: Ministry of Water and Power, Power Wing, Government of Pakistan, December, 2008.
(US $)145 Project Cost (Rs million)
5362.7 8577.8 9754.3
13546.8 17205.0
10.6
10.6.1
10.6.2
Transportation
Transport contributes about 10 percent to the GDP and accounts for over 6 percent of employment in the country. The sector consumes 35 percent of the total energy annually
and accounts for approximately 15 percent of the PSDP.147
Road transport is the backbone of Pakistan's transport system, accounting for 90 percent of
national passenger traffic and 96 percent of freight. Two major ports, Port Karachi and Port Qasim,
handle 95 percent of all international trade, and 14 dry ports cater to high value external trade.
Over the past 10 years, road traffic — both passenger and freight — has grown significantly
faster than national economic growth. The National Highway and Motorway network, which is
9,518 km long and accounts for 3.7 percent of the total road network, carries 90 percent of Pakistan's
total traffic.148 There are 36 operational airports,
one major public sector airline, and a few private airlines.
10.6.3 Issues
10.6.3.1 The performance of the sector leaves much to be desired. The public transport systems
suffer from insufficient and badly targeted investments, neglect of essential maintenance, poor
management, and inadequately trained labour. The high costs and low reliability of the transport
sector constitute a drag on Pakistan's economic growth, reduce the
143 144
Economic survey, Government of Pakistan, 2008. Please refer to chapter 7 for detailed investment plans of GENCOs and DISCOs.
145 US $1 = Rs.60/59.25. 146 While partial operation of Kurram Tangi Dam will start in 2011, full completion is expected in 2013 (see Table 10.3). 147 GoP, Economic Affairs Division (2007). 148 GoP, Finance Division, 'Pakistan Economic Survey 2005-06', Economic Adviser's Wing, Islamabad.
233
Poverty Reduction Strategy Paper-II Chapter 10 - Pillar VII: Removing Infrastructure Bottlenecks through Public Private Partnerships
(PPPs)
competitiveness of the country's exports, and constrain its ability to integrate into global
supply chains that require just-in-time delivery.149 It is estimated that the inefficiencies in
the transport system impose a cost to the economy of about 4-6 percent of the GDP.
10.6.3.2 An efficient transport system is a pre-requisite for Pakistan to rapidly evolve into a globally
competitive economy that would meet the country's goals for reducing poverty. The
government's strategy for the transport sector is directed not only towards the sector's role
in supporting domestic trade, but also takes advantage of Pakistan's strategic position in the
region so as to create stronger and more efficient links with neighbouring countries.
10.6.3.3 The strategy includes large financial allocations for investment, a strengthening of
institutional capacity, and the participation of the private sector through public-private
partnerships. Institutional capacity will be strengthened and R&D activities stepped up.
Regional connectivity will be improved, including links to Central Asian States, Iran,
Afghanistan and India. Railways will be revitalized by transforming it into a commercially-
oriented entity. Port infrastructure will be developed and port charges rationalized through
the landlord port concept. Airports will be upgraded and a major expansion of the telecom network
undertaken. Key objectives include establishing an efficient and integrated transport system
that will facilitate the development of a competitive economy, reduce transport costs, ensure
safety in mobility, and enhance regional connectivity by creating greater synergy between the
rural, provincial and federal transport infrastructure. These aims will further help to increase
Pakistan's share of world trade, which currently stands at only 0.2 percent. The development of the
transport sector will also bring about structural changes in the industrial and services base by
facilitating a better economic mix. This transformation should go far towards promoting value
addition and job creation, and play a
crucial role in reducing poverty.
10.6.3.4 The existing infrastructure cannot support the aims of the government to regain GDP
growth. However, with the capital investment, institutional strengthening, and policy
reforms that are planned, the sector's capacity and functioning will be sufficiently enhanced
to play its required role.
10.6.4
National Trade Corridor
Since the overwhelming amount of goods and passenger traffic moves along a line from
Karachi to Peshawar, the government has launched a major strategic initiative to improve
the trade and transport logistics chain along the the north-south axis that links Pakistan's
major ports with its main industrial centres and neighbouring countries. Together the ports,
road and railways along NTC handle 95 percent of external trade and 65 percent of total land
freight, and serve the regions of the country that contribute about 80-85 percent of the
country's GDP.
149
World Bank (2007).
234
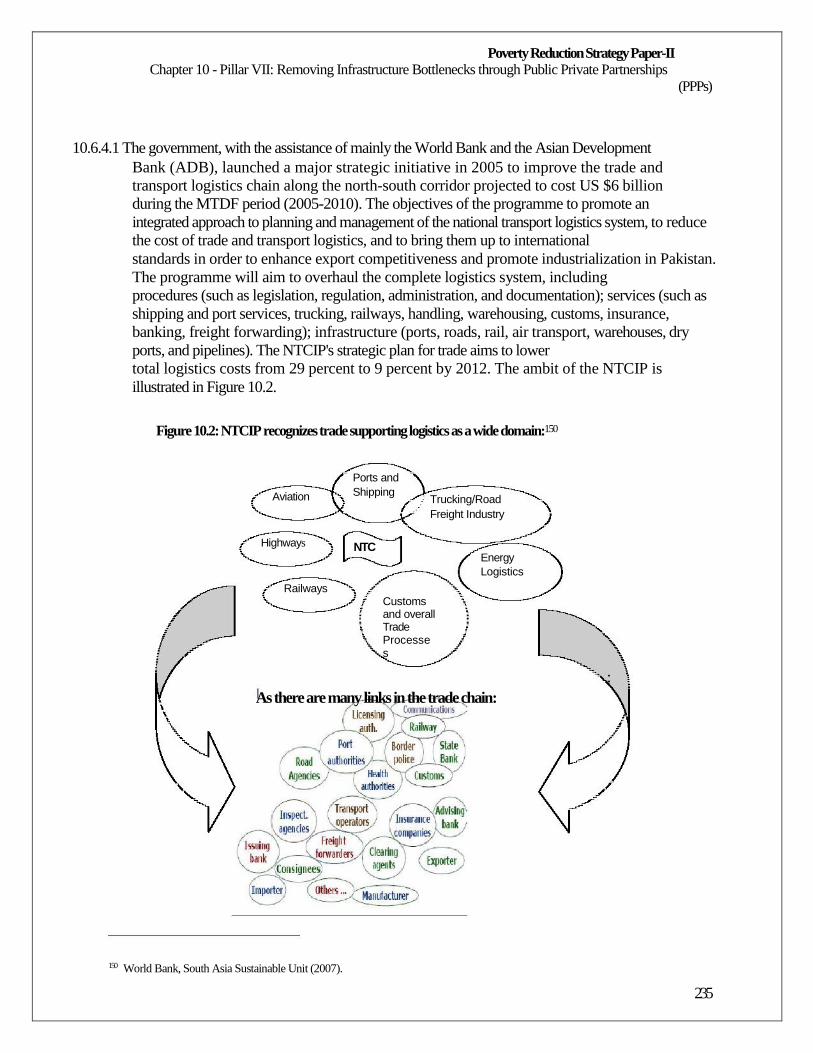
Poverty Reduction Strategy Paper-II Chapter 10 - Pillar VII: Removing Infrastructure Bottlenecks through Public Private Partnerships
(PPPs)
10.6.4.1 The government, with the assistance of mainly the World Bank and the Asian Development
Bank (ADB), launched a major strategic initiative in 2005 to improve the trade and
transport logistics chain along the north-south corridor projected to cost US $6 billion
during the MTDF period (2005-2010). The objectives of the programme to promote an
integrated approach to planning and management of the national transport logistics system, to reduce
the cost of trade and transport logistics, and to bring them up to international
standards in order to enhance export competitiveness and promote industrialization in Pakistan.
The programme will aim to overhaul the complete logistics system, including
procedures (such as legislation, regulation, administration, and documentation); services (such as
shipping and port services, trucking, railways, handling, warehousing, customs, insurance,
banking, freight forwarding); infrastructure (ports, roads, rail, air transport, warehouses, dry
ports, and pipelines). The NTCIP's strategic plan for trade aims to lower
total logistics costs from 29 percent to 9 percent by 2012. The ambit of the NTCIP is
illustrated in Figure 10.2.
Figure 10.2: NTCIP recognizes trade supporting logistics as a wide domain:150
Ports and
Aviation
Highways
Railways
Shipping
NTC
Trucking/Road Freight Industry
Energy Logistics
Customs and overall Trade Processes
:
As there are many links in the trade chain:
150
World Bank, South Asia Sustainable Unit (2007).
235
Poverty Reduction Strategy Paper-II Chapter 10 - Pillar VII: Removing Infrastructure Bottlenecks through Public Private Partnerships
(PPPs)
10.6.4.2 Some early gains of the programme include:151 reduction of port entry charges by 15
percent; decrease in port dwell times to four days and of customs clearance to less than one day for
containers; reduction of up-country container travel times by 10-20 percent.152 The free time at ports
has been reduced from 7 days to 5 days, resulting in less congestion at
ports and more effective inventory management by the trade. Speedy, non-intrusive
scanners have been installed at Lahore, Mughalpura dry-port, NLC dry port, Port Qasim,
and Jamroad Transit station, while the scanners for Chamman and Sust are being procured.
The electronic filing of carrier and goods declaration modules have been implemented
nationwide. A multi-agency modern transit terminal has been constructed at Jamrud (near Peshawar)
for smooth and speedy clearance of transit cargo. Continuous working at ports by Customs and
other agencies started from February 2007. All government agencies are now available round the
clock for clearance of international cargo at all customs' ports. Ministry of Commerce has
drafted a revised agreement on regional and Pakistan- Afghanistan transit trade in
consultation with all stakeholders. Maximum facilitation for
customs clearance and transportation of Afghan transit cargo has been ensured.
10.6.4.3 To achieve the objectives of the NTCIP, which will be reassessed on an annual basis until
the end of the project, the government has adopted an integrated approach encompassing
public and private actors in the various sectors that contribute to the performance of the Corridor
(highways, road transport, ports and shipping, civil aviation, railways and
customs). The government has also set up a strong management framework.
10.6.4.4 An NTC Secretariat has been established in the Planning Commission for inter-sectoral
coordination, analytical work, performance assessment and monitoring and impact
evaluation. A National Trade Corridor Improvement Programme (NTCIP) Task Force,
chaired by the Deputy Chairman of the Planning Commission meets quarterly to review progress
in implementing the NTCIP against agreed targets and performance benchmarks.
Seven committees: (i) Ports and Shipping (ii) Trade Facilitation (iii) Highways
Modernization (iv) Trucking Modernization (v) Railways Restructuring and Modernization
created under the umbrella of the Cabinet NTCIP task force for each of the sectors involved
in the NTC. These committees are chaired by the Federal Secretary of the relevant
Ministry and include representatives of the donor community and the private sector.
10.6.4.5 The institutional side of developing the Corridor will not be neglected. It has been
estimated that trade facilitation can save Pakistan US $1.3 billion annually. The
government has set up a Trade Facilitation Committee, the broad mandate for which includes
measures to reduce clearance and dwell times; to develop dry ports; to modernize practices relating to
trade and transport logistics; to expedite the implementation of reforms
151
A performance monitoring and evaluation framework study for NTC is presently being prepared. This study will identify and
establish a quantitative methodology for linking performance and economic impacts/planning on the country's economy, and create a pilot results-based database and analysis system for the NTC sectors. 152 World Bank, 'Pakistan National Trade Corridor Programme' (2006).
236
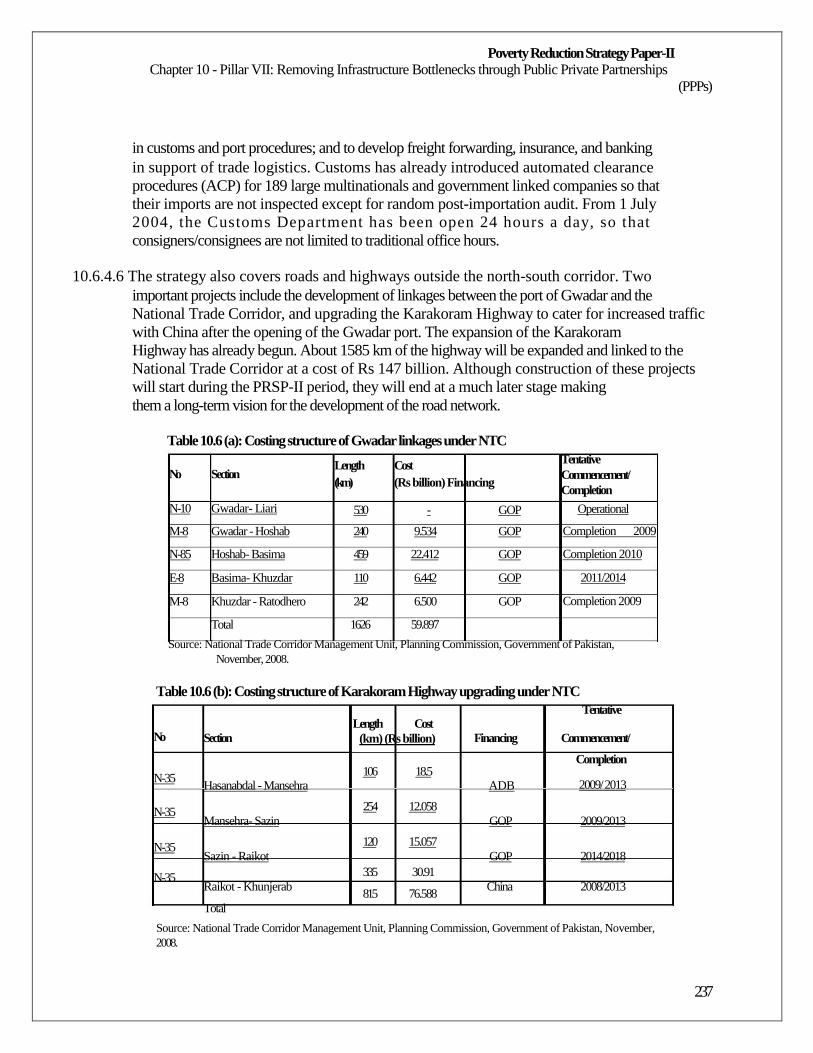
Poverty Reduction Strategy Paper-II Chapter 10 - Pillar VII: Removing Infrastructure Bottlenecks through Public Private Partnerships
(PPPs)
in customs and port procedures; and to develop freight forwarding, insurance, and banking
in support of trade logistics. Customs has already introduced automated clearance
procedures (ACP) for 189 large multinationals and government linked companies so that
their imports are not inspected except for random post-importation audit. From 1 July
2004, the Customs Department has been open 24 hours a day, so that
consigners/consignees are not limited to traditional office hours.
10.6.4.6 The strategy also covers roads and highways outside the north-south corridor. Two
important projects include the development of linkages between the port of Gwadar and the
National Trade Corridor, and upgrading the Karakoram Highway to cater for increased traffic
with China after the opening of the Gwadar port. The expansion of the Karakoram
Highway has already begun. About 1585 km of the highway will be expanded and linked to the
National Trade Corridor at a cost of Rs 147 billion. Although construction of these projects
will start during the PRSP-II period, they will end at a much later stage making
them a long-term vision for the development of the road network.
Table 10.6 (a): Costing structure of Gwadar linkages under NTC
No
N-10
M-8
N-85
E-8
M-8
Section
Gwadar- Liari
Gwadar - Hoshab
Hoshab- Basima
Basima- Khuzdar
Khuzdar - Ratodhero
Total
Length (km)
530
240
459
110
242
1626
Cost (Rs billion) Financing
- GOP
9.534 GOP
22.412 GOP
6.442 GOP
6.500 GOP
59.897
Tentative Commencement/ Completion
Operational
Completion 2009
Completion 2010
2011/2014
Completion 2009
Source: National Trade Corridor Management Unit, Planning Commission, Government of Pakistan, November, 2008.
Table 10.6 (b): Costing structure of Karakoram Highway upgrading under NTC
Tentative Length Cost
No
N-35
N-35
N-35
N-35
Section
Hasanabdal - Mansehra
Mansehra- Sazin
Sazin - Raikot
Raikot - Khunjerab
Total
(km) (Rs billion)
106 18.5
254 12.058
120 15.057
335 30.91
815 76.588
Financing
ADB
GOP
GOP
China
Commencement/
Completion
2009/ 2013
2009/2013
2014/2018
2008/2013
Source: National Trade Corridor Management Unit, Planning Commission, Government of Pakistan, November, 2008.
237
Poverty Reduction Strategy Paper-II Chapter 10 - Pillar VII: Removing Infrastructure Bottlenecks through Public Private Partnerships
(PPPs)
10.6.5 Highways
10.6.5.1It has been estimated that modernization of highways can save Pakistan US $2 billion
annually. Sustaining delivery of an efficient, safe and reliable National Highway system will
involve: (i) strengthening institutional, financing and technical capacity of National Highway
Authority (NHA); (ii) ensuring a stable, secure, and adequate source of funding for road
maintenance; and (iii) encouraging private sector participation in construction and
operation of highway infrastructure. Actions towards these goals will include:
Preparing an annual business plan for the road sector, including allocating resources
to road asset management;
Introducing performance-based corridor management including an established modern
highway operations centers, trucking stands, and trauma centers along the
north-south expressway corridor;
Modernizing and enhancing the capacity of North-South (N-S) and allied National
Highways through the application of an Intelligent Transport System (ITS) -
Electronic Real Time Traveler Information Services, Electronic Financial
Transaction Services, Incident and Hazard Management Services;
Establishing a Road Safety Council at federal and provincial level;
Rationalizing road check points on NTC;
Completion of the Road Freight Industry (RFI) Policy (the first phase of the RFI
covering tariff restructuring has been completed); and
Development of plans for ancillary facilities, such as modern highway operations
centres, trucking stands, and trauma centres along the north-south expressway
corridor.
10.6.5.2 The government is implementing a National Highway Improvement Programme (NHIP) to
increase the efficiency of the National Highway Authority (NHA), through phased
improvement of approximately 2700 km of highways. The programme was initiated during FY02
using GoP's own resources. The huge NHA project portfolio (Rs 277 billion) has its roots in a very
ambitious highway expansion programme launched by the government during the early 1990s,
to rectify past under-investments in this sector. Even though there has been some improvement in
portfolio management since 2000, much more needs to be done. Reforms aim to improve the quality
of public sector expenditure through a Medium Term Budgetary Framework. They also aim to
enhance sustainable sources of maintenance finance with greater user participation, and improve
governance through progressive commercialization of NHA activities. In addition, the
project is also financing reconstruction and rehabilitation of about 180 km of roads damaged by
the earthquake of
October 8, 2005.153
10.6.5.3 A plan to rehabilitate and improve the National Expressway Corridor (at a cost of US $2
billion) has already been appraised and approved. Some benefits from this initiative have
153
World Bank (2007)
238
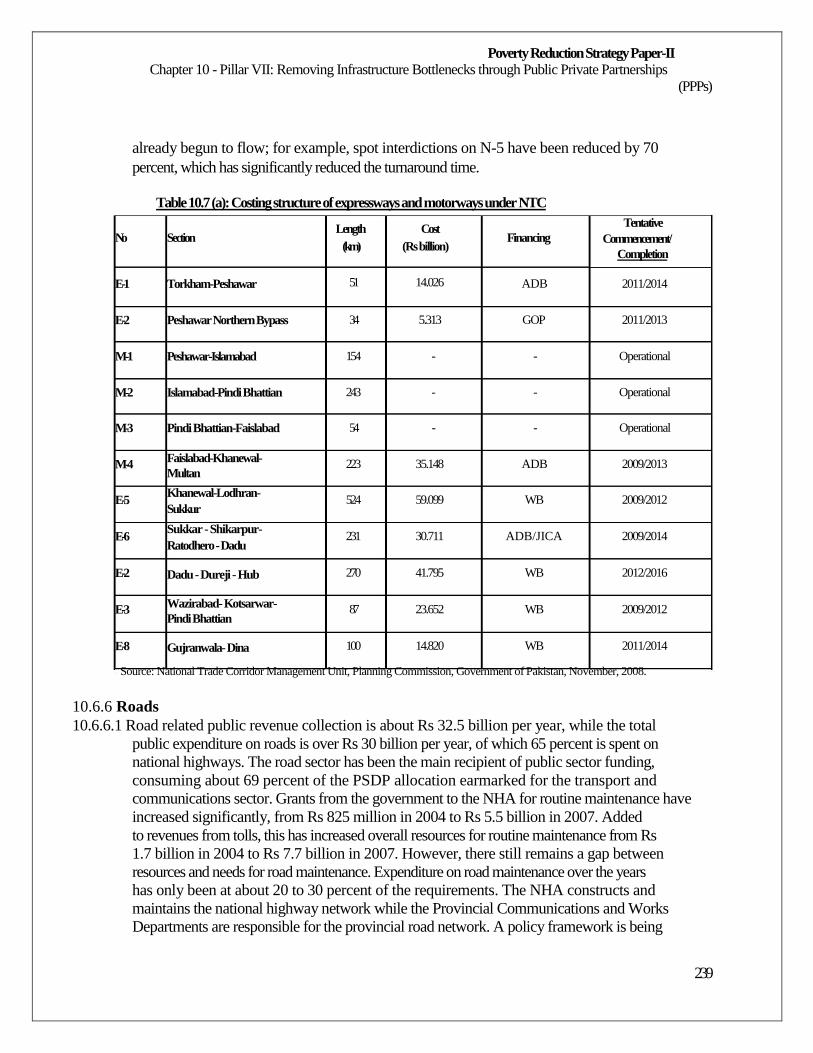
Poverty Reduction Strategy Paper-II Chapter 10 - Pillar VII: Removing Infrastructure Bottlenecks through Public Private Partnerships
(PPPs)
already begun to flow; for example, spot interdictions on N-5 have been reduced by 70
percent, which has significantly reduced the turnaround time.
Table 10.7 (a): Costing structure of expressways and motorways under NTC
No
E-1
E-2
M-1
M-2
M-3
M-4
E-5
E-6
E-2
E-3
E-8
Section
Torkham-Peshawar
Peshawar Northern Bypass
Peshawar-Islamabad
Islamabad-Pindi Bhattian
Pindi Bhattian-Faislabad Faislabad-Khanewal- Multan
Khanewal-Lodhran- Sukkur
Sukkar - Shikarpur- Ratodhero - Dadu
Dadu - Dureji - Hub Wazirabad- Kotsarwar- Pindi Bhattian
Gujranwala- Dina
Length (km)
51
34
154
243
54
223
524
231
270
87
100
Cost (Rs billion)
14.026
5.313
-
-
-
35.148
59.099
30.711
41.795
23.652
14.820
Financing
ADB
GOP
-
-
-
ADB
WB
ADB/JICA
WB
WB
WB
Tentative Commencement/
Completion
2011/2014
2011/2013
Operational
Operational
Operational
2009/2013
2009/2012
2009/2014
2012/2016
2009/2012
2011/2014
Source: National Trade Corridor Management Unit, Planning Commission, Government of Pakistan, November, 2008.
10.6.6 Roads
10.6.6.1 Road related public revenue collection is about Rs 32.5 billion per year, while the total
public expenditure on roads is over Rs 30 billion per year, of which 65 percent is spent on
national highways. The road sector has been the main recipient of public sector funding,
consuming about 69 percent of the PSDP allocation earmarked for the transport and
communications sector. Grants from the government to the NHA for routine maintenance have
increased significantly, from Rs 825 million in 2004 to Rs 5.5 billion in 2007. Added
to revenues from tolls, this has increased overall resources for routine maintenance from Rs
1.7 billion in 2004 to Rs 7.7 billion in 2007. However, there still remains a gap between
resources and needs for road maintenance. Expenditure on road maintenance over the years
has only been at about 20 to 30 percent of the requirements. The NHA constructs and
maintains the national highway network while the Provincial Communications and Works
Departments are responsible for the provincial road network. A policy framework is being
239
Poverty Reduction Strategy Paper-II Chapter 10 - Pillar VII: Removing Infrastructure Bottlenecks through Public Private Partnerships
(PPPs)
prepared that will cover road user charges, road fund, axle load control, road safety,
environmental and social a154
cts, and will encourage private sector participation in road spe
construction and operation.
10.6.6.2 The government's strategy for developing the transport infrastructure includes a more
comprehensive approach to constructing and upgrading road access in rural areas. The ongoing
devolution process was expected to strengthen policies that responded more quickly to
beneficiaries' needs. It is now understood that in certain aspects, more training will have to be
provided at the local level in order to perform this job effectively. In the transport sector, the
importance of road maintenance and intra-village infrastructure will be emphasized. The
substantially larger allocations of financial resources from the federal
government to the provinces, and the measures put in place to ensure a larger and smoother
movement of such resources from provincial to local governments (described in chapter 12 on
governance), should help ease the resource constraint on upgrading rural roads. The government
will also take steps to improve the regulation of transport services; these regulations will
address issues such as the low frequency of service in some areas, overloading of passengers
and goods, and fares. The question of fares will require the authorities to interact with the private
sector in order to ensure that these are not set on the
basis of a monopoly position.
10.6.6.3 Nearly two-thirds of Pakistan's population lives in rural areas. One in every five villages,
where 15 percent of the population lives, is not accessible by all-weather motorable roads. This
average, of course, conceals wide variations; thus while only about 8 percent of the Punjab's
villages does not have all-weather motorable access, the figure rises to 36 percent for Balochistan.
Nearly 30 percent of the country's villages does not have a bus or wagon
stop within the village. For such settlements, the average distance to a bus/wagon stop is
8.2 km.
10.6.6.4 These deficiencies in the rural transport infrastructure impact not only on the obvious
sectors, such as trade, but are also associated with lower human development outcomes. Data
suggest that girls' net primary school enrollment rates are 50 percent higher in villages with all-weather
motorable access and female literacy rates about 75 percent higher than in villages that lack such
facilities. These communities also have a higher incidence of pre-
natal medical consultation for women; a higher proportion of childbirths attended by
skilled personnel; a higher incidence of post-natal consultation; and a lower probability of births at
home. In short, it is difficult to think of developing the rural areas without
substantially improving their transport infrastructure.
10.6.7 Trucking Industry
10.6.7.1 The government adopted a trucking policy, 'Modernization of the Trucking Sector', in
October, 2007 and is currently developing the implementation strategy. The objective of
154
Trade & Transport Facilitation Project-2, Planning Commission and Ministry of Commerce, Government of Pakistan, May
2006.
240
Poverty Reduction Strategy Paper-II Chapter 10 - Pillar VII: Removing Infrastructure Bottlenecks through Public Private Partnerships
(PPPs)
this strategy is to reform and promote integrated and sustainable modernization of the
trucking sector to enhance trade and logistic efficiencies and reduce the cost of the economy
through improved management of the Road Freight Sector. It is expected that
increased efficiency will reduce the average travel time between Karachi and the main
industrial centres in the Punjab from 48 hours to 24 hours. Other elements in the strategy
include:
Making Pakistan a regional hub for international trade;
Corporatizing the National Logistics Cell;
Rationalizing truck import tariffs to have a level-playing field with the local building
industry;
Developing a truck financing scheme with private financing institutions;
Establishing truck drivers training facilities in association with private shippers;
Revising diesel quality and marketing low sulphur diesel;
Controlling overloading, environmental externalities, and fuel quality;
Reducing operating costs and improving fuel efficiency; and
Replacing obsolete 2-axle and 3-axle rigid trucks.
10.6.7.2 The trucking sector is a component of the overall NTCIP and is entrusted to the Ministry of
Industries & Production. According to the newly approved trucking policy, the trucking
sector has been declared an industry as of January, 2008 and given the following additional
incentives: withdrawal of 1 percent Federal Insurance Fee and 5 percent Federal Excise
Duty (FED) on gross premium; investment tax credit allowance at 15 percent to be allowed
to fleet operators; National Freight and Logistics Chamber (NFLC) to be constituted to formally
organize the sector; revamping of motor vehicle examination/registration system - establishment of
Central Data Repository; drivers' licensing/training; establishment of
trans freight status; and establishment of an industrial estate for trade/bus body makers155.
10.6.7 Ports
10.6.8.1 Pakistan has a coastline of 990 km and an offshore Exclusive Economic Zone covering an
area of 240,000 sq km. These constitute important bases for developing ports and making
the country more competitive in international trade. The functioning of the existing ports needs
improvement; it has been estimated that the efficient running of ports can save
Pakistan US $450 million annually. The NTCIP strategy for port development includes:
Preparation of a ports' master plan for the coordinated development of all ports in
Pakistan;
Projects to reduce costs, improve logistics, and upgrade the existing infrastructure;
Making port tariffs competitive with other regional ports;
155
Ministry of Industries & Production, Government of Pakistan, October, 2008.
241
Poverty Reduction Strategy Paper-II Chapter 10 - Pillar VII: Removing Infrastructure Bottlenecks through Public Private Partnerships
(PPPs)
Ensuring the rights of labour and working conditions for dockers in line with
international practices;
To ensure efficiency of port operations and reduce port costs by outsourcing port
activities such as dredging, piloting and tug boats operation and rightsizing of staff
mainly at Karachi Port Trust and Port Qasim Authority by 25-40 percent;
Revising ports' acts and bills to corporatize ports;
Privatizing dockyard and bulk handling as well as reducing port costs and terminal
handling charges;
Ensuring navigation available throughout the year, 24 hours a day; and
Overhauling port finances to focus on cost recovery.
10.6.8 Railways
10.6.9.1 An efficient railway system can save Pakistan US $1 billion annually. Therefore, to make
fiscal space for growth-oriented investments, railway reforms constitute an important part
of the strategy. The strategy's main focus will be on increasing the efficiency of Pakistan Railways
(PR) and reducing the level of state subsidies. Private sector management and financing will be
introduced in the rail freight sector. A commercially-oriented rail
environment will be created, eliminating cross subsidies and involving:
Corporatizing and devolving more managerial and financial autonomy;
Organizing structures around lines of business (freight, passengers, infrastructure) for
better knowledge of costs and profitability;
Making financing of loss-making services transparent;
Opening the track to private operators by implementing the Track Access Policy (being
developed by PR);
Introducing a door-to-door service through involvement of private freight forwarders
and cargo haulers between railway stations in Karachi and Lahore; and
Initiating Fast Track Access for PR freight business to reduce travel time for Karachi-
Lahore container services to 28 hours against the present 56 hours.
10.6.8.1 The development portfolio of Pakistan Railways (PR) consists of a total of 32 projects, at a
cost of Rs 103 billion. Six projects are nearly completed and eight projects are in the pipeline.
PR's eighteen on-going projects will be completed in 4 years with the current level of allocations.
The overall portfolio will be completed in six years. The allocations
are in line with MTDF, and many of the projects will be finished during the PRSP-II
period.
10.6.9 Aviation
10.6.9.1 Adoption of a revised civil aviation policy will separate regulatory functions, air navigation
services, and airport operations. The main objective in the aviation sector, however, is the
enhancement of the cargo infrastructure at important airports to meet the delivery needs of a modern
global supply chain. The National Aviation Policy was approved by the
242
Poverty Reduction Strategy Paper-II Chapter 10 - Pillar VII: Removing Infrastructure Bottlenecks through Public Private Partnerships
(PPPs)
government in 2007. The vision of this strategy is to establish a progressive, liberalized,
and efficient aviation sector based on competition and fair opportunities; regulated to safeguard
public and national interest, provide impetus to national economy and to achieve international
standards of safety and security. Objectives include: to comply with ICAO standards of Safety,
Security and Regularity; to promote aviation sector in the country by allowing market forces to
determine the price, quality, frequency and range of air services; to increase its contribution in GDP
from about 0.1 to 1 percent over a period of 5 years; to encourage development of passenger hubs
and cargo transshipment hubs to support; to facilitate the objectives of National Transport
Master Plan (NTMP) and National Trade
Corridor (NTC); and to regulate standards of services of airports and airlines.
10.6.9.2 The aviation strategy under NTCIP includes:
New international airport in Islamabad, Sialkot (completed), and Gwadar, and
upgrading of Multan Airport;
Liberalization of air service agreements to attract more airlines;
Regionally competitive user charges and fuel prices;
Encouragement of private sector airlines to operate on international routes;
Adopting a unilateral Open Sky Policy for cargo operations; and
Establishing cargo villages in Karachi and cargo warehousing facilities in Lahore.
10.6.10.3 High user charges at domestic airports by the Civil Aviation Authority and little assistance
to facilitate airline operations discourages a wider use of Pakistan's airports by
international carriers. Landing rates for various types of aircraft at different airports in Pakistan
are much higher than other countries and will be reviewed. There is a huge potential for PPPs
in the construction of new airports as identified in the list of potential PPPs (Annex III). Efforts
are being made to restructure Pakistan International Airlines (PIA). With reference to the role
of the private sector, opportunities exist with airports, where airport management can be easily
concessioned to private operators. The Sialkot
airport is an example.
10.7 Housing and Assets Titles
10.7.1 Housing is a basic requirement as it provides social security to the poor as well as is a
source of economic growth. Housing construction also generates direct employment
including: (i) absorbing rural labour and providing opportunity for seasonal employment for farm
workers, (ii) enhancing participation of women workers, and (iii) activating small scale and
mostly self-employed industries including building/construction materials, equipment,
fittings and fixtures etc. Affordable housing for low-income groups also
contributes to poverty alleviation, income redistribution and promotes individual
productivity and household savings. With the rising demand for housing units, the housing
and construction sector is becoming an investor's haven.
243
Poverty Reduction Strategy Paper-II Chapter 10 - Pillar VII: Removing Infrastructure Bottlenecks through Public Private Partnerships
(PPPs)
10.7.2 The housing sector contributes hugely to inter-sectoral linkages and provides a strong
growth stimulus throughout the economy. Construction industry, as a prime source of
employment generation offering job opportunities to millions of unskilled, semi-skilled and skilled
work force, can create a big dent in poverty. It provides employment to 7.14 million people, which
constitutes 15 percent of the total employed labour force. The large
employment potential in construction and housing industry provides a rationale for the
government to establish it as one of the key policy sectors in its Poverty Reduction
Strategy.
10.7.3 Current Scenario and Issues:
There are multiple housing-related issues in the country, mainly generated by population explosion which grew from 84.3 million in 1981 to 130.6 million in 1998, showing an overall increase of 55 percent. It is estimated at 163.8 million in 2008 with
a growth rate of 2.69 per cent per annum (Population Census 1998 extrapolated for
2008).
According to the 1998 census (extrapolated for 2008), the total number of housing
units, throughout the country, is 19.3 million, of which 67.5 percent are in rural areas
and 32.5 percent in urban. The157
overall housing stock comprised 39 percent kachha156 houses, 40 percent semi-pakka houses, and 21 percent pakka houses. The housing backlog,
as estimated according to 1998 census (extrapolated for 2008), is 7.90 million units. The annual
additional requirement is estimated around 850,000 housing units,
whereas the annual production is estimated around 350,000 housing units resulting in a recurring
backlog of 500,000 housing units annually. Available data indicate a
household size of 6.8 persons and occupancy per room of 3.13 persons.
There continues to be unchecked growth of squatter settlements. It is estimated that 50
percent of urban population now lives in katchi abadis/slums/squatter settlements. This
in itself is a challenge of great magnitude for replacement, rehabilitation and upgrading.
Land suitable for housing is becoming scarce, particularly in and around urban centres.
Land values continue to increase, resulting in virtual non-availability of affordable land
especially for low income groups.
The housing stock is also rapidly aging and present estimate suggest that more than 50
percent are over 50 years old and rapidly deteriorating due to general neglect.
Shortage of finance continues to be the major constraint in housing production,
maintenance and growth.
As a result of inflationary trends in the economy; the cost of building material has sky
rocketed.
There continues to be a lack of adaptation of innovative technology and materials and
lack of support to the research carried out in this field.
156 157
Mud houses. Concrete houses.
244
Poverty Reduction Strategy Paper-II Chapter 10 - Pillar VII: Removing Infrastructure Bottlenecks through Public Private Partnerships
(PPPs)
10.7.4 Housing Policy
10.7.4.1 The National Housing Policy (2001) aims to accelerate housing activity by facilitating
provision of housing inputs including land, finance, building materials, institutional and legal
framework, and regularization of katchi abadis (squatter settlement). One of the
cornerstones of the Policy is to ensure development of housing for the poor and needy and
housing for the majority of rural population. The strategy under this policy aspires:
To provide an enabling environment, capacity-building and institutional development
aiming at empowering all stakeholders, particularly local authorities, the private sector, non-
governmental organizations and community-based organizations, to play an effective
role in shelter and human settlements planning and management;
To combine community participation and institutional strengthening in support of the
development of a commercially based system of housing finance for land and house
purchase; house construction improvement and upgrading. In addition, innovative
approaches to collateral and screening of eligible households for incremental housing
finance and home improvement credits, which are compatible with the affordability limits
of moderate and low income households, will be introduced;
To improve housing conditions of the low-income population, through development
capacity building and institution of new ideas, such as reduced housing standards,
appropriate technology, incremental housing development, community participation and
squatter-settlement regulations;
To upgrade existing towns and cities with better city planning through improvement of
infrastructure, creation of employment opportunities and affordable housing under a phased
programme, giving higher attention to those cities and towns which are comparatively
more productive and efficient and require lower investments;
To provide for an effective institutional capacity building framework responsive to the
grassroots devolved powers, to minimize general disparities and imbalances, not only
between urban and rural areas but also between various income groups;
Long term solution for housing lies in this sector, which should be a high priority for
economic development. It should not be considered as an area parasitic upon other
economic activities but as an instrument of economic and cultural development. This sector
can lend support in achieving all the key national goals including employment, economic
growth, promotion of market oriented economy and higher levels of public and private
savings; and
To make the government a catalyst and facilitator in case of land policy, financial policy,
improvement of katchi abadis and slums, research and development and institutional
development.
10.7.4.2 To follow the above strategy, key steps of the Housing Policy focus on:
245
Poverty Reduction Strategy Paper-II Chapter 10 - Pillar VII: Removing Infrastructure Bottlenecks through Public Private Partnerships
(PPPs)
Housing development through capacity building of formal and informal sector;
Facilitating the availability of suitably located and affordable land and developing land
delivery processes;
Encouraging indigenous approaches in research and development to support housing
activity particularly for low income groups;
Provision of safeguards against malpractices, inefficiencies, institutional weaknesses
and mafia assaults;
Resource mobilization through Government initiatives, mortgage loans, refinance
facility, savings and loan schemes, induction of insurance, pension and provident funds
and introduction of microfinance schemes
Provision of incentives through tax rationalization, reduction in property tax and
registration, simplification of procedure and enforcement of effective foreclosure Laws;
Supporting research and development for economic building material inputs and
support modernization of construction technologies; and
Developing indigenous and cost effective approaches particularly for low income
groups;
Monitoring and enabling the development of katchi abadis initiatives as announced in
January 2001and discouraging formation of new slums;
Provision of institutional incentives for improved housing delivery for the rural areas
and preparation of Rural Housing Plans and schemes;
Introducing a firm and clear-cut institutional and legal framework at all levels of
Government with well-defined roles and responsibilities. Removal of shortcomings,
gaps and overlaps and devising institutional coordination mechanism, transparency and
accountability;
A countywide programme of developing small and medium-sized towns that offers the
potential for growth; and
Formulating a system to monitor and evaluate implementation of guidelines provided
under the Housing Policy and to ensure coordination with other national level
development strategies.
10.7.5 Prime Minister's Housing Programme
10.7.5.1 Realizing the importance of the housing sector as a means of generating massive
employment opportunities and its multilateral effect on business and economy, the
Government has laid great emphasis on boosting the Housing & Real Estate sector in the country.
The government has a priority agenda to provide quality livable housing for the low income groups
that had been ignored in the past. It has announced the construction of one million housing units to
meet the housing backlog and recurring housing shortfall. Five
marla schemes have been initiated for homeless citizens in rural areas and scheme for
provision of apartment and plot of 80 sq yds for homeless peoples in urban areas has been
246
Poverty Reduction Strategy Paper-II Chapter 10 - Pillar VII: Removing Infrastructure Bottlenecks through Public Private Partnerships
(PPPs)
introduced. The distribution of the housing units for the Prime Minister's Housing
Programme will be as follows.
Table 10.8: Distribution of housing units under the Prime Minister's Housing Programme: 2008 and beyond
Short Term Target (2008-09) Long Term Targets (5 years)
Construction of 1000 housing 5,000 units Punjab 440,000 units units in the federal capital & each Sindh 300,000 units provincial capital NWFP 150,000 units
Balochistan AJ&K/Northern Areas Islamabad Total
Source: Ministry of Housing & Works, Government of Pakistan, October, 2008.
10.7.6 Strategy
40,000 units
40,000 units
25,000 units 1,000,000 units
10.7.6.1 In order to achieve these objectives, the Ministry of Housing and Works has adopted the
following course of action:
Creation of land bank;
Availability of concessional housing finance;
Provision of trunk utility land physical infrastructure;
Selection of consultants for designing and construction management; and
Pre-qualification of contractors to undertake the construction activities.
10.7.6.2 In addition to establishing a line of action, it is emphasized that the government role is of a facilitator, regulator and advocate; the construction of housing units will be through PPPs,
joint ventures, BOTs, turnkey operators, etc. The immediate action plan envisaged is as
follows:
Multi-storied apartments in major cities where state lands are available or make joint
venture with private sector where feasible;
Row houses/incremental housing in urban/sub-urban areas, intermediate town and rural
area where state land is available;
Re-development of prime urban land where public buildings are dilapidated or slums
have been created; and
Creation of land bank and housing development fund.
10.7.6.3 Creating a land bank alone will not guarantee a sustainable low cost housing but, at the
same time, land is the basic component to provide housing and should be treated as an ongoing
process for a sustainable housing development either in the commercial or low cost housing areas.
Creation of a land bank is a preferable option widely accepted all over
247
Poverty Reduction Strategy Paper-II Chapter 10 - Pillar VII: Removing Infrastructure Bottlenecks through Public Private Partnerships
(PPPs)
the world as it provides a forum to the foreign entrepreneurs and local developers to have
clear unencumbered lands available presenting no obstacles in housing development. Land banks curb
the speculation of land prices. The basic concept is 'procurement of land by the
government for future corridors of growth.'
10.7.6.4 Some of the initiatives undertaken in this regard include identification of state land in the
Federal capital and all the provinces for subsequent development and auctioning of contract
for construction of 976 housing units in Islamabad, etc.
10.7.7
10.7.8
10.7.9
The Government has also taken the initiative to facilitate housing for low income groups at
the provincial level. A cell namely, People's Housing Cell (PHC) has been established in Sindh.
The Sindh Government has announced a mega programme to provide shelter to the
poor. In its first year, PHC has set a target of providing 100,000 housing units for the poor.
In urban areas, low cost housing units will be constructed in the form of high-rise
complexes along with all amenities including educational and health facilities. The cities of
Karachi, Hyderabad, Badin, Thatta, Nawabshah, Sukkur, Larkana, Khairpur have been
selected for the purpose in its first phase. Suitable locations for this objective have already been
selected by People's Housing Cell. Residential-cum-commercial plazas will be built
on prime land in Karachi and other cities vacated by slum dwellers.
In rural areas, a Village Housing Scheme has been formulated under which one-room and
two-room houses will be built for the poorest households in all Union Councils of Sindh
province. Clusters of low cost houses will be constructed in sanctioned villages for the
homeless people in selected villages.
10.7.10 The Government of Sindh wants to apply innovative PPP approach. According to this, land
developers and builders from the private sector have been invited to invest in developing
townships and satellite towns on land which will be provided by the government on
specifically laid down conditions.
10.7.11 Housing Finance
10.7.11.1 A Housing Finance Committee has been formed to examine the issues relating to housing
finance in depth and to suggest fiscal measures to be taken for affordable housing. The
committee will include representatives from MoHW, SBP and FBR.
10.7.11.2 An amount of Rs 1 billion has been allocated for the Prime Minister's Special Initiative for
the poor, and another Rs 1 billion under Prime Minister's special initiative for housing for
government servants though not directly linked with poverty reduction but having an
indirect link in terms of creation of jobs and production of materials to be used.
10.7.11.3 The plan does not make it compulsory that all of the one million housing unit will be
constructed by the federal government alone as to provide housing is a provincial subject
under the constitution of Pakistan. The programme, therefore, defines the role of the federal
248
Poverty Reduction Strategy Paper-II Chapter 10 - Pillar VII: Removing Infrastructure Bottlenecks through Public Private Partnerships
(PPPs)
government as a regulator, facilitator and advocate. Accordingly, the provincial
governments are being encouraged to undertake housing at their own and from their own resources
following the models presented in the form of pilot projects. Similarly, government
departments, banks, autonomous bodies, corporations and the private sector (also individuals) are
being encouraged to undertake housing which would eventually be accounted for to meet the
figure of one million housing units under the Prime Minister's
Housing Programme.
10.7.11.4 To illustrate, the housing units built and catered to the general public by developers like
DHA, Bahria Town, Creed Vistas etc. will become a part of the housing stock of the said
Housing Programme. Besides, multilateral financial institutions like World Bank, IFC etc. and
various multinational and national developers are committing resources towards development
of housing sector on BOT basis. In this respect, a number of MoUs have been signed by the Ministry
of Housing and Works through Pakistan Housing Authority (PHA) with companies from China,
Malaysia, Italy, USA, Iran including some local companies. In view of this, it is clear that the
programme's model of PPPs and self-generated cross- subsidy from projects of commercial
importance would provide sufficient finance for its
implementation.
10.7.12 State Bank of Pakistan (SBP) and Housing Finance
10.7.12.1 Given the potential of housing sector both for the economy and the banking sector, the SBP
is creating an environment for the banking system that will enhance the size and efficiency
of housing finance. In order to encourage banks/DFIs to undertake exposure to the housing and
construction sector, SBP has liberalized the credit regime for housing loans, the details
of which are as under:
10.7.12.2 Enhanced Credit Facilities
Banks' exposure to housing finance has been enhanced from 5 to 10 percent of their
net advances;
The maximum per party limit has been increased from Rs 5 million to Rs 10 million while
the maximum debt-equity for housing loans has been increased from 70:30 to
80:20;
Banks have been allowed to deduct up to 3 percent of the income arising out of
consumer loans for creation of reserve to off-set bad debts in this segment;
The maximum loan tenure for housing finance has been increased from 15 to 20
years;
Banks and DFIs are extending credit facilities for Balancing, Modernization and
Replacement (BMR) of machinery used for housing and construction industry; and
Property tax on rented property and for self occupancy has been rationalized.
10.7.12.3
Construction Services Sector
Income from property has been brought under Presumptive Tax Regime (PTR); tax at the rate of
5 percent of the gross rentals shall constitute full and final discharge of tax
liability;
249
Poverty Reduction Strategy Paper-II Chapter 10 - Pillar VII: Removing Infrastructure Bottlenecks through Public Private Partnerships
(PPPs)
Stamp duties and registration fees are being rationalized for housing mortgage;
Central Excise Duty (CED) on wires and cables has been withdrawn to lessen cost of
construction; and
Housing and construction companies charged via PTR, which shall not exceed 1
percent on yearly receipts.
10.7.12.4 Promote Home Ownership
No stamp duty/registration fee, etc shall be charged for the housing mortgage; and
Property tax on rented property shall be reduced from current rate of 25 percent to 5
percent.
10.7.13.4 Low Income, Low Cost
All new construction of houses on plots, measuring up to 150 sq yards and flats/apartments having an area of 1000 sq ft have been exempted from all types of
taxes for a period of 5 years
10.7.13 House Building Finance Corporation (HBFC) and Housing Finance
10.7.13.1 The House Building Finance Corporation (HBFC) being the prime housing finance
institution of the country provides financial assistance for construction and affordable housing
solutions to low and middle income groups of population by encouraging new construction in
small & medium housing. HBFC Ltd. has financed over one and half million units for Rs
41.4 billions, made recoveries of Rs 51.4 billions and has an investment portfolio of Rs
19.6 billion. HBFC's average annual disbursements and recoveries are around Rs 2.5 to 3
billion. The activities of the corporation will increase
during the PRSP-II period because of additional measures, such as:
The annual disbursement of HBFC loans has been enhanced from the present Rs 1.2
billion to Rs 7 billion over the next 5 years; and
HBFC has introduced bridge financing and bulk financing of housing projects through
escrow accounting together with appropriate safeguards.
10.7.15 Assets Titles
10.7.15.1 One of the most important issues connected with the housing sector relates to the titling of
assets, principally lands. The law and procedure can be complex and, at times, ambiguous, and the
government is working to simplify and clarify these matters. The government has
initiated several programmes/schemes at provincial level to clear the transfer of property
and computerize the records of all moveable and immoveable assets. These programmes
will facilitate the identification of land and provide protection to low income groups, so that
clear ownership may be defined. Some other important steps that will be taken during
the PRSP-II period are described below.
250
Poverty Reduction Strategy Paper-II Chapter 10 - Pillar VII: Removing Infrastructure Bottlenecks through Public Private Partnerships
(PPPs)
10.7.15.2 Land
10.7.15.3 Land is one of the principal inputs for housing. Its identification, allocation and servicing
are the three critical components of the housing supply process. But the land mass is under constant
pressure from competing uses, other than housing, both by the public and private
sectors. The situation is further aggravated by the unchecked growth of settlements,
spiralling land values, intricacies of land acquisition laws, as well as allotment and disposal
methods.
10.7.15.4 Given the key role of land in housing supply, it is essential that a comprehensive
perspective is developed for the land delivery system at national, provincial, regional and local
levels with effective coordination among various government departments,
development agencies and other bodies and above all the private sector.
10.7.15.5 Initiatives to strengthen property rights
10.7.15.6 A crucial issue for the sector is the confused state of ownership rights. The provincial
governments have all initiated significant programs to rectify this state of affairs and to
computerize the records of all moveable and immoveable assets. For example:
The Government of Sindh has initiated a scheme to improve the automation of stamps
and registration. As a first step, the scheme will cover 21 districts. A scheme
'Computerization and Establishment of Land Administration & Revenue Management
Information System (LARMIS)' has been introduced with an estimated cost of Rs 922 million
for maintaining computerized record of revenue assessment and collection system. Two
other projects 'Creation of GIS for Land Administration and Revenue Management in Sindh'
and 'Preservation of Land Revenue Record and Revamping of Survey Settlement Department,
Board of Revenue Sindh' is also appended with LARMIS. The estimated cost of projects is
Rs 648.86 million and Rs 363.709 million,
respectively.
The NWFP has established a Housing Authority with a mandate not only to provide
housing inputs (such as land, finance, building materials, etc), but also to develop
geographical information on land use and to create a database of the housing stock. For
simplification of computerized registration of land, registration offices have since been
established at Peshawar and D.I.Khan. This facility will further be extended to other big districts
of the province. The provincial government has also included a scheme 'Establishment of
Project management Unit (PMU) in housing Department' which will
cater for land use planning and frame regulations to facilitate incremental development
of housing facilities for low income groups in the province.
The Government of Balochistan has developed software that will help it create an
accurate database to be used in recording the ownership and transfer of property.
The Punjab's Land Records Management and Information Systems project is designed
to create secure, reliable, and efficient system of all records relating to land ownership
and transfer. The provincial government expects to complete the process of data entry
251
Poverty Reduction Strategy Paper-II Chapter 10 - Pillar VII: Removing Infrastructure Bottlenecks through Public Private Partnerships
(PPPs)
in the entire province by the end of FY 2009/10. Another component of the plan is to
provide online access to the financial institutions and banks in order to facilitate the process
of issuance of credits. A pilot project has been initiated for automation and
improvement of registration process.
10.7.16 Disaster Risk Management
10.7.16.1 Pakistan is vulnerable to disaster risks from a range of hazards including cyclones/storms,
droughts, earthquakes, floods, landslides, and tsunami. Human induced hazards that threaten
the country include: transport; industrial; oil spills; urban and forest fires; civil conflicts; and
internal displacements of communities due to multiple factors. This type of
situation affects a large number of people and the poor as well by leaving them homeless.
10.7.16.2 A reactive emergency response approach has remained the predominant way of dealing
with disasters in Pakistan. The Calamity Act of 1958 was mainly concerned with
organizing emergency response. A system of relief commission at provincial level was
established. An Emergency Relief Cell (ERC) in the Cabinet Secretariat was responsible for
organizing disaster response by the federal government. The loss of life and property and the
challenges that were faced in the aftermath of October 2005 earthquake affecting
Azad Jammu & Kashmir (AJK) and the NWFP province exhibited the need for establishing
appropriate policy and institutional arrangements to reduce losses from disasters in future.
Immediately after the earthquake of 8th October 2005, Cabinet was briefed regarding the earthquake
relief and it was, inter alia, decided to undertake revision of building codes and
regulations at the national level to ensure safety and security of the residents of buildings.
10.7.16.3 The need for strong institutional and policy arrangements has been fulfilled with the
promulgation of National Disaster Management Ordinance, 2006. Under the Ordinance the
National Disaster Management Commission (NDMC) has been established under the
Chairmanship of the Prime Minister as the highest policy making body in the field of
disaster management. As an executive arm of the NDMC, the National Disaster
Management Authority (NDMA) has been made operational to coordinate and monitor
implementation of National Policies and Strategies on disaster management.
10.7.16.4 The new system envisages a devolved and de-centralized mechanism for disaster
management. Accordingly, Provincial Disaster Management Commissions (PDMCs) and
Authorities (PDMAs) have been established while similar arrangements have been made in AJK
and Northern Areas. The District Disaster Management Authorities (DDMAs) have been
notified across the country. The DDMAs are going to be the linchpin of the whole
system and would play the role of the first line of defense in the event of a disaster.
10.7.16.5 The National Disaster risk Management Framework has been formulated to guide the work
of entire system in the area of disaster risk management. It has been developed through wide
consultation with stakeholders from local, provincial and national levels. The Framework
identifies National Strategies and Policies for disaster management. The details
252
Poverty Reduction Strategy Paper-II Chapter 10 - Pillar VII: Removing Infrastructure Bottlenecks through Public Private Partnerships
(PPPs)
of these plans/strategies has been discussed in pillar 2; 'Protecting the poor and
Vulnerable.'
10.7.17 Regularization of Katchi Abadis, Squatter Settlements & Slums
10.7.17.1 A special problem relates to katchi abadis. Nearly 50 percent of our population in major
urban centers lives in slums, katchi abadis and squatter settlements. The mushroom growth of slums
and katchi abadis in urban areas is the product of unprecedented population growth, rapid
urbanization, and large-scale influx of refugees. These factors have led to unauthorized
encroachments on urban spaces, especially state land, and have created a
number of health and security hazards.
10.7.17.2 In order to evolve an effective mechanism to control future growth of katchi
abadis/squatter settlements and also to alleviate the sufferings of the urban poor, the
government has distributed 65,496 acres of land among 4633 number of beneficiaries
during FY 2001-07. Katchi abadis, which are hazardous if located under high tension power
lines, or on lands needed for operational/security purposes, need to be relocated at
appropriate places. Formation of new katchi abadis has been restricted and discouraged by exercising
strict development controls in all urban areas. The government has regularized 1466 katchi abadis
in Punjab, Sindh and ICT during FY 2006/07. It plans to regularize 469
katchi abadis in Punjab and 439 in Sindh during the PRSP-II period.
10.7.17.3 The housing sector helps in providing social security to the poor and promotion of housing
sector not only increases the growth of the economy but also creates more skill and
unskilled employment opportunities which reduce poverty. It enhances the activities in the
construction industry alongwith 40 industries which are directly or indirectly linked to the
economy. It also contributes in attracting investment and also stimulates growth which
contributes to overall improvements in the economic situation of the country.
10.8 Infrastructure Planning and Environmental Sustainability
10.8.1 Pakistan is also the most urbanized country in South Asia, with an estimated 38 percent of
its population living in cities. Rapid urbanization and the expansion of industry and
transport have led to a rapid decline in the quality of air in all major cities in Pakistan,
where levels of fine particulate matter (PM10) of up to 6-7 times WHO guidelines have been
measured. About 16.28 million Pakistanis (40 percent of total urban population) are under risk of
air pollution, which is costing Rs 25.7 billion every year on account of health merely by not
complying with the WHO Ambient Air Quality Standards.158 Urban air
pollution, of which mobile sources are the most significant, is estimated to cause around 22,700
premature deaths per year. The number of vehicles in Pakistan have increased
tenfold in the past twenty years, where the fastest growth has been in two-stroke delivery
vehicles and diesel trucks and buses. Vehicular emissions are particularly detrimental to
human health because pollutants are emitted at ground level. Pakistan's consumption of
petroleum products is growing at an annual rate of about 6 percent, almost half of which is
158
GoP, Planning Commission, 'MTDF 2005-2010' (May 2005).
253
Poverty Reduction Strategy Paper-II Chapter 10 - Pillar VII: Removing Infrastructure Bottlenecks through Public Private Partnerships
(PPPs)
consumed by the transport sector. The high content of sulphur in diesel (0.5-1 percent) and
furnace oil (1-3.5 percent) is a major contributor to air pollution. Industrial activities are
another important source of air pollution in urban areas, both from large-scale facilities (e.g.
cement, fertilizers, sugar, steel and power plants) and from small to medium scale industries using
waste fuels (e.g. brick kilns, steels works and plastic moulding). Industrial
emissions are further compounded by the widespread use of small diesel electric generators
in commercial and residential areas in response to the poor reliability of electricity.
Combustion of municipal waste is another significant contributor to air pollution. Almost 48,000
tonnes of solid waste are generated every day across the country, most of which is
either dumped in low-lying areas or burned. Open burning of waste is also the largest
source of dioxins and furans to the environment.
10.8.2 Pakistan Clean Air Programme
10.8.2.1 The Ministry of Environment is developing the Pakistan Clean Air Programme (PCAP) as
a vehicle to support a range of ongoing and proposed initiatives for the management of urban air
quality, involving a variety of sectors, levels of government and development
partners. Under the PCAP, the Pakistan159
nvironmental Protection Agency with grant E
assistance of the Government of Japan has set up seven continuous Air Quality
Monitoring Stations160 and three Mobile Air Quality Monitoring Stations to measure PM10 and
PM25 (Particular Matter). Presently these units are being run on trial basis. Data generated so
far has shown that PM10 and PM25 in urban centers have reached alarming
levels.
159
The Bank's support for the NEP is initially focused on providing technical assistance to M/o Environment for the development
of provincial action plans. The aim is to facilitate a process through which provincial authorities will establish their own priorities within the broad matrix of national environmental goals laid out in the NEP. For implementation of the PCAP, while JICA is funding monitoring equipment which will provide necessary data, there is limited capacity to plan and implement specific interventions. The Bank will initially provide technical assistance, with the possibility of subsequent investment support as plans become more concrete. 160 Two continuous Air Quality Monitoring Stations have been installed in Karachi, two in Lahore, and one each Islamabad, Peshawar and Quetta.
254
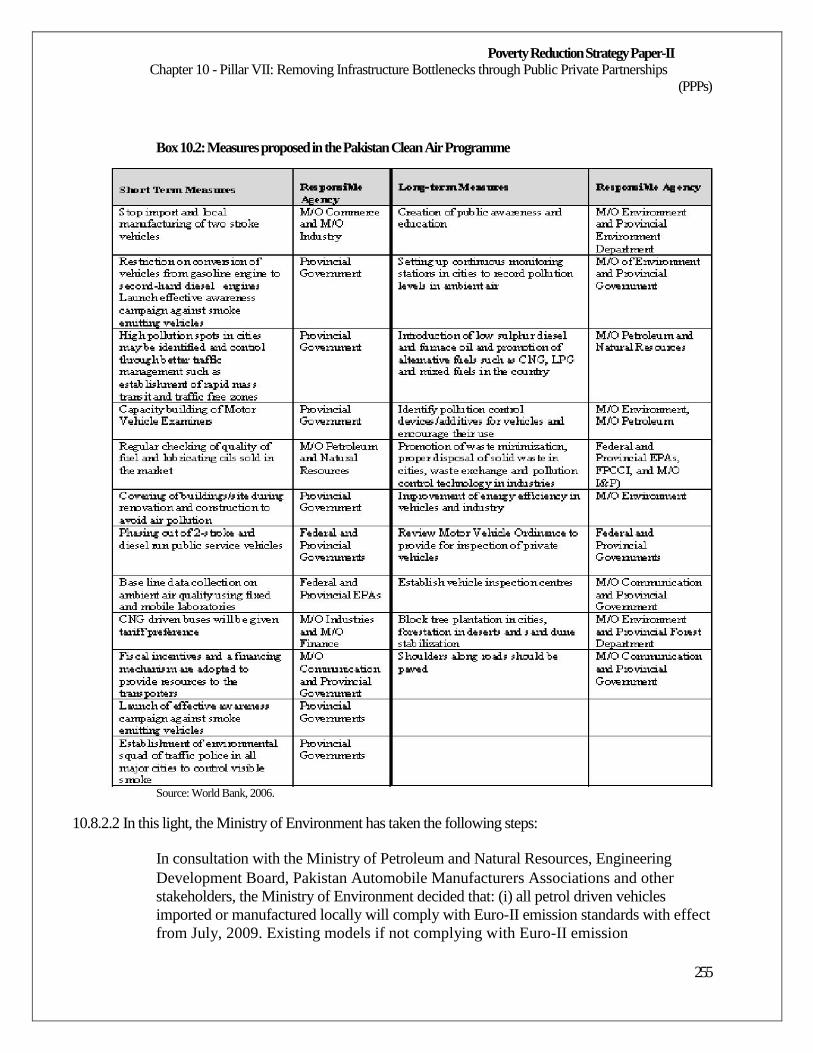
Poverty Reduction Strategy Paper-II Chapter 10 - Pillar VII: Removing Infrastructure Bottlenecks through Public Private Partnerships
(PPPs)
Box 10.2: Measures proposed in the Pakistan Clean Air Programme
Source: World Bank, 2006.
10.8.2.2 In this light, the Ministry of Environment has taken the following steps:
In consultation with the Ministry of Petroleum and Natural Resources, Engineering
Development Board, Pakistan Automobile Manufacturers Associations and other
stakeholders, the Ministry of Environment decided that: (i) all petrol driven vehicles
imported or manufactured locally will comply with Euro-II emission standards with effect
from July, 2009. Existing models if not complying with Euro-II emission
255
Poverty Reduction Strategy Paper-II Chapter 10 - Pillar VII: Removing Infrastructure Bottlenecks through Public Private Partnerships
(PPPs)
standards will have to switch over to Euro-II models by no later than three years if not
immediately; (ii) all diesel driven vehicles imported or manufactured locally will
comply with Euro-II emission standards with effect from July, 2012. The Ministry of
Petroleum and Natural Resources will ensure availability of Euro-II compliant diesel
(with sulphur contents 0.05 percent) with effect from January 2012.
In consultation with provincial governments, the Ministry of Environment has worked
out a model for vehicle examination/emission testing to be established in the country to follow a
uniform procedure for motor vehicle inspection for public and private
vehicles. The first pilot project in this regard has been approved at a cost of Rs 294 million.
It is expected that motor vehicle centers will be established with the help of
PPPs throughout the country.
10.8.3 In summary, a comprehensive and integrated infrastructure policy is being developed for
the PRSP-II period and beyond, which will include the establishment of a multi-modal
transport system; an emphasis on asset management with consolidation, upgrading,
rehabilitation and maintenance of the existing system particularly dams for water storage; enhanced
private sector participation in development and institutional capacity building, with research and
development; and use of modern technology and procedures to increase sector efficiency. The
strategy also takes into account the regional and domestic scenarios, particularly with respect to
rail, road and shipping sub-sectors, enhancing regional
connectivity to improve links to the Central Asian States, Iran, Afghanistan and India.
256
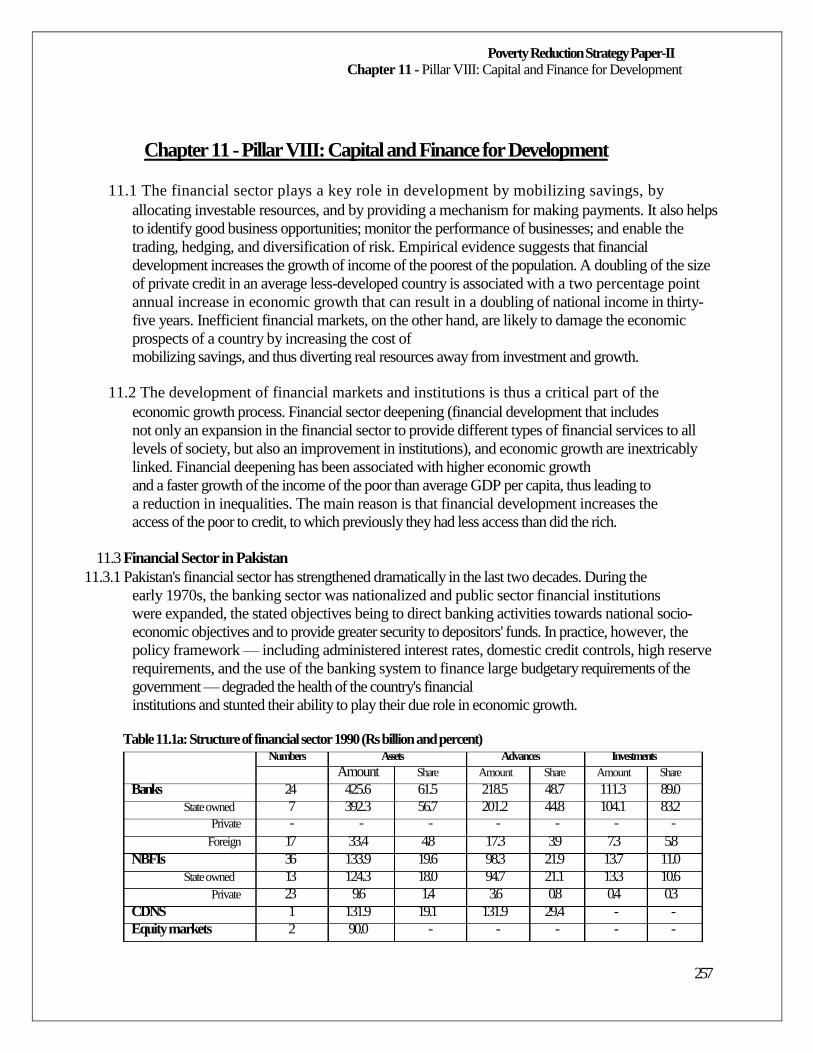
Poverty Reduction Strategy Paper-II Chapter 11 - Pillar VIII: Capital and Finance for Development
Chapter 11 - Pillar VIII: Capital and Finance for Development
11.1 The financial sector plays a key role in development by mobilizing savings, by
allocating investable resources, and by providing a mechanism for making payments. It also helps
to identify good business opportunities; monitor the performance of businesses; and enable the
trading, hedging, and diversification of risk. Empirical evidence suggests that financial
development increases the growth of income of the poorest of the population. A doubling of the size
of private credit in an average less-developed country is associated with a two percentage point
annual increase in economic growth that can result in a doubling of national income in thirty-
five years. Inefficient financial markets, on the other hand, are likely to damage the economic
prospects of a country by increasing the cost of
mobilizing savings, and thus diverting real resources away from investment and growth.
11.2 The development of financial markets and institutions is thus a critical part of the
economic growth process. Financial sector deepening (financial development that includes
not only an expansion in the financial sector to provide different types of financial services to all
levels of society, but also an improvement in institutions), and economic growth are inextricably
linked. Financial deepening has been associated with higher economic growth
and a faster growth of the income of the poor than average GDP per capita, thus leading to
a reduction in inequalities. The main reason is that financial development increases the
access of the poor to credit, to which previously they had less access than did the rich.
11.3 Financial Sector in Pakistan
11.3.1 Pakistan's financial sector has strengthened dramatically in the last two decades. During the
early 1970s, the banking sector was nationalized and public sector financial institutions
were expanded, the stated objectives being to direct banking activities towards national socio-
economic objectives and to provide greater security to depositors' funds. In practice, however, the
policy framework — including administered interest rates, domestic credit controls, high reserve
requirements, and the use of the banking system to finance large budgetary requirements of the
government — degraded the health of the country's financial
institutions and stunted their ability to play their due role in economic growth.
Table 11.1a: Structure of financial sector 1990 (Rs billion and percent) Numbers Assets Advances Investments
Amount Share Amount Share Amount Share Banks 24 425.6 61.5 218.5 48.7 111.3 89.0
State owned 7 392.3 56.7 201.2 44.8 104.1 83.2 Private - - - - - - -
Foreign 17 33.4 4.8 17.3 3.9 7.3 5.8 NBFIs 36 133.9 19.6 98.3 21.9 13.7 11.0
State owned 13 124.3 18.0 94.7 21.1 13.3 10.6 Private 23 9.6 1.4 3.6 0.8 0.4 0.3
CDNS 1 131.9 19.1 131.9 29.4 - -
Equity markets 2 90.0 - - - - -
257
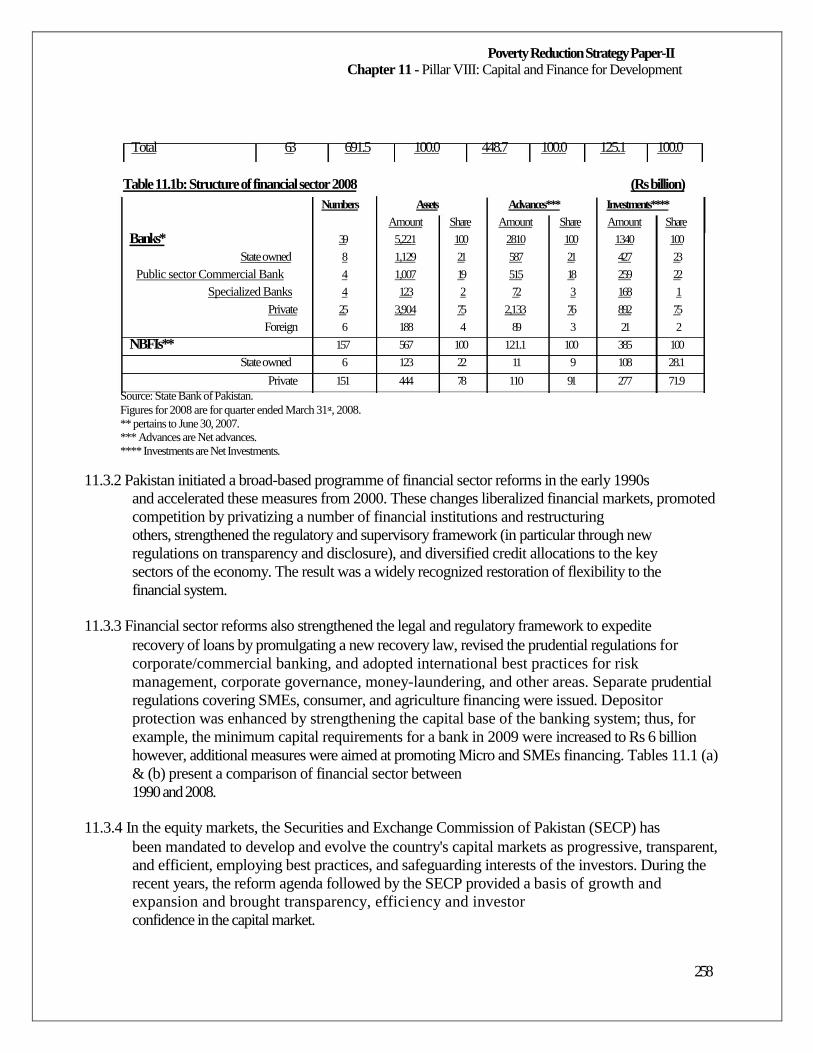
Poverty Reduction Strategy Paper-II Chapter 11 - Pillar VIII: Capital and Finance for Development
Total 63 691.5 100.0 448.7 100.0 125.1 100.0
Table 11.1b: Structure of financial sector 2008 (Rs billion)
Numbers Assets Advances*** Investments****
Amount Share Amount Share Amount Share Banks* 39 5,221 100 2810 100 1340 100
State owned 8 1,129 21 587 21 427 23
Public sector Commercial Bank 4 1,007 19 515 18 259 22 Specialized Banks 4 123 2 72 3 168 1
Private 25 3,904 75 2,133 76 892 75 Foreign 6 188 4 89 3 21 2
NBFIs** 157 567 100 121.1 100 385 100 State owned 6 123 22 11 9 108 28.1
Private 151 444 78 110 91 277 71.9 Source: State Bank of Pakistan.
Figures for 2008 are for quarter ended March 31st, 2008. ** pertains to June 30, 2007. *** Advances are Net advances. **** Investments are Net Investments.
11.3.2 Pakistan initiated a broad-based programme of financial sector reforms in the early 1990s
and accelerated these measures from 2000. These changes liberalized financial markets, promoted
competition by privatizing a number of financial institutions and restructuring
others, strengthened the regulatory and supervisory framework (in particular through new
regulations on transparency and disclosure), and diversified credit allocations to the key
sectors of the economy. The result was a widely recognized restoration of flexibility to the
financial system.
11.3.3 Financial sector reforms also strengthened the legal and regulatory framework to expedite
recovery of loans by promulgating a new recovery law, revised the prudential regulations for
corporate/commercial banking, and adopted international best practices for risk
management, corporate governance, money-laundering, and other areas. Separate prudential
regulations covering SMEs, consumer, and agriculture financing were issued. Depositor
protection was enhanced by strengthening the capital base of the banking system; thus, for
example, the minimum capital requirements for a bank in 2009 were increased to Rs 6 billion
however, additional measures were aimed at promoting Micro and SMEs financing. Tables 11.1 (a)
& (b) present a comparison of financial sector between
1990 and 2008.
11.3.4 In the equity markets, the Securities and Exchange Commission of Pakistan (SECP) has
been mandated to develop and evolve the country's capital markets as progressive, transparent,
and efficient, employing best practices, and safeguarding interests of the investors. During the
recent years, the reform agenda followed by the SECP provided a basis of growth and
expansion and brought transparency, efficiency and investor
confidence in the capital market.
258
Poverty Reduction Strategy Paper-II Chapter 11 - Pillar VIII: Capital and Finance for Development
11.3.5 The SECP proactively undertook market reform initiatives, implemented sustainable risk
management measures, and introduced various new products. The Commission's various initiatives
and reform programmes contributed towards a high level of integrity and
transparency in terms of price discovery, trade settlement and risk management. The
introduction of various new products has provided impetus for the development of a buoyant
and broad-based capital market in the country. A detailed analysis of Pakistan's
financial sector is presented below.
11.4 Banking
11.4.1 The banking sector of Pakistan is regarded as one of the fastest growing and best
performing sectors in the region. Banking assets rose three-fold over the last 5 years and the
industry size is close to Rs 4 trillion. The increasing trend contrast sharply with the
declines in the ratio during the second half of the 1990s. Moreover, supported by
privatization and consolidation, a substantial proportion of the assets of the banking sector
has shifted from public to private hands (in 2007 almost 80 percent of banking assets were
in the private sector), and asset concentration within the banking sector has also declined in
favour of the private sector.
11.4.2 Banking reforms led to major improvements in the profitability and financial strength of
the sector. Return on banking assets before taxes rose to 2.6 percent in 2006 (1.8 percent
after tax) compared with 0.2 percent in 2000, and the return on equity increased to 25.4
percent in the year 2006. The banking industry's profitability is at an all-time high, credit is fairly
diversified and bank-wide systemic risks are well contained. The accesses to banking services have
been broadened to a much wider customer base particularly the middle and lower middle income
groups. No country can aspire for sustainable and equitable growth in
the absence of a strong and healthy middle class. In Pakistan, the banking system was
intermediating the savings of millions of depositors primarily to fund the fiscal deficit and the
losses of the public sector, to meet the working capital of 200 top named companies
and to engage in letters of credit for business and international trade. The number of active
borrowers was limited to less than half a million at best. By allowing the banking system to offer
new products and services such as agriculture credit, SME financing, mortgage loans, automobile
leasing, personal loans etc. a new vista has opened up. Commercial banks that were always hesitant
to channel credit to agriculture sector are now the single largest source of agriculture
financing. This broadening of access not only eases the credit constraint faced by a dynamic
segment of the population and transfers purchasing power in
their hands but also diversifies the risk for the banks and allows them to earn a decent return on
their loan products. This enhanced purchasing power in the hands of a large
number of families stimulates aggregate demand in the economy, helps in the expansion of
production of manufactured goods and contributes to higher growth of the economy.
11.4.3 The banking sector's profitability was supported by the sustained growth of the economy
from 2002. It has been estimated that a one percent rise in the real GDP growth tends to
improve the profitability by 113 basis points. In addition, low interest rates and inflation for most of
the period in the last four years also supported the financial sector's profitability, as
259
Poverty Reduction Strategy Paper-II Chapter 11 - Pillar VIII: Capital and Finance for Development
a one percentage point increase in real interest rates or in inflation each tend to reduce the
return on assets by 27 basis points. The move of Pakistan's economy to a higher growth
trajectory with lower real interest rates and inflation thus further bolstered the profitability
of the financial system. Indeed, in 2006, a World Bank study ranked Pakistan's banking
sector second in performance and efficiency among the South Asian countries.
11.4.4 The banking system has also become stronger. The capital adequacy ratio of the banking
system in 2008 increased to 13.9 percent from 10.9 percent in 1999. The loan infection ratio (the
ratio of nonperforming loans to the total loan portfolio of a bank) dropped to 2.1
percent from the very high rate of 15.3 percent in 1999. A multi-track strategy is being
adopted to address the issue of stock of nonperforming loans, which includes the following:
The Corporate & Industrial Restructuring Corporation (CIRC) has been established to
take over the non-performing assets of the nationalized commercial banks (NCBs) and
Development Financial Institutions (DFIs) exceeding Rs. 30 million. It will ultimately
liquidate non-performing assets and loans by auctioning the underlying physical assets
to the highest bidder.
A committee has been formed to restructure those units which are non-operational due
to an unsustainable debt burden but are otherwise financially and economically viable.
By extending the maturity, grace period or partial remissions, the committee is
attempting, with the cooperation of the borrowers and lenders, to find solutions that can
result in resumption of debt servicing.
The SBP has issued guidelines under which long-standing loans in the loss category
with almost zero probability of recovery can be written off in a transparent manner to the extent
that there is a shortfall between the proceeds realized from sale of collaterals
and the amount outstanding on the books of the banks.
Those found willful defaulters are referred, after due process of law, to accountability
courts.
There is almost a consensus that enforcement of financial contracts cannot take place
unless the legal and judicial process is strengthened. The banking courts system needs
to be revamped and reoriented to facilitate loan recovery more expeditiously. Training of
judicial officers assigned as heads of banking courts was held by the State Bank and
infrastructure, logistic support to the banking court is being strengthened. These
measures will help in the disposal of the backlog of cases.
11.4.5 In terms of their core business activity, the banks are now operating at a significantly
higher capacity than in the 1990s; for example, the ratio of loans to deposits reached nearly
70 percent in 2008. Moreover, the strong performance of the financial sector attracted
increasing amounts of foreign direct investment in this sector — in FY 2008, foreign
investment in the financial sector of Pakistan remained US $322.8 million.
260
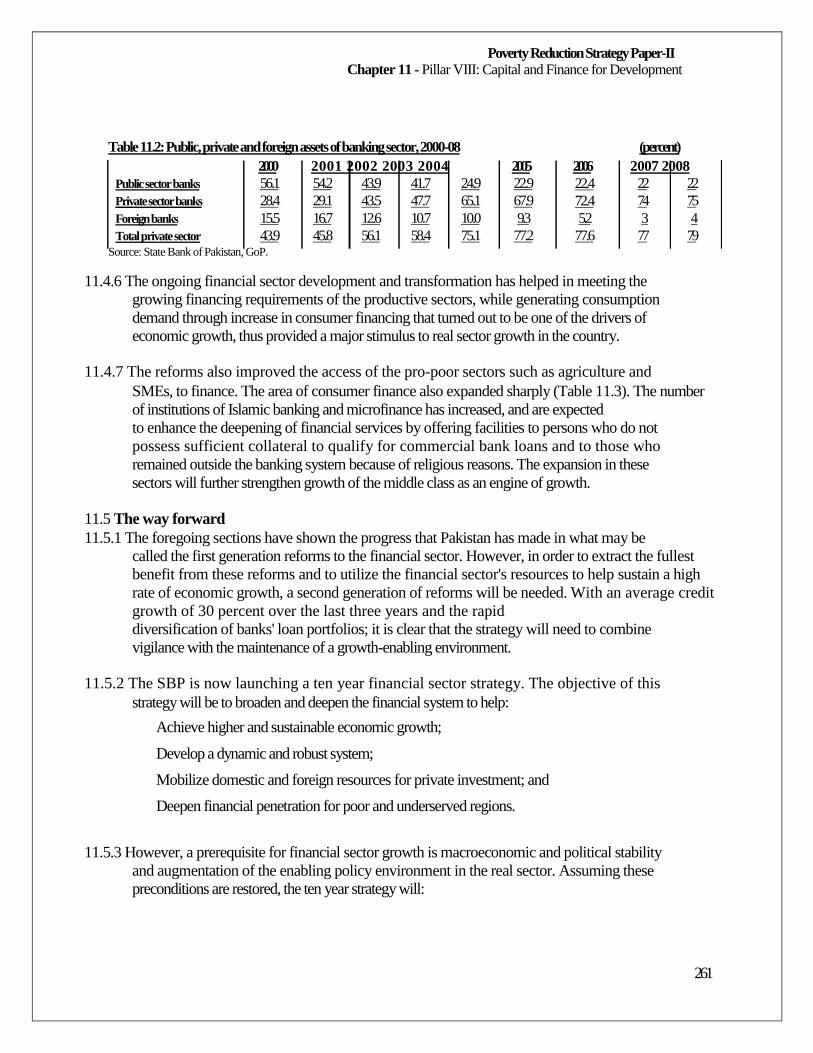
Poverty Reduction Strategy Paper-II Chapter 11 - Pillar VIII: Capital and Finance for Development
Table 11.2: Public, private and foreign assets of banking sector, 2000-08
2000 2001 2002 2003 2004 2005 Public sector banks 56.1 54.2 43.9 41.7 24.9 22.9 Private sector banks 28.4 29.1 43.5 47.7 65.1 67.9 Foreign banks 15.5 16.7 12.6 10.7 10.0 9.3 Total private sector 43.9 45.8 56.1 58.4 75.1 77.2
Source: State Bank of Pakistan, GoP.
2006 22.4 72.4 5.2
77.6
(percent)
2007 2008 22 22 74 75 3 4
77 79
11.4.6 The ongoing financial sector development and transformation has helped in meeting the
growing financing requirements of the productive sectors, while generating consumption
demand through increase in consumer financing that turned out to be one of the drivers of
economic growth, thus provided a major stimulus to real sector growth in the country.
11.4.7 The reforms also improved the access of the pro-poor sectors such as agriculture and
SMEs, to finance. The area of consumer finance also expanded sharply (Table 11.3). The number
of institutions of Islamic banking and microfinance has increased, and are expected
to enhance the deepening of financial services by offering facilities to persons who do not
possess sufficient collateral to qualify for commercial bank loans and to those who
remained outside the banking system because of religious reasons. The expansion in these
sectors will further strengthen growth of the middle class as an engine of growth.
11.5 The way forward
11.5.1 The foregoing sections have shown the progress that Pakistan has made in what may be
called the first generation reforms to the financial sector. However, in order to extract the fullest
benefit from these reforms and to utilize the financial sector's resources to help sustain a high
rate of economic growth, a second generation of reforms will be needed. With an average credit
growth of 30 percent over the last three years and the rapid
diversification of banks' loan portfolios; it is clear that the strategy will need to combine
vigilance with the maintenance of a growth-enabling environment.
11.5.2 The SBP is now launching a ten year financial sector strategy. The objective of this
strategy will be to broaden and deepen the financial system to help:
Achieve higher and sustainable economic growth;
Develop a dynamic and robust system;
Mobilize domestic and foreign resources for private investment; and
Deepen financial penetration for poor and underserved regions.
11.5.3 However, a prerequisite for financial sector growth is macroeconomic and political stability
and augmentation of the enabling policy environment in the real sector. Assuming these
preconditions are restored, the ten year strategy will:
261
Poverty Reduction Strategy Paper-II Chapter 11 - Pillar VIII: Capital and Finance for Development
Stimulate growth in financial assets to 165 percent of GDP, growth in deposit base by
13 percent to reach US $217 billion, and advances to allow private sector credit/GDP
ratio to rise from 27 to 42 percent;
Support small savers and meet the requirements of small borrowers in agriculture,
housing, small and medium enterprises (SME) and microfinance sectors by raising the
financial penetration ratio through enabling policy environment and outreach expansion
(coverage per bank branch to improve from 19,000 to 15,000 persons);
Develop financial infrastructure and automation to enhance the coverage of automated
teller machines (ATMs) to 10,000; and
Reduce the systemic risks of the financial system by developing an adequate safety net
for the small depositors and the central bank's lender of last resort functions as well as
a framework for dealing with failing banks.
11.5.4 To achieve these goals, the SBP is putting together a comprehensive reform programme.
The SBP has developed and has full ownership of this reform agenda and received technical
assistance from the International Monetary Fund, the Asian Development Bank and the DFID of
United Kingdom to draw from international experience and expertise. The section below further
outlines the major areas of thrust of the second generation banking
sector reforms.
11.6 Financial Inclusion Programme (FIP): In Pakistan the level of financial exclusion is
quite steep: only 17 percent of the population (30 million) has bank accounts and less than 4 percent
(5.5 million) are borrowers. Moreover only 25 percent of the total bank deposits and 17 percent of
the total borrowers are from rural areas. In value terms their shares are even smaller, 10 percent
and 7 percent of the total value of deposits and advances, respectively. Limited access to
services is captured by the low level of branch penetration, especially in rural areas and this has
held back the growth of savings and impacted credit distribution system. To address issues of
access, the SBP has established a Development Finance Group which has developed a
comprehensive Financial Inclusion Programme
(FIP) with assistance of the UK Department of International Development (DFID) grant
amounting to GBP 50 million that aims to promote access to development finance for all
small and underserved markets. In Pakistan context there is need to encourage shift in
banks' focus away from large companies to smaller companies and the household sector.
11.6.1 While keeping its focus on supporting sustainable and inclusive growth, FIP will mostly
benefit the poor, small entrepreneurs, women and marginalized communities. It is
estimated that the FIP interventions will expand the number of microfinance clients from
existing 1 million to 3 million by the year 2010 and to 5 million by the end of the
programme span of 10 years.
11.6.2 Major Elements of Financial Inclusion Programme: Keeping in mind the international
experience of financial sector development and the state of Pakistan's financial sector, FIP
262
Poverty Reduction Strategy Paper-II Chapter 11 - Pillar VIII: Capital and Finance for Development
focuses on market based sustainable financial services to the poor and the lower end of the
market. Key outputs of the programme are listed below:
Well targeted Financial Inclusion Policy (FIP): The FIP will help SBP and the
government of Pakistan to develop evidence-based, coherent and well targeted financial
inclusion policy in conformity with Pakistan's PRSP and sustainable growth strategies.
In addition to the policy development, this component will strengthen SBP's capacity
on regulation, corporate governance, procurement, development finance and
programme implementation. The FIP is a policy programme which will encourage
microfinance institutions and banks to focus on expanding outreach of financial
services to women.
Credit enhancement: In order to reach the FIP targets, it is estimated that the
microfinance providers will require timely and predictable availability of funds in next three
years. FIP interventions will therefore facilitate partnerships between commercial banks and
microfinance institutions. The liquidity situation in the financial sector will be a key factor for
launching Credit Enhancement Facility. In order to cover this risk, the SBP is about to launch
the microfinance credit Guarantee facility for microfinance
institutions.
Sector transformation and institutional strengthening: The FIP aims to transform
the microfinance sector from its reliance on state subsidies to market based, sustainable
and inclusive financial services. The FIP will support institutional Strengthening fund that
will invest in strengthening systems and human resources capacity of the financial sector
intermediaries for efficient and cost effective delivery of financial services to the
poor.
Innovation and delivery mechanisms: The FIP will support a Financial Innovation
Fund to address the supply side issues of financial innovation. Main focus of the
Innovation Fund will be to support technology based affordable financial services and to
encourage innovative schemes to reach out to marginalized groups in rural areas. The proposed
fund will be managed by private sector professionals with adequate fund
management and development expertise.
Small enterprises and rural financing: The continued low levels of financing to small
enterprises and rural population pose several challenges to sustainable growth in Pakistan.
The FIP proposes to build on the existing work in these areas done by Small and Medium
Enterprises Authority and SBP. The FIP will support in-depth analysis of different
approaches to enhance market based solutions to improve financing to small enterprises and
rural areas. In addition to evaluating effectiveness of credit guarantees, FIP will look at
innovative options of venture capital financing and possibilities of replication of credit
union models in Pakistan. Remittances play a significant role in
poverty reduction in Pakistan, and have the potential to do substantially more.
Financial literacy: Financial literacy and communication is a key part of the
programme to create awareness about access to financial services, consumer rights and productive
use of finances. The communication strategy will ensure regular dialogue
263
Poverty Reduction Strategy Paper-II Chapter 11 - Pillar VIII: Capital and Finance for Development
among the key stakeholders with particular emphasis on policy dialogue between the
financial sector policy makers and the private sector both at local and regional levels.
11.6.3 Strategy regarding phasing out of government ownership of assets in the financial sector: The recent divestiture of state-owned commercial banks has substantially changed the structure of the banking sector in Pakistan and nearly 80 percent of sector assets are now controlled by private banks. The overall banking sector has now become considerably more competitive and responsive. Thus continuous restructuring has reduced the burden on
the government and has left few minor areas to concentrate.
11.6.3.1 With the successful implementation of the privatization strategy for the state owned
institution, currently the Government of Pakistan holds a 19.49 percent share in the United
Bank Limited, 75.20 percent in the National Bank of Pakistan, 12.04 percent in the Allied
Bank and 40.55 percent in the Habib Bank Limited.
11.6.3.2 For the future, the SBP recommends that the government continue divesting its remaining
stake from the commercial banks. However, the same may be done at times when the
international and national markets become stable or be moving towards stabilization, in
order to fetch a better price.
11.6.5 Strategy to resolve insolvent state banks: Till now the basic strategy adopted by SBP to
resolve insolvent state banks has been privatization. Currently, Industrial Development Bank of
Pakistan (IDBP) is the only insolvent state owned bank and SBP is working for the
resolution of IDBP.
11.6.6 Corporate Governance Reforms: The need for improved corporate governance in
Pakistan is unmistakable. Good corporate governance is essential in establishing an
attractive investment climate characterized by competitive companies and efficient financial
markets. It is imperative that Pakistan's banking sector develops and implements
good governance practices, in order to provide impetus to economic growth. In the realm of
a rapidly globalizing world — characterized by liberalization of markets, relatively freer trade,
sophistication of financial products and instruments, and growing awareness among consumers —
Pakistan is ripe with lucrative opportunities for foreign and local investors
alike.
11.6.6.1 While considerable progress has been achieved in enhancing corporate governance of
banks, the SBP is working towards filling in the remaining gaps. In this regard, foremost is
the need to develop a suitable cadre of professional directors who are knowledgeable of
banks' affairs as well as independent of their management and majority shareholders. Allied to
this is the need to clarify and strengthen directors' fiduciary duties to act in the interests of the bank
and all of its stakeholders. It is also essential for banks to provide sufficient time and information
to directors to prepare for Board meetings, structure Board meetings so as to allow ample time for
discussion and establish appropriate criteria for
264
Poverty Reduction Strategy Paper-II Chapter 11 - Pillar VIII: Capital and Finance for Development
assessing and improving performance of directors, including independent directors. To
raise awareness on these and related aspects, the SBP is working towards issuing
comprehensive corporate governance guidelines for banks.
11.6.6.2 Pakistan's corporate and financial sectors present corporate governance issues peculiar to
complex ownership and group structures. By conducting operations through a complex
network of subsidiaries, controlling shareholders often acquire control of operations and/or
cash flows disproportionate to their equity stake in individual companies. The key issues
that arise as a result include: (i) inequitable treatment of stakeholders; (ii) dominance of controlling
shareholder-directors over Board proceedings; (iii) lack of independence of the
Board from the management; and (iv) channelling of bank resources to the benefit of group
concerns.
11.6.6.3 In order to address such corporate governance issues, the SBP is stepping up towards
introduction of consolidated supervision, whereby it will not be monitoring banks as a
standalone entity but rather as part of the entire banking group. This will help to evaluate the
strength of the entire group and to mitigate risks arising from group companies. A significant
component of consolidated supervision will be review of group structures and
detailed examination of related party transactions.
11.6.6.4 The SBP has recently launched a survey of banks to assess their corporate governance
practices. The survey will help to identify areas for reform in the regulatory framework as
well as its implementation by banks. The survey results will be a key input in further
improving the corporate governance framework for banks.
11.6.7 Major focus on development finance to serve the underserved markets: The key
objective of the strategy for financial sector deepening is to improve access to funding by priority
sectors in the economy; to provide advisory services to small borrowers; and to substantially
enlarge banking services in rural areas. The government has been active in
developing the prudential regulatory framework for the SME and microfinance sectors.
However, even though these sectors have somewhat easier access to credit, there are still
outstanding issues of inequitable distribution of credit to the sectors and segments that
remain underserved. The key issues for the sectors are the improvement of delivery and
outreach of banking services to far-flung areas, and the resolution of problems related to
collateral.
11.6.7.1 The strategy to increase outreach will enable Microfinance Institutions to tailor their
products to meet the needs of their customers as they move along the prosperity continuum. To support
this programme, the SBP has encouraged commercialization of microfinance industry so that it is
financially and socially sustainable. Some of the specific actions being
launched are:
Encouraging Microfinance Institutions (MFIs) to develop commercially viable
operations that are financially and socially sustainable operations and transform them
265
Poverty Reduction Strategy Paper-II Chapter 11 - Pillar VIII: Capital and Finance for Development
into microfinance banks (MFB) to provide holistic services. Tax holiday for five years
has been provided to MFIs once they transform themselves into full-fledged
microfinance banks (MFBs).
Creating partnership between commercial banks and MF providers and the post office
(PO) network and MF providers. (POs already manage over 4 million savings accounts,
mainly small accounts below Rs 10,000, through more than 12,000 branches.) There is
scope for the PO and MF providers to join forces with the latter acting as intermediaries for
funds from the PO, especially as many MF providers are constrained in their
operations by limited funding.
Developing a flexible regulatory regime for MFBs to allow innovation and organic
growth without compromising prudential objectives. Limits for MFBs (and MFIs) will be
adjusted at least in line with inflation and a two-tier regime is to be considered under which
MFBs (and MFIs) with track record of prudent governance, risk management and financial
success could be given more room to operate. This includes capital adequacy
requirements, which will be reviewed so as not to put MFBs (and MFIs) in a
competitive position substantially worse than that of banks.
Providing mobile phone-based banking services which is a cost effective way of
bringing financial services even to the most remote areas of the country. This is an option
with enormous potential as there already are almost two times as many mobile
phone owners (some 80 million) as there are depositors. Mobile phone services reach
almost every part of the country and would be an extremely cheap way for banks and
other financial institutions to extend their reach.
11.6.7.2 In order to improve the access of financial services to these sectors, the State Bank is
setting up a Development Finance Division dedicated to serve as an interface with the industry
and improve access of credit to districts and provinces. The SBP has also been
instrumental in the amendment of the legal framework for microfinance.
Box 11.1 : Microfinance Institutions Microfinance Ordinance (2001) defines a Microfinance Institution (MFI) as a company that accepts deposits from the public for the purpose of providing microfinance services. MFIs in Pakistan include Microfinance Banks (MFBs) regulated by the State Bank of Pakistan, in addition to some NGOs, RSPs and CFIs as detailed below: Non-government Organizations (NGOs): These include NGOs operating as microfinance institutions as well as those running
microfinance operations as part of their multi-dimensional Development programme. Specifically, Kashf, Sind Agricultural and
Forestry Workers Coordination Organization (SAFWCO), Akhuwat, Orangi Pilot Project (OPP), and Asasah are
operating as MFIs. Development Action for Mobilization and Emancipation (DAMEN), Taraqee Foundation and Sungi are
proving microfinance services as a part of their overall integrated development services. Rural Support Programmes (RSPs): These programmes are running microfinance operations as part of their multi-dimensional rural development programme. Commercial Financial Institutions (CFIs): These are financial institutions in the mainstream financial sector, providing
microfinance services as a separate function within the broader organizational context. Two such CFIs are Orix Leasing and The Bank of Khyber. MFIs will develop gender sensitive financial products and will reach out to poor women.
266
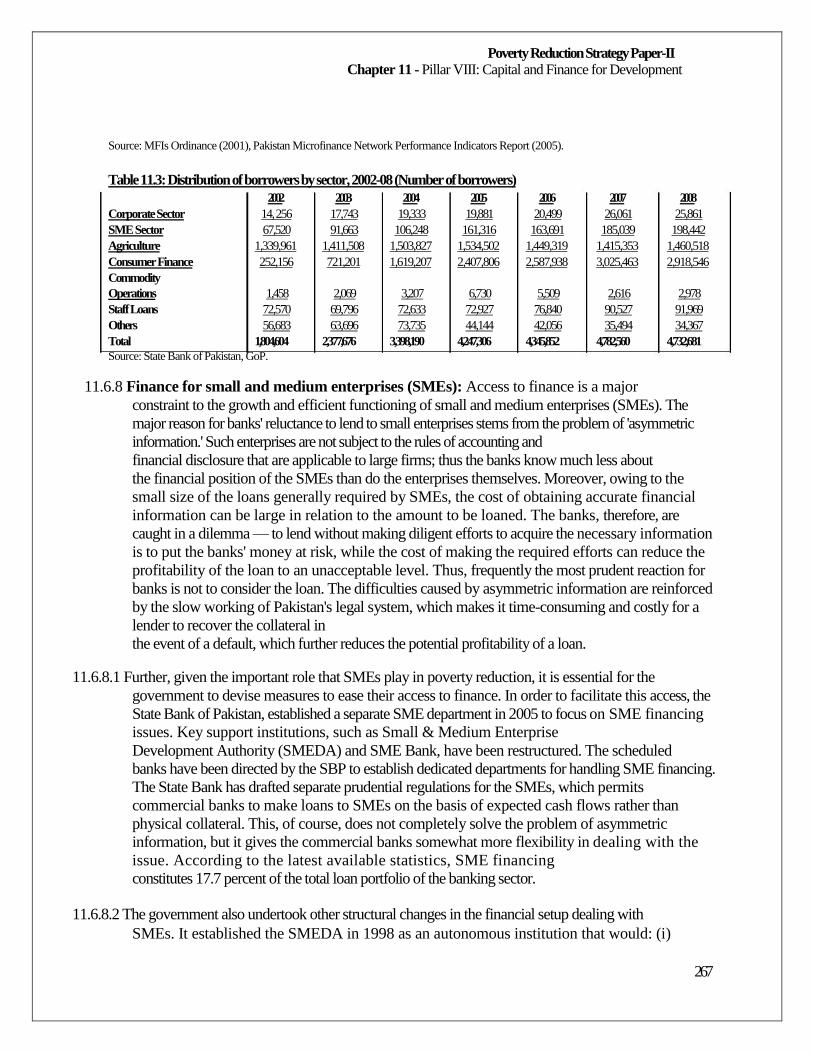
Poverty Reduction Strategy Paper-II Chapter 11 - Pillar VIII: Capital and Finance for Development
Source: MFIs Ordinance (2001), Pakistan Microfinance Network Performance Indicators Report (2005).
Table 11.3: Distribution of borrowers by sector, 2002-08 (Number of borrowers)
2002 2003 2004 2005 2006 2007 2008 Corporate Sector 14, 256 17,743 19,333 19,881 20,499 26,061 25,861 SME Sector 67,520 91,663 106,248 161,316 163,691 185,039 198,442 Agriculture 1,339,961 1,411,508 1,503,827 1,534,502 1,449,319 1,415,353 1,460,518 Consumer Finance 252,156 721,201 1,619,207 2,407,806 2,587,938 3,025,463 2,918,546 Commodity Operations 1,458 2,069 3,207 6,730 5,509 2,616 2,978 Staff Loans 72,570 69,796 72,633 72,927 76,840 90,527 91,969 Others 56,683 63,696 73,735 44,144 42,056 35,494 34,367 Total 1,804,604 2,377,676 3,398,190 4,247,306 4,345,852 4,782,560 4,732,681
Source: State Bank of Pakistan, GoP.
11.6.8 Finance for small and medium enterprises (SMEs): Access to finance is a major
constraint to the growth and efficient functioning of small and medium enterprises (SMEs). The
major reason for banks' reluctance to lend to small enterprises stems from the problem of 'asymmetric
information.' Such enterprises are not subject to the rules of accounting and
financial disclosure that are applicable to large firms; thus the banks know much less about
the financial position of the SMEs than do the enterprises themselves. Moreover, owing to the
small size of the loans generally required by SMEs, the cost of obtaining accurate financial
information can be large in relation to the amount to be loaned. The banks, therefore, are
caught in a dilemma — to lend without making diligent efforts to acquire the necessary information
is to put the banks' money at risk, while the cost of making the required efforts can reduce the
profitability of the loan to an unacceptable level. Thus, frequently the most prudent reaction for
banks is not to consider the loan. The difficulties caused by asymmetric information are reinforced
by the slow working of Pakistan's legal system, which makes it time-consuming and costly for a
lender to recover the collateral in
the event of a default, which further reduces the potential profitability of a loan.
11.6.8.1 Further, given the important role that SMEs play in poverty reduction, it is essential for the
government to devise measures to ease their access to finance. In order to facilitate this access, the
State Bank of Pakistan, established a separate SME department in 2005 to focus on SME financing
issues. Key support institutions, such as Small & Medium Enterprise
Development Authority (SMEDA) and SME Bank, have been restructured. The scheduled
banks have been directed by the SBP to establish dedicated departments for handling SME financing.
The State Bank has drafted separate prudential regulations for the SMEs, which permits
commercial banks to make loans to SMEs on the basis of expected cash flows rather than
physical collateral. This, of course, does not completely solve the problem of asymmetric
information, but it gives the commercial banks somewhat more flexibility in dealing with the
issue. According to the latest available statistics, SME financing
constitutes 17.7 percent of the total loan portfolio of the banking sector.
11.6.8.2 The government also undertook other structural changes in the financial setup dealing with
SMEs. It established the SMEDA in 1998 as an autonomous institution that would: (i)
267
Poverty Reduction Strategy Paper-II Chapter 11 - Pillar VIII: Capital and Finance for Development
expedite changes in the policy and regulatory environment, increasing the share of
manufacturing small enterprises from 5.5 to 7 percent, while decreasing the threshold and density
of regulations thereby reducing the cost of doing business and facilitate government-SME
interface; (ii) encourage the development of clusters through sector studies, strategic advice,
and the creation of Common Facility Centres (CFCs); and (iii)
facilitate investment and the acquiring of that technology, and improve practices related to
training, finance, marketing, and those that would enhance productivity and
competitiveness. The following are some of the initiatives that have been taken for growth
of SME finance:
Separate prudential regulations have been issued for the SMEs, which allow
banks/DFIs lending to SMEs on the basis of asset conversion cycle/cash flow basis with a
clean lending limit of Rs 3 million. This facility would allow the banks to be
more innovative and develop different SME specific products to increase the outreach.
Banks are encouraged to adopt a downscaling approach in SME finance. For this, under
the Asian Development Bank (ADB) Technical Assistance, a report on 'SME Finance via
Downscaling Approach' for banks in Pakistan has been prepared. Introduction and
implementation of 'Downscaling approach' in collaboration with multilateral
institutions, namely, ADB, World Bank and DFID is designed to provide existing
commercial banks with the technical know-how they need in order to be able to disburse
loans to very small and small and medium enterprises. During FY 2005/06 a
German firm provided assistance to SME Bank and Bank Alfalah, while more banks will
be provided technical assistance to implement downscaling approach on similar lines. This
approach includes building whole spectrum of lending infrastructure within a bank ranging
from establishment of SME lending units, IT, product development and
training of staff.
On the advice of the SBP, banks have established dedicated SME branches. These
branches are collaborating with SMEDA and provide all the necessary information
relating to finance along with guidance on how to become bankable.
The State Bank has developed a number of different credit schemes that will devote
special attention to financing needs of the SME sector.
The State Bank, in collaboration with ADB, commissioned a feasibility study to
strengthen secured transaction regime which will help develop a system that makes it
efficacious for financial institutions to accept movable property as collateral. This was
particularly important for improving SMEs' access to credit as they are more likely to be able to
post movable property as collateral. A robust and secured transaction regime will help improve
the enforcement of repossession and sale of movable property. The
objective of this reform is to design methods that could shift a bulk of repossessing and
selling of collaterals away from courts.
268
Poverty Reduction Strategy Paper-II Chapter 11 - Pillar VIII: Capital and Finance for Development
11.6.9 The way forward
11.6.9.1 A major reason for the SMEs' very limited access to credit is that lenders have virtually no
information to assess the creditworthiness of the potential borrower. The government considers
that if accurate information about the financial status of SMEs were more widely
available, financial institutions would be more willing to lend. The SBP is, therefore,
planning to set up a Credit Information Bureau with the private sector that would collect
data on the credit history of SMEs. This information should go far to improve the capacity
of the commercial banks to appraise credit risks in the SME sector.
11.6.9.2
The SME sector faces a host of both demand and supply side constraints impeding
delivery. In line with international best practice, the SBP plans to promote SME financing
through supportive mechanisms. This would involve help in designing specific products,
and developing credit scoring system for SME finance and SME financial reporting
system. In addition, banks are being encouraged to facilitate program based lending - in which
banks establish general criteria for meeting the specific financing requirements of
businesses - and cash flow based rather than collateral based lending. Work is under way to
develop an appropriate credit enhancement mechanism which will facilitate bank
lending to the sector. Also, the SBP is exploring with industry possibility of development of
venture capital funds focusing on SME promotion and offering training to commercial
bankers on SME lending methodology and approaches.
11.7 Islamic banking
11.7.5 The main aim of this initiative is to promote Islamic banking in Pakistan as a parallel
banking system, comparable to and compatible with the conventional banking system and Shariah
requirements. Growing at 10-15 percent per annum in the last decade, today the Islamic financial
industry comprises a range of financial institutions, including banks, non-
bank finance companies, venture capital firms, insurance companies, mutual funds etc., with
dedicated regulatory, academic and legal institutions providing the necessary
infrastructural support for their development. The Islamic financial industry in Pakistan has grown
substantially since the launch of the SBP's focused strategy to promote a parallel Islamic Banking
system in 2003. This performance is commendable for such a short period, given that other
countries have achieved a similar growth in their respective Islamic
banking industries after several years of existence.
11.7.5.1
A separate Islamic Banking Department was established in the SBP in September 2003. By
2007, six licensed Islamic banks and 12 conventional banks with more than 330 branches were
operating compared with one bank with 10 branches in 2003. Islamic banking services are
now available in 50 cities in all four provinces. Total assets of Islath banking
mic institutions (IBIs) grew from Rs 13 billion in 2003 to over Rs 225 billion at 30 June 2008. Based
on assets, and the market share of IBIs in banking industry has grown from 0.5 percent in 2003
to 4.2 percent at 30th June, 2008. Pakistan can increasingly share the advantages of international
best practices in adopting Islamic Finance and capture a large share of the market because of Shariah
compliance. The SBP has adopted a comprehensive
269
Poverty Reduction Strategy Paper-II Chapter 11 - Pillar VIII: Capital and Finance for Development
agenda to achieve this objective and has drawn transparent guidelines. Some of these
specific measures include:
Islamic Financial Services Board Standard: The Islamic Financial Services Board
(IFSB) serves as an international-standards setting body of regulatory and supervisory agencies
that is working to ensure the soundness and stability of Islamic financial services industry.
IFSB promotes the development of prudent and transparent Islamic financial services
industry by introducing new, or adapting existing international standards consistent with
Islamic Shariah principles, with recommendations for their adoption. Being a full member of
IFSB, the SBP is responsible to support and adopt the
different standards approved by IFSB.
Human Resource Development: For catering to the developmental needs of potential
and existing workforce in Islamic banking, the SBP has launched an Islamic Banking
Certification Course at the National Institute of Banking & Finance. The course is
aimed at building capacity of bankers to deliver Islamic banking products and services.
Cooperation at International level: In order to enhance investment opportunities and
strengthen linkages with global Islamic financial markets, the SBP became a permanent member
of International Islamic Financial Market (IIFM) and participated in its Board
of Directors meetings, working groups etc.
Liquidity Management: A Task Force has been formed to map out a plan for the
introduction of short and medium term liquidity management products based on
innovative Islamic structures. It has also prepared a structure for short term Shariah-
compliant government instrument which has been sent for government approval.
Accounting and Taxation Issues: For development of accounting standards for
Islamic modes of financing, a Committee was constituted at Institute of Chartered
Accountants Pakistan (ICAP). This Committee is reviewing the accounting standards
prepared by Accounting and Auditing Organization for Islamic Financial Institutions,
Bahrain (AAOIFI) with a view to adapting them to Pakistani circumstances and if
considered necessary to propose new accounting standards. There have been some
major taxation issues faced by the industry due to its nature of asset backed/trade based modes of
financing. The SBP, along with other relevant bodies took-up the issues with
FBR for resolution of tax problems.
11.7.5.2
Although Islamic banking has been expanding, it is still relatively insignificant compared
with conventional banking. It has the potential to be an important segment of the financial industry
with the potential of mobilizing savings from the numbers of people who are reluctant to
engage with conventional commercial banks because of religious reasons. If
Islamic Financial Institutions are to compete with other national and international
institutions, there is a particular need to enhance their capitalization and efficiency, and to
ensure that they are at par with international best practices.
270
Poverty Reduction Strategy Paper-II Chapter 11 - Pillar VIII: Capital and Finance for Development
11.7.6 Further consolidation and restructuring of the banking sector: Further consolidation is
necessary to ensure presence of stronger and well capitalized banks that can support diverse
financial services and client requirements, while adequately managing risks. There are several
reasons to consolidate banks through mergers or acquisitions. One reason is the need for a large capital
base. A large capital base which serves as a buffer to absorb losses and, therefore, provides the
institution with credibility and its customers with confidence in the institutions. A second motive
for consolidation is customer growth as with increasing
economic development, customers are likely to undertake larger transactions; thus banks
will thus be required to provide greater financial commitments so as to stay in the race. As
part of this strategy, the SBP has approved, in principle, five mergers:
Standard Chartered Bank (SCB) has acquired Union Bank which had earlier acquired
Bank of America and Emirates International Bank. Following this, SCB will emerge as
a local subsidiary;
Merger of Rupali Bank's Pakistan operations with and into Habib Rupali Bank;
Merger of Atlas Investment Bank with and into Atlas Bank Limited after its acquisition
of Dawood Bank Ltd;
Merger of Habib Bank AG Zurich's Pakistan operations with and into Metropolitan
Bank; and
Merger of PICIC and PICIC Commercial Bank.
11.7.7 Strengthening competition and efficiency: To enhance competitiveness, the SBP will primarily focus on continuing to further broaden and deepen the financial system. Efforts are under
way to: (i) review the actual behaviour and conduct of banks related to structure of banking industry
and takes the required actions; (ii) encourage contestability by allowing entry; and (iii) promote
development of NBF intermediation to improve bank competition.
The SBP has also sought to remove structural distortions that have impeded competition.
11.7.8 Development of Core Financial Infrastructure: A number of initiatives are under
implementation or to be launched to improve the efficiency of the financial system. These
include:
Retail payment system: On 1st of July, 2008 the SBP launched the Pakistan Real
Time Gross Settlement (RTGS) system for wholesale transactions. In addition, work has
started for modernization of the retail payments and settlement system which will encourage
electronic and mobile phone based transactions, while taking due consideration of
privacy and security matters and the development of an appropriate
legal framework.
Credit Information Bureau: The SBP's electronic Credit Information Bureau (eCIB)
has already helped credit risk management in all financial institutions. With up-to-date
(almost real-time) data and coverage of almost 5 million consumer and commercial
271
Poverty Reduction Strategy Paper-II Chapter 11 - Pillar VIII: Capital and Finance for Development
borrowers, it provides financial institutions, both large and small, an invaluable risk
management tool. The SBP will further develop operational software for borrower
analysis and credit scoring which will help in credit analysis of banks.
Credit rating agencies: Corporate ratings are needed for the standardized approach of
Basel II implementation as well as for the development of a private debt securities market
and for listing of companies on the stock exchange. There are two rating agencies who
have rated a few companies, as there is little need and few incentives for
companies to subject themselves to external scrutiny. The incentive framework for the
services provided by private rating agencies needs to be analyzed with a view towards
identifying measures and incentives that will result in more company ratings which
would also help facilitate listings of private debt securities.
Land and property registries: Land and property titles are available in urban but not
in rural areas. Improved land titling systems in rural areas could be seen as a necessary
underpinning for an improved credit extension process by allowing collateralized
lending for the agriculture, SME and housing sectors. Security of title is essential. The
SBP is exploring ways to facilitate pilot studies and efforts to develop off the shelf systems
and make it affordable for local and provincial governments to introduce new
registries and systems over the medium term.
The judicial system: An efficient financial system requires legal certainty and
enforceability of contracts. The present court system needs to be further equipped to
deal with financial transactions and disputes. This would require a long term
programme to train judges in commercial and financial law and perhaps to establish
more specialized courts to deal with financial matters.
11.7.9 Further strengthening of supervisory regime: The main focus of the strategy is the
further refinement of regulations and the supervision framework and involves the following
strategic thrusts:
11.7.9.1
Consumer protection infrastructure: In the coming years, the financial sector will
increasingly be deregulated so as to increase competition. The challenge is to ensure that this
deregulation does not disrupt the level or reliability of service to consumers. The government's
strategy in this area includes policy recommendations to guarantee consumer
protection in an increasingly market-oriented financial system. The SBP on its part is
focusing on effective compliance with customer service regulations and following it up with
proper enforcement to motivate banks to render good service and deal fairly with
customers. To supplement and reinforce this, the SBP plans to:
Introduce a Consumer Protection Bill, in line with international best practices, which
would among others provide guidance on issues of transparency, confidentiality,
availability of statements, account servicing, protection against fraud, unfair contracts and
lending practices, methods of debt collection, arbitrary penalties, etc. An
appropriate dispute settlement mechanism will be established;
272
Poverty Reduction Strategy Paper-II Chapter 11 - Pillar VIII: Capital and Finance for Development
Encourage Pakistan Banks' Association (PBA) to adopt a Banking Code to commit
banks to fairness, disclosure and ethical standards;
Strengthen the newly established Consumer Protection Department of the SBP to
monitor compliance with such new laws, regulations and codes;
Transform and strengthen the role and functions of Banking Ombudsman, which
will remain an independent body from the regulators, to be better aligned with the
above developments; and
A long-term campaign to enhance financial literacy will be launched in rural and urban
areas both by commercial banks and the SBP with the support of the IBP, NIBAF and
PBA.
11.7.9.2 Depositor protection scheme: Since private banks, which form the bulk of the financial
system, are outside the Banks' (Nationalization) Act, 1974, the SBP is developing a blue
print for a limited deposit protection scheme (DPS) to protect small depositors.
11.7.10 Strengthening risk management: Pakistan has instituted an all-embracing framework
viz. the Institutional Risk Assessment Framework (IRAF) to further strengthen the
supervisory mechanism and for mitigation of the variety of risks. The framework envisages
a collaborative supervisory focus amongst different supervisory departments within the SBP to
ensure cohesive monitoring of risks within banks and Development Finance
Institutions. The framework is highly technology driven — integrating off-site surveillance,
onsite examination, and current market information — and provides for the timely flow of
information, thereby enabling the SBP to supervise financial institutions more effectively.
11.7.10.1 Further, considering the importance of a forward looking approach to risk management,
the SBP has instituted and is strengthening a framework of stress-testing. The framework is based on
single factor sensitivity and regression-based analysis. Using this framework, the exposure of all
banks towards five major risks — interest rate risk; credit risk; real estate price risk; equity price
risk; and exchange rate risk — will be assessed, after subjecting the underlying risk factors to
unusual, but plausible, shocks. These exercises help considerably
to assess overall risk exposures as well as structural vulnerabilities in banks.
11.7.10.2 The SBP is taking action to ensure that these methods of risk management are internalized
and used in a consistent manner in the financial institutions. To this end, the SBP has issued
guidelines on stress testing. These guidelines contain a framework for regular stress testing, the
technique and scope of stress testing, along with methodologies and calibration
of shocks.
11.7.11 Consolidation of supervision: Recognizing the need to evolve an appropriate oversight
policy mechanism for its evolving financial structure, the SBP, as part of its overall
financial sector reforms launched in July 2008, has advocated the need for legislature to
empower the central bank to augment its oversight of the financial sector. The significant
273
Poverty Reduction Strategy Paper-II Chapter 11 - Pillar VIII: Capital and Finance for Development
challenges posed by universal banking, large financial groups and holding company
structures now warrant a matching legal framework to avoid any major disruptions in the economy
and in the process of financial intermediation. Recognizing these challenges, SBP
has sought in principle approval from the requisite forums for amendments in the Banking
Companies Ordinance (BCO) to enable it to supervise banks, groups and financial holding
companies in line with international trends. The legislative reforms in this area have
recently been approved, in principle, by the Cabinet and are to be tabled for consideration
of the Parliament.
11.7.11.1 Besides forestalling various risks, these amendments would enable significant benefits in
the form of operational efficiency, lower costs, reduced prices and innovation in products
and services. Moreover, one of the Core Principles for effective banking supervision (CP- 24)
issued by the Basel Committee on Banking Supervision requires that a banking supervisor
should be able to supervise the banking groups on a consolidated basis. Presently, Pakistan
is either compliant or largely compliant with all the core principles except those dealing with
consolidated supervision. The proposed amendments in the BCO
would also enable Pakistan to ensure compliance with this principle.
11.7.12 Basel II implementation: The SBP has initiated the implementation of the new Basel II
minimum capital adequacy requirements. Banks have made major advances in
implementation of the new framework though many face challenges in areas like integrated risk
management policy, collateral management and the limited availability of credit
ratings for counterparts.
11.8 Non-banking sector
11.8.5 Capital markets
11.8.5.1 Pakistan's stock market has been one of the best performing markets in the region in recent
years. However, the situation has changed since the start of 2008. The global financial crisis,
unprecedented current account deficit, hyper inflation, reduction of foreign exchange
reserves, and depreciation of Pak Rupee against the US dollar coupled with political
uncertainty and a deteriorating law and order situation have hurt the stock market badly.
11.8.5.2
11.8.5.3
Prudent macroeconomic management, supported by healthy macroeconomic indicators and
broad-based reforms, is critical for the revitalization of capital market and flow of foreign
investment. Sustainable economic policies will build long term interest of the capital markets
providing impetus to the investment climate and engendering investor confidence, thus paving the
way for a healthy and dynamic capital market that is fair, efficient and
transparent for all stakeholders.
The SECP is an autonomous statutory body that is entrusted with the integrated
administration and regulation of, inter alia, the capital markets, corporate sector and
financial (non-banking) sectors in Pakistan. Their regulatory ambit extends to the Insurance sector,
NBFIs and to the significant components of capital markets such as Stock Exchanges,
Commodity exchange, CDC and NCCPL, besides the vast and growing
274
Poverty Reduction Strategy Paper-II Chapter 11 - Pillar VIII: Capital and Finance for Development
corporate sector. The policy making for each of these areas also falls under preview that
entails not only the revision of existing laws and regulations to bring them in line with best practices
but also the promulgation of new laws, etc. The mandate entrusted upon the Commission has
made it a catalyst to evolve the capital markets of the country as progressive, transparent
and efficient, employing best practices and safeguarding the interests of the investors at large.
As the regulator of an emerging market the SECP's regulatory philosophy is based on the
principle of developmental regulation. The SECP, therefore, lays considerable emphasis on
market development while administering and
enforcing various corporate and securities laws.
11.8.5.4
The SECP has undertaken various capital market reforms to bring stability and protect the
investors. Some of these reforms include development of laws and regulations such as
amendments in Proprietary Trading Regulations, 2004; amendments in National Clearing
and Settlement System regulations; and development of new products, market
transparency, and governance regulations. Some of these measures include the following
regulations specifically for Risk Management and Corporate Governance along with the
development of new products/systems:
Conversion of Carry-Over Trade (COT) transactions into Continuous Funding System
(CFS) to improve liquidity in capital market;
Redefining of Net capital balance in line with international standards;
Introduction of Capital adequacy standards for brokers;
Strengthening of Margin deposits with pre-trade margin verification at the exchanges;
Defining of position limit for brokers in the ready, futures and CFS Market;
Elimination of Group accounts and prohibition of Brokers from trading via accounts of
other brokers;
Launching of Universal Identification Number (UIN) at pre trade level to strengthen the
disclosure regime to deter any wrongdoing; and
Implementation of T+3 settlement system replacing weekly settlement bringing the
market at par with various international jurisdictions and assisted in reducing the
overall settlement risk in the market. The reduction in settlement cycle is also beneficial
to the brokers as it provides them a relief in their capital adequacy and margining
requirements.
11.9.10 Corporate Governance Reforms
Independent management has been appointed at the stock exchanges to run daily
operations. The structure of boards of directors of stock exchanges has been changed through
nomination of non-member directors, one of whom must also be the chairman
of the board.
275
Poverty Reduction Strategy Paper-II Chapter 11 - Pillar VIII: Capital and Finance for Development
Pursuant to the introduction of the Code of Corporate Governance in March 2002, the
SECP has taken several measures to increase the level of transparency and disclosure in
corporate reporting. Several amendments were made to the Companies Ordinance,
1984 so as to make key provisions of the Code applicable to all companies including
public sector listed companies.
A significant development along the road to sustainable corporate governance reforms
is the establishment of the Pakistan Institute of Corporate Governance (PICG) that would
impart training and education, create awareness, undertake research, publish guidelines and
other resource material, and would be a forum for discussion on
corporate governance.
11.9.10.1
Development of New Products/Systems - Market Development
Free Float Index: KSE-30 Sensitive Index based on free float of scrips was put in
place with effect from September 1, 2006. There had been a need to introduce a free
float index that is representative of the market as the capitalization weighted KSE 100
Index was not representative because of over weightage of a few scrips.
Introduction of Cash Settled Futures Contracts Market: Cash settled futures
contracts were introduced at KSE on April 2, 2007 subsequent to promulgation of the
Regulations Governing Cash Settled Futures Contracts. Cash Settled Futures Market being a
derivatives market provides another avenue for source of financing for the
Capital Market, increasing the liquidity thereof.
Unified Trading System Platform: The introduction of a unified trading platform will
enable the exchanges to expand their trading activities and enter into a new era which envisages
increased trading volumes, better price discovery, and a better quality of
trade execution for the investors.
Introduction of Financial Institutions (FIs) Margining System: This system was
implemented by NCCPL in December 07, 2007 and the salient features thereof are as
follows:
Margins deposited by FI's directly with NCCPL;
Release of Margins of Brokers once margins deposited by corresponding FI's;
Default management by NCCPL in case of Non Broker Clearing Member; and
Risk Management of Non Broker Clearing Member at NCCPL.
Index Futures Contracts: The KSE has introduced Index Futures Contract on KSE 30
Index from March 2008. Index Futures Contracts Market is a derivatives market which
provides another avenue of source of financing for the Capital Market, increasing the
liquidity thereof.
Establishment of Islamic Index: The Commission had earlier proposed introduction
of an Islamic Index at the stock exchanges for the purpose of promoting listing of
Shariah-compliant companies on the Pakistani stock market and encouraging
276
Poverty Reduction Strategy Paper-II Chapter 11 - Pillar VIII: Capital and Finance for Development
international and local players to list and trade their Shariah-based shares/instruments
on an Islamic index. The Karachi Stock Exchange, in collaboration with Al-Meezan
Investment Management Ltd, has successfully launched the first co-branded Islamic index,
KSE-Meezan Index (KMI), comprising of 30 Shariah-compliant companies. A
soft launch of the index was carried out on July 1, 2008 and the KMI was formally
launched and became fully operational from the 1st of Ramadan161 this year i.e.
September 02, 2008.
11.9.10.2 The government has launched comprehensive second generation of capital market
reforms to facilitate the mobilization of financial resources for productive investment and
employment generation. The reform agenda aims at:
The development of institutional investors to facilitate long term capital formation
and increase the demand for securities;
Improving the efficiency of securities markets to increase the supply of corporate
securities and optimize the allocation of financial resources into productive
investment; and
Strengthening the governance of capital markets to improve market transparency
and protect investors.
11.9.10.3 The government plans to put special emphasis on strengthening the enabling
environment for pension funds and other non-bank financial institutions, given the strong
causal relationship between the level of development of institutional investors and the
deepening of capital markets. While limited supply of suitable assets, including corporate equity
and debt, clearly hampers the development of institutional investors,
the relative underdevelopment of contractual saving schemes offered by institutional
investors limits the demand for securities.
11.9.10.4 To restore investor confidence, the regulator is strengthening the governance of
exchanges by restructuring Boards and appointing independent management,
encouraging the demutualization of exchanges, while162
engthening risk management str
systems (including the introduction of T+3 settlement and circuit breaker limits163,
and raising the requirements on capital adequacy for brokers). Investor confidence will be
further enhanced as the Code of Corporate Governance has been incorporated into the listing
regulations of stock exchanges. There is enhanced vigilance to check undisclosed
trading and front running, and effective enforcement mechanisms are implemented.
Additional efforts to develop the market include the introduction of stock
futures, an over-the-counter market and online access for internet trading, and gradually
161 162
Islamic holy month of fasting. Investors must complete or "settle" their security transactions within three business days. T+3 means that when you buy a
security, your payment must be received by your brokerage firm no later than three business days after the trade is executed. 163 These are trading limits designed to cap maximum stock market price decline in a single day.
277
Poverty Reduction Strategy Paper-II Chapter 11 - Pillar VIII: Capital and Finance for Development
phasing out badla (a form of short-selling) with the Continuous Funding System (CFS)
and eventually margin financing to provide funding to leveraged investors.
11.9.11
11.9.12
Demutualization of the Stock Exchanges: Demutualization is the process of
converting a non-profit, mutually owned organization to a for-profit entity owned by the
shareholders. In the context of stock exchange the demutualization process involves not only
Corporatization, which is conversion of a stock exchange limited by guarantee into the one
limited by shares but also it segregates ownership and trading rights. Hence demutualization brings
balance among interest of different stakeholders in the corporate
and governance structure of a stock exchange. The SECP in consultation with the stock
exchanges developed the draft Stock Exchanges (Corporatization, Demutualization and
Integration) Rules, 2008, which are in the pipeline for approval.
Development of New Regulatory Laws: The following Rules/Regulations have been
drafted which would be notified after necessary review and due deliberation by the
Commission:
Balloters and Securities Registrars Rules;
Underwriter (Registration and Regulation) Rules;
Bankers to an Issue Regulations;
Debenture Trustee Regulations.
11.9.13 Draft Futures Trading ACT, 2008: Future Contracts are legally binding agreements
between two parties through a regulated future exchange. The SECP is currently
working on Futures Trading Act to provide for a comprehensive and independent legal
framework for the regulation of Futures contracts.
11.9.14 Non-bank financial institutions (NBFIs)
11.9.14.1 In Pakistan164
non-banking finance sector includes mutual funds, venture capital funds,
Modaraba, pension funds, Real Estate Investment Trusts (REITs) as well as
companies engaged in the business of leasing, investment banking, house financing and
investment advisory services. The concept of Non-Bank Finance Corporations (NBFC)
regime was introduced jointly by the SBP and the Commission through amendments in
the Company's Ordinance 1984, pursuant to which regulatory oversight over NBFCs
was transferred from the SBP to the Commission in 2002.
11.9.14.2 In order to bring efficiency to the financial sector and consolidate the fragmented
business of NBFIs, rules relating to NBFC were promulgated in 2003. These were
followed up by the introduction of the Universal NBFC concept in 2005 with the
objective to consolidate the non-bank financial services sector by allowing multiple
164
A special kind of Islamic partnership where one partner gives money to another for investing in a commercial enterprise.
278
Poverty Reduction Strategy Paper-II Chapter 11 - Pillar VIII: Capital and Finance for Development
business lines under one umbrella. Key statistics of NBFCs sector, as at June 30th, 2008
are as under:
Table 11.4: Key Statistics of NBFIs FY 2007/08
Sector
Mutual Funds Leasing Companies Investment banks Modarabas Venture Capital Housing Finance Total
Total Assets
339.718 65.920 58.017 29.703 3.760 0.149
497.267
Total Deposits
11.035 14.411 3.719
- 0.005
Source: Securities and Exchange Commission of Pakistan, Government of Pakistan, 2008.
11.9.14.3
Over the past few years, the mutual funds industry has been the star performers
amongst NBFIs. The emergence of the mutual funds in the financial sector will allow small
investors to take on diversified risks in the capital markets. In terms of assets size, mutual
funds constitute 68 percent of the entire NBFCs sector. During the last several years, mutual
funds have shown the highest growth in terms of numbers and
assets. The total number of mutual funds increased from 67 as of 30-06-2007 to 87 as of 30-06-
2008, while their net assets increased from Rs 295 billion to Rs 326.822
billion during the period, depicting a growth of 10 percent. Details of assets managed
under different categories of mutual funds are provided below:
Table 11.5: Assets Structure of Mutual Funds FY 2007/08
Sr. No.
Nature of Mutual Fund
Closed End Funds
Total Assets
Open End Funds
Total Assets
Grand Total
Total Assets
percent to
No. No. No. Total (Rs million) (Rs million) (Rs million) Assets
Asset Allocation 1 Funds 1 3,272.31 7 5,769.19 8 9,041.50 2.7 2 Balanced Funds 3 3,926.15 4 11,224.06 7 15,150.21 4.5 3 Capital Pro. Funds 3 1,426.79 4 5,048.48 7 6,475.27 1.9 4 Equity Funds 10 32,906.38 7 102,768.57 17 135,674.95 39.9 5 Fund of Funds 1 609.54 1 1,302.81 2 1,912.34 0.6 6 Income Funds - - 21 117,941.71 21 117,941.71 34.7 7 Index Funds - - 5 7,857.15 5 7,857.15 2.3 8 Islamic Funds 2 3,366.37 12 20,875.74 14 24,242.07 7.1 9 Money Market Funds - - 4 19,213.42 4 19,213.42 5.7 10 Sector Funds 2 2,209.56 - - 2 2,209.56 0.7
TOTAL 22 47,717.06 65 292,001.14 87 339,718.20 100
Source: Securities and Exchange Commission of Pakistan, Government of Pakistan, 2008.
11.9.14.4 Future plans for the sector include promulgation of the regulatory framework for real estate
investment trusts, promulgation of a regulatory framework for private equity and venture
capital funds, amendments to NBFC rules in the light of international best practices,
279
Poverty Reduction Strategy Paper-II Chapter 11 - Pillar VIII: Capital and Finance for Development
strengthening of on-site and off-site monitoring of entities along with computerized
quarterly analysis of information to assess the financial health of NBFIs. An independent
NBFC Law is also being processed to overcome the encumbrances of being a subordinate
to the Companies Ordinance.
11.9.15 Insurance
11.9.15.1 As of 30th June 2008,165
there were five life insurance companies, 51 non-life insurance
companies, one Takaful operator, and one reinsurance company operating in Pakistan.
Since 2000, various laws have been administered in order to reform insurance regulation. These
include the Insurance Ordinance 2000, SEC (Insurance) Rules 2002, Ministry of Commerce
Rules 2002 and Takaful Rules 2005. Other regulatory changes include the abolition of the
office of controller of insurance and conversion of Corporate Law Authority into SECP
within which a separate department was formed to look after the
affairs of the insurance industry.
11.9.15.2 The financial sector strategy includes reforms to the pension and insurance systems. As a
beginning, the government is encouraging the Voluntary Pension Schemes and allowing Asset
Management Companies and Life Insurance Companies, meeting the proper criteria, to be licensed
to act as Pension Fund Managers. Life insurance companies will be
authorized to offer Annuity Plans at the retirement age of participants. For insurance
businesses, stringent solvency standards have been introduced and minimum capital
requirements have been enhanced. Insurance companies have also been directed to obtain
reinsurance treaties from international 'A' class reinsurers.
11.9.15.3 Further reforms in the insurance sector will bring Postal Life Insurance under the ambit of
the Insurance Ordinance 2000; remove anomalies in the tax laws and change the
governance structure of public sector insurance companies. In order to ensure that the
insurance industry penetrates the rural areas and reaches the marginalized groups, steps
will be taken to make group insurance compulsory. Moreover, under the financial sector strategy,
a framework will be developed whereby all insurers will be required to write a
certain proportion of their business in rural areas as well as among the socially deprived by
introducing micro-insurance schemes.
11.9.16 Foreign investment
11.9.16.1 Reforms have transformed the financial sector into a privately-owned and a competitive
field making it one of the top three destinations for foreign investment inflows.166 The
sector has seen booming FDI inflows in Pakistan during recent years (FY 2002/03-FY
2006/07). These inflows were further strengthened by aggressive privatization programme and
saving glut available in the international market. As a consequence, FDI increased from below
US $1billion in FY 2002/03 to US $5.1 billion in FY2006/07. Importantly,
165
Islamic insurance. In principle, the Takaful system is based on mutual co-operation, responsibility, assurance, protection
and assistance between groups of participants. 166 FDI in the top three sectors for Juyl-March FY 2006/07: Telecommunications — US $1.35 billion, Financial Business — US $696.1 million, Oil & Gas Explorations — US $420.1 million.
280
Poverty Reduction Strategy Paper-II Chapter 11 - Pillar VIII: Capital and Finance for Development
Pakistan has been able to record close to US $5.2 billion FDI in FY 2007/08, despite
heightened political uncertainty and emerging economic imbalances during the period.
11.9.16.2 A significant change in the composition of FDI is also witnessed in the last five years. Oil
and gas producing sectors have traditionally dominated the preferences of foreign investors which
now stand diversified to telecommunication and financial sectors in the wake of liberalization
of the latter. The increased inflows in the telecommunication and financial
sectors not only benefited the consumers in the form of variety of products and low prices
but it also contributed significantly in the overall GDP growth through expansion of
services.
11.9.16.3 Many of the existing foreign banks have enhanced their stake and new foreign banks have
entered the domestic market for the first time, either through acquisitions or by establishing new
banks. Thus, for example, Standard Chartered Bank acquired Union bank, ABN Amro acquired
Prime bank, while Tamasek of Singapore established NIB bank. Several other
transactions are in the pipeline; all this activity reflects the profitability of the banking
sector in Pakistan.
11.9.16.4 In the last three years (FY 2004/05-2006/07) foreign flows in portfolio investment picked
up sharply in the wake of a combination of factors. On the one hand, liquidity comfort in
international market and political and economic stability at home enabled Pakistan to raise funds
from international capital market, in the form of euro (sukuk) bonds and Global Depository
Receipts (GDR), at favourable rate. On the other hand, remarkable performance of stock market also
attracted sizeable amount of foreign investment in the last two years.
As a result, Foreign Portfolio Investment (FPI) increased from US $0.6 billion in FY
2004/05 to US $3.3 billion in FY 2006/07. However, the congenial international and
domestic environment changed in FY 2007/08. The crisis that hit international financial markets
led to capital flight from emerging economies' stock markets and also increased the risk premium of
raising funds. The effect of the adverse development on external front was further compounded by
political uncertainty and emerging imbalances in Pakistan economy which increased country risk
as was reflected by Standard & Poor's downward
revision (from stable to negative) of Pakistan outlook on the long term foreign and local
currency sovereign credit rating. Consequently, FPI plunged to US $36 million in FY
2007/08.
11.9.16.5 The country's privatisation programme has further spurred interest on the part of foreign
investors for buying stakes in local companies. In FY 2006/07, the government
successfully completed privatisation of 7 transactions amounting to Rs 104.315 billion. This
includes sale of OGDCL GDR, UBL GDR, OGDCL SPO, Pak American Fertilizers,
Javedan Cement Limited, Lyallpur Chemical & Fertilizers and Lasbella Textile Mills.
During the period from July to December 2007 3.26 percent UBL shares have been sold
through GDR for Rs 5.159 billion and 7.5 percent shares of HBL have been sold through IPO for
Rs 12.161 billion. To date, the government had completed or approved 166
transactions at gross sale price of Rs 475,081.2 million.
281
Poverty Reduction Strategy Paper-II Chapter 11 - Pillar VIII: Capital and Finance for Development
11.9.17
11.9.17.1
Future Outlook
Pakistan has been quite successful in attracting FDI in recent years. However, the country
has the potential to increase FDI inflows substantially because of its favorable geographical location
and a relatively large population which offers a vast potential for the marketing of both consumer
and durable goods. The 'WTO Trade Policy Review (TPR) for Pakistan, 2008' indicates that the
major remaining investment limitations include: poor coordination and collaboration between
relevant regulatory bodies; duplication of requisite permissions; inadequate implementation of
incentives, and their non-competitiveness compared to those offered by regional governments; an
improper domestic arbitration framework to resolve commercial disputes; and lengthy and time-
consuming judicial procedures. Moreover, investors also remain discouraged by political
instability, sectarian violence, weak infrastructure and high crime rates. In addition, the
portfolio investment inflows are less likely to pick up in the near future due to deteriorating
economic fundamentals and
worsening global financial crises. Given the volatile nature of the portfolio investment,
there is need to devise some sort of mechanism to control sudden outflow of capital to
avoid market volatility as has been experimented in some of the Latin American countries.
11.9.17.2 In addition, FDI in Pakistan is mostly concentrated in non-tradable sectors which have
relatively limited potential to generate exportable surplus and thereby alleviate pressure on
country's external account. Thus, there is a need to channel FDI inflows to tradable sectors such as
agriculture, textile, leather, automobiles and chemicals, etc. Likewise, within services sector,
instead of narrowing FDI down to financial and telecommunication sector, it should be encouraged
in wholesale and retail trade as well as in transport and housing
sectors. Keeping in view the recent developments involving the approval by the IMF's
Board of Directors of a US $7.6 billion loan in support of Pakistan's economic stabilization
programme and the government's concrete efforts to generate foreign reserves while maintaining
economic stability in the country, investor's confidence would get boosted
which will help restore flows of Foreign Investment in the country.
282
Poverty Reduction Strategy Paper-II Chapter 12 - Pillar IX: Governance for a Just and Fair System
Chapter 12 - Pillar IX: Governance for a Just and Fair System
12.1
12.2
12.3
12.4
12.5
Governance is the manner in which public institutions and officials acquire and exercise authority to shape public policy and provide public goods and services. It is a critical pillar of
Pakistan's Poverty Reduction Strategy, because it is the poor that especially suffer from
lack of security, empowerment, and opportunities.
The government is committed to delivering public services in an efficient and effective
manner. In the past, much of the effort towards this objective was focused on establishing a well-
performing, merit-based public service and efficient public financial management. But this core of
public administration tends to become self-serving unless stimulated by the 'demand' upon
government for good administration and public services — coming from the National Assembly, the
judiciary, the media and civil society — institutions that hold the government accountable. The
Local Government Ordinance, 2001 led to fundamental restructuring of parts of the political
and administrative setup in order to devolve significant powers away from the federal and
provincial authorities towards local
governments.
Political and administrative devolution have helped improve some social indicators. The
survey findings from the Household Consumption Expenditure Survey (HCES) 2004,
relating to the local government functions are encouraging and show an improvement in
the living conditions of population since FY 2000/2001. This includes an increase in the sources
of drinking water, households using flush system and use of underground sanitation. Other
social sector indices, such as education, have167
gistered an increase in the re
last three years. Another recent survey (CIET/NRB Survey ) also shows that there is
improvement in access to services, citizen's satisfaction levels have improved, and revenue
generation by local governments has shown significant increases.
The governance agenda for the PRSP II period will need to comprise both (i) stimulating
the demand for good governance; and (ii) increasing the government's capacity to
efficiently implement the required response. During 2004-2007, tth
e government's h
effectiveness and regulatory quality have been estimated in the 25th to 50 percentile, while voice and
accountability, rule of law, and control of corruption have been in the 10th to 25th
percentile among 212 countries for which these indicators are available.168
This rebalancing of political authority will strengthen demand and require policymakers to
respond quickly and effectively. This view of governance is especially relevant to the current
time. For more than half its history, Pakistan has not had a democratic government. The return of
democracy, therefore, is likely to bring in its train pressures for governance to
167
Registered in February 1994 as a non-profit, NGO based in New York, Community Information and Epidemiological
Technologies (CIET) is an international group of professionals from a variety of disciplines, including epidemiology, medicine, planning, communications and other social sciences, who bring scientific research methods to community levels. 168 Worldwide Governance Indicators, World Bank Institute at http://info.worldbank.org/governance/wgi/index.asp
283
Poverty Reduction Strategy Paper-II Chapter 12 - Pillar IX: Governance for a Just and Fair System
take directions towards which the country did not previously perhaps show the same
urgency.
12.6 Demand for Good Governance
12.6.1 Locally elected leaders are more familiar with their constituents' needs than are authorities
at the national level, and physical proximity can make it easier for citizens to hold local
officials accountable for their acts. This reasoning lay behind Pakistan's decision to devolve
increasing amounts of power and fiscal responsibility from the federal to the
provincial, and from the provincial to the district levels of government.
12.6.2 The share of women in national decision-making has improved significantly. The 33
percent quota under the devolution plan for women at the union, tehsil and district levels
provides a platform for mainstreaming women in the development process. Seats for
minorities, peasants and workers, on each local council ensure inclusion of the vulnerable
and poor groups.
12.6.3 The devolution plan institutionalizes community participation by setting up an institutional
base of Citizens Community Boards (CCBs) at the grassroots level for participatory
development and bottom-up planning. The CCBs through voluntary and self-help
initiatives take up improvement of service delivery and development and management of
new public facilities. More than 42,469 CCBs have been registered in the provinces and
projects have been initiated. Under the law, at least 25 percent of the development budget
is to be expended through CCBs. The unspent CCB funds are credited in the following year's
budget. The maximum share of the Local Government is 80 percent and the CCBs are required to
contribute at least 20 percent. In addition, as envisaged in LGO 2001, the
Devolution Trust for Community Empowerment (DTCE) has been established as a non- profit,
non-governmental organization working to promote community empowerment
through citizen participation at the grassroots level by facilitating the organization of CCBs and
implementation of CCB development projects. DTCE has made networking
arrangements with the Rural Support Programme Network (RSPN) and National Council
for Human Development (NCHD) to enhance its effectiveness.
12.6.4 More vigorous civil participation requires continuing changes in the manner in which
economic and other policies are conducted: more transparency and accountability for actions
by the upper tiers of government. This, not unexpectedly, caused some discomfort initially in certain
areas of the government, but overall has made government actions more
effective because they are increasingly seen as more responsive to people's felt needs (see the
participation levels of stakeholders' consultations in Annex I). However, the wider
diffusion of political authority is not simply a force that urges greater efficiency on the supply
of services; it also works in important ways to create new demands for better
governance.
12.6.5 The more direct reactions from the grassroots level have affected the contours of the
Poverty Reduction Strategy in at least four ways. First, all stakeholders emphasized the
284
Poverty Reduction Strategy Paper-II Chapter 12 - Pillar IX: Governance for a Just and Fair System
importance of strengthening and enforcing the rule of law. If this vital pillar of governance
is not effective, the lack of security would prejudice not only economic activities (such as
investment), but would severely diminish the quality of life. The poor would be worst
affected, because they have the least resources to cope with insecurity and a lack of justice.
12.6.6 Second, the increased awareness of political power puts more pressure on making the
provision of full employment a central tenet of economic policy-making. This will call for
a delicate balance. The country's resources do not permit the creation of large numbers of 'make work'
jobs in the public sector. Hence, most of the jobs will have to be created in the private sector. Yet, in
dealing with the private sector, an important asymmetry exists. The authorities can prevent the
private sector from doing certain things (by, for example, passing a law or denying the sector
access to some key input), but they cannot make the
private sector do something; they can only provide incentives that the private sector will
consider sufficient. A key challenge for governance in realizing the country's poverty
reduction goals will be to create a business environment in which the private sector feels secure
and in which it is willing to invest on the scale that would create the required number of
productive jobs, while ensuring that the response to the profit motive does not damage the country's
key social goals. These issues are explored at greater length in the
chapter on creating a more competitive economy.
12.6.7 Third, the dialogue with the stakeholders showed that greater grassroots political
participation (such as through the devolution process) would increase the demand for improved
social services, particularly health and education. The country cannot exempt itself from such
pressures. One cannot, for example, envisage a Pakistan 20 years hence in
which the majority of women are illiterate or where medical care is so inequitably
distributed. As a result of these demands, the government's development strategy must
incorporate substantial improvements in the coverage and quality of health care, in access
to higher quality education, and in the improvement of technical training to make it more
relevant for the needs of a competitive market economy in the 21st century.
12.6.8 Fourth, participatory politics puts much more stress on equity in the distribution of
incomes, both between persons and between different regions of the country. There are also
pressures to develop more comprehensive social safety nets so that the disadvantaged are,
to a significant extent, protected from disaster. The development strategy must explicitly
incorporate policies to redress large-scale differences in the distribution of incomes
between individuals, and explicit regional policies to stimulate the development of the
more backward regions of the country, which also means paying special attention to the
requirements of the rural areas.
12.6.9 Procurement reforms are an integral part of improved public financial management and
wider governance reform initiatives. The primary objective of undertaking reform of the
existing procurement systems is improved efficiency and transparency that delivers
substantial direct and indirect economic gains. Benefits are not limited to savings that accrue
on the acquisition of goods, works and services, but extend to the improvement in
285
Poverty Reduction Strategy Paper-II Chapter 12 - Pillar IX: Governance for a Just and Fair System
the way services are delivered. A transparent, modern procurement system will not only
create economic opportunities for local suppliers helping to create healthy competition for goods
and services acquired by the government but also encourage foreign direct investment
which is one of the key goals in the government's economic strategy. Finally, such a system would
enable external partners rely on the province's own systems, rather
than prescribe their own procurement rules and procedures for use under programmes they
finance.
12.6.10 The 2000 Country Procurement Assessment Report (CPAR) of the World Bank called for a
number of institutional and procedural reforms in Public Procurement in Pakistan. These
reforms are a necessary part of good governance and transparency in the use of public
funds. In May 2003, the Public Procurement Regulatory Authority (PPRA) was set up
through an Ordinance to regulate and take such actions as may be required to provide
efficiency and transparency in public procurement. In May 2004, a set of Public
Procurement Rules (PPR) were prepared by the PPRA and notified. Although these rule
conform to good practice in most areas, there remain some in which improvements need to be made.
A suite of standard bidding documents is under preparation. Some of these documents have a
jurisdictional overlap with the Pakistan Engineering Council (PEC) Rules. Consequently, the
PPRA has mandated that pending the finalization of its own
standard Bidding Documents, those of PEC will be used for engineering works and goods.
12.6.11 The foregoing considerations are discussed in more detail in different chapters of this
report. However, it is to highlight these issues here as they play a profound role in shaping
the poverty reduction strategy and these demands are a direct concomitant of an
administration's accepting a more responsive approach to governance.
12.7 Increasing Government's Efficiency and Effectiveness
12.7.1 The first section discussed increases in the demand for good governance that are likely to
come from changes in Pakistan's social and political structures. The present section
examines how the government's ability to respond to these demands can be enhanced by
increasing its efficiency and effectiveness. This section describes the government's strategy
in five main areas in which improved governance would increase the government's ability
to respond efficiently to the demands raised by stakeholders.
12.7.2 Making decentralization more effective
12.7.2.1 The government has made substantial progress on devolution, which formed the second
pillar of PRSP-I, but continuing adjustments are necessary.
12.7.2.2 The first term of local governments ended successfully in June 2005. Under the devolved
system, a strategy for integrated development planning, implementation, and monitoring
has been devised based on a separation of functions. Decentralized functions are to be planned
and executed only by the local governments, and the policies are to be developed
on a bottom-up approach — initiated at the local level and culminating at the provincial
and national levels. Poverty reduction is to be addressed through elected and accountable
286
Poverty Reduction Strategy Paper-II Chapter 12 - Pillar IX: Governance for a Just and Fair System
local governments by strengthening the political, administrative, and financial structures at
the local level. All rural development functions, such as livestock, agriculture (extension),
fisheries, community development, social mobilization, and other social sector services are
now the responsibility of local governments.
12.7.2.3 The devolution reforms were introduced when assemblies were not in place. The reforms
have concentrated on moving from a system managed by the bureaucracy to a system where
decisions are made through a political hierarchy. This has put polit ical
representatives in charge of service delivery at local levels.
12.7.2.4 Interest in local elections is quite high — the turnout in the 2005 local government
elections was 48 percent, compared with a turnout of 42 percent in the 2002 national assembly
elections. This suggests that the citizens are perhaps more interested in local
issues, possibly because they feel that they are more able to influence them.
12.7.2.5 A comprehensive review of implementation problems experienced in the first term of local
governments was undertaken through a consultative process (involving more than 100
meetings) during 2003 and 2004 involving all stakeholders. Based on the feedback from
these consultations, amendments were made to the Local Government Ordinance (LGO). The
functioning of local governments has been kept under review and studies indicate that
three broad issues must be addressed.
The resources of local governments are poorly aligned with their responsibilities:
The revenue base for local governments is limited, and thus these entities depend
heavily on inter-government transfers. However, the autonomy of local governments on the
expenditure side is highly constrained, as: (i) the majority of the financial transfers
are consumed by personnel costs that are in practice determined by the federal
government (since wages are de facto set by the federal government); and (ii) federal and
provincial interventions (through vertical programmes) in the formally devolved
sectors easily overwhelm the spending that local governments could do.
The potential for raising revenues at the local level is highly constrained. Districts have
been assigned a number of revenue sources, such as education and health taxes, user fees, and
tolls on new roads and bridges within the limits of the district, but these tax bases remain
weak and are often difficult to impose. Thus, local governments have
little effective control over or access to own-source revenues.
Power regarding personnel matters remains fragmented: In particular, local
governments still exercise rather limited control over staff appointments, promotions, and
transfers compared with the considerable authority exercised by the provincial
governments. Moreover, there have been complaints of politically motivated staff
appointments and transfers — illustrated, e.g. by the short average tenures of District
Coordination Officers, especially in Sindh, the NWFP, and Balochistan. These are
symptomatic of managerial conflicts between the province and local governments, and
287
Poverty Reduction Strategy Paper-II Chapter 12 - Pillar IX: Governance for a Just and Fair System
only hinder the effectiveness of local governance. The problems of governance are
compounded by the limited capacity of local governments, particularly in departments
(such as Finance) that did not exist prior to devolution, and also in those districts in
Sindh and Balochistan that have been created recently.
The respective roles of the provincial and local governments in development
matters must be further clarified: Provincial initiatives in the social sectors appear to have encouraged local governments in many districts to reduce their allocations to these sectors and to focus their attention on the provision of physical infrastructure. These trends dilute a main purpose behind the devolution, and do not play to the strengths of local governments because the latter do not really have the resources for significant
infrastructure projects.
12.7.2.6 During the period of the PRSP-II, the government intends to make a concerted effort to
correct the foregoing problems. There are four main elements in the federal and
provincial governments' strategies:
to ensure that district governments receive their due financial support in good time;
to build up capacity for better service delivery at the district level through
widespread training programmes for local officials;
to consolidate the administrative setups at the district, tehsil, and union levels; and
to enact new set of rules and bye-laws for the quick disposal of cases at the district
and subdistrict levels.
12.7.2.7 The longer-term strategy envisages the creation of a District Service cadre with a
significant input by the Public Service Commissions in selection. Investments since 2001 by
development partners — such as UNDP, Asian Development Bank, JICA, CIDA, SDC, World
Bank and others — have supported the institutional strengthening of the
decentralization process.
12.7.2.8 The government has established a committee to revisit devolution reforms and also take
into account their advantages and demerits. After review, the committee will decide
whether to continue devolution reform or just preserve the benefits.
12.7.3 Fiscal decentralization
12.7.3.1 Of the problems thrown up by the reviews of the functioning of local governments, issues
connected with fiscal decentralization loom large and it may be worthwhile to examine
them in a little more detail.
12.7.3.2 Since the FY 2002/03, a transparent, formula-based system has determined the transfer of
funds to local governments. For this purpose, a Provincial Finance Commission (PFC) has been
established by each province. The PFC is chaired by the provincial Minister of Finance, and
includes provincial and local government officials and representatives of the
288
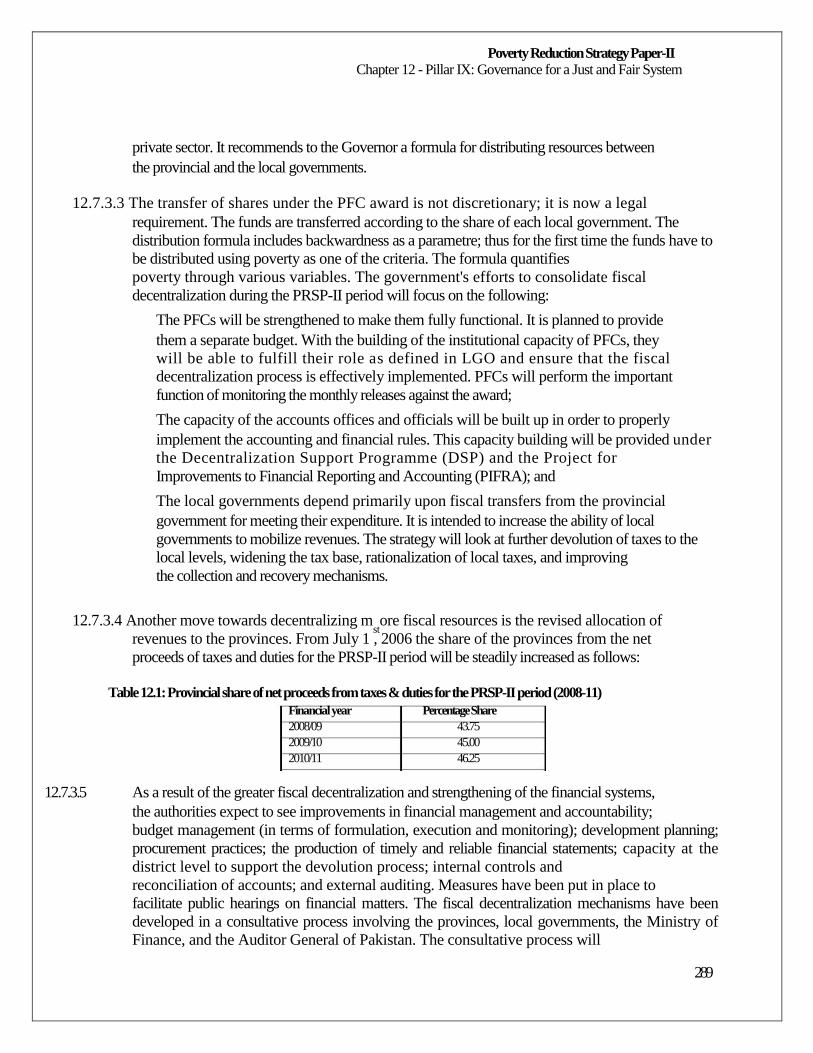
Poverty Reduction Strategy Paper-II Chapter 12 - Pillar IX: Governance for a Just and Fair System
private sector. It recommends to the Governor a formula for distributing resources between
the provincial and the local governments.
12.7.3.3 The transfer of shares under the PFC award is not discretionary; it is now a legal
requirement. The funds are transferred according to the share of each local government. The
distribution formula includes backwardness as a parametre; thus for the first time the funds have to
be distributed using poverty as one of the criteria. The formula quantifies
poverty through various variables. The government's efforts to consolidate fiscal
decentralization during the PRSP-II period will focus on the following:
The PFCs will be strengthened to make them fully functional. It is planned to provide
them a separate budget. With the building of the institutional capacity of PFCs, they
will be able to fulfill their role as defined in LGO and ensure that the fiscal
decentralization process is effectively implemented. PFCs will perform the important
function of monitoring the monthly releases against the award;
The capacity of the accounts offices and officials will be built up in order to properly
implement the accounting and financial rules. This capacity building will be provided under
the Decentralization Support Programme (DSP) and the Project for
Improvements to Financial Reporting and Accounting (PIFRA); and
The local governments depend primarily upon fiscal transfers from the provincial
government for meeting their expenditure. It is intended to increase the ability of local
governments to mobilize revenues. The strategy will look at further devolution of taxes to the
local levels, widening the tax base, rationalization of local taxes, and improving
the collection and recovery mechanisms.
12.7.3.4 Another move towards decentralizing mstore fiscal resources is the revised allocation of
revenues to the provinces. From July 1 , 2006 the share of the provinces from the net
proceeds of taxes and duties for the PRSP-II period will be steadily increased as follows:
Table 12.1: Provincial share of net proceeds from taxes & duties for the PRSP-II period (2008-11)
Financial year Percentage Share 2008/09 43.75 2009/10 45.00 2010/11 46.25
12.7.3.5
As a result of the greater fiscal decentralization and strengthening of the financial systems,
the authorities expect to see improvements in financial management and accountability;
budget management (in terms of formulation, execution and monitoring); development planning;
procurement practices; the production of timely and reliable financial statements; capacity at the
district level to support the devolution process; internal controls and
reconciliation of accounts; and external auditing. Measures have been put in place to
facilitate public hearings on financial matters. The fiscal decentralization mechanisms have been
developed in a consultative process involving the provinces, local governments, the Ministry of
Finance, and the Auditor General of Pakistan. The consultative process will
289
Poverty Reduction Strategy Paper-II Chapter 12 - Pillar IX: Governance for a Just and Fair System
continue during the period covered by PRSP-II.
12.7.3.6
As noted above, some important deficiencies identified in local governments relate to
weaknesses in institutions and shortages of trained personnel. The government will use the
Devolution Trust for Community Empowerment (DTCE) — a non-profit, non-
governmental organization that promotes community empowerment through citizen
participation at the grassroots level — among other organizations, to tackle these problems.
12.7.4 (b) Creating a District Service
12.7.4.1 The Provincial Local Government Ordinances, 2001 were amended in June 2005 to
provide for the creation of the district service and to give disciplinary powers to Nazims.
The creation of a District Service (comprising district and tehsil cadres) will ensure that local
governments have full command over the officials working in the decentralized offices. The
National Reconstruction Bureau will provide technical support to the
provincial governments.
12.7.4.2 The creation of the District Service will impact on the civil service structures at the federal
and provincial levels. The new framework for the civil services will be completed during the
PRSP-II period, and will ensure, inter alia, that employees of the district service and those in the
provincial services find adequate opportunities to move from one cadre to the
other. The reform of the civil service is discussed later in this chapter.
12.7.5
12.7.5.1
12.8
12.8.1
12.8.2
12.8.2.1
(c) Strengthening local institutions
The efficient working of Provincial Finance Commission, Local Government Commission, Office of the Zila Mohtasib, Zila Mushawarat Committee, Accounts Committee, and
Monitoring Committees is an important pre-requisite for strengthening the decentralization
process. In order to make the working of these institutions/committees effective, rules,
regulations, and byelaws will be required. Some of these have already been developed.
Model rules are being developed by the NRB which will be promulgated by the provincial
governments. In the past, the NRB had issued guidelines for the monitoring committees.
These guidelines will be converted into model rules during the PRSP-II period.
Improving the rule of law
The chief impediment in the way of a citizen's timely access to justice are the
unsatisfactory functioning of the police, the long periods taken by law courts to dispose of cases,
and the legal and other expenses that these practices generate. The present outcomes result from a long
history and it would be unrealistic to expect them all to be rectified
within the space of three years. The strategy during the period covered by the PRSP-II aims
at making a solid beginning to improving the situation in all these areas.
Reforming the police
The police forms the first bulwark for citizens against crime and disorder. It bears a heavy responsibility for enforcing the rule of law. The first point of contact of a citizen with the
country's law and order system is with the police. The majority of stakeholders, however,
290
Poverty Reduction Strategy Paper-II Chapter 12 - Pillar IX: Governance for a Just and Fair System
reckoned the performance of the police to be far from satisfactory. This is a serious matter,
not only from the point of view of protecting the rights of citizens, especially of the poor
and vulnerable, but also from that of creating a secure environment in which investment
and economic activity can flourish, and employment and incomes increase.
12.8.2.2
12.8.2.3
12.8.2.4
For these reasons, the government has taken a number of steps to reform the police forces
of the country. The promulgation of Police Order, 2002 was a major step towards
transforming police into a professionally competent, politically neutral, non-authoritarian,
and publicly accountable organization.
The Order envisaged that a number of institutions, including the police, complaint
authorities and Public Safety Commissions at the district, provincial and federal levels,
would achieve the objectives of public oversight, checks and balances and accountability. It also listed
a large number of reforms in terms of the structure of the police service (e.g. the
separation of 'watch & ward' from investigation) and put a number of obligations on police
leadership.
A credible system of public oversight and accountability has been provided through the
establishment of two high-powered institutions at the federal level — the Federal Police
Complaints Authority and the National Public Safety Commission. Additionally, Public
Safety and Police Complaints Commissions have been established at the provincial and district
levels. These commissions have been empowered to direct corrective actions on
complaints against the police and to take cognizance of a range of issues falling within
their remit.
12.8.2.5 During the period of the PRSP-II, the government intends to pursue additional police
reforms, principally aimed at depoliticizing the police, increasing their accountability, and
improving their functions. This will be done by strengthening checks on the conduct of the police,
improving their training, upgrading equipment, and reforming the structure of pay
and incentives.
12.8.3 Strengthening the judicial system
12.8.3.1 While the Supreme Court and the High Courts have generally retained the public's
confidence, the performance of the judicial system at lower levels is perceived to be
unsatisfactory. The subordinate courts suffer from long delays, large and increasing
backlogs of cases, and even allegations of bribery leading to compromised judgments.
12.8.3.2 A number of factors have contributed to bringing about this state of affairs. The first is that
the number of judges has not kept pace with the growth of the population. It has been
estimated that in Pakistan there are about 1.2 judges for every 100,000 of the population; this
compares with over eight in France and about 4.5 in Germany. Second, however, the efficiency of
the legal system also depends upon the clearance rate, that is, the number of cases resolved
divided by the number filed. Most developed countries have rates approaching 100
percent; France and Germany in a number of years have had rates
291
Poverty Reduction Strategy Paper-II Chapter 12 - Pillar IX: Governance for a Just and Fair System
exceeding 100 percent, while that in Pakistan is only about 30 percent. The rate must
exceed 100 percent in order to reduce the backlog of cases; therefore, the number of pending
cases in Pakistan keeps increasing. Third, a higher number of judges per capita
does not necessarily translate into a higher overall clearance rate—it also depends on the
productivity of judges, i.e. the number of cases cleared per judge. Singapore, for example, is amongst
the countries with the fewest judges per 100,000 of the population (0.64), but it
has one of the highest clearance rates (94 percent).
12.8.3.3 Reforming the judicial system in Pakistan, in terms of significantly reducing the time taken
to resolve cases and improving the quality of judgments, can be expected to take several
years. The government, in co-operation with international institutions (especially the Asian
Development Bank) made a serious beginning with the 'Access to Justice Programme.'
The process of reform includes an expansion of the number of judges, improving their training,
providing them with better facilities and equipment, increasing their pay to appropriate levels,
recruiting and training sufficient support staff, and simplifying a number of the procedural rules that
lead to delays in disposing of cases. These measures should
help speed up the delivery of justice, cut the backlog of pending cases, and make access to legal
processes more affordable and the results more equitable. The reform process will continue
during the period covered by the PRSP-II; additional funding and other support
will be sought as needed.
12.8.4 Fighting corruption
12.8.4.1 An important element in the bid to improve governance is the struggle against corruption.
While corruption affects all sections of society, it is especially harmful to the poor by
denying them their rightful share of economic resources, by putting basic public services beyond
the reach of those who cannot afford to pay bribes, and by diverting scarce resources intended
for development into unproductive expenditures. By widening the gap between the 'haves' (who can
afford bribes) and the 'have nots' (who cannot), it breeds a
sense of inequality and injustice.
12.8.4.2 Pakistan inherited the Prevention of Corruption Act (PCA) at independence in 1947. World
War II had led to an immense increase in procurement-related corruption and the first ever
anti-corruption agency was created under the PCA called the Special Police Establishment.
Following the PCA 1947, laws like the Public Representatives (Disqualification) Act 1949 and
the Elected Bodies (Disqualification) Ordinance 1959 were promulgated. Anti- corruption
agencies have also been created ever since independence. The West Pakistan
Anti Corruption Establishment 1961 created the provincial Anti Corruption Establishments
(ACEs). The Federal Investigation Agency169
IA) replaced the Pakistan Special police (F
Establishment (PSPE) in 1975. The Ehtesab Bureau was instituted in 1997 augmenting
the Ehtesab Commission of 1996. The Bureau was entrusted with investigation of
corruption while the Commission had to prosecute it.
169
Accountability.
292
Poverty Reduction Strategy Paper-II Chapter 12 - Pillar IX: Governance for a Just and Fair System
12.8.4.3 In 1999, the National Accountability Ordinance was promulgated which created the
National Accountability Bureau (NAB) as the supreme anti-corruption agency of the
Federal government. The NAB had the defunct Ehtesab Bureau as its predecessor. The Bureau
has been accorded a wide range of powers enabling it to, for example, freeze assets,
issue warrants for arrest, employ persons and organizations within or outside Pakistan to
trace illegal assets, and to prosecute offenders.
12.8.4.4 The Bureau has previously been transferred anti corruption functions of the FIA in 2005
which, however, have now been given back in 2008. As a result, there are at present two
agencies dealing with anti corruption at the federal level. Meanwhile, the National
Accountability Ordinance, 1999 governing the functioning of the NAB is being revised by
the Ministry of Law & Justice.
12.8.4.5 The strategy to combat corruption during the period of the PRSP-II encompasses several
facets. The authorities will continue the pressure against acts of corruption using some of the
powerful instruments, such as the NAB and the FIA. The anti-corruption efforts have also been
strengthened by measures to counter money-laundering. Pakistan became a member of the
Asia-Pacific Group (an autonomous regional anti-money-laundering organization) in 2000.
Pakistan has now promulgated an Anti Money Laundering Ordinance (2007) that empowers
the authorities to seize property derived from or invested in money-laundering and matters
connected therewith, and to impose other suitable
penalties.
12.8.4.6 The strategy will also introduce measures that seek to prevent corruption and raise the
awareness of the people as to what can be done to reduce the incidence of this scourge. This,
clearly, is a long haul effort. During the period of the PRSP-II the most visible effects
will be a more explicit focus by the educational system on calling attention to the evils of this
practice, and much greater ease of access to local and district lawgivers whose scrutiny
of demands for bribes and other corrupt actions can thus be more quickly obtained.
12.8.4.7 Pakistan has also ratified the United Nations Convention Against Corruption (UNCAC)
and has joined the world community in the fight against corruption.
12.8.5 Mobilizing and managing resources for development
12.8.5.1 A crucial requisite for improving the response to stakeholders' demands is the need to
mobilize additional resources for development. This is not the place to comprehensively rehearse
the government's strategy for mobilizing resources; only the more important aspects of resource
mobilization that touches upon governance issues are taken up. These aspects include a
strengthening of the tax administration and policies to streamline tax
policy.
12.8.5.2 Strengthen tax administration
12.8.5.3 Progress has been made in many areas including: moves towards the introduction of self-
assessment for income tax; extensive development of IT systems in some critical areas; the
293
Poverty Reduction Strategy Paper-II Chapter 12 - Pillar IX: Governance for a Just and Fair System
development of a strong taxpayer facilitation approach; rapid progress in e-filing; and the
establishment of an increasingly modern office network, with upgraded infrastructure at
many offices.
12.8.5.4 However, the process is still not complete: self-assessment is partial; the organizational
structure continues to reflect separate taxes; and the full benefits of a function-based and
integrated administration have yet to be realized.
12.8.5.5 In cooperation with international institutions (principally the World Bank) the government
has commenced a major programme to reform the tax administration. This programme is intended
to increase tax collections, to obtain the economic efficiency gains from reducing the unfair
competition that results from an uneven tax burden on businesses, and to
increase the confidence of the public in the tax department.
12.8.5.6 The reform process has been structured around simplification of tax laws and procedures
(which should reduce the cost of doing business); a universal self-assessment scheme (which
should reduce much of the friction associated with taxation); broadening of the tax base (which
should increase revenue collections in an equitable manner); and rendering transparent services to
the taxpayers (which should increase the confidence of the public). The reform process, therefore,
focuses on questions of equity, efficiency, and increased confidence; that is, it is centered
squarely on the governance aspects of revenue
mobilization. The program will be pushed forward vigorously during the period covered by
the PRSP-II; indeed, it is intended to complete a major portion of the reforms by December
2009.
12.8.5.7 The tax reforms, of which a major component is the reform of the tax administration, have
already begun to yield dividends. Revenue collection in 2007/08 rose to Rs 1007 billion
from Rs 518 billion in FY 2003/04 — an annual growth rate of over 18 percent. The tax
base was also expanded — returns filed in FY 2007/08 increased to 2.1 million from only
about 1 million in FY 2003/04. The numbers registered with the sales tax department
increased from 101,851 to 145,000 between these two years. The increases in these
indicators show that the reforms have succeeded not only in mobilizing additional
resources but, by bringing in taxpayers who had hitherto apparently evaded their
responsibilities, also increased the equity of the system.
12.8.5.8 Despite the progress that has been made, the government is aware that more needs to be
done. The performance of the tax administration was reviewed in 2008 in cooperation with the
World Bank in order to examine how it could be further improved. The government
proposes to take a number of steps (outlined below) during the currency of the PRSP-II in
order to increase both the efficiency and equity of tax administration.
12.8.6 (b) Streamline tax policy
12.8.6.1 In order to increase revenue from taxes in an equitable manner, the government will
implement a number of measures to streamline tax policy during the period of the PRSP-II.
294
Poverty Reduction Strategy Paper-II Chapter 12 - Pillar IX: Governance for a Just and Fair System
These measures will be directed towards improving tax policy and legislation,
strengthening the organisation and management of key institutions; and putting in place a
framework to increase taxpayer compliance.
Tax policy and legislation: The government intends to follow a three-pronged approach.
The first is aimed at improving tax policy and legislation and will remove weaknesses and
inconsistencies in the design of the basic taxes (especially the income and sales taxes) that
tend to hinder effective administration. Steps will be taken to make the sales tax more
closely approximate a true value-added tax. Other issues that will receive attention during the period
of the PRSP-II are: tax exemptions and tax credits; harmonization of procedures
for all domestic taxes; more consistent tax treatments and definitions of small business;
clarification of a number of issues relating to the sales tax, such as exemptions and zero-
rating, and the application of the sales tax to services.
Organization and management: The second prong of the strategy is aimed at
improving the structure and performance of key institutions that are responsible for
implementing tax policy. A major objective of the reforms has been to create an
organizational structure for the FBR based on functional rather than tax-type lines. This
will ultimately involve the full merger of the sales tax and income tax organizations
into a single organization. During the period of the PRSP-II, the government intends to review
all the tax administration processes of the FBR with a view to making them more business-
like. This re-engineering will include the introduction of more rigorous
planning and monitoring of FBR operations, in addition to the revenue targets.
Taxpayer compliance: The third prong aims at strengthening taxpayer compliance.
This is a vital element of the reforms because self-assessment forms an important part of the
taxation strategy. Successful self-assessment systems depend on most taxpayers voluntarily
complying with their obligations to register, keep proper records, file correct returns and
pay tax on time, without the interference of a tax official. The recent efforts to facilitate taxpayer
compliance through education and assistance will be augmented with a strengthened and
targeted enforcement programme to detect and
deter non-compliance.
A number of measures are under consideration to improve compliance. These measures
include: dedicated task forces to pursue unregistered entities and non-filers; systematic cross
checking of a range of external databases (for example, property transactions and
utility accounts) against the taxpayer register; significantly increasing the risk of
discovery by boosting audit coverage to 30 percent of the large taxpayer sector and 3 to 5 percent
of the small and medium business sector; and consistently applying penalties
to non-compliant taxpayers and prosecuting cases of serious fraud and evasion.
12.8.7 Increase accountability and financial management
12.8.7.1 The responsiveness of the authorities to the demand for better governance will be strengthened
if the key actions of the government that impact on poverty reduction are rigorously prepared
295
Poverty Reduction Strategy Paper-II Chapter 12 - Pillar IX: Governance for a Just and Fair System
and reliably tracked. This monitoring must be conducted in terms both of financial indicators
and of the physical implementation of various programmes and projects. A separate chapter examines
the monitoring and evaluation of physical outcomes; the present section deals with measures to
strengthen financial discipline so that the government can utilize its expenditures
more effectively and deliver key services more efficiently.
12.8.7.2 Public Financial Management (PFM)
12.8.7.2.1 The enabling overarching legislative framework for public financial management in Pakistan is
embedded in the 1973 Constitution. In 2001, the accounting function was separated from the
audit and the Office of the Controller General of Accounts (CGA) was established.
12.8.7.2.2 The CGA organization is being strengthened across the country with the support of a World
Bank-financed project — Project for Improvement in Financial Reporting and Auditing
(PIFRA). Under this project, the government has transited to International Public Sector
Accounting Standards using a computerized integrated financial management information system.
As a result, the timeliness and reliability of financial reports of government have
improved.
12.8.7.2.3 A number of other systemic public financial management weaknesses identified in earlier
diagnostics have been remedied under the PIFRA project. The key reforms areas targeted for
the period of the PRSP-II are: (a) modernization of the legal and institutional framework of
PFM; (b) streamlining and updating the older financial and treasury rules; (c) strengthening the public
accountability practices; and (d) improving the public audit and oversight functions
across all governments.
12.8.7.2.4 These reforms will build on what has already been achieved in addressing the PFM
weaknesses. These achievements include: (a) the roll-out of the new government-wide Chart of Accounts
under the new accounting model for budgeting, accounting, and financial reporting, consistent with
international standards, across federal, provincial and all district governments
in Pakistan; (b) the improved timeliness in the rendering of accounts for audit and the
completion of the audit processes using risk-based audit practices that conform to the
International Standards on Auditing; (c) significant reduction in 'pay-bill' processing time as the
computerized environment has minimized manual processes and human discretion; (d) more credible
fiscal reports that enable better economic decisions by public officials; and (e) enhanced disclosure in
financial reports. Since enhancing accountability, transparency, and reducing opportunities for
corruption are core elements of the governance pillar of the Pakistan PRSP, these and other related
actions will be strengthened and deepened as part of the
government's ongoing reforms.
12.8.7.2.5 During the period of the PRSP-II, the government will continue to engage with development
partners to deepen the diagnostics on PFM and to address weaknesses that may be identified. In addition,
the government will continue to partner with the donor community in harmonizing
their respective PFM practices, systems, and procedures, and aligning them with improved
country systems in pursuit of the Paris Declaration on aid effectiveness.
296
Poverty Reduction Strategy Paper-II Chapter 12 - Pillar IX: Governance for a Just and Fair System
12.8.7.2.6 An important tool that the government will use for strengthening public financial management
during the period of the PRSP-II is the Medium Term Budgetary Framework (MTBF). A
multi-year budget horizon will provide ministries the space and flexibility they need to
formulate, plan and implement policies that focus on public service delivery or output.
12.8.7.2.7 The MTBF reforms were initiated by the federal government in 2003, and a considerable
amount of time has been devoted to training staff, developing computer programmes, and
identifying indicators for each output and target set for service delivery in the financial year. The
system comprises two major components — a strategic or 'top-down' element implemented in the
Ministry of Finance, and a 'bottom-up' element that will strengthen budget preparation through output based
budgeting. The system has already been tried on a pilot basis,
and the Ministry of Finance expects the full roll-out and implementation of the MTBF system
across the federal government in the preparation of the budget for FY 2009/10. The system will be
progressively calibrated during the period of the PRSP-II as more experience is
accumulated.
12.8.7.2.8 Since the MTBF addresses only the preparation stage of the budget cycle, the realization of the
full benefits of the MTBF process will require complementary efforts to strengthen
management of the later stages of the budgetary cycle, namely budget execution, monitoring
and evaluation and budget reporting. These will be pursued during the PRSP-II period.
12.8.7.2.9 The implementation of the MTBF is an important development for maintaining discipline in
the Poverty Reduction Strategy. It provides a structured process, through the top-down
component of the MTBF and through the application of output-based budgeting, to concentrate
government spending, within the available resources, in defined priority areas to achieve national
goals and to improve the quality of public spending. The government intends to develop the system
further during the PRSP-II period so as to make it possible to conduct more
effective Public Expenditure Reviews for individual ministries or sectors. It also intends to
progressively link outputs defined in the budget to financial resources required for the delivery,
so that it becomes possible to undertake meaningful reviews of the efficiency and cost-
effectiveness of public spending.
12.9 Civil service reform
12.9.1 At the time of independence, Pakistan inherited a strong civil service that came to be known as the 'steel frame' of the administration. In the 60 years since that date, the scope and
responsibilities of the civil bureaucracy have greatly expanded and, in some important
ways, altered in response to the changing structure and functions of the state. The
expansion of the bureaucracy can easily be explained by the need to cater to a much larger
population, which has increased from about 37 million at the time of the 1951 census to over 160
million today. However, on a per capita basis, the civilian bureaucracy of
Pakistan is still much smaller than that of several other countries, for example, Egypt.
297
Poverty Reduction Strategy Paper-II Chapter 12 - Pillar IX: Governance for a Just and Fair System
12.9.2 Apart from having to deal with a much larger population, the civilian bureaucracy has had
to incorporate two major changes to its remit and to its functioning. The major change to its area of
responsibility is its stewardship of many aspects of Pakistan's economic development. The
bureaucracy in the pre-independence and immediate post-independence
period was almost exclusively concerned with questions of law and order; these days it has
also to manage complicated issues that impinge on the economic development of the country.
The major change to its functioning results from the devolution process, whereby a significant
amount of power and responsibility is shared with administrative elements at the district and local
levels. These changes require material adjustments to the recruitment, training, pay, career
development, and conditions of work of the bureaucracy if it is to
satisfactorily discharge its duties in the new political and economic environment.
12.9.3 A competent, effective, and neutral Civil Service is the backbone of any country's
governance structure. There is a general consensus that the performance of the Civil Service in
terms of output, efficiency, neutrality, objectivity and attitude towards common citizens no longer
meets the exigencies of the country. Pakistan, has therefore, tried to bring about major structural
changes; the most prominent among them were introduced in
1973 and in 2001.
12.9.4 The 2001 devolution to local governments is more wide ranging than previous attempts.
The most significant change is that under the new system the posts of Deputy
Commissioners and Commissioners have been replaced by elected Nazims as head of the
District Administration with greater powers and autonomy. To some extent, these reforms
have introduced a larger measure of accountability on the part of officials closer to the people,
and surveys have confirmed general public satisfaction with these changes. But
several problems have not yet been ironed out, and in a number of cases there are tensions
between the provincial and local governments, especially where incumbents belong to different
political parties. However, this reform is still considered an ongoing process, and the government is
fine-tuning its working (some of the major issues relating to devolution
are discussed elsewhere in this chapter).
12.9.5 A high-level commission is presently studying the reform of the civil service. Its
preliminary proposals touch upon four broad areas to be implemented during the period
covered by the PRSP-II.
12.9.6 Widening the talent pool by utilizing the services of professional headhunting
organizations for specific senior and professional positions in the civil service;
Aligning pay and other elements of the compensation package with present economic
realities, so as to attract the best people into the service and to motivate them to
perform to their potential;
Providing regular training in subjects (such as management, law, economics, regional
languages, etc.) that would help maintain a more effective approach to analyzing and dealing
with issues. Particular emphasis will be put on the use of IT, in order to speed
298
Poverty Reduction Strategy Paper-II Chapter 12 - Pillar IX: Governance for a Just and Fair System
up decision-making and to monitor the implementation of decisions; and
Greater emphasis on solving problems and on increasing the professionalization of the
service. Recruitment measures could then give due weight to ability-based
psychometric assessments (while minimizing the element of subjectivity in the
assessment process). In particular, it is proposed that the common examination for all cadres be
restricted to a small number of compulsory subjects that focus primarily on communication
and problem solving skills; and that separate examinations be instituted for different occupational
groups to test skills more relevant to their chosen fields (e.g. potential taxation service recruits
would be tested in finance and accounting, financial
management, and international standards of audit).
12.10 Public Sector Capacity Building Project 12.10.1 Public sector capacity building is yet another area of focus for increasing efficiency in the
civil service. Public Sector Capacity Building Project (PSCBP) was initiated with a total cost
of US $61 million including World Bank assistance of US $55 million for a period of five
years. The project was launched in FY 2004/05 and is in its 5th and final year of
implementation. The project seeks to undertake capacity building initiatives in three broad areas i.e.
Civil Service Reforms, Policy Reforms, and Regulatory Reforms. There are
currently 26 stakeholders of the Project. The PSCB Project is oriented towards
improvement in economic management of the government, policy design, implementation,
coordination, monitoring, adjustment and regulatory functions through an intensive
resource development programme.
12.10.2 The PSCBP arranges short and long term foreign trainings for civil servants to bridge the
capacity gap. Long-term foreign training for the civil servants is arranged under two
programmes i.e. Professional Development Programme (PDP) and Executive Development
Programme (EDP). Under the PDP until now a total of 347 officers have been sent abroad for
training i.e. Master Degree courses. Similarly, a total of 186 officers have been trained under the
EDP. All executing agencies have undertaken short term foreign training and till
now, a total of 701 officers have benefited.
12.10.3 Localized training courses have also been arranged under the framework of the project by
engaging foreign specialists/experts in the required field/subject. A total of 427 officers of the
Federal, Provincial and District governments were imparted training in the specialized
fields such as Capital Markets, Financial Management, Debt Management and Public Private
Partnership. Local training courses have also been arranged by various executing
agencies under the sponsorship of the project to impart training to their officers on subjects of their
immediate concern. A total of 2,796 officers have been trained during the past four
years through local training courses by the Executing Agencies.
12.10.4 The other major intervention under the Project is to bridge the skill gap in the government
through recruitment of consultants. So far 36 consultants have been recruited by different
299
Poverty Reduction Strategy Paper-II Chapter 12 - Pillar IX: Governance for a Just and Fair System
executing agencies for various wings. A total of 27 research studies on various topics to
build the capacity of executing agencies have also been conducted.
12.10.5 To assess the effects of these capacity building interventions on the performance and
efficiency of the public sector, an impact assessment/evaluation study is currently
underway with the assistance of the World Bank
12.11 Public Private Partnerships (PPPs)
12.11.1The increasing demand for income-generating employment and the provision of key
services on the one hand, and the constraints on the government's financial and human resources on
the other, means that in some fields of activity the government should not seek to act as the sole
provider, but should encourage the private sector to perform as a partner. Some areas are quite
clear. The private sector is in general a more efficient creator of jobs; it can therefore help to alleviate
poverty through employment generation and at the
same time create more fiscal space by relieving pressure on the government budget.
12.11.2In the same vein, the private sector can join hands with the public sector in delivering some
key services, such as education, health and financial services. During the period covered by
the PRSP-II, the government intends to encourage the private sector to join in partnership with it to
deliver a wide range of services. However, this does not mean that the government will
abdicate or dilute its responsibilities; rather, these will take on a more
strategic hue.
12.11.3Thus, the private sector will be permitted a larger role in utilities, but the government will
devise regulations to ensure that the poor get access to better services at lower prices. In the health
sector, public institutions will play to their strengths and take the lead in dealing with
communicable diseases, providing a health insurance programme, and promoting equity in the
distribution of health resources. The role of the private sector is likely to raise
quality and promote efficiency. Similarly, the provision of primary education would appear
to fall squarely within the remit of the public sector, while the balance between public and
private sectors in the provision of tertiary education could be more flexible.
12.11.4
In the final analysis, however, the government will remain the referee to apply the rules of
the game that will ensure that the quality of services is maintained, and that the delivery of services
does not ignore the poor. The government will work on formulating appropriate regulations and
developing financial options that will enable the private sector to respond to its profit motive while
at the same time acting as an effective partner with the public sector in its
strategy to reduce poverty.
300
Poverty Reduction Strategy Paper-II Chapter: 13 - Results-Based Monitoring and Evaluation of PRSP-II
Chapter: 13 - Results-Based Monitoring and Evaluation of
PRSP-II
13.1 This chapter presents the results-based Monitoring and Evaluation (M&E), first outlining the objectives, components, features and framework of the PRS monitoring, PRSP-I
monitoring experience during the last three years, followed by a description of the main
challenges and steps that will be taken to address the challenges. The strategy for the PRSP-II
period is then outlined with a concrete plan for M&E as well as vision for the
coming years.
13.2
13.3
Undoubtedly, M&E is a powerful public management tool that can be used to improve the
way governments achieve results. Just as governments need human, financial and
accountability systems, governments also need good performance feedback systems.
As part of the Poverty Reduction Strategy (PRS) initiative, Pakistan has been developing
results-based M&E systems to track PRS implementation and its impact on poverty. The process
supports decision making, fosters accountability, and promotes dialogue. Results-
based M&E is defined broadly to include the tracking of overall progress in poverty
reduction, monitoring and evaluating the implementation of PRS policies and programmes, in
addition to monitoring budgets and expenditures. The system, therefore, focuses on the entire 'results
chain' that links the various elements. In order to response to this need, the
Ministry of Finance and UNDP have instituted a joint project titled 'Strengthening Poverty
Reduction Strategy (PRS) Monitoring' covering the period 2008-12. The objective of the project is
to strengthen institutional capacities for results-based monitoring and evaluation
of poverty reduction strategies at the federal, provincial and district levels.
13.2 Results-based Monitoring and Evaluation (M&E)
13.2.1 The success in poverty reduction depends on the availability of resources, effective
implementation of the strategy, continuous monitoring and evaluation (M&E), and regular
feedback to policymakers for appropriate adjustment in programmes and policies. The
development of results-based M&E system is a critical component of any successful PRS.
Such a system is intended both as a way of ensuring continuous improvement of the PRS
and as an instrument for influencing the development policy process by170
king it more ma
evidence based and results oriented. A recent review of the PRS approach underlines the
centrality of a monitoring system as a pillar upon which PRS can be elaborated; it helps open the
policy space for dialogue, establish priorities, design programme and policies, set realistic targets,
and assess implementation with a view to refine the strategy. Accordingly, the strategy includes a
detailed results-based M&E framework in line with the MDGs that also includes a set of indicators
to track policy inputs and expenditures, their outputs, and
progress towards the intended outcomes.
170
IMF and World Bank, 2005
301
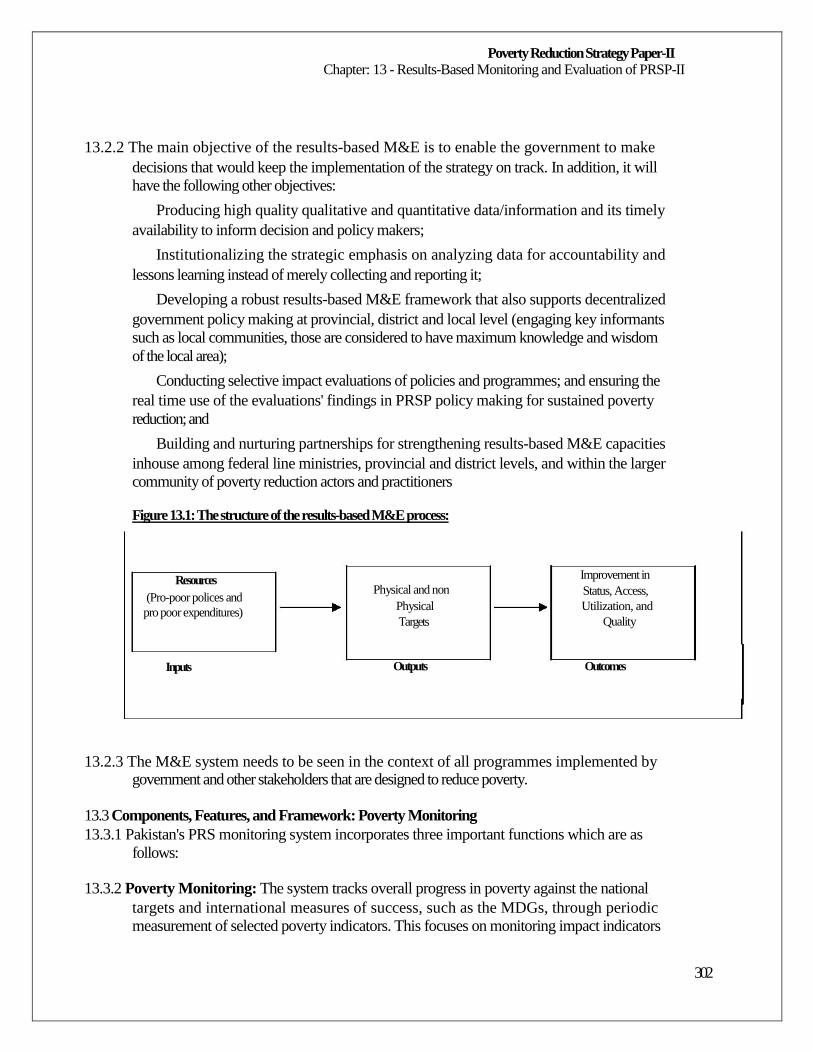
Poverty Reduction Strategy Paper-II Chapter: 13 - Results-Based Monitoring and Evaluation of PRSP-II
13.2.2 The main objective of the results-based M&E is to enable the government to make
decisions that would keep the implementation of the strategy on track. In addition, it will
have the following other objectives:
Producing high quality qualitative and quantitative data/information and its timely
availability to inform decision and policy makers;
Institutionalizing the strategic emphasis on analyzing data for accountability and
lessons learning instead of merely collecting and reporting it;
Developing a robust results-based M&E framework that also supports decentralized
government policy making at provincial, district and local level (engaging key informants
such as local communities, those are considered to have maximum knowledge and wisdom
of the local area);
Conducting selective impact evaluations of policies and programmes; and ensuring the
real time use of the evaluations' findings in PRSP policy making for sustained poverty
reduction; and
Building and nurturing partnerships for strengthening results-based M&E capacities
inhouse among federal line ministries, provincial and district levels, and within the larger
community of poverty reduction actors and practitioners
Figure 13.1: The structure of the results-based M&E process:
Resources (Pro-poor polices and pro poor expenditures)
Inputs
Physical and non Physical Targets
Outputs
Improvement in Status, Access, Utilization, and
Quality
Outcomes
13.2.3 The M&E system needs to be seen in the context of all programmes implemented by government and other stakeholders that are designed to reduce poverty.
13.3 Components, Features, and Framework: Poverty Monitoring
13.3.1 Pakistan's PRS monitoring system incorporates three important functions which are as
follows:
13.3.2 Poverty Monitoring: The system tracks overall progress in poverty against the national
targets and international measures of success, such as the MDGs, through periodic
measurement of selected poverty indicators. This focuses on monitoring impact indicators
302
Poverty Reduction Strategy Paper-II Chapter: 13 - Results-Based Monitoring and Evaluation of PRSP-II
and is accomplished through the use of census, surveys, and other investigative tools
through the Federal Bureau of Statistics.
13.3.3 Implementation of the Monitoring of PRS: The system allows for the M&E of the
progress in the implementation of PRS policies and programmes. This involves the
measurement of inputs, activities, outputs and outcomes across the various sectoral
programmes and thematic areas. Implementation monitoring relies on administrative data from a
wide range of actors, from line ministries to provincial and district levels set up, and is therefore
most difficult to manage and coordinate. The capacity constraints are often severe and difficult to
address because of the numbers of actors involved. Implementation depends upon a careful
selection of indicators based upon explicit result chain (that is, casual links between interventions
and their desired impacts) in order to support effective
assessment of programmes and polices.
13.3.4 Expenditure Tracking: Although conceptually a part of implementation monitoring, the
measurement of expenditure is a specialised area under the PRSP Secretariat, Ministry of Finance.
Normally, expenditure tracking is not always explicitly articulated as part of PRS
monitoring, however, reliable and timely data on expenditure are indispensable to a well
functioning PRS monitoring system in practice. Hence, the PRSP Secretariat has been
taking right steps in this direction.
13.4
In order to provide the maximum assistance to policymakers, the improved M&E
framework established for this strategy has the following characteristics:
Comparability with the PRSP-I M&E framework: To the extent possible, the
previous M&E indicators have been retained to ensure comparability and analyse trends
overtime. Some indicators have, however, been dropped due to non-availability of reliable
data e.g. percentage of trained teachers, absenteeism of teachers etc.
Continuity of PRSP-I institutional framework: The institutional framework for the
PRSP-I will continue to be retained with 171
reased capacity and role of PRSP Secretariat in inc
tracking output and outcome monitoring.
Aligned with MDGs: The framework has been completely aligned with MDGs (see
Annex V).
171
The PRSP Secretariat underpins the government's institutional mechanism for poverty monitoring. The PRSP Secretariat
has been mandated with the overall lead in coordinating, monitoring, evaluating, and tracking the implementation of the PRSP; and
reporting progress on anti-poverty public expenditures, intermediate social indicators, and final outcomes. A critical input in achieving
the targets set out in the PRSP is the effective utilization of anti-poverty public expenditures. The PRSP secretariat is regularly
tracking the budgetary and non-budgetary expenditures since FY 2001/02, and has so far generated 5 annual and 14 quarterly expenditure
profiles. The sixth annual report for FY 2007/08 is in the process and will be completed very soon.
303
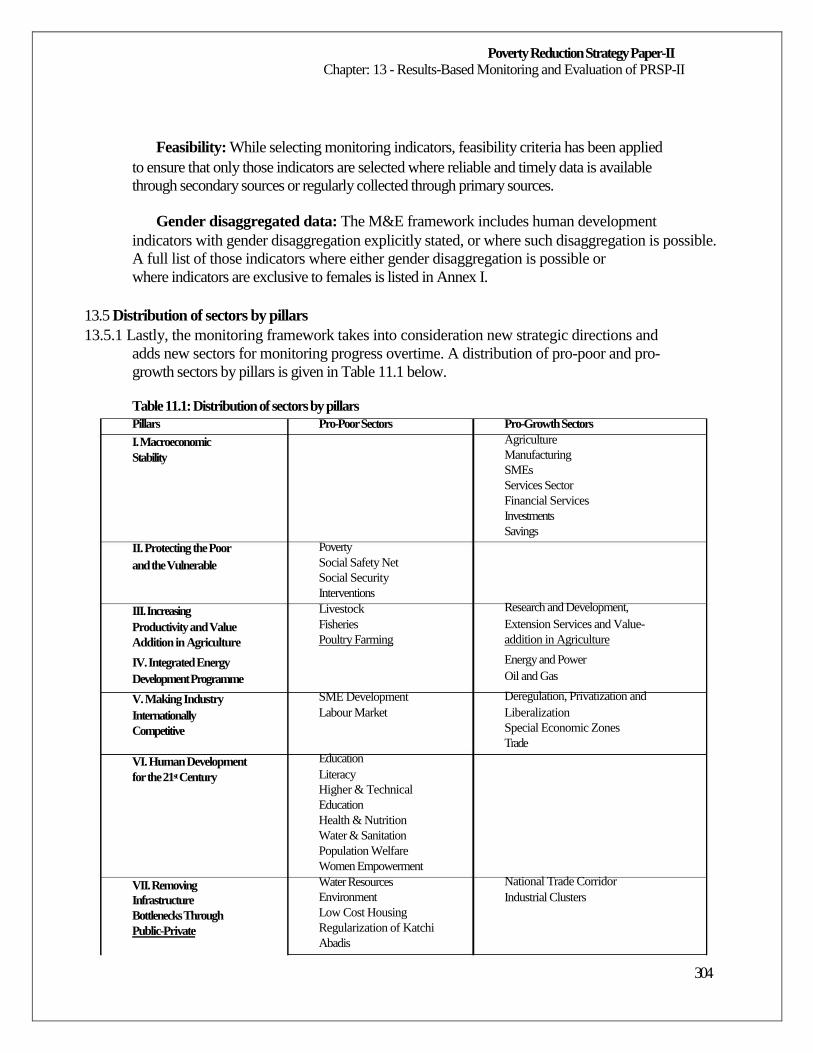
Poverty Reduction Strategy Paper-II Chapter: 13 - Results-Based Monitoring and Evaluation of PRSP-II
Feasibility: While selecting monitoring indicators, feasibility criteria has been applied
to ensure that only those indicators are selected where reliable and timely data is available
through secondary sources or regularly collected through primary sources.
Gender disaggregated data: The M&E framework includes human development
indicators with gender disaggregation explicitly stated, or where such disaggregation is possible.
A full list of those indicators where either gender disaggregation is possible or
where indicators are exclusive to females is listed in Annex I.
13.5 Distribution of sectors by pillars
13.5.1 Lastly, the monitoring framework takes into consideration new strategic directions and
adds new sectors for monitoring progress overtime. A distribution of pro-poor and pro-
growth sectors by pillars is given in Table 11.1 below.
Table 11.1: Distribution of sectors by pillars
Pillars
I. Macroeconomic Stability
II. Protecting the Poor and the Vulnerable
III. Increasing Productivity and Value Addition in Agriculture
IV. Integrated Energy Development Programme
V. Making Industry Internationally Competitive
VI. Human Development for the 21st Century
VII. Removing Infrastructure Bottlenecks Through Public-Private
Pro-Poor Sectors
Poverty Social Safety Net Social Security Interventions Livestock Fisheries Poultry Farming
SME Development Labour Market
Education Literacy Higher & Technical Education Health & Nutrition Water & Sanitation Population Welfare Women Empowerment Water Resources Environment Low Cost Housing Regularization of Katchi Abadis
Pro-Growth Sectors Agriculture Manufacturing SMEs Services Sector Financial Services Investments Savings
Research and Development, Extension Services and Value- addition in Agriculture
Energy and Power Oil and Gas
Deregulation, Privatization and Liberalization Special Economic Zones Trade
National Trade Corridor Industrial Clusters
304
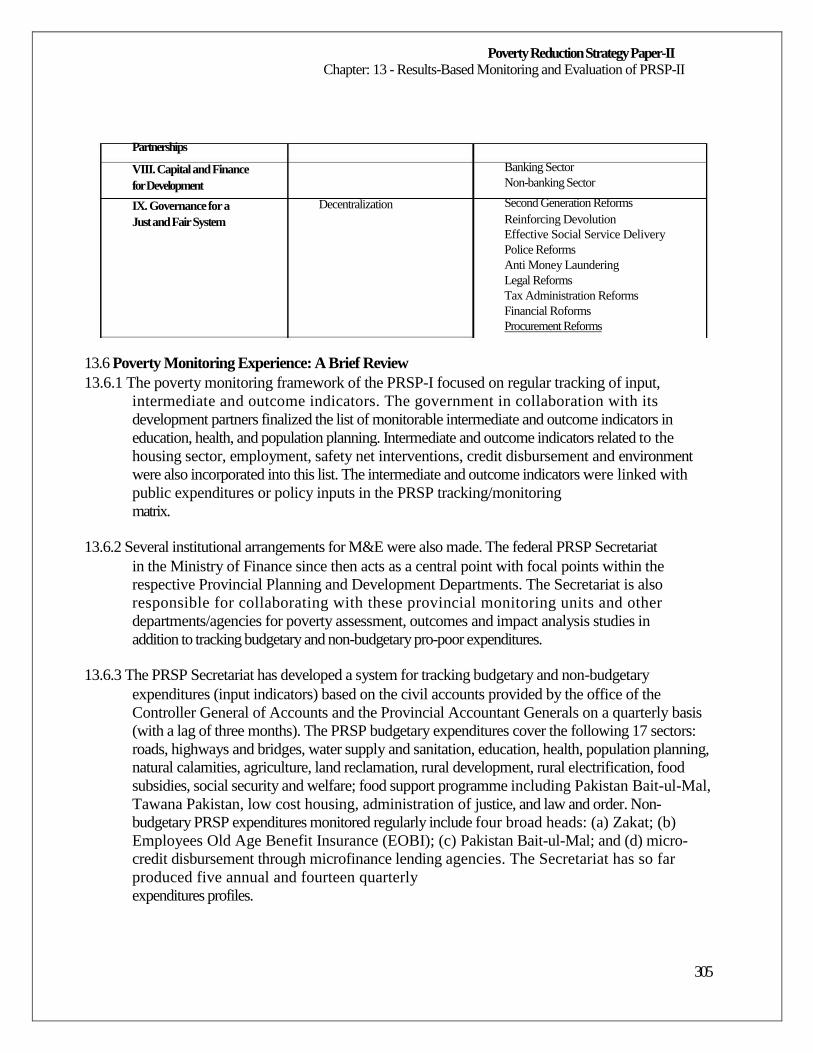
Poverty Reduction Strategy Paper-II Chapter: 13 - Results-Based Monitoring and Evaluation of PRSP-II
Partnerships
VIII. Capital and Finance for Development
IX. Governance for a Just and Fair System
Decentralization
Banking Sector Non-banking Sector
Second Generation Reforms Reinforcing Devolution Effective Social Service Delivery Police Reforms Anti Money Laundering Legal Reforms Tax Administration Reforms Financial Roforms Procurement Reforms
13.6 Poverty Monitoring Experience: A Brief Review
13.6.1 The poverty monitoring framework of the PRSP-I focused on regular tracking of input,
intermediate and outcome indicators. The government in collaboration with its
development partners finalized the list of monitorable intermediate and outcome indicators in
education, health, and population planning. Intermediate and outcome indicators related to the
housing sector, employment, safety net interventions, credit disbursement and environment
were also incorporated into this list. The intermediate and outcome indicators were linked with
public expenditures or policy inputs in the PRSP tracking/monitoring
matrix.
13.6.2 Several institutional arrangements for M&E were also made. The federal PRSP Secretariat
in the Ministry of Finance since then acts as a central point with focal points within the
respective Provincial Planning and Development Departments. The Secretariat is also
responsible for collaborating with these provincial monitoring units and other
departments/agencies for poverty assessment, outcomes and impact analysis studies in
addition to tracking budgetary and non-budgetary pro-poor expenditures.
13.6.3 The PRSP Secretariat has developed a system for tracking budgetary and non-budgetary
expenditures (input indicators) based on the civil accounts provided by the office of the
Controller General of Accounts and the Provincial Accountant Generals on a quarterly basis
(with a lag of three months). The PRSP budgetary expenditures cover the following 17 sectors:
roads, highways and bridges, water supply and sanitation, education, health, population planning,
natural calamities, agriculture, land reclamation, rural development, rural electrification, food
subsidies, social security and welfare; food support programme including Pakistan Bait-ul-Mal,
Tawana Pakistan, low cost housing, administration of justice, and law and order. Non-
budgetary PRSP expenditures monitored regularly include four broad heads: (a) Zakat; (b)
Employees Old Age Benefit Insurance (EOBI); (c) Pakistan Bait-ul-Mal; and (d) micro-
credit disbursement through microfinance lending agencies. The Secretariat has so far
produced five annual and fourteen quarterly
expenditures profiles.
305
Poverty Reduction Strategy Paper-II Chapter: 13 - Results-Based Monitoring and Evaluation of PRSP-II
13.6.4 For the monitoring of intermediate and outcome indicators, the PRSP secretariat relies on
several sources including: (i) Management Information Systems developed by the Ministry of
Education and the Ministry of Health; (ii) other relevant ministries/departments, such as
Ministry of Population, Ministry of Rural Development, Ministry of Religious Affairs and
Ministry of Environment; and (iii) the Pakistan Integrated Household Survey (PIHS) of the FBS
has been improved to track intermediate outputs to measure MDG outcomes every
third year. This renewed system is the PSLM survey instituted since FY 2004/05.
13.6.5 The PSLM follows the PIHS methodology in terms of questionnaire, sample design, and
definition of indicators every third year when FBS generated data comparable with the PIHS
series. In addition, it is geared to collect annual surveys to track intermediate indicators in
service delivery. However, there does remain the issue of tracking important
outcome indicators like nutrition (anthropometric measures), infant and child mortality.
13.6.6 Other sources of data report on intermediate indicators include administrative data from
education and health management information systems. These systems, however, require a
thorough assessment to ensure that they are equipped to collect quality input and output data and the
results reported from these sources are consistent with similar indicators that are collected by PSLM
in the relevant years. Such improvement in the reporting of these
intermediate indicators from these sources is yet to be undertaken. For example, in the
health sector the PRSP Progress Report FY 2004/05 reported data only for immunization and lady
health workers. Data on indicators related to governance and environment could not be provided
regularly by the relevant departments/ministries. Thus the monitoring of the broader set of
intermediate indicators also needs significant assessment and
improvements.
13.6.7 Based on the lessons learnt during the implementation of PRSP-I, there is the recognition
of the need to strengthen the existing monitoring mechanism, upgrade institutional
networks, improve coherence with sectoral management information systems, and
reinforce evaluation systems at provincial and district levels. With Pakistan's PRS now entering
its second cycle, a system-wide improvement in results-based M&E and its links
to inform policy are thus crucial.
13.6.8 The overall poverty monitoring experience showed that while significant progress was
made in finalizing indicators for monitoring different dimensions of programmes,
particularly in the pro-poor priority sectors where investments were made; data/information has been
available with varying degrees of regularity. The further strengthening of the
results- based M&E system is thus a priority for the PRSP-II.
13.6.9 In order to respond to this need, the Ministry of Finance and UNDP have instituted a joint
project titled 'Strengthening PRS Monitoring', with a total budget of US $6.487 million covering
the period 2008-12. The objective of the project is to strengthen institutional capacities for
results-based M&E of poverty reduction strategies at the federal and
provincial levels. Overall, the project will ensure improved capacity to formulate and
306
Poverty Reduction Strategy Paper-II Chapter: 13 - Results-Based Monitoring and Evaluation of PRSP-II
implement pro-poor policies, efficient and effective spending aimed at poverty reduction
and an integrated system which will enable precise comparison of past achievements with
future objectives. The project has the following three outputs:
Improvement in quality, collection, analysis and management of PRSP data at national
and provincial levels for effective tracking of PRSP targets.
Review of public spending and allocations in pro-poor sectors, and an analysis through
a gender lens172 to better understand the contribution and needs of men and women.
National engagement in PRSP monitoring mobilized through participatory processes.
13.7 Main Challenges and Issues 13.7.1 The challenge of designing and building a results-based M&E system is difficult. The
construction of such a system is a serious undertaking, and will not happen overnight.
However, it is not to be dismissed as being too complicated, too demanding, or too
sophisticated. A number of important challenges remain to be addressed on results-based
M&E during the strategy period. These are as follows:
Creation of a results-based M&E system requires interdependency, alignment, and
coordination across multiple government levels. This can be a challenge because,
provincial and district governments are loosely interconnected, and are still working toward
building strong administrative cultures and transparent financial systems. As a result,
governments may have only vague information about the amount and allocation of
available resources, and whether resources are, in fact, used for the purpose intended.
Measuring government performance in such an environment is an approximate exercise.
Most management information systems operate in isolation and there is no data warehouse
that collates all information from such administrative data to help compilation of various
indicators at a central level. This fragmentation is inefficient for gathering the required
information in a timely manner at a single source to facilitate monitoring. Obtaining the
relevant data requires close coordination between the information systems and the PRSP
Secretariat which exhibits room for improvement.
The devolution plan poses some challenges for poverty monitoring and for implementing
poverty reduction and social safety net programmes. Capacity constraints at the local level
are usually critical, especially in the under-developed and poor areas. The district
governments need to develop systems to monitor poverty at the local level. This strategy aims to
monitor the progress of both intermediate and outcome indicators at the province as well as district
levels. While it is not an easy task to develop this system for monitoring the intermediate and
outcome indicators at these sub national levels, the PSLM 2004/05 has
generated data which develops information at the district level.
172
Gender Responsive Budgeting Initiative (GRBI) Project (2005-07), housed in the Ministry of finance was initiated with the
technical and financial support of UNDP and its cost sharing donors. It aims at analysing the differential impacts of public expenditure
as well as revenue policy on women and girls, and men and boys, respectively. It also makes proposals for a reprioritization of expenditures and revenues which take into account the different needs and priorities of women and men.
307
Poverty Reduction Strategy Paper-II Chapter: 13 - Results-Based Monitoring and Evaluation of PRSP-II
Monitoring is not an end in itself. The real issue is effective follow-up and implementation
of remedial measures and reinforcement of accountability for results. Although M&E
capacity is developing, the coordination of the flow of relevant information to decision
makers still remains weak. Continuous dissemination of intermediate and outcome
indicators among stakeholders in order to ensure regular feedback to policy makers for
appropriate adjustment in policies is essential for more effective poverty reduction.
The key issue is the improvement of the quality and timely availability of data. Without
this, M&E will be rendered ineffective. Therefore this matter warrants a detailed
discussion. Such consideration is provided in the following section.
13.8 Improving the Quality and Availability of Data
13.8.1 During PRSP-II period increased emphasis shall be placed on improving sources and
quality of monitoring data. The household surveys and management information systems of the line
ministries shall be strengthened to provide timely data and fill certain data gaps
those can be filled in easily (see Annex III for details of data sources).
13.8.2 Some key additions and adjustments in the data sources will be as follows:
13.8.3 Household Surveys: In sum, PSLM, PDS/PDHS and Labour Force Survey (LFS) will be
the three major data sources for monitoring outcome indicators and will cover some
intermediate indicators as well. It must also be ensured that these surveys contain the
modules necessary to generate the data required for the common indicators of
MDGs/PRSP.
13.8.3.1 Pakistan Social and Living Standard Measurement (PSLM) Survey
13.8.3.1.1 The FBS launched the new PSLM in 2004. As PIHS, PSLM also collects household data at
the province and district level that is useful for the assessment of indicators that track access,
quality and use of service delivery. The new series has been designed to provide
data for the province and district-level social and economic indicators in alternate years, to help
assess development programmes initiated under PRSP-I.173 Five survey rounds of PSLM for
the period FY 2004/05 to FY 2008/09 have been planned. In 2004 both the
district and provincial level PSLM survey rounds were started simultaneously, and
completed in 2005. Since then PSLM survey was conducted in FY 2005/06 and in FY
2006-07, both providing national and provincial level data.
13.8.3.1.2 The sample for representative district level data is almost five times that for the provincial
level PSLM survey. Such a large sample size enables policymakers and researchers to draw
socioeconomic information that is representative at the district level. This will help meet
district level data requirements for planning purposes in the context of decentralization for
key intermediate indicators in service delivery.
173
The district-level PSLM is collected through the Core Welfare Indicator Questionnaire.
308
Poverty Reduction Strategy Paper-II Chapter: 13 - Results-Based Monitoring and Evaluation of PRSP-II
13.8.3.1.3 However, the PSLM survey is not sufficiently comprehensive for monitoring all MDG and
PRSP indicators. Some other MDG/PRSP indicators that the PSLM did not monitor, such as
maternal mortality, under five mortality and malnutrition need to be measured and these remain an
outstanding issue. The following indicators would need to be added to PSLM to
enhance its coverage of PRSP/MDG indicators:
Survival to grade 5
ANC/Assisted Deliveries
CPR by method (traditional vs modern methods)
13.8.3.2 Pakistan Demographic Survey (PDS)/Pakistan Demographic Health Survey (PDHS)
13.8.3.2.1 The Pakistan Demographic Survey (PDS) will be the main data source for population
growth, total fertility rate, and infant and child mortality. The PDS generates statistics on
births and deaths to estimate various measures of rural and urban fertility and mortality. It also helps
estimate the rate of natural increase in the population. Its sample size is almost double than that of
the HIES (Household Income and Expenditure Survey) or the PIHS —
more than 30,000 households — which is sufficient to provide reliable estimates of key
national and provincial variables.
13.8.3.2.2 However, some key elements are missing, such as data on children's height and weight
(required for monitoring malnutrition, an important MDG indicator). In addition to
collecting this information, the PDS/PDHS may also collect information on the height and weight
of women, in order to monitor their nutritional status. Moreover, the PDS/PDHS
would need to collect information on maternal mortality.
13.8.3.3 Labour Force Survey (LFS)
13.8.3.3.1 Benefits of income growth are transferred to the poor through enhanced employment
opportunities, and thus employment statistics need to be monitored regularly.
13.8.4
Management Information Systems (MIS): The PRSP intermediate indicators including
schools, teachers, student enrollments, utilization levels of health facilities and stock-outs
of essential medicines, identify the priority sectors as well as sub-sectors for resource
allocation. MDGs are primarily outcome indicators. Alignment of the MDGs with the
PRSP described in the previous section links the former with a well-defined set of
monitorable intermediate indicators. Thus real progress in these intermediate indicators is the key to
achieving the MDG/PRSP targets. The MIS' of different ministries/departments
and are the major source for monitoring the progress in intermediate indicators. The two major
systems in the social sector that have been formally designed and implemented are Health and
Education MIS' (HMIS and EMIS). However, with devolution, these systems
have gradually lost their effectiveness, as timely and adequate interventions have not been
made to adjust them to the new management setup. It is, therefore, important to invest in
rejuvenating the existing systems and in developing new MIS, especially at the local
government level. Such measures would not only improve the availability of disaggregated
309
Poverty Reduction Strategy Paper-II Chapter: 13 - Results-Based Monitoring and Evaluation of PRSP-II
data on output indicators, but also strengthen management capacity to enhance service
delivery as most services are delivered at the local level.
13.8.4.1 The MIS of a number of ministries also need to be strengthened or modified. This severely
limits a system of poverty monitoring which is highly based on the acquisition of regular,
reliable, and timely data/information.
13.8.5 Rebasing of indicators: A reliable baseline data of intermediate and outcome indicators is
crucial to set achievable targets for the future; to monitor the progress in these indicators; and to
evaluate the impact of policy inputs on the outcome/output indicators. For PRSP-I, 2000-01 was set
as the base year, and the data on both intermediate and outcome indicators was reported for this year in
the PRSP finalized in 2003. Using this baseline, the relevant ministries set the targets until FY
2005/06. In the PRSP-II, most indicators are, therefore,
based with FY 2005/06. Indicators are rebased with the 2005/06 for the following reasons:
13.8.5.1 First, PIHS was not carried out in FY 2000/01. So data on several outcome indicators was
based on secondary sources such as the relevant ministries/departments. The concepts and
definition used in these sources do not necessarily match those commonly used in PIHS type
household surveys. One such example is the baseline data on primary school enrolment.
The PRSP-I reported enrolment data from the Ministry of Education, and
targets were set on that basis. However, the Ministry had reported enrollment rates that
were considerably higher than the enrollment reported by PIHS. To avoid this
inconsistency, there is a need to rely on reliable and consistent sources for any particular
indicator.
13.8.5.2 Second, with the availability of data from the new series of PSLM, rebasing of indicators
seems to be preferable. This point is particularly relevant in the context of developing the
baseline data for provinces and ultimately extending it to all districts. This can be done only by
using the PSLM FY 2005/06 data. It thus makes sense to have a same basis for the
baseline data at the national as well as the province and district levels.
13.8.5.3 Third, PRSP-I did not report baseline data for certain sectors e.g. governance. Although all
the required data on governance indicators are still not available, partial data has enabled to setting up
of at least a partial baseline. Another area which needs careful data gathering is social safety net
programmes to ensure that under coverage, leakage rates can be measured to assess the efficiency of
targeting of the programmes. This would also need to include the new programmes like Benazir
Income Support Programme and Punjab Food Support
Scheme that have been recently launched (detailed explanation is given in chapter 5).
13.9
13.9.1
The Way Forward: Results-based M&E - PRSP-II
A new Statistics Law, strengthening autonomy and functioning of national statistical system, will be approved shortly for further strengthening of statistical system which will provide more reliable and timely economic and social data for policy analysis and
310
Poverty Reduction Strategy Paper-II Chapter: 13 - Results-Based Monitoring and Evaluation of PRSP-II
formulation. The amended draft law for the Pakistan Bureau of Statistics is at advanced
stages of approval.
13.9.2 The monitoring experience during PRSP-I has shown greater need for building institutional
capacities for an improved coordination and oversight of PRSP implementation, tracking
expenditures, and monitoring progress. The new monitoring framework is envisaged to ensure an
ongoing and sustainable system, developed to deliver timely and reliable data
against a set of well-defined indicators that feeds into the policy process and engages national
and sub-national levels. Without this essential capacity, the monitoring function will remain an
adhoc activity with varying degree of success over quality, timing and completeness of data
flowing in from different sources. To respond to the demands and to facilitate the understanding
and ownership of the PRSP process, a comprehensive organizational structure that: (a) links
the two tiers of the government; (b) has required
capacity to plan and implement monitoring agenda at the federal and provincial levels; with (c)
mechanisms mobilized at the federal and provincial levels to enhance technical
coordination for effective PRS monitoring, is required.
13.9.3 The PRS Monitoring Project has initiated revision of the current M&E framework
identified during the PRSP-I term (2003-06). With Pakistan's Poverty Reduction Strategy having
entered its second cycle, a system-wide improvement in impact assessment is being processed. A
PRS Monitoring Secretariat has been established in Punjab and will soon be set-up in the rest of
the provinces. The federal PRS Secretariat is responsible for ensuring
coordination with the Technical Working Groups (TWGs) and convening of their meetings
as and when required. The meetings of six Technical Working Groups were held to get
feedback from the relevant policy makers in the finalization of monitorable indicators for key
sectors such as education, health, labour/employment, gender, environment/water
supply & sanitation, and social safety net etc. The TWGs on other pro-poor sectors will be
held in the later stages as and when required.
13.9.4 The decentralization process has now been underway for five years in Pakistan. One of the
main objectives of results-based M&E under this strategy is to increase the degree of
participation and ownership of monitoring mechanism by the provincial and district
governments. Provincial PRSP Secretariats will be strengthened, and districts will be
involved in the monitoring process. As a first step, baseline data for the indicators will be
developed at the province as well as district levels. The PSLM FY 2005/06 data will be
utilized for this purpose. Since PSLM FY 2005/06 covers only provincial level data, the
decision regarding district level data to be undertaken later on. Provinces and districts will
be encouraged to set their own targets.
13.9.5 The PRSP expenditure tracking exercise will measure the achievement of certain key
outcome targets. However, in the last three years, only a few studies were carried out to evaluate
the impact of the policy inputs and expenditures on poverty reduction or other
identified outcome indicators. In FY 2005/06 the Government of Pakistan in conjunction
with the UK Department for International Development (DFID) decided to conduct a
311
Poverty Reduction Strategy Paper-II Chapter: 13 - Results-Based Monitoring and Evaluation of PRSP-II
Poverty and Social Impact Analysis (PSIA)174 of its microfinance policies. The PSIA
validates that the MF sector in Pakistan is now in a position to consolidate the gains it has
made during the years since the passing of the MF Ordinance in 2001, and is ready to
embark on a major expansion in size and scope, given the right conditions. In terms of size, the
analysis confirms that there is a scope for a major expansion in the number of beneficiaries
in the next decade, from hundreds of thousands to millions. However, being a late starter, Pakistan
still has some way to go compared with most of its neighbours in
terms of the depth of the financial sector as a whole and the reach of the banking sector,
especially in relation to access by low-income households and micro enterprises.
13.9.6 More impact studies are needed to make efficient use of resources being expanded. The
PRSP Secretariat plans to conduct more PSIAs on various sectors, such as energy, social
safety nets, etc. to analyze the impact of policies on poverty reduction.
13.9.7 The monitoring indicators will be rebased to make them more relevant and to increase their
congruence with the availability of new data series. The main features of the proposed
rebasing are as follows:
Since the Strategy is a rolling plan for the next three years, the targets using the new
baseline data will be set for the terminal fiscal year 2010/11. The MDG targets for 2015
will be aligned with them;
Targets have been set by the relevant ministries/department, showing their ownership to
achieve them in a given period of time;
Following the alignment with MDGs, both outcome and intermediate indicators has been
rebased; and
For the outcome indicators, the major source for rebasing is the PSLM FY 2005/06.
However, since this source does not provide information on all variables, as discussed
earlier, the Planning Commission has attempted to fill some gaps in the 2005 MDG report.
The Planning Commission estimates will be adjusted when the results of latest PDS/PDHS
are available.
13.9.8
13.9.9
The success of PRS monitoring system closely tied to the development of budget planning and public expenditure management systems, which is currently in progress here and at an early stage.
The functioning of quality medium term expenditure framework (MTEF) is very critical here. Special efforts to strengthen this system during the PRSP-II are discussed
later in the chapter.
Designing and building a reporting system that can produce trustworthy, timely, and
relevant information on the performance of projects, programmes, and policies requires
174
The PSIAs are simply analytical exercises that attempt to understand the likely poverty and social impact of particular
policy choices. The PSIAs often draw on a wide range of analytical tools and data sources in attempting to understand policy impact.
These tools range from those that are highly qualitative and participatory, to those that are quantitative and often driven by economic theory.
312
Poverty Reduction Strategy Paper-II Chapter: 13 - Results-Based Monitoring and Evaluation of PRSP-II
experience, skill and real institutional capacity. Building such capacity for these systems is
a long term effort and many initiatives in this regard need to be undertaken during the
PRSP-II.
13.9.10 The earlier quarterly progress reporting of indicators will remain same but for some
indicators the reporting will be half-yearly. The focus will be more on the analysis of
policy inputs and expenditures and intermediate indicators. The progress in the outcome indicators
will be primarily reported whenever the results of the three identified household
surveys—PSLM, PDS and LFS—are available.
13.9.11 Statistical systems are meant to encompass both FBS and other producers of statistics,
including provincial governments' and district governments. Generally, there is a disconnect
between the central agencies and the wider system, which often results in gaps and redundancies. The
peripheral agencies also typically perform less well than the central ones, resulting in the
weaknesses in administrative data mentioned elsewhere above. An analysis of the availability of
statistics for monitoring the MDGs identifies the peripheral
agencies as the weakest part of the system. This area requires special attention of the policy
makers for extra measures in this regard during the PRSP-II period.
13.9.12 The production of specific outputs and their dissemination is a major weakness in the PRS
monitoring systems. Generally monitoring systems are focused mainly on the production of an annual
progress report. Under the PRSP, the annual progress report is an opportunity to
review and update the PRS on a regular basis. In practice, these reports are typically not
being used this way. They tend to have weak analytical content and, in the first PRS cycle,
are often produced in adhoc manners which do not draw on the monitoring system. It is important
to ensure that the outputs of the PRS monitoring system are appropriate to the
needs of the national policy process. Activity to Output Based Monitoring (ATOM) System would
be introduced during PRSP II for more analytical and higher level analysis for the
policy makers.
13.9.13 Creating a link between PRS monitoring and the budget process is a critical objective for a
PRS monitoring system. The need to access public resources creates powerful incentives
across all public agencies and provides the most promising hook for creating demand for effective
monitoring. Moreover, unless this link is established, the PRS monitoring system
will fail to meet its central objective of information-based decision making because budgets are the
central mechanism for policy implementation. The M&E matrices for poverty and
the nine pillars of the PRSP-II are given below.
313
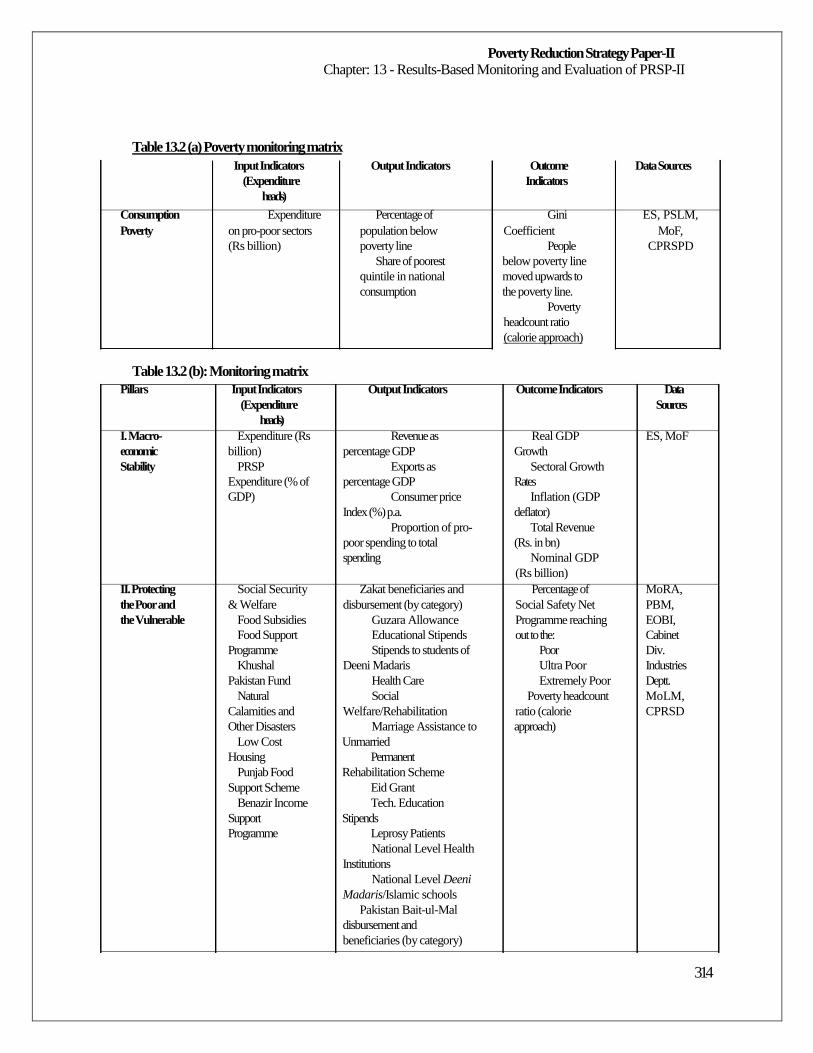
Poverty Reduction Strategy Paper-II Chapter: 13 - Results-Based Monitoring and Evaluation of PRSP-II
Table 13.2 (a) Poverty monitoring matrix
Input Indicators Output Indicators Outcome Data Sources (Expenditure Indicators
heads)
Consumption Expenditure Percentage of Gini ES, PSLM, Poverty on pro-poor sectors population below Coefficient MoF,
(Rs billion) poverty line People CPRSPD Share of poorest below poverty line
quintile in national moved upwards to consumption the poverty line.
Poverty headcount ratio (calorie approach)
Table 13.2 (b): Monitoring matrix
Pillars Input Indicators Output Indicators Outcome Indicators Data (Expenditure Sources
heads) I. Macro- Expenditure (Rs Revenue as Real GDP ES, MoF economic billion) percentage GDP Growth Stability PRSP Exports as Sectoral Growth
Expenditure (% of percentage GDP Rates GDP) Consumer price Inflation (GDP
Index (%) p.a. deflator) Proportion of pro- Total Revenue
poor spending to total (Rs. in bn) spending Nominal GDP
(Rs billion) II. Protecting Social Security Zakat beneficiaries and Percentage of MoRA, the Poor and & Welfare disbursement (by category) Social Safety Net PBM, the Vulnerable Food Subsidies Guzara Allowance Programme reaching EOBI,
Food Support Educational Stipends out to the: Cabinet Programme Stipends to students of Poor Div.
Khushal Deeni Madaris Ultra Poor Industries Pakistan Fund Health Care Extremely Poor Deptt.
Natural Social Poverty headcount MoLM, Calamities and Welfare/Rehabilitation ratio (calorie CPRSD Other Disasters Marriage Assistance to approach)
Low Cost Unmarried Housing Permanent
Punjab Food Rehabilitation Scheme Support Scheme Eid Grant
Benazir Income Tech. Education Support Stipends Programme Leprosy Patients
National Level Health Institutions
National Level Deeni Madaris/Islamic schools
Pakistan Bait-ul-Mal disbursement and beneficiaries (by category)
314
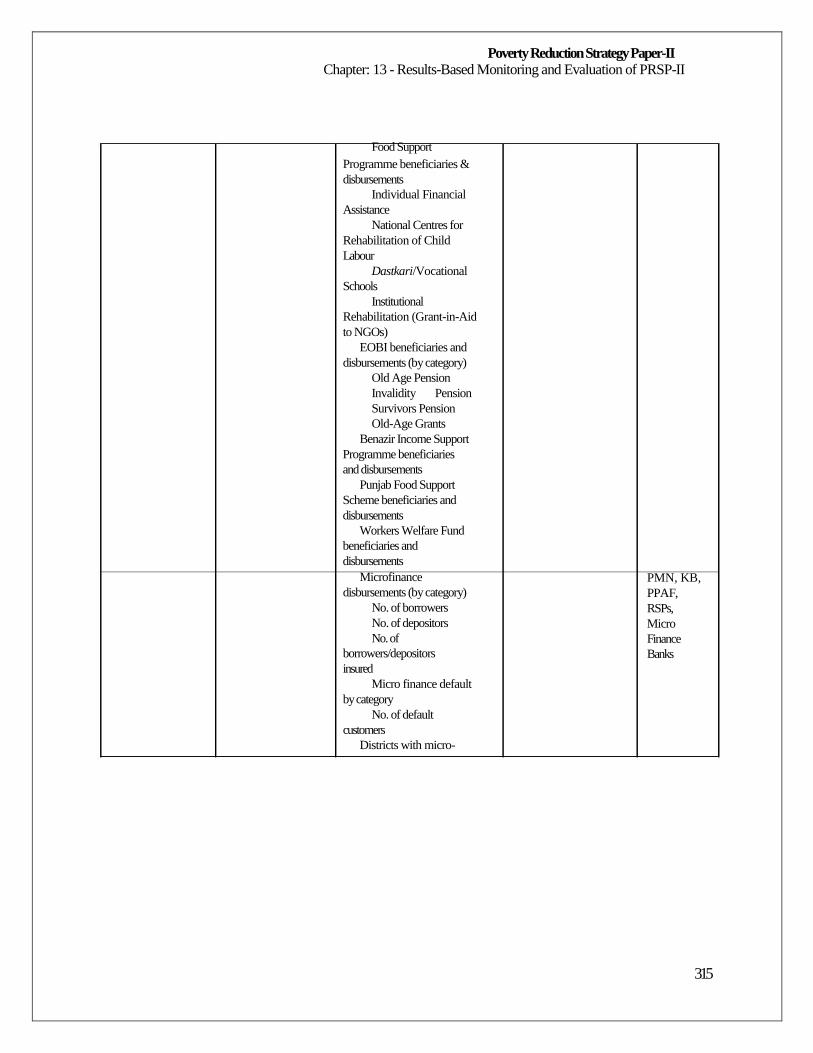
Poverty Reduction Strategy Paper-II Chapter: 13 - Results-Based Monitoring and Evaluation of PRSP-II
Food Support Programme beneficiaries & disbursements
Individual Financial Assistance
National Centres for Rehabilitation of Child Labour
Dastkari/Vocational Schools
Institutional Rehabilitation (Grant-in-Aid to NGOs)
EOBI beneficiaries and disbursements (by category)
Old Age Pension Invalidity Pension
Survivors Pension Old-Age Grants
Benazir Income Support Programme beneficiaries and disbursements
Punjab Food Support Scheme beneficiaries and disbursements
Workers Welfare Fund beneficiaries and disbursements
Microfinance disbursements (by category)
No. of borrowers No. of depositors No. of
borrowers/depositors insured
Micro finance default by category
No. of default customers
Districts with micro-
PMN, KB, PPAF, RSPs, Micro Finance Banks
315
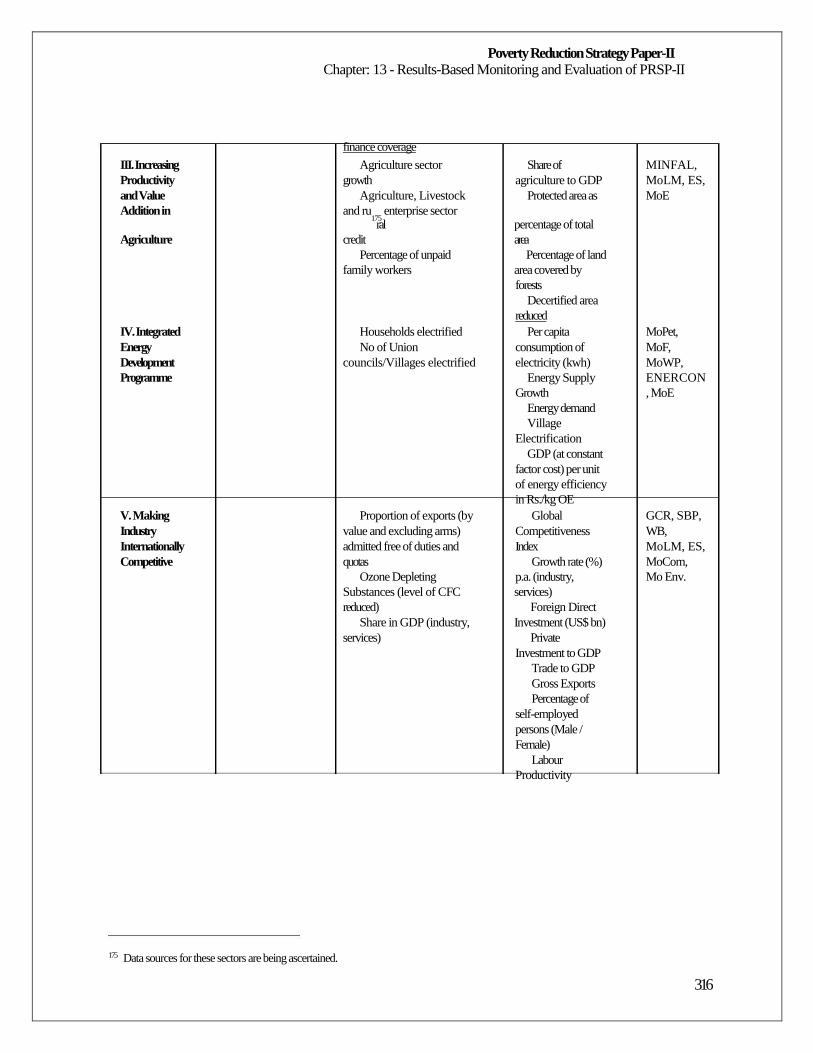
Poverty Reduction Strategy Paper-II Chapter: 13 - Results-Based Monitoring and Evaluation of PRSP-II
finance coverage III. Increasing Agriculture sector Share of MINFAL, Productivity growth agriculture to GDP MoLM, ES, and Value Agriculture, Livestock Protected area as MoE Addition in and ru
175 enterprise sector
ral percentage of total Agriculture credit area
Percentage of unpaid Percentage of land family workers area covered by
forests Decertified area
reduced IV. Integrated Households electrified Per capita MoPet, Energy No of Union consumption of MoF, Development councils/Villages electrified electricity (kwh) MoWP, Programme Energy Supply ENERCON
Growth , MoE Energy demand Village
Electrification GDP (at constant
factor cost) per unit of energy efficiency in Rs./kg OE
V. Making Proportion of exports (by Global GCR, SBP, Industry value and excluding arms) Competitiveness WB, Internationally admitted free of duties and Index MoLM, ES, Competitive quotas Growth rate (%) MoCom,
Ozone Depleting p.a. (industry, Mo Env. Substances (level of CFC services) reduced) Foreign Direct
Share in GDP (industry, Investment (US$ bn) services) Private
Investment to GDP Trade to GDP Gross Exports Percentage of
self-employed persons (Male / Female)
Labour Productivity
175
Data sources for these sectors are being ascertained.
316
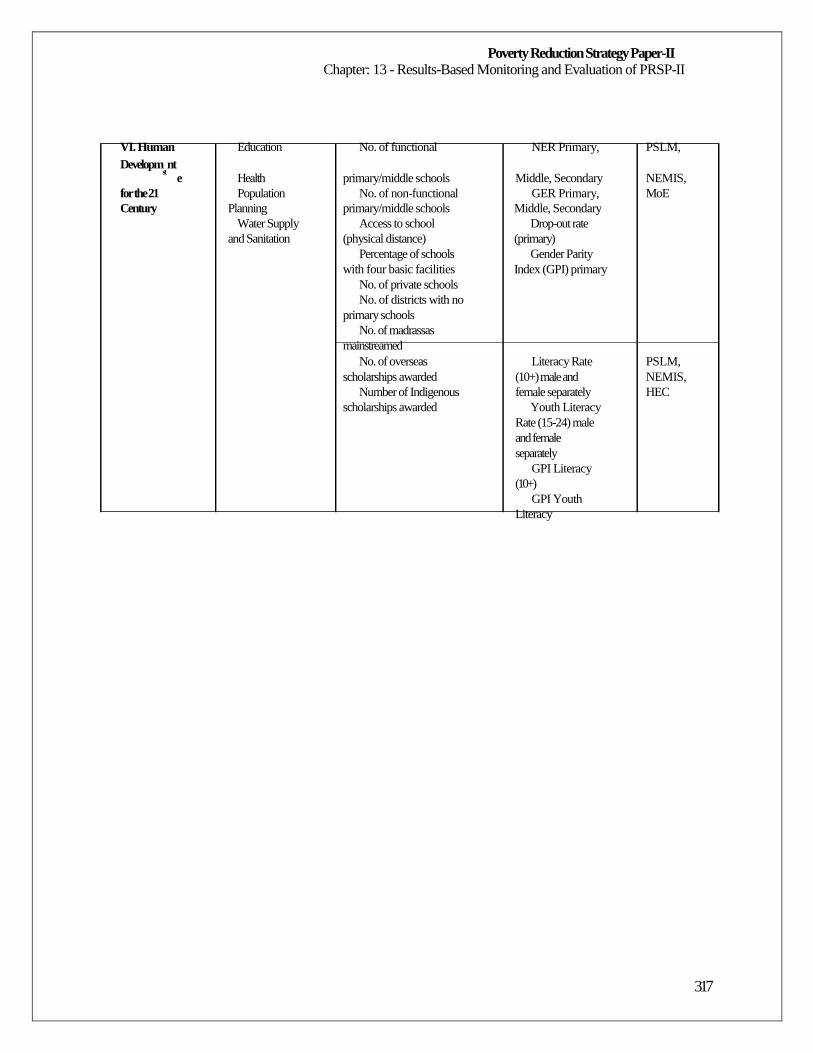
Poverty Reduction Strategy Paper-II Chapter: 13 - Results-Based Monitoring and Evaluation of PRSP-II
VI. Human Education No. of functional NER Primary, PSLM, Developm
st nt
e Health primary/middle schools Middle, Secondary NEMIS, for the 21 Population No. of non-functional GER Primary, MoE Century Planning primary/middle schools Middle, Secondary
Water Supply Access to school Drop-out rate and Sanitation (physical distance) (primary)
Percentage of schools Gender Parity with four basic facilities Index (GPI) primary
No. of private schools No. of districts with no
primary schools No. of madrassas
mainstreamed No. of overseas Literacy Rate PSLM,
scholarships awarded (10+) male and NEMIS, Number of Indigenous female separately HEC
scholarships awarded Youth Literacy Rate (15-24) male and female separately
GPI Literacy (10+)
GPI Youth Literacy
317
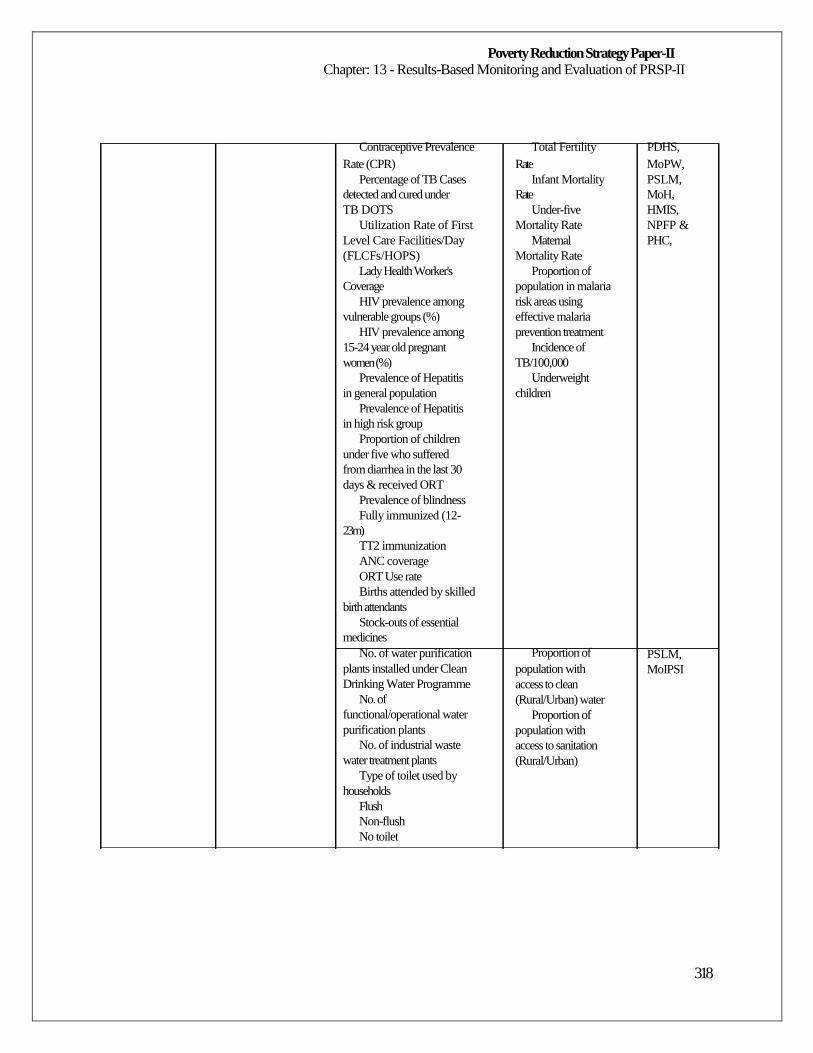
Poverty Reduction Strategy Paper-II Chapter: 13 - Results-Based Monitoring and Evaluation of PRSP-II
Contraceptive Prevalence Rate (CPR)
Percentage of TB Cases detected and cured under TB DOTS
Utilization Rate of First Level Care Facilities/Day (FLCFs/HOPS)
Lady Health Worker's Coverage
HIV prevalence among vulnerable groups (%)
HIV prevalence among 15-24 year old pregnant women (%)
Prevalence of Hepatitis in general population
Prevalence of Hepatitis in high risk group
Proportion of children under five who suffered from diarrhea in the last 30 days & received ORT
Prevalence of blindness Fully immunized (12-
23m) TT2 immunization ANC coverage ORT Use rate Births attended by skilled
birth attendants Stock-outs of essential
medicines No. of water purification
plants installed under Clean Drinking Water Programme
No. of functional/operational water purification plants
No. of industrial waste water treatment plants
Type of toilet used by households
Flush Non-flush No toilet
Total Fertility Rate
Infant Mortality Rate
Under-five Mortality Rate
Maternal Mortality Rate
Proportion of population in malaria risk areas using effective malaria prevention treatment
Incidence of TB/100,000
Underweight children
Proportion of population with access to clean (Rural/Urban) water
Proportion of population with access to sanitation (Rural/Urban)
PDHS, MoPW, PSLM, MoH, HMIS, NPFP & PHC, PSLM, MoIPSI
318
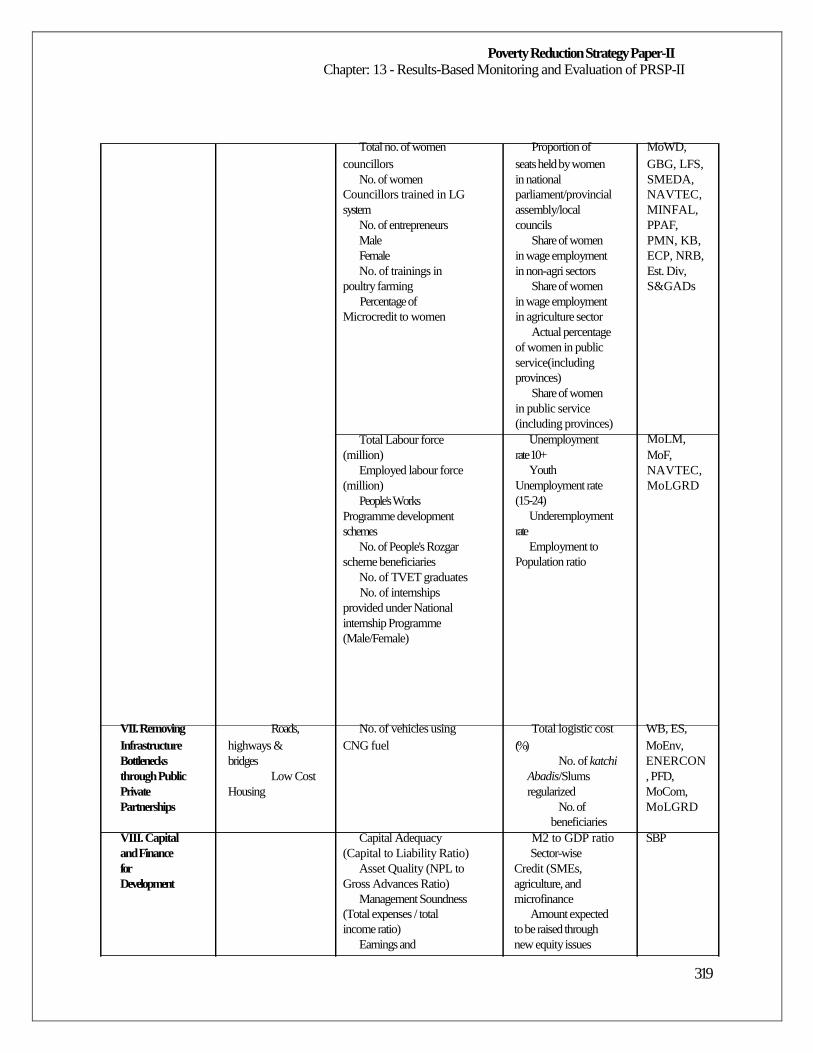
Poverty Reduction Strategy Paper-II Chapter: 13 - Results-Based Monitoring and Evaluation of PRSP-II
Total no. of women councillors
No. of women Councillors trained in LG system
No. of entrepreneurs Male Female No. of trainings in
poultry farming Percentage of
Microcredit to women
Total Labour force (million)
Employed labour force (million)
People's Works Programme development schemes
No. of People's Rozgar scheme beneficiaries
No. of TVET graduates No. of internships
provided under National internship Programme (Male/Female)
Proportion of seats held by women in national parliament/provincial assembly/local councils
Share of women in wage employment in non-agri sectors
Share of women in wage employment in agriculture sector
Actual percentage of women in public service(including provinces)
Share of women in public service (including provinces)
Unemployment rate 10+
Youth Unemployment rate (15-24)
Underemployment rate
Employment to Population ratio
MoWD, GBG, LFS, SMEDA, NAVTEC, MINFAL, PPAF, PMN, KB, ECP, NRB, Est. Div, S&GADs
MoLM, MoF, NAVTEC, MoLGRD
VII. Removing Roads, No. of vehicles using Total logistic cost WB, ES, Infrastructure highways & CNG fuel (%) MoEnv, Bottlenecks bridges No. of katchi ENERCON through Public Low Cost Abadis/Slums , PFD, Private Housing regularized MoCom, Partnerships No. of MoLGRD
beneficiaries VIII. Capital Capital Adequacy M2 to GDP ratio SBP and Finance (Capital to Liability Ratio) Sector-wise for Asset Quality (NPL to Credit (SMEs, Development Gross Advances Ratio) agriculture, and
Management Soundness microfinance (Total expenses / total Amount expected income ratio) to be raised through
Earnings and new equity issues
319
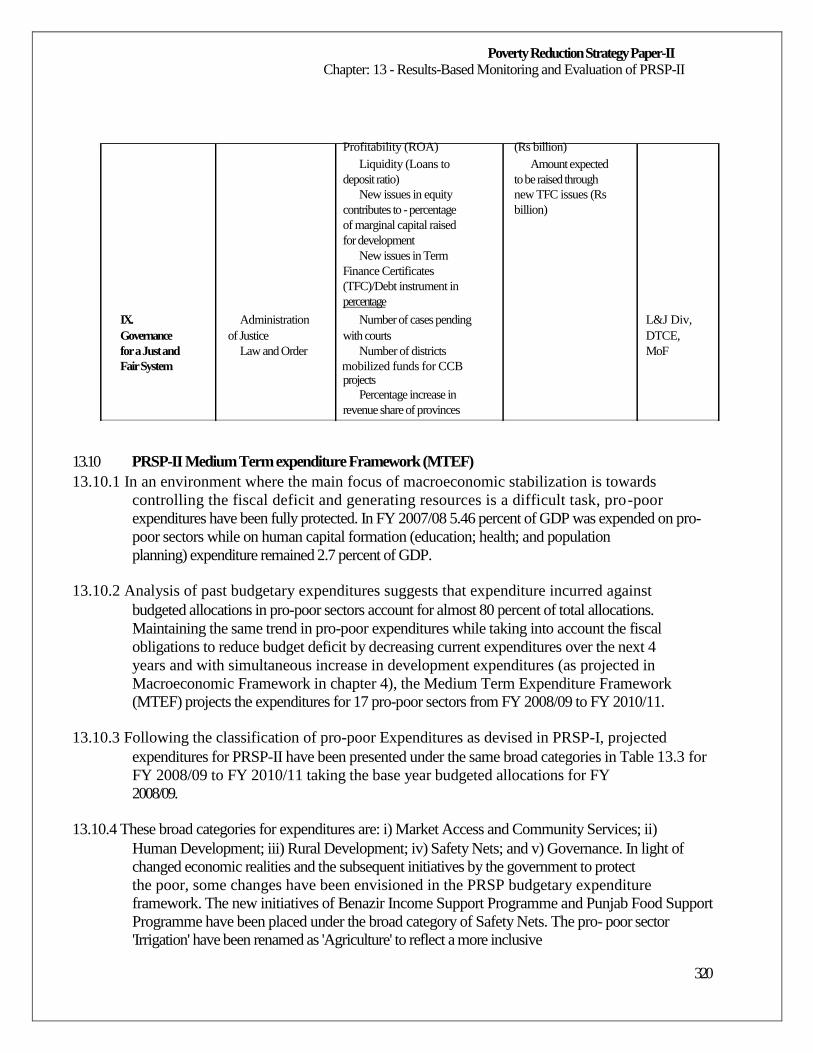
Poverty Reduction Strategy Paper-II Chapter: 13 - Results-Based Monitoring and Evaluation of PRSP-II
Profitability (ROA) (Rs billion) Liquidity (Loans to Amount expected
deposit ratio) to be raised through New issues in equity new TFC issues (Rs
contributes to - percentage billion) of marginal capital raised for development
New issues in Term Finance Certificates (TFC)/Debt instrument in percentage
IX. Administration Number of cases pending L&J Div, Governance of Justice with courts DTCE, for a Just and Law and Order Number of districts MoF Fair System mobilized funds for CCB
projects Percentage increase in
revenue share of provinces
13.10 PRSP-II Medium Term expenditure Framework (MTEF)
13.10.1 In an environment where the main focus of macroeconomic stabilization is towards
controlling the fiscal deficit and generating resources is a difficult task, pro-poor
expenditures have been fully protected. In FY 2007/08 5.46 percent of GDP was expended on pro-
poor sectors while on human capital formation (education; health; and population
planning) expenditure remained 2.7 percent of GDP.
13.10.2 Analysis of past budgetary expenditures suggests that expenditure incurred against
budgeted allocations in pro-poor sectors account for almost 80 percent of total allocations.
Maintaining the same trend in pro-poor expenditures while taking into account the fiscal
obligations to reduce budget deficit by decreasing current expenditures over the next 4
years and with simultaneous increase in development expenditures (as projected in
Macroeconomic Framework in chapter 4), the Medium Term Expenditure Framework
(MTEF) projects the expenditures for 17 pro-poor sectors from FY 2008/09 to FY 2010/11.
13.10.3 Following the classification of pro-poor Expenditures as devised in PRSP-I, projected
expenditures for PRSP-II have been presented under the same broad categories in Table 13.3 for
FY 2008/09 to FY 2010/11 taking the base year budgeted allocations for FY
2008/09.
13.10.4 These broad categories for expenditures are: i) Market Access and Community Services; ii)
Human Development; iii) Rural Development; iv) Safety Nets; and v) Governance. In light of
changed economic realities and the subsequent initiatives by the government to protect
the poor, some changes have been envisioned in the PRSP budgetary expenditure
framework. The new initiatives of Benazir Income Support Programme and Punjab Food Support
Programme have been placed under the broad category of Safety Nets. The pro- poor sector
'Irrigation' have been renamed as 'Agriculture' to reflect a more inclusive
320
Poverty Reduction Strategy Paper-II Chapter: 13 - Results-Based Monitoring and Evaluation of PRSP-II
picture of expenditure incurred in the agriculture sector. This amended sector includes
budgetary expenditure details regarding Livestock, Fisheries and Forestry in addition to
Irrigation. Similarly the pro-poor sector 'Subsidies' now incorporates a larger account of
subsidies being provided by the government including subsidies for financial and fiscal affairs
(dairy, Utility Stores Corporation for sale of wheat); commercial affairs (oil, electricity); and
food. While the subsidies on fuel and power are going to be phased out during FY 2009, therefore
the total projected amount of subsidies for PRSP-II duration is capped at Rs 145 billion so that it
can capture any abnormal deviation in international
prices of wheat and sugar, etc.
13.10.5 It is also imperative to explain that prior to PRSP-II, under the head, Governance;
Administration of Justice included only the expenditures for subordinate judiciary but
during PRSP-II the expenditures will be tracked for all tiers of the Judiciary. Similarly only
development expenditures were tracked under Law and Order, but now current
expenditures have also been included as they reflect the costs being borne by the people
owing to the 'War on Terror.'
13.10.6 The PRSP expenditures do not capture a large quantum of the development as well as
current expenditures that do directly or indirectly contribute to poverty alleviation. These include
expenditures on highways, power, information technology and telecommunication, women
development, environment, railways, oil and gas, and works, etc. Despite the
above, the size of pro-poor expenditures is expected to be higher than previous years, given the
substantial increase in the PSDP in the coming years as reflected in in chapter 4. Therefore,
any analysis of pro-expenditures in the country must not restrict itself to PRSP expenditures alone.
Additionally, a large amount is being spent on poverty alleviation through NGOs,
development partners, and philanthropy, which are not captured in the
PRSP budgetary or non-budgetary expenditures.
13.10.7 In view of the above cited M&E mechanisms and identified issues, a detailed M&E plan
under the Strengthening PRS Monitoring project will be developed during the first quarter
(January-March 2009). The proposed M&E plan will consist of the key deliverables,
specific activities, timeframe, required recourses (both financial and human) and
responsibilities (key partners to be involved and accountable for, to implement the
identified activities and produce the deliverables on time).
321
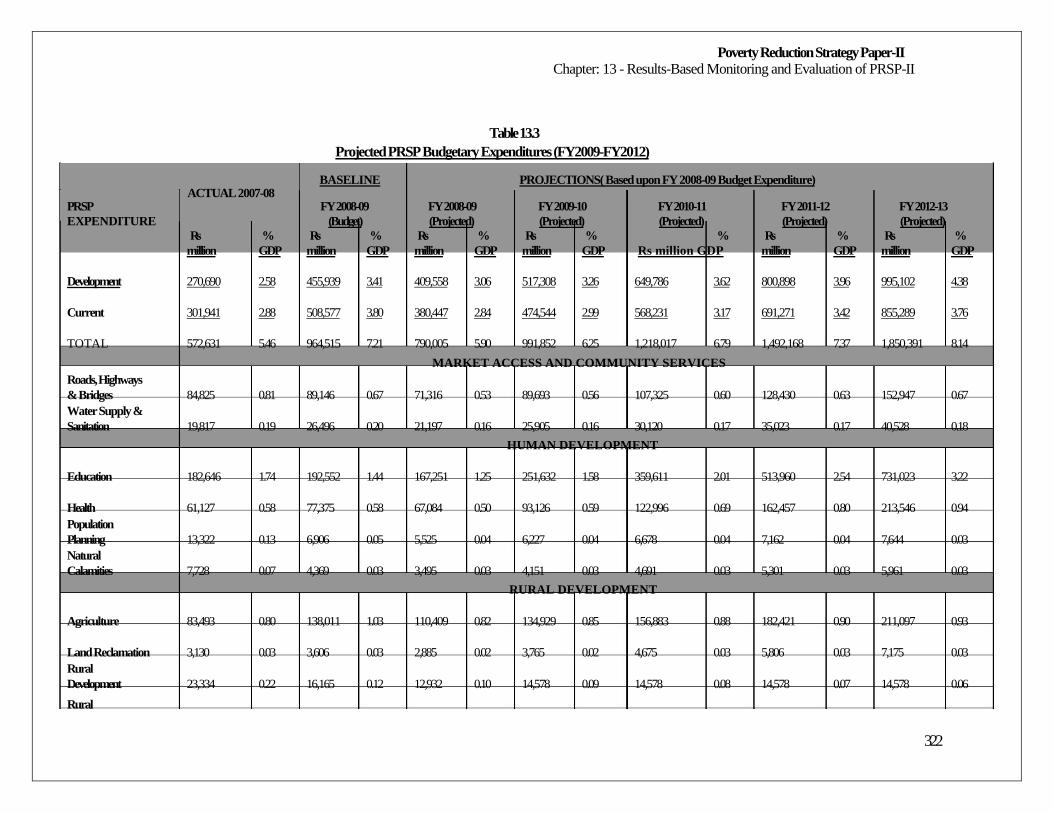
Poverty Reduction Strategy Paper-II Chapter: 13 - Results-Based Monitoring and Evaluation of PRSP-II
Table 13.3
Projected PRSP Budgetary Expenditures (FY2009-FY2012)
BASELINE PROJECTIONS( Based upon FY 2008-09 Budget Expenditure) ACTUAL 2007-08
PRSP FY 2008-09 FY 2008-09 FY 2009-10 FY 2010-11 FY 2011-12 FY 2012-13 EXPENDITURE (Budget) (Projected) (Projected) (Projected) (Projected) (Projected)
Rs % Rs % Rs % Rs % % Rs % Rs %
million GDP million GDP million GDP million GDP Rs million GDP million GDP million GDP
Development 270,690 2.58 455,939 3.41 409,558 3.06 517,308 3.26 649,786 3.62 800,898 3.96 995,102 4.38
Current 301,941 2.88 508,577 3.80 380,447 2.84 474,544 2.99 568,231 3.17 691,271 3.42 855,289 3.76
TOTAL 572,631 5.46 964,515 7.21 790,005 5.90 991,852 6.25 1,218,017 6.79 1,492,168 7.37 1,850,391 8.14
MARKET ACCESS AND COMMUNITY SERVICES Roads, Highways & Bridges 84,825 0.81 89,146 0.67 71,316 0.53 89,693 0.56 107,325 0.60 128,430 0.63 152,947 0.67 Water Supply & Sanitation 19,817 0.19 26,496 0.20 21,197 0.16 25,905 0.16 30,120 0.17 35,023 0.17 40,528 0.18
HUMAN DEVELOPMENT
Education 182,646 1.74 192,552 1.44 167,251 1.25 251,632 1.58 359,611 2.01 513,960 2.54 731,023 3.22
Health 61,127 0.58 77,375 0.58 67,084 0.50 93,126 0.59 122,996 0.69 162,457 0.80 213,546 0.94 Population Planning 13,322 0.13 6,906 0.05 5,525 0.04 6,227 0.04 6,678 0.04 7,162 0.04 7,644 0.03 Natural Calamities 7,728 0.07 4,369 0.03 3,495 0.03 4,151 0.03 4,691 0.03 5,301 0.03 5,961 0.03
RURAL DEVELOPMENT
Agriculture 83,493 0.80 138,011 1.03 110,409 0.82 134,929 0.85 156,883 0.88 182,421 0.90 211,097 0.93
Land Reclamation 3,130 0.03 3,606 0.03 2,885 0.02 3,765 0.02 4,675 0.03 5,806 0.03 7,175 0.03 Rural Development 23,334 0.22 16,165 0.12 12,932 0.10 14,578 0.09 14,578 0.08 14,578 0.07 14,578 0.06
Rural
322
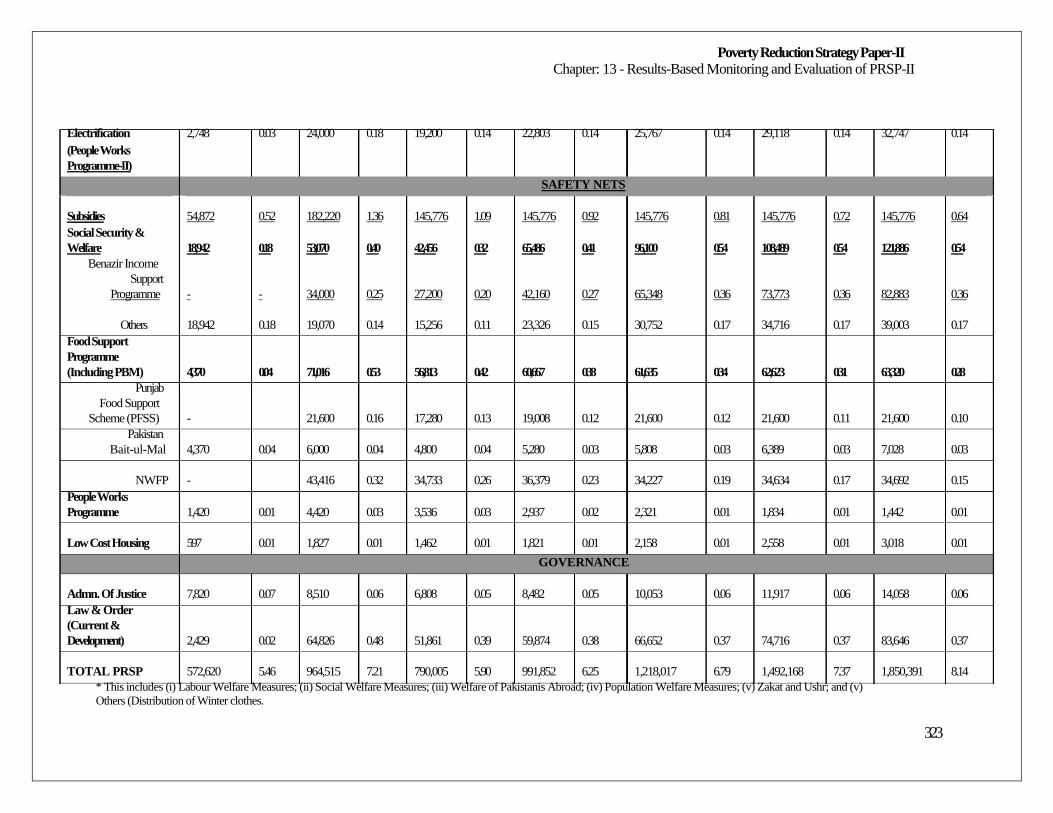
Poverty Reduction Strategy Paper-II Chapter: 13 - Results-Based Monitoring and Evaluation of PRSP-II
Electrification 2,748 0.03 24,000 0.18 19,200 0.14 22,803 0.14 25,767 0.14 29,118 0.14 32,747 0.14 (People Works Programme-II)
SAFETY NETS
Subsidies 54,872 0.52 182,220 1.36 145,776 1.09 145,776 0.92 145,776 0.81 145,776 0.72 145,776 0.64 Social Security & Welfare 18,942 0.18 53,070 0.40 42,456 0.32 65,486 0.41 96,100 0.54 108,489 0.54 121,886 0.54
Benazir Income Support
Programme - - 34,000 0.25 27,200 0.20 42,160 0.27 65,348 0.36 73,773 0.36 82,883 0.36
Others 18,942 0.18 19,070 0.14 15,256 0.11 23,326 0.15 30,752 0.17 34,716 0.17 39,003 0.17 Food Support Programme (Including PBM) 4,370 0.04 71,016 0.53 56,813 0.42 60,667 0.38 61,635 0.34 62,623 0.31 63,320 0.28
Punjab Food Support
Scheme (PFSS) - 21,600 0.16 17,280 0.13 19,008 0.12 21,600 0.12 21,600 0.11 21,600 0.10 Pakistan
Bait-ul-Mal 4,370 0.04 6,000 0.04 4,800 0.04 5,280 0.03 5,808 0.03 6,389 0.03 7,028 0.03
NWFP - 43,416 0.32 34,733 0.26 36,379 0.23 34,227 0.19 34,634 0.17 34,692 0.15 People Works Programme 1,420 0.01 4,420 0.03 3,536 0.03 2,937 0.02 2,321 0.01 1,834 0.01 1,442 0.01
Low Cost Housing 597 0.01 1,827 0.01 1,462 0.01 1,821 0.01 2,158 0.01 2,558 0.01 3,018 0.01
GOVERNANCE
Admn. Of Justice 7,820 0.07 8,510 0.06 6,808 0.05 8,482 0.05 10,053 0.06 11,917 0.06 14,058 0.06 Law & Order (Current & Development) 2,429 0.02 64,826 0.48 51,861 0.39 59,874 0.38 66,652 0.37 74,716 0.37 83,646 0.37
TOTAL PRSP 572,620 5.46 964,515 7.21 790,005 5.90 991,852 6.25 1,218,017 6.79 1,492,168 7.37 1,850,391 8.14
* This includes (i) Labour Welfare Measures; (ii) Social Welfare Measures; (iii) Welfare of Pakistanis Abroad; (iv) Population Welfare Measures; (v) Zakat and Ushr; and (v) Others (Distribution of Winter clothes.
323
Poverty Reduction Strategy Paper-II Chapter 14 - Costing of Millennium Development Goals (MDGs)
Chapter 14 - Costing of Millennium Development Goals (MDGs)
14.1 Rationale of MDG Costing: 14.1.1 The key instruments towards achieving Pakistan's vision of substantially reducing poverty
within the next generation include acting proactively through goal-oriented interventions with
relevant programmes, which in turn, requires appropriate costing and subsequent financing. This
chapter will revisit key features of PRSP financing and related challenges and the methodology
for estimating financing requirements. PRSP-II's costing framework in this
chapter will be based on the Millennium Development Goals (M176
DGs) Costing Report, a study
jointly undertaken by Ministry of Finance and UNDP (2007) which costed three social
sectors - education, health and water and sanitation.177 The United Nations MDGs, agreed at the
Millennium Summit held in New York in September 2000, are linked to Pakistan's Medium
Term Expenditure Framework (MTEF), while the key focus of PRSP-II is also intertwined with
the achievement of MDGs. Government expenditure on 17 budgetary pro- poor sectors under five
broad headings as identified in PRSP-I178 have remained the basic framework and main vehicle
to channel funds for poverty reduction. Budgetary expenditure/PRSP allocations for the three
social sectors mentioned above will be illustrated in detail, alongside MDG costing. Since costing is an
extensive and ambitious task, the end of the
chapter states issues which are inevitable in the process regarding whether the interventions
made and the resources allocated are in line with one another.
14.1.2 The goals/targets of PRSP are fully aligned with the Medium Term Development Framework
(MTDF) and the MDGs. The government's Macroeconomic Framework derives the overall
guidelines for the economy, followed by consequent goals identified in the Medium Term
Development Framework (MTDF) while the Medium Term Budgetary Framework (MTBF)
provides the financing structure to set out a wider vision for the budget, thus making the priorities
at federal and provincial levels more productive/efficient and pro-development. The MTEF, as
discussed in the previous chapter, which presents detailed forecasting of pro-poor expenditures for the
PRSP-II period, provides the 'linking framework' for the overall plans of
the government.
14.2 PRSP-II and Medium Term Expenditure Framework (MTEF)
14.2.1 Given the significant resources required for its funding, GoP will prioritize the Poverty
Reduction Strategy through MTEF. This expenditure framework will adhere to the Fiscal
Responsibility and Debt Limitation Act (FRDLA) 2005. The MTEF provides the 'linking
176 177
"Estimating the Cost to achieve MDGs in Pakistan" UNDP & Finance Division, Islamabad (2007). The initial costing parameters were determined through a consultative process during December 2005 to August 2006.
However, assumptions, including the financial prices, made over two years remain valid. Expenditure incurred in FY 2007-08 has been updated with current GDP at market cost (Rs 10478194) as a result of which future projections have been readjusted. 178 The PRSP Secretariat has institutionalized a mechanism with the Controller General of Accounts for quarterly tracking of seventeen pro-poor expenditures. The 17 pro-poor sectors, which come under five broad headings include: Market access and community services: (i) roads, highways and buildings, (ii) water supply and sanitation, Human development: (iii) education, (iv) health, (v)
population planning, (vi) natural calamities, Rural development: (viii) agriculture, (ix) land reclamation, (x) rural development, (xi) rural electrification (People's Works Programme-II); Safety nets: (xi) subsidies; (xii) social security and welfare including Benazir Income Support Programme; (xiii) food support programme including Pakistan Bait-ul-Mal and Punjab Food Support
Scheme; (xiv) Peoples' Works Programme; (xv) low cost housing; Governance: (xvi) administration of justice; and (xvii) law and order.
324
Poverty Reduction Strategy Paper-II Chapter 14 - Costing of Millennium Development Goals (MDGs)
framework' that allows expenditures to be driven by policy priorities and disciplined by budget
realities. Still a rather recent phenomenon, conceptually, the MTEF is an ideal tool for
translating PRSPs into public expenditure programmes within a coherent multi-year
macroeconomic and fiscal framework.
14.2.2 Tracking is a major component of PRSP's Monitoring & Evaluation (M&E) process. Federal
and provincial Accountant General Offices regularly submit budgetary expenditure data on
seventeen pro-poor sectors to the Finance Division for consolidation and further reporting. With the
shift from the Chart of Classification based upon the legacy system to the Chart of Accounts based
upon the New Accounting Model, developed under the Project for
Improvement of Financial Reporting and Auditing (PIFRA), it has now become possible to
separately account for district expenditures for provinces also. Quarterly and annual
expenditure reports are regularly being generated and shared with stakeholders and are available
on the Finance Division's website.179 Cumulative PRSP expenditures (budgetary, as
well as, non-budgetary) to address the needs of the poor and vulnerable sections of the society
from 2001-08, amounted to Rs 2,410 billion. During FY 2007/08, budgetary expenditure on
pro-poor sectors amounted to Rs 572.6 billion, representing 5.46 percent of the GDP.
14.2.3 The basic objective of this chapter is to examine the present situation regarding alignment of
various MDG goals with PRSP-II; related interventions that may be required; the population to be served
and the cost of each intervention; aggregate expenditure required to meet the MDGs;
the resources provided to each of the social activity and for the interventions required for meeting
MDGs; and the projection of resources that might be available and the shortfall of resources. The
study also identifies various other constraints that might stifle realization of the MDGs and how to
overcome those are also examined. Main focus of the costing is on improvement of human
resource, which is the key to improved living standards and human development. Pakistan lags behind
in social sector development though there have been some improvements in her ranking in recent years.
Given the limited resources, it is imperative that resources are optimally utilized across various
human resource development activities and
within each of the sectors.
14.3 PRSP-II and MDG Costing
14.3.1 As mentioned in chapter 9 - Human development in the 21st century, human resource
development is amongst the government's top most priorities. Three main social sectors: education;
health; and water supply and sanitation - were selected to project the cost of
achieving the proposed MDGs the results of which are reflected in this chapter.
14.3.2 According to the Fiscal Responsibility Debt Limitation Act (FRDLA), 2005 social and poverty
related expenditures are not to be reduced below 4.5 percent of GDP in any given year. Further,
budgetary allocations of health and education will be doubled from the existing level in terms of
percentage of GDP during the next ten years ending in June 2013, hence further endorsing the
significance of tracking social sectors. In accordance with PRSP's MTEF, pro- poor expenditure
projections for water supply and sanitation will also increase during the
PRSP-II period from 0.16 percent of GDP in FY 2008/09 to 0.17 percent in FY 2010/11.
179
Please visit: www.finance.gov.pk
325
Poverty Reduction Strategy Paper-II Chapter 14 - Costing of Millennium Development Goals (MDGs)
14.3.3 Since the government is also working towards achieving MDGs, it makes sense to align the attainment of PRSP-II goals so as to avoid duplication of efforts and resources. For attainment of 8
millennium goals the UN Millennium Declaration had fixed 18 targets and 48 indicators.180
Pakistan has adopted 16 targets and 37 indicators for monitoring the MDGs. In
the present study, the following MDGs 2, 4, 5, 6 and parts of Goal 7 are addressed:
Goal 2: Achieving universal primary education and improving gender balance by 2015
Pakistan's MDG Report identifies three specific targets to be achieved by 2015 under Goal 2
which include:
Attain Net Enrolment Rate of 100 percent for 5-9 years aged group children;
Attain Primary Completion Rate of 100 percent; and
Attain Adult Literacy Rate amongst 10+ aged population to rise to 88 percent.
14.3.4 In addition, targets set under Goal 3, promoting Gender Equality, include the two indicators
which have bearings on actions to be taken in the education sector. These are:
Attain Gender parity (1:1) in youth literacy (15-24 years population); and
Attain full gender parity in primary education and a GPI of 0.94 at secondary 'stage'.
Goal 4: Reducing child mortality
Goal 5: Improving maternal health
Goal 6: Combating HIV, malaria and other diseases
14.3.5 Specific targets under these goals are:
Reduction in Mortality rate to 52;
Reduction in infant mortality rate to 77;
Reduction in neonatal mortality rate to 50;
Proportion of fully immunized children more than 90 percent;
Proportion of children less than one year against measles more than 90 percent;
Prevalence of underweight children less than 20 percent;
Proportion of children less than 5 years suffering from diarrhoea less than 10 percent;
Lady health workers: Universal coverage;
Reduction in maternal mortality rate to 140;
Proportion of birth attended by skilled birth attendants more than 90 percent;
Contraceptive prevalence rate of 55 percent;
Total fertility rate 2.1 percent; and
At least one antenatal care consultation: 100 percent.
Goal 7: Ensuring environmental sustainability (partially covered)
Safe water availability for every one; and
Sanitation facilities to 80 percent of population.
14.3.6 Accordingly, costs for attaining these goals have been worked out for health, education and
water supply and sanitation sectors.
180
"Estimating the Cost to achieve MDGs in Pakistan" UNDP & Finance Division, Islamabad (2007), Pg 8.
326
Poverty Reduction Strategy Paper-II Chapter 14 - Costing of Millennium Development Goals (MDGs)
14.4 MDG Costing Exercise: The Process National/Provincial Workshops on Achieving MDGs Integrated with PRSP
14.4.1 The MDG costing exercise in Pakistan went through an intensive process of training on costing
techniques, which was provided during December 2005. The first training workshop provided a basis
for forming the provincial focal points, which helped in subsequent consultations at provincial levels.
At a national consultation workshop held in end July 2006, the broad design of costing and the initial sets
of parameter values were shared with the participants, which were
subsequently taken to provincial level consultations in August 2006.
14.5 Methodology and Targets of the Strategy
MDG Costing Methodology: An Outline of the Conceptual Framework 14.5.1 The basic framework in the MDG costing exercise involves identification of interventions that
are necessary to realize the targets set under the MDGs, derivation/specification of targets under each
intervention package, and use of an appropriate investment model for estimation of the resource needs
and the financial size of the public investment. Following the series of
workshops, the resource team improved upon the template designs and engaged in a 181
period of intensive
work in compiling consistent sets of numbers for generating cost estimates. Of the
several modifications done, the following are noteworthy:
Eight different regions have been dealt with in case of most exercises, and the water and
sanitation exercise took cue from UNICEF's MICS design to accommodate three regions in each of
the four provinces - major cities, other urban and rural. In each of the exercises, links are provided
to a core file, which provides summary results with every change in
target or parameter values.
In search for consistency in the base year, and because of disaggregation of data, one may
obtain greater insights into the state of a particular sector, which may be valuable inputs to
policy making.
Health modules have incorporated diseases, such as Scabies, Hepatitis B and C, which are
an important concern for Pakistan. More importantly, disaggregated data have been put together
to undertake costing of the health system. This would be a first step ahead in
working out a more robust costing of the system that had so far been lacking.
Education module explicitly accounts for the institutional diversity in Pakistan, and
provides the policymakers with a consistent set of information to raise relevant policy
questions and monitor progress.
14.5.2 There are various approaches to cost182
g including the aggregate relationships through in
Computable General Equilibrium (CGE) modelling and programme level costing. However, this
study has employed a methodology employed by the United Nations Millennium Project
181
Three major exercises, made available during the undertaking, reduced the need for separate consultations on interventions.
These included, the MTDF 2005-10, PMDGR 2005 and the draft PRSP-II. 182 Computable general equilibrium (CGE) models are a class of economic model that use actual economic data to estimate how an economy might react to changes in policy, technology or other external factors. CGE models are also referred to as AGE (applied general equilibrium) models.
327
Poverty Reduction Strategy Paper-II Chapter 14 - Costing of Millennium Development Goals (MDGs)
(UNMP).183 The MDG Costing Methodology initiated by the UNMP outlines the interventions,
and given targets at different tiers of interventions and estimates the resources required. Rather than
resorting to a single unit cost for realizing a target, the approach makes use of financial
prices of all resources to arrive at total cost of realizing a target. The logic running through a
transparently laid out excel-based template is critical in linking targets with resource needs,
and the design has the provision to introduce new intervention and update price and other data.
14.5.3 The MDG costing methodology outlines the interventions; identified targets at different tiers;
subsequent estimates/indicative numbers of the resources required for education; health; and water
supply and sanitation sectors and gaps calculated using PRSP expenditure projections.
Elements of the methodology employed in the study are illustrated below:
For identification of interventions/strategies required for achieving targets, the use has been
made of available research findings and consultations with stakeholders;
Intervention packages to reflect supply and demand side concerns and reducing
overlapping as much as possible;
Determining feasible technological and institutional options;
Setting output level targets within each set of intervention packages;
Using appropriate parameters to translate targets and interventions into resource needs;
Evaluation of various types of data before using them in the costing exercise;
Better basis for unit costs so that the marginal interventions are properly accounted for;
Generation of province and sector level estimates for both rural and urban areas;
Possible links between budgeting and planning exercises; and
Information platform that may provide the basis for bringing consistency across various
data usages and consensus-building on statistics.
183
For details, please visit: http://www.unmillenniumproject.org/reports/index.htm
328
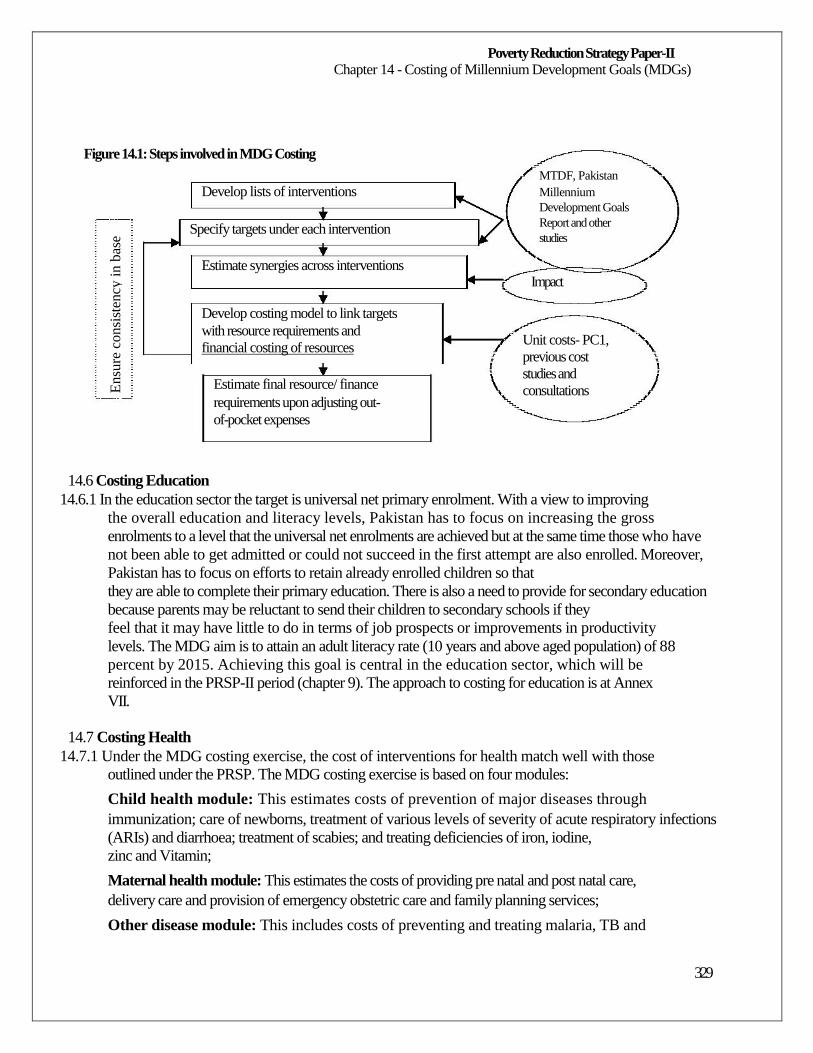
Poverty Reduction Strategy Paper-II Chapter 14 - Costing of Millennium Development Goals (MDGs)
Figure 14.1: Steps involved in MDG Costing
Develop lists of interventions
Specify targets under each intervention
Estimate synergies across interventions
Develop costing model to link targets with resource requirements and financial costing of resources
Estimate final resource/ finance
requirements upon adjusting out- of-pocket expenses
MTDF, Pakistan Millennium Development Goals Report and other studies
Impact
Unit costs- PC1, previous cost studies and consultations
14.6 Costing Education
14.6.1 In the education sector the target is universal net primary enrolment. With a view to improving
the overall education and literacy levels, Pakistan has to focus on increasing the gross
enrolments to a level that the universal net enrolments are achieved but at the same time those who have
not been able to get admitted or could not succeed in the first attempt are also enrolled. Moreover,
Pakistan has to focus on efforts to retain already enrolled children so that
they are able to complete their primary education. There is also a need to provide for secondary education
because parents may be reluctant to send their children to secondary schools if they
feel that it may have little to do in terms of job prospects or improvements in productivity
levels. The MDG aim is to attain an adult literacy rate (10 years and above aged population) of 88
percent by 2015. Achieving this goal is central in the education sector, which will be
reinforced in the PRSP-II period (chapter 9). The approach to costing for education is at Annex
VII.
14.7 Costing Health
14.7.1 Under the MDG costing exercise, the cost of interventions for health match well with those
outlined under the PRSP. The MDG costing exercise is based on four modules:
Child health module: This estimates costs of prevention of major diseases through
immunization; care of newborns, treatment of various levels of severity of acute respiratory infections
(ARIs) and diarrhoea; treatment of scabies; and treating deficiencies of iron, iodine,
zinc and Vitamin;
Maternal health module: This estimates the costs of providing pre natal and post natal care,
delivery care and provision of emergency obstetric care and family planning services;
Other disease module: This includes costs of preventing and treating malaria, TB and
329
Ensu
re c
on
sist
ency
in
bas
e
Poverty Reduction Strategy Paper-II Chapter 14 - Costing of Millennium Development Goals (MDGs)
Hepatitis B and C184; and
Health system module: This estimates costs of health personnel e.g., Lady Health Workers
(LHW), doctors, nurses, lab technicians, etc.; equipment; and supporting structure which will be
required to provide the interventions required to meet the MDGs. Besides, it also
incorporates costs of improving monitoring and evaluation (under the HMIS/integrated disease
surveillance system).
14.7.2 An analysis (1996) of Burden of Disease (BOD)185 indicates that around 60 percent of the
disease burden is due to poverty related communicable diseases, childhood illness,
reproductive health problems and malnutrition. These are the areas that comprise the integral part of the
Millennium Development Goals. Three of the eight MDGs relate directly to health sector with four
targets and sixteen indicators. The goals include: Reducing Child Mortality; Improving Maternal
Health and Combating HIV/AIDS, Malaria and Other Diseases. Major intervention areas thus
include child health, maternal health, and other diseases, such as, malaria, TB and Hepatitis B and
C. Besides, treatment and prevention of these diseases,
household level interventions for creating awareness are also included. Within child health, key
interventions include, ARI (including pneumonia), diarrhoea, malnutrition, scabies and
immunization against major killer diseases. Under maternal health, pre and post-natal care, child
delivery, emergency obstetric care (EmOC) and family planning interventions are
addressed.
14.7.3 Whereas UN MDGs focus on HIV/AIDS, but this costing exercise has laid more emphasis on
Hepatitis B and C due to two main factors; Firstly, HIV/AIDS at present is of relatively small
magnitude and stakeholders in the federal and provincial level agree that since the government has
already launched an awareness programme and a large number of NGOs are working in this area,
another intervention in the area would be duplication of resources. Secondly, Hepatitis B and C
have assumed critical proportion in the country and need to be provided
additional resources for complete eradication.
14.9 Costing Water Supply and Sanitation
14.9.1 Whereas the MDG Report of Pakistan has various environment targets including pollution,
energy efficient use, deforestation etc., the present costing exercise focuses on water and sanitation
since it is estimated that almost 60 percent of all the diseases in Pakistan are water borne and improved
water and sanitation facilities would help in reducing the incidence of
diseases and the expenditure on health. Although safe water availability is a major issue/health hazard in
Pakistan, unfortunately the available data relates to sources of water supplies rather than on their safety
levels. The notion of 'safe water' is determined by statistical agencies on the basis of water source. For
example, the tap water and water from the hand pump is
considered safe in Pakistan Social and Living Standards Measurement (PSLM) Survey.
Revitalizing the infrastructure and increasing the coverage under filtration plants are also
included in the costing exercise.
184 185
Provincial consultation suggested exclusion of HIV/AIDS in the costing given its low incidence in the country. "Estimating the Cost to achieve MDGs in Pakistan" UNDP & Finance Division, Islamabad (2007).
330
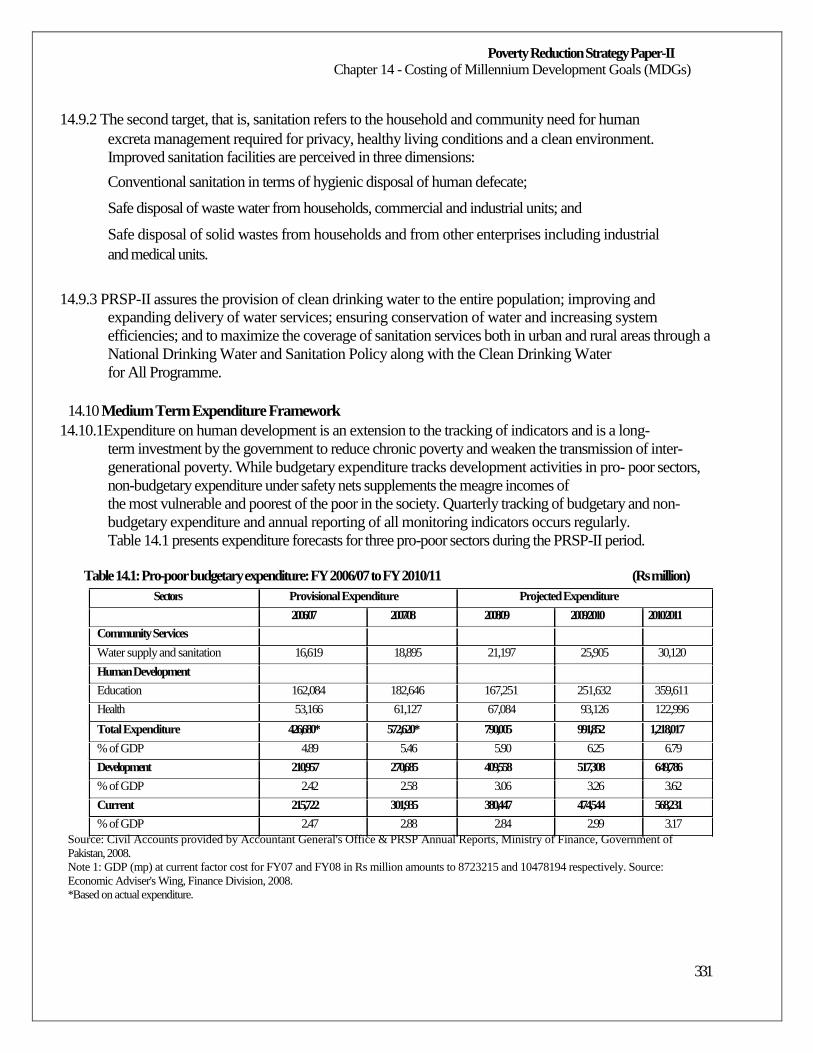
Poverty Reduction Strategy Paper-II Chapter 14 - Costing of Millennium Development Goals (MDGs)
14.9.2 The second target, that is, sanitation refers to the household and community need for human
excreta management required for privacy, healthy living conditions and a clean environment.
Improved sanitation facilities are perceived in three dimensions:
Conventional sanitation in terms of hygienic disposal of human defecate;
Safe disposal of waste water from households, commercial and industrial units; and
Safe disposal of solid wastes from households and from other enterprises including industrial
and medical units.
14.9.3 PRSP-II assures the provision of clean drinking water to the entire population; improving and expanding delivery of water services; ensuring conservation of water and increasing system
efficiencies; and to maximize the coverage of sanitation services both in urban and rural areas through a
National Drinking Water and Sanitation Policy along with the Clean Drinking Water
for All Programme.
14.10 Medium Term Expenditure Framework
14.10.1Expenditure on human development is an extension to the tracking of indicators and is a long-
term investment by the government to reduce chronic poverty and weaken the transmission of inter-
generational poverty. While budgetary expenditure tracks development activities in pro- poor sectors,
non-budgetary expenditure under safety nets supplements the meagre incomes of
the most vulnerable and poorest of the poor in the society. Quarterly tracking of budgetary and non-
budgetary expenditure and annual reporting of all monitoring indicators occurs regularly.
Table 14.1 presents expenditure forecasts for three pro-poor sectors during the PRSP-II period.
Table 14.1: Pro-poor budgetary expenditure: FY 2006/07 to FY 2010/11 (Rs million)
Sectors Provisional Expenditure Projected Expenditure
2006/07 2007/08 2008/09 2009/2010 2010/2011
Community Services
Water supply and sanitation 16,619 18,895 21,197 25,905 30,120
Human Development
Education 162,084 182,646 167,251 251,632 359,611
Health 53,166 61,127 67,084 93,126 122,996
Total Expenditure 426,680* 572,620* 790,005 991,852 1,218,017
% of GDP 4.89 5.46 5.90 6.25 6.79
Development 210,957 270,685 409,558 517,308 649,786
% of GDP 2.42 2.58 3.06 3.26 3.62
Current 215,722 301,935 380,447 474,544 568,231
% of GDP 2.47 2.88 2.84 2.99 3.17
Source: Civil Accounts provided by Accountant General's Office & PRSP Annual Reports, Ministry of Finance, Government of Pakistan, 2008. Note 1: GDP (mp) at current factor cost for FY07 and FY08 in Rs million amounts to 8723215 and 10478194 respectively. Source: Economic Adviser's Wing, Finance Division, 2008. *Based on actual expenditure.
331
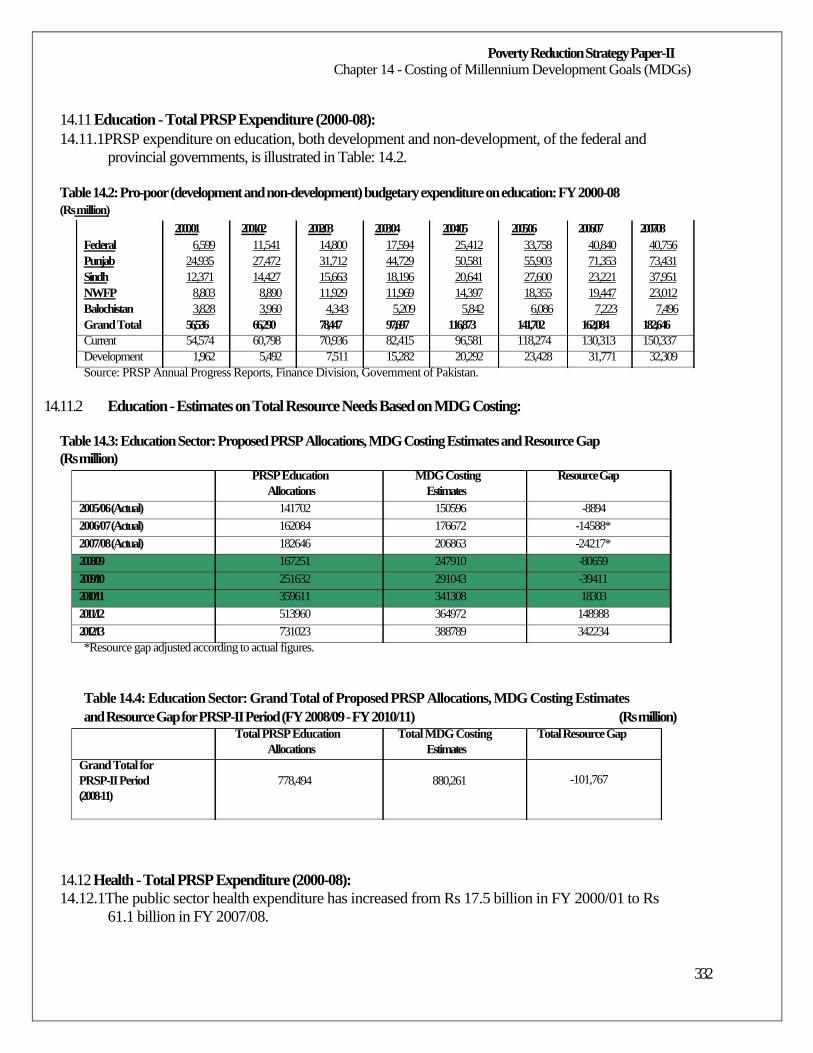
Poverty Reduction Strategy Paper-II Chapter 14 - Costing of Millennium Development Goals (MDGs)
14.11 Education - Total PRSP Expenditure (2000-08):
14.11.1PRSP expenditure on education, both development and non-development, of the federal and
provincial governments, is illustrated in Table: 14.2.
Table 14.2: Pro-poor (development and non-development) budgetary expenditure on education: FY 2000-08 (Rs million)
2000/01 2001/02 2002/03 2003/04 2004/05 2005/06 2006/07 2007/08 Federal 6,599 11,541 14,800 17,594 25,412 33,758 40,840 40,756 Punjab 24,935 27,472 31,712 44,729 50,581 55,903 71,353 73,431 Sindh 12,371 14,427 15,663 18,196 20,641 27,600 23,221 37,951 NWFP 8,803 8,890 11,929 11,969 14,397 18,355 19,447 23,012 Balochistan 3,828 3,960 4,343 5,209 5,842 6,086 7,223 7,496 Grand Total 56,536 66,290 78,447 97,697 116,873 141,702 162,084 182,646 Current 54,574 60,798 70,936 82,415 96,581 118,274 130,313 150,337 Development 1,962 5,492 7,511 15,282 20,292 23,428 31,771 32,309
Source: PRSP Annual Progress Reports, Finance Division, Government of Pakistan.
14.11.2 Education - Estimates on Total Resource Needs Based on MDG Costing:
Table 14.3: Education Sector: Proposed PRSP Allocations, MDG Costing Estimates and Resource Gap (Rs million)
PRSP Education MDG Costing Resource Gap Allocations Estimates
2005/06 (Actual) 141702 150596 -8894 2006/07 (Actual) 162084 176672 -14588* 2007/08 (Actual) 182646 206863 -24217* 2008/09 167251 247910 -80659 2009/10 251632 291043 -39411 2010/11 359611 341308 18303 2011/12 513960 364972 148988 2012/13 731023 388789 342234
*Resource gap adjusted according to actual figures.
Table 14.4: Education Sector: Grand Total of Proposed PRSP Allocations, MDG Costing Estimates
and Resource Gap for PRSP-II Period (FY 2008/09 - FY 2010/11) Total PRSP Education Total MDG Costing
Allocations Estimates Grand Total for PRSP-II Period 778,494 880,261 (2008-11)
(Rs million) Total Resource Gap
-101,767
14.12 Health - Total PRSP Expenditure (2000-08):
14.12.1The public sector health expenditure has increased from Rs 17.5 billion in FY 2000/01 to Rs
61.1 billion in FY 2007/08.
332
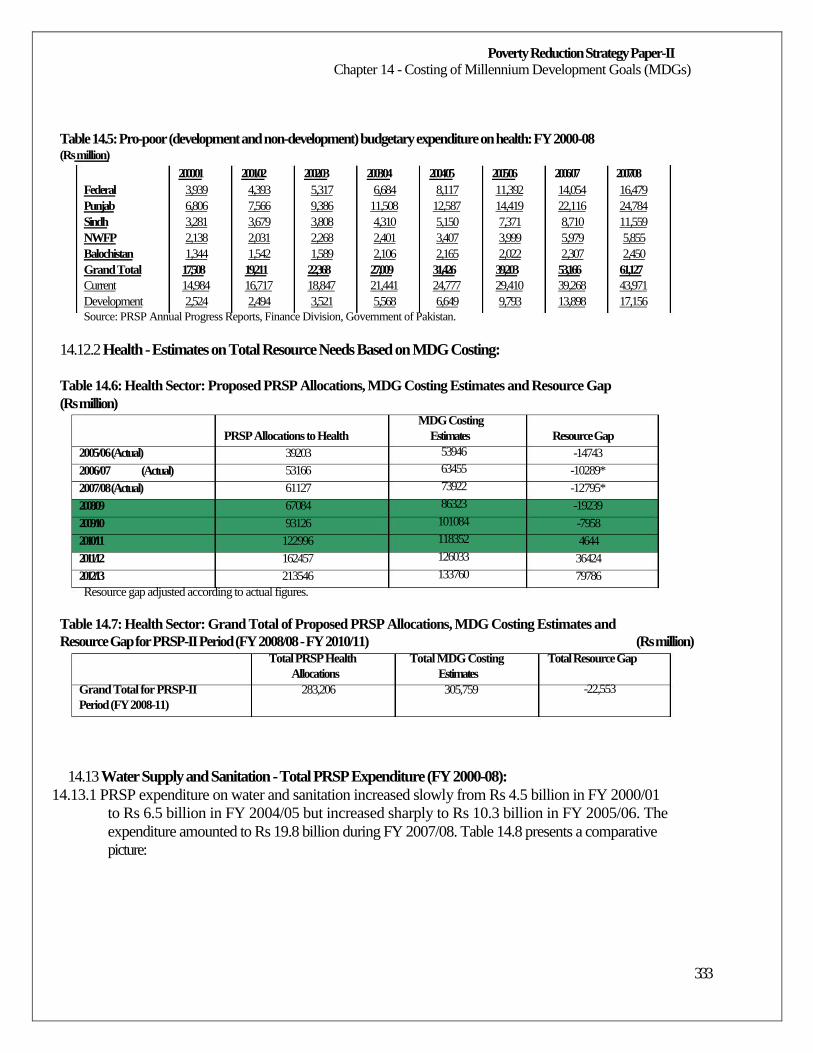
Poverty Reduction Strategy Paper-II Chapter 14 - Costing of Millennium Development Goals (MDGs)
Table 14.5: Pro-poor (development and non-development) budgetary expenditure on health: FY 2000-08 (Rs million)
2000/01 2001/02 2002/03 2003/04 2004/05 2005/06 2006/07 2007/08 Federal 3,939 4,393 5,317 6,684 8,117 11,392 14,054 16,479 Punjab 6,806 7,566 9,386 11,508 12,587 14,419 22,116 24,784 Sindh 3,281 3,679 3,808 4,310 5,150 7,371 8,710 11,559 NWFP 2,138 2,031 2,268 2,401 3,407 3,999 5,979 5,855 Balochistan 1,344 1,542 1,589 2,106 2,165 2,022 2,307 2,450 Grand Total 17,508 19,211 22,368 27,009 31,426 39,203 53,166 61,127 Current 14,984 16,717 18,847 21,441 24,777 29,410 39,268 43,971 Development 2,524 2,494 3,521 5,568 6,649 9,793 13,898 17,156
Source: PRSP Annual Progress Reports, Finance Division, Government of Pakistan.
14.12.2 Health - Estimates on Total Resource Needs Based on MDG Costing:
Table 14.6: Health Sector: Proposed PRSP Allocations, MDG Costing Estimates and Resource Gap (Rs million)
MDG Costing
2005/06 (Actual) 2006/07 (Actual)
2007/08 (Actual) 2008/09 2009/10 2010/11 2011/12 2012/13
PRSP Allocations to Health 39203 53166 61127 67084 93126
122996 162457 213546
Estimates 53946 63455 73922 86323
101084 118352 126033 133760
Resource Gap -14743 -10289* -12795* -19239 -7958 4644
36424 79786
Resource gap adjusted according to actual figures.
Table 14.7: Health Sector: Grand Total of Proposed PRSP Allocations, MDG Costing Estimates and
Resource Gap for PRSP-II Period (FY 2008/08 - FY 2010/11) Total PRSP Health Total MDG Costing
Allocations Estimates Grand Total for PRSP-II 283,206 305,759 Period (FY 2008-11)
(Rs million) Total Resource Gap
-22,553
14.13 Water Supply and Sanitation - Total PRSP Expenditure (FY 2000-08):
14.13.1 PRSP expenditure on water and sanitation increased slowly from Rs 4.5 billion in FY 2000/01
to Rs 6.5 billion in FY 2004/05 but increased sharply to Rs 10.3 billion in FY 2005/06. The
expenditure amounted to Rs 19.8 billion during FY 2007/08. Table 14.8 presents a comparative
picture:
333
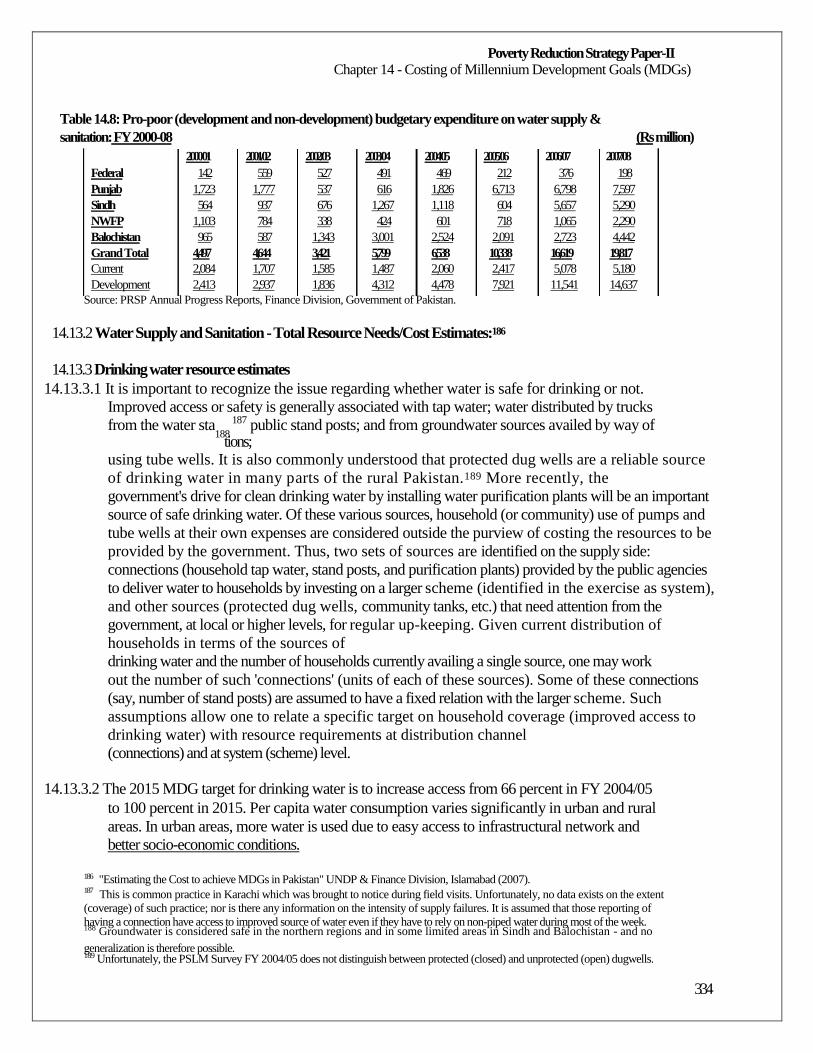
Poverty Reduction Strategy Paper-II Chapter 14 - Costing of Millennium Development Goals (MDGs)
Table 14.8: Pro-poor (development and non-development) budgetary expenditure on water supply &
sanitation: FY 2000-08 (Rs million)
2000/01 2001/02 2002/03 2003/04 2004/05 2005/06 2006/07 2007/08 Federal 142 559 527 491 469 212 376 198 Punjab 1,723 1,777 537 616 1,826 6,713 6,798 7,597 Sindh 564 937 676 1,267 1,118 604 5,657 5,290 NWFP 1,103 784 338 424 601 718 1,065 2,290 Balochistan 965 587 1,343 3,001 2,524 2,091 2,723 4,442 Grand Total 4,497 4,644 3,421 5,799 6,538 10,338 16,619 19,817 Current 2,084 1,707 1,585 1,487 2,060 2,417 5,078 5,180 Development 2,413 2,937 1,836 4,312 4,478 7,921 11,541 14,637
Source: PRSP Annual Progress Reports, Finance Division, Government of Pakistan.
14.13.2 Water Supply and Sanitation - Total Resource Needs/Cost Estimates:186
14.13.3 Drinking water resource estimates
14.13.3.1 It is important to recognize the issue regarding whether water is safe for drinking or not.
Improved access or safety is generally associated with tap water; water distributed by trucks
from the water sta188
187 public stand posts; and from groundwater sources availed by way of tions;
using tube wells. It is also commonly understood that protected dug wells are a reliable source
of drinking water in many parts of the rural Pakistan.189 More recently, the
government's drive for clean drinking water by installing water purification plants will be an important
source of safe drinking water. Of these various sources, household (or community) use of pumps and
tube wells at their own expenses are considered outside the purview of costing the resources to be
provided by the government. Thus, two sets of sources are identified on the supply side:
connections (household tap water, stand posts, and purification plants) provided by the public agencies
to deliver water to households by investing on a larger scheme (identified in the exercise as system),
and other sources (protected dug wells, community tanks, etc.) that need attention from the
government, at local or higher levels, for regular up-keeping. Given current distribution of
households in terms of the sources of
drinking water and the number of households currently availing a single source, one may work
out the number of such 'connections' (units of each of these sources). Some of these connections
(say, number of stand posts) are assumed to have a fixed relation with the larger scheme. Such
assumptions allow one to relate a specific target on household coverage (improved access to
drinking water) with resource requirements at distribution channel
(connections) and at system (scheme) level.
14.13.3.2 The 2015 MDG target for drinking water is to increase access from 66 percent in FY 2004/05
to 100 percent in 2015. Per capita water consumption varies significantly in urban and rural
areas. In urban areas, more water is used due to easy access to infrastructural network and
better socio-economic conditions.
186 187
"Estimating the Cost to achieve MDGs in Pakistan" UNDP & Finance Division, Islamabad (2007). This is common practice in Karachi which was brought to notice during field visits. Unfortunately, no data exists on the extent
(coverage) of such practice; nor is there any information on the intensity of supply failures. It is assumed that those reporting of having a connection have access to improved source of water even if they have to rely on non-piped water during most of the week. 188 Groundwater is considered safe in the northern regions and in some limited areas in Sindh and Balochistan - and no generalization is therefore possible. 189 Unfortunately, the PSLM Survey FY 2004/05 does not distinguish between protected (closed) and unprotected (open) dugwells.
334
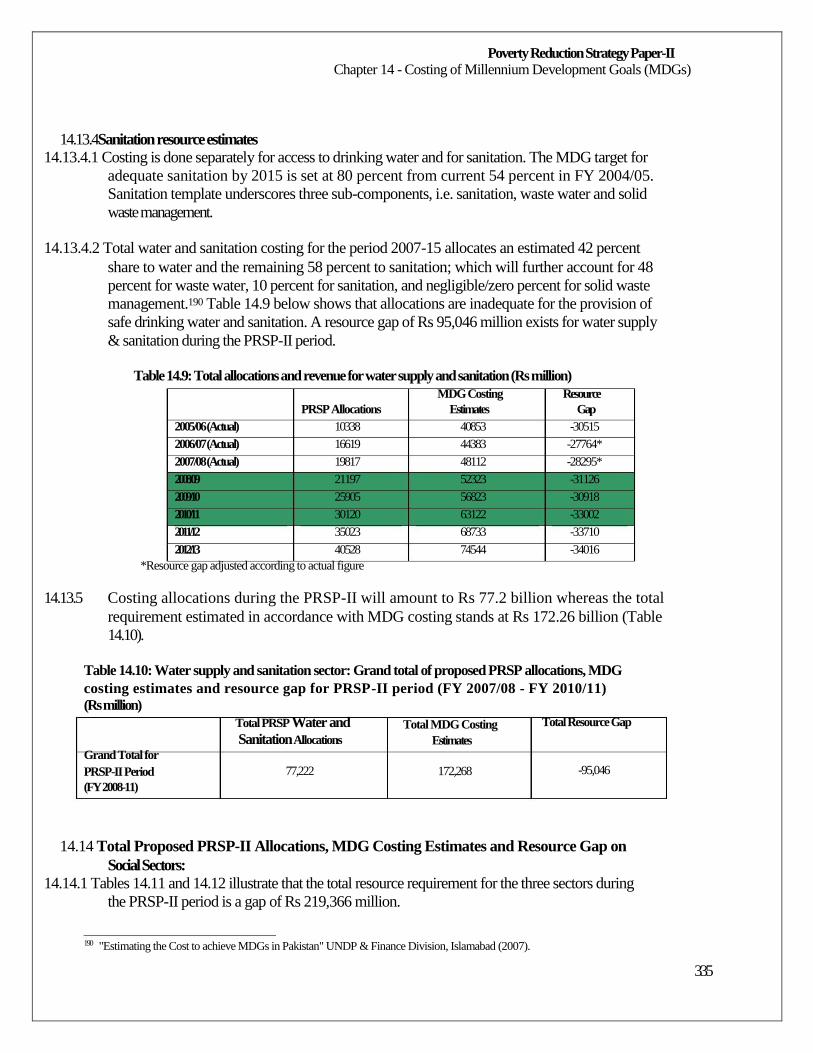
Poverty Reduction Strategy Paper-II Chapter 14 - Costing of Millennium Development Goals (MDGs)
14.13.4Sanitation resource estimates 14.13.4.1 Costing is done separately for access to drinking water and for sanitation. The MDG target for
adequate sanitation by 2015 is set at 80 percent from current 54 percent in FY 2004/05.
Sanitation template underscores three sub-components, i.e. sanitation, waste water and solid
waste management.
14.13.4.2 Total water and sanitation costing for the period 2007-15 allocates an estimated 42 percent
share to water and the remaining 58 percent to sanitation; which will further account for 48
percent for waste water, 10 percent for sanitation, and negligible/zero percent for solid waste
management.190 Table 14.9 below shows that allocations are inadequate for the provision of
safe drinking water and sanitation. A resource gap of Rs 95,046 million exists for water supply
& sanitation during the PRSP-II period.
Table 14.9: Total allocations and revenue for water supply and sanitation (Rs million)
MDG Costing Resource PRSP Allocations Estimates Gap
2005/06 (Actual) 10338 40853 -30515 2006/07 (Actual) 16619 44383 -27764* 2007/08 (Actual) 19817 48112 -28295* 2008/09 21197 52323 -31126 2009/10 25905 56823 -30918 2010/11 30120 63122 -33002 2011/12 35023 68733 -33710 2012/13 40528 74544 -34016
*Resource gap adjusted according to actual figure
14.13.5 Costing allocations during the PRSP-II will amount to Rs 77.2 billion whereas the total
requirement estimated in accordance with MDG costing stands at Rs 172.26 billion (Table
14.10).
Table 14.10: Water supply and sanitation sector: Grand total of proposed PRSP allocations, MDG costing estimates and resource gap for PRSP-II period (FY 2007/08 - FY 2010/11) (Rs million)
Grand Total for PRSP-II Period (FY 2008-11)
Total PRSP Water and Sanitation Allocations
77,222
Total MDG Costing Estimates
172,268
Total Resource Gap
-95,046
14.14 Total Proposed PRSP-II Allocations, MDG Costing Estimates and Resource Gap on
Social Sectors: 14.14.1 Tables 14.11 and 14.12 illustrate that the total resource requirement for the three sectors during
the PRSP-II period is a gap of Rs 219,366 million.
190
"Estimating the Cost to achieve MDGs in Pakistan" UNDP & Finance Division, Islamabad (2007).
335
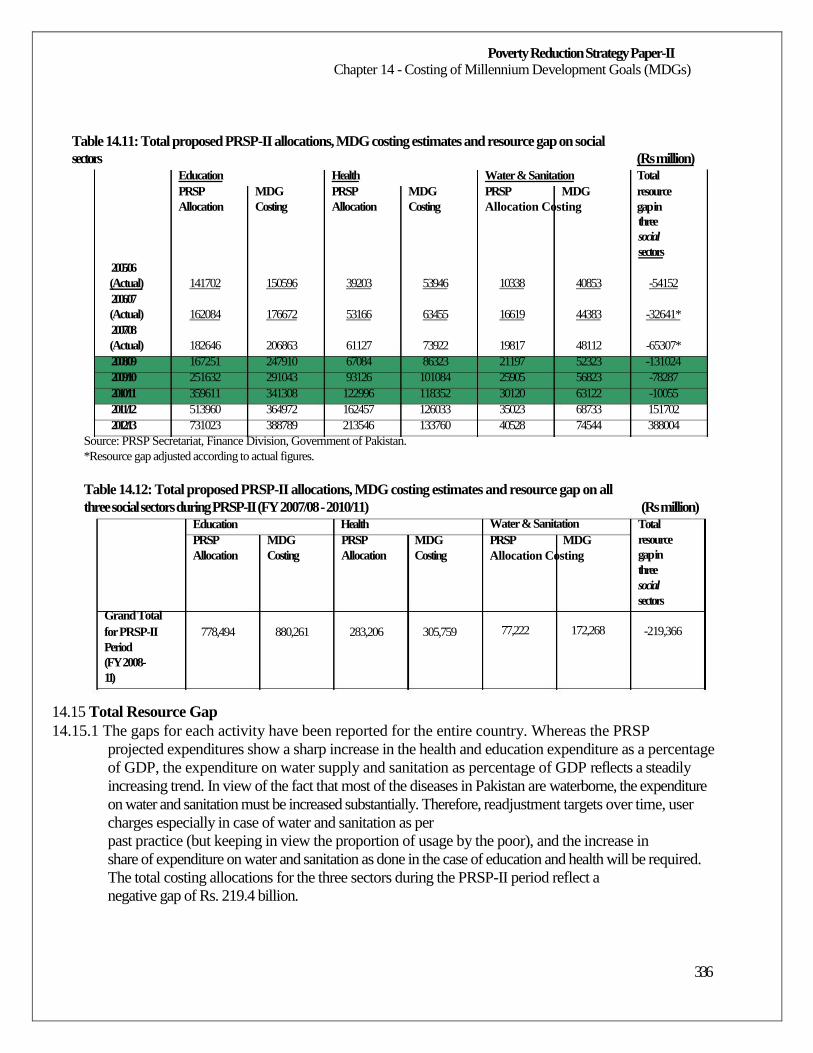
Poverty Reduction Strategy Paper-II Chapter 14 - Costing of Millennium Development Goals (MDGs)
Table 14.11: Total proposed PRSP-II allocations, MDG costing estimates and resource gap on social
sectors (Rs million) Education Health Water & Sanitation Total PRSP MDG PRSP MDG PRSP MDG resource Allocation Costing Allocation Costing Allocation Costing gap in
three social sectors
2005/06 (Actual) 141702 150596 39203 53946 10338 40853 -54152 2006/07 (Actual) 162084 176672 53166 63455 16619 44383 -32641* 2007/08 (Actual) 182646 206863 61127 73922 19817 48112 -65307* 2008/09 167251 247910 67084 86323 21197 52323 -131024 2009/10 251632 291043 93126 101084 25905 56823 -78287 2010/11 359611 341308 122996 118352 30120 63122 -10055 2011/12 513960 364972 162457 126033 35023 68733 151702 2012/13 731023 388789 213546 133760 40528 74544 388004
Source: PRSP Secretariat, Finance Division, Government of Pakistan. *Resource gap adjusted according to actual figures.
Table 14.12: Total proposed PRSP-II allocations, MDG costing estimates and resource gap on all
three social sectors during PRSP-II (FY 2007/08 - 2010/11) Education Health PRSP MDG PRSP MDG Allocation Costing Allocation Costing
Grand Total for PRSP-II 778,494 880,261 283,206 305,759 Period (FY 2008- 11)
14.15 Total Resource Gap
Water & Sanitation PRSP MDG Allocation Costing
77,222 172,268
(Rs million) Total resource gap in three social sectors
-219,366
14.15.1 The gaps for each activity have been reported for the entire country. Whereas the PRSP
projected expenditures show a sharp increase in the health and education expenditure as a percentage
of GDP, the expenditure on water supply and sanitation as percentage of GDP reflects a steadily
increasing trend. In view of the fact that most of the diseases in Pakistan are waterborne, the expenditure
on water and sanitation must be increased substantially. Therefore, readjustment targets over time, user
charges especially in case of water and sanitation as per
past practice (but keeping in view the proportion of usage by the poor), and the increase in
share of expenditure on water and sanitation as done in the case of education and health will be required.
The total costing allocations for the three sectors during the PRSP-II period reflect a
negative gap of Rs. 219.4 billion.
336
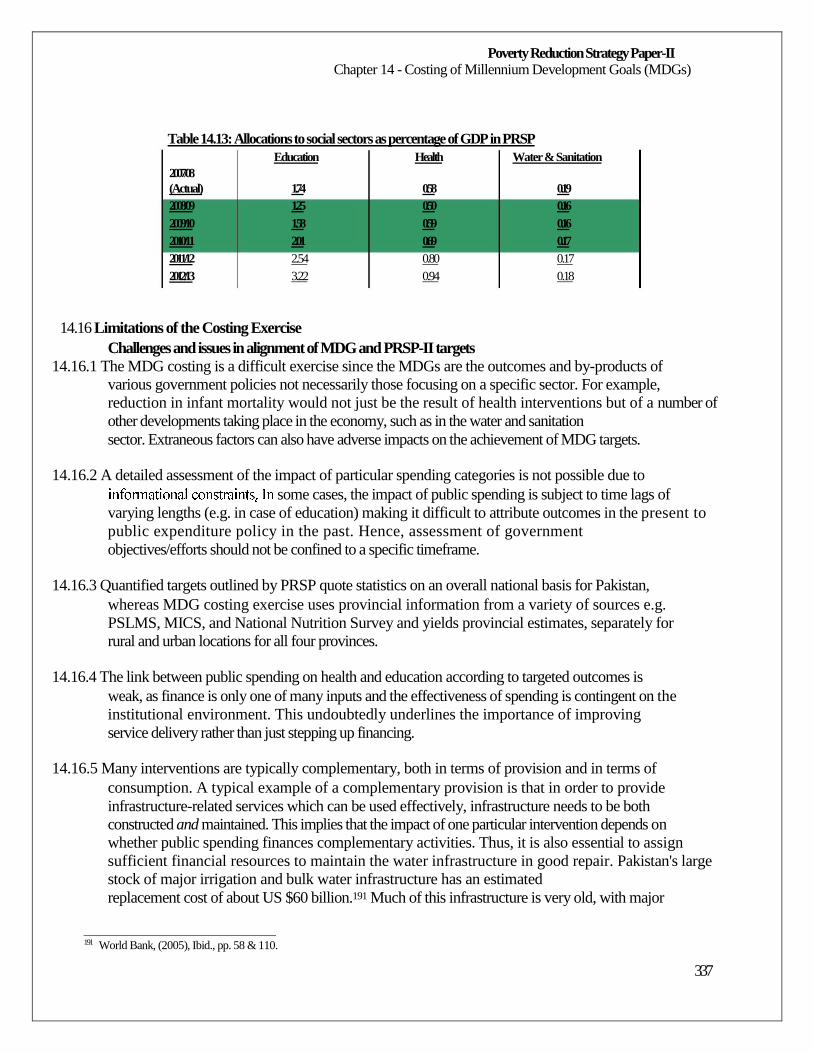
Poverty Reduction Strategy Paper-II Chapter 14 - Costing of Millennium Development Goals (MDGs)
Table 14.13: Allocations to social sectors as percentage of GDP in PRSP
Education Health Water & Sanitation 2007/08 (Actual) 1.74 0.58 0.19 2008/09 1.25 0.50 0.16 2009/10 1.58 0.59 0.16 2010/11 2.01 0.69 0.17 2011/12 2.54 0.80 0.17 2012/13 3.22 0.94 0.18
14.16 Limitations of the Costing Exercise
Challenges and issues in alignment of MDG and PRSP-II targets
14.16.1 The MDG costing is a difficult exercise since the MDGs are the outcomes and by-products of
various government policies not necessarily those focusing on a specific sector. For example,
reduction in infant mortality would not just be the result of health interventions but of a number of
other developments taking place in the economy, such as in the water and sanitation
sector. Extraneous factors can also have adverse impacts on the achievement of MDG targets.
14.16.2 A detailed assessment of the impact of particular spending categories is not possible due to
some cases, the impact of public spending is subject to time lags of
varying lengths (e.g. in case of education) making it difficult to attribute outcomes in the present to
public expenditure policy in the past. Hence, assessment of government
objectives/efforts should not be confined to a specific timeframe.
14.16.3 Quantified targets outlined by PRSP quote statistics on an overall national basis for Pakistan,
whereas MDG costing exercise uses provincial information from a variety of sources e.g.
PSLMS, MICS, and National Nutrition Survey and yields provincial estimates, separately for
rural and urban locations for all four provinces.
14.16.4 The link between public spending on health and education according to targeted outcomes is
weak, as finance is only one of many inputs and the effectiveness of spending is contingent on the
institutional environment. This undoubtedly underlines the importance of improving
service delivery rather than just stepping up financing.
14.16.5 Many interventions are typically complementary, both in terms of provision and in terms of
consumption. A typical example of a complementary provision is that in order to provide
infrastructure-related services which can be used effectively, infrastructure needs to be both
constructed and maintained. This implies that the impact of one particular intervention depends on
whether public spending finances complementary activities. Thus, it is also essential to assign
sufficient financial resources to maintain the water infrastructure in good repair. Pakistan's large
stock of major irrigation and bulk water infrastructure has an estimated
replacement cost of about US $60 billion.191 Much of this infrastructure is very old, with major
191
World Bank, (2005), Ibid., pp. 58 & 110.
337
Poverty Reduction Strategy Paper-II Chapter 14 - Costing of Millennium Development Goals (MDGs)
structures operating well beyond their designed life. Consequently, it is important to note that
requirements of funds for physical infrastructure are not portrayed in the form of a costing
exercise like MDG Costing but are in fact PSDP projections of expenditure based on project
feasibility studies. Nevertheless, they will have a significant impact upon availability and use
of public resources and cannot be ignored while assessing expenditure on social delivery
during the PRSP-II period and beyond.
14.16.6 In general, costing PRSPs (or MDGs) suffers from five main weaknesses:
Different approaches exist for reaching any particular goal, each of them has different unit
costs and cost functions;
Costs might not be linear, but affected by economies or diseconomies of scale;
Different goals are interrelated, so adding up of costs would lead to overestimates;
Absorptive capacity can reduce the efficiency of spending when scaling up interventions;
and
There is no means of indicating cost estimates affected by, say, conflict or epidemics.
14.16.7 It must be kept in mind that assumptions related to costing each social sector in the MDG
Costing exercise cannot be considered sacrosanct. Changes in assumptions can occur due to
extraneous factors, which can lead to varying numbers in the cost estimates. However, this first ever
costing exercise should be assumed as far as possible, as providing indicative requirements
of funds, ceterus paribus. Overall, the costing framework will act as a useful planning tool for
public policy managers. The proposed framework is only a projection; the recommendations given
are not iron cast, which means there is always room for improvement
and valuable feedback from stakeholders.
14.16.8 The PRSP Secretariat will endeavour to initiate costing of other sectors as well as new
estimates of the above mentioned social sectors during the PRSP period. This would help in arriving
at a more realistic figure pertaining to the resource gap. Needless to mention that filling up of
resource gaps with the help of development partners, would be a prerequisite to
achieve MDGs.
338
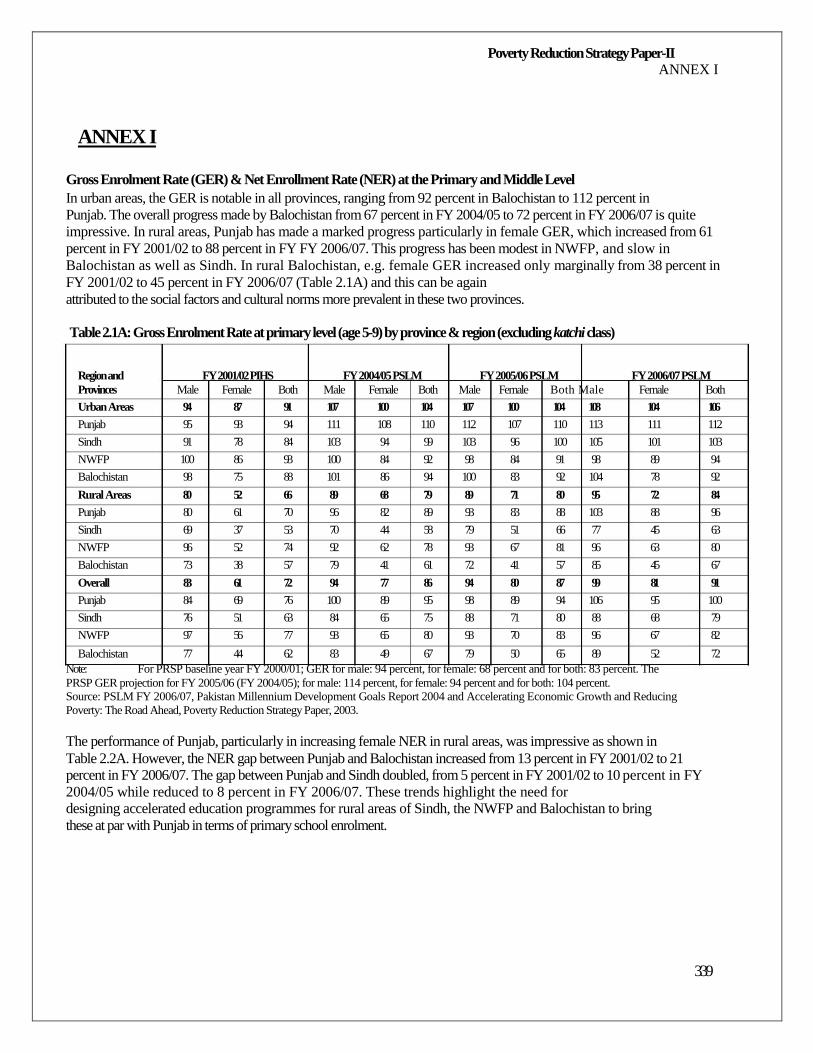
Poverty Reduction Strategy Paper-II ANNEX I
ANNEX I
Gross Enrolment Rate (GER) & Net Enrollment Rate (NER) at the Primary and Middle Level
In urban areas, the GER is notable in all provinces, ranging from 92 percent in Balochistan to 112 percent in Punjab. The overall progress made by Balochistan from 67 percent in FY 2004/05 to 72 percent in FY 2006/07 is quite
impressive. In rural areas, Punjab has made a marked progress particularly in female GER, which increased from 61
percent in FY 2001/02 to 88 percent in FY FY 2006/07. This progress has been modest in NWFP, and slow in
Balochistan as well as Sindh. In rural Balochistan, e.g. female GER increased only marginally from 38 percent in
FY 2001/02 to 45 percent in FY 2006/07 (Table 2.1A) and this can be again attributed to the social factors and cultural norms more prevalent in these two provinces.
Table 2.1A: Gross Enrolment Rate at primary level (age 5-9) by province & region (excluding katchi class)
Region and FY 2001/02 PIHS FY 2004/05 PSLM FY 2005/06 PSLM FY 2006/07 PSLM Provinces Male Female Both Male Female Both Male Female Both Male Female Both Urban Areas 94 87 91 107 100 104 107 100 104 108 104 106 Punjab 95 93 94 111 108 110 112 107 110 113 111 112 Sindh 91 78 84 103 94 99 103 96 100 105 101 103 NWFP 100 86 93 100 84 92 98 84 91 98 89 94 Balochistan 98 75 88 101 86 94 100 83 92 104 78 92 Rural Areas 80 52 66 89 68 79 89 71 80 95 72 84 Punjab 80 61 70 96 82 89 93 83 88 103 88 96 Sindh 69 37 53 70 44 58 79 51 66 77 45 63 NWFP 96 52 74 92 62 78 93 67 81 96 63 80 Balochistan 73 38 57 79 41 61 72 41 57 85 45 67 Overall 83 61 72 94 77 86 94 80 87 99 81 91 Punjab 84 69 76 100 89 95 98 89 94 106 95 100 Sindh 76 51 63 84 65 75 88 71 80 88 68 79 NWFP 97 56 77 93 65 80 93 70 83 96 67 82
Balochistan 77 44 62 83 49 67 79 50 65 89 52 72
Note: For PRSP baseline year FY 2000/01; GER for male: 94 percent, for female: 68 percent and for both: 83 percent. The
PRSP GER projection for FY 2005/06 (FY 2004/05); for male: 114 percent, for female: 94 percent and for both: 104 percent. Source: PSLM FY 2006/07, Pakistan Millennium Development Goals Report 2004 and Accelerating Economic Growth and Reducing Poverty: The Road Ahead, Poverty Reduction Strategy Paper, 2003.
The performance of Punjab, particularly in increasing female NER in rural areas, was impressive as shown in Table 2.2A. However, the NER gap between Punjab and Balochistan increased from 13 percent in FY 2001/02 to 21 percent in FY 2006/07. The gap between Punjab and Sindh doubled, from 5 percent in FY 2001/02 to 10 percent in FY
2004/05 while reduced to 8 percent in FY 2006/07. These trends highlight the need for designing accelerated education programmes for rural areas of Sindh, the NWFP and Balochistan to bring these at par with Punjab in terms of primary school enrolment.
339
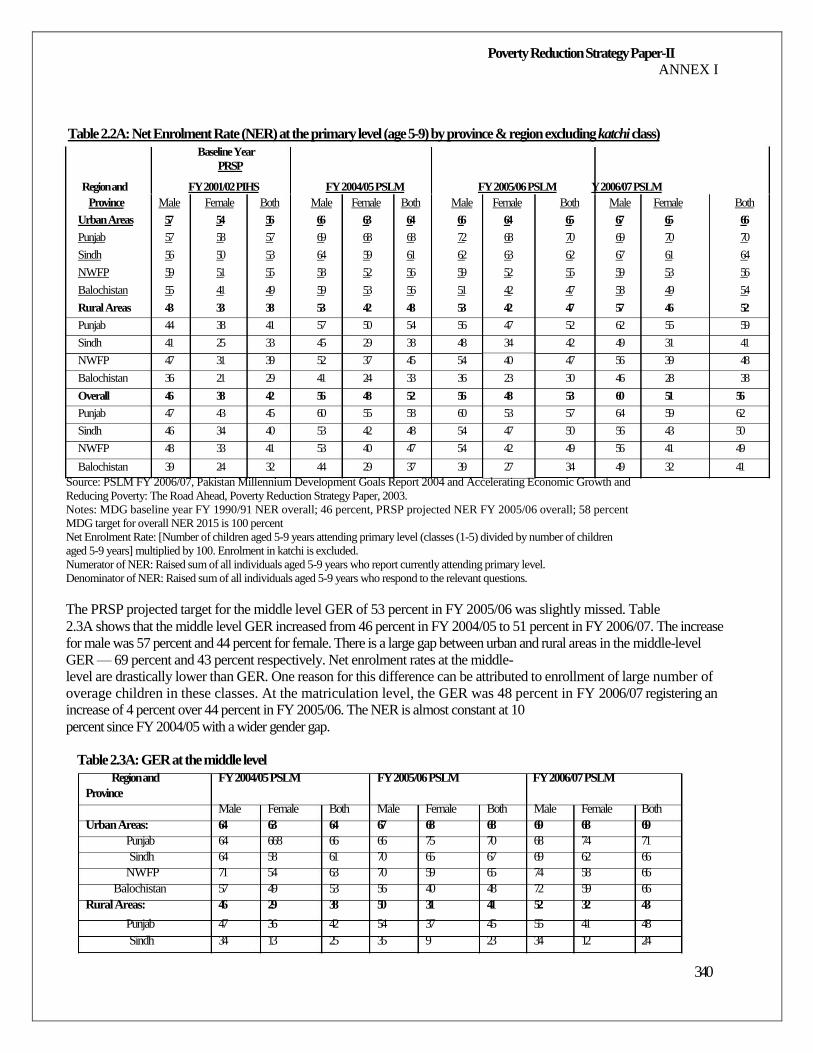
Poverty Reduction Strategy Paper-II ANNEX I
Table 2.2A: Net Enrolment Rate (NER) at the primary level (age 5-9) by province & region excluding katchi class) Baseline Year
PRSP
Region and FY 2001/02 PIHS FY 2004/05 PSLM FY 2005/06 PSLM Y 2006/07 PSLM Province Male Female Both Male Female Both Male Female Both Male Female Both
Urban Areas 57 54 56 66 63 64 66 64 65 67 65 66 Punjab 57 58 57 69 68 68 72 68 70 69 70 70 Sindh 56 50 53 64 59 61 62 63 62 67 61 64 NWFP 59 51 55 58 52 56 59 52 55 59 53 56 Balochistan 55 41 49 59 53 56 51 42 47 58 49 54 Rural Areas 43 33 38 53 42 48 53 42 47 57 46 52 Punjab 44 38 41 57 50 54 56 47 52 62 55 59 Sindh 41 25 33 45 29 38 48 34 42 49 31 41 NWFP 47 31 39 52 37 45 54 40 47 56 39 48 Balochistan 36 21 29 41 24 33 36 23 30 46 28 38 Overall 46 38 42 56 48 52 56 48 53 60 51 56 Punjab 47 43 45 60 55 58 60 53 57 64 59 62 Sindh 46 34 40 53 42 48 54 47 50 56 43 50 NWFP 48 33 41 53 40 47 54 42 49 56 41 49
Balochistan 39 24 32 44 29 37 39 27 34 49 32 41
Source: PSLM FY 2006/07, Pakistan Millennium Development Goals Report 2004 and Accelerating Economic Growth and Reducing Poverty: The Road Ahead, Poverty Reduction Strategy Paper, 2003. Notes: MDG baseline year FY 1990/91 NER overall; 46 percent, PRSP projected NER FY 2005/06 overall; 58 percent MDG target for overall NER 2015 is 100 percent Net Enrolment Rate: [Number of children aged 5-9 years attending primary level (classes (1-5) divided by number of children aged 5-9 years] multiplied by 100. Enrolment in katchi is excluded. Numerator of NER: Raised sum of all individuals aged 5-9 years who report currently attending primary level. Denominator of NER: Raised sum of all individuals aged 5-9 years who respond to the relevant questions.
The PRSP projected target for the middle level GER of 53 percent in FY 2005/06 was slightly missed. Table 2.3A shows that the middle level GER increased from 46 percent in FY 2004/05 to 51 percent in FY 2006/07. The increase
for male was 57 percent and 44 percent for female. There is a large gap between urban and rural areas in the middle-level
GER — 69 percent and 43 percent respectively. Net enrolment rates at the middle- level are drastically lower than GER. One reason for this difference can be attributed to enrollment of large number of
overage children in these classes. At the matriculation level, the GER was 48 percent in FY 2006/07 registering an increase of 4 percent over 44 percent in FY 2005/06. The NER is almost constant at 10 percent since FY 2004/05 with a wider gender gap.
Table 2.3A: GER at the middle level
Region and FY 2004/05 PSLM FY 2005/06 PSLM FY 2006/07 PSLM Province
Male Female Both Male Female Both Male Female Both Urban Areas: 64 63 64 67 68 68 69 68 69
Punjab 64 668 66 66 75 70 68 74 71 Sindh 64 58 61 70 65 67 69 62 66
NWFP 71 54 63 70 59 65 74 58 66 Balochistan 57 49 53 56 40 48 72 59 66
Rural Areas: 46 29 38 50 31 41 52 32 43
Punjab 47 36 42 54 37 45 55 41 48 Sindh 34 13 25 35 9 23 34 12 24
340
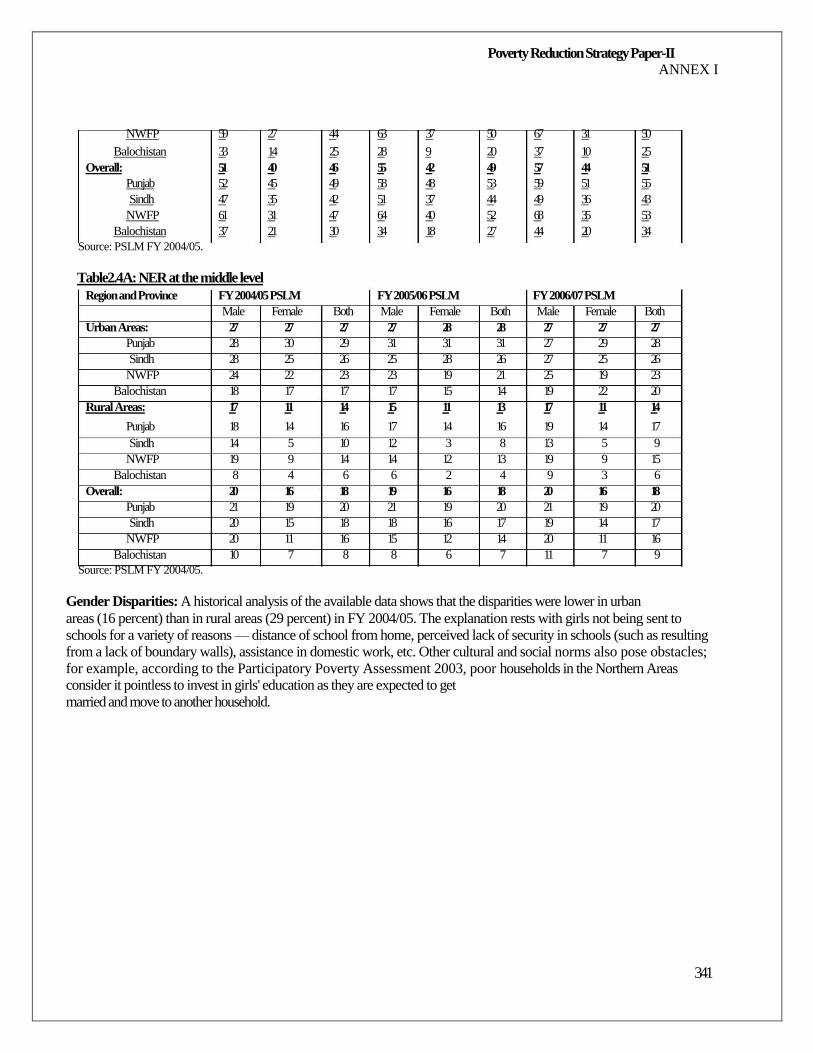
Poverty Reduction Strategy Paper-II ANNEX I
NWFP 59 27 44 63 37 50 67 31 50 Balochistan 33 14 25 28 9 20 37 10 25
Overall: 51 40 46 55 42 49 57 44 51
Punjab 52 45 49 58 48 53 59 51 55 Sindh 47 35 42 51 37 44 49 36 43
NWFP 61 31 47 64 40 52 68 35 53 Balochistan 37 21 30 34 18 27 44 20 34
Source: PSLM FY 2004/05.
Table2.4A: NER at the middle level
Region and Province FY 2004/05 PSLM FY 2005/06 PSLM FY 2006/07 PSLM Male Female Both Male Female Both Male Female Both
Urban Areas: 27 27 27 27 28 28 27 27 27 Punjab 28 30 29 31 31 31 27 29 28 Sindh 28 25 26 25 28 26 27 25 26
NWFP 24 22 23 23 19 21 25 19 23 Balochistan 18 17 17 17 15 14 19 22 20
Rural Areas: 17 11 14 15 11 13 17 11 14
Punjab 18 14 16 17 14 16 19 14 17 Sindh 14 5 10 12 3 8 13 5 9
NWFP 19 9 14 14 12 13 19 9 15 Balochistan 8 4 6 6 2 4 9 3 6
Overall: 20 16 18 19 16 18 20 16 18 Punjab 21 19 20 21 19 20 21 19 20 Sindh 20 15 18 18 16 17 19 14 17
NWFP 20 11 16 15 12 14 20 11 16 Balochistan 10 7 8 8 6 7 11 7 9
Source: PSLM FY 2004/05.
Gender Disparities: A historical analysis of the available data shows that the disparities were lower in urban areas (16 percent) than in rural areas (29 percent) in FY 2004/05. The explanation rests with girls not being sent to
schools for a variety of reasons — distance of school from home, perceived lack of security in schools (such as resulting from a lack of boundary walls), assistance in domestic work, etc. Other cultural and social norms also pose obstacles;
for example, according to the Participatory Poverty Assessment 2003, poor households in the Northern Areas consider it pointless to invest in girls' education as they are expected to get married and move to another household.
341
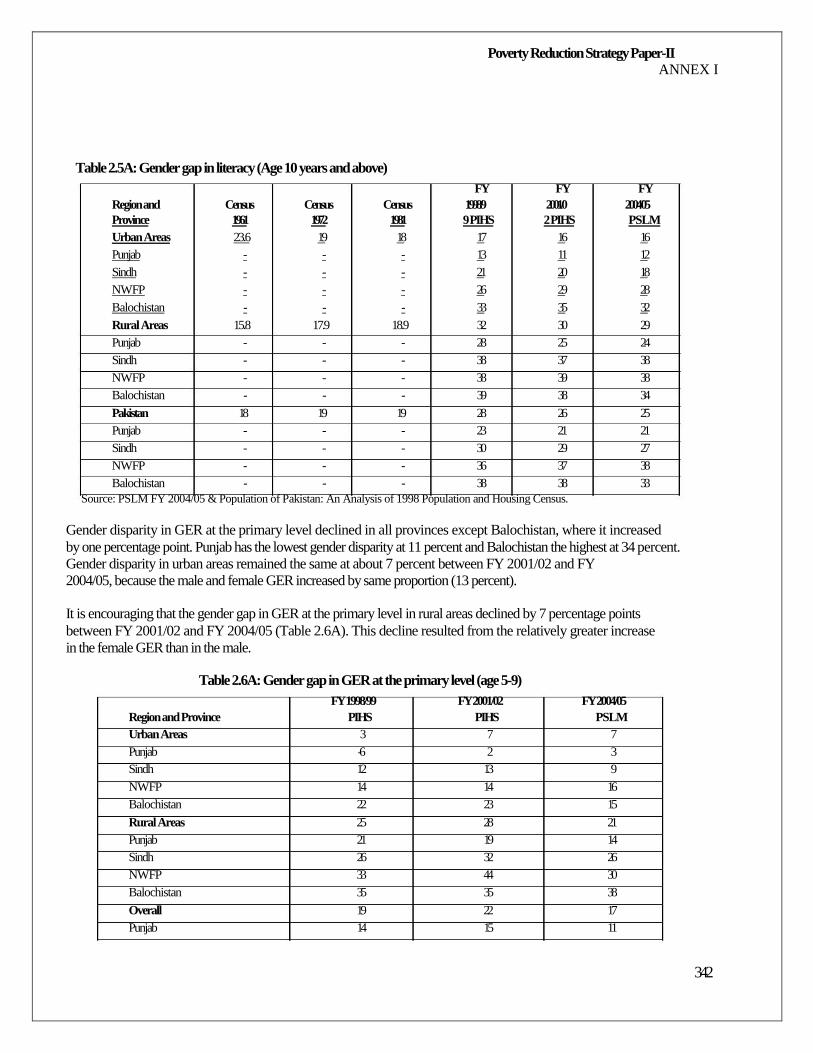
Poverty Reduction Strategy Paper-II ANNEX I
Table 2.5A: Gender gap in literacy (Age 10 years and above)
FY FY FY Region and Census Census Census 1998/9 2001/0 2004/05 Province 1961 1972 1981 9 PIHS 2 PIHS PSLM Urban Areas 23.6 19 18 17 16 16 Punjab - - - 13 11 12 Sindh - - - 21 20 18 NWFP - - - 26 29 28 Balochistan - - - 33 35 32 Rural Areas 15.8 17.9 18.9 32 30 29 Punjab - - - 28 25 24 Sindh - - - 38 37 38 NWFP - - - 38 39 38 Balochistan - - - 39 38 34 Pakistan 18 19 19 28 26 25 Punjab - - - 23 21 21 Sindh - - - 30 29 27 NWFP - - - 36 37 38 Balochistan - - - 38 38 33
Source: PSLM FY 2004/05 & Population of Pakistan: An Analysis of 1998 Population and Housing Census.
Gender disparity in GER at the primary level declined in all provinces except Balochistan, where it increased by one percentage point. Punjab has the lowest gender disparity at 11 percent and Balochistan the highest at 34 percent.
Gender disparity in urban areas remained the same at about 7 percent between FY 2001/02 and FY 2004/05, because the male and female GER increased by same proportion (13 percent).
It is encouraging that the gender gap in GER at the primary level in rural areas declined by 7 percentage points between FY 2001/02 and FY 2004/05 (Table 2.6A). This decline resulted from the relatively greater increase in the female GER than in the male.
Table 2.6A: Gender gap in GER at the primary level (age 5-9)
FY 1998/99 FY 2001/02 FY 2004/05 Region and Province PIHS PIHS PSLM Urban Areas 3 7 7 Punjab -6 2 3 Sindh 12 13 9 NWFP 14 14 16 Balochistan 22 23 15 Rural Areas 25 28 21 Punjab 21 19 14 Sindh 26 32 26 NWFP 33 44 30 Balochistan 35 35 38 Overall 19 22 17 Punjab 14 15 11
342
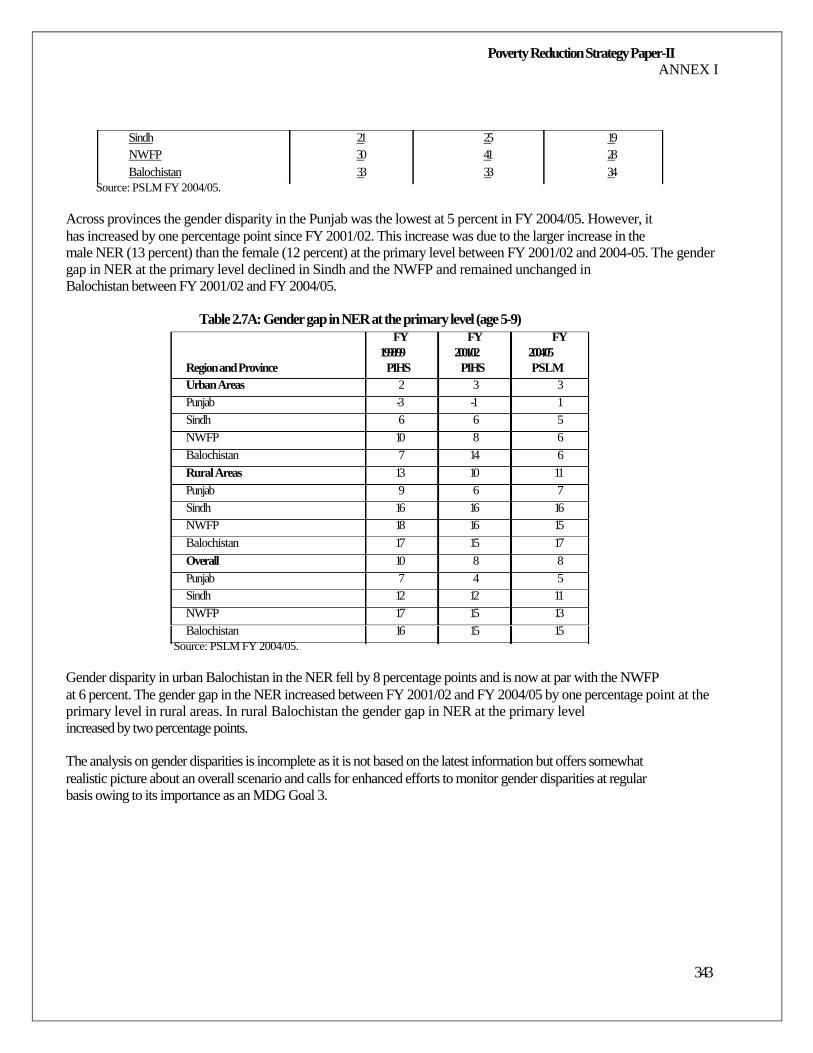
Poverty Reduction Strategy Paper-II ANNEX I
Sindh 21 25 19 NWFP 30 41 28 Balochistan 33 33 34
Source: PSLM FY 2004/05.
Across provinces the gender disparity in the Punjab was the lowest at 5 percent in FY 2004/05. However, it has increased by one percentage point since FY 2001/02. This increase was due to the larger increase in the male NER (13 percent) than the female (12 percent) at the primary level between FY 2001/02 and 2004-05. The gender
gap in NER at the primary level declined in Sindh and the NWFP and remained unchanged in Balochistan between FY 2001/02 and FY 2004/05.
Table 2.7A: Gender gap in NER at the primary level (age 5-9)
FY FY FY 1998/99 2001/02 2004/05
Region and Province PIHS PIHS PSLM Urban Areas 2 3 3 Punjab -3 -1 1 Sindh 6 6 5 NWFP 10 8 6 Balochistan 7 14 6 Rural Areas 13 10 11 Punjab 9 6 7 Sindh 16 16 16 NWFP 18 16 15 Balochistan 17 15 17 Overall 10 8 8 Punjab 7 4 5 Sindh 12 12 11 NWFP 17 15 13 Balochistan 16 15 15
Source: PSLM FY 2004/05.
Gender disparity in urban Balochistan in the NER fell by 8 percentage points and is now at par with the NWFP at 6 percent. The gender gap in the NER increased between FY 2001/02 and FY 2004/05 by one percentage point at the primary level in rural areas. In rural Balochistan the gender gap in NER at the primary level increased by two percentage points.
The analysis on gender disparities is incomplete as it is not based on the latest information but offers somewhat realistic picture about an overall scenario and calls for enhanced efforts to monitor gender disparities at regular basis owing to its importance as an MDG Goal 3.
343
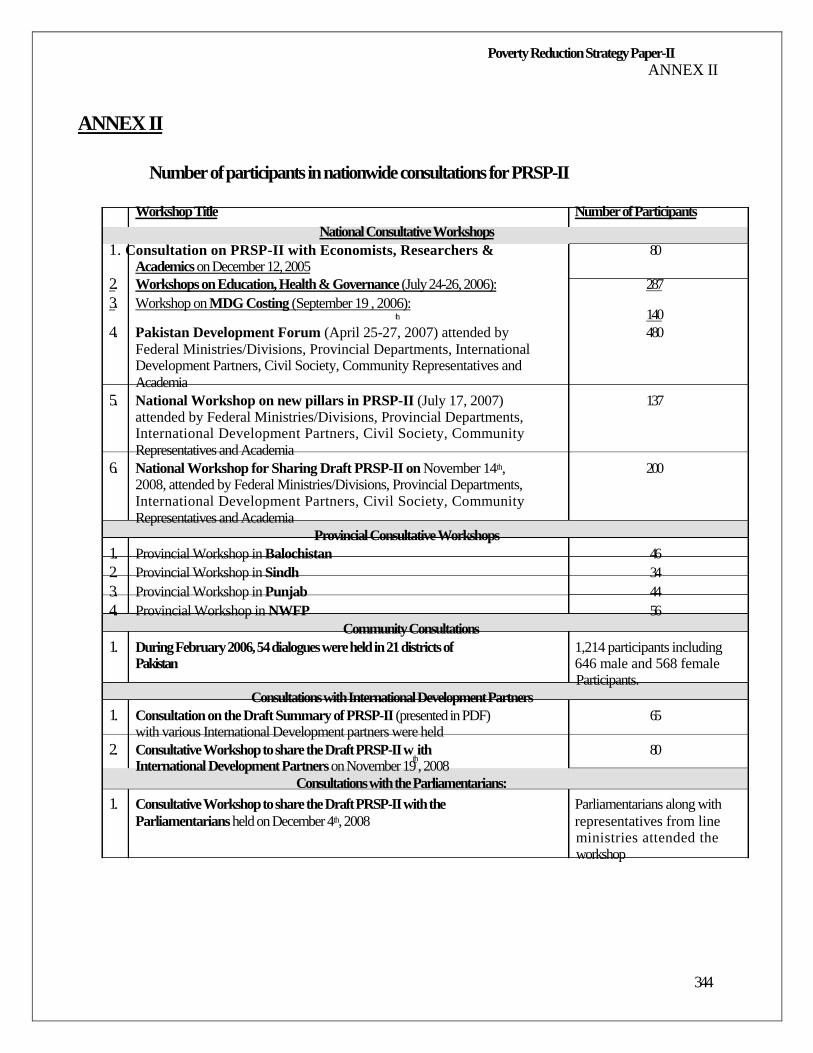
Poverty Reduction Strategy Paper-II ANNEX II
ANNEX II
Number of participants in nationwide consultations for PRSP-II
Workshop Title Number of Participants
National Consultative Workshops
1. Consultation on PRSP-II with Economists, Researchers & 80 Academics on December 12, 2005
2. Workshops on Education, Health & Governance (July 24-26, 2006): 287
3. Workshop on MDG Costing (September 19 , 2006): th 140
4. Pakistan Development Forum (April 25-27, 2007) attended by 480 Federal Ministries/Divisions, Provincial Departments, International Development Partners, Civil Society, Community Representatives and Academia
5. National Workshop on new pillars in PRSP-II (July 17, 2007) 137 attended by Federal Ministries/Divisions, Provincial Departments, International Development Partners, Civil Society, Community Representatives and Academia
6. National Workshop for Sharing Draft PRSP-II on November 14th, 200 2008, attended by Federal Ministries/Divisions, Provincial Departments, International Development Partners, Civil Society, Community Representatives and Academia
Provincial Consultative Workshops
1. Provincial Workshop in Balochistan 46
2. Provincial Workshop in Sindh 34
3. Provincial Workshop in Punjab 44
4. Provincial Workshop in NWFP 56
Community Consultations
1. During February 2006, 54 dialogues were held in 21 districts of 1,214 participants including Pakistan 646 male and 568 female
Participants.
Consultations with International Development Partners 1. Consultation on the Draft Summary of PRSP-II (presented in PDF) 65
with various International Development partners were held 2. Consultative Workshop to share the Draft PRSP-II w
thith 80
International Development Partners on November 19 , 2008 Consultations with the Parliamentarians:
1. Consultative Workshop to share the Draft PRSP-II with the Parliamentarians along with Parliamentarians held on December 4th, 2008 representatives from line
ministries attended the workshop
344
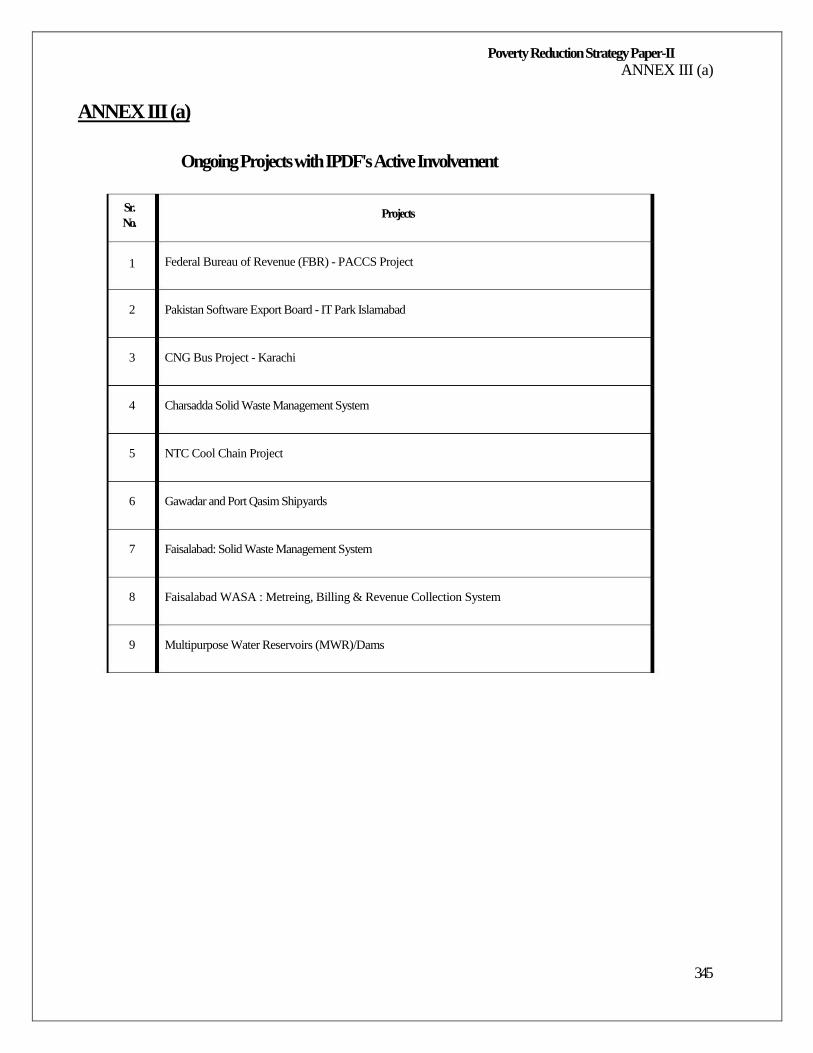
Poverty Reduction Strategy Paper-II ANNEX III (a)
ANNEX III (a)
Ongoing Projects with IPDF's Active Involvement
Sr. No.
1
2
3
4
5
6
7
8
9
Projects
Federal Bureau of Revenue (FBR) - PACCS Project
Pakistan Software Export Board - IT Park Islamabad
CNG Bus Project - Karachi
Charsadda Solid Waste Management System
NTC Cool Chain Project
Gawadar and Port Qasim Shipyards
Faisalabad: Solid Waste Management System
Faisalabad WASA : Metreing, Billing & Revenue Collection System
Multipurpose Water Reservoirs (MWR)/Dams
345
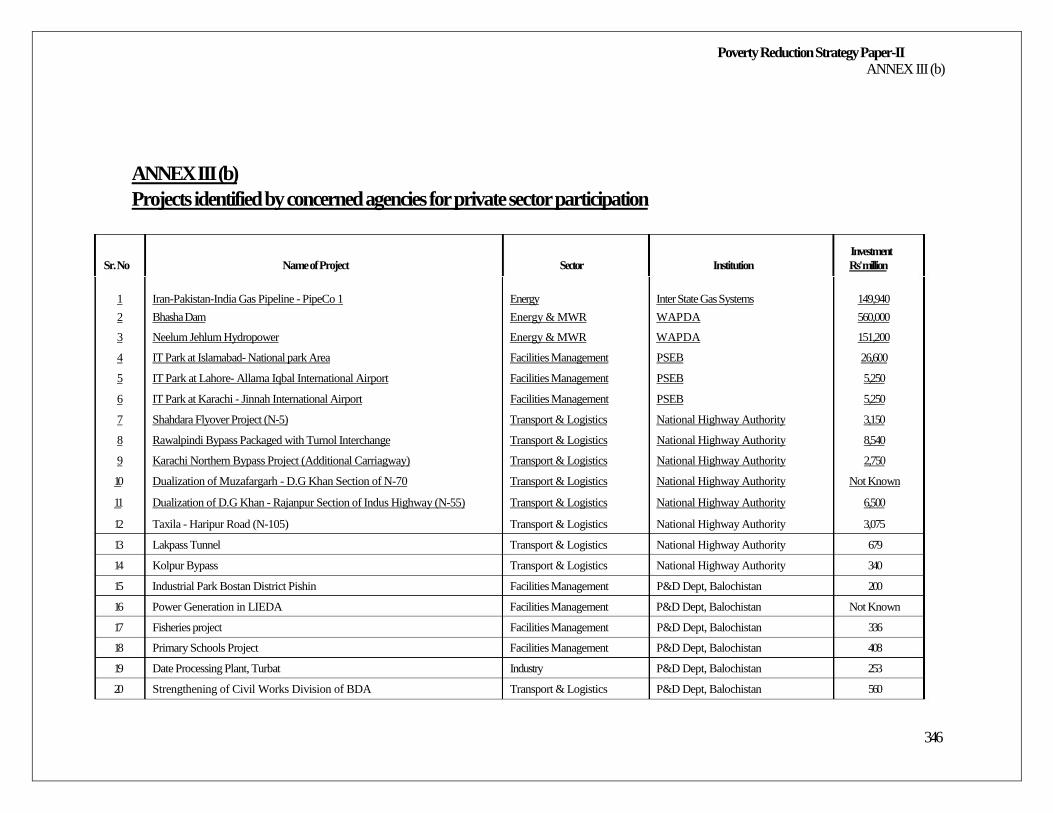
Poverty Reduction Strategy Paper-II ANNEX III (b)
ANNEX III (b)
Projects identified by concerned agencies for private sector participation
Investment Sr. No Name of Project Sector Institution Rs' million
1 Iran-Pakistan-India Gas Pipeline - PipeCo 1 Energy Inter State Gas Systems 149,940
2 Bhasha Dam Energy & MWR WAPDA 560,000
3 Neelum Jehlum Hydropower Energy & MWR WAPDA 151,200
4 IT Park at Islamabad- National park Area Facilities Management PSEB 26,600
5 IT Park at Lahore- Allama Iqbal International Airport Facilities Management PSEB 5,250
6 IT Park at Karachi - Jinnah International Airport Facilities Management PSEB 5,250
7 Shahdara Flyover Project (N-5) Transport & Logistics National Highway Authority 3,150
8 Rawalpindi Bypass Packaged with Turnol Interchange Transport & Logistics National Highway Authority 8,540
9 Karachi Northern Bypass Project (Additional Carriagway) Transport & Logistics National Highway Authority 2,750
10 Dualization of Muzafargarh - D.G Khan Section of N-70 Transport & Logistics National Highway Authority Not Known
11 Dualization of D.G Khan - Rajanpur Section of Indus Highway (N-55) Transport & Logistics National Highway Authority 6,500
12 Taxila - Haripur Road (N-105) Transport & Logistics National Highway Authority 3,075
13 Lakpass Tunnel Transport & Logistics National Highway Authority 679
14 Kolpur Bypass Transport & Logistics National Highway Authority 340
15 Industrial Park Bostan District Pishin Facilities Management P&D Dept, Balochistan 200
16 Power Generation in LIEDA Facilities Management P&D Dept, Balochistan Not Known
17 Fisheries project Facilities Management P&D Dept, Balochistan 336
18 Primary Schools Project Facilities Management P&D Dept, Balochistan 408
19 Date Processing Plant, Turbat Industry P&D Dept, Balochistan 253
20 Strengthening of Civil Works Division of BDA Transport & Logistics P&D Dept, Balochistan 560
346
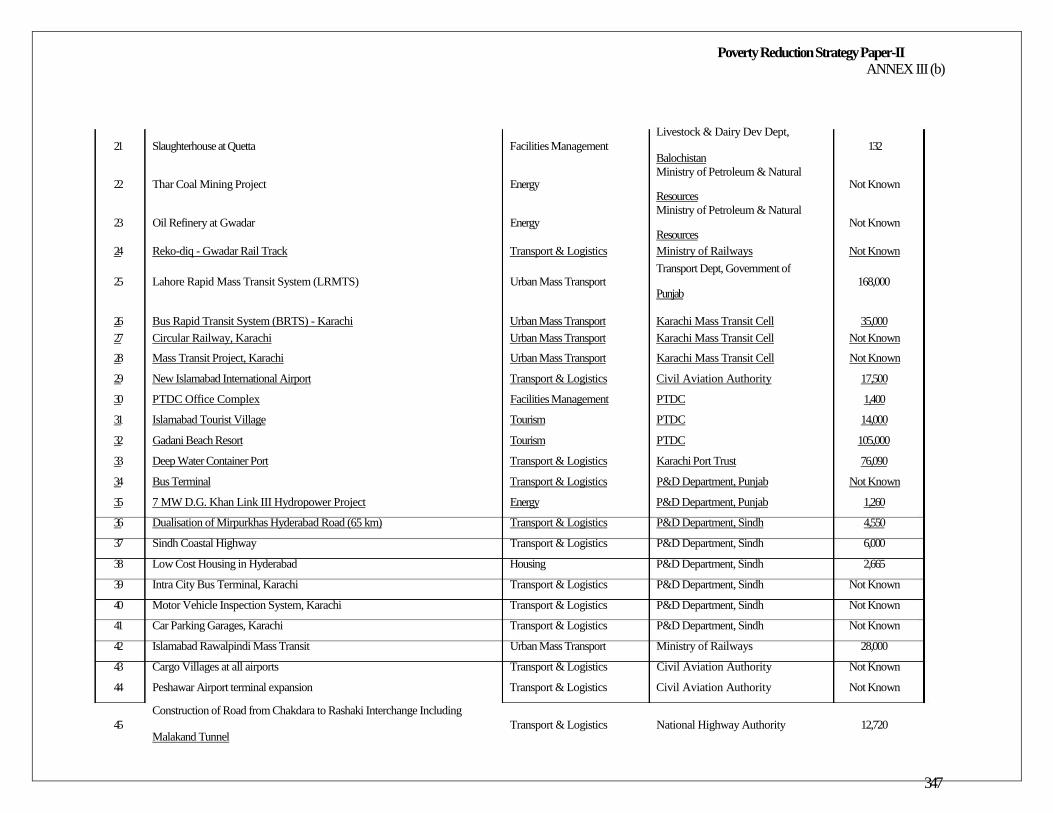
Poverty Reduction Strategy Paper-II ANNEX III (b)
Livestock & Dairy Dev Dept, 21 Slaughterhouse at Quetta Facilities Management 132
Balochistan Ministry of Petroleum & Natural
22 Thar Coal Mining Project Energy Not Known Resources Ministry of Petroleum & Natural
23 Oil Refinery at Gwadar Energy Not Known Resources
24 Reko-diq - Gwadar Rail Track Transport & Logistics Ministry of Railways Not Known Transport Dept, Government of
25 Lahore Rapid Mass Transit System (LRMTS) Urban Mass Transport 168,000 Punjab
26 Bus Rapid Transit System (BRTS) - Karachi Urban Mass Transport Karachi Mass Transit Cell 35,000 27 Circular Railway, Karachi Urban Mass Transport Karachi Mass Transit Cell Not Known
28 Mass Transit Project, Karachi Urban Mass Transport Karachi Mass Transit Cell Not Known
29 New Islamabad International Airport Transport & Logistics Civil Aviation Authority 17,500
30 PTDC Office Complex Facilities Management PTDC 1,400
31 Islamabad Tourist Village Tourism PTDC 14,000
32 Gadani Beach Resort Tourism PTDC 105,000
33 Deep Water Container Port Transport & Logistics Karachi Port Trust 76,090
34 Bus Terminal Transport & Logistics P&D Department, Punjab Not Known
35 7 MW D.G. Khan Link III Hydropower Project Energy P&D Department, Punjab 1,260
36 Dualisation of Mirpurkhas Hyderabad Road (65 km) Transport & Logistics P&D Department, Sindh 4,550
37 Sindh Coastal Highway Transport & Logistics P&D Department, Sindh 6,000
38 Low Cost Housing in Hyderabad Housing P&D Department, Sindh 2,665
39 Intra City Bus Terminal, Karachi Transport & Logistics P&D Department, Sindh Not Known
40 Motor Vehicle Inspection System, Karachi Transport & Logistics P&D Department, Sindh Not Known
41 Car Parking Garages, Karachi Transport & Logistics P&D Department, Sindh Not Known
42 Islamabad Rawalpindi Mass Transit Urban Mass Transport Ministry of Railways 28,000
43 Cargo Villages at all airports Transport & Logistics Civil Aviation Authority Not Known
44 Peshawar Airport terminal expansion Transport & Logistics Civil Aviation Authority Not Known
Construction of Road from Chakdara to Rashaki Interchange Including 45 Transport & Logistics National Highway Authority 12,720
Malakand Tunnel
347
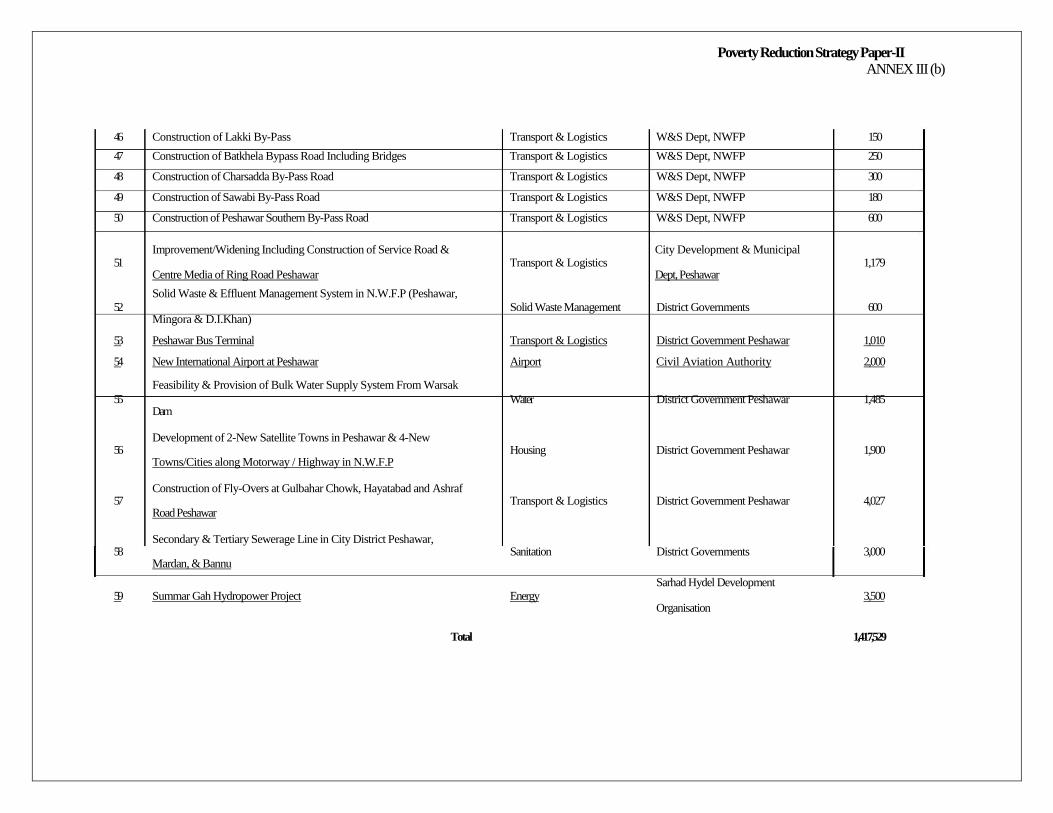
Poverty Reduction Strategy Paper-II ANNEX III (b)
46 Construction of Lakki By-Pass Transport & Logistics W&S Dept, NWFP 150
47 Construction of Batkhela Bypass Road Including Bridges Transport & Logistics W&S Dept, NWFP 250
48 Construction of Charsadda By-Pass Road Transport & Logistics W&S Dept, NWFP 300
49 Construction of Sawabi By-Pass Road Transport & Logistics W&S Dept, NWFP 180
50 Construction of Peshawar Southern By-Pass Road Transport & Logistics W&S Dept, NWFP 600
Improvement/Widening Including Construction of Service Road & City Development & Municipal 51 Transport & Logistics 1,179
Centre Media of Ring Road Peshawar Dept, Peshawar
Solid Waste & Effluent Management System in N.W.F.P (Peshawar, 52 Solid Waste Management District Governments 600
Mingora & D.I.Khan)
53 Peshawar Bus Terminal Transport & Logistics District Government Peshawar 1,010
54 New International Airport at Peshawar Airport Civil Aviation Authority 2,000
Feasibility & Provision of Bulk Water Supply System From Warsak 55 Water District Government Peshawar 1,485
Dam
Development of 2-New Satellite Towns in Peshawar & 4-New 56 Housing District Government Peshawar 1,900
Towns/Cities along Motorway / Highway in N.W.F.P
Construction of Fly-Overs at Gulbahar Chowk, Hayatabad and Ashraf 57 Transport & Logistics District Government Peshawar 4,027
Road Peshawar
Secondary & Tertiary Sewerage Line in City District Peshawar, 58 Sanitation District Governments 3,000
Mardan, & Bannu
Sarhad Hydel Development 59 Summar Gah Hydropower Project Energy 3,500
Organisation
Total 1,417,529

348
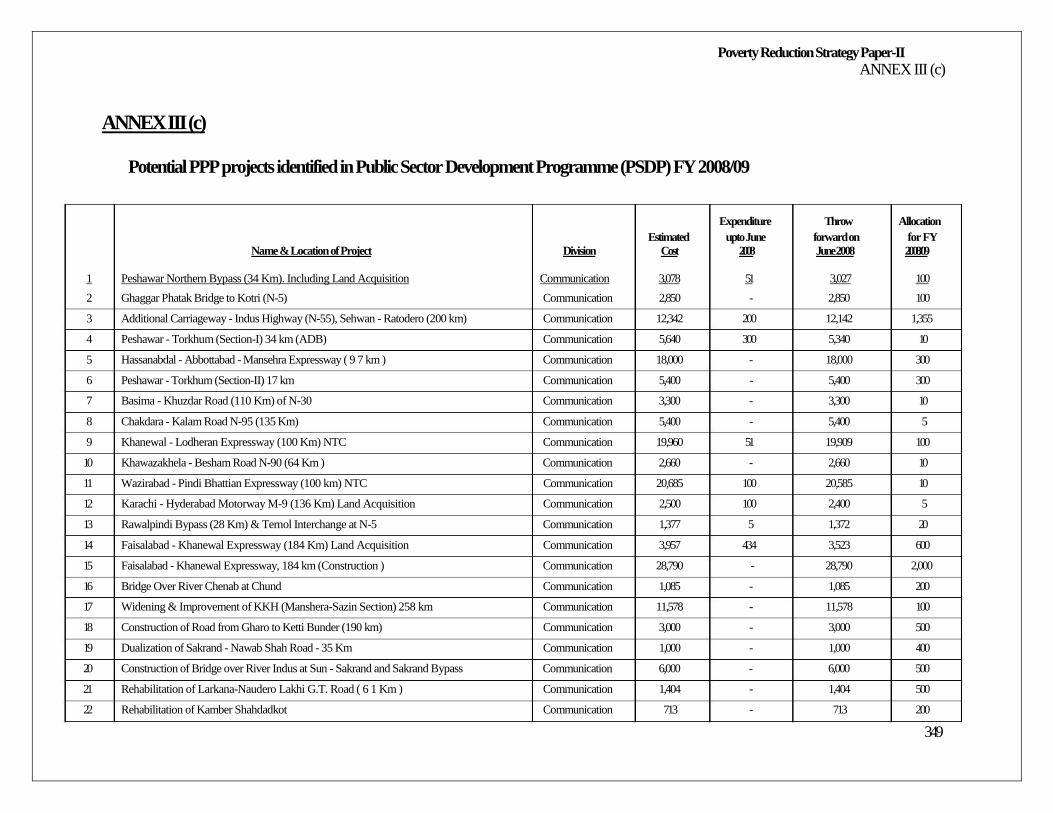
Poverty Reduction Strategy Paper-II ANNEX III (c)
ANNEX III (c)
Potential PPP projects identified in Public Sector Development Programme (PSDP) FY 2008/09
Expenditure Throw Allocation Estimated upto June forward on for FY
Name & Location of Project Division Cost 2008 June 2008 2008/09
1 Peshawar Northern Bypass (34 Km). Including Land Acquisition Communication 3,078 51 3,027 100
2 Ghaggar Phatak Bridge to Kotri (N-5) Communication 2,850 - 2,850 100
3 Additional Carriageway - Indus Highway (N-55), Sehwan - Ratodero (200 km) Communication 12,342 200 12,142 1,355
4 Peshawar - Torkhum (Section-I) 34 km (ADB) Communication 5,640 300 5,340 10
5 Hassanabdal - Abbottabad - Mansehra Expressway ( 9 7 km ) Communication 18,000 - 18,000 300
6 Peshawar - Torkhum (Section-II) 17 km Communication 5,400 - 5,400 300
7 Basima - Khuzdar Road (110 Km) of N-30 Communication 3,300 - 3,300 10
8 Chakdara - Kalam Road N-95 (135 Km) Communication 5,400 - 5,400 5
9 Khanewal - Lodheran Expressway (100 Km) NTC Communication 19,960 51 19,909 100
10 Khawazakhela - Besham Road N-90 (64 Km ) Communication 2,660 - 2,660 10
11 Wazirabad - Pindi Bhattian Expressway (100 km) NTC Communication 20,685 100 20,585 10
12 Karachi - Hyderabad Motorway M-9 (136 Km) Land Acquisition Communication 2,500 100 2,400 5
13 Rawalpindi Bypass (28 Km) & Ternol Interchange at N-5 Communication 1,377 5 1,372 20
14 Faisalabad - Khanewal Expressway (184 Km) Land Acquisition Communication 3,957 434 3,523 600
15 Faisalabad - Khanewal Expressway, 184 km (Construction ) Communication 28,790 - 28,790 2,000
16 Bridge Over River Chenab at Chund Communication 1,085 - 1,085 200
17 Widening & Improvement of KKH (Manshera-Sazin Section) 258 km Communication 11,578 - 11,578 100
18 Construction of Road from Gharo to Ketti Bunder (190 km) Communication 3,000 - 3,000 500
19 Dualization of Sakrand - Nawab Shah Road - 35 Km Communication 1,000 - 1,000 400
20 Construction of Bridge over River Indus at Sun - Sakrand and Sakrand Bypass Communication 6,000 - 6,000 500
21 Rehabilitation of Larkana-Naudero Lakhi G.T. Road ( 6 1 Km ) Communication 1,404 - 1,404 500
22 Rehabilitation of Kamber Shahdadkot Communication 713 - 713 200
349
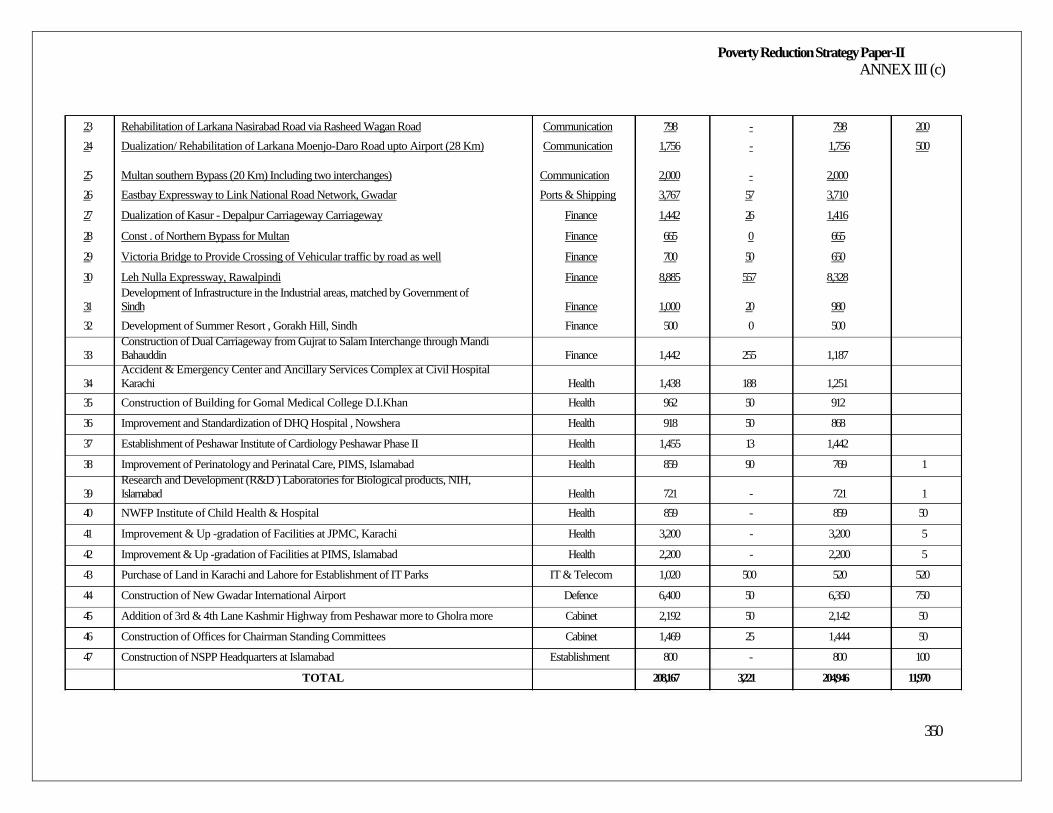
Poverty Reduction Strategy Paper-II ANNEX III (c)
23 Rehabilitation of Larkana Nasirabad Road via Rasheed Wagan Road Communication 798 - 798 200
24 Dualization/ Rehabilitation of Larkana Moenjo-Daro Road upto Airport (28 Km) Communication 1,756 - 1,756 500 25 Multan southern Bypass (20 Km) Including two interchanges) Communication 2,000 - 2,000
26 Eastbay Expressway to Link National Road Network, Gwadar Ports & Shipping 3,767 57 3,710
27 Dualization of Kasur - Depalpur Carriageway Carriageway Finance 1,442 26 1,416
28 Const . of Northern Bypass for Multan Finance 665 0 665
29 Victoria Bridge to Provide Crossing of Vehicular traffic by road as well Finance 700 50 650
30 Leh Nulla Expressway, Rawalpindi Finance 8,885 557 8,328 Development of Infrastructure in the Industrial areas, matched by Government of
31 Sindh Finance 1,000 20 980
32 Development of Summer Resort , Gorakh Hill, Sindh Finance 500 0 500 Construction of Dual Carriageway from Gujrat to Salam Interchange through Mandi
33 Bahauddin Finance 1,442 255 1,187 Accident & Emergency Center and Ancillary Services Complex at Civil Hospital
34 Karachi Health 1,438 188 1,251
35 Construction of Building for Gomal Medical College D.I.Khan Health 962 50 912
36 Improvement and Standardization of DHQ Hospital , Nowshera Health 918 50 868
37 Establishment of Peshawar Institute of Cardiology Peshawar Phase II Health 1,455 13 1,442
38 Improvement of Perinatology and Perinatal Care, PIMS, Islamabad Health 859 90 769 1 Research and Development (R&D ) Laboratories for Biological products, NIH,
39 Islamabad Health 721 - 721 1
40 NWFP Institute of Child Health & Hospital Health 859 - 859 50
41 Improvement & Up -gradation of Facilities at JPMC, Karachi Health 3,200 - 3,200 5
42 Improvement & Up -gradation of Facilities at PIMS, Islamabad Health 2,200 - 2,200 5
43 Purchase of Land in Karachi and Lahore for Establishment of IT Parks IT & Telecom 1,020 500 520 520
44 Construction of New Gwadar International Airport Defence 6,400 50 6,350 750
45 Addition of 3rd & 4th Lane Kashmir Highway from Peshawar more to Gholra more Cabinet 2,192 50 2,142 50
46 Construction of Offices for Chairman Standing Committees Cabinet 1,469 25 1,444 50
47 Construction of NSPP Headquarters at Islamabad Establishment 800 - 800 100
TOTAL 208,167 3,221 204,946 11,970
350
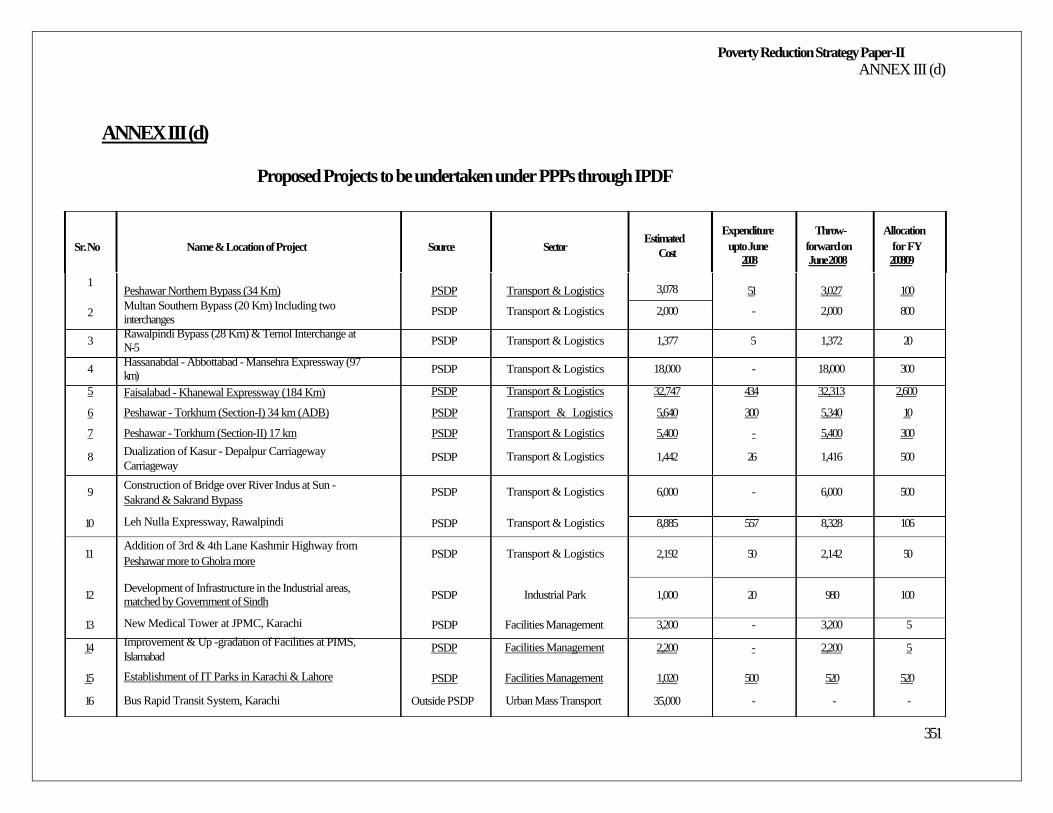
Poverty Reduction Strategy Paper-II ANNEX III (d)
ANNEX III (d)
Proposed Projects to be undertaken under PPPs through IPDF Sr. No
1
2
3
4
5
6
7
8
9
10
11
12
13
14
15
16
Name & Location of Project
Peshawar Northern Bypass (34 Km) Multan Southern Bypass (20 Km) Including two interchanges Rawalpindi Bypass (28 Km) & Ternol Interchange at N-5 Hassanabdal - Abbottabad - Mansehra Expressway (97 km) Faisalabad - Khanewal Expressway (184 Km)
Peshawar - Torkhum (Section-I) 34 km (ADB)
Peshawar - Torkhum (Section-II) 17 km Dualization of Kasur - Depalpur Carriageway Carriageway
Construction of Bridge over River Indus at Sun - Sakrand & Sakrand Bypass
Leh Nulla Expressway, Rawalpindi
Addition of 3rd & 4th Lane Kashmir Highway from Peshawar more to Gholra more Development of Infrastructure in the Industrial areas, matched by Government of Sindh
New Medical Tower at JPMC, Karachi
Improvement & Up -gradation of Facilities at PIMS, Islamabad
Establishment of IT Parks in Karachi & Lahore
Bus Rapid Transit System, Karachi
Source
PSDP
PSDP
PSDP
PSDP
PSDP
PSDP
PSDP
PSDP
PSDP
PSDP
PSDP
PSDP
PSDP
PSDP
PSDP
Outside PSDP
Sector
Transport & Logistics
Transport & Logistics Transport & Logistics Transport & Logistics
Transport & Logistics
Transport & Logistics
Transport & Logistics
Transport & Logistics
Transport & Logistics
Transport & Logistics
Transport & Logistics
Industrial Park
Facilities Management
Facilities Management Facilities Management
Urban Mass Transport
Estimated Cost
3,078
2,000
1,377
18,000
32,747
5,640
5,400
1,442
6,000
8,885
2,192
1,000
3,200
2,200
1,020
35,000
Expenditure upto June
2008
51
-
5
-
434
300
-
26
-
557
50
20
-
-
500
-
Throw- forward on June 2008
3,027
2,000
1,372
18,000
32,313
5,340
5,400
1,416
6,000
8,328
2,142
980
3,200
2,200
520
-
Allocation for FY 2008/09
100
800
20
300
2,600
10
300
500
500
106
50
100
5
5
520
-
351
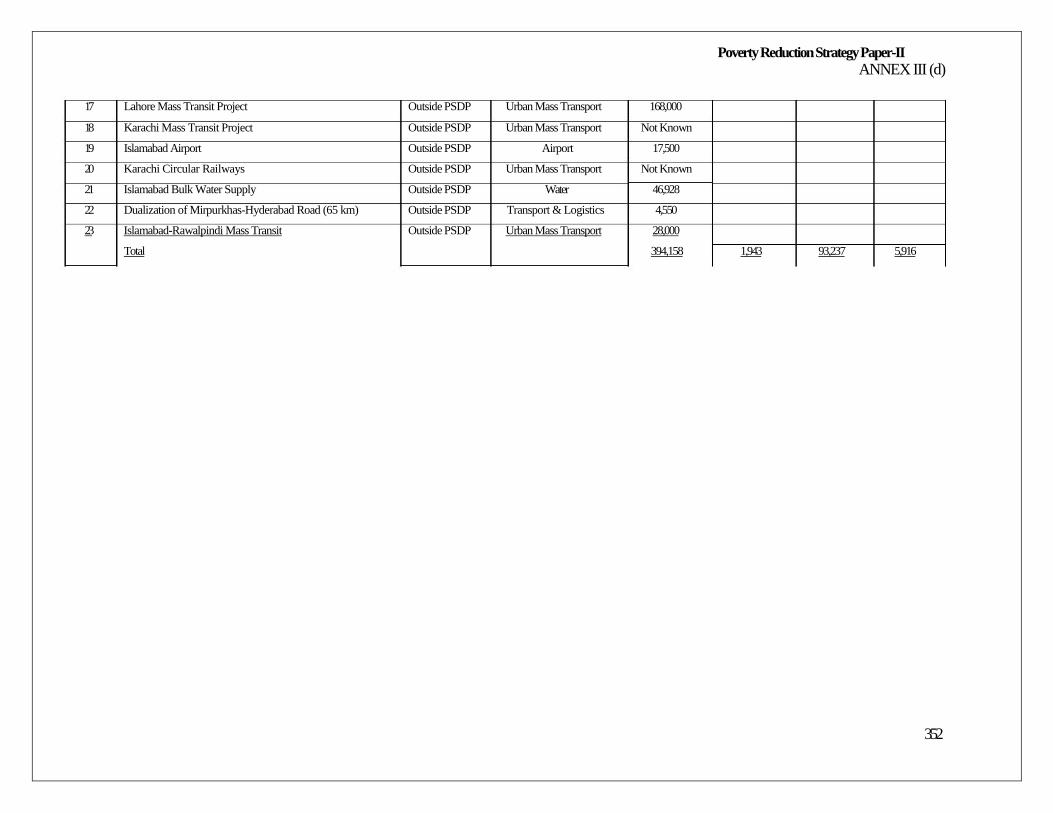
Poverty Reduction Strategy Paper-II ANNEX III (d)
17 Lahore Mass Transit Project Outside PSDP Urban Mass Transport 168,000
18 Karachi Mass Transit Project Outside PSDP Urban Mass Transport Not Known
19 Islamabad Airport Outside PSDP Airport 17,500
20 Karachi Circular Railways Outside PSDP Urban Mass Transport Not Known
21 Islamabad Bulk Water Supply Outside PSDP Water 46,928
22 Dualization of Mirpurkhas-Hyderabad Road (65 km) Outside PSDP Transport & Logistics 4,550
23 Islamabad-Rawalpindi Mass Transit Outside PSDP Urban Mass Transport 28,000
Total 394,158 1,943 93,237 5,916
352
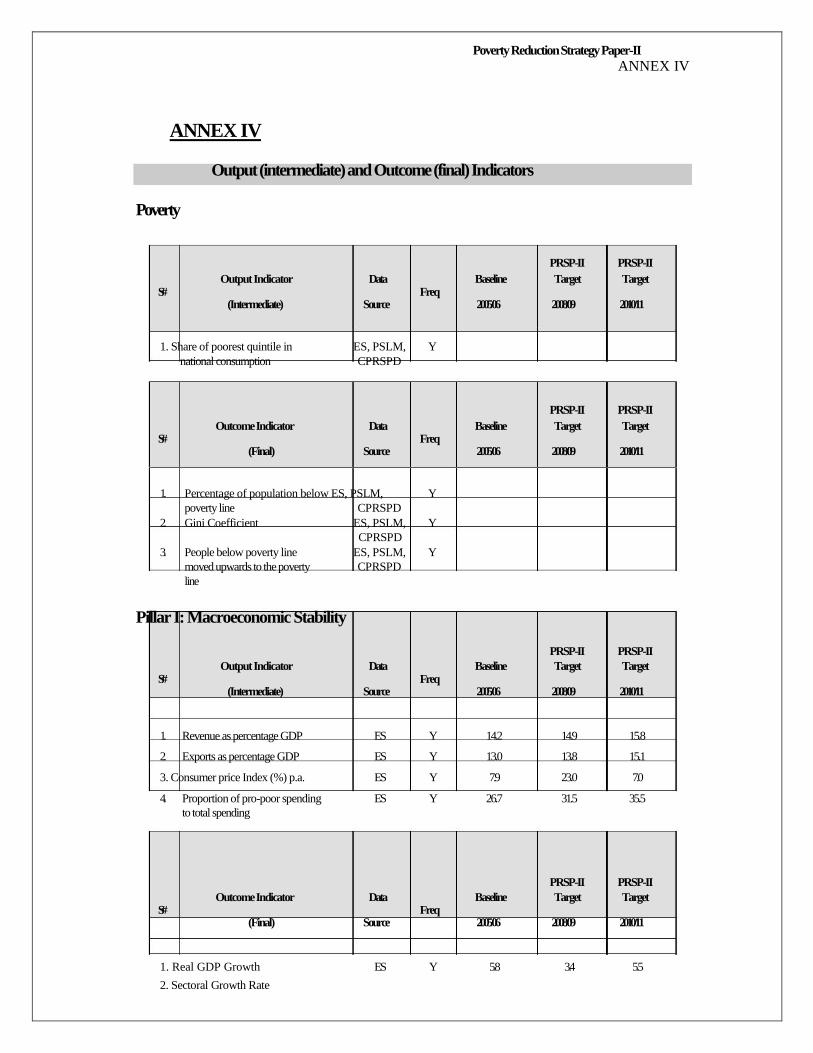
Poverty Reduction Strategy Paper-II ANNEX IV
ANNEX IV
Output (intermediate) and Outcome (final) Indicators
Poverty
PRSP-II PRSP-II Output Indicator Data Baseline Target Target
S# Freq (Intermediate) Source 2005/06 2008/09 2010/11
1. Share of poorest quintile in ES, PSLM, Y national consumption CPRSPD
PRSP-II PRSP-II Outcome Indicator Data Baseline Target Target
S# Freq (Final) Source 2005/06 2008/09 2010/11
1. Percentage of population below ES, PSLM, Y poverty line CPRSPD
2. Gini Coefficient ES, PSLM, Y CPRSPD
3. People below poverty line ES, PSLM, Y moved upwards to the poverty CPRSPD line
Pillar I: Macroeconomic Stability
PRSP-II PRSP-II Output Indicator Data Baseline Target Target
S# Freq (Intermediate) Source 2005/06 2008/09 2010/11
1. Revenue as percentage GDP ES Y 14.2 14.9 15.8
2. Exports as percentage GDP ES Y 13.0 13.8 15.1
3. Consumer price Index (%) p.a. ES Y 7.9 23.0 7.0
4. Proportion of pro-poor spending ES Y 26.7 31.5 35.5 to total spending
PRSP-II PRSP-II Outcome Indicator Data Baseline Target Target
S# Freq (Final) Source 2005/06 2008/09 2010/11
1. Real GDP Growth ES Y 5.8 3 .4 5.5
2. Sectoral Growth Rate

353
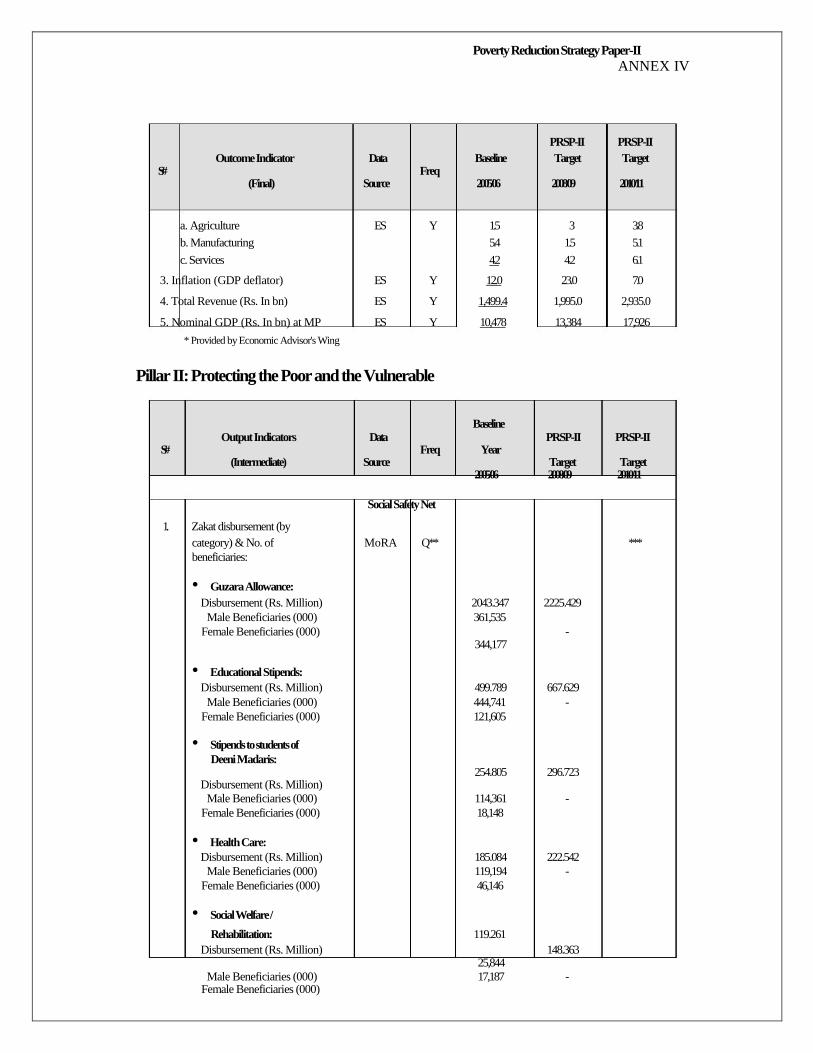
Poverty Reduction Strategy Paper-II ANNEX IV
PRSP-II PRSP-II Outcome Indicator Data Baseline Target Target
S# Freq (Final) Source 2005/06 2008/09 2010/11
a. Agriculture ES Y 1.5 3 3.8 b. Manufacturing 5.4 1.5 5.1 c. Services 4.2 4.2 6.1
3. Inflation (GDP deflator) ES Y 12.0 23.0 7.0
4. Total Revenue (Rs. In bn) ES Y 1,499.4 1,995.0 2,935.0
5. Nominal GDP (Rs. In bn) at MP ES Y 10,478 13,384 17,926 * Provided by Economic Advisor's Wing
Pillar II: Protecting the Poor and the Vulnerable
Baseline Output Indicators Data PRSP-II PRSP-II
S# Freq Year (Intermediate) Source Target Target
2005/06 2008/09 2010/11
Social Safety Net
1. Zakat disbursement (by category) & No. of MoRA Q** *** beneficiaries:
• Guzara Allowance: Disbursement (Rs. Million) 2043.347 2225.429
Male Beneficiaries (000) 361,535 Female Beneficiaries (000) -
344,177
• Educational Stipends: Disbursement (Rs. Million) 499.789 667.629
Male Beneficiaries (000) 444,741 - Female Beneficiaries (000) 121,605
• Stipends to students of
Deeni Madaris: 254.805 296.723
Disbursement (Rs. Million) Male Beneficiaries (000) 114,361 -
Female Beneficiaries (000) 18,148
• Health Care: Disbursement (Rs. Million) 185.084 222.542
Male Beneficiaries (000) 119,194 - Female Beneficiaries (000) 46,146
• Social Welfare /
Rehabilitation: 119.261 Disbursement (Rs. Million) 148.363
25,844 Male Beneficiaries (000) 17,187 -
Female Beneficiaries (000)

354
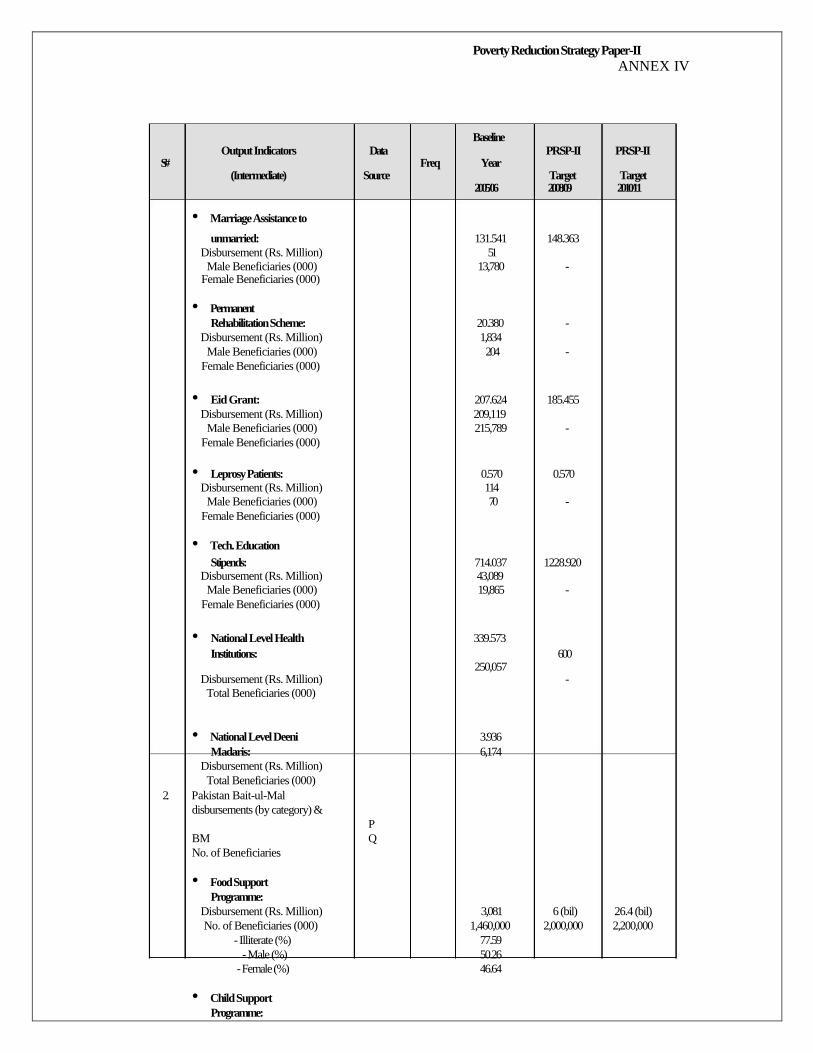
Poverty Reduction Strategy Paper-II ANNEX IV
Baseline
Output Indicators Data PRSP-II PRSP-II S# Freq Year
(Intermediate) Source Target Target 2005/06 2008/09 2010/11
• Marriage Assistance to
unmarried: 131.541 148.363 Disbursement (Rs. Million) 51
Male Beneficiaries (000) 13,780 - Female Beneficiaries (000)
• Permanent Rehabilitation Scheme: 20.380 -
Disbursement (Rs. Million) 1,834 Male Beneficiaries (000) 204 -
Female Beneficiaries (000)
• Eid Grant: 207.624 185.455 Disbursement (Rs. Million) 209,119
Male Beneficiaries (000) 215,789 - Female Beneficiaries (000)
• Leprosy Patients: 0.570 0.570 Disbursement (Rs. Million) 114
Male Beneficiaries (000) 70 - Female Beneficiaries (000)
• Tech. Education Stipends: 714.037 1228.920
Disbursement (Rs. Million) 43,089 Male Beneficiaries (000) 19,865 -
Female Beneficiaries (000)
• National Level Health 339.573 Institutions: 600
250,057 Disbursement (Rs. Million) - Total Beneficiaries (000)
• National Level Deeni 3.936 Madaris: 6,174
Disbursement (Rs. Million) Total Beneficiaries (000)
2. Pakistan Bait-ul-Mal disbursements (by category) &
P
BM Q No. of Beneficiaries
• Food Support Programme:
Disbursement (Rs. Million) 3,081 6 (bil) 26.4 (bil) No. of Beneficiaries (000) 1,460,000 2,000,000 2,200,000
- Illiterate (%) 77.59 - Male (%) 50.26
- Female (%) 46.64
• Child Support Programme:

355
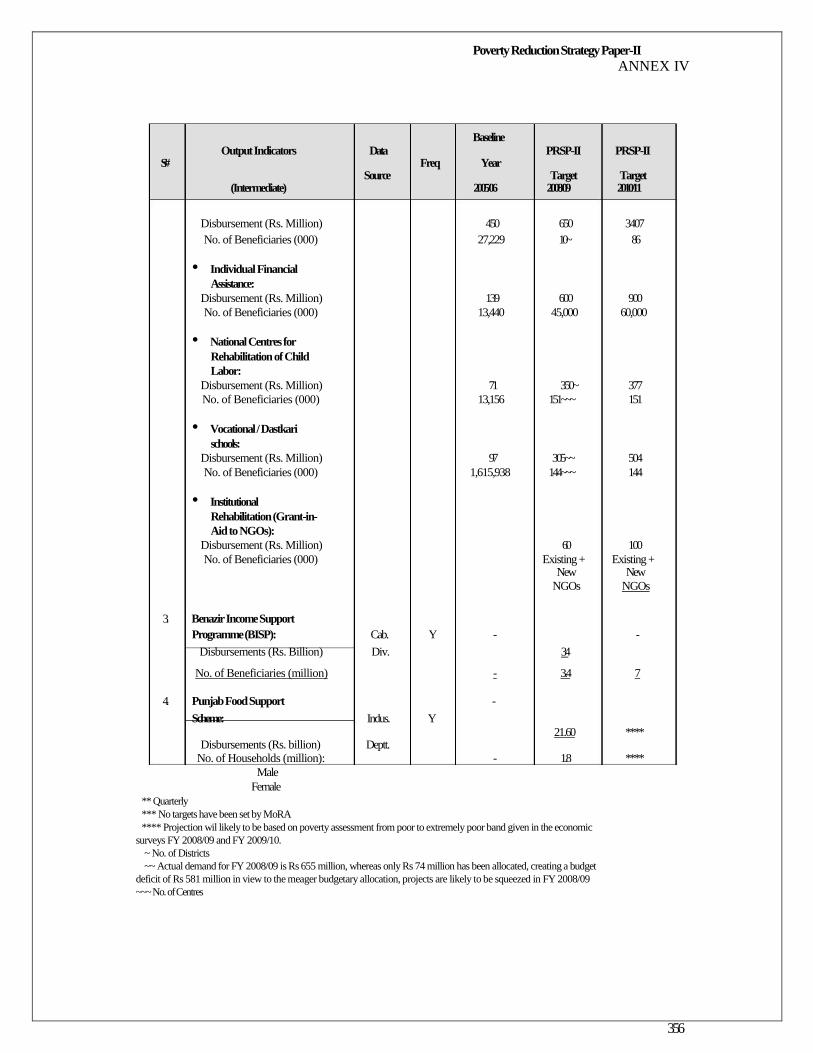
Poverty Reduction Strategy Paper-II ANNEX IV
Baseline
Output Indicators Data PRSP-II PRSP-II S# Freq Year
Source Target Target (Intermediate) 2005/06 2008/09 2010/11
Disbursement (Rs. Million) 450 650 3407 No. of Beneficiaries (000) 27,229 10~ 86
• Individual Financial Assistance:
Disbursement (Rs. Million) 139 600 900 No. of Beneficiaries (000) 13,440 45,000 60,000
• National Centres for Rehabilitation of Child Labor:
Disbursement (Rs. Million) 71 350~ 377 No. of Beneficiaries (000) 13,156 151~~~ 151
• Vocational / Dastkari schools:
Disbursement (Rs. Million) 97 305~~ 504 No. of Beneficiaries (000) 1,615,938 144~~~ 144
• Institutional Rehabilitation (Grant-in- Aid to NGOs):
Disbursement (Rs. Million) 60 100 No. of Beneficiaries (000) Existing + Existing +
New New NGOs NGOs
3. Benazir Income Support Programme (BISP): Cab. Y - -
Disbursements (Rs. Billion) Div. 34
No. of Beneficiaries (million) - 3.4 7
4. Punjab Food Support - Scheme: Indus. Y
21.60 **** Disbursements (Rs. billion) Deptt.
No. of Households (million): - 1.8 **** Male
Female
** Quarterly *** No targets have been set by MoRA **** Projection wil likely to be based on poverty assessment from poor to extremely poor band given in the economic
surveys FY 2008/09 and FY 2009/10. ~ No. of Districts ~~ Actual demand for FY 2008/09 is Rs 655 million, whereas only Rs 74 million has been allocated, creating a budget
deficit of Rs 581 million in view to the meager budgetary allocation, projects are likely to be squeezed in FY 2008/09 ~~~ No. of Centres
356
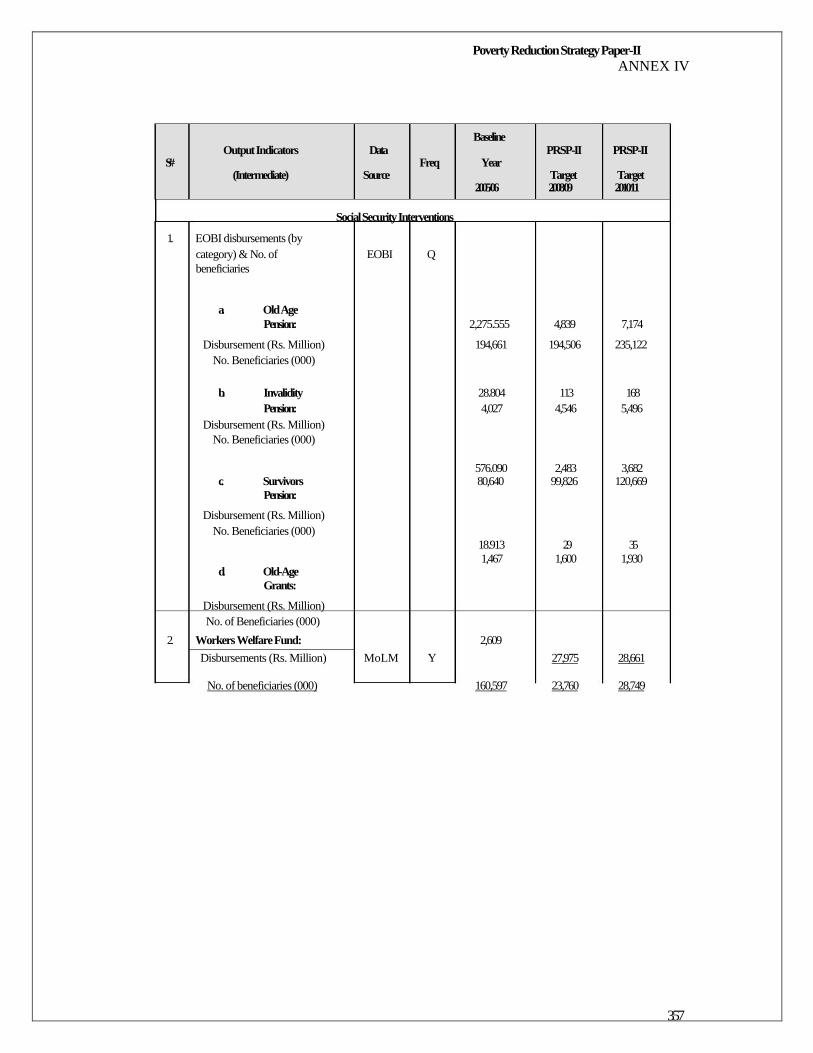
Poverty Reduction Strategy Paper-II ANNEX IV
Baseline Output Indicators Data PRSP-II PRSP-II
S# Freq Year (Intermediate) Source Target Target
2005/06 2008/09 2010/11
Social Security Interventions
1. EOBI disbursements (by category) & No. of EOBI Q beneficiaries
a. Old Age Pension: 2,275.555 4,839 7,174
Disbursement (Rs. Million) 194,661 194,506 235,122 No. Beneficiaries (000)
b. Invalidity 28.804 113 168 Pension: 4,027 4,546 5,496
Disbursement (Rs. Million) No. Beneficiaries (000)
576.090 2,483 3,682
c. Survivors 80,640 99,826 120,669 Pension:
Disbursement (Rs. Million) No. Beneficiaries (000)
18.913 29 35 1,467 1,600 1,930
d. Old-Age Grants:
Disbursement (Rs. Million) No. of Beneficiaries (000)
2. Workers Welfare Fund: 2,609 Disbursements (Rs. Million) MoLM Y 27,975 28,661
No. of beneficiaries (000) 160,597 23,760 28,749
357
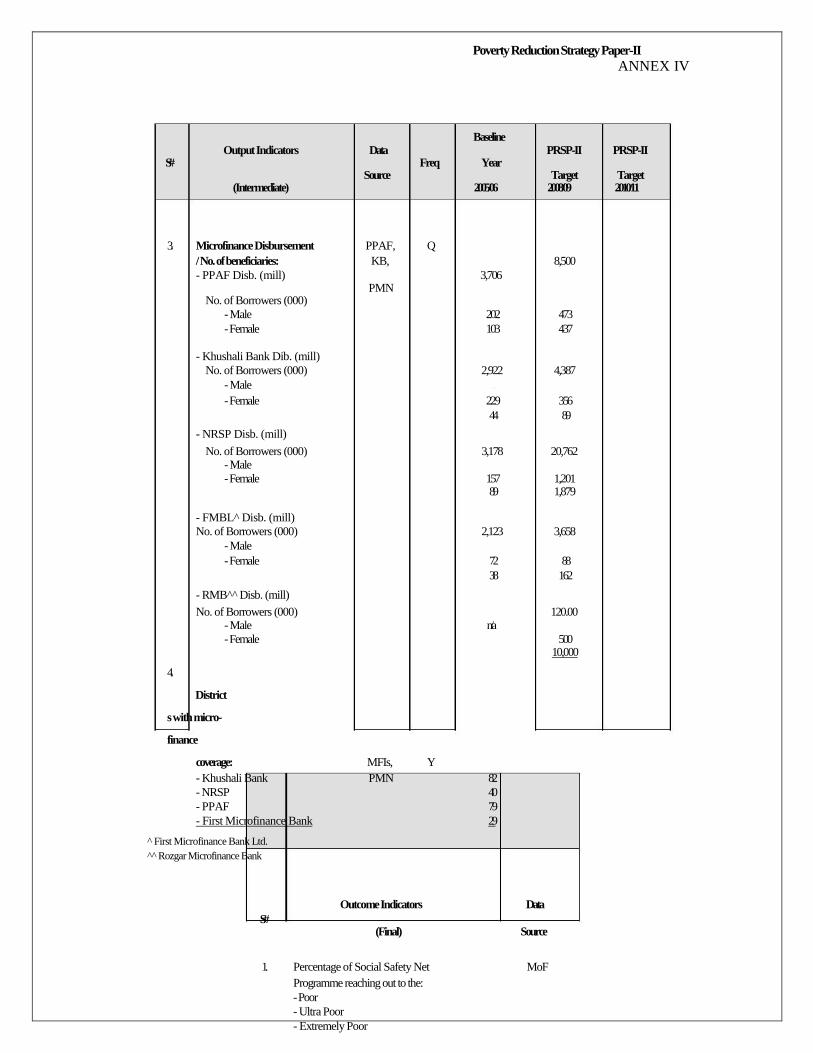
Poverty Reduction Strategy Paper-II ANNEX IV
Baseline Output Indicators Data PRSP-II PRSP-II
S# Freq Year Source Target Target
(Intermediate) 2005/06 2008/09 2010/11
3. Microfinance Disbursement PPAF, Q / No. of beneficiaries: KB, 8,500 - PPAF Disb. (mill) 3,706
PMN No. of Borrowers (000)
- Male 202 473 - Female 103 437
- Khushali Bank Dib. (mill)
No. of Borrowers (000) 2,922 4,387 - Male [ - Female 229 356
44 89
- NRSP Disb. (mill) No. of Borrowers (000) 3,178 20,762
- Male - Female 157 1,201
89 1,879
- FMBL^ Disb. (mill) No. of Borrowers (000) 2,123 3,658
- Male - Female 72 88
38 162
- RMB^ Disb. (mill) No. of Borrowers (000) 120.00
- Male n/a - Female 500
10,000
4.
District
s with micro-
finance
coverage: MFIs, Y - Khushali Bank PMN 82 - NRSP 40 - PPAF 79 - First Microfinance Bank 29
First Microfinance Bank Ltd. ^ Rozgar Microfinance Bank
Outcome Indicators Data S#
(Final) Source
1. Percentage of Social Safety Net MoF Programme reaching out to the: - Poor - Ultra Poor - Extremely Poor
Pillar III: Increasing Productivity and Value Addition in Agriculture
358
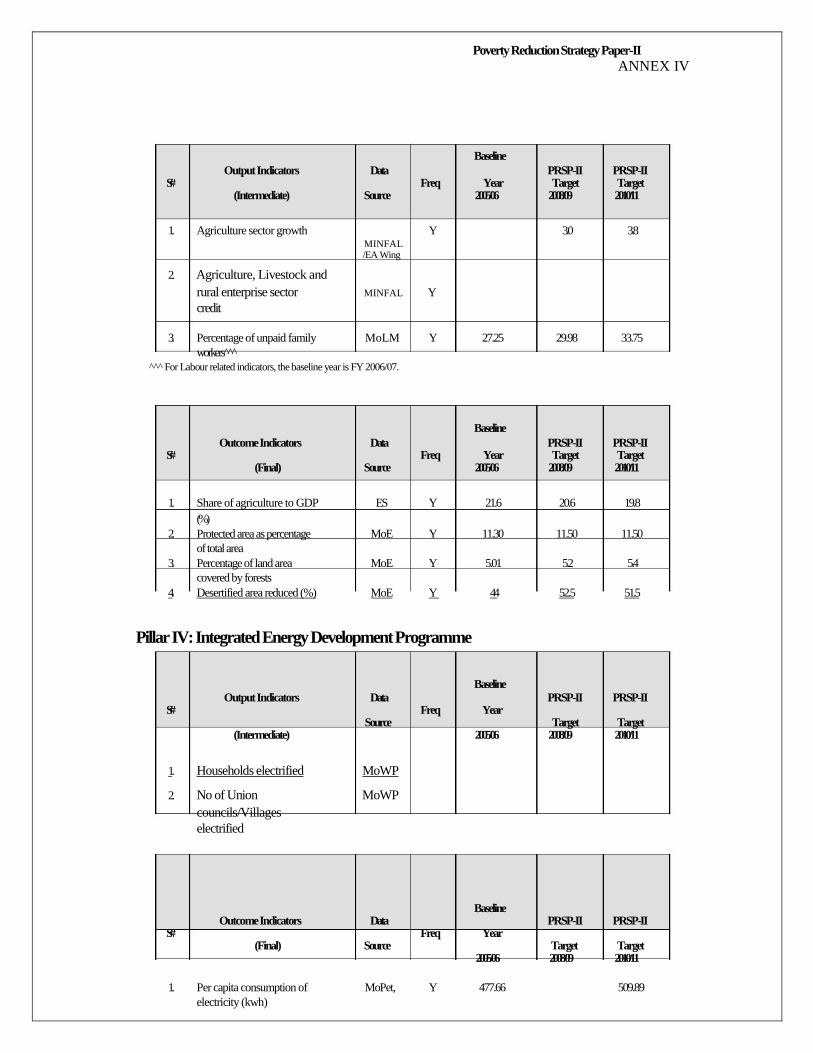
Poverty Reduction Strategy Paper-II ANNEX IV
Baseline Output Indicators Data PRSP-II PRSP-II
S# Freq Year Target Target (Intermediate) Source 2005/06 2008/09 2010/11
1. Agriculture sector growth Y 3.0 3.8 MINFAL /EA Wing
2. Agriculture, Livestock and rural enterprise sector MINFAL Y credit
3. Percentage of unpaid family MoLM Y 27.25 29.98 33.75 workers ^
^^ For Labour related indicators, the baseline year is FY 2006/07.
Baseline Outcome Indicators Data PRSP-II PRSP-II
S# Freq Year Target Target (Final) Source 2005/06 2008/09 2010/11
1. Share of agriculture to GDP ES Y 21.6 20.6 19.8 (%)
2. Protected area as percentage MoE Y 11.30 11.50 11.50 of total area
3. Percentage of land area MoE Y 5.01 5.2 5.4 covered by forests
4. Desertified area reduced (%) MoE Y 44 52.5 51.5
Pillar IV: Integrated Energy Development Programme
Baseline Output Indicators Data PRSP-II PRSP-II
S# Freq Year Source Target Target
(Intermediate) 2005/06 2008/09 2010/11
1. Households electrified MoWP
2. No of Union MoWP councils/Villages electrified
Baseline Outcome Indicators Data PRSP-II PRSP-II
S# Freq Year (Final) Source Target Target
2005/06 2008/09 2010/11
1. Per capita consumption of MoPet, Y 477.66 509.89 electricity (kwh)

359
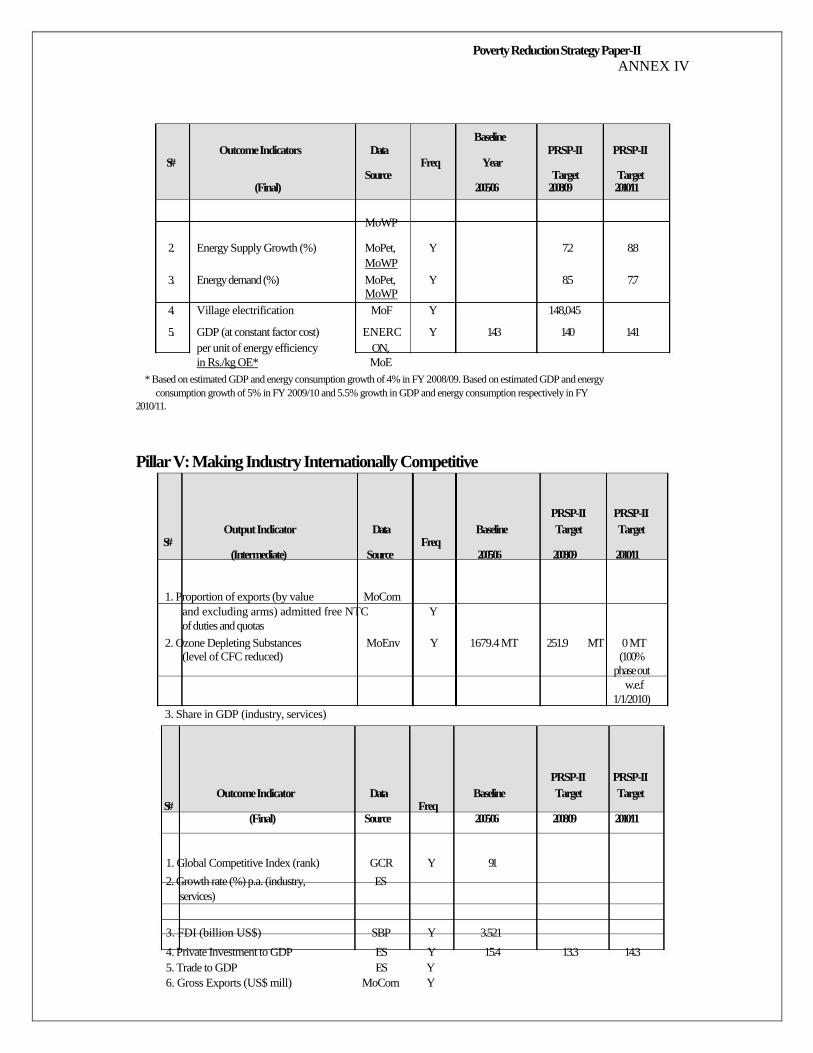
Poverty Reduction Strategy Paper-II ANNEX IV
Baseline Outcome Indicators Data PRSP-II PRSP-II
S# Freq Year Source Target Target
(Final) 2005/06 2008/09 2010/11
MoWP
2. Energy Supply Growth (%) MoPet, Y 7.2 8.8 MoWP
3. Energy demand (%) MoPet, Y 8.5 7.7 MoWP
4. Village electrification MoF Y 148,045
5. GDP (at constant factor cost) ENERC Y 143 140 141 per unit of energy efficiency ON, in Rs./kg OE* MoE
* Based on estimated GDP and energy consumption growth of 4% in FY 2008/09. Based on estimated GDP and energy consumption growth of 5% in FY 2009/10 and 5.5% growth in GDP and energy consumption respectively in FY
2010/11.
Pillar V: Making Industry Internationally Competitive
PRSP-II PRSP-II Output Indicator Data Baseline Target Target
S# Freq (Intermediate) Source 2005/06 2008/09 2010/11
1. Proportion of exports (by value MoCom
and excluding arms) admitted free NTC Y of duties and quotas
2. Ozone Depleting Substances MoEnv Y 1679.4 MT 251.9 MT 0 MT (level of CFC reduced) (100%
phase out w.e.f
1/1/2010) 3. Share in GDP (industry, services)
PRSP-II PRSP-II Outcome Indicator Data Baseline Target Target
S# Freq (Final) Source 2005/06 2008/09 2010/11
1. Global Competitive Index (rank) GCR Y 91
2. Growth rate (%) p.a. (industry, ES services)
3. FDI (billion US$) SBP Y 3.521
4. Private Investment to GDP ES Y 15.4 13.3 14.3 5. Trade to GDP ES Y 6. Gross Exports (US$ mill) MoCom Y

360
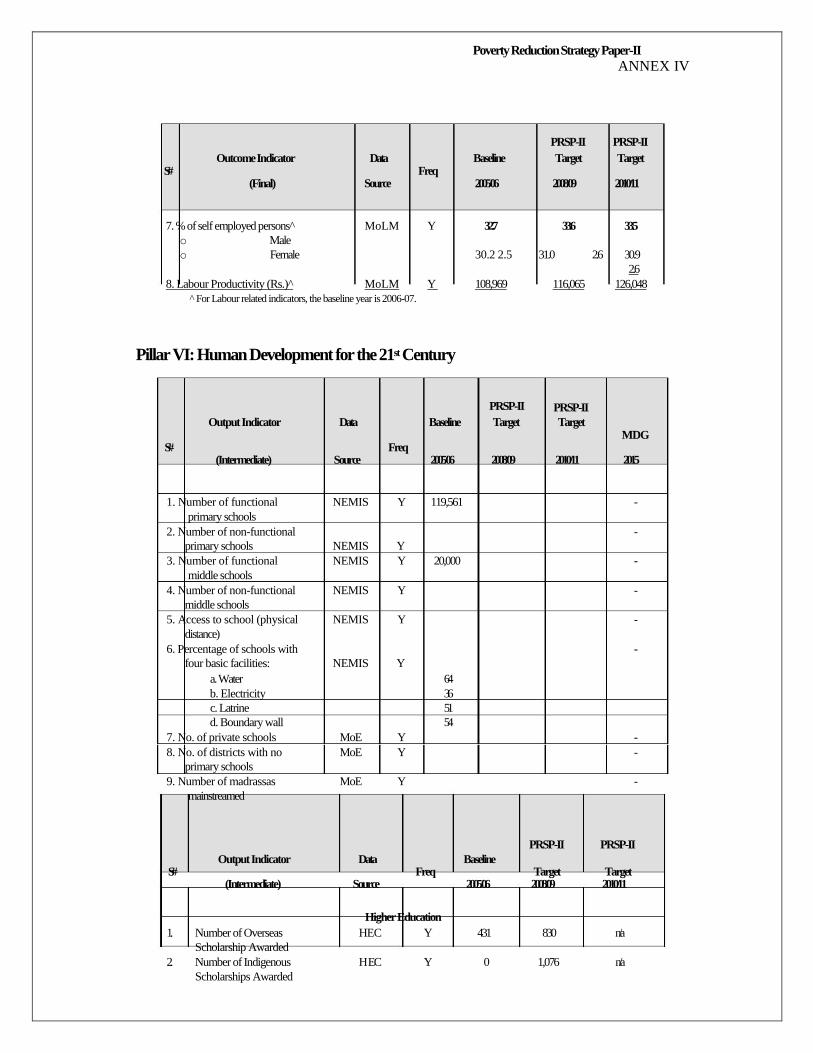
Poverty Reduction Strategy Paper-II ANNEX IV
PRSP-II PRSP-II Outcome Indicator Data Baseline Target Target
S# Freq (Final) Source 2005/06 2008/09 2010/11
7. % of self employed persons MoLM Y 32.7 33.6 33.5 o Male o Female 30.2 2.5 31.0 2.6 30.9
2.6
8. Labour Productivity (Rs.) MoLM Y 108,969 116,065 126,048
For Labour related indicators, the baseline year is 2006-07.
Pillar VI: Human Development for the 21st Century
PRSP-II Output Indicator Data Baseline Target
PRSP-II Target
MDG S# Freq
(Intermediate) Source 2005/06 2008/09 2010/11 2015
1. Number of functional NEMIS Y 119,561 - primary schools
2. Number of non-functional - primary schools NEMIS Y
3. Number of functional NEMIS Y 20,000 - middle schools
4. Number of non-functional NEMIS Y - middle schools
5. Access to school (physical NEMIS Y - distance)
6. Percentage of schools with - four basic facilities: NEMIS Y
a. Water 64 b. Electricity 36 c. Latrine 51 d. Boundary wall 54
7. No. of private schools MoE Y - 8. No. of districts with no MoE Y -
primary schools 9. Number of madrassas MoE Y -
mainstreamed
PRSP-II PRSP-II Output Indicator Data Baseline
S# Freq Target Target (Intermediate) Source 2005/06 2008/09 2010/11
Higher Education
1. Number of Overseas HEC Y 431 830 n/a Scholarship Awarded
2. Number of Indigenous H EC Y 0 1,076 n/a Scholarships Awarded

361
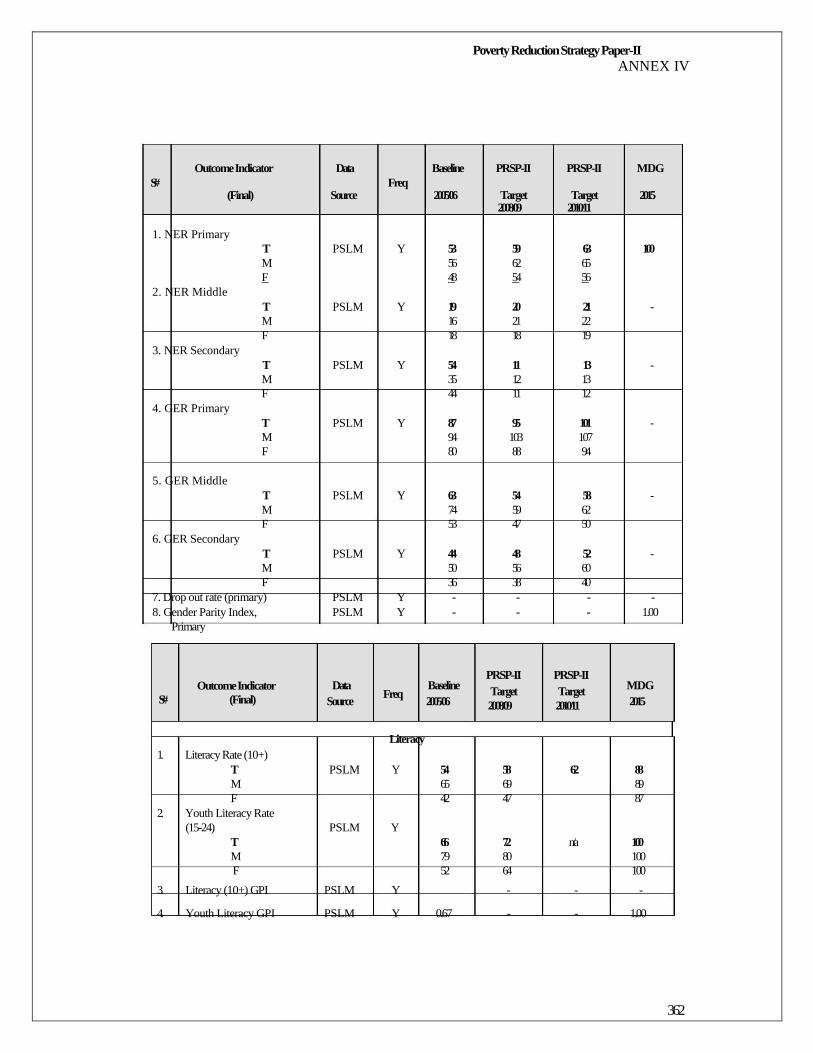
Poverty Reduction Strategy Paper-II ANNEX IV
Outcome Indicator Data Baseline PRSP-II PRSP-II MDG S# Freq
(Final) Source 2005/06 Target Target 2015 2008/09 2010/11
1. NER Primary
T PSLM Y 53 59 63 100 M 56 62 65 F 48 54 56
2. NER Middle T PSLM Y 19 20 21 - M 16 21 22 F 18 18 19
3. NER Secondary T PSLM Y 54 11 13 - M 35 12 13 F 44 11 12
4. GER Primary T PSLM Y 87 95 101 - M 94 103 107 F 80 88 94
5. GER Middle T PSLM Y 63 54 58 - M 74 59 62 F 53 47 50
6. GER Secondary T PSLM Y 44 48 52 - M 50 56 60 F 36 38 40
7. Drop out rate (primary) 8. Gender Parity Index,
Primary
Outcome Indicator S# (Final)
PSLM PSLM
Data Source
Y Y
Freq
- -
Baseline 2005/06
- -
PRSP-II Target 2008/09
- -
PRSP-II Target 2010/11
- 1.00
MDG 2015
Literacy 1. Literacy Rate (10+)
T PSLM Y 54 58 62 88 M 65 69 89 F 42 47 87
2. Youth Literacy Rate (15-24) PSLM Y
T 66 72 n/a 100 M 79 80 100 F 52 64 100
3. Literacy (10+) GPI PSLM Y - - -
4. Youth Literacy GPI PSLM Y 0.67 - - 1.00
362
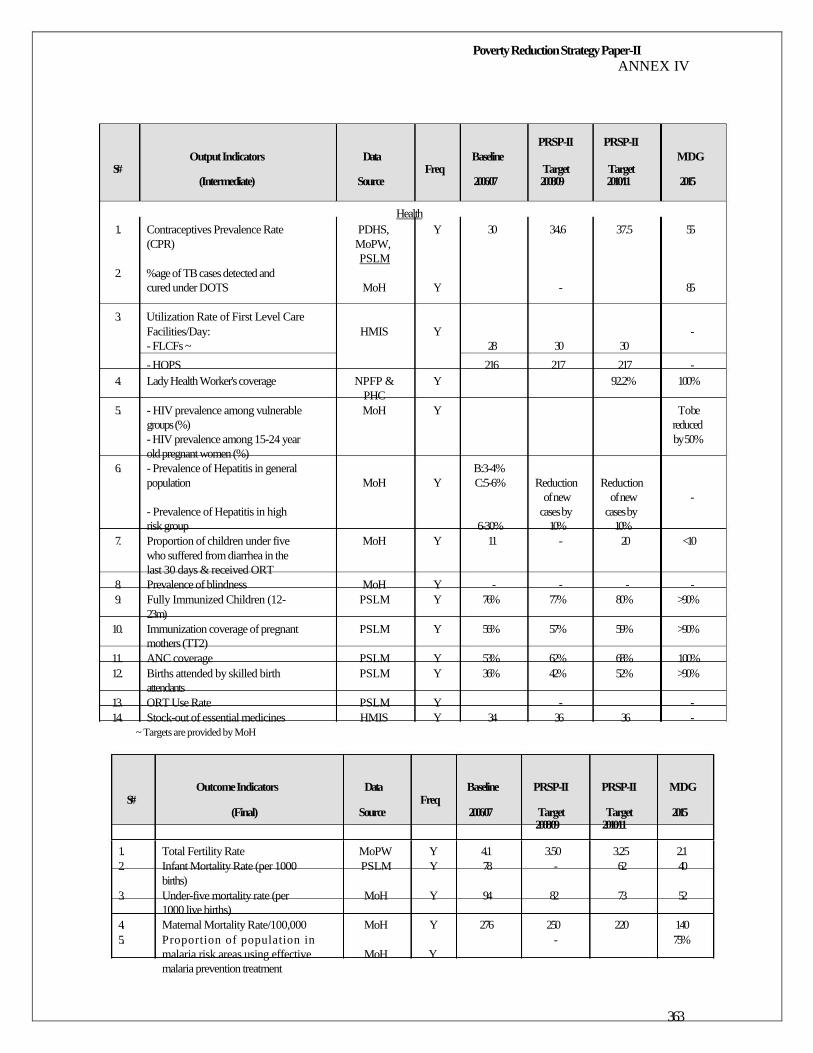
Poverty Reduction Strategy Paper-II ANNEX IV
PRSP-II PRSP-II Output Indicators Data Baseline MDG
S# Freq Target Target (Intermediate) Source 2006/07 2008/09 2010/11 2015
Health 1. Contraceptives Prevalence Rate PDHS, Y 30 34.6 37.5 55
(CPR) MoPW, PSLM
2. %age of TB cases detected and cured under DOTS MoH Y - 85
3. Utilization Rate of First Level Care Facilities/Day: HMIS Y - - FLCFs ~ 28 30 30
- HOPS 216 217 217 -
4. Lady Health Worker's coverage NPFP & Y 92.2% 100% PHC
5. - HIV prevalence among vulnerable MoH Y T o be groups (%) reduced - HIV prevalence among 15-24 year by 50% old pregnant women (%)
6. - Prevalence of Hepatitis in general B:3-4% population MoH Y C:5-6% Reduction Reduction
of new of new - - Prevalence of Hepatitis in high cases by cases by risk group 6-30% 10% 10%
7. Proportion of children under five MoH Y 11 - 20 <10 who suffered from diarrhea in the last 30 days & received ORT
8. Prevalence of blindness MoH Y - - - - 9. Fully Immunized Children (12- PSLM Y 76% 77% 80% >90%
23m) 10. Immunization coverage of pregnant PSLM Y 56% 57% 59% >90%
mothers (TT2) 11. ANC coverage PSLM Y 53% 62% 68% 100% 12. Births attended by skilled birth PSLM Y 36% 42% 52% >90%
attendants 13. ORT Use Rate PSLM Y - - 14. Stock-out of essential medicines HMIS Y 34 36 36 -
~ Targets are provided by MoH
Outcome Indicators Data Baseline PRSP-II PRSP-II MDG S# Freq
(Final) Source 2006/07 Target Target 2015 2008/09 2010/11
1. Total Fertility Rate MoPW Y 4.1 3.50 3.25 2 .1 2. Infant Mortality Rate (per 1000 PSLM Y 78 - 62 40
births) 3. Under-five mortality rate (per MoH Y 94 82 73 52
1000 live births) 4. Maternal Mortality Rate/100,000 MoH Y 276 250 220 140 5. Proportion of population in - 75%
malaria risk areas using effective MoH Y malaria prevention treatment
363
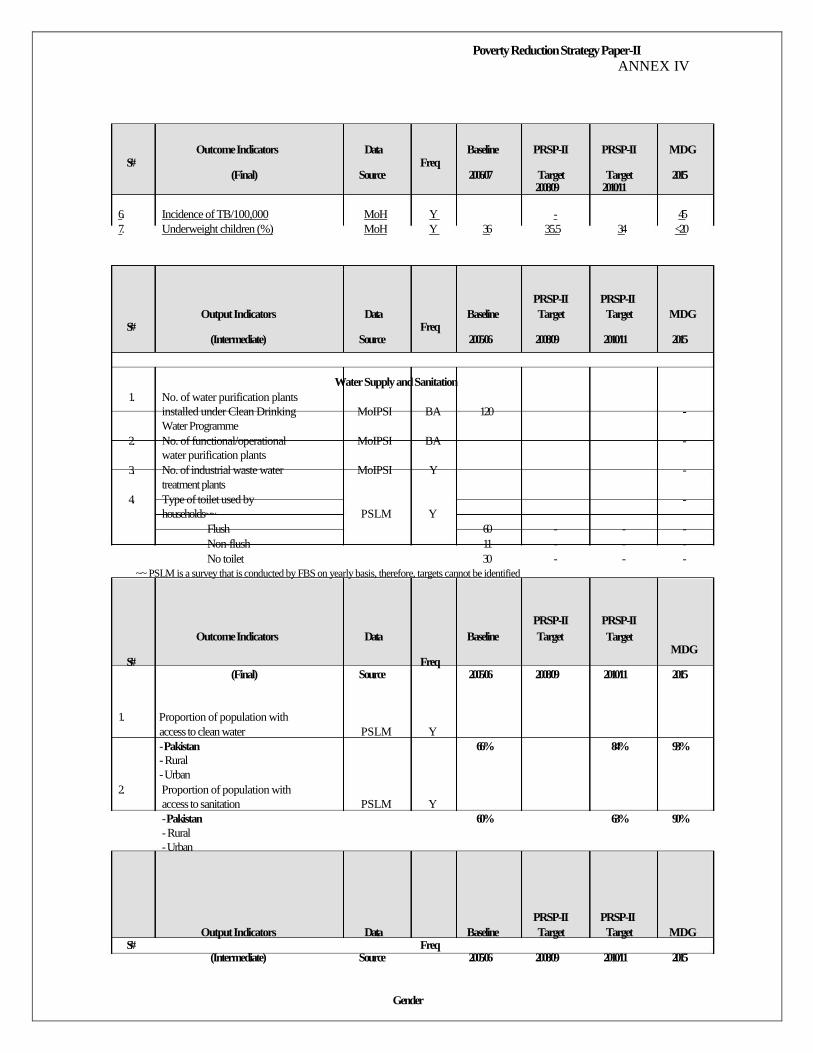
Poverty Reduction Strategy Paper-II ANNEX IV
Outcome Indicators Data Baseline PRSP-II PRSP-II MDG S# Freq
(Final) Source 2006/07 Target Target 2015 2008/09 2010/11
6. Incidence of TB/100,000 MoH Y - 45 7. Underweight children (%) MoH Y 36 35.5 34 <20
PRSP-II PRSP-II Output Indicators Data Baseline Target Target MDG
S# Freq (Intermediate) Source 2005/06 2008/09 2010/11 2015
Water Supply and Sanitation 1. No. of water purification plants
installed under Clean Drinking MoIPSI BA 120 - Water Programme
2. No. of functional/operational MoIPSI BA - water purification plants
3. No. of industrial waste water MoIPSI Y - treatment plants
4. Type of toilet used by - households~~ PSLM Y
Flush 60 - - - Non-flush 11 - - - No toilet 30 - - -
~~ PSLM is a survey that is conducted by FBS on yearly basis, therefore, targets cannot be identified
PRSP-II Outcome Indicators Data Baseline Target
PRSP-II Target
MDG S# Freq
(Final) Source 2005/06 2008/09 2010/11 2015
1. Proportion of population with access to clean water PSLM Y - Pakistan 66% 84% 93% - Rural - Urban
2. Proportion of population with access to sanitation PSLM Y - Pakistan 60% 63% 90% - Rural - Urban
PRSP-II PRSP-II Output Indicators Data Baseline Target Target MDG
S# Freq (Intermediate) Source 2005/06 2008/09 2010/11 2015
Gender

364
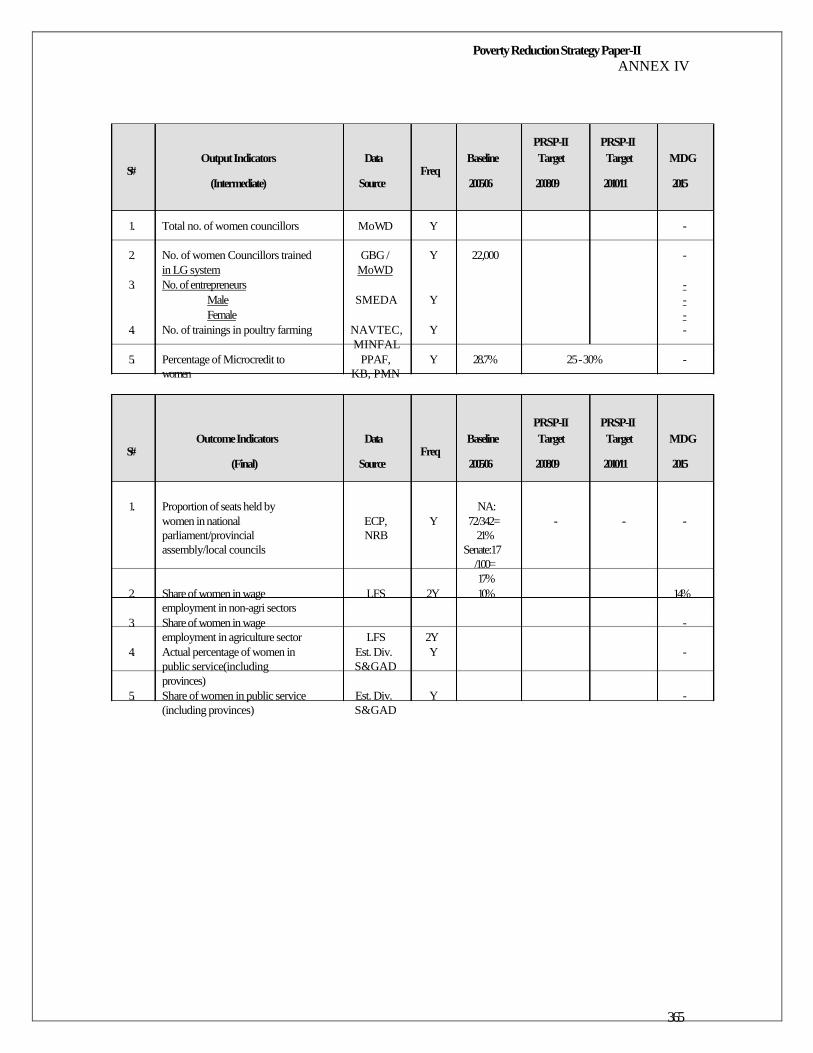
Poverty Reduction Strategy Paper-II ANNEX IV
PRSP-II PRSP-II Output Indicators Data Baseline Target Target MDG
S# Freq (Intermediate) Source 2005/06 2008/09 2010/11 2015
1. Total no. of women councillors M o WD Y -
2. No. of women Councillors trained GBG / Y 22,000 - in LG system MoWD
3. No. of entrepreneurs - Male SMEDA Y - Female -
4. No. of trainings in poultry farming NAVTEC, Y - MINFAL
5. Percentage of Microcredit to PPAF, Y 28.7% 25 - 30% - women KB, PMN
PRSP-II PRSP-II Outcome Indicators Data Baseline Target Target MDG
S# Freq (Final) Source 2005/06 2008/09 2010/11 2015
1. Proportion of seats held by NA: women in national ECP, Y 72/342= - - - parliament/provincial NRB 21% assembly/local councils Senate:17
/100= 17%
2. Share of women in wage LFS 2Y 10% 14% employment in non-agri sectors
3. Share of women in wage - employment in agriculture sector LFS 2Y
4. Actual percentage of women in Est. Div. Y - public service(including S&GAD provinces)
5. Share of women in public service Est. Div. Y - (including provinces) S&GAD
365
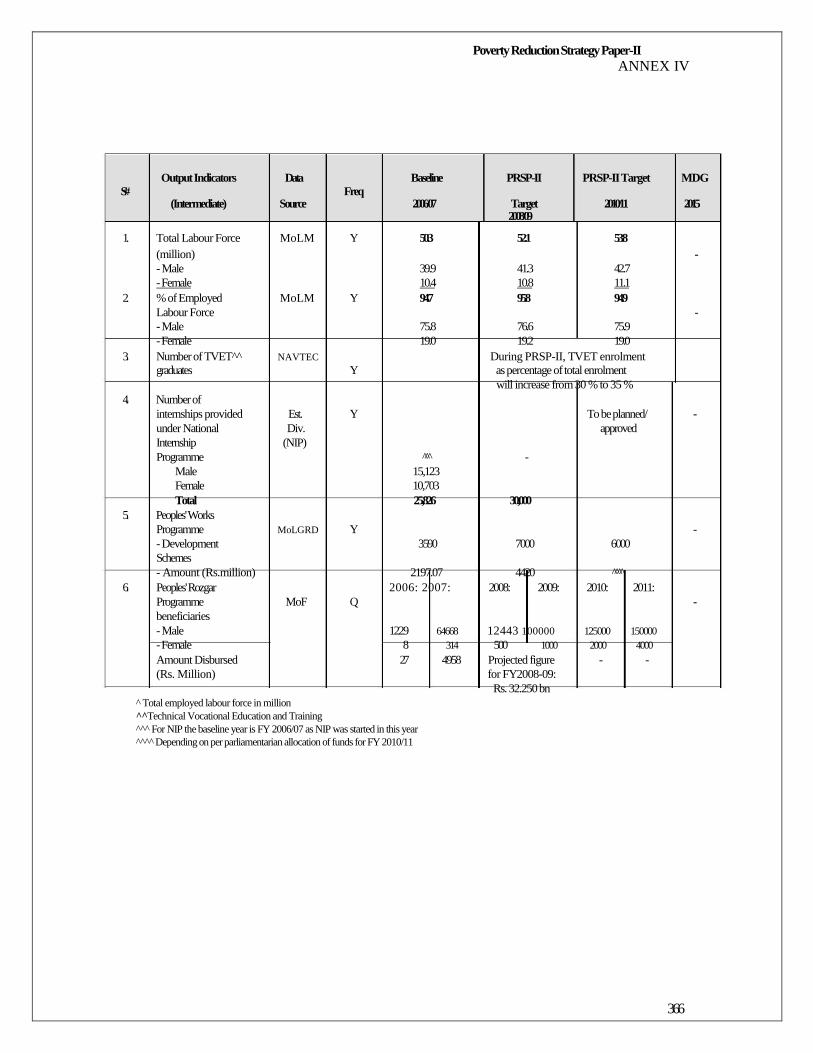
Poverty Reduction Strategy Paper-II ANNEX IV
Output Indicators Data Baseline PRSP-II PRSP-II Target MDG S# Freq
(Intermediate) Source 2006/07 Target 2010/11 2015 2008/09
1. Total Labour Force MoLM Y 50.3 52.1 53.8 (million) - - Male 39.9 41.3 42.7 - Female 10.4 10.8 11.1
2. % of Employed MoLM Y 94.7 95.8 94.9 Labour Force - - Male 75.8 76.6 75.9 - Female 19.0 19.2 19.0
3. Number of TVET^ NAVTEC During PRSP-II, TVET enrolment graduates Y as percentage of total enrolment
will increase from 30 % to 35 % 4. Number of
internships provided Est. Y To be planned/ - under National Div. approved Internship (NIP) Programme ^ -
Male 15,123 Female 10,703 Total 25,826 30,000
5. Peoples' Works Programme MoLGRD Y - - Development 3590 7000 6000 Schemes - Amount (Rs.million) 2197.07 4420 ^^
6. Peoples' Rozgar 2006: 2007: 2008: 2009: 2010: 2011: Programme MoF Q - beneficiaries - Male 1229 64668 12443 100000 125000 150000 - Female 8 314 500 1000 2000 4000 Amount Disbursed 27 4958 Projected figure - - (Rs. Million) for FY2008-09:
Rs. 32.250 bn
Total employed labour force in million ^^Technical Vocational Education and Training ^^ For NIP the baseline year is FY 2006/07 as NIP was started in this year ^^^ Depending on per parliamentarian allocation of funds for FY 2010/11
366
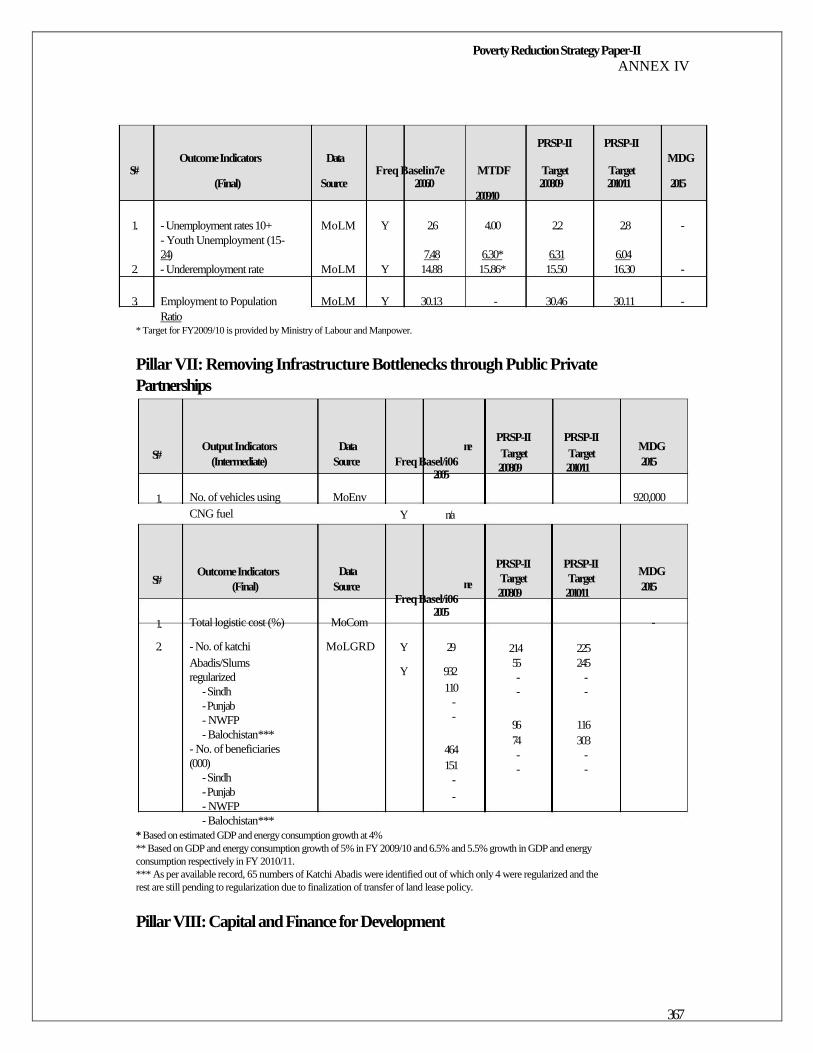
Poverty Reduction Strategy Paper-II ANNEX IV
PRSP-II PRSP-II Outcome Indicators Data MDG
S# Freq Baselin7e MTDF Target Target (Final) Source 2006/0 2008/09 2010/11 2015
2009/10
1. - Unemployment rates 10+ MoLM Y 2.6 4.00 2.2 2.8 - - Youth Unemployment (15- 24) 7.48 6.30* 6.31 6.04
2. - Underemployment rate MoLM Y 14.88 15.86* 15.50 16.30 -
3. Employment to Population MoLM Y 30.13 - 30.46 30.11 - Ratio
* Target for FY2009/10 is provided by Ministry of Labour and Manpower.
Pillar VII: Removing Infrastructure Bottlenecks through Public Private
Partnerships
S.#
1.
S.#
1.
2.
Output Indicators (Intermediate)
No. of vehicles using CNG fuel
Outcome Indicators (Final)
Total logistic cost (%)
- No. of katchi Abadis/Slums regularized
- Sindh - Punjab - NWFP - Balochistan***
- No. of beneficiaries (000)
- Sindh - Punjab - NWFP - Balochistan***
Data Source
MoEnv
Data Source
MoCom
MoLGRD
ne Freq Basel/i06
2005 Y n/a
ne Freq Basel/i06
2005
Y 29
Y 932 110
- -
464 151
- -
PRSP-II Target 2008/09
PRSP-II Target 2008/09
214 55 - -
96 74 - -
PRSP-II Target 2010/11
PRSP-II Target 2010/11
225 245
- -
116 303
- -
MDG 2015
920,000
MDG 2015
-
* Based on estimated GDP and energy consumption growth at 4% ** Based on GDP and energy consumption growth of 5% in FY 2009/10 and 6.5% and 5.5% growth in GDP and energy consumption respectively in FY 2010/11. *** As per available record, 65 numbers of Katchi Abadis were identified out of which only 4 were regularized and the rest are still pending to regularization due to finalization of transfer of land lease policy.
Pillar VIII: Capital and Finance for Development
367
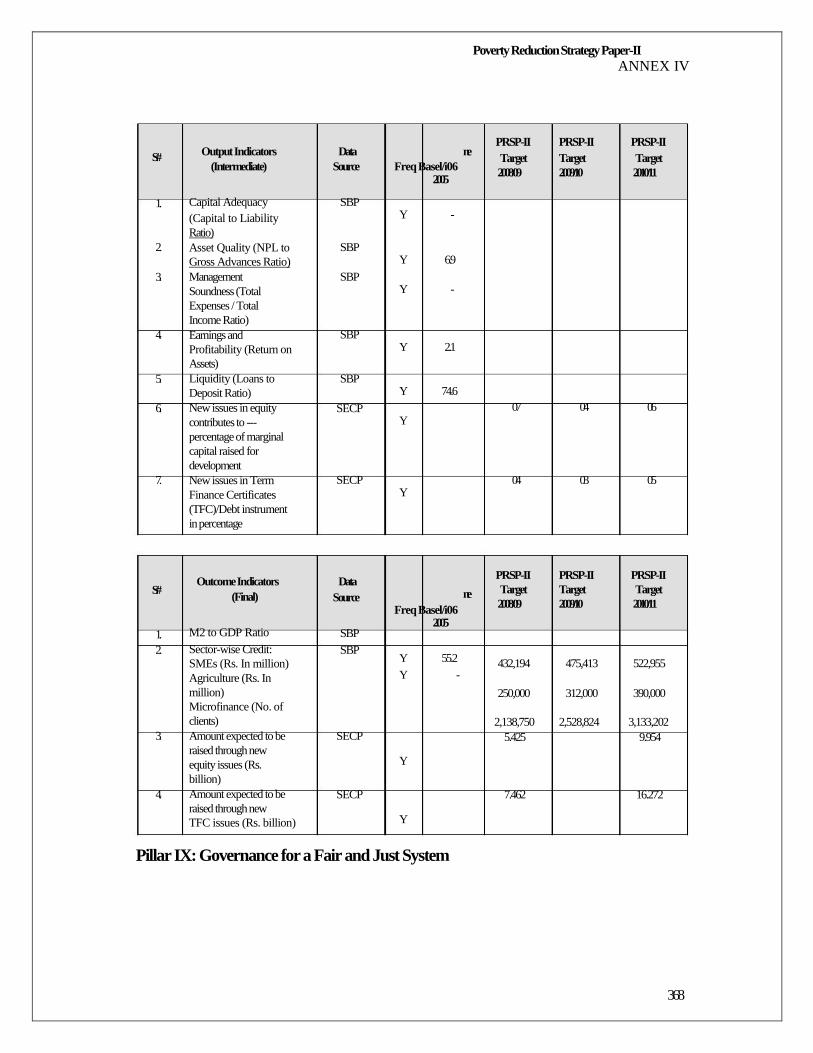
Poverty Reduction Strategy Paper-II ANNEX IV
S.#
1.
2.
3.
4.
5.
6.
7.
S.#
1. 2.
3.
4.
Output Indicators (Intermediate)
Capital Adequacy (Capital to Liability Ratio) Asset Quality (NPL to Gross Advances Ratio) Management Soundness (Total Expenses / Total Income Ratio) Earnings and Profitability (Return on Assets) Liquidity (Loans to Deposit Ratio) New issues in equity contributes to --- percentage of marginal capital raised for development New issues in Term Finance Certificates (TFC)/Debt instrument in percentage
Outcome Indicators (Final)
M2 to GDP Ratio Sector-wise Credit: SMEs (Rs. In million) Agriculture (Rs. In million) Microfinance (No. of clients) Amount expected to be raised through new equity issues (Rs. billion) Amount expected to be raised through new TFC issues (Rs. billion)
Data Source
SBP
SBP
SBP
SBP
SBP
SECP
SECP
Data Source
SBP SBP
SECP
SECP
ne Freq Basel/i06
2005
Y -
Y 6.9
Y -
Y 2.1
Y 74.6
Y
Y
ne Freq Basel/i06
2005
Y 55.2 Y -
Y
Y
PRSP-II Target 2008/09
07
04 PRSP-II Target 2008/09
432,194 250,000
2,138,750
5.425
7.462
PRSP-II Target 2009/10
04
03 PRSP-II Target 2009/10
475,413
312,000 2,528,824
PRSP-II Target 2010/11
06
05 PRSP-II Target 2010/11
522,955 390,000
3,133,202
9.954
16.272
Pillar IX: Governance for a Fair and Just System
368
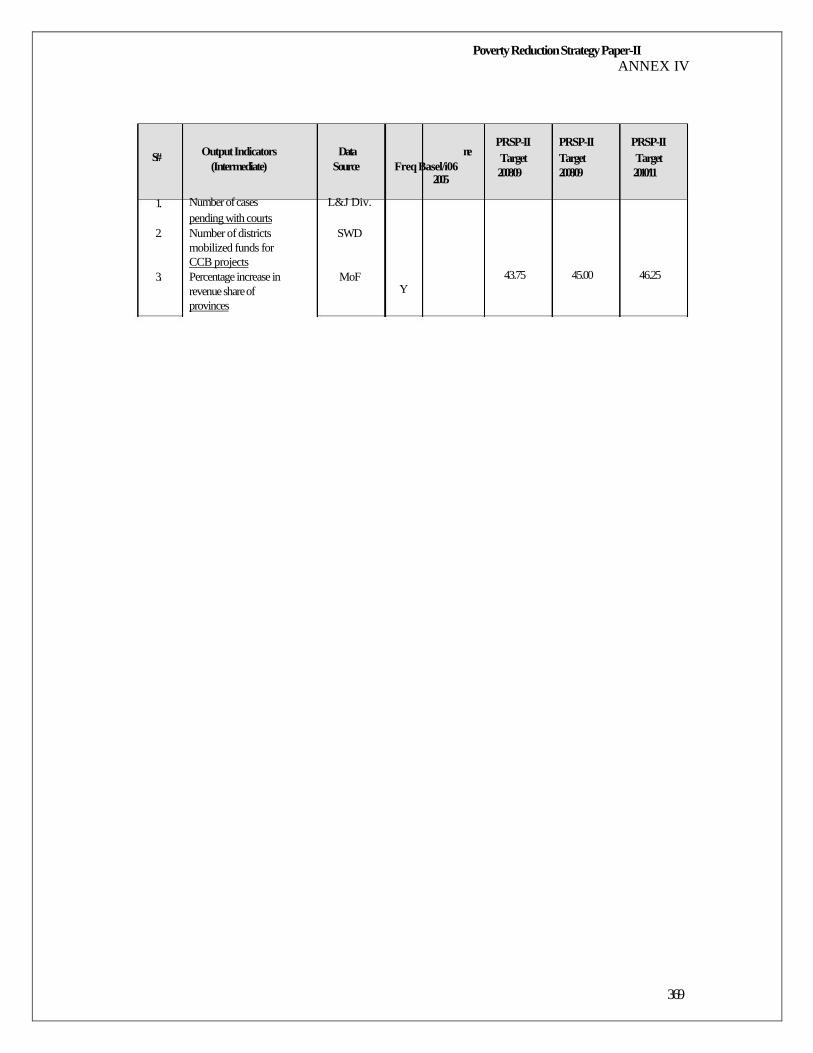
Poverty Reduction Strategy Paper-II ANNEX IV
S.#
1.
2.
3.
Output Indicators (Intermediate)
Number of cases pending with courts Number of districts mobilized funds for CCB projects Percentage increase in revenue share of provinces
Data Source
L&J Div.
SWD
MoF
ne Freq Basel/i06
2005
Y
PRSP-II Target 2008/09
43.75
PRSP-II Target 2008/09
45.00
PRSP-II Target 2010/11
46.25
369
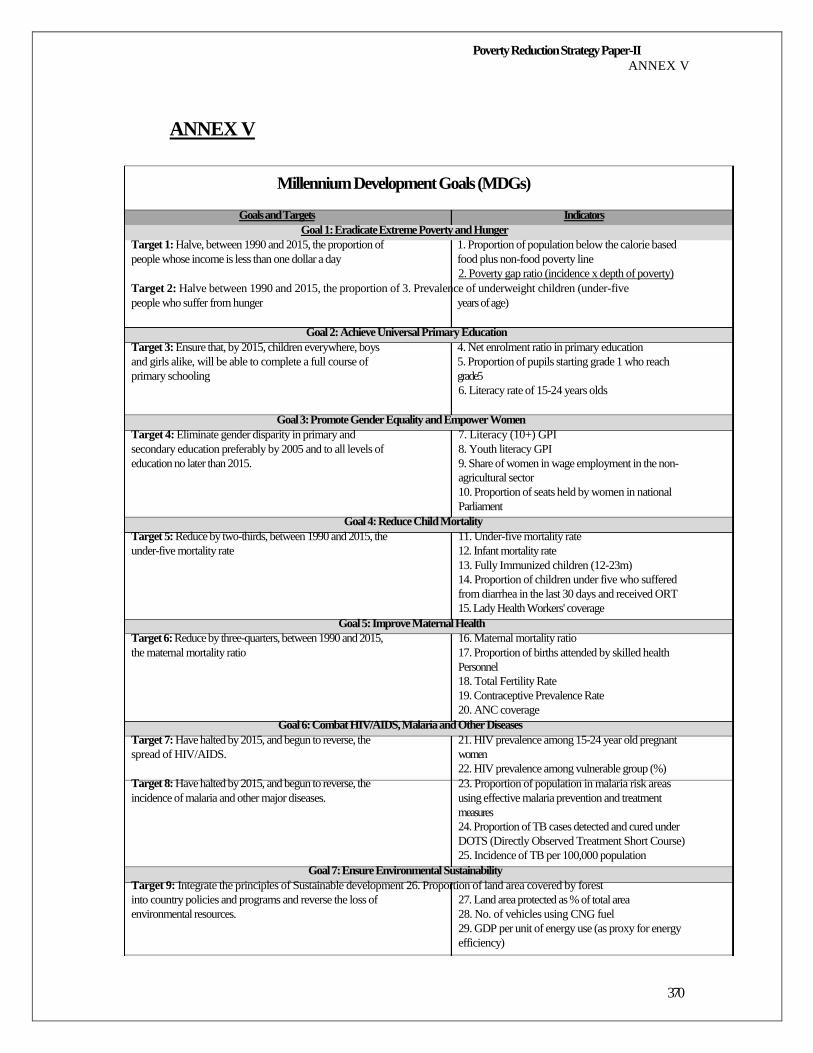
Poverty Reduction Strategy Paper-II ANNEX V
ANNEX V
Millennium Development Goals (MDGs)
Goals and Targets Indicators
Goal 1: Eradicate Extreme Poverty and Hunger
Target 1: Halve, between 1990 and 2015, the proportion of 1. Proportion of population below the calorie based people whose income is less than one dollar a day food plus non-food poverty line
2. Poverty gap ratio (incidence x depth of poverty)
Target 2: Halve between 1990 and 2015, the proportion of 3. Prevalence of underweight children (under-five
people who suffer from hunger years of age)
Goal 2: Achieve Universal Primary Education
Target 3: Ensure that, by 2015, children everywhere, boys 4. Net enrolment ratio in primary education and girls alike, will be able to complete a full course of 5. Proportion of pupils starting grade 1 who reach primary schooling grade5
6. Literacy rate of 15-24 years olds
Goal 3: Promote Gender Equality and Empower Women
Target 4: Eliminate gender disparity in primary and secondary education preferably by 2005 and to all levels of education no later than 2015.
7. Literacy (10+) GPI 8. Youth literacy GPI 9. Share of women in wage employment in the non- agricultural sector 10. Proportion of seats held by women in national Parliament
Goal 4: Reduce Child Mortality
Target 5: Reduce by two-thirds, between 1990 and 2015, the under-five mortality rate
11. Under-five mortality rate 12. Infant mortality rate 13. Fully Immunized children (12-23m) 14. Proportion of children under five who suffered from diarrhea in the last 30 days and received ORT 15. Lady Health Workers' coverage
Goal 5: Improve Maternal Health
Target 6: Reduce by three-quarters, between 1990 and 2015, the maternal mortality ratio
16. Maternal mortality ratio 17. Proportion of births attended by skilled health Personnel 18. Total Fertility Rate 19. Contraceptive Prevalence Rate 20. ANC coverage
Goal 6: Combat HIV/AIDS, Malaria and Other Diseases
Target 7: Have halted by 2015, and begun to reverse, the spread of HIV/AIDS.
Target 8: Have halted by 2015, and begun to reverse, the incidence of malaria and other major diseases.
21. HIV prevalence among 15-24 year old pregnant women 22. HIV prevalence among vulnerable group (%) 23. Proportion of population in malaria risk areas using effective malaria prevention and treatment measures 24. Proportion of TB cases detected and cured under DOTS (Directly Observed Treatment Short Course) 25. Incidence of TB per 100,000 population
Goal 7: Ensure Environmental Sustainability Target 9: Integrate the principles of Sustainable development 26. Proportion of land area covered by forest
into country policies and programs and reverse the loss of environmental resources.
27. Land area protected as % of total area 28. No. of vehicles using CNG fuel 29. GDP per unit of energy use (as proxy for energy efficiency)
370
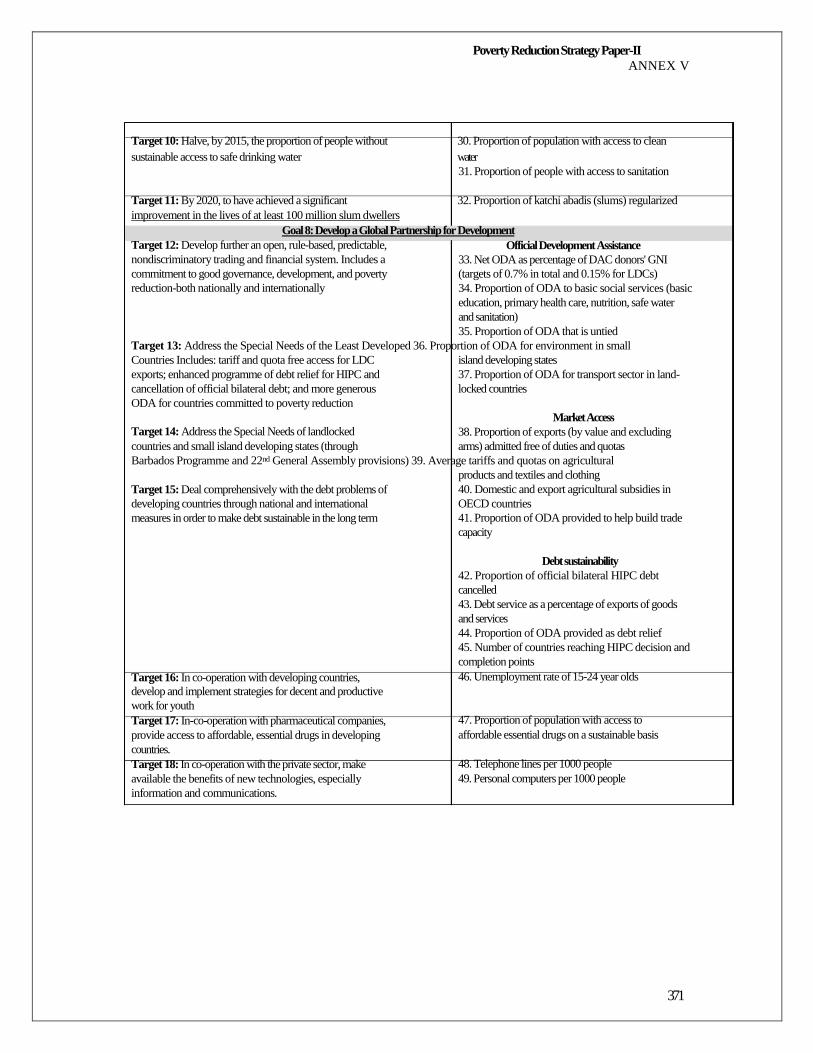
Poverty Reduction Strategy Paper-II ANNEX V
Target 10: Halve, by 2015, the proportion of people without 30. Proportion of population with access to clean sustainable access to safe drinking water water
31. Proportion of people with access to sanitation
Target 11: By 2020, to have achieved a significant 32. Proportion of katchi abadis (slums) regularized improvement in the lives of at least 100 million slum dwellers
Goal 8: Develop a Global Partnership for Development
Target 12: Develop further an open, rule-based, predictable, nondiscriminatory trading and financial system. Includes a commitment to good governance, development, and poverty reduction-both nationally and internationally
Official Development Assistance 33. Net ODA as percentage of DAC donors' GNI (targets of 0.7% in total and 0.15% for LDCs) 34. Proportion of ODA to basic social services (basic education, primary health care, nutrition, safe water and sanitation) 35. Proportion of ODA that is untied
Target 13: Address the Special Needs of the Least Developed 36. Proportion of ODA for environment in small
Countries Includes: tariff and quota free access for LDC exports; enhanced programme of debt relief for HIPC and cancellation of official bilateral debt; and more generous ODA for countries committed to poverty reduction Target 14: Address the Special Needs of landlocked countries and small island developing states (through
island developing states 37. Proportion of ODA for transport sector in land- locked countries
Market Access 38. Proportion of exports (by value and excluding arms) admitted free of duties and quotas
Barbados Programme and 22nd General Assembly provisions) 39. Average tariffs and quotas on agricultural products and textiles and clothing
Target 15: Deal comprehensively with the debt problems of developing countries through national and international measures in order to make debt sustainable in the long term Target 16: In co-operation with developing countries, develop and implement strategies for decent and productive work for youth Target 17: In-co-operation with pharmaceutical companies, provide access to affordable, essential drugs in developing countries. Target 18: In co-operation with the private sector, make available the benefits of new technologies, especially information and communications.
40. Domestic and export agricultural subsidies in OECD countries 41. Proportion of ODA provided to help build trade capacity
Debt sustainability 42. Proportion of official bilateral HIPC debt cancelled 43. Debt service as a percentage of exports of goods and services 44. Proportion of ODA provided as debt relief 45. Number of countries reaching HIPC decision and completion points 46. Unemployment rate of 15-24 year olds
47. Proportion of population with access to affordable essential drugs on a sustainable basis
48. Telephone lines per 1000 people 49. Personal computers per 1000 people
371
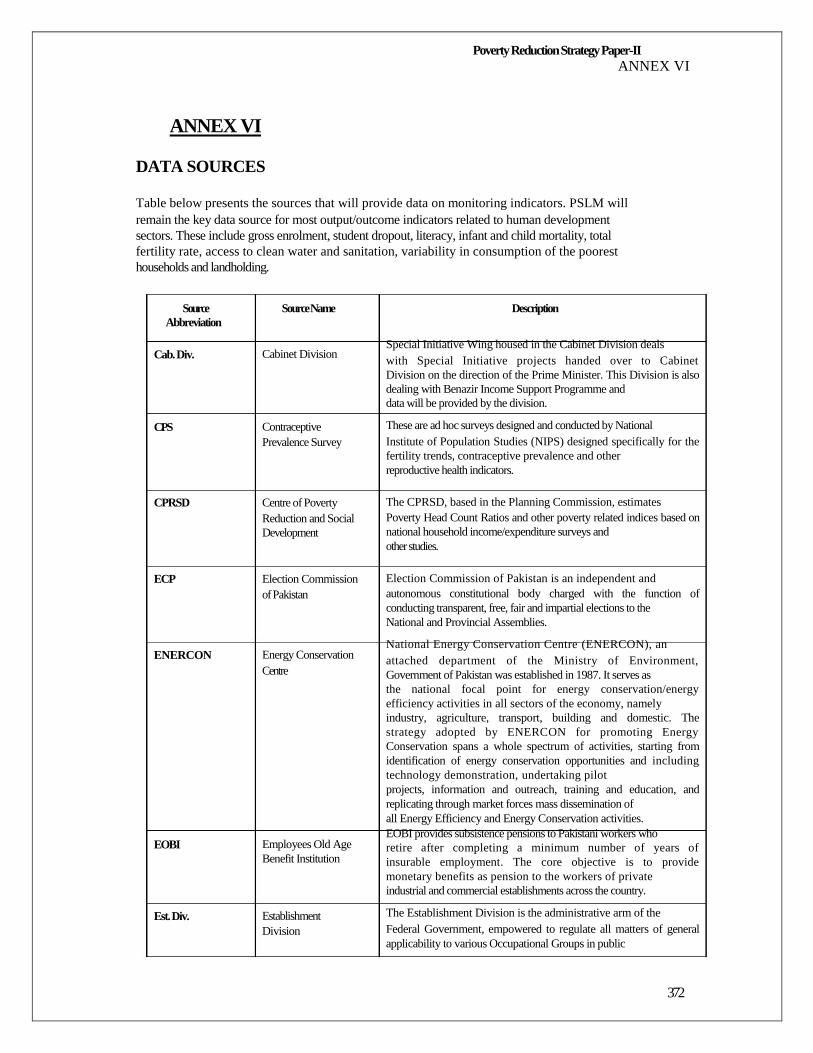
Poverty Reduction Strategy Paper-II ANNEX VI
ANNEX VI
DATA SOURCES
Table below presents the sources that will provide data on monitoring indicators. PSLM will remain the key data source for most output/outcome indicators related to human development sectors. These include gross enrolment, student dropout, literacy, infant and child mortality, total fertility rate, access to clean water and sanitation, variability in consumption of the poorest households and landholding.
Source Abbreviation
Cab. Div.
CPS
CPRSD
ECP
ENERCON
EOBI
Est. Div.
Source Name
Cabinet Division
Contraceptive Prevalence Survey
Centre of Poverty Reduction and Social Development
Election Commission of Pakistan
Energy Conservation Centre Employees Old Age Benefit Institution
Establishment Division
Description
Special Initiative Wing housed in the Cabinet Division deals with Special Initiative projects handed over to Cabinet
Division on the direction of the Prime Minister. This Division is also
dealing with Benazir Income Support Programme and data will be provided by the division.
These are ad hoc surveys designed and conducted by National Institute of Population Studies (NIPS) designed specifically for the
fertility trends, contraceptive prevalence and other reproductive health indicators.
The CPRSD, based in the Planning Commission, estimates Poverty Head Count Ratios and other poverty related indices based on
national household income/expenditure surveys and other studies.
Election Commission of Pakistan is an independent and autonomous constitutional body charged with the function of
conducting transparent, free, fair and impartial elections to the National and Provincial Assemblies.
National Energy Conservation Centre (ENERCON), an attached department of the Ministry of Environment,
Government of Pakistan was established in 1987. It serves as the national focal point for energy conservation/energy
efficiency activities in all sectors of the economy, namely industry, agriculture, transport, building and domestic. The
strategy adopted by ENERCON for promoting Energy
Conservation spans a whole spectrum of activities, starting from
identification of energy conservation opportunities and including
technology demonstration, undertaking pilot projects, information and outreach, training and education, and
replicating through market forces mass dissemination of all Energy Efficiency and Energy Conservation activities. EOBI provides subsistence pensions to Pakistani workers who retire after completing a minimum number of years of
insurable employment. The core objective is to provide
monetary benefits as pension to the workers of private industrial and commercial establishments across the country.
The Establishment Division is the administrative arm of the Federal Government, empowered to regulate all matters of general
applicability to various Occupational Groups in public
372
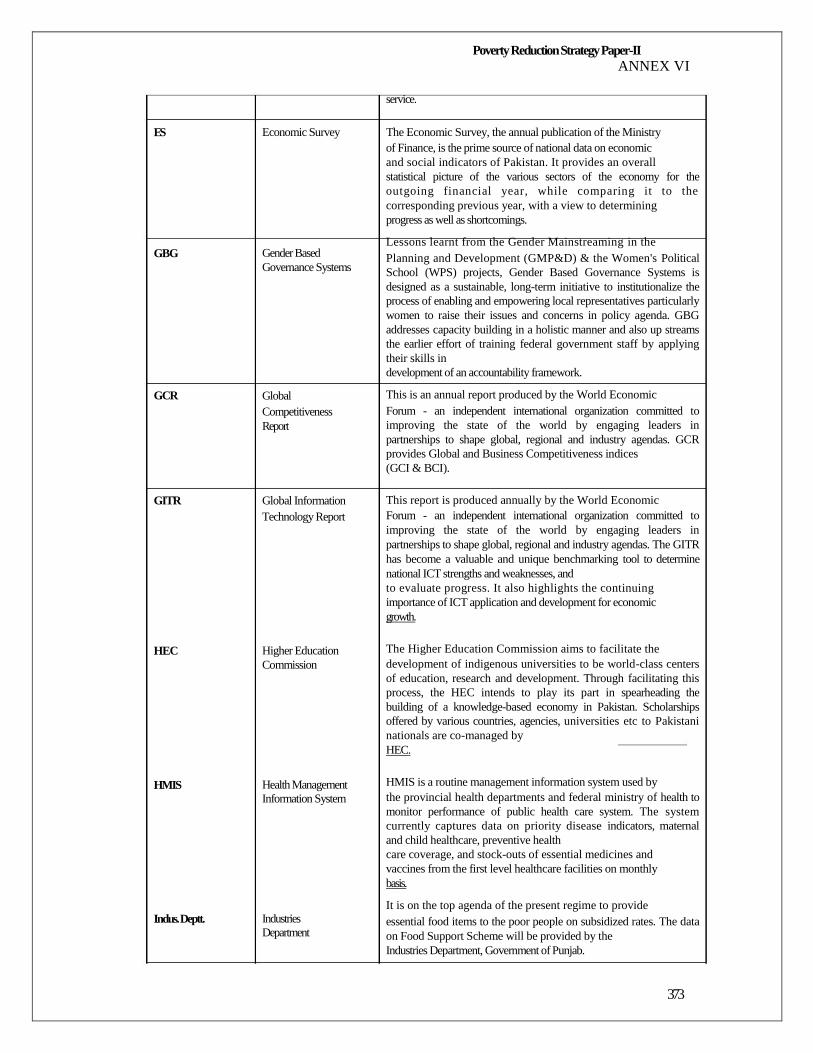
Poverty Reduction Strategy Paper-II ANNEX VI
service.
ES GBG
GCR
GITR HEC HMIS Indus. Deptt.
Economic Survey Gender Based Governance Systems
Global Competitiveness Report
Global Information Technology Report Higher Education Commission Health Management Information System Industries Department
The Economic Survey, the annual publication of the Ministry of Finance, is the prime source of national data on economic and social indicators of Pakistan. It provides an overall statistical picture of the various sectors of the economy for the
outgoing financial year, while comparing it to the
corresponding previous year, with a view to determining progress as well as shortcomings.
Lessons learnt from the Gender Mainstreaming in the Planning and Development (GMP&D) & the Women's Political
School (WPS) projects, Gender Based Governance Systems is
designed as a sustainable, long-term initiative to institutionalize the
process of enabling and empowering local representatives particularly
women to raise their issues and concerns in policy agenda. GBG
addresses capacity building in a holistic manner and also up streams
the earlier effort of training federal government staff by applying
their skills in development of an accountability framework.
This is an annual report produced by the World Economic Forum - an independent international organization committed to
improving the state of the world by engaging leaders in
partnerships to shape global, regional and industry agendas. GCR
provides Global and Business Competitiveness indices (GCI & BCI).
This report is produced annually by the World Economic Forum - an independent international organization committed to
improving the state of the world by engaging leaders in
partnerships to shape global, regional and industry agendas. The GITR
has become a valuable and unique benchmarking tool to determine
national ICT strengths and weaknesses, and to evaluate progress. It also highlights the continuing importance of ICT application and development for economic growth.
The Higher Education Commission aims to facilitate the development of indigenous universities to be world-class centers
of education, research and development. Through facilitating this
process, the HEC intends to play its part in spearheading the
building of a knowledge-based economy in Pakistan. Scholarships
offered by various countries, agencies, universities etc to Pakistani
nationals are co-managed by HEC.
HMIS is a routine management information system used by the provincial health departments and federal ministry of health to
monitor performance of public health care system. The system
currently captures data on priority disease indicators, maternal
and child healthcare, preventive health care coverage, and stock-outs of essential medicines and vaccines from the first level healthcare facilities on monthly basis.
It is on the top agenda of the present regime to provide essential food items to the poor people on subsidized rates. The data
on Food Support Scheme will be provided by the Industries Department, Government of Punjab.
373
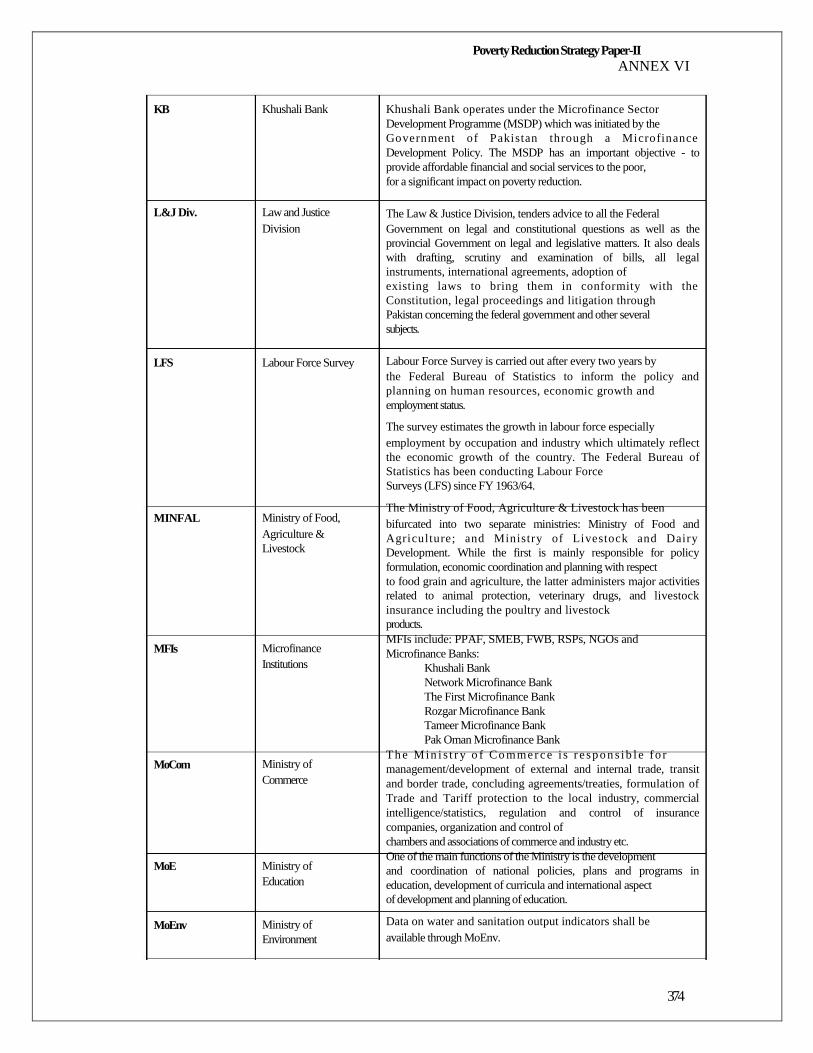
Poverty Reduction Strategy Paper-II ANNEX VI
KB
L&J Div. LFS
MINFAL
MFIs
MoCom
MoE
MoEnv
Khushali Bank
Law and Justice Division Labour Force Survey
Ministry of Food, Agriculture & Livestock
Microfinance Institutions
Ministry of Commerce
Ministry of Education
Ministry of Environment
Khushali Bank operates under the Microfinance Sector Development Programme (MSDP) which was initiated by the Government of Pakistan through a Microfinance
Development Policy. The MSDP has an important objective - to
provide affordable financial and social services to the poor, for a significant impact on poverty reduction.
The Law & Justice Division, tenders advice to all the Federal Government on legal and constitutional questions as well as the
provincial Government on legal and legislative matters. It also deals
with drafting, scrutiny and examination of bills, all legal
instruments, international agreements, adoption of existing laws to bring them in conformity with the
Constitution, legal proceedings and litigation through Pakistan concerning the federal government and other several subjects.
Labour Force Survey is carried out after every two years by the Federal Bureau of Statistics to inform the policy and
planning on human resources, economic growth and employment status.
The survey estimates the growth in labour force especially employment by occupation and industry which ultimately reflect
the economic growth of the country. The Federal Bureau of
Statistics has been conducting Labour Force Surveys (LFS) since FY 1963/64.
The Ministry of Food, Agriculture & Livestock has been bifurcated into two separate ministries: Ministry of Food and
Agriculture; and Ministry of Livestock and Dairy
Development. While the first is mainly responsible for policy
formulation, economic coordination and planning with respect to food grain and agriculture, the latter administers major activities
related to animal protection, veterinary drugs, and livestock
insurance including the poultry and livestock products. MFIs include: PPAF, SMEB, FWB, RSPs, NGOs and Microfinance Banks:
Khushali Bank Network Microfinance Bank The First Microfinance Bank Rozgar Microfinance Bank Tameer Microfinance Bank Pak Oman Microfinance Bank
Th e Min i s t r y o f Co mme r c e i s r e sp o n s ib l e fo r management/development of external and internal trade, transit
and border trade, concluding agreements/treaties, formulation of
Trade and Tariff protection to the local industry, commercial
intelligence/statistics, regulation and control of insurance
companies, organization and control of chambers and associations of commerce and industry etc. One of the main functions of the Ministry is the development and coordination of national policies, plans and programs in
education, development of curricula and international aspect of development and planning of education.
Data on water and sanitation output indicators shall be available through MoEnv.
374
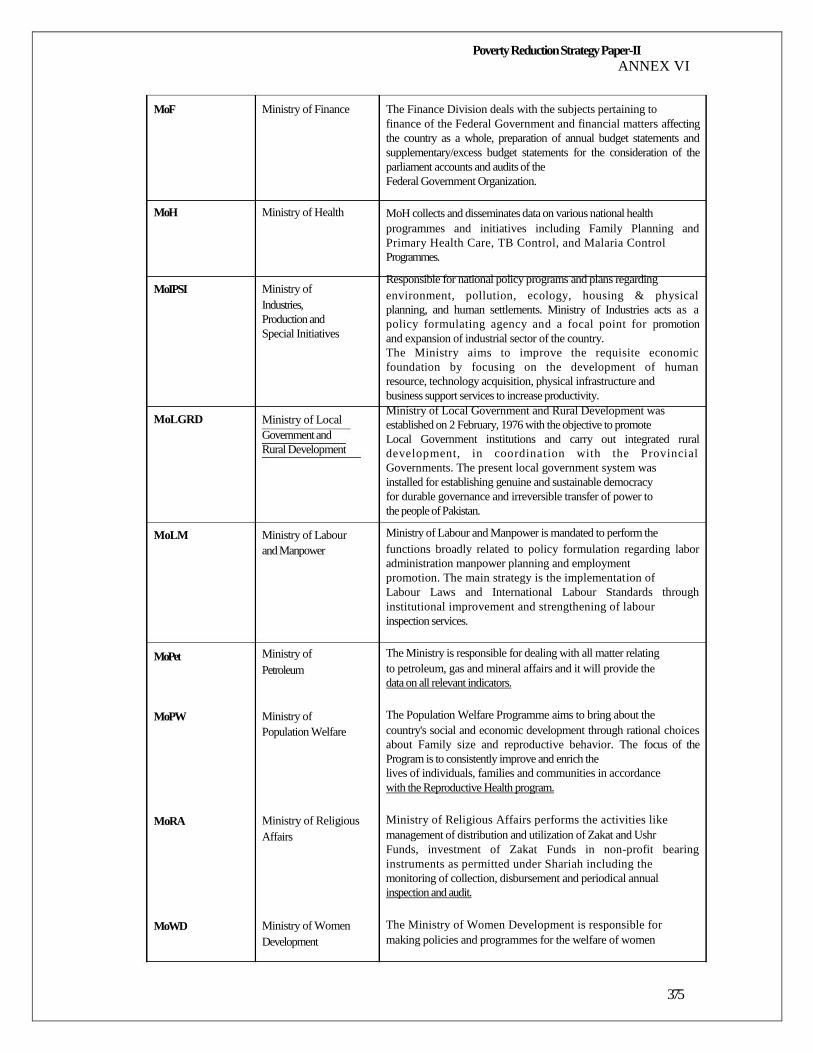
Poverty Reduction Strategy Paper-II ANNEX VI
MoF
MoH
MoIPSI
MoLGRD
MoLM MoPet
MoPW
MoRA
MoWD
Ministry of Finance
Ministry of Health
Ministry of Industries, Production and Special Initiatives
Ministry of Local Government and Rural Development
Ministry of Labour and Manpower
Ministry of Petroleum
Ministry of Population Welfare
Ministry of Religious Affairs
Ministry of Women Development
The Finance Division deals with the subjects pertaining to finance of the Federal Government and financial matters affecting
the country as a whole, preparation of annual budget statements and
supplementary/excess budget statements for the consideration of the
parliament accounts and audits of the Federal Government Organization.
MoH collects and disseminates data on various national health programmes and initiatives including Family Planning and
Primary Health Care, TB Control, and Malaria Control Programmes.
Responsible for national policy programs and plans regarding environment, pollution, ecology, housing & physical
planning, and human settlements. Ministry of Industries acts as a
policy formulating agency and a focal point for promotion
and expansion of industrial sector of the country. The Ministry aims to improve the requisite economic
foundation by focusing on the development of human
resource, technology acquisition, physical infrastructure and business support services to increase productivity. Ministry of Local Government and Rural Development was established on 2 February, 1976 with the objective to promote Local Government institutions and carry out integrated rural
development, in coordination with the Provincial
Governments. The present local government system was installed for establishing genuine and sustainable democracy for durable governance and irreversible transfer of power to the people of Pakistan.
Ministry of Labour and Manpower is mandated to perform the functions broadly related to policy formulation regarding labor
administration manpower planning and employment promotion. The main strategy is the implementation of Labour Laws and International Labour Standards through
institutional improvement and strengthening of labour inspection services.
The Ministry is responsible for dealing with all matter relating to petroleum, gas and mineral affairs and it will provide the data on all relevant indicators.
The Population Welfare Programme aims to bring about the country's social and economic development through rational choices
about Family size and reproductive behavior. The focus of the
Program is to consistently improve and enrich the lives of individuals, families and communities in accordance with the Reproductive Health program.
Ministry of Religious Affairs performs the activities like management of distribution and utilization of Zakat and Ushr Funds, investment of Zakat Funds in non-profit bearing
instruments as permitted under Shariah including the monitoring of collection, disbursement and periodical annual inspection and audit.
The Ministry of Women Development is responsible for making policies and programmes for the welfare of women
375
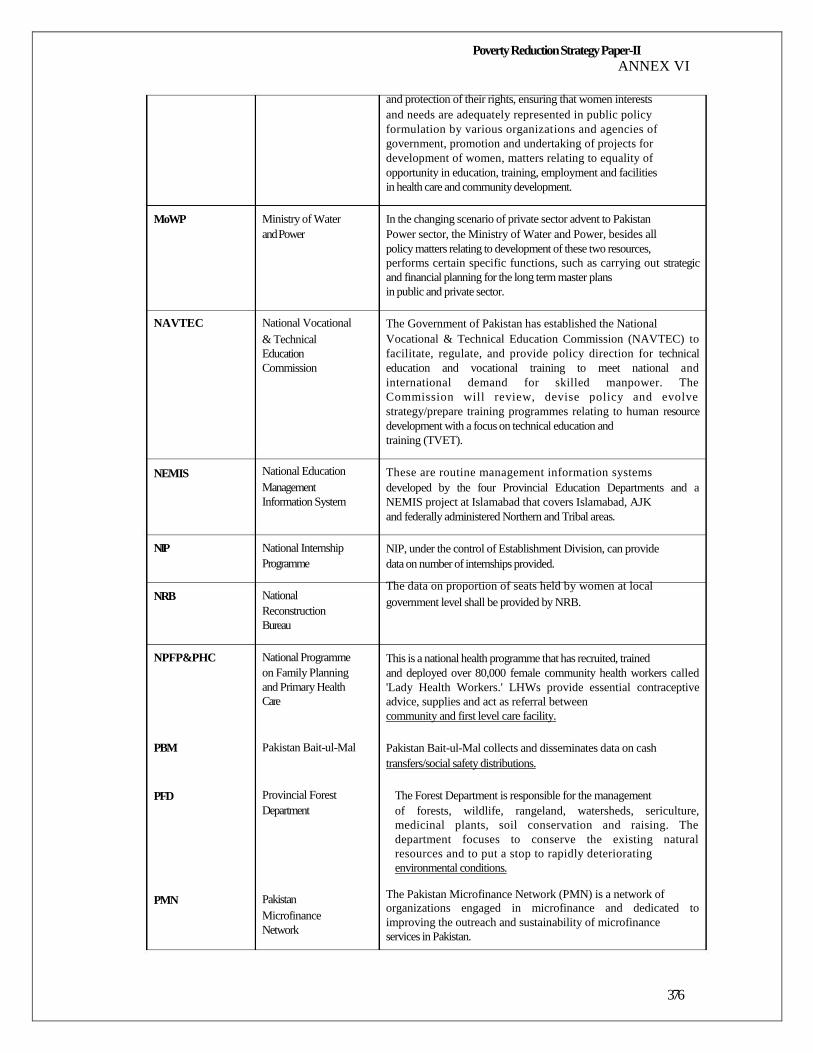
Poverty Reduction Strategy Paper-II ANNEX VI
and protection of their rights, ensuring that women interests and needs are adequately represented in public policy
formulation by various organizations and agencies of
government, promotion and undertaking of projects for
development of women, matters relating to equality of
opportunity in education, training, employment and facilities in health care and community development.
MoWP
NAVTEC NEMIS
NIP
NRB
NPFP&PHC
PBM
PFD
PMN
Ministry of Water and Power
National Vocational & Technical Education Commission
National Education Management Information System
National Internship Programme
National Reconstruction Bureau
National Programme on Family Planning and Primary Health Care
Pakistan Bait-ul-Mal
Provincial Forest Department
Pakistan Microfinance Network
In the changing scenario of private sector advent to Pakistan Power sector, the Ministry of Water and Power, besides all policy matters relating to development of these two resources, performs certain specific functions, such as carrying out strategic
and financial planning for the long term master plans in public and private sector.
The Government of Pakistan has established the National Vocational & Technical Education Commission (NAVTEC) to
facilitate, regulate, and provide policy direction for technical
education and vocational training to meet national and
international demand for skilled manpower. The
Commission will review, devise policy and evolve
strategy/prepare training programmes relating to human resource
development with a focus on technical education and training (TVET).
These are routine management information systems developed by the four Provincial Education Departments and a
NEMIS project at Islamabad that covers Islamabad, AJK and federally administered Northern and Tribal areas.
NIP, under the control of Establishment Division, can provide data on number of internships provided.
The data on proportion of seats held by women at local government level shall be provided by NRB.
This is a national health programme that has recruited, trained and deployed over 80,000 female community health workers called
'Lady Health Workers.' LHWs provide essential contraceptive
advice, supplies and act as referral between community and first level care facility.
Pakistan Bait-ul-Mal collects and disseminates data on cash transfers/social safety distributions.
The Forest Department is responsible for the management of forests, wildlife, rangeland, watersheds, sericulture,
medicinal plants, soil conservation and raising. The
department focuses to conserve the existing natural
resources and to put a stop to rapidly deteriorating environmental conditions.
The Pakistan Microfinance Network (PMN) is a network of organizations engaged in microfinance and dedicated to
improving the outreach and sustainability of microfinance services in Pakistan.
376
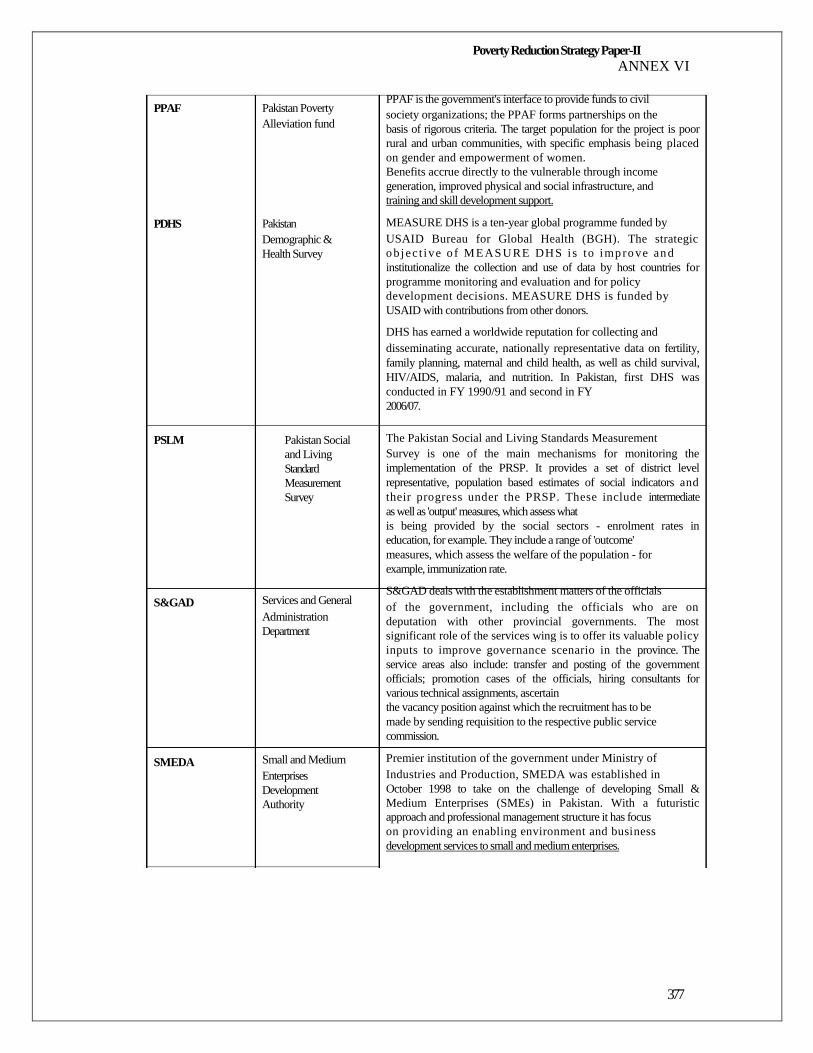
PPAF
PDHS PSLM
S&GAD SMEDA
Pakistan Poverty Alleviation fund
Pakistan Demographic & Health Survey
Pakistan Social and Living Standard Measurement Survey
Services and General Administration Department
Small and Medium Enterprises Development Authority
Poverty Reduction Strategy Paper-II ANNEX VI
PPAF is the government's interface to provide funds to civil society organizations; the PPAF forms partnerships on the basis of rigorous criteria. The target population for the project is poor
rural and urban communities, with specific emphasis being placed
on gender and empowerment of women. Benefits accrue directly to the vulnerable through income generation, improved physical and social infrastructure, and training and skill development support.
MEASURE DHS is a ten-year global programme funded by USAID Bureau for Global Health (BGH). The strategic
o b jec t ive o f MEASURE DHS i s to imp ro ve an d institutionalize the collection and use of data by host countries for
programme monitoring and evaluation and for policy development decisions. MEASURE DHS is funded by USAID with contributions from other donors.
DHS has earned a worldwide reputation for collecting and disseminating accurate, nationally representative data on fertility,
family planning, maternal and child health, as well as child survival,
HIV/AIDS, malaria, and nutrition. In Pakistan, first DHS was
conducted in FY 1990/91 and second in FY 2006/07.
The Pakistan Social and Living Standards Measurement Survey is one of the main mechanisms for monitoring the
implementation of the PRSP. It provides a set of district level
representative, population based estimates of social indicators and
their progress under the PRSP. These include intermediate
as well as 'output' measures, which assess what is being provided by the social sectors - enrolment rates in
education, for example. They include a range of 'outcome' measures, which assess the welfare of the population - for example, immunization rate.
S&GAD deals with the establishment matters of the officials of the government, including the officials who are on
deputation with other provincial governments. The most
significant role of the services wing is to offer its valuable policy
inputs to improve governance scenario in the province. The
service areas also include: transfer and posting of the government
officials; promotion cases of the officials, hiring consultants for
various technical assignments, ascertain the vacancy position against which the recruitment has to be made by sending requisition to the respective public service commission.
Premier institution of the government under Ministry of Industries and Production, SMEDA was established in October 1998 to take on the challenge of developing Small &
Medium Enterprises (SMEs) in Pakistan. With a futuristic
approach and professional management structure it has focus on providing an enabling environment and business development services to small and medium enterprises.
377
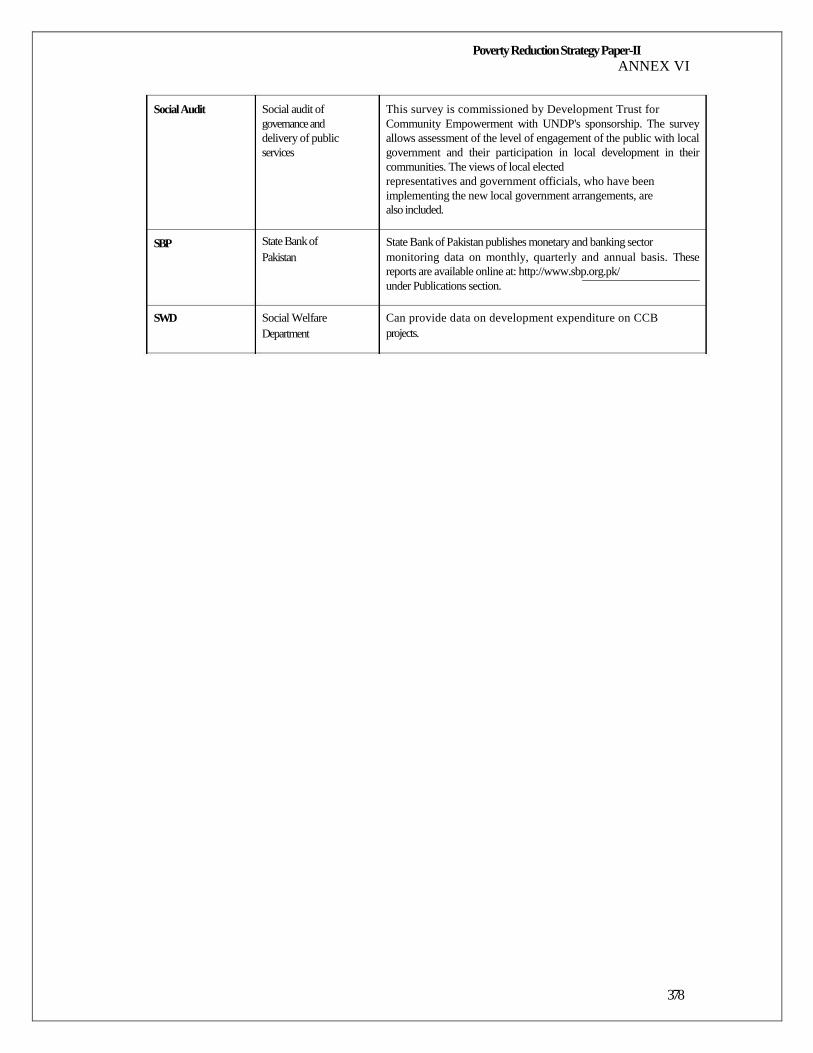
Poverty Reduction Strategy Paper-II ANNEX VI
Social Audit SBP
SWD
Social audit of governance and delivery of public services
State Bank of Pakistan
Social Welfare Department
This survey is commissioned by Development Trust for Community Empowerment with UNDP's sponsorship. The survey
allows assessment of the level of engagement of the public with local
government and their participation in local development in their
communities. The views of local elected representatives and government officials, who have been implementing the new local government arrangements, are also included.
State Bank of Pakistan publishes monetary and banking sector monitoring data on monthly, quarterly and annual basis. These
reports are available online at: http://www.sbp.org.pk/ under Publications section.
Can provide data on development expenditure on CCB projects.
378
Poverty Reduction Strategy Paper-II ANNEX VIII
ANNEX VII
An outline of the costing approach - the Education Module
The MDG costing exercise attempts to derive resource requirements from targets set, and this is possible only when specific measurable interventions are identified to realize these targets. The last part obviously
involves valuing these resources with appropriate price figures. The current exercise follows these paths, but more
importantly, it has developed an excel-based template that captures all relevant information for urban and rural
areas in four provinces of Pakistan, and simultaneously compiles these into aggregate figures. Numbers have equal power in misleading others as well as providing
greater insights into the working of a sector. Estimates framed within an accounting structure, therefore,
require sound basis of the initial sets of numbers chosen. This section discusses several conceptual issues that underlie the exercise.
GER, NER and enrolments from other age groups Quite often, confusions arise due to our failure in appreciating the accounting relations between several target
(and performance) indicators. A prime example is the instance of setting 100% (primary stage) NER with a definition of primary school-aged children to include only 5-9 years age group. It is
important to note that GER truly captures the actual number of students enrolled at any 'stage' of education, not the
NER. However, a simple formula ties the three variables (mentioned in the subtitle) together:
(1) GER = (# total enrolled at primary stage)/(# of 5-9 years children); (2) GER = (# enrolled children of 5-9 years age + over-aged children enrolled) divided by (# of
5-9 years age children).
One may assume that the over-aged children are from 10-14 years age group. Thus the above may be reformulated as,
(3) GER = NER + (% of 10-14 years children attending primary stage) * (ratio of 10-14 years population to 5-9 years population).
From the above relations, we may draw various inferences: If NER=GER=100%, there can be no children from other age group attending primary stage schools, and
no children of 5-9 years aged group would be studying in pre-primary (or, secondary) schools.
If one allows for over-aged children to participate in primary stage, GER will always be greater than NER.
If children of 5-9 years age group participate in pre-primary schools, NER will always be less than 100%, even when all children of 5-9 years age group are attending schools.
Simulation on an excel template Projecting into future involves simulations, and as in other instances of simulations, one is
expected to ensure base year consistency across numbers. Upon ensuring base year consistencies, one may set
targets and estimate resource requirements. Often the parametres (such as, student- teacher ratio) are considered
as target variables so that one may choose to lower or increase the value of the parametre in the terminal year.
There are several areas where consistency in numbers has been ensured, at the least, in the base year (2005) and
in terminal year (2015). Some of the important ones are highlighted below.
379
Poverty Reduction Strategy Paper-II ANNEX VIII
(4) NER (all) = NER (boys) * share of boys + NER (girls) * share of girls.
The above applies to many other statistics.
(5) TGE =i (TE * share of ith institution in TE * % of girls in TE of ith institution),
Where, TGE = Total Girls' enrolment, TE = Total enrolment, is the summation sign and * is the multiplication sign. Major institutional groups considered are, public, commercially run private, NFBE/NGO and Madrasah schools.
The above applies for boys as well. Equation (4) has important bearing on policy target and for the resource requirements in the hands of the public agencies. Current shares of various agencies (public,
private, Madrasah, and NFBE/NGO) in total primary enrolment is largely assumed to remain stable, even
though the excel-based template design has the provision of setting different targets on these shares. Any
change in the share of public institution will change the resource requirements for realizing any given target.
(6) Total number of schools = enrolled students * (school: student ratio)
The above applies for several other ratios.
Capturing Reality in an abstract world: concepts
All the four provinces, Punjab (without FATA and with ICT included), Sindh, NWFP and Balochistan; and urban and rural areas in each of these provinces, have been separately treated. Thus, there are
eight sets of data and parametre values that have been dealt with. Aggregate for Pakistan will be derived by
adding the eight estimates, and adjusted by a factor in line with the proportion of the whole covered.
The coverage data, that is, number of students (boys and girls) enrolled, number of teachers, number of schools, etc. by various institutional settings (such as, government, madrassah, NFBE/NGO) ought to tally
with the real world figures in the base year (2004-05). This is ensured by choice of appropriate parametre (for
example, % of total enrolment in government schools, % of government school enrolment who are girls, student-
teacher ratio, etc.) values. In order to ensure consistency at the aggregate levels, we incorporated enrolments in
government/public schools, NFBE/NGO/CBO centers, madrasahs, and the commercially driven private sector.
NFBE provides a floor figure on the second category, while 2002 study on private sector schools and briefs from
recently concluded education census 2005 provide some elementary information on the last category. One
obvious constraint was set by the DOE figures on enrolment in government schools, and other than for
Sindh Rural, most of these could fit in our exercise. One may however 19
ote that such constraints n
often imposed restriction on being simultaneously consistent and realistic. 2
Adult literacy and out-of-school programmes are considered in aggregates - and these are considered government's responsibility whether channeled through NGO/CBOs or not. Pakistan chose to
associate target setting for 10+ population, partly influenced by the availability of data. At a program level, it raises quite a few complications. First, as noted above, some children aged 10-14 years enroll in primary stage and are already covered under the reported GER. Second, NFBE is targeting the
out of school children from this age group. In order to account for these concerns, the module has two segments of
adult literacy: providing literacy to 15-59 years age group, and
192
For example, high reported figures on primary enrolment in Sindh Rural areas (which exceeded the figures compatible
with FBS finding on GER in PSLM Survey FY 2004/05), shares of other institutions were likely to have been under- represented.
380
Poverty Reduction Strategy Paper-II ANNEX VIII
providing basic education to out-of-school children to 10-14 years. The latter takes account of secondary NER and the % of this group enrolled in primary stage.
While the costing exercises confine to estimation of resource requirements by the government, it does not confine to resource requirements for public sector education only. An important underlying assumption pertains to the role of government in the field of governance - and, therefore, resources required to play
supportive or regulatory roles ought to be taken into account. This requires laying out the total canvass of the
primary and related education sub-sectors. In addition, for overall consistency, having all numerical figures on
all stakeholders is very critical for the costing exercise. It is to be emphasized that the targets are set for the
population independent of who delivers the service to the target population! Within such a broad canvass of
many stakeholders/institutions, policies are the key determinants of the numerical results from a costing
exercise. And, it calls for operationally meaningful policies that allow one to set targets - such as, in shares to be
accounted by various institutional stakeholders, and the supportive roles that the government intends to play in promoting their shares.
The public schools go by the names of 'mosque school', primary school, middle school, high school and higher secondary schools. While the first two do not teach students beyond class V, some of them offer
katchi (pre-primary) classes. The last three in the list however, in most cases, offer primary stage education.
We group these into three broad groups: the first includes the 'mosque school' and primary schools; the second includes middle and high schools; and the third category is the high school
(which also offers classes XI and XII). Thus, enrolment in the public schools is further disaggregated into
enrollments in these three categories, and percentages of public school enrollment in each of these three are considered parametres in our exercise.193
There is an additional dimension of categorizing public schools - boys, girls and mixed. The last does not reportedly have an official standing, even though many of the boys' schools enroll (at early stages) girls and
vice versa. While some of the infrastructure parametres (such as, number of latrines, etc.) are likely to have
different values for the boys' and girls' schools; unfortunately, the enrollment data on these categories are not consistent across provinces. We were thus unable to make this finer distinction.
Given a distribution of enrollment across the four institutional categories (or, a path of changing distribution), additional enrollments (consistent with the realization of the MDG targets of increasing
NER at primary stage) in each of the institutions may be worked out. These figures provide the basis for
most resource requirements. While the obligation to provide supports to the public schools is an obvious
inclusion, supports to other activities are matters of policy choice. We do assume that NFBE through NGOs and independent NGO schooling require government or external resources. We also assume that madrassah194 education will require some limited supports, outside that
mobilized from voluntary contributions. The commercially driven private sector is kept outside the domain of the final cost estimates. 193
Expansion of primary enrolment will involve increases in primary stage enrollment in the non-primary level schools as
well. The costing exercise takes this into account and considers increases in the teachers required to accommodate such expansions. Any additional needs on physical resources at the non-primary level are excluded. 194 Islamic school.
381
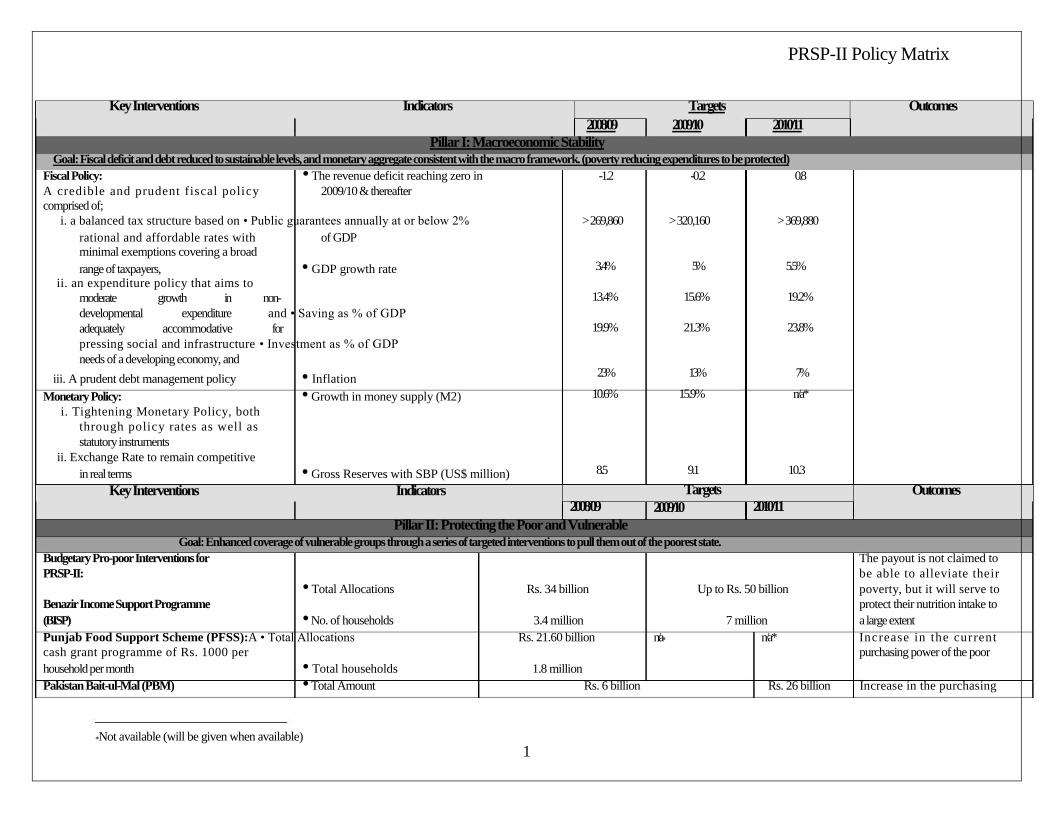
PRSP-II Policy Matrix
Key Interventions Indicators Targets Outcomes
2008/09 2009/10 2010/11
Pillar I: Macroeconomic Stability Goal: Fiscal deficit and debt reduced to sustainable levels, and monetary aggregate consistent with the macro framework. (poverty reducing expenditures to be protected)
Fiscal Policy: • The revenue deficit reaching zero in -1.2 -0.2 0.8 A credible and prudent fiscal policy 2009/10 & thereafter comprised of;
i. a balanced tax structure based on• Public guarantees annually at or below 2% rational and affordable rates with of GDP minimal exemptions covering a broad range of taxpayers, • GDP growth rate
ii. an expenditure policy that aims to moderate growth in non- developmental expenditure and• Saving as % of GDP adequately accommodative for pressing social and infrastructure• Investment as % of GDP needs of a developing economy, and
iii. A prudent debt management policy • Inflation Monetary Policy: • Growth in money supply (M2)
i. Tightening Monetary Policy, both through policy rates as well as statutory instruments
ii. Exchange Rate to remain competitive in real terms • Gross Reserves with SBP (US$ million)
Key Interventions Indicators
> 269,860
3.4%
13.4%
19.9%
23%
10.6%
8.5
2008/09
> 320,160
5%
15.6%
21.3%
13%
15.9%
9.1
Targets 2009/10
> 369,880
5.5%
19.2%
23.8%
7%
n/a*
10.3
2010/11
Outcomes
Pillar II: Protecting the Poor and Vulnerable Goal: Enhanced coverage of vulnerable groups through a series of targeted interventions to pull them out of the poorest state.
Budgetary Pro-poor Interventions for The payout is not claimed to PRSP-II: be able to alleviate their
• Total Allocations Rs. 34 billion Up to Rs. 50 billion poverty, but it will serve to Benazir Income Support Programme protect their nutrition intake to (BISP) • No. of households 3.4 million 7 million a large extent
Punjab Food Support Scheme (PFSS):A• Total Allocations Rs. 21.60 billion n/a n/a* Increase in the current cash grant programme of Rs. 1000 per purchasing power of the poor household per month • Total households 1.8 million Pakistan Bait-ul-Mal (PBM) • Total Amount Rs. 6 billion Rs. 26 billion Increase in the purchasing
Not available (will be given when available) 1
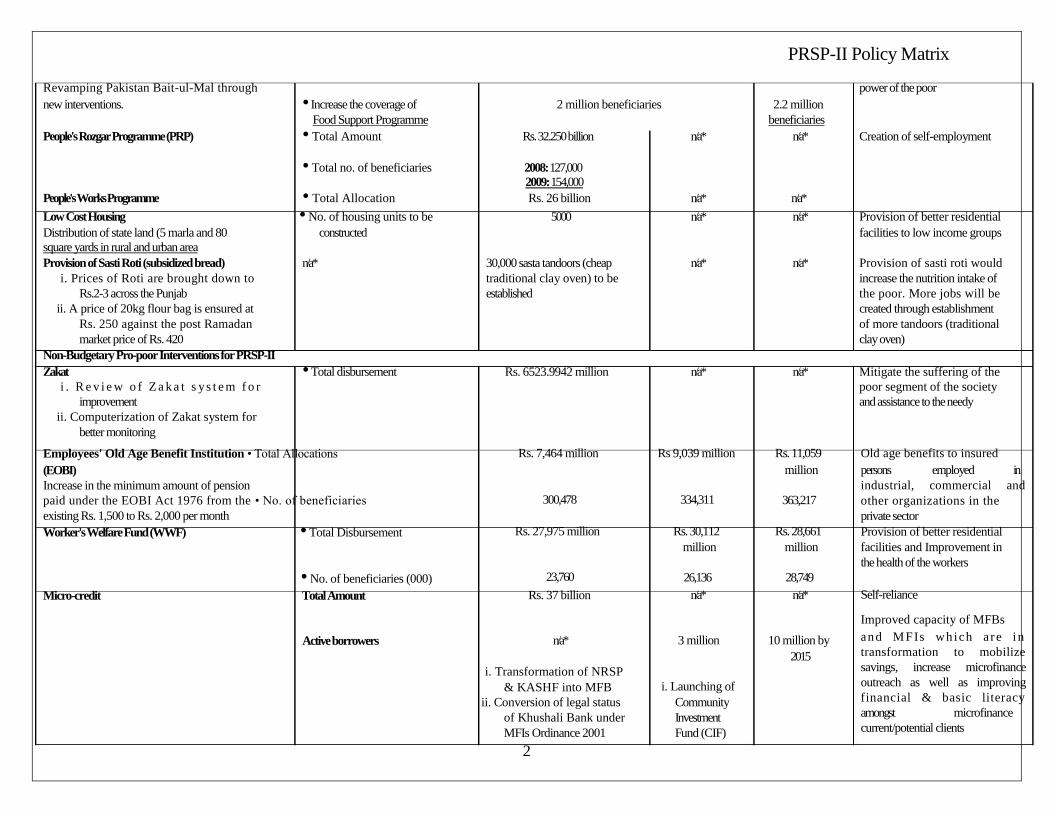
PRSP-II Policy Matrix
Revamping Pakistan Bait-ul-Mal through power of the poor new interventions. • Increase the coverage of 2 million beneficiaries 2.2 million
Food Support Programme beneficiaries People's Rozgar Programme (PRP) • Total Amount Rs. 32.250 billion n/a* n/a* Creation of self-employment
• Total no. of beneficiaries 2008: 127,000 2009: 154,000
People's Works Programme • Total Allocation Rs. 26 billion n/a* n/a*
Low Cost Housing • No. of housing units to be 5000 n/a* n/a* Provision of better residential Distribution of state land (5 marla and 80 constructed facilities to low income groups square yards in rural and urban area Provision of Sasti Roti (subsidized bread) n/a* 30,000 sasta tandoors (cheap n/a* n/a* Provision of sasti roti would
i. Prices of Roti are brought down to traditional clay oven) to be increase the nutrition intake of Rs.2-3 across the Punjab established the poor. More jobs will be
ii. A price of 20kg flour bag is ensured at created through establishment Rs. 250 against the post Ramadan of more tandoors (traditional market price of Rs. 420 clay oven)
Non-Budgetary Pro-poor Interventions for PRSP-II
Zakat • Total disbursement Rs. 6523.9942 million n/a* n/a* Mitigate the suffering of the i . R e v i e w o f Z a k a t s ys t e m f o r poor segment of the society
improvement and assistance to the needy ii. Computerization of Zakat system for
better monitoring
Employees' Old Age Benefit Institution• Total Allocations (EOBI) Increase in the minimum amount of pension paid under the EOBI Act 1976 from the• No. of beneficiaries existing Rs. 1,500 to Rs. 2,000 per month Worker's Welfare Fund (WWF) • Total Disbursement
• No. of beneficiaries (000) Micro-credit Total Amount
Active borrowers
Rs. 7,464 million
300,478
Rs. 27,975 million
23,760
Rs. 37 billion
n/a*
i. Transformation of NRSP & KASHF into MFB
ii. Conversion of legal status of Khushali Bank under MFIs Ordinance 2001
2
Rs 9,039 million
334,311
Rs. 30,112 million
26,136 n/a*
3 million
i. Launching of Community Investment Fund (CIF)
Rs. 11,059 million
363,217
Rs. 28,661 million
28,749 n/a*
10 million by 2015
Old age benefits to insured persons employed in industrial, commercial and
other organizations in the private sector Provision of better residential facilities and Improvement in the health of the workers
Self-reliance
Improved capacity of MFBs and MFIs wh ich a r e i n
transformation to mobilize
savings, increase microfinance
outreach as well as improving
financial & basic literacy
amongst microfinance current/potential clients
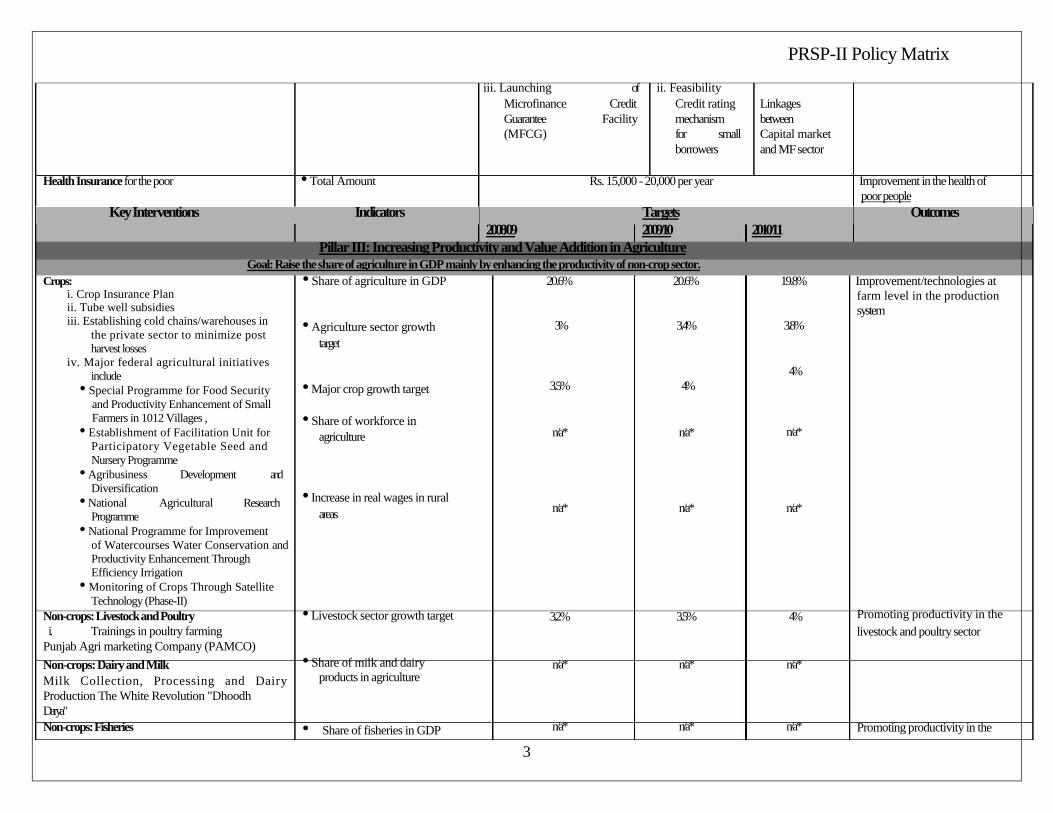
PRSP-II Policy Matrix
iii. Launching of ii. Feasibility Microfinance Credit Credit rating Linkages Guarantee Facility mechanism between (MFCG) for small Capital market
borrowers and MF sector
Health Insurance for the poor • Total Amount Rs. 15,000 - 20,000 per year Improvement in the health of poor people
Key Interventions Indicators Targets Outcomes 2008/09 2009/10 2010/11
Pillar III: Increasing Productivity and Value Addition in Agriculture Goal: Raise the share of agriculture in GDP mainly by enhancing the productivity of non-crop sector.
Crops: • Share of agriculture in GDP 20.6% 20.6% 19.8% Improvement/technologies at i. Crop Insurance Plan ii. Tube well subsidies iii. Establishing cold chains/warehouses in
the private sector to minimize post harvest losses
iv. Major federal agricultural initiatives include
• Special Programme for Food Security and Productivity Enhancement of Small Farmers in 1012 Villages ,
• Establishment of Facilitation Unit for Participatory Vegetable Seed and Nursery Programme
• Agribusiness Development and Diversification
• National Agricultural Research Programme
• National Programme for Improvement of Watercourses Water Conservation and
Productivity Enhancement Through Efficiency Irrigation
• Monitoring of Crops Through Satellite Technology (Phase-II)
Non-crops: Livestock and Poultry i. Trainings in poultry farming
Punjab Agri marketing Company (PAMCO)
Non-crops: Dairy and Milk Milk Collection, Processing and Dairy
Production The White Revolution "Dhoodh Darya" Non-crops: Fisheries
• Agriculture sector growth target
• Major crop growth target
• Share of workforce in agriculture
• Increase in real wages in rural areas
• Livestock sector growth target
• Share of milk and dairy products in agriculture
• Share of fisheries in GDP
3%
3.5%
n/a*
n/a* 3.2%
n/a*
n/a*
3.4%
4%
n/a*
n/a* 3.5%
n/a*
n/a*
3.8%
4%
n/a*
n/a* 4%
n/a*
n/a*
farm level in the production system
Promoting productivity in the livestock and poultry sector
Promoting productivity in the
3
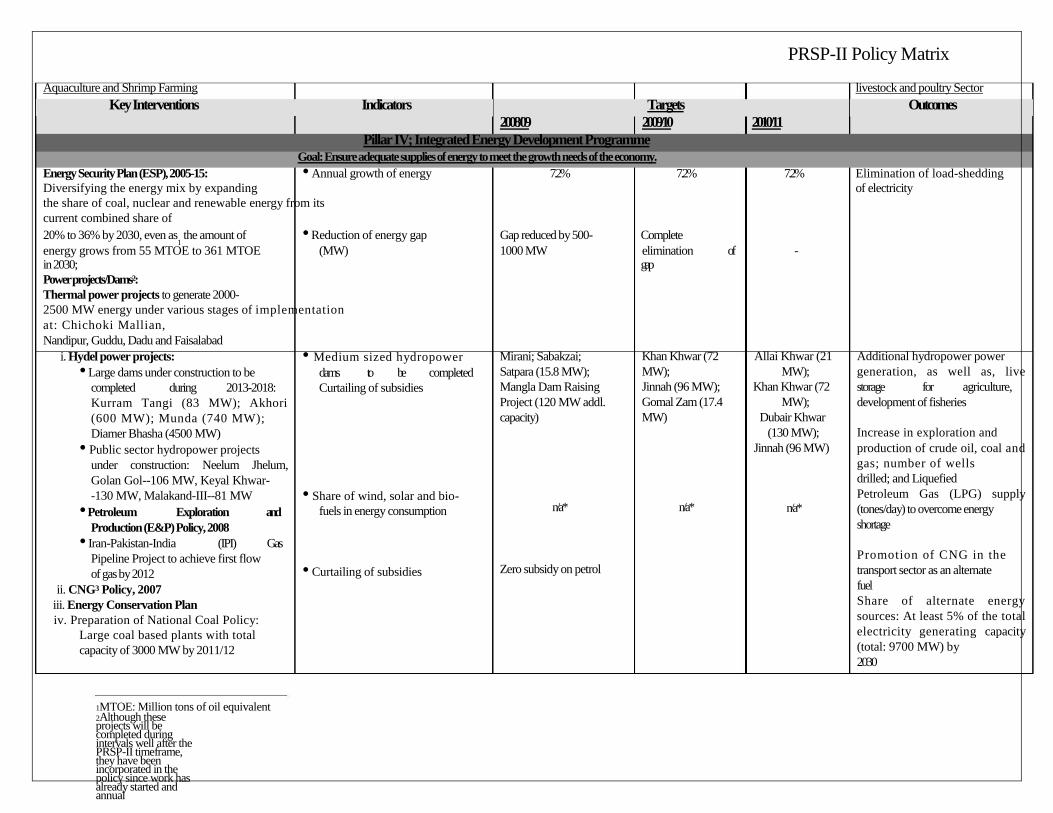
PRSP-II Policy Matrix
Aquaculture and Shrimp Farming livestock and poultry Sector Key Interventions Indicators Targets Outcomes
2008/09 2009/10 2010/11
Pillar IV; Integrated Energy Development Programme Goal: Ensure adequate supplies of energy to meet the growth needs of the economy.
Energy Security Plan (ESP), 2005-15: • Annual growth of energy 7.2% 7.2% 7.2% Elimination of load-shedding Diversifying the energy mix by expanding of electricity the share of coal, nuclear and renewable energy from its
current combined share of 20% to 36% by 2030, even as
1 the amount of • Reduction of energy gap Gap reduced by 500- Complete
energy grows from 55 MTOE to 361 MTOE (MW) 1000 MW elimination of - in 2030; gap Power projects/Dams2: Thermal power projects to generate 2000- 2500 MW energy under various stages of implementation
at: Chichoki Mallian, Nandipur, Guddu, Dadu and Faisalabad
i. Hydel power projects: • Large dams under construction to be
completed during 2013-2018: Kurram Tangi (83 MW); Akhori
(600 MW); Munda (740 MW); Diamer Bhasha (4500 MW)
• Public sector hydropower projects under construction: Neelum Jhelum,
Golan Gol--106 MW, Keyal Khwar- -130 MW, Malakand-III--81 MW
• Petroleum Exploration and Production (E&P) Policy, 2008
• Iran-Pakistan-India (IPI) Gas Pipeline Project to achieve first flow of gas by 2012
ii. CNG3 Policy, 2007 iii. Energy Conservation Plan iv. Preparation of National Coal Policy:
Large coal based plants with total capacity of 3000 MW by 2011/12
1MTOE: Million tons of oil equivalent
• Medium sized hydropower dams to be completed Curtailing of subsidies
• Share of wind, solar and bio-
fuels in energy consumption
• Curtailing of subsidies
Mirani; Sabakzai; Satpara (15.8 MW); Mangla Dam Raising Project (120 MW addl. capacity)
n/a*
Zero subsidy on petrol
Khan Khwar (72 MW); Jinnah (96 MW); Gomal Zam (17.4 MW)
n/a*
Allai Khwar (21 MW);
Khan Khwar (72 MW);
Dubair Khwar (130 MW);
Jinnah (96 MW)
n/a*
Additional hydropower power generation, as well as, live
storage for agriculture, development of fisheries
Increase in exploration and production of crude oil, coal and
gas; number of wells drilled; and Liquefied Petroleum Gas (LPG) supply
(tones/day) to overcome energy shortage
Promotion of CNG in the transport sector as an alternate fuel Share of alternate energy
sources: At least 5% of the total
electricity generating capacity
(total: 9700 MW) by 2030
2Although these projects will be completed during intervals well after the PRSP-II timeframe, they have been incorporated in the policy since work has already started and annual

expenditures/allocations have been devised. 4
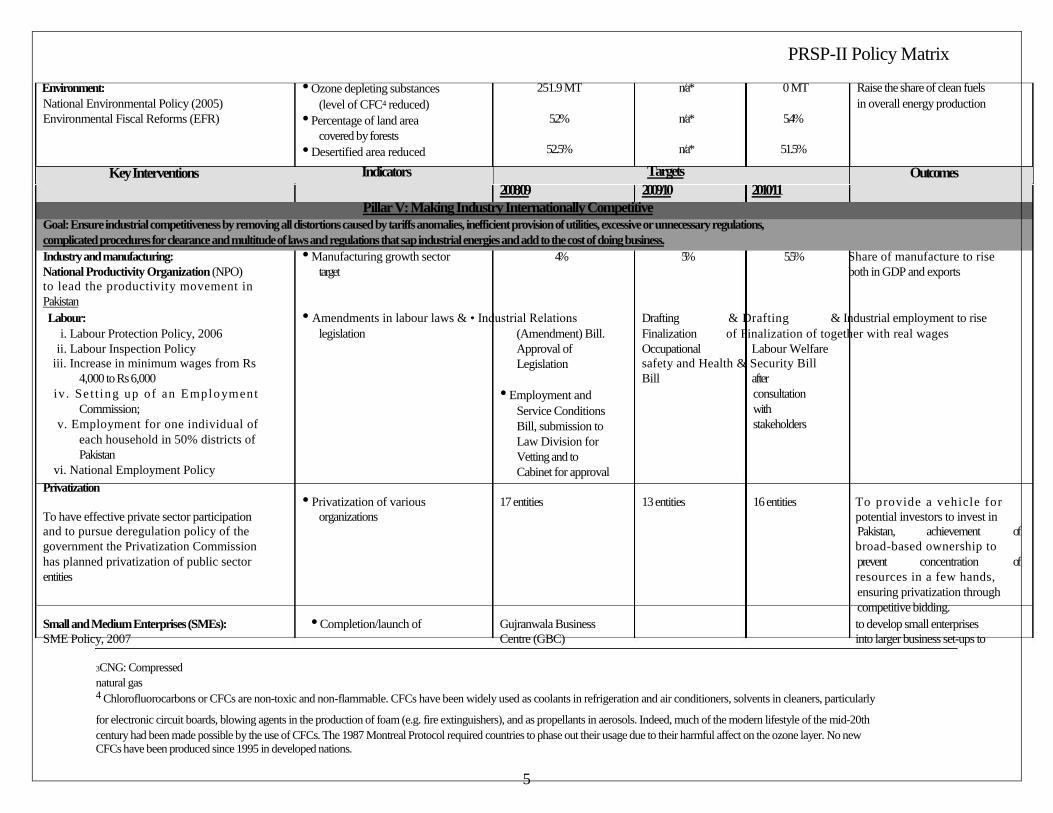
PRSP-II Policy Matrix
Environment: National Environmental Policy (2005) Environmental Fiscal Reforms (EFR)
Key Interventions
• Ozone depleting substances (level of CFC4 reduced)
• Percentage of land area covered by forests
• Desertified area reduced
Indicators
251.9 MT
5.2%
52.5%
n/a*
n/a*
n/a*
Targets
0 MT
5.4%
51.5%
Raise the share of clean fuels in overall energy production
Outcomes
2008/09 2009/10 2010/11
Pillar V: Making Industry Internationally Competitive Goal: Ensure industrial competitiveness by removing all distortions caused by tariffs anomalies, inefficient provision of utilities, excessive or unnecessary regulations, complicated procedures for clearance and multitude of laws and regulations that sap industrial energies and add to the cost of doing business.
Industry and manufacturing: • Manufacturing growth sector 4% 5% 5.5% Share of manufacture to rise National Productivity Organization (NPO) target both in GDP and exports to lead the productivity movement in Pakistan
Labour: • Amendments in labour laws &• Industrial Relations Drafting & Drafting & Industrial employment to rise
i. Labour Protection Policy, 2006 legislation (Amendment) Bill. Finalization of Finalization of together with real wages ii. Labour Inspection Policy Approval of Occupational Labour Welfare
iii. Increase in minimum wages from Rs 4,000 to Rs 6,000
iv. Se t t ing up of an Employment Commission;
v. Employment for one individual of each household in 50% districts of Pakistan
vi. National Employment Policy Privatization
Legislation
• Employment and Service Conditions Bill, submission to Law Division for Vetting and to Cabinet for approval
safety and Health & Security Bill Bill after
consultation with stakeholders
• Privatization of various 17 entities 13 entities 16 entities To provide a vehicle for To have effective private sector participation organizations potential investors to invest in and to pursue deregulation policy of the Pakistan, achievement of government the Privatization Commission broad-based ownership to has planned privatization of public sector prevent concentration of entities resources in a few hands,
ensuring privatization through competitive bidding.
Small and Medium Enterprises (SMEs): • Completion/launch of Gujranwala Business to develop small enterprises SME Policy, 2007 Centre (GBC) into larger business set-ups to
3CNG: Compressed
natural gas 4 Chlorofluorocarbons or CFCs are non-toxic and non-flammable. CFCs have been widely used as coolants in refrigeration and air conditioners, solvents in cleaners, particularly
for electronic circuit boards, blowing agents in the production of foam (e.g. fire extinguishers), and as propellants in aerosols. Indeed, much of the modern lifestyle of the mid-20th century had been made possible by the use of CFCs. The 1987 Montreal Protocol required countries to phase out their usage due to their harmful affect on the ozone layer. No new CFCs have been produced since 1995 in developed nations.
5
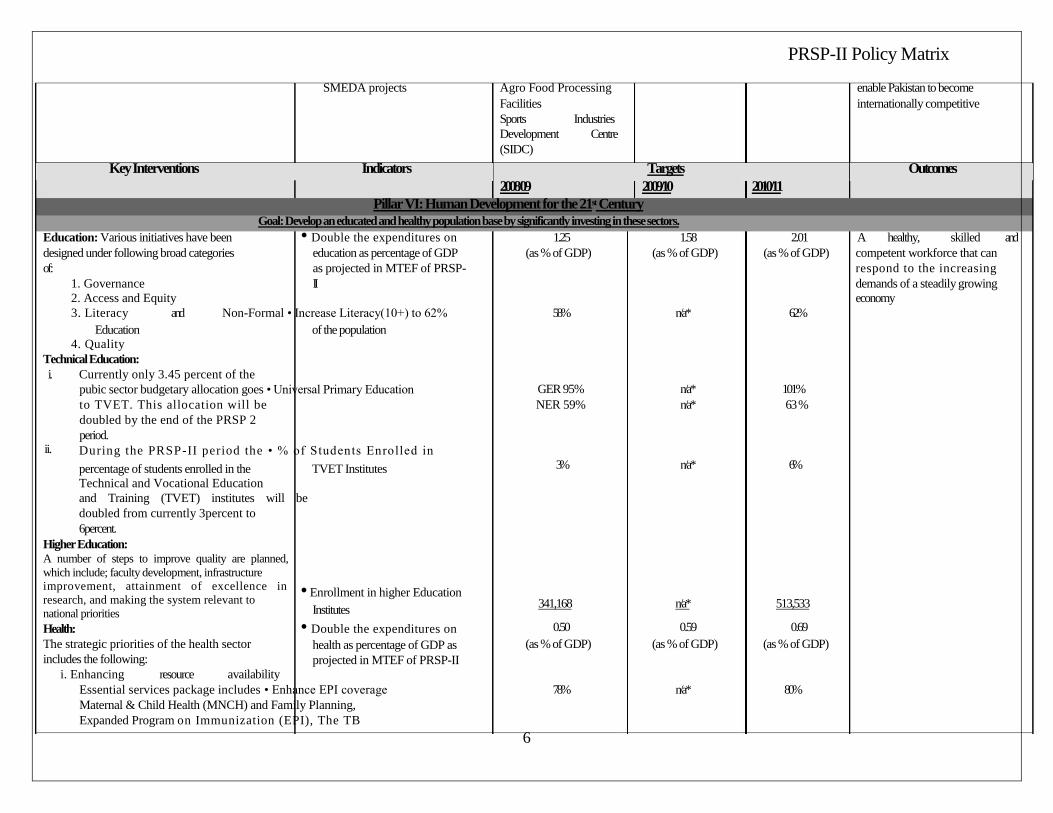
PRSP-II Policy Matrix
SMEDA projects
Agro Food Processing Facilities Sports Industries Development Centre (SIDC)
enable Pakistan to become internationally competitive
Key Interventions Indicators Targets Outcomes 2008/09 2009/10 2010/11
Pillar VI: Human Development for the 21st Century Goal: Develop an educated and healthy population base by significantly investing in these sectors.
Education: Various initiatives have been • Double the expenditures on 1.25 1.58 2.01 A healthy, skilled and
designed under following broad categories education as percentage of GDP (as % of GDP) (as % of GDP) (as % of GDP) competent workforce that can of: as projected in MTEF of PRSP- respond to the increasing
1. Governance II demands of a steadily growing 2. Access and Equity economy
3. Literacy and Non-Formal• Increase Literacy(10+) to 62% 58% n/a* 62% Education of the population
4. Quality Technical Education:
i.
ii.
Currently only 3.45 percent of the pubic sector budgetary allocation goes• Universal Primary Education to TVET. This allocation will be doubled by the end of the PRSP 2 period. During the PRSP-II period the • % of Students Enrolled in
percentage of students enrolled in the TVET Institutes Technical and Vocational Education and Training (TVET) institutes will be
doubled from currently 3percent to 6percent.
GER 95% NER 59%
3%
n/a* n/a*
n/a*
101% 63 %
6%
Higher Education: A number of steps to improve quality are planned,
which include; faculty development, infrastructure improvement, attainment of excellence in
research, and making the system relevant to national priorities Health: The strategic priorities of the health sector includes the following:
i. Enhancing resource availability
• Enrollment in higher Education Institutes
• Double the expenditures on health as percentage of GDP as projected in MTEF of PRSP-II
341,168
0.50 (as % of GDP)
n/a*
0.59 (as % of GDP)
513,533
0.69 (as % of GDP)
Essential services package includes• Enhance EPI coverage 78% n/a* 80% Maternal & Child Health (MNCH) and Family Planning,
Expanded Program on Immunization (EPI), The TB
6
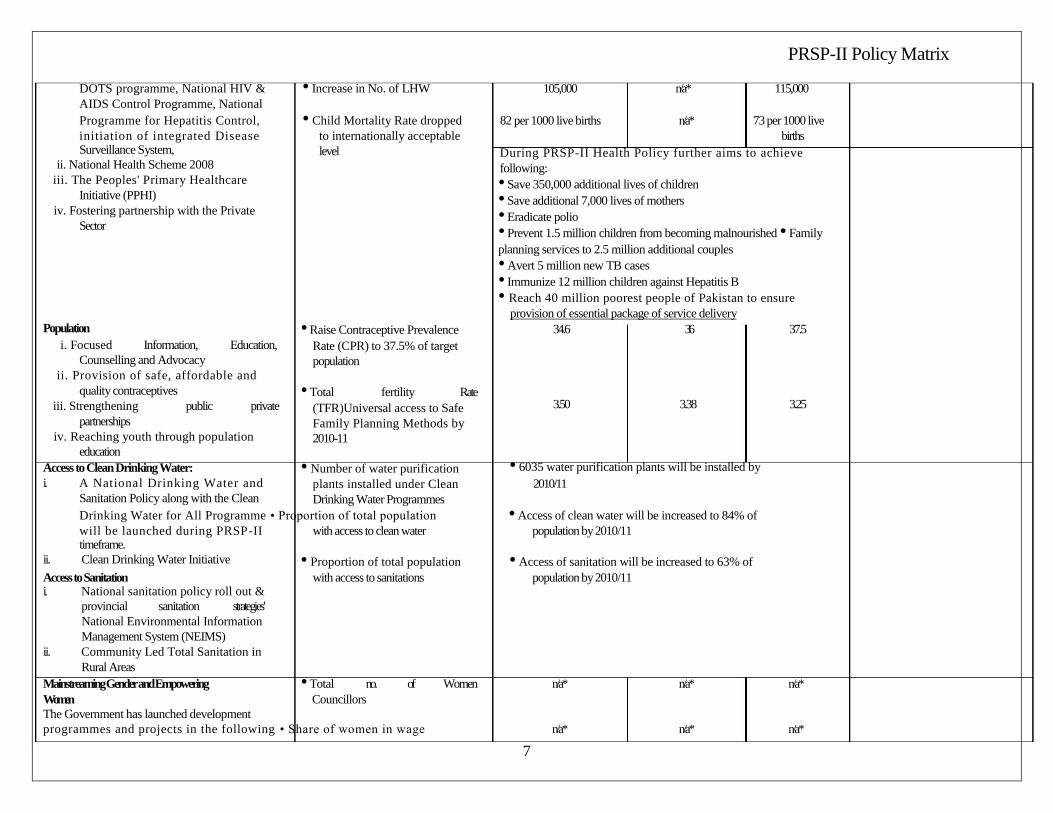
PRSP-II Policy Matrix
DOTS programme, National HIV & • Increase in No. of LHW 105,000 n/a* 115,000 AIDS Control Programme, National Programme for Hepatitis Control, • Child Mortality Rate dropped 82 per 1000 live births n/a* 73 per 1000 live initiation of integrated Disease to internationally acceptable births Surveillance System,
ii. National Health Scheme 2008 iii. The Peoples' Primary Healthcare
Initiative (PPHI) iv. Fostering partnership with the Private
Sector
Population i. Focused Information, Education,
Counselling and Advocacy ii. Provision of safe, affordable and
quality contraceptives iii. Strengthening public private
partnerships iv. Reaching youth through population
education Access to Clean Drinking Water: i. A National Drinking Water and
Sanitation Policy along with the Clean
level
• Raise Contraceptive Prevalence Rate (CPR) to 37.5% of target population
• Total fertility Rate (TFR)Universal access to Safe Family Planning Methods by 2010-11
• Number of water purification plants installed under Clean Drinking Water Programmes
During PRSP-II Health Policy further aims to achieve following: • Save 350,000 additional lives of children • Save additional 7,000 lives of mothers • Eradicate polio • Prevent 1.5 million children from becoming malnourished • Family
planning services to 2.5 million additional couples • Avert 5 million new TB cases • Immunize 12 million children against Hepatitis B • Reach 40 million poorest people of Pakistan to ensure
provision of essential package of service delivery 34.6 36 37.5
3.50 3.38 3.25
• 6035 water purification plants will be installed by 2010/11
Drinking Water for All Programme• Proportion of total population • Access of clean water will be increased to 84% of will be launched during PRSP-II with access to clean water population by 2010/11 timeframe.
ii. Clean Drinking Water Initiative • Proportion of total population • Access of sanitation will be increased to 63% of
Access to Sanitation with access to sanitations population by 2010/11 i. National sanitation policy roll out &
provincial sanitation strategies' National Environmental Information Management System (NEIMS)
ii. Community Led Total Sanitation in Rural Areas
Mainstreaming Gender and Empowering • Total no. of Women n/a* n/a* n/a* Women Councillors The Government has launched development
programmes and projects in the following • Share of women in wage n/a* n/a* n/a*
7
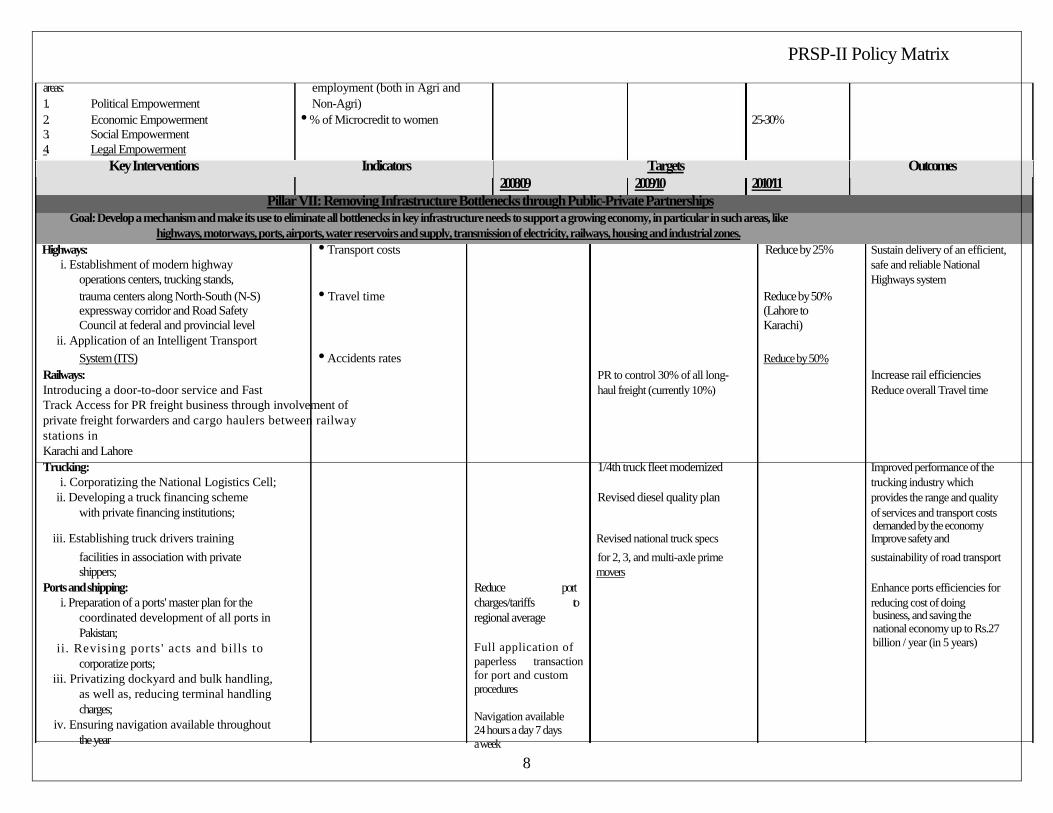
PRSP-II Policy Matrix
areas: employment (both in Agri and 1. Political Empowerment Non-Agri) 2. Economic Empowerment • % of Microcredit to women 25-30% 3. Social Empowerment 4. Legal Empowerment
Key Interventions Indicators Targets Outcomes 2008/09 2009/10 2010/11
Pillar VII: Removing Infrastructure Bottlenecks through Public-Private Partnerships Goal: Develop a mechanism and make its use to eliminate all bottlenecks in key infrastructure needs to support a growing economy, in particular in such areas, like
highways, motorways, ports, airports, water reservoirs and supply, transmission of electricity, railways, housing and industrial zones.
Highways: • Transport costs Reduce by 25% Sustain delivery of an efficient, i. Establishment of modern highway safe and reliable National
operations centers, trucking stands, Highways system trauma centers along North-South (N-S) • Travel time Reduce by 50% expressway corridor and Road Safety (Lahore to Council at federal and provincial level Karachi)
ii. Application of an Intelligent Transport System (ITS) • Accidents rates Reduce by 50%
Railways: PR to control 30% of all long- Increase rail efficiencies Introducing a door-to-door service and Fast haul freight (currently 10%) Reduce overall Travel time Track Access for PR freight business through involvement of
private freight forwarders and cargo haulers between railway
stations in Karachi and Lahore Trucking: 1/4th truck fleet modernized Improved performance of the
i. Corporatizing the National Logistics Cell; trucking industry which ii. Developing a truck financing scheme Revised diesel quality plan provides the range and quality
with private financing institutions; of services and transport costs demanded by the economy
iii. Establishing truck drivers training Revised national truck specs Improve safety and
facilities in association with private for 2, 3, and multi-axle prime sustainability of road transport shippers; movers
Ports and shipping: Reduce port Enhance ports efficiencies for i. Preparation of a ports' master plan for the charges/tariffs to reducing cost of doing
coordinated development of all ports in Pakistan;
ii. Revising ports ' acts and bills to corporatize ports;
iii. Privatizing dockyard and bulk handling, as well as, reducing terminal handling charges;
iv. Ensuring navigation available throughout the year
regional average
Full application of paperless transaction
for port and custom procedures Navigation available 24 hours a day 7 days a week
8
business, and saving the national economy up to Rs.27 billion / year (in 5 years)
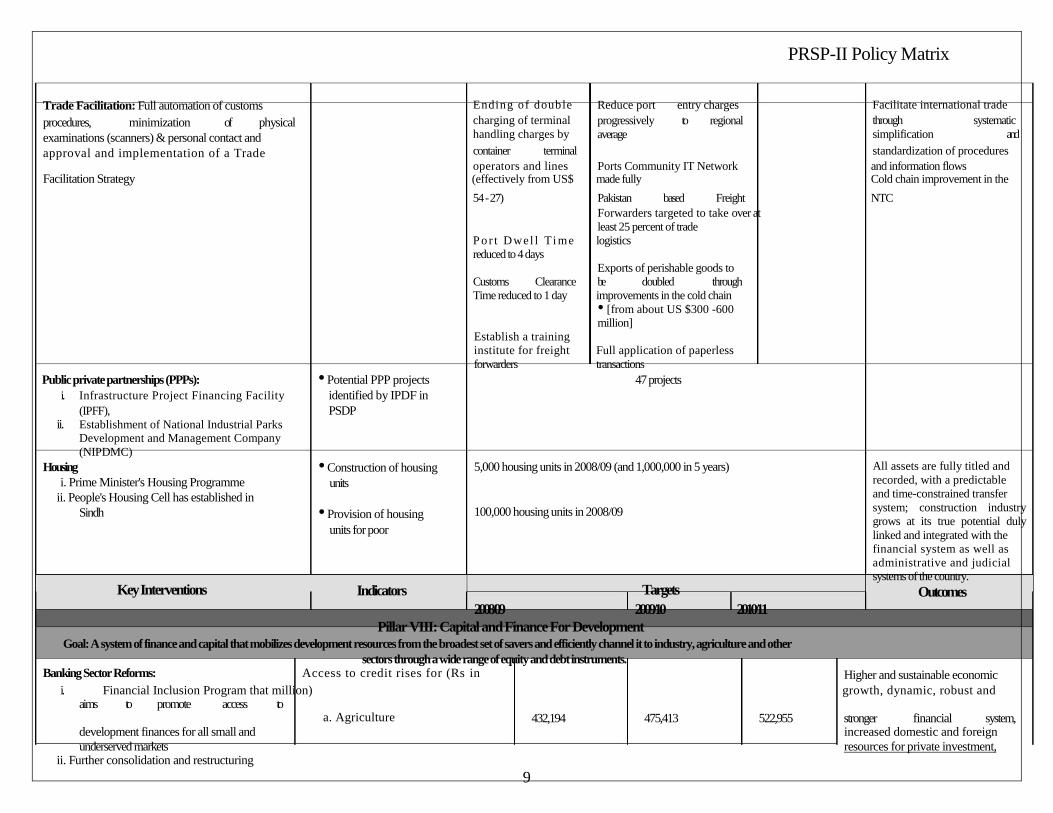
PRSP-II Policy Matrix
Trade Facilitation: Full automation of customs procedures, minimization of physical examinations (scanners) & personal contact and
Ending of double charging of terminal handling charges by
Reduce port progressively average
entry charges to regional
Facilitate international trade through systematic simplification and
approval and implementation of a Trade container terminal standardization of procedures
operators and lines Ports Community IT Network and information flows Facilitation Strategy (effectively from US$ made fully Cold chain improvement in the
54 - 27) Pakistan based Freight NTC Forwarders targeted to take over at
least 25 percent of trade P o r t Dwel l Ti me logistics reduced to 4 days
Exports of perishable goods to Customs Clearance be doubled through Time reduced to 1 day improvements in the cold chain
• [from about US $300 -600 million]
Establish a training institute for freight Full application of paperless forwarders transactions
Public private partnerships (PPPs): • Potential PPP projects 47 projects i. Infrastructure Project Financing Facility identified by IPDF in
(IPFF), PSDP ii. Establishment of National Industrial Parks
Development and Management Company (NIPDMC)
Housing i. Prime Minister's Housing Programme
ii. People's Housing Cell has established in Sindh
Key Interventions
• Construction of housing units
• Provision of housing units for poor
Indicators
5,000 housing units in 2008/09 (and 1,000,000 in 5 years)
100,000 housing units in 2008/09
Targets
2008/09 2009/10 2010/11
All assets are fully titled and recorded, with a predictable and time-constrained transfer system; construction industry
grows at its true potential duly
linked and integrated with the financial system as well as administrative and judicial systems of the country.
Outcomes
Pillar VIII: Capital and Finance For Development Goal: A system of finance and capital that mobilizes development resources from the broadest set of savers and efficiently channel it to industry, agriculture and other
sectors through a wide range of equity and debt instruments. Banking Sector Reforms: Access to credit rises for (Rs in Higher and sustainable economic
i. Financial Inclusion Program that million) growth, dynamic, robust and aims to promote access to
a. Agriculture 432,194 475,413 522,955 stronger financial system, development finances for all small and underserved markets
ii. Further consolidation and restructuring
increased domestic and foreign resources for private investment,
9
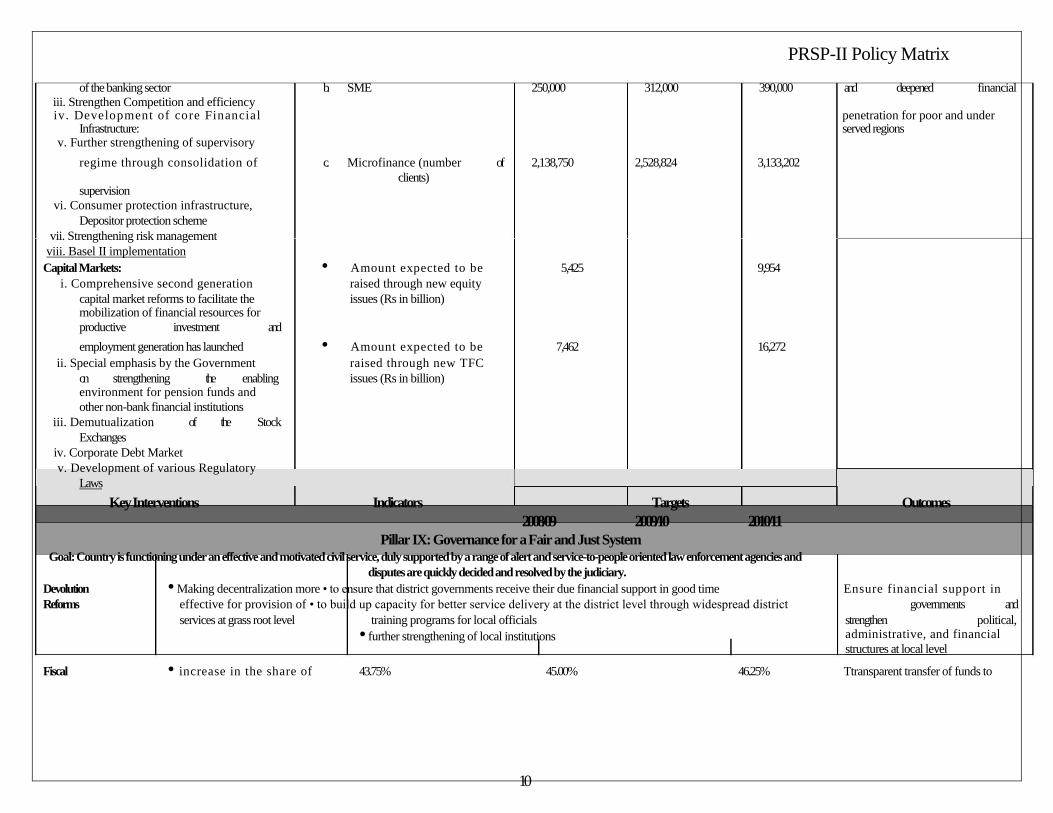
PRSP-II Policy Matrix
of the banking sector b. SME 250,000 312,000 390,000 and deepened financial iii. Strengthen Competition and efficiency iv. Development of core Financial penetration for poor and under
Infrastructure: served regions v. Further strengthening of supervisory
regime through consolidation of c. Microfinance (number of 2,138,750 2,528,824 3,133,202 clients)
supervision vi. Consumer protection infrastructure,
Depositor protection scheme vii. Strengthening risk management
viii. Basel II implementation
Capital Markets: • Amount expected to be 5,425 9,954 i. Comprehensive second generation raised through new equity
capital market reforms to facilitate the issues (Rs in billion) mobilization of financial resources for productive investment and
employment generation has launched • Amount expected to be 7,462 16,272 ii. Special emphasis by the Government raised through new TFC
on strengthening the enabling issues (Rs in billion) environment for pension funds and other non-bank financial institutions
iii. Demutualization of the Stock Exchanges
iv. Corporate Debt Market v. Development of various Regulatory
Laws
Key Interventions Indicators Targets Outcomes
2008/09 2009/10 2010/11
Pillar IX: Governance for a Fair and Just System Goal: Country is functioning under an effective and motivated civil service, duly supported by a range of alert and service-to-people oriented law enforcement agencies and
disputes are quickly decided and resolved by the judiciary.
Devolution • Making decentralization more• to ensure that district governments receive their due financial support in good time Ensure financial support in
Reforms effective for provision of• to build up capacity for better service delivery at the district level through widespread district governments and services at grass root level training programs for local officials strengthen political,
• further strengthening of local institutions administrative, and financial structures at local level
Fiscal • increase in the share of 43.75% 45.00% 46.25% Ttransparent transfer of funds to
10
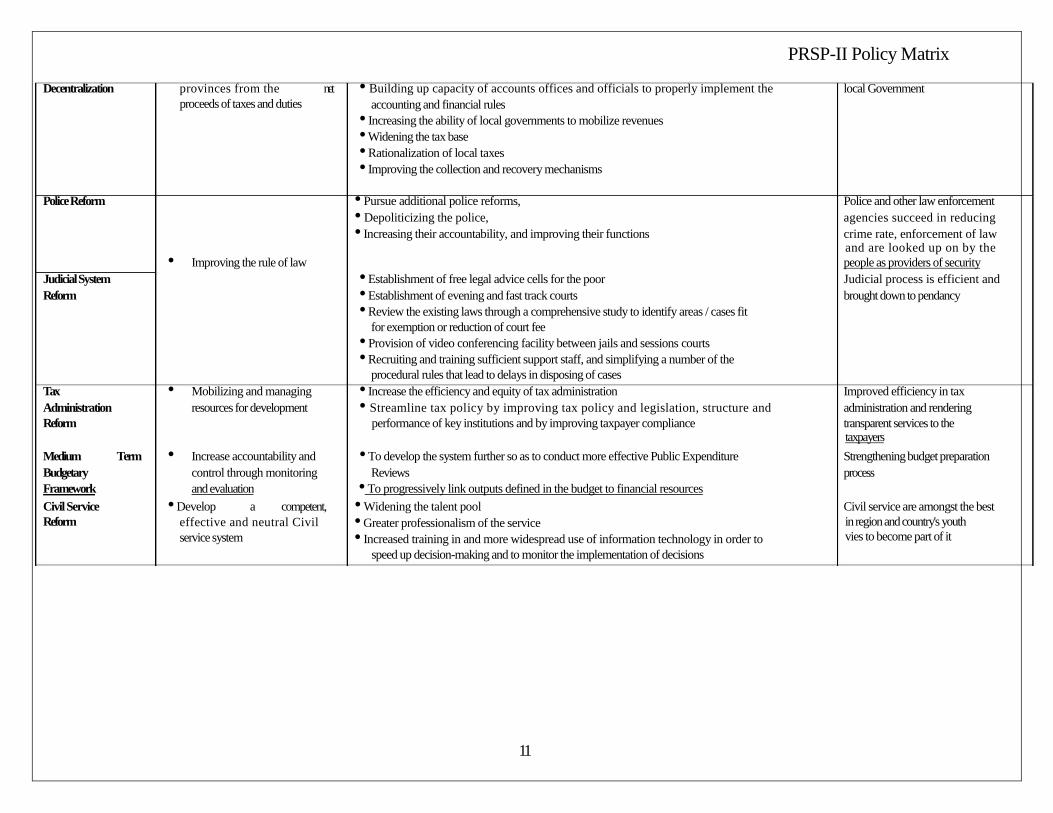
PRSP-II Policy Matrix
Decentralization provinces from the net • Building up capacity of accounts offices and officials to properly implement the local Government
proceeds of taxes and duties accounting and financial rules • Increasing the ability of local governments to mobilize revenues • Widening the tax base • Rationalization of local taxes • Improving the collection and recovery mechanisms
Police Reform • Pursue additional police reforms, Police and other law enforcement • Depoliticizing the police, agencies succeed in reducing • Increasing their accountability, and improving their functions crime rate, enforcement of law
and are looked up on by the • Improving the rule of law people as providers of security
Judicial System • Establishment of free legal advice cells for the poor Judicial process is efficient and Reform • Establishment of evening and fast track courts brought down to pendancy
• Review the existing laws through a comprehensive study to identify areas / cases fit for exemption or reduction of court fee
• Provision of video conferencing facility between jails and sessions courts • Recruiting and training sufficient support staff, and simplifying a number of the
procedural rules that lead to delays in disposing of cases Tax • Mobilizing and managing • Increase the efficiency and equity of tax administration Improved efficiency in tax Administration resources for development • Streamline tax policy by improving tax policy and legislation, structure and administration and rendering Reform performance of key institutions and by improving taxpayer compliance transparent services to the
taxpayers
Medium Term • Increase accountability and • To develop the system further so as to conduct more effective Public Expenditure Strengthening budget preparation Budgetary control through monitoring Reviews process Framework and evaluation • To progressively link outputs defined in the budget to financial resources
Civil Service • Develop a competent, • Widening the talent pool Civil service are amongst the best
Reform effective and neutral Civil service system
• Greater professionalism of the service • Increased training in and more widespread use of information technology in order to
speed up decision-making and to monitor the implementation of decisions
in region and country's youth vies to become part of it
11