Potential applications of Unmanned Aerial Vehicle ...era.daf.qld.gov.au/5497/1/HFS - Potential...
19
Potential applications of Unmanned Aerial Vehicle multispectral imagery in vegetables Julie O’Halloran, Horticulture and Forestry Science Agri-Science Queensland Innovation Opportunity July 2016
Transcript of Potential applications of Unmanned Aerial Vehicle ...era.daf.qld.gov.au/5497/1/HFS - Potential...
Potential applications of Unmanned Aerial Vehiclemultispectral imagery in vegetables
Julie O’Halloran, Horticulture and Forestry Science
Agri-Science Queensland Innovation Opportunity
July 2016
This publication has been compiled by Julie O’Halloran of Agri-Science Queensland, Department of Agriculture and Fisheriesand Nathaniel Parker of Airborn Insight.
© State of Queensland, 2015
The Queensland Government supports and encourages the dissemination and exchange of its information. The copyright inthis publication is licensed under a Creative Commons Attribution 3.0 Australia (CC BY) licence.
Under this licence you are free, without having to seek our permission, to use this publication in accordance with the licenceterms.
You must keep intact the copyright notice and attribute the State of Queensland as the source of the publication.
Note: Some content in this publication may have different licence terms as indicated.
For more information on this licence, visit http://creativecommons.org/licenses/by/3.0/au/deed.en
The information contained herein is subject to change without notice. The Queensland Government shall not be liable fortechnical or other errors or omissions contained herein. The reader/user accepts all risks and responsibility for losses,damages, costs and other consequences resulting directly or indirectly from using this information.
Summary
A proof of concept project using UAV technology was conducted in conjunction with Rugby Farms,
Gatton to assess the potential application of UAV crop sensing imagery in vegetable systems. The
work focused on 2 key areas: detection of Sclerotinia in green beans using NDVI as an indicator of
crop stress; and the development of predictive capacity for yield and final plant parameters. Green
beans, lettuce, sweet corn and broccoli were the key crops studied.
Sclerotinia was evident in field sampling of green bean crops but not in the initial crop sensing data.
Higher resolution flights at key crop stages might have been more successful. UAV NDVI imagery
successfully identified spatial variability in all crops. Small plot yield assessments in green beans
identified a 20% reduction in yield in lower NDVI areas (approximately 27% of the field).
In additions to identifying spatial variability, UAV NDVI imagery was also utilised to determine what
predictive capacity could be developed for yield and final plant parameters across the experimental
sites. The small scale assessments reported here confirm that early season variability is maintained
through to maturity suggesting that early season data measurements could be used to predict final
yield and plant characteristics.
Classification and automated counting process were applied to corn data as a mechanism for
potentially predicting final yield. The automated corn counts were 10% less than manual counts.
Automated counts of lettuce were 98% accurate relative to manual counts. Field measurements of
plant parameters (plant and head diameter and final weights) were highly correlated with predicted
harvest data (R2 0.608-0.915).
Given the project was a small scoping study, significant development would be required to further
assess this application of technology in vegetable systems. This would include refinement of the
algorithms and classification counting processes with significant larger datasets and rigorous
validation and testing.
Table of contents
Table of figures ...................................................................................................................................... ii
Table of images......................................................................................................................................iii
Table of tables........................................................................................................................................iii
Background ............................................................................................................................................ 1
Project Objectives.................................................................................................................................. 2
Methodology........................................................................................................................................... 2
Unmanned Aerial Vehicle ...................................................................................................................... 2
Field sampling ........................................................................................................................................ 3
Data Processing and Analysis ............................................................................................................... 4
Results .................................................................................................................................................... 4
Disease detection in green beans.......................................................................................................... 4
Detecting spatial variability .................................................................................................................... 4
Counting and Sizing Lettuce .................................................................................................................. 5
Automated Corn Counts ........................................................................................................................ 6
Use of different indices .......................................................................................................................... 7
Significance ............................................................................................................................................ 8
Key Messages ........................................................................................................................................ 9
Where to next .......................................................................................................................................10
Budget Summary .................................................................................................................................10
References............................................................................................................................................10
Acknowledgements .............................................................................................................................11
Appendix 1 Quantification of field area characterised by lower and higher NDVI values as an
indicator of plant vigour. .....................................................................................................................12
Appendix 2 Lettuce measured parameters and UAV derived parameters.....................................13
Appendix 3 Lettuce automated counting ..........................................................................................14
Table of figures
Figure 1 Reflectance of Red/ Green/ Blue and NIR light from a healthy and unhealthy leaf (left) and
calculation of NDVI from a healthy and unhealthy plant (right). Source: Basics of crop sensing,
Alabama Cooperative Extension System www.aces.edu ........................................................................ 1
Figure 2 Yield from hand harvested small green bean plots compared with the NDVI value 3 weeks
prior to harvest ......................................................................................................................................... 5
Figure 3 Lettuce harvest characteristics vs. automated sizing from UAV imagery.................................. 6

Table of images
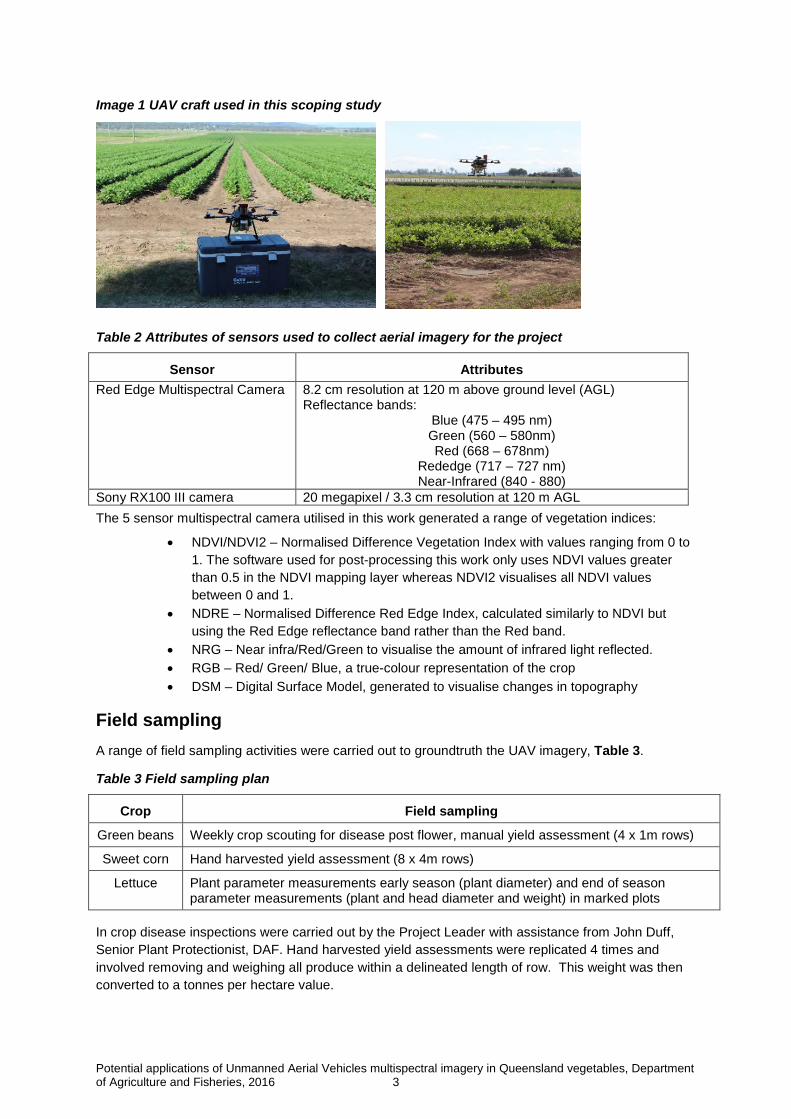
Image 1 UAV craft used in this scoping study ......................................................................................... 3
Image 2 Green beans NDVI imagery at first flower at 90m AGL (left – circles highlight ‘pinching in’ of
plant canopy), diseased plant (top right) and Sclerotinia in green beans (bottom right) ......................... 4
Image 3 NDVI imagery of green beans (centre) and zoomed in to each end of the field (left) and size
of green bean plants from each of the areas indicated (right) ................................................................. 5
Image 4 Green beans harvested from 1 metre of plants from highest yielding plot and lowest yielding
plot sampled from the areas indicated by the arrow tips in Image 2. ...................................................... 5
Image 5 Comparison of on ground photo (left), high resolution digital image (centre) and NDVI
imagery (right) of a lettuce field 4 weeks after transplant (the same 2 metres of row are highlighted in
each image) ............................................................................................................................................. 6
Image 6 Process to Extract Plant Count on corn..................................................................................... 7
Image 7 NDVI (left), NDRE (centre) and RGB (right) imagery in green beans ....................................... 8
Table of tables
Table 1 Crop and flight plan....................................................................................................................2
Table 2 Attributes of sensors used to collect aerial imagery for the project ...........................................3
Table 3 Field sampling plan ....................................................................................................................3
Table 4 Comparison of actual field plant counts and NDVI classification counts ...................................7
Potential applications of Unmanned Aerial Vehicles multispectral imagery in Queensland vegetables, Departmentof Agriculture and Fisheries, 2016 1
Background
Precision agriculture (PA) technologies, such as crop biomass sensing, have until recently had limited
adoption into Queensland vegetable production beyond GPS guidance systems. The Australian
Government funded Department of Agriculture and Fisheries (DAF) project ‘Adoption of variable rate
technologies into Queensland’s intensive vegetable production systems‘ has focused on
implementing and optimising a range of PA technologies in vegetables over the last 2 years (Limpus
et al. 2016).
Collaboration between DAF and Boeing Australia in 2014-15 as part of this project involved the use of
UAV technology to monitor onions in south-east Queensland with the aim of developing specific
analytical algorithms that could be used in a predictive capacity. The initial Agri-Science Queensland
Innovation grant proposal aimed to build on this existing collaboration with Boeing Australia by
groundtruthing the progression of white rot in red onions for the development of an algorithm with
predictive capacity for disease incidence. However, after acceptance of this project proposal, Boeing
Australia notified DAF that it would no longer be undertaking UAV flights in 2015 and the situation had
still not been clarified for 2016. Given these circumstances the project leader was advised to
redevelop the project into something with similar objectives that would be able to be sufficiently
resourced. The work presented here reflects a redevelopment of the initial proposal as a scoping
study to assess the potential applications of UAV imagery to vegetable systems.
Remote sensing has been successfully used in a range of crops, primarily broadacre (cotton and
grains) for a range of purposes related to soil and crop variability (De Benedetto et al. 2013; Hatfield
and Pinter Jr 1993; Schofield et al. 2016; Seelan et al. 2003). The Normalised Difference Vegetation
Index (NDVI) has been the primary vegetation index used. NDVI is calculated from the visible and
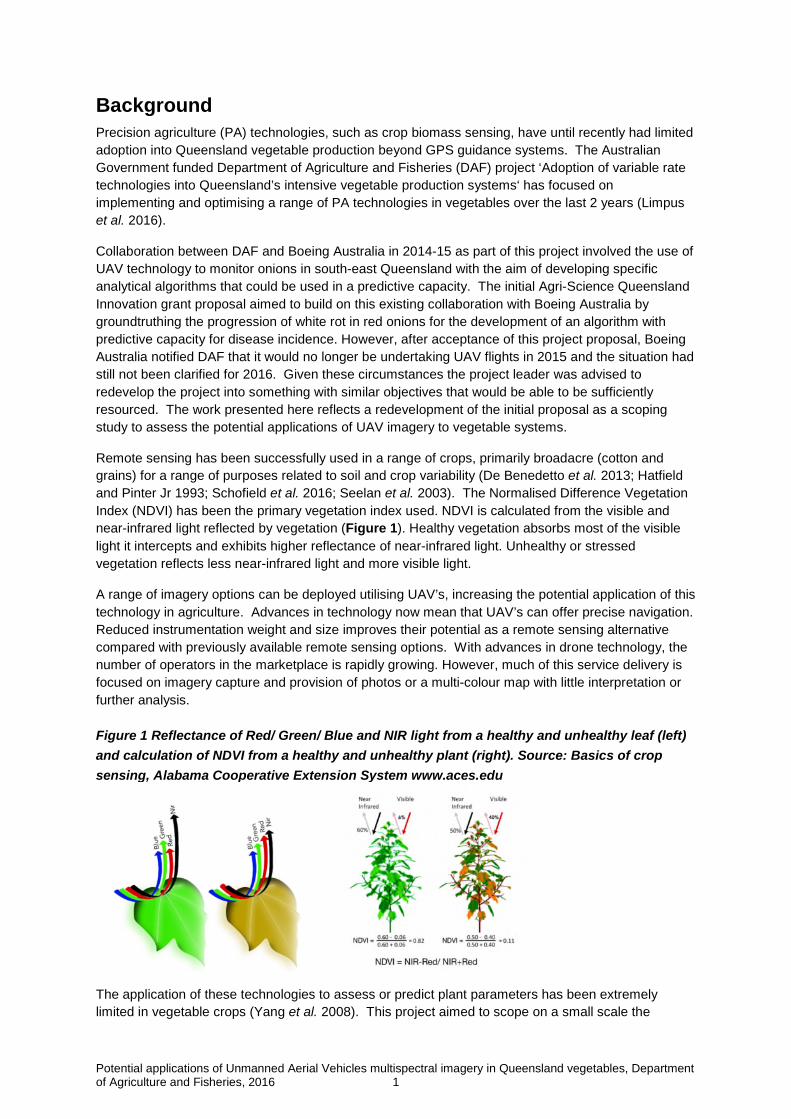
near-infrared light reflected by vegetation (Figure 1). Healthy vegetation absorbs most of the visible
light it intercepts and exhibits higher reflectance of near-infrared light. Unhealthy or stressed
vegetation reflects less near-infrared light and more visible light.
A range of imagery options can be deployed utilising UAV’s, increasing the potential application of this
technology in agriculture. Advances in technology now mean that UAV’s can offer precise navigation.
Reduced instrumentation weight and size improves their potential as a remote sensing alternative
compared with previously available remote sensing options. With advances in drone technology, the
number of operators in the marketplace is rapidly growing. However, much of this service delivery is
focused on imagery capture and provision of photos or a multi-colour map with little interpretation or
further analysis.
Figure 1 Reflectance of Red/ Green/ Blue and NIR light from a healthy and unhealthy leaf (left)
and calculation of NDVI from a healthy and unhealthy plant (right). Source: Basics of crop
sensing, Alabama Cooperative Extension System www.aces.edu
The application of these technologies to assess or predict plant parameters has been extremely
limited in vegetable crops (Yang et al. 2008). This project aimed to scope on a small scale the
Potential applications of Unmanned Aerial Vehicles multispectral imagery in Queensland vegetables, Departmentof Agriculture and Fisheries, 2016 2
potential for UAV technologies to be used to assess and develop predictive capabilities for a range of
crop parameters including: disease detection using remote sensing; accurate prediction of yield from
early season automated counts and sizing; and forecast of market specification information.
Project Objectives
The objective of this small project was to assess the potential application of UAV crop sensing
imagery in vegetable systems including:
• Detection of diseases in green beans
• Early season crop counting and sizing of lettuce and broccoli to predict maturity and yield
from crop vegetation indices
• Optimal timing and resolution of imagery for different purposes without compromising data
quality and cost effectiveness
MethodologyAn initial meeting between DAF, Airborn Insight (UAV operator) and Rugby Farms (grower co-
operator) identified green beans, sweet corn, lettuce and broccoli (data not shown) as key crops for
image capture. Key crop stages for flights were identified to optimise the amount of information we
could obtain from the minimal number of flights (Table 1). Rugby farms indicated that for their
business, plant counts and sizing of crops for predicting harvest timing and potential yields would be
key areas of interest.
Table 1 Crop and flight plan
Flight 1 Flight 2 Flight 3 Flight 4 Comments
Green beans (x3) √ √ √ Weekly flights x 3 from flowering
Sweet corn √ √ Early crop and silking
Lettuce √ Early crop before plants touching
Unmanned Aerial Vehicle
A Toowoomba based UAV business Airborn Insight was selected to perform UAV services relating to
this project as the only commercial operator that could also support image processing, statistical
analysis and the development of algorithms for automated image analysis. The UAV utilised for this
work was multirotor aircraft (Image 1) fitted with a Red Edge 5 sensor multispectral camera with
narrow band channels optimised for agricultural crops (Table 2). Also included on the UAV was a 20
megapixel RX 100 III Sony camera for the development of 3D crop models. Post processing of the
images from this camera generates final images of 500-1000 megapixels. The two cameras were
mounted on the UAV during each flight to collect both multispectral images and high resolution photos
that could be post processed into 3D models for analysis. Flight heights were manipulated to achieve
the desired ground resolution depending on the data analysis requirements. Depending on the site
and project objectives the resolution of each pixel ranged from 0.7cm2 (25 m flights with Sony) –
8.2cm2 (120 m flights with Red Edge).
Potential applications of Unmanned Aerial Vehicles multispectral imagery in Queensland vegetables, Departmentof Agriculture and Fisheries, 2016 3
Image 1 UAV craft used in this scoping study
Table 2 Attributes of sensors used to collect aerial imagery for the project
Sensor Attributes
Red Edge Multispectral Camera 8.2 cm resolution at 120 m above ground level (AGL)Reflectance bands:
Blue (475 – 495 nm)Green (560 – 580nm)Red (668 – 678nm)
Rededge (717 – 727 nm)Near-Infrared (840 - 880)
Sony RX100 III camera 20 megapixel / 3.3 cm resolution at 120 m AGL
The 5 sensor multispectral camera utilised in this work generated a range of vegetation indices:
• NDVI/NDVI2 – Normalised Difference Vegetation Index with values ranging from 0 to
1. The software used for post-processing this work only uses NDVI values greater
than 0.5 in the NDVI mapping layer whereas NDVI2 visualises all NDVI values
between 0 and 1.
• NDRE – Normalised Difference Red Edge Index, calculated similarly to NDVI but
using the Red Edge reflectance band rather than the Red band.
• NRG – Near infra/Red/Green to visualise the amount of infrared light reflected.
• RGB – Red/ Green/ Blue, a true-colour representation of the crop
• DSM – Digital Surface Model, generated to visualise changes in topography
Field sampling
A range of field sampling activities were carried out to groundtruth the UAV imagery, Table 3.
Table 3 Field sampling plan
Crop Field sampling
Green beans Weekly crop scouting for disease post flower, manual yield assessment (4 x 1m rows)
Sweet corn Hand harvested yield assessment (8 x 4m rows)
Lettuce Plant parameter measurements early season (plant diameter) and end of seasonparameter measurements (plant and head diameter and weight) in marked plots
In crop disease inspections were carried out by the Project Leader with assistance from John Duff,
Senior Plant Protectionist, DAF. Hand harvested yield assessments were replicated 4 times and
involved removing and weighing all produce within a delineated length of row. This weight was then
converted to a tonnes per hectare value.
Potential applications of Unmanned Aerial Vehicles multispectral imagery in Queensland vegetables, Departmentof Agriculture and Fisheries, 2016 4
Data Processing and Analysis
Imagery was available within 24 hours of capture and viewed through the Atlas MicaSense website
e.g. https://atlas.micasense.com/data/map/public?token=rJVyFeH74C7pemhzoxKfAw
This website also has a geo-locator tool which facilitated tracking the location of personnel in the field
for groundtruthing activities. Data analysis was completed by Airborn Insight staff. For the lettuce
analysis, an automated process was used on jpeg imagery to separate NDVI signatures. The corn
analysis used training software in ArcGIS.
Results
The following results summarises the key findings from this work.
Disease detection in green beans
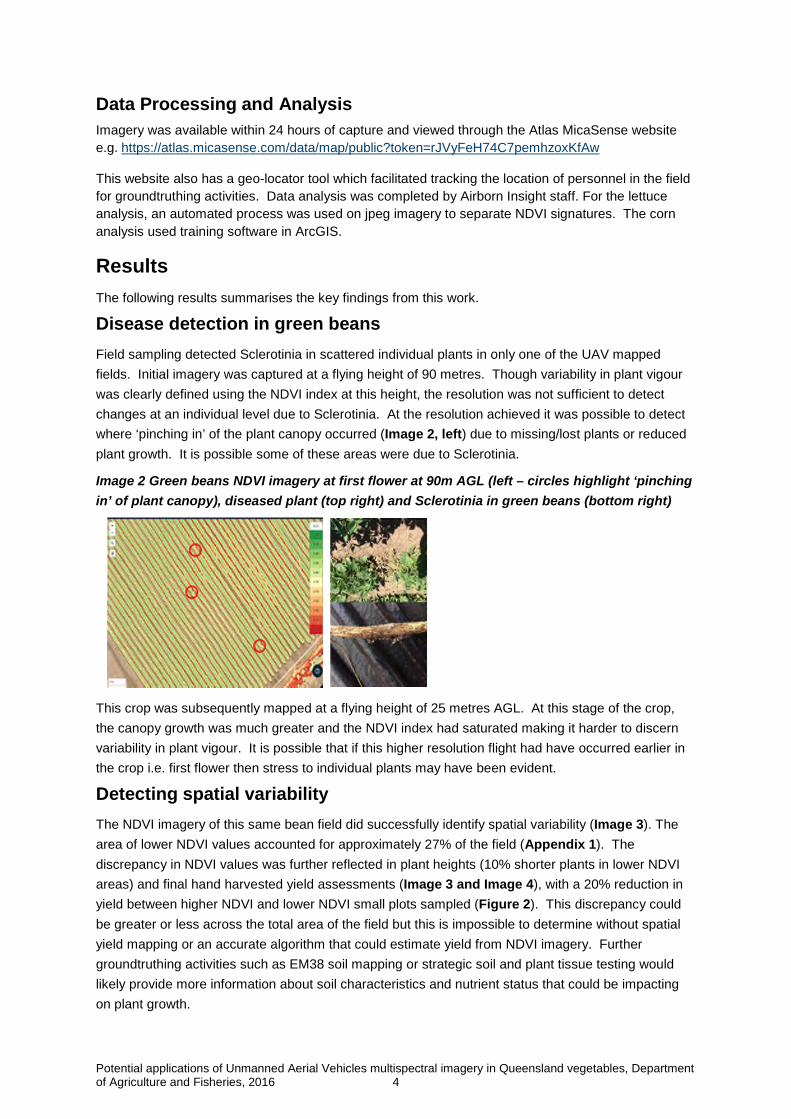
Field sampling detected Sclerotinia in scattered individual plants in only one of the UAV mapped
fields. Initial imagery was captured at a flying height of 90 metres. Though variability in plant vigour
was clearly defined using the NDVI index at this height, the resolution was not sufficient to detect
changes at an individual level due to Sclerotinia. At the resolution achieved it was possible to detect
where ‘pinching in’ of the plant canopy occurred (Image 2, left) due to missing/lost plants or reduced
plant growth. It is possible some of these areas were due to Sclerotinia.
Image 2 Green beans NDVI imagery at first flower at 90m AGL (left – circles highlight ‘pinching
in’ of plant canopy), diseased plant (top right) and Sclerotinia in green beans (bottom right)
This crop was subsequently mapped at a flying height of 25 metres AGL. At this stage of the crop,
the canopy growth was much greater and the NDVI index had saturated making it harder to discern
variability in plant vigour. It is possible that if this higher resolution flight had have occurred earlier in
the crop i.e. first flower then stress to individual plants may have been evident.
Detecting spatial variability
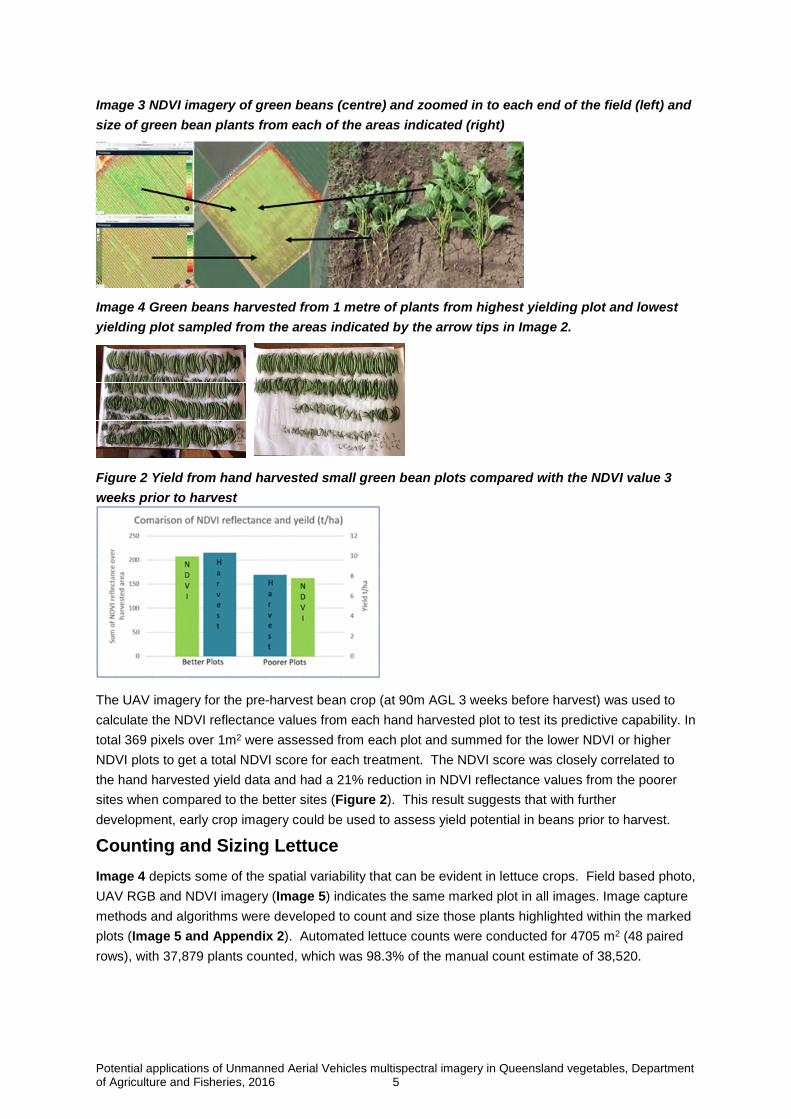
The NDVI imagery of this same bean field did successfully identify spatial variability (Image 3). The
area of lower NDVI values accounted for approximately 27% of the field (Appendix 1). The
discrepancy in NDVI values was further reflected in plant heights (10% shorter plants in lower NDVI
areas) and final hand harvested yield assessments (Image 3 and Image 4), with a 20% reduction in
yield between higher NDVI and lower NDVI small plots sampled (Figure 2). This discrepancy could
be greater or less across the total area of the field but this is impossible to determine without spatial
yield mapping or an accurate algorithm that could estimate yield from NDVI imagery. Further
groundtruthing activities such as EM38 soil mapping or strategic soil and plant tissue testing would
likely provide more information about soil characteristics and nutrient status that could be impacting
on plant growth.
Potential applications of Unmanned Aerial Vehicles multispectral imagery in Queensland vegetables, Departmentof Agriculture and Fisheries, 2016 5
Image 3 NDVI imagery of green beans (centre) and zoomed in to each end of the field (left) and
size of green bean plants from each of the areas indicated (right)
Image 4 Green beans harvested from 1 metre of plants from highest yielding plot and lowest
yielding plot sampled from the areas indicated by the arrow tips in Image 2.
Figure 2 Yield from hand harvested small green bean plots compared with the NDVI value 3
weeks prior to harvest
The UAV imagery for the pre-harvest bean crop (at 90m AGL 3 weeks before harvest) was used to
calculate the NDVI reflectance values from each hand harvested plot to test its predictive capability. In
total 369 pixels over 1m2 were assessed from each plot and summed for the lower NDVI or higher
NDVI plots to get a total NDVI score for each treatment. The NDVI score was closely correlated to
the hand harvested yield data and had a 21% reduction in NDVI reflectance values from the poorer
sites when compared to the better sites (Figure 2). This result suggests that with further
development, early crop imagery could be used to assess yield potential in beans prior to harvest.
Counting and Sizing Lettuce
Image 4 depicts some of the spatial variability that can be evident in lettuce crops. Field based photo,
UAV RGB and NDVI imagery (Image 5) indicates the same marked plot in all images. Image capture
methods and algorithms were developed to count and size those plants highlighted within the marked
plots (Image 5 and Appendix 2). Automated lettuce counts were conducted for 4705 m2 (48 paired
rows), with 37,879 plants counted, which was 98.3% of the manual count estimate of 38,520.
Potential applications of Unmanned Aerial Vehicles multispectral imagery in Queensland vegetables, Departmentof Agriculture and Fisheries, 2016 6
Image 5 Comparison of on ground photo (left), high resolution digital image (centre) and NDVI
imagery (right) of a lettuce field 4 weeks after transplant (the same 2 metres of row are
highlighted in each image)
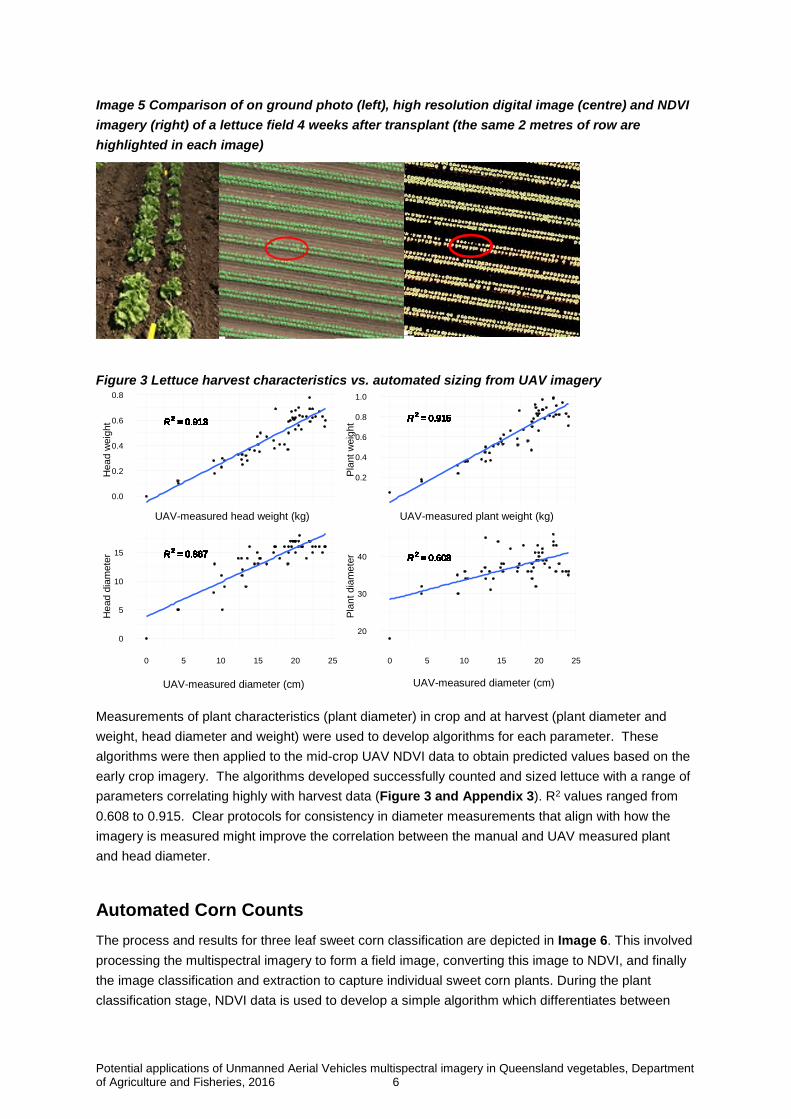
Figure 3 Lettuce harvest characteristics vs. automated sizing from UAV imagery
Measurements of plant characteristics (plant diameter) in crop and at harvest (plant diameter and
weight, head diameter and weight) were used to develop algorithms for each parameter. These
algorithms were then applied to the mid-crop UAV NDVI data to obtain predicted values based on the
early crop imagery. The algorithms developed successfully counted and sized lettuce with a range of
parameters correlating highly with harvest data (Figure 3 and Appendix 3). R2 values ranged from
0.608 to 0.915. Clear protocols for consistency in diameter measurements that align with how the
imagery is measured might improve the correlation between the manual and UAV measured plant
and head diameter.
Automated Corn Counts
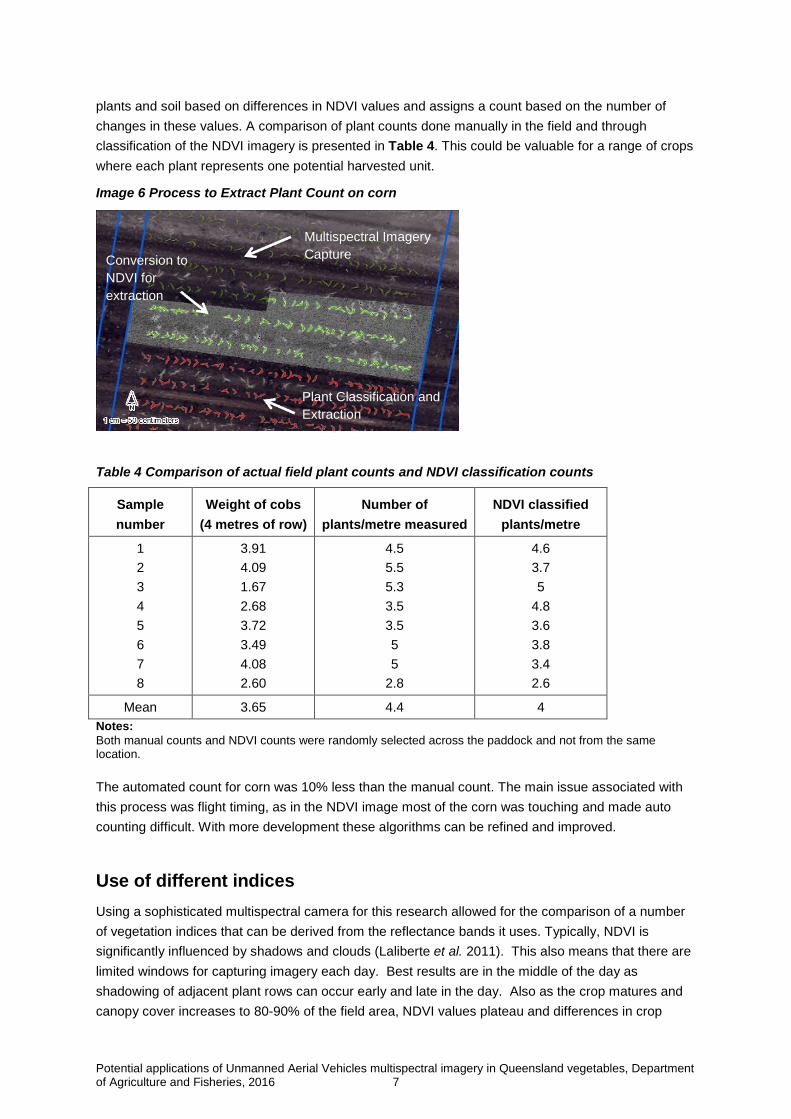
The process and results for three leaf sweet corn classification are depicted in Image 6. This involved
processing the multispectral imagery to form a field image, converting this image to NDVI, and finally
the image classification and extraction to capture individual sweet corn plants. During the plant
classification stage, NDVI data is used to develop a simple algorithm which differentiates between
R 2 = 0.913R 2 = 0.913R 2 = 0.913R 2 = 0.913R 2 = 0.913R 2 = 0.913R 2 = 0.913R 2 = 0.913R 2 = 0.913R 2 = 0.913R 2 = 0.913R 2 = 0.913R 2 = 0.913R 2 = 0.913R 2 = 0.913R 2 = 0.913R 2 = 0.913R 2 = 0.913R 2 = 0.913R 2 = 0.913R 2 = 0.913R 2 = 0.913R 2 = 0.913R 2 = 0.913R 2 = 0.913R 2 = 0.913R 2 = 0.913R 2 = 0.913R 2 = 0.913R 2 = 0.913R 2 = 0.913R 2 = 0.913R 2 = 0.913R 2 = 0.913R 2 = 0.913R 2 = 0.913R 2 = 0.913R 2 = 0.913R 2 = 0.913R 2 = 0.913R 2 = 0.913R 2 = 0.913R 2 = 0.913R 2 = 0.913R 2 = 0.913R 2 = 0.913R 2 = 0.913R 2 = 0.913R 2 = 0.913R 2 = 0.913R 2 = 0.913R 2 = 0.913R 2 = 0.913
R 2 = 0.867R 2 = 0.867R 2 = 0.867R 2 = 0.867R 2 = 0.867R 2 = 0.867R 2 = 0.867R 2 = 0.867R 2 = 0.867R 2 = 0.867R 2 = 0.867R 2 = 0.867R 2 = 0.867R 2 = 0.867R 2 = 0.867R 2 = 0.867R 2 = 0.867R 2 = 0.867R 2 = 0.867R 2 = 0.867R 2 = 0.867R 2 = 0.867R 2 = 0.867R 2 = 0.867R 2 = 0.867R 2 = 0.867R 2 = 0.867R 2 = 0.867R 2 = 0.867R 2 = 0.867R 2 = 0.867R 2 = 0.867R 2 = 0.867R 2 = 0.867R 2 = 0.867R 2 = 0.867R 2 = 0.867R 2 = 0.867R 2 = 0.867R 2 = 0.867R 2 = 0.867R 2 = 0.867R 2 = 0.867R 2 = 0.867R 2 = 0.867R 2 = 0.867R 2 = 0.867R 2 = 0.867R 2 = 0.867R 2 = 0.867R 2 = 0.867R 2 = 0.867R 2 = 0.867
0.0
0.2
0.4
0.6
0.8
0
5
10
15
0 5 10 15 20 25
Hea
dw
eig
ht
He
ad
dia
mete
r
R 2 = 0.915R 2 = 0.915R 2 = 0.915R 2 = 0.915R 2 = 0.915R 2 = 0.915R 2 = 0.915R 2 = 0.915R 2 = 0.915R 2 = 0.915R 2 = 0.915R 2 = 0.915R 2 = 0.915R 2 = 0.915R 2 = 0.915R 2 = 0.915R 2 = 0.915R 2 = 0.915R 2 = 0.915R 2 = 0.915R 2 = 0.915R 2 = 0.915R 2 = 0.915R 2 = 0.915R 2 = 0.915R 2 = 0.915R 2 = 0.915R 2 = 0.915R 2 = 0.915R 2 = 0.915R 2 = 0.915R 2 = 0.915R 2 = 0.915R 2 = 0.915R 2 = 0.915R 2 = 0.915R 2 = 0.915R 2 = 0.915R 2 = 0.915R 2 = 0.915R 2 = 0.915R 2 = 0.915R 2 = 0.915R 2 = 0.915R 2 = 0.915R 2 = 0.915R 2 = 0.915R 2 = 0.915R 2 = 0.915R 2 = 0.915R 2 = 0.915R 2 = 0.915R 2 = 0.915
R 2 = 0.608R 2 = 0.608R 2 = 0.608R 2 = 0.608R 2 = 0.608R 2 = 0.608R 2 = 0.608R 2 = 0.608R 2 = 0.608R 2 = 0.608R 2 = 0.608R 2 = 0.608R 2 = 0.608R 2 = 0.608R 2 = 0.608R 2 = 0.608R 2 = 0.608R 2 = 0.608R 2 = 0.608R 2 = 0.608R 2 = 0.608R 2 = 0.608R 2 = 0.608R 2 = 0.608R 2 = 0.608R 2 = 0.608R 2 = 0.608R 2 = 0.608R 2 = 0.608R 2 = 0.608R 2 = 0.608R 2 = 0.608R 2 = 0.608R 2 = 0.608R 2 = 0.608R 2 = 0.608R 2 = 0.608R 2 = 0.608R 2 = 0.608R 2 = 0.608R 2 = 0.608R 2 = 0.608R 2 = 0.608R 2 = 0.608R 2 = 0.608R 2 = 0.608R 2 = 0.608R 2 = 0.608R 2 = 0.608R 2 = 0.608R 2 = 0.608R 2 = 0.608R 2 = 0.608
0.2
0.4
0.6
0.8
1.0
20
30
40
0 5 10 15 20 25
Pla
nt
weig
ht
Pla
ntdia
mete
r
UAV-measured diameter (cm) UAV-measured diameter (cm)
UAV-measured head weight (kg)
(cm)
UAV-measured plant weight (kg)
(cm)
Potential applications of Unmanned Aerial Vehicles multispectral imagery in Queensland vegetables, Departmentof Agriculture and Fisheries, 2016 7
plants and soil based on differences in NDVI values and assigns a count based on the number of
changes in these values. A comparison of plant counts done manually in the field and through
classification of the NDVI imagery is presented in Table 4. This could be valuable for a range of crops
where each plant represents one potential harvested unit.
Image 6 Process to Extract Plant Count on corn
Table 4 Comparison of actual field plant counts and NDVI classification counts
Sample
number
Weight of cobs
(4 metres of row)
Number of
plants/metre measured
NDVI classified
plants/metre
1
2
3
4
5
6
7
8
3.91
4.09
1.67
2.68
3.72
3.49
4.08
2.60
4.5
5.5
5.3
3.5
3.5
5
5
2.8
4.6
3.7
5
4.8
3.6
3.8
3.4
2.6
Mean 3.65 4.4 4
Notes:Both manual counts and NDVI counts were randomly selected across the paddock and not from the samelocation.
The automated count for corn was 10% less than the manual count. The main issue associated with
this process was flight timing, as in the NDVI image most of the corn was touching and made auto
counting difficult. With more development these algorithms can be refined and improved.
Use of different indices
Using a sophisticated multispectral camera for this research allowed for the comparison of a number
of vegetation indices that can be derived from the reflectance bands it uses. Typically, NDVI is
significantly influenced by shadows and clouds (Laliberte et al. 2011). This also means that there are
limited windows for capturing imagery each day. Best results are in the middle of the day as
shadowing of adjacent plant rows can occur early and late in the day. Also as the crop matures and
canopy cover increases to 80-90% of the field area, NDVI values plateau and differences in crop
Multispectral Imagery
CaptureConversion to
NDVI for
extraction
Plant Classification and
Extraction
Potential applications of Unmanned Aerial Vehicles multispectral imagery in Queensland vegetables, Departmentof Agriculture and Fisheries, 2016 8
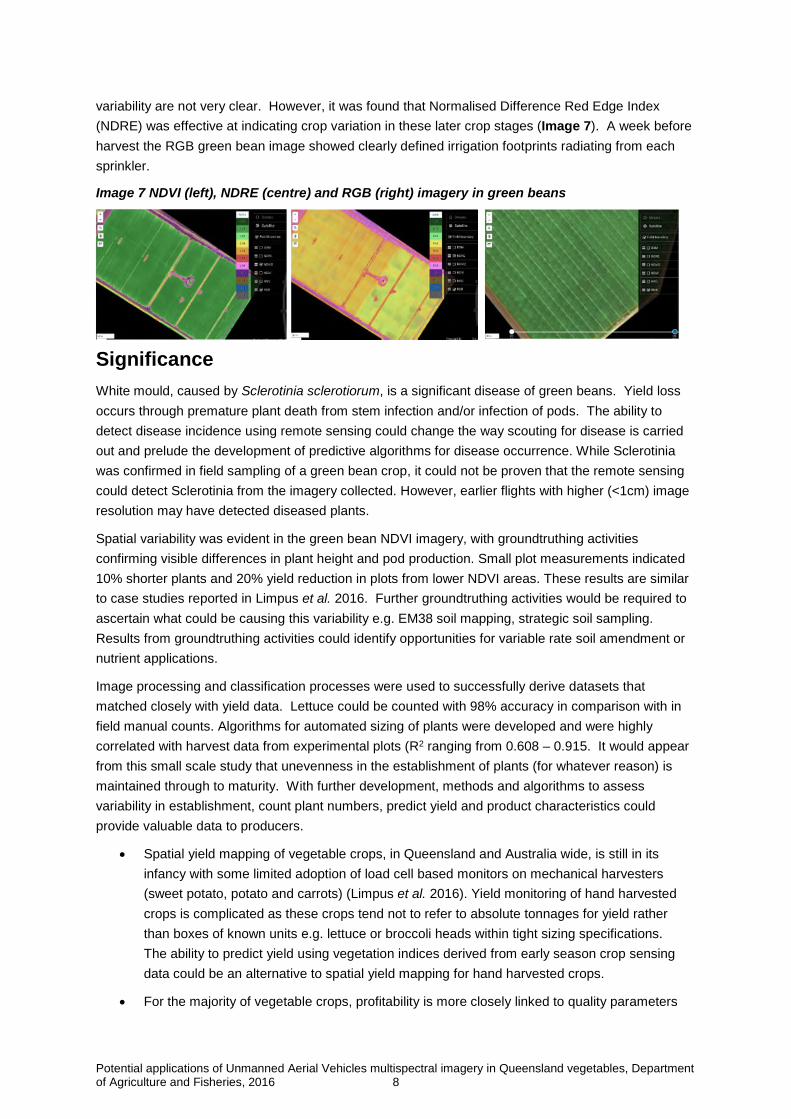
variability are not very clear. However, it was found that Normalised Difference Red Edge Index
(NDRE) was effective at indicating crop variation in these later crop stages (Image 7). A week before
harvest the RGB green bean image showed clearly defined irrigation footprints radiating from each
sprinkler.
Image 7 NDVI (left), NDRE (centre) and RGB (right) imagery in green beans
Significance
White mould, caused by Sclerotinia sclerotiorum, is a significant disease of green beans. Yield loss
occurs through premature plant death from stem infection and/or infection of pods. The ability to
detect disease incidence using remote sensing could change the way scouting for disease is carried
out and prelude the development of predictive algorithms for disease occurrence. While Sclerotinia
was confirmed in field sampling of a green bean crop, it could not be proven that the remote sensing
could detect Sclerotinia from the imagery collected. However, earlier flights with higher (<1cm) image
resolution may have detected diseased plants.
Spatial variability was evident in the green bean NDVI imagery, with groundtruthing activities
confirming visible differences in plant height and pod production. Small plot measurements indicated
10% shorter plants and 20% yield reduction in plots from lower NDVI areas. These results are similar
to case studies reported in Limpus et al. 2016. Further groundtruthing activities would be required to
ascertain what could be causing this variability e.g. EM38 soil mapping, strategic soil sampling.
Results from groundtruthing activities could identify opportunities for variable rate soil amendment or
nutrient applications.
Image processing and classification processes were used to successfully derive datasets that
matched closely with yield data. Lettuce could be counted with 98% accuracy in comparison with in
field manual counts. Algorithms for automated sizing of plants were developed and were highly
correlated with harvest data from experimental plots (R2 ranging from 0.608 – 0.915. It would appear
from this small scale study that unevenness in the establishment of plants (for whatever reason) is
maintained through to maturity. With further development, methods and algorithms to assess
variability in establishment, count plant numbers, predict yield and product characteristics could
provide valuable data to producers.
• Spatial yield mapping of vegetable crops, in Queensland and Australia wide, is still in its
infancy with some limited adoption of load cell based monitors on mechanical harvesters
(sweet potato, potato and carrots) (Limpus et al. 2016). Yield monitoring of hand harvested
crops is complicated as these crops tend not to refer to absolute tonnages for yield rather
than boxes of known units e.g. lettuce or broccoli heads within tight sizing specifications.
The ability to predict yield using vegetation indices derived from early season crop sensing
data could be an alternative to spatial yield mapping for hand harvested crops.
• For the majority of vegetable crops, profitability is more closely linked to quality parameters
Potential applications of Unmanned Aerial Vehicles multispectral imagery in Queensland vegetables, Departmentof Agriculture and Fisheries, 2016 9
(market specifications) rather than absolute product tonnages. The ability to assess potential
variability in these parameters prior to harvest could be used to inform packing shed
requirements and marketing decisions. This could also provide a mechanism for assessing
potential product quality spatially
• The bulk of vegetable crops are still reliant on hand harvesting. As labour is the highest cost
in horticultural production, representing up to 27% of costs depending on the crop type, any
efficiencies in the use of this labour is desirable. Understanding the extent of field variability
in maturity could inform harvest decisions for more efficient use of labour.
Flight timing and height is crucial for appropriate imagery and data collection. For lettuce and corn,
classification (counting and/or sizing) was possible and accurate for the crop stages assessed. It was
expected that where plants were physically touching, automated counts and sizing using the tools
developed was difficult and prone to undercounting and oversizing plants. However, methods to
reduce errors were developed to limit these issues. Timing of UAV flights at the correct crop
development stage is critical for accurate crop counting and sizing and further development would
continue to improve count accuracy, particularly in corn.
At lower flying heights there is a trade-off between resolution and the area captured or flying time as
travel speed needs to be reduce to compensate for being closer to the ground and the requirement for
more frequent image captures. For example for the bean field, at 100 metres AGL, the UAV travelled
at 12 metres/second, capturing an image every 1.5 seconds and taking 30 seconds to map 1 hectare.
In contrast, at 20 metres AGL, the aircraft travels at 7 metres/second, capturing an image every 0.5
second (limit of existing cameras) and takes 4 minutes to map 1 hectare.
The multispectral camera employed for this work generated several vegetation indices. NDVI was the
most appropriate during the early to mid-growth stage of the crop. In later crop stages NDRE is an
option for assessing crop biomass, where NDVI values have plateaued due to saturation of the index,
and no longer depicts spatial variability clearly. Though NDVI and other vegetation indices can
demark variability by capturing areas of low and high plant vigour, they do not provide any information
on the underlying cause of any identified variation. In-crop groundtruthing is the only way of
discerning or eliminating potential causes of variation in crop growth and these activities can be time
consuming and costly.
Key Messages
• UAV captured NDVI data successfully identified spatial variability in green beans.
• While scattered Sclerotinia was detected in the crop, these plants were not evident at the
resolution the imagery was initially carried out at. It is possible that infected plants would be
evident at a higher resolution (or lower flying height).
• The small scale assessments here confirm variability in maturity early season is maintained
through to maturity.
• In addition to identifying spatial variability for the purpose of improving uniformity using UAV
imagery, there is potential to develop predictive tools to inform harvest and marketing of
horticultural crops. This study suggests that classification and sizing algorithms could be
developed from vegetation indices data to predict yield for vegetable crops such as lettuce
and sweet corn.
Potential applications of Unmanned Aerial Vehicles multispectral imagery in Queensland vegetables, Departmentof Agriculture and Fisheries, 2016 10
• Flight timing and height are crucial to obtain valuable imagery for accurate classification and
analytics.
• While NDVI is the most commonly used vegetative index, others can also provide valuable
information in different crops and at different crop stages.
• Field sampling to groundtruth NDVI or other vegetative index imagery is critical. Though UAV
imagery will indicate and calculate the areas of crop variability within a field, some level of
crop and/or field inspection will be required to identify or confirm the cause.
Where to next
• Expanding on the results presented in this report would include higher resolution imagery
specifically targeting disease detection at an individual plant level.
• NDVI and other vegetation indices were used to calculate and clearly delineate crop
variability across paddocks. This information can be readily supplied to variable rate
technologies, which could support reducing inputs (nutrient or chemical) and provide farm
businesses with significant cost savings or increased profitability from improved uniformity
into the future.
• The development of algorithms and tools for early season counts and assessment of
vegetable crop characteristics requires further refining and validation. This work involved only
small scale assessments and the biometric capacity developed through this project could be
significantly expanded. Development and testing of accurate algorithms and tools for different
crops and crop stages would require significantly larger data sets and resourcing.
• The optimum flight parameters to reduce UAV flight times and costs and still gain effective
accurate counts also needs further assessment.
Budget Summary
The budget for this work was initially requested for field sampling assistance to groundtruth disease in
crop. However, as the contribution of UAV services by Boeing ceased, the budget had to be
reallocated to purchase UAV imagery. The full amount of $6000.00 was expended in the purchase of
UAV imagery, processing and analysis. Groundtruthing activities were completed by the project
leader with assistance from John Duff, Senior Plant Protectionist.
Airborn Insight staff provided significant in-kind contribution ($6,000) for the counting and sizing
classification algorithm development.
References
De Benedetto, D., Gastrignano, A., Diacono, M., Rinald, M., Rugglieri, S. and Tamborrino, R. (2013.
Field partition by proximal and remote sensing data fusion, Biosystems Engineering 114(4):372-383
Hatfield, P.L. and Pinter Jr, P.J. (1993). Remote sensing for crop Protection, Crop Protection 12
(6):403-413
Laliberte, A., Goforth, M., Steele, C., 1 and Rang A. (2011). Multispectral Remote Sensing from
Unmanned Aircraft: Image Processing Workflows and Applications for Rangeland Environments.
Remote Sensing 3, 2529-2551
Potential applications of Unmanned Aerial Vehicles multispectral imagery in Queensland vegetables, Departmentof Agriculture and Fisheries, 2016 11
Limpus, S., O’Halloran, J. and Layden, I. (2016). Adoption of variable rate technology in Queensland’s
intensive vegetable production systems. Final Report for GMX- INNOV-312 June 2016 Australian
Department of Agriculture
Schoefield, B. McMurray, L., Walela, C., Kimber, R., Brunton, D. and Ophel Keller, K. (2016). The
potential of unmanned aerial vehicles and field robotics for capturing key agronomic characteristics in
the field <https://grdc.com.au/Research-and-Development/GRDC-Update-Papers/2016/02/The-
potential-of-unmanned-aerial-vehicles-and-field-robotics-in-the-field> Accessed 21/7/2016.
Seelan, S.K., Laguelle, S., Casady, G.M. and Seielstad, G.A. (2003). Remote sensing applications for
precision agriculture: A learning community approach, Remote Sensing of Environment 88(1-2):157-
169
Yang, C., Liu, T. and Everitt, J.H (2008). Estimating cabbage physical parameters using remote
sensing technology, Crop Protection 27 25-35
Acknowledgements
This work would not have been possible without the co-operation of Rugby Farms, Gatton and the
significant contribution by Airborn Insight towards classification and analysis.
Potential applications of Unmanned Aerial Vehicles multispectral imagery in Queensland vegetables, Departmentof Agriculture and Fisheries, 2016 12
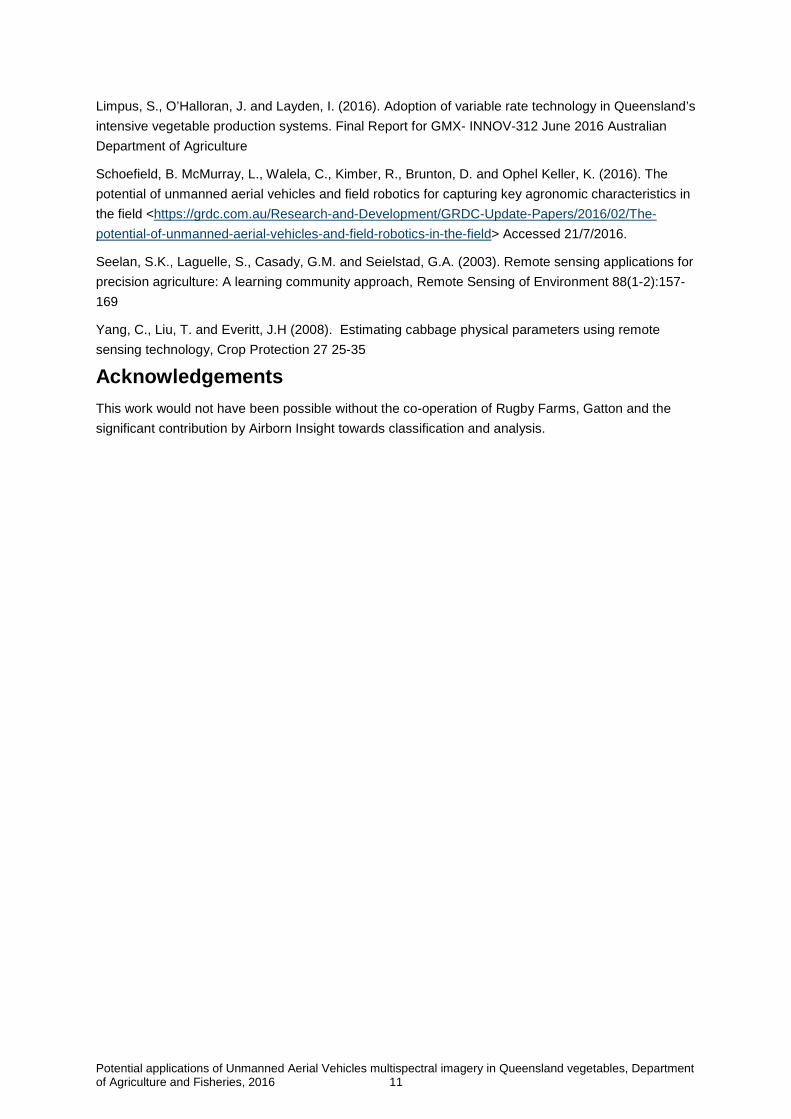
Appendix 1 Quantification of field area characterised by lowerand higher NDVI values as an indicator of plant vigour.
Total Paddock Area Lower NDVI Area Higher NDVI Area
6.7 ha 1.8 ha 4.9 ha
Potential applications of Unmanned Aerial Vehicles multispectral imagery in Queensland vegetables, Departmentof Agriculture and Fisheries, 2016 13
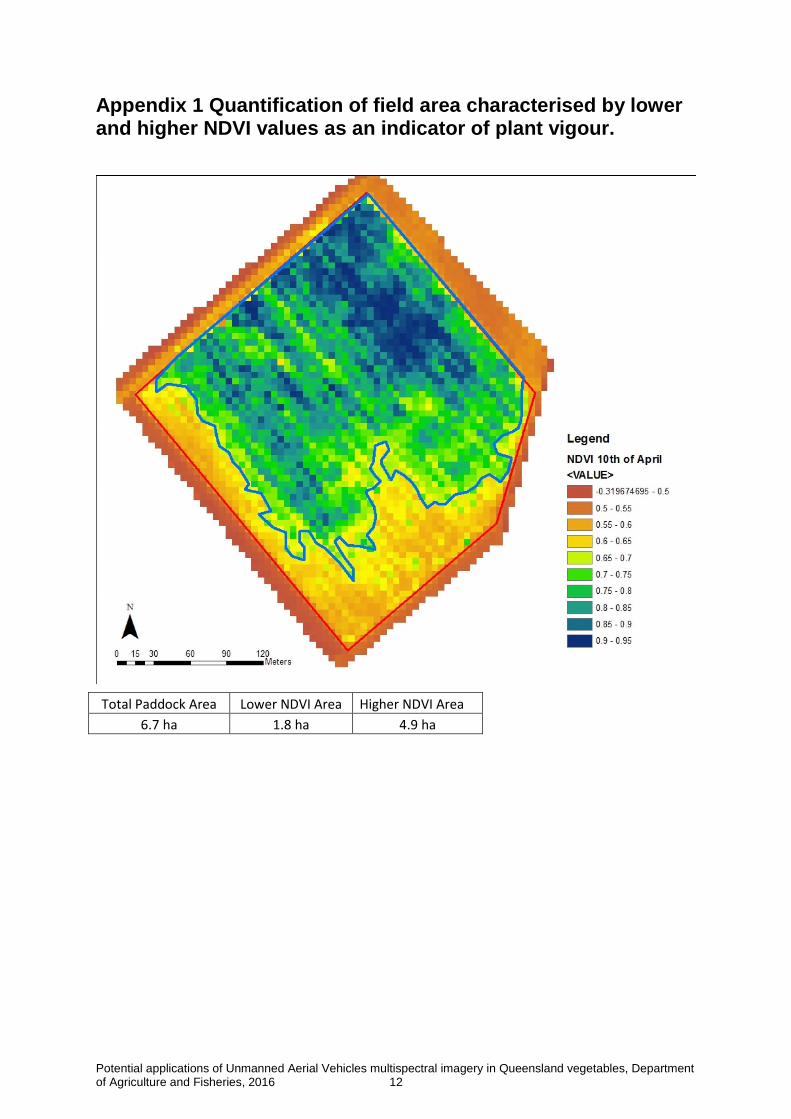
Appendix 2 Lettuce measured parameters and UAV derivedparameters
PlotPlant diameter(cm) 26/4/16
Plant diameter(cm)13/5/16
Head diameter(cm) 13/5/16
Plant weight(kg) 13/5/16
Head weight(kg) 13/5/16
Row(north orsouth)
UAV-headDiameter(cm)
1 22 41 16 0.87 0.56 N 20.5
1 28 36 16 0.94 0.67 N 23.2
1 23 36 15 0.58 0.44 N 17.1
1 31 39 16 0.89 0.63 N 21.0
1 25 32 17 0.89 0.62 N 19.6
1 28 39 18 0.87 0.64 N 20.6
1 15 34 5 0.36 0.3 N 10.2
1 25 41 17 0.86 0.62 S 20.0
1 27 36 16 0.82 0.62 S 22.3
1 28 43 17 0.8 0.59 S 22.0
1 23 37 14 0.81 0.63 S 21.5
1 26 44 17 0.99 0.69 S 22.0
1 21 31 14 0.37 0.28 S 13.5
1 28 46 17 0.98 0.78 S 21.9
2 15 30 13 0.24 0.18 N 9.2
2 19 45 11 0.5 0.33 N 12.9
2 12 18 0 0.05 0 N 0.0
2 22 36 14 0.53 0.35 N 15.2
2 22 37 14 0.45 0.29 N 12.8
2 24 37 16 0.52 0.38 N 17.2
2 23 36 13 0.47 0.37 N 19.0
2 26 38 16 0.75 0.59 S 19.1
2 27 40 15 0.83 0.68 S 20.0
2 26 38 16 0.82 0.63 S 22.7
2 24 37 15 0.58 0.47 S 14.9
2 24 38 14 0.62 0.5 S 15.3
2 27 38 16 0.78 0.53 S 20.8
2 26 39 17 0.66 0.53 S 20.0
3 17 36 14 0.38 0.33 N 12.3
3 12 30 5 0.18 0.12 N 4.3
3 18 35 8 0.32 0.28 N 9.1
3 21 36 9 0.44 0.32 N 13.4
3 19 36 11 0.36 0.23 N 10.1
3 20 34 12 0.36 0.25 N 12.9
3 27 34 15 0.7 0.5 N 19.1
3 28 41 16 0.92 0.67 S 19.5
3 30 36 15 0.83 0.63 S 23.6
3 29 37 17 0.78 0.6 S 19.3
3 32 42 17 0.97 0.7 S 20.5
3 31 38 16 0.86 0.69 S 17.4
3 26 35 16 0.71 0.55 S 23.9
3 28 36 16 0.8 0.6 S 24.0
4 28 43 15 0.91 0.69 N 22.3
4 28 43 17 0.81 0.61 N 19.9
4 25 36 16 0.56 0.41 N 18.5
4 24 39 17 0.83 0.61 N 19.7
4 22 34 16 0.51 0.37 N 13.9
4 24 38 13 0.55 0.41 N 15.0
4 23 43 14 0.67 0.41 S 17.9
4 16 34 9 0.36 0.28 S 10.5
4 11 32 5 0.16 0.1 S 4.3
4 21 44 13 0.53 0.36 S 14.5
4 26 42 13 0.66 0.47 S 16.2
Potential applications of Unmanned Aerial Vehicles multispectral imagery in Queensland vegetables, Departmentof Agriculture and Fisheries, 2016 14
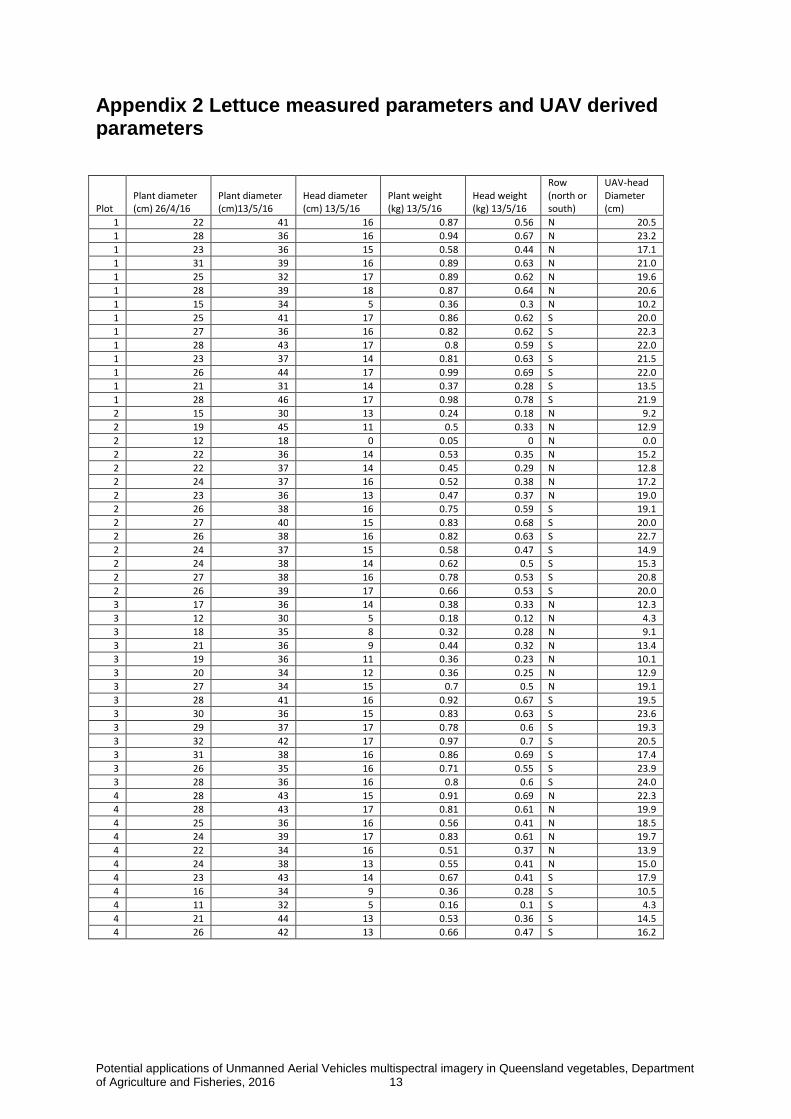
Appendix 3 Lettuce automated counting
Manual plant count Automated plant count Difference between counts
38,520 37,879 3,852 (1.7%)
Notes:Image captured 4 weeks after transplant. Lettuce harvested 8 weeks after transplant.