Unmanned Aerial Vehicles and their Applications in ...
49
Unmanned Aerial Vehicles and their Applications in Exploration and Mining Peter Dueck Thomas Stanley-Jones www.airesources.ca SEG – Drones Applied to Geophysical Mapping September 2017
Transcript of Unmanned Aerial Vehicles and their Applications in ...

Unmanned Aerial Vehicles and their Applications in
Exploration and Mining
Peter Dueck
Thomas Stanley-Joneswww.airesources.ca
SEG – Drones Applied to Geophysical Mapping
September 2017

Who We Are
AERIAL IMAGING RESOURCES l 2
Thomas Stanley-Jones Peter Dueck
• Commercial pilot
• Geographic Information
System specialist
• Professional Geophysicist
• Extensive exploration
experience

Unmanned Aerial Vehicles
AERIAL IMAGING RESOURCES l 3
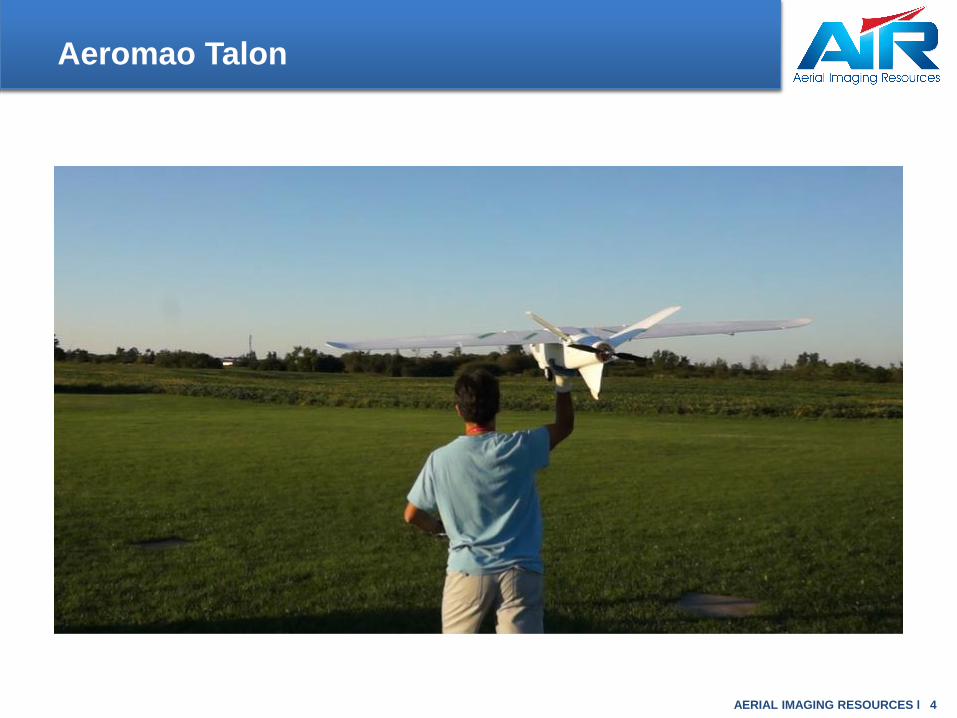
Aeromao Talon
AERIAL IMAGING RESOURCES l 4
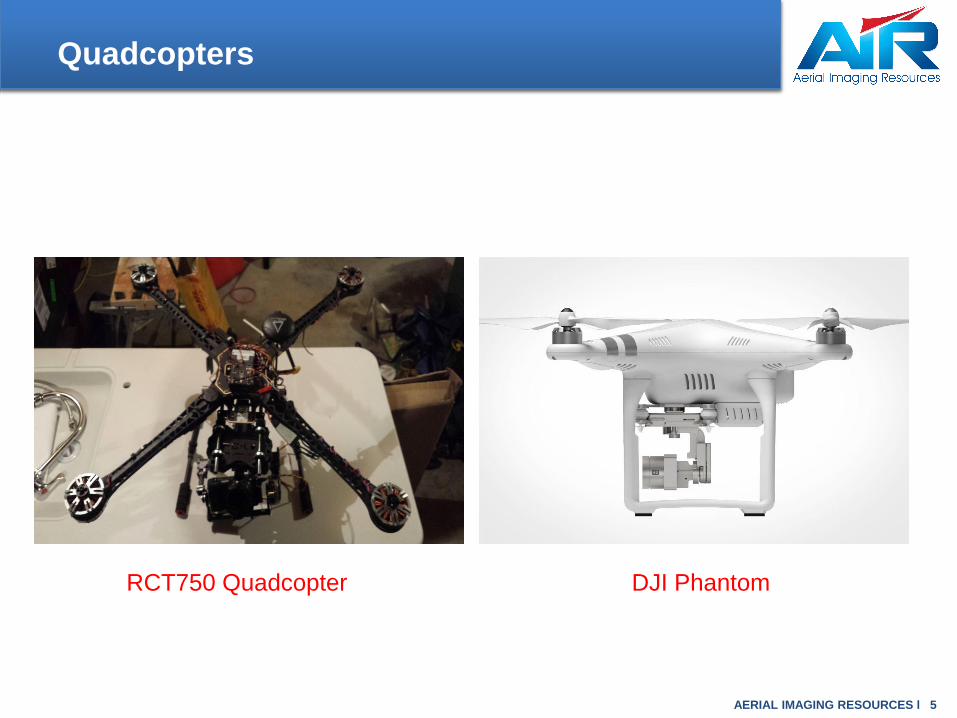
Quadcopters
AERIAL IMAGING RESOURCES l 5
RCT750 Quadcopter DJI Phantom
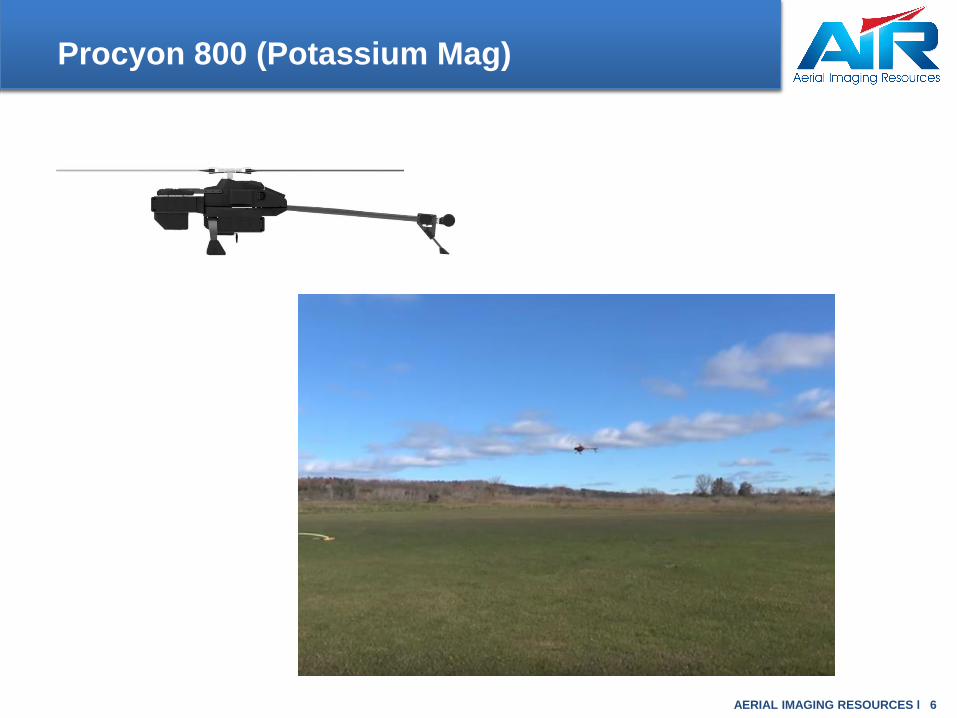
Procyon 800 (Potassium Mag)
AERIAL IMAGING RESOURCES l 6

Airborne Magnetic Platforms
AERIAL IMAGING RESOURCES l 7
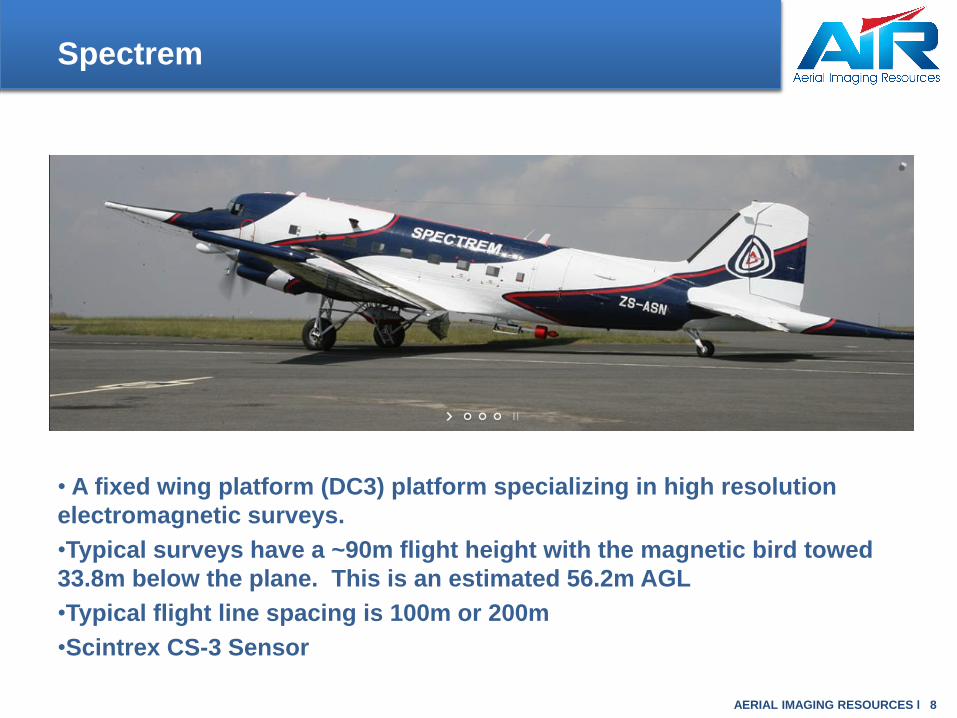
Spectrem
• A fixed wing platform (DC3) platform specializing in high resolution
electromagnetic surveys.
•Typical surveys have a ~90m flight height with the magnetic bird towed
33.8m below the plane. This is an estimated 56.2m AGL
•Typical flight line spacing is 100m or 200m
•Scintrex CS-3 Sensor
AERIAL IMAGING RESOURCES l 8

VTEM
•A helicopter platform platform
specializing in high resolution
electromagnetic surveys.
•Mean altitude have a ~80m flight
height with the magnetic bird towed
an estimated 56m AGL
•Typical flight line spacing is 100m
•Geometrics Cesium Magnetometer
used
AERIAL IMAGING RESOURCES l 9

Quad/Skidoo Magnetics
•Typical line spacing is 25m to 100m (on lakes only)
•Magnetometer towed directly on ground with a non-magnetic sleigh
• GEMS GSMP Potassium Magnetometer
AERIAL IMAGING RESOURCES l 10

AIRMag System
• Mean altitude was approximately
30-50m AGL typically due to tree
cover.
•The AIRMag bird is towed 15m
vertically below the AUV. Testing
has shown that a tether less than
~10-12m see’s induced noise from
the UAV itself.
•This means that a mean bird height
of 27m was achieved throughout
the grid
•Typical flight line spacing is 25m
•GEMS potassium magnetometer
usedAERIAL IMAGING RESOURCES l 11
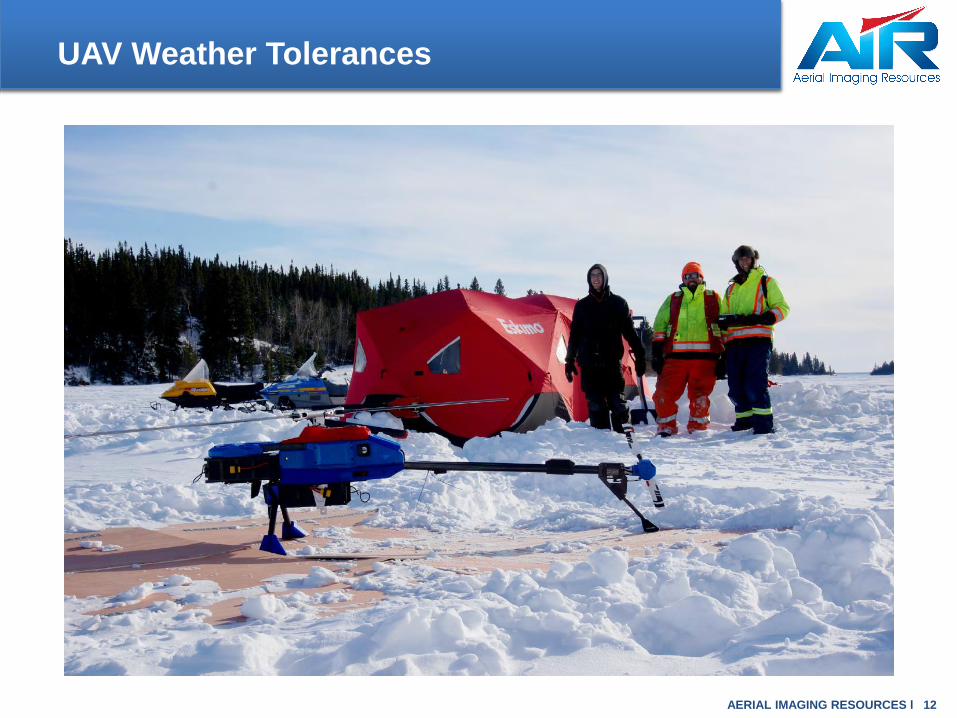
UAV Weather Tolerances
AERIAL IMAGING RESOURCES l 12

High Resolution Advantages
AERIAL IMAGING RESOURCES l 13

Magnetic Forward Modeling
AERIAL IMAGING RESOURCES l 14
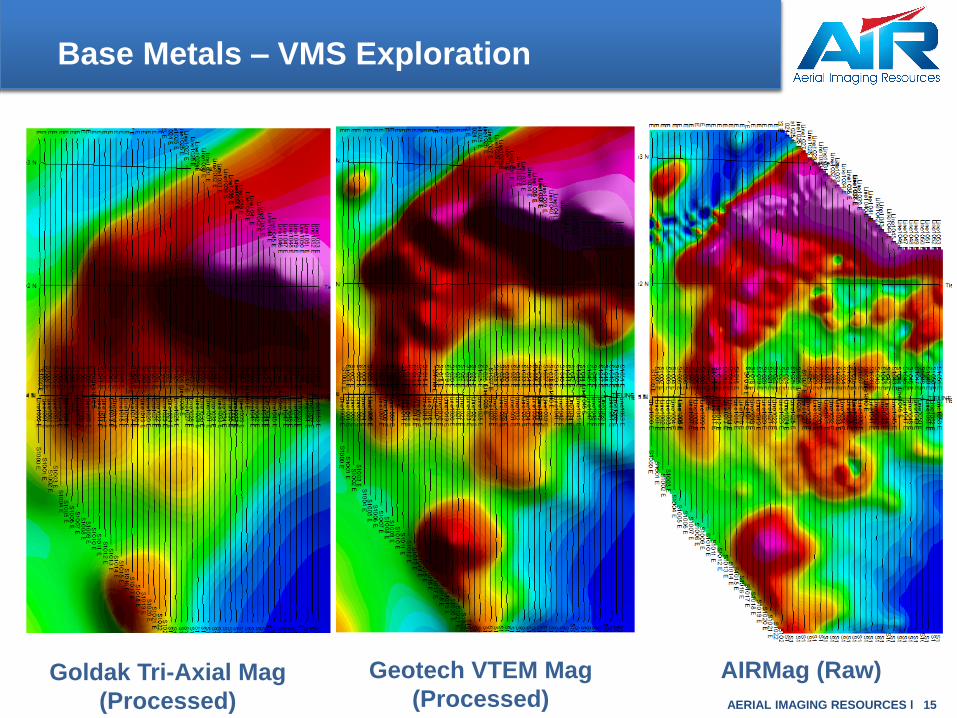
Base Metals – VMS Exploration
AERIAL IMAGING RESOURCES l 15
Goldak Tri-Axial Mag
(Processed)
Geotech VTEM Mag
(Processed)
AIRMag (Raw)
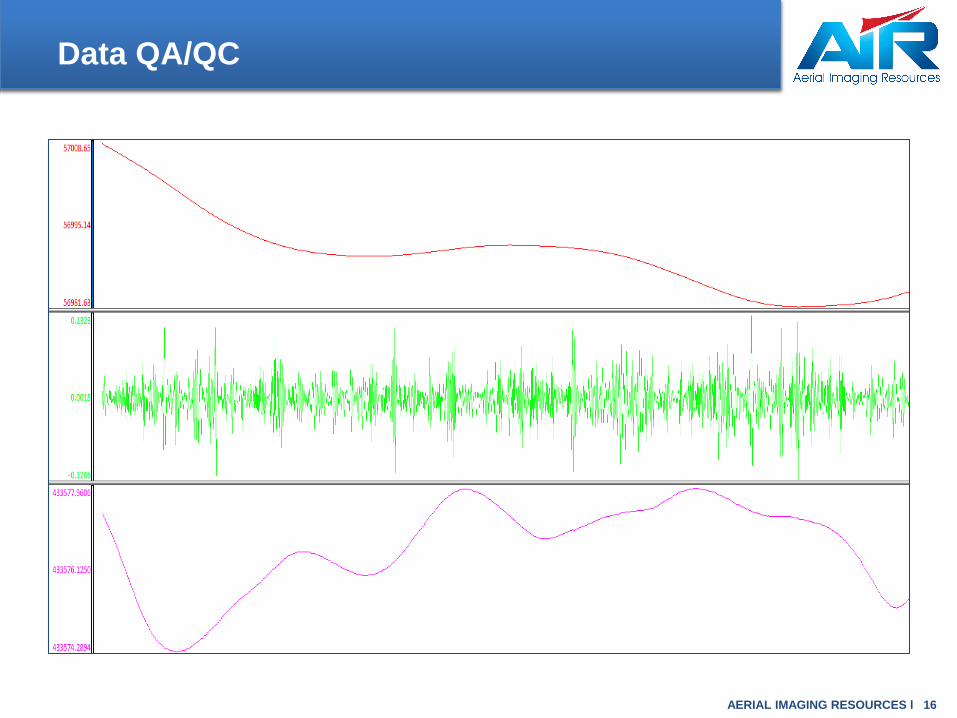
Data QA/QC
AERIAL IMAGING RESOURCES l 16

Government of Canada (Mag-EM, 1988, 300m)
AERIAL IMAGING RESOURCES l 17
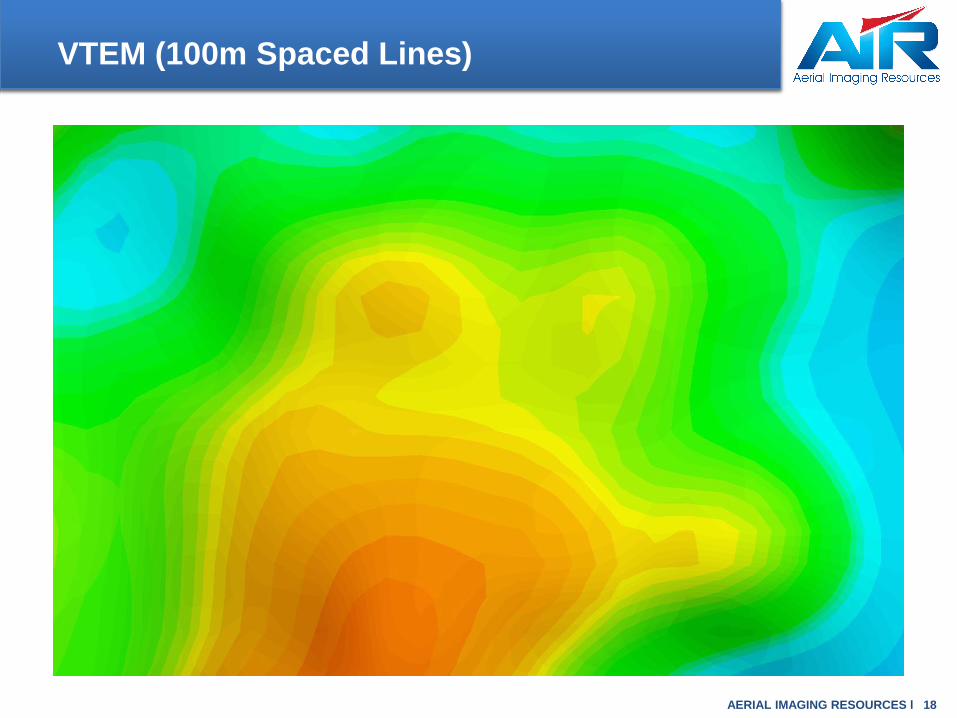
VTEM (100m Spaced Lines)
AERIAL IMAGING RESOURCES l 18
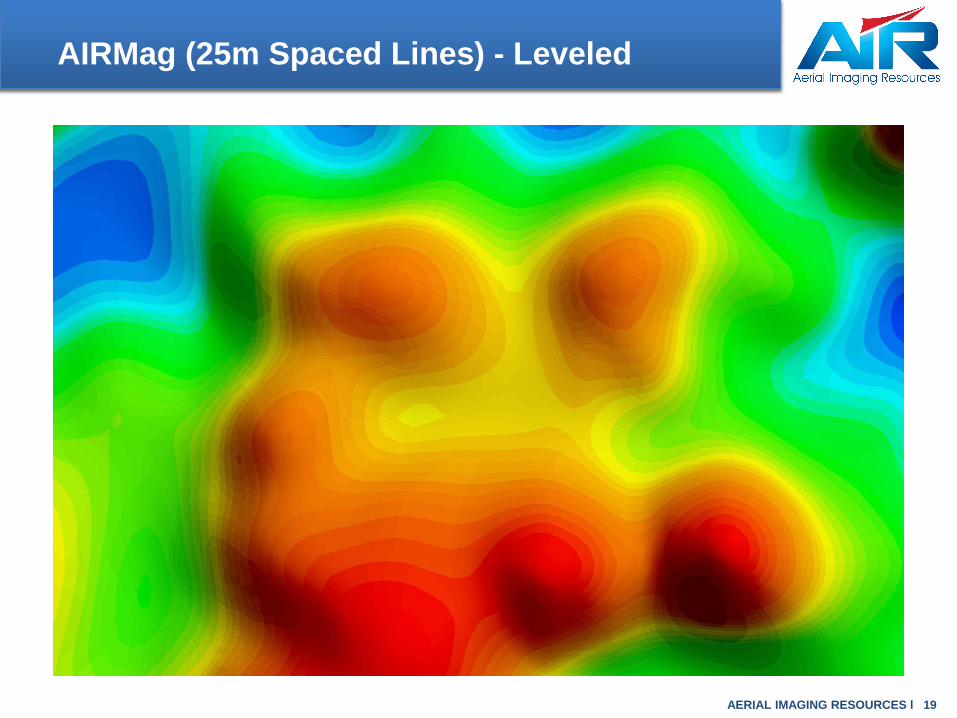
AIRMag (25m Spaced Lines) - Leveled
AERIAL IMAGING RESOURCES l 19

AIRMag (25m Spaced Lines) – Structurally Enhanced
AERIAL IMAGING RESOURCES l 20
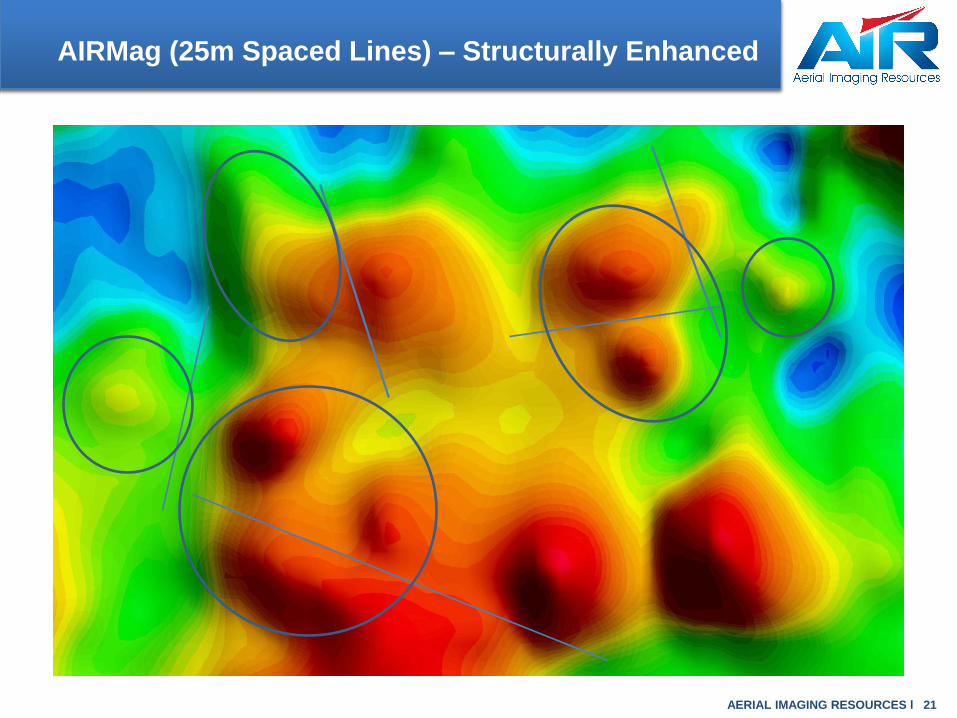
AIRMag (25m Spaced Lines) – Structurally Enhanced
AERIAL IMAGING RESOURCES l 21

Case Studies
AERIAL IMAGING RESOURCES l 22

Laguna Property – Snow Lake, Manitoba
• The blue lines represent 25m
spaced lines, while the yellow lines
show the areas collected at 50m
spaced lines
•The area required multiple staging
areas to complete the survey within
the restrictions of Transport Canada
•A variety of boat, quad, skidoo and
helicopter access was required to
complete the survey block in its
entirety
• The survey area is approximately
9km x 6km
•The survey was a total of 1161 line-
km’sAERIAL IMAGING RESOURCES l 23

Reduced to Magnetic Pole
• Data collection with an azimuth of
120 degrees, roughly perpendicular
to the regional geological strike
• The average flight speed of the
UAV was 10m/s to 15m/s dependent
on wind speed and turbulence
• With a 10 Hz sampling rate
resulting in a sample record every
0.5 m to 1.5m
AERIAL IMAGING RESOURCES l 24

Laguna Interpretation
• Mapped veins are approximately
coincident with and parallel to the
gradient between relatively low and high
magnetic amplitudes
• Magnetic data processed to enhance
short-wavelength features highlight
asymmetric folds with NNE-trending
axial traces. Fold domains bound by NE-
trending dextral shears (schist zones?)
• The NNE-trending vein segments are
axial planar to an interpreted fold
closure. Due to overprinting this fold
may be F2a or F3
• The aeromagnetic data nicely
demonstrates the interference between
a NE-trending fold F2a fold structure
and ~N-S trending F3 asymmetric folds
AERIAL IMAGING RESOURCES l 25

Laguna Veins
The Laguna Vein area is located in the northern section of the claim
block. The Laguna vein is traceable at surface for approximately 500m
and historic records and recent sampling surveys have shown significant
assay results AERIAL IMAGING RESOURCES l 26

Laguna Veins (Spectrem background)

Spectrem Data - Zoomed

AIRMag Raw Data - Zoomed

Kiski Vein
The Kiski Vein area comprises an area of known mineralization within a
quartz vein system where historic records have shown 3-4 known
mineralized veins with significant assay results returned from grab
samples AERIAL IMAGING RESOURCES l 30

Kiski Vein – Analytic Signal
•Notice how one of the Kiski
Veins appears to closely follow
a magnetic gradient.
• Highlighted in blue is a
continuation of this magnetic
gradient which is in interpreted
to be mapping a fault or shear
zone.
•This may indicate the
orientation of an extension of
the Kiski Vein.
AERIAL IMAGING RESOURCES l 31
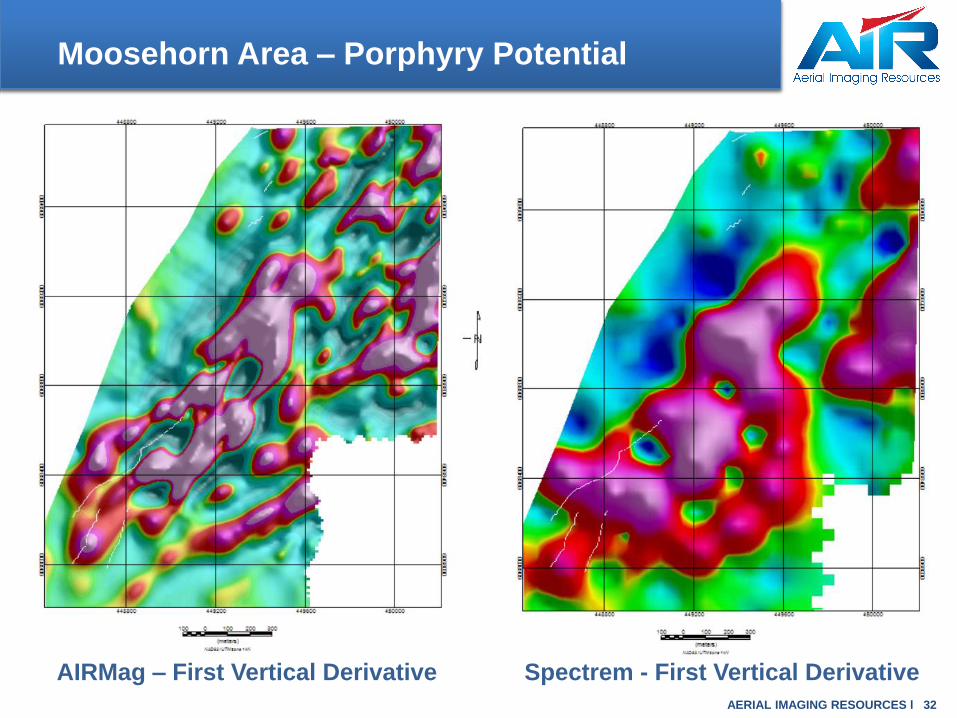
Moosehorn Area – Porphyry Potential
AERIAL IMAGING RESOURCES l 32
AIRMag – First Vertical Derivative Spectrem - First Vertical Derivative
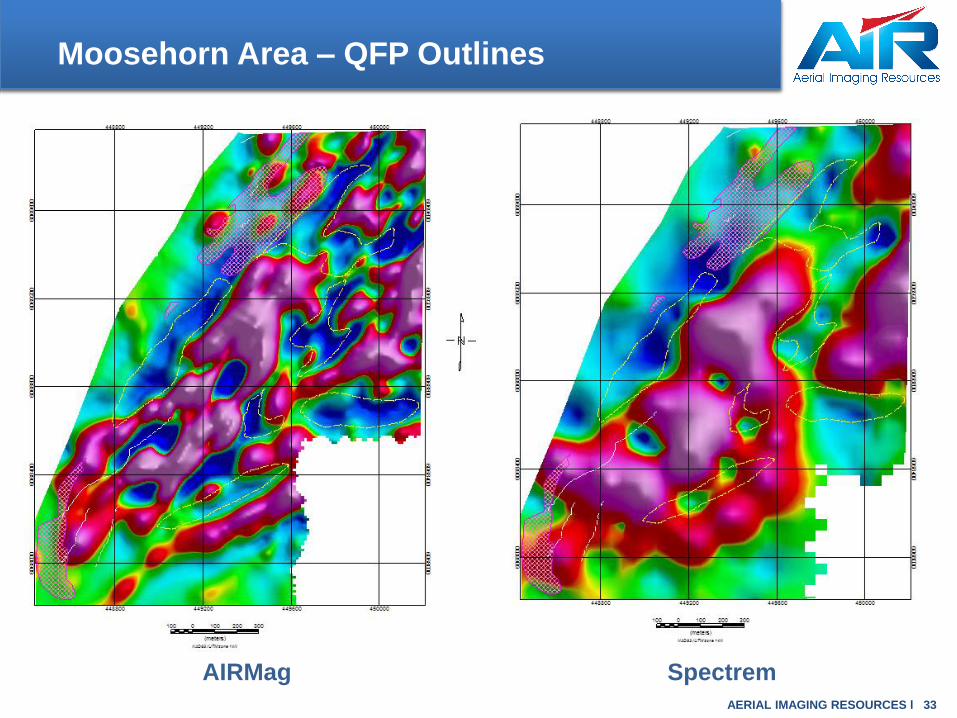
Moosehorn Area – QFP Outlines
AERIAL IMAGING RESOURCES l 33
AIRMag Spectrem

Geological Mapping
AERIAL IMAGING RESOURCES l 34

1:200 3D Geological Trench Mapping
AERIAL IMAGING RESOURCES l 35
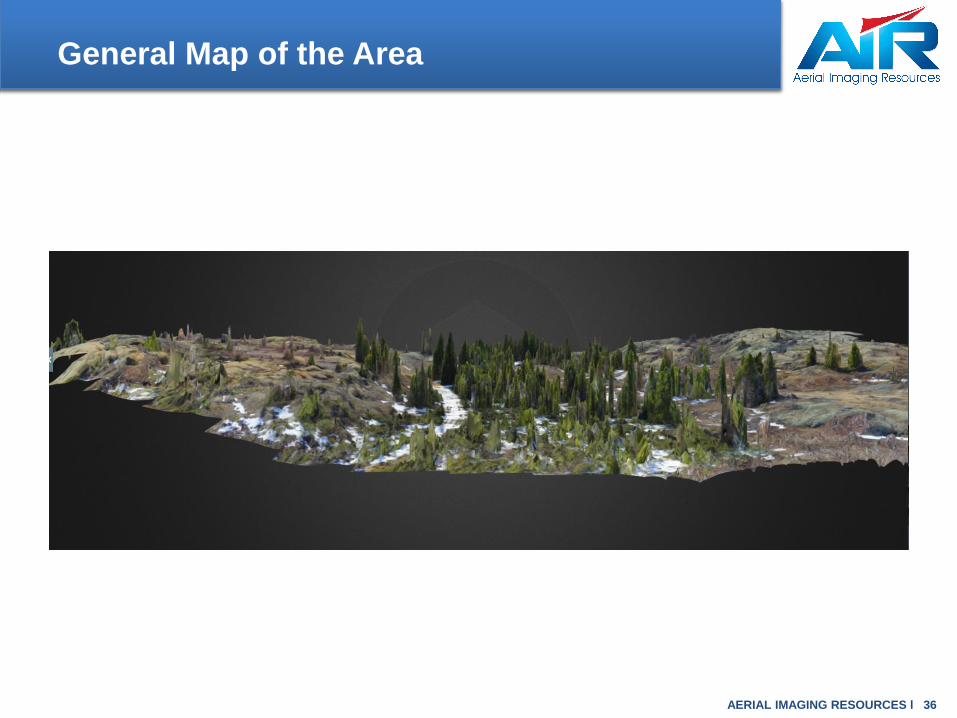
General Map of the Area
AERIAL IMAGING RESOURCES l 36

Easy to See Topography Changes
AERIAL IMAGING RESOURCES l 37

Same Outcrop, Different Perspective
AERIAL IMAGING RESOURCES l 38

Zoom of the Outcrop in 3D
AERIAL IMAGING RESOURCES l 39

Geological 1:500 Mapping Exercise
AERIAL IMAGING RESOURCES l 40

Geological Mapping (con’t)
AERIAL IMAGING RESOURCES l 41

Geological Modeling (con’t)
1: This shear zone is a prominent feature in
the mosaic – other map features here are not.
2: The dyke/rhyolite contact shows up as a
colour/terrain-fabric contrast.
3: The rhyolite/Millrock contact – which I’ve
accentuated with blue dots – is very sharply
defined over a distance of around 50 metres.
4: Here and elsewhere, the locally coarse
character of the Millrock is clearly visible. A
closer look at higher resolution might be
worthwhile.
5: Because of lack of any colour contrast
between the dykes and the hosting basalt
flows in this area, contacts do not show up in
the mosaics – but they may show up in the
higher resolution imagery?
AERIAL IMAGING RESOURCES l 42
Volumetrics Calculations
AERIAL IMAGING RESOURCES l 43
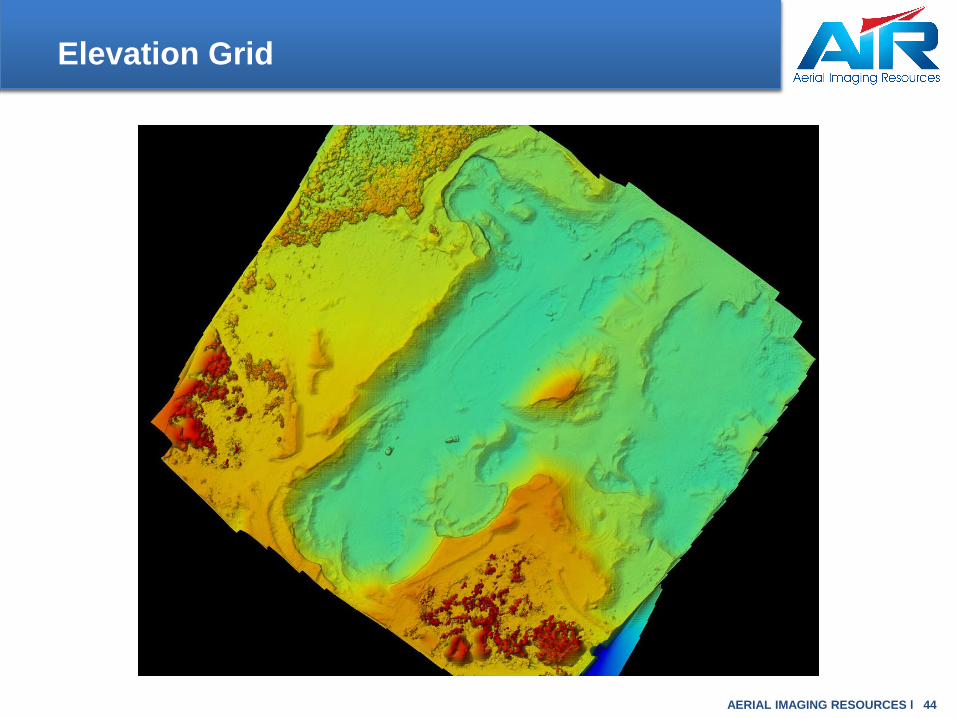
Elevation Grid
AERIAL IMAGING RESOURCES l 44

Cut/Fill – Volumetrics
AERIAL IMAGING RESOURCES l 45

Inspections and Inventory
AERIAL IMAGING RESOURCES l 46

Inspections
AERIAL IMAGING RESOURCES l 47

Thank-You
AERIAL IMAGING RESOURCES l 48
DAPROCK ENTERPRISESAll data contributors for the presentation

AERIAL IMAGING RESOURCES l 49
Questions?