Port Pirie Regional Council Port Pirie Regional Council Business Plan 2017/18 ... (summary) 2017 -...
61
Port Pirie Regional Council Business Plan 2017/18 – 2019/20 Port Pirie Regional Council BUSINESS PLAN 2017/18 – 2019/20 CONSULTATION DRAFT May 2017 Version : 2.4a Page 1
Transcript of Port Pirie Regional Council Port Pirie Regional Council Business Plan 2017/18 ... (summary) 2017 -...

Port Pirie Regional Council Business Plan 2017/18 – 2019/20
Port Pirie Regional Council
BUSINESS PLAN 2017/18 – 2019/20
CONSULTATION DRAFT May 2017 Version : 2.4a
Page 1
Port Pirie Regional Council Business Plan 2017/18 – 2019/20
Contents
Introduction .............................................................................................. 3 Mayor and CEO Message ............................................................................ 4 Overview ................................................................................................... 7 Measuring Our Performance – Success Indicators ..................................... 8 Overview – Strategic Priority Projects ..................................................... 10 Role of the Business Plan ........................................................................ 11 Strategic Architecture ............................................................................. 12 Strategic Architecture – Objectives and Goals ......................................... 13 Alignment with State Government Strategy ............................................ 14 Seven Strategic Priorities ........................................................................ 14 Our Organisation – What We Do .............................................................. 15 Our Organisation – Where We Are ........................................................... 16 Our Organisation – Our Values ................................................................ 17 Our Organisation – Organisational Structure ........................................... 18 Operating Environment ........................................................................... 19 Our Key Actions 2017/18 – 2019/20 ....................................................... 21 Funding the Business Plan ....................................................................... 26 Rates 2017/18………………………………………………..………………………31 Rating Strategy…………………………………..……………….………………….37 Long Term Financial Plan…………………………………….……………….…..39 Attachments: Financial Statements 2017/18 - 2019/20…………………………….….…43 Financial Sustainability Indicators ……………………………………….……48
Rates Policy………………….……………………………………………….………..49 Long Term Financial Plan 2017 - 2027…………………….…….….………..58 Capital Works Program (summary) 2017 - 2027…………….….………..61
Page 2
Port Pirie Regional Council Business Plan 2017/18 – 2019/20
Introduction Purpose The Business Plan links the goals of Council’s Community Plan with the services delivered, activities and projects undertaken by Council. It is a vital tool used for responsible financial management. This Business Plan is a three year plan for 2017/18 to 2019/20. Opportunity to have your Say Port Pirie Regional Council will undertake public consultation on its draft Business Plan 2017/18 – 2019/20 from Wednesday 31 May 2017 to Friday 23 June 2017 A Public Information Forum will be held on Monday 19 June at 6pm in the Council
Chambers, 115 Ellen Street, Port Pirie. There were a number of methods to provide Council with feedback: Online – complete the online feedback form at www.pirie.sa.gov.au/feedback In writing – address submissions to PO Box 45, Port Pirie SA 5540 or fax to 8632 5801, or
deliver in person to the Council Administration Centre, 115 Ellen Street, Port Pirie. All submissions will be considered by Council prior to the adoption of the Plan. About this Plan Section 123 of the Local Government Act 1999 requires Council to prepare a Business Plan and Budget which provides a summary of the long term goals and the activities that Council intends to undertake to achieve them and how these will be funded. It also provides an outline of how Council will measure its performance, taking into account the Long Term Financial Plan and Asset Management Plans. The Act requires the Business Plan to set out proposed operating and capital expenditure, sources of income, the proposed rate structure and the impact of the proposed rate structure on the community.
Page 3

Port Pirie Regional Council Business Plan 2017/18 – 2019/20
Mayor and CEO Message For our organisation and our community, change is no longer a constant, its pace is accelerating. The way we lived ten years ago is very different from today. For example, did you know it is only seven years ago that the first iPod was invented and look at how this technological device and the associated ‘apps’ have changed our lives. We are in an age of rapidly evolving technologies, business models, demographics and even workplace attitudes – all changing at once. These changes will impact not only on Council but also on the lives of current and future members of our communities. Therefore, this year Council has moved from an annual Business Plan to a three year Business Plan to improve the decision making process leading to the best utilisation of our finite resources. This is particularly for the major assets and projects that are implemented over several years. It is recognised that the Business Plan is created now with the best available information at the time the plan is created. However, as we move through the next three years there will be changes that require us to be agile to provide the best opportunities and services to our communities. Therefore, the Business Plan provides the basis on which we can report on the variance and why they have occurred. We will also annually review and update the three year plan to ensure it provides a clear direction for Council and community. Recently we have seen extensive changes occur around our City entrances, the Solomontown boat ramp, our CBD and the Sports Precinct. Nyrstar is undertaking a significant change in the way it operates and Council is looking to further diversify the local economy. We, as a community, are also changing the perceptions of Port Pirie and the broader region though the Come See Change initiative. Therefore, this Business Plan seeks to demonstrate that Council is responsive to the changes in our operating environment and the needs, interests and aspirations of individuals and groups within its community as outlined in the Community Plan and that it demonstrates through the Business Plan that Council resources are used efficiently and effectively. A key focus over the next three years will be to continue the transformation of the region to meet changing community requirements and deliver Council’s vision for the Port Pirie Region to be the premier regional centre in South Australia where residents and visitors want to be. To achieve this Council intends to focus its efforts in the coming years on the following activities:
Complete the Port Pirie Sports Precinct by December 2018 Provide attractive entrance signs to all rural towns Prepare and implement a footpath strategy Implement the key actions from Council’s Economic Development Strategy Complete a Tourism and Events Strategy Continue with the implementation of the Come See Change rebranding of Port Pirie Enhance our measurement system to review and improve our efficiency and delivery of
services to the community This will be done in conjunction with the usual extensive range of services that you have come to expect from Council, such as waste collection, maintained streets and footpaths, library, animal control, parklands and sporting and recreation facilities.
Page 4
Port Pirie Regional Council Business Plan 2017/18 – 2019/20
The future for our region looks promising with Council seeking to implement a number of exciting initiatives to help to transform our region into an attractive and prosperous place to live and visit. We would like to thank the Councillors and employees for their service and input into this plan. Without them, this Business Plan could not be developed and appropriate resources allocated to support its delivery. We encourage you to read the Business Plan and provide us with your thoughts. Community consultation on the Plan will close on 23 June 2017. You are also welcome to attend the Public Information Forum on Monday, 19 June at 6 pm in the Council Chambers, 115 Ellen Street to raise questions and discuss the Business Plan.
John Rohde Mayor
Dr Andrew Johnson Chief Executive Officer
Page 5
Port Pirie Regional Council Business Plan 2017/18 – 2019/20
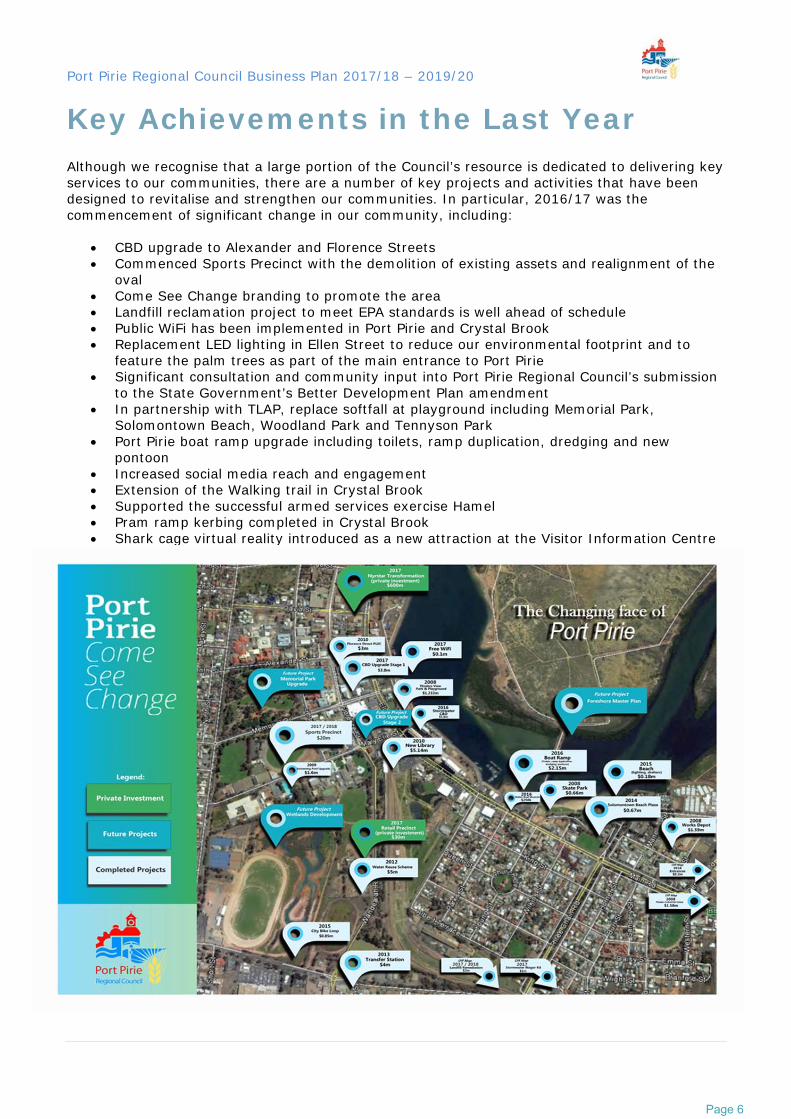
Key Achievements in the Last Year Although we recognise that a large portion of the Council’s resource is dedicated to delivering key services to our communities, there are a number of key projects and activities that have been designed to revitalise and strengthen our communities. In particular, 2016/17 was the commencement of significant change in our community, including:
CBD upgrade to Alexander and Florence Streets Commenced Sports Precinct with the demolition of existing assets and realignment of the
oval Come See Change branding to promote the area Landfill reclamation project to meet EPA standards is well ahead of schedule Public WiFi has been implemented in Port Pirie and Crystal Brook Replacement LED lighting in Ellen Street to reduce our environmental footprint and to
feature the palm trees as part of the main entrance to Port Pirie Significant consultation and community input into Port Pirie Regional Council’s submission
to the State Government’s Better Development Plan amendment In partnership with TLAP, replace softfall at playground including Memorial Park,
Solomontown Beach, Woodland Park and Tennyson Park Port Pirie boat ramp upgrade including toilets, ramp duplication, dredging and new
pontoon Increased social media reach and engagement Extension of the Walking trail in Crystal Brook Supported the successful armed services exercise Hamel Pram ramp kerbing completed in Crystal Brook Shark cage virtual reality introduced as a new attraction at the Visitor Information Centre
Page 6
Port Pirie Regional Council Business Plan 2017/18 – 2019/20
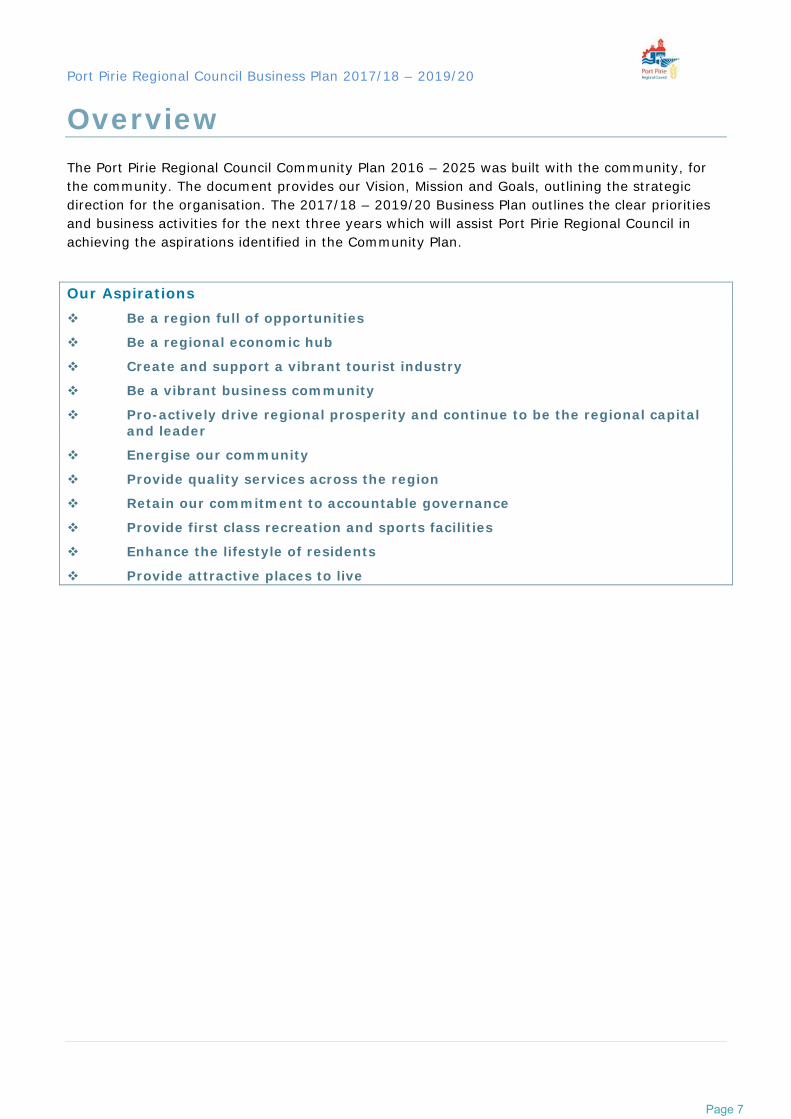
Overview The Port Pirie Regional Council Community Plan 2016 – 2025 was built with the community, for the community. The document provides our Vision, Mission and Goals, outlining the strategic direction for the organisation. The 2017/18 – 2019/20 Business Plan outlines the clear priorities and business activities for the next three years which will assist Port Pirie Regional Council in achieving the aspirations identified in the Community Plan.
Our Aspirations Be a region full of opportunities
Be a regional economic hub
Create and support a vibrant tourist industry
Be a vibrant business community
Pro-actively drive regional prosperity and continue to be the regional capital and leader
Energise our community
Provide quality services across the region
Retain our commitment to accountable governance
Provide first class recreation and sports facilities
Enhance the lifestyle of residents
Provide attractive places to live
Page 7
Port Pirie Regional Council Business Plan 2017/18 – 2019/20
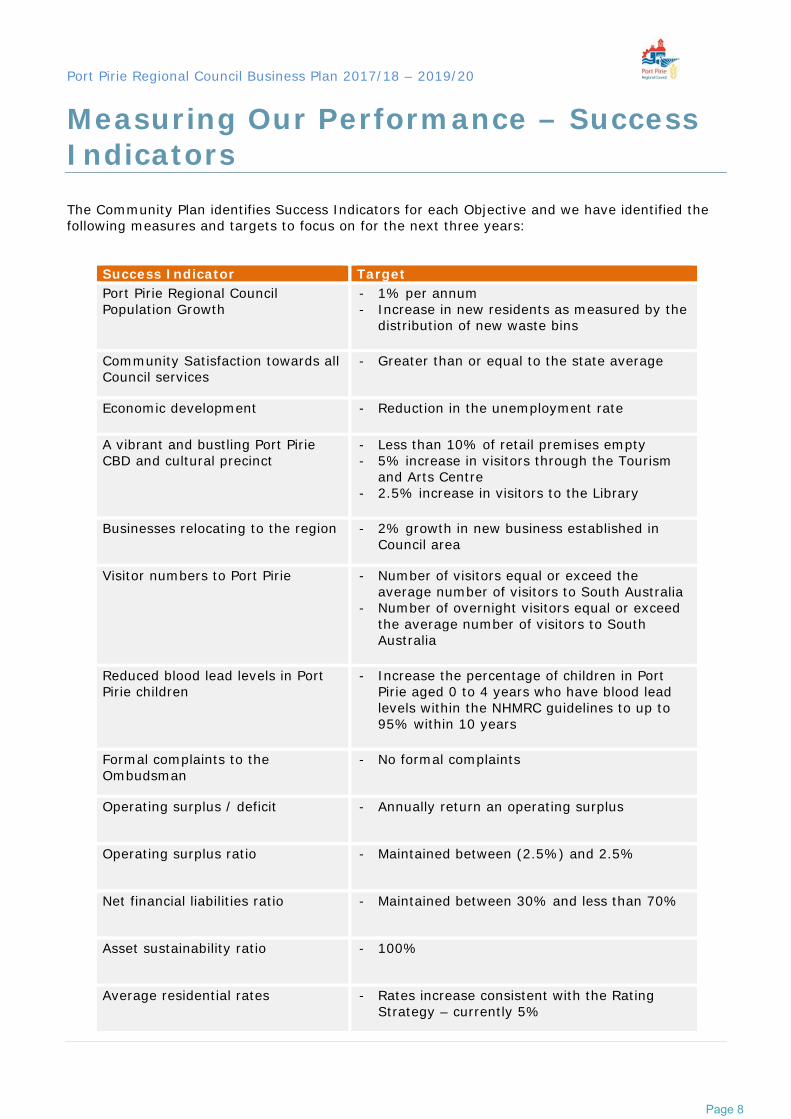
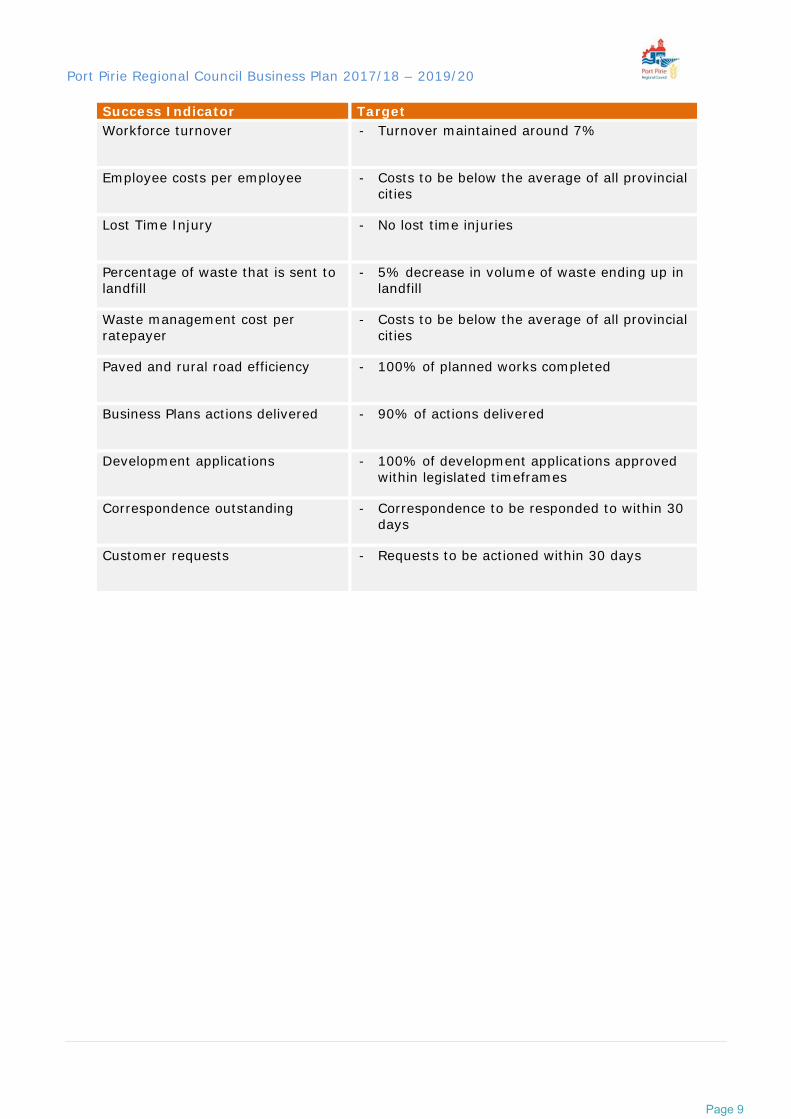
Measuring Our Performance – Success Indicators
The Community Plan identifies Success Indicators for each Objective and we have identified the following measures and targets to focus on for the next three years:
Success Indicator Target Port Pirie Regional Council Population Growth
- 1% per annum - Increase in new residents as measured by the
distribution of new waste bins
Community Satisfaction towards all Council services
- Greater than or equal to the state average
Economic development - Reduction in the unemployment rate
A vibrant and bustling Port Pirie CBD and cultural precinct
- Less than 10% of retail premises empty - 5% increase in visitors through the Tourism
and Arts Centre - 2.5% increase in visitors to the Library
Businesses relocating to the region - 2% growth in new business established in
Council area
Visitor numbers to Port Pirie - Number of visitors equal or exceed the average number of visitors to South Australia
- Number of overnight visitors equal or exceed the average number of visitors to South Australia
Reduced blood lead levels in Port Pirie children
- Increase the percentage of children in Port Pirie aged 0 to 4 years who have blood lead levels within the NHMRC guidelines to up to 95% within 10 years
Formal complaints to the Ombudsman
- No formal complaints
Operating surplus / deficit - Annually return an operating surplus
Operating surplus ratio - Maintained between (2.5%) and 2.5%
Net financial liabilities ratio - Maintained between 30% and less than 70%
Asset sustainability ratio - 100%
Average residential rates - Rates increase consistent with the Rating Strategy – currently 5%
Page 8
Port Pirie Regional Council Business Plan 2017/18 – 2019/20
Success Indicator Target Workforce turnover - Turnover maintained around 7%
Employee costs per employee - Costs to be below the average of all provincial cities
Lost Time Injury - No lost time injuries
Percentage of waste that is sent to landfill
- 5% decrease in volume of waste ending up in landfill
Waste management cost per ratepayer
- Costs to be below the average of all provincial cities
Paved and rural road efficiency - 100% of planned works completed
Business Plans actions delivered - 90% of actions delivered
Development applications - 100% of development applications approved within legislated timeframes
Correspondence outstanding - Correspondence to be responded to within 30 days
Customer requests - Requests to be actioned within 30 days
Page 9
Port Pirie Regional Council Business Plan 2017/18 – 2019/20
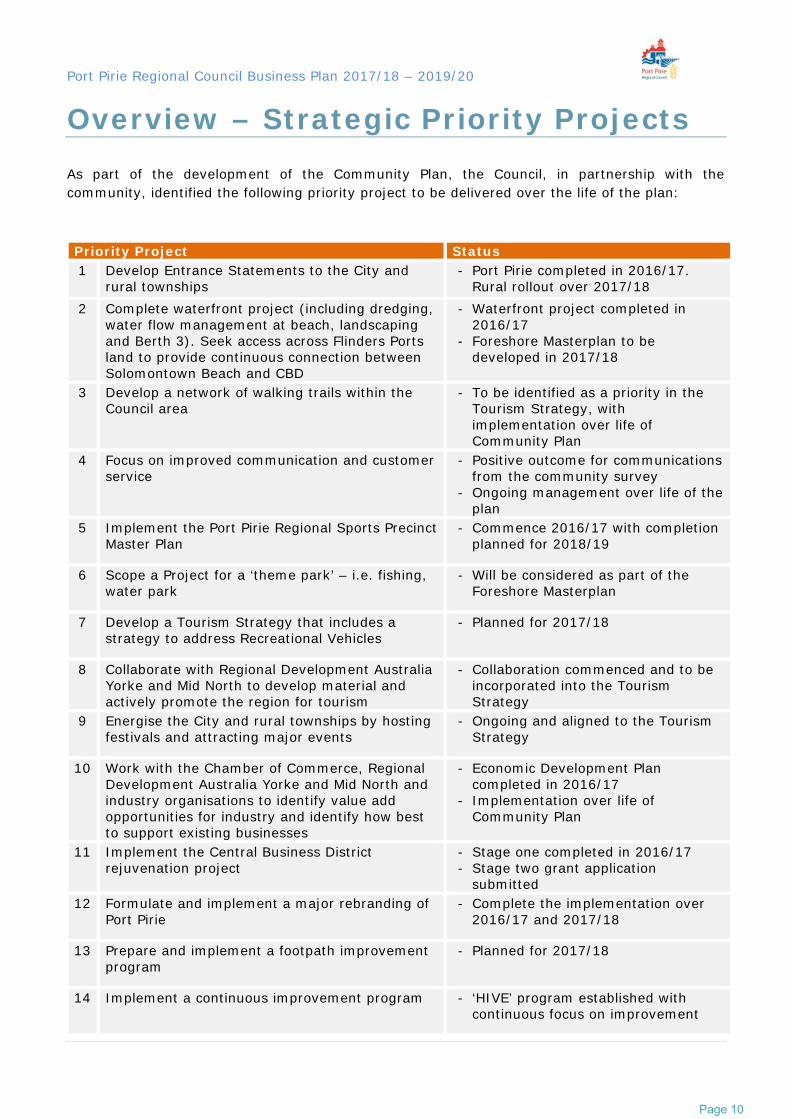
Overview – Strategic Priority Projects
As part of the development of the Community Plan, the Council, in partnership with the community, identified the following priority project to be delivered over the life of the plan:
Priority Project Status 1 Develop Entrance Statements to the City and
rural townships - Port Pirie completed in 2016/17.
Rural rollout over 2017/18 2 Complete waterfront project (including dredging,
water flow management at beach, landscaping and Berth 3). Seek access across Flinders Ports land to provide continuous connection between Solomontown Beach and CBD
- Waterfront project completed in 2016/17
- Foreshore Masterplan to be developed in 2017/18
3 Develop a network of walking trails within the Council area
- To be identified as a priority in the Tourism Strategy, with implementation over life of Community Plan
4 Focus on improved communication and customer service
- Positive outcome for communications from the community survey
- Ongoing management over life of the plan
5 Implement the Port Pirie Regional Sports Precinct Master Plan
- Commence 2016/17 with completion planned for 2018/19
6 Scope a Project for a ‘theme park’ – i.e. fishing, water park
- Will be considered as part of the Foreshore Masterplan
7 Develop a Tourism Strategy that includes a strategy to address Recreational Vehicles
- Planned for 2017/18
8 Collaborate with Regional Development Australia Yorke and Mid North to develop material and actively promote the region for tourism
- Collaboration commenced and to be incorporated into the Tourism Strategy
9 Energise the City and rural townships by hosting festivals and attracting major events
- Ongoing and aligned to the Tourism Strategy
10 Work with the Chamber of Commerce, Regional Development Australia Yorke and Mid North and industry organisations to identify value add opportunities for industry and identify how best to support existing businesses
- Economic Development Plan completed in 2016/17
- Implementation over life of Community Plan
11 Implement the Central Business District rejuvenation project
- Stage one completed in 2016/17 - Stage two grant application
submitted 12 Formulate and implement a major rebranding of
Port Pirie - Complete the implementation over
2016/17 and 2017/18
13 Prepare and implement a footpath improvement program
- Planned for 2017/18
14 Implement a continuous improvement program - ‘HIVE’ program established with continuous focus on improvement
Page 10

Port Pirie Regional Council Business Plan 2017/18 – 2019/20
Role of the Business Plan This year, Council has moved to simplify its strategy structure to have one long term strategy document - the Community Plan, and one document to support the implementation of the Community Plan - a three year rolling Business Plan. The rolling three year Business Plan will be updated annually to ensure the plan is developed using the most up-to-date information and is achievable. The change also recognises that many of the activities and actions undertaken by Council are either ongoing or happen over several years. In any planning process it is recognised that the plan is created with the best available information and to ensure the most efficient and effective use of all Council resources. However, during the life of a plan, unforeseen issues or opportunities may arise that need to be addressed and require a deviation from the plan. It is important to keep the Business Plan as an agile and dynamic document that Council continually reviews through reports and records any deviations and makes appropriate adjustments to our future plans. Therefore, this Business Plan, including the budgeted financials needs to be read in that context. The Business Plan has been developed taking into consideration an appraisal of the current and emerging situation including:
Implementation status of the 2016/17 Annual Business Plan Alignment to our Community Plan that reflect Council’s commitment to communities in
the Council area Council’s operating environment Current performance level of the Council commensurate with community and key
stakeholder needs Effective and efficient use of Council’s finite resource to ensure financial sustainability
Delivery of the Business Plan will be reported on regularly through performance reports and once a year in the Annual Report. The alignment between the State Government, the Community Plan 2016-2025 and this Business Plan is shown below:
Key Actions Performance Reports
Annual Report
Resources
Budget
Assets
Infrastructure
Measures and Targets
Local Government Act 1999
South Australia’s Seven Key Priorities Port Pirie Regional Council Community Plan 2016 - 2025
Rolling Three Year Business Plan
Page 11

Port Pirie Regional Council Business Plan 2017/18 – 2019/20
Strategic Architecture The Community Plan 2016 - 2025 defines our strategic architecture that articulates and translates community aspirations into our future direction and implementable actions. Port Pirie Regional Council has aligned all corporate planning to this architecture.
Vision
“Regional Leader – Economic Hub – Quality Lifestyle” By 2025 the Port Pirie Region is the premier regional centre in South Australia
where residents and visitors want to be
Mission To progressively strive for excellence, lead with integrity and deliver positive
outcomes for the community
Objectives
Community Wellbeing
Establish the Port Pirie Regional Council area as the region of choice for residents, based on our strong sense of community,
healthy lifestyle, economic prosperity and job opportunities
for all, quality services and strong
identity
Economic Prosperity
Grow the regional economy by
supporting existing businesses and attracting new businesses and industry sectors
Sustainability Manage our
environment, minimise our
ecological footprint and head towards sustainability in all
endeavours
Leadership & Governance Provide best
practice governance and administration that are inclusive,
innovative, sustainable,
transparent and achievement /
outcome focussed while providing
regional leadership
Goals
Strategies
Business Plan Actions
Page 12

Port Pirie Regional Council Business Plan 2017/18 – 2019/20
Strategic Architecture – Objectives and Goals
Our Business Plan actions are aligned to our objectives and strategies as outlined below:
Community Wellbeing
CW1 Inclusivity CW2 Community Resilience & Health CW3 Recreation & Sports CW4 Community Diversity CW5 Jobs CW6 Education Opportunities CW7 Built Environment CW8 Place
Economic Prosperity
EP1 Economic Diversity EP2 Tourism EP3 Primary Production EP4 Mining EP5 Infrastructure
Sustainability
S1 Waste Management S2 Energy S3 Natural Environment S4 Waste Resources S5 Climate Change S6 Targeted Lead Abatement
Leadership and Governance
L&G1 Sustainable Organisation L&G2 Accountability L&G3 Council Initiatives L&G4 Strategic Partnerships L&G5 Innovation & Leadership
Page 13

Port Pirie Regional Council Business Plan 2017/18 – 2019/20
Creating a vibrant city
An affordable place to live
Every change for every child
Growing advanced manufacturing
Realising the benefits of the mining boom for all
Safe communities, healthy neighbourhoods
Premium food and wine from our clean environment
Community Wellbeing
Economic Prosperity
Leadership and Governance
Sustainability
State Government Priorities Key Council Themes
Alignment with State Government Strategy Seven Strategic Priorities
The State Government has developed seven priorities for South Australia’s future. These priorities are areas where the State can make the most difference to the lives of everyday people and the most difference to the future prosperity of South Australia.
These priorities are about:
giving our children every chance to achieve their potential in life
keeping our communities safe and our citizens healthy
building our reputation for premium food and wine
growing advanced manufacturing as the way for the future
realising the benefits of the mining boom for all
creating a vibrant city that energises and excites
keeping our high quality of life affordable for everyone.
To ensure we contribute to the delivery of the State Government’s strategic priorities, we have developed our Community Plan to align with both the strategic priorities and the South Australia Strategic Plan and seek through the Business Plan to implementation our contribution. However, we will only be successful if there is an active partnership between State Government, Port Pirie Regional Council, industry and our communities. This alignment with the South Australia Strategic Plan means we need to understand their 100 measures and targets and our contribution to meeting those commitments. The alignment between our Community Plan and the State Government Priorities are shown in the above diagram.
Page 14
Port Pirie Regional Council Business Plan 2017/18 – 2019/20
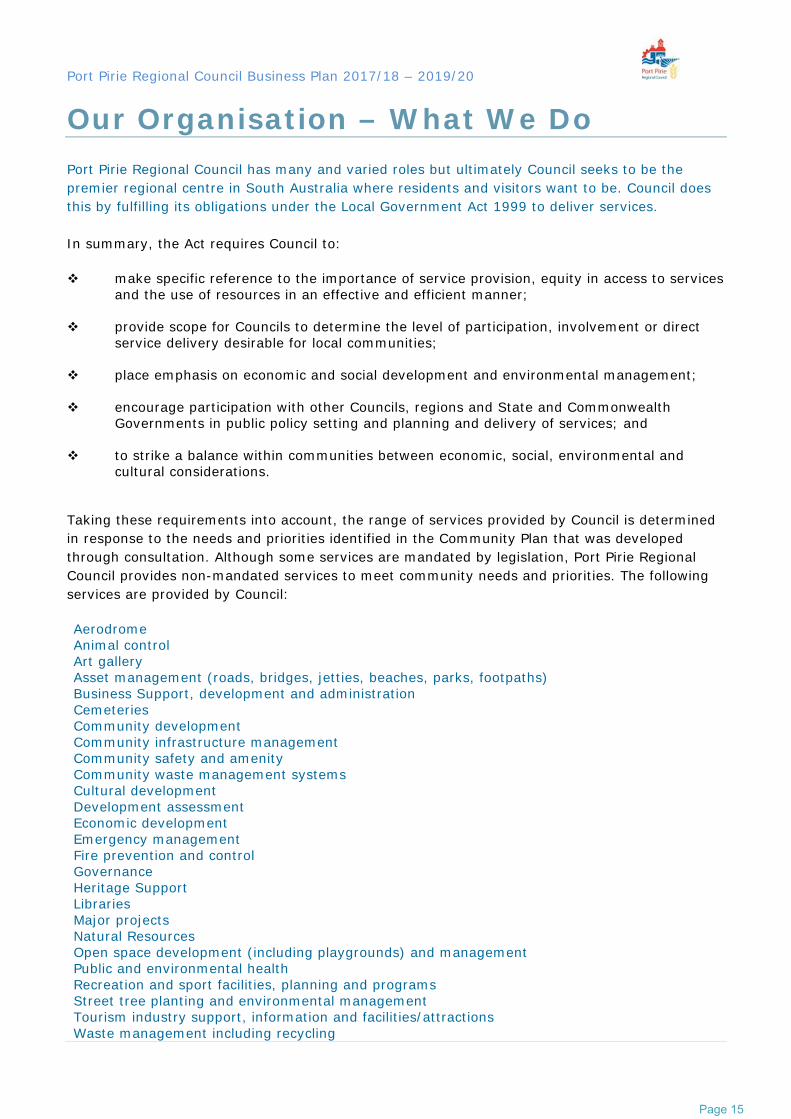
Our Organisation – What We Do Port Pirie Regional Council has many and varied roles but ultimately Council seeks to be the premier regional centre in South Australia where residents and visitors want to be. Council does this by fulfilling its obligations under the Local Government Act 1999 to deliver services. In summary, the Act requires Council to: make specific reference to the importance of service provision, equity in access to services
and the use of resources in an effective and efficient manner;
provide scope for Councils to determine the level of participation, involvement or direct service delivery desirable for local communities;
place emphasis on economic and social development and environmental management;
encourage participation with other Councils, regions and State and Commonwealth Governments in public policy setting and planning and delivery of services; and
to strike a balance within communities between economic, social, environmental and cultural considerations.
Taking these requirements into account, the range of services provided by Council is determined in response to the needs and priorities identified in the Community Plan that was developed through consultation. Although some services are mandated by legislation, Port Pirie Regional Council provides non-mandated services to meet community needs and priorities. The following services are provided by Council: Aerodrome Animal control Art gallery Asset management (roads, bridges, jetties, beaches, parks, footpaths) Business Support, development and administration Cemeteries Community development Community infrastructure management Community safety and amenity Community waste management systems Cultural development Development assessment Economic development Emergency management Fire prevention and control Governance Heritage Support Libraries Major projects Natural Resources Open space development (including playgrounds) and management Public and environmental health Recreation and sport facilities, planning and programs Street tree planting and environmental management Tourism industry support, information and facilities/attractions Waste management including recycling
Page 15

Port Pirie Regional Council Business Plan 2017/18 – 2019/20
Our Organisation – Where We Are Port Pirie is located in the Upper Spencer Gulf region of South Australia and is 220km from Adelaide on Highway One. Port Pirie is the gateway to the Southern Flinders Ranges. The Port Pirie Regional Council was created in 1997, and resulted from two council mergers in short succession. Firstly, the amalgamation of the District Council of Pirie into the City of Port Pirie in July 1996 and secondly, that Council's subsequent amalgamation with the District Council of Crystal Brook-Redhill in March 1997. The Council region covers an area of 1,761 square kilometres and has a population of 17,625 people. The main city is Port Pirie with a population of 13,263 and two smaller towns being Crystal Brook (population 1,259) and Napperby (population 253). Other smaller townships include Koolunga, Redhill, Mundoora, Wandearah and Warnertown with the remaining people living on rural properties. Port Pirie is the largest city in the State’s Mid North Region and plays an important role as a regional service centre, with many of the surrounding smaller towns relying on Port Pirie for education, health care, retail and employment.
Page 16

Port Pirie Regional Council Business Plan 2017/18 – 2019/20
Our Organisation – Our Values Every Port Pirie Regional Council employee carries the responsibility of working towards achieving a continuing, measurable improvement in our workplace culture. This will be achieved through upholding Port Pirie Regional Council values by: Service Delivery Excellence Council will ensure that its services meet quality, cost and efficiency standards; are accessible and are responsive to the needs of the community. Accountability Council acts on behalf of the communities of Port Pirie Regional Council and accepts accountability for its decisions and actions. Honesty, Integrity and Transparency Council will strive to be valued and trusted by the community through its actions and open and honest communication. Ethical Behaviour and Good Governance Council values ethical conduct and employs principles of good governance Inclusivity Council acts on behalf of all residents and ratepayers. We value the community and will treat all people with dignity, respect and equity. Team Work and Professionalism Council values a cohesive team approach with the administration and elected members working together to lead the region forward with appropriate skills, knowledge and experience.
Page 17

Port Pirie Regional Council Business Plan 2017/18 – 2019/20
Our Organisation – Organisational Structure Port Pirie Regional Council has an equivalent full time establishment of 102.25 employees and an operating budget of approximately $25 million that is used to meet the needs of its residents, including maintaining total assets to the value of $250 million. Council appoints a Chief Executive Officer to manage the day-to-day business or the Council. To support the Chief Executive Officer deliver manage Council business, the structure has the following three directorates who have been assigned accountability for a range of functions:
Chief Executive
Officer
Director
Infrastructure
Director Corporate
& Community
Director Development
& Regulation
Council
• Construction & Maintenance
• Parks & Recreation
• Workshop • Asset
Management • Cemeteries • Aerodrome • Emergency
Management • Natural
Resources
• Customer Service • Finance • Governance • Human
Resources • Information
Technology & Communications
• Library • Records • Tourism & Events
• Environmental Health
• Planning & Building Services
• Waste Services • General
Inspectorate • Community Waste
Water • Fire Prevention
Andrew Johnson
James Holyman Kathryn Johnson Grant McKenzie
Page 18

Port Pirie Regional Council Business Plan 2017/18 – 2019/20
Operating Environment Port Pirie Regional Council operates in an era of worldwide social, economic and environmental change. We operate in a world of rapidly evolving technologies, business models, demographics and even workplace attitudes that are all shifting concurrently. This is combined with our communities demanding that we deliver more and spend less. Change is not only constant but also exponential in its pace and scope. Therefore, as context for this Business Plan it is important to understand some of the key external changes impacting on Council: Changing role of councils – The role of councils across the nation is shifting due to changes in community expectations and standards and economic growth (for example a higher number of vehicles per household leads to demand for safer local roads/traffic management and increases demand for waste services). Also contributing to the change is the reductions in the size of both Federal and State public services resulting in greater reliance on councils to fill the gap. Finally, increased legal obligations (e.g. building fire safety inspections now done by councils and higher workplace safety standards affecting all employers) contribute to an increased workload. To respond, the council will need to become more agile and innovative to make best use of our finite resources to meet community expectations. The growing power of social networks - The use of modern social networks continues to rapidly evolve and it is essential that we embrace and better utilise this area of innovation to deliver our services and to involve our communities in the decision making process. Recent events demonstrate that our communities receive, share and respond via their social networks more rapidly than using traditional communication systems. These platforms must also be used for online forums to invite citizens to openly comment and discuss the policies, strategies and projects of our council and to share their opinions. Operating in a tight fiscal environment - Across Australia in both public and private sectors we are experiencing a sustained tightening of the economy and the related financial environment. Port Pirie Regional Council is not immune to these influences and so it is imperative that we continue our identification of more efficient and flexible service delivery solutions which deliver effective services to our communities, now and into the future. Honing in on what Council consider are the most valuable aspects of our operation will assist the organisation in finding a balanced and sustainable service model for the benefit of all citizens. Changing community structures, population and shape - Our definition of community is gradually shifting. Once predominantly geographic or ‘place based’ in our sense of community, we increasingly see strong ‘interest based’ communities supported by technology and a greater ease to regularly travel from place to place. Coupled with shifts in urban, regional and rural population we are witnessing a change to traditional community structures. In particular, changes to traditional farming structures have resulted in rural decline in many small towns. This change coupled with longer life expectancies and falling birth rates will strain social welfare systems (by 2030, the world’s population aged 65 and over will double to a billion and fewer young people will be working to help pay their retirement and medical expenses) We must consider opportunities to better identify, connect with and utilise a range of community networks in order to engage and sustain organisational capability into the future and also meet the pressures of growth and change.
Page 19

Port Pirie Regional Council Business Plan 2017/18 – 2019/20
Increased urbanisation – In 1990, we had ten megacities (i.e. a city with more than ten million people) and today there are 25 cities that meet this definition. Many of our cities are growing faster than governments can expend to develop the supporting infrastructure, e.g. public transport. It also means that housing closer to the centre of the city is out of reach of most people and this is reflected in the housing affordability crisis in capital cities across Australia. It also means that a large portion of the younger population are moving to the city to study and then staying for work. In the rural small town this is leading a decline in population, an increase in the average age of residents and consequently a decrease in the number and type of businesses and services (common known as rural decline). Responding to a changing climate - Scientific research shows South Australia’s climate is changing significantly. The increasing severity and frequency of extreme weather is impacting on the volume and intensity of emergencies experienced across South Australia. Preparing for and responding to these significant events requires a real shift in our approach as it is recognised that our traditional response to emergencies cannot effectively combat their catastrophic impact. Working closely with our partners, we need to better engage communities to fully understand their collective and individual risk, and to better enable them to prepare for and respond to emergencies. Council has a role in building community capacity and resilience as well as rebuilding infrastructure following any natural event. As these become more frequent, so the will the expectation on Council to strengthen existing infrastructure and move quickly to restore communities following such events. These expectations will impact directly on the financial sustainability of councils
Page 20

Port Pirie Regional Council Business Plan 2017/18 – 2019/20
Our Key Actions 2017/18 – 2019/20 Community Wellbeing Establish the Port Pirie Council area as the region of choice for residents, based on our strong sense of community, healthy lifestyle, economic prosperity and job opportunities for all, quality services and strong identity.
Goal & Strategy
Action Accountability Performance measure
Target
CW1.2 Provide support to community volunteer organisations and acknowledge their efforts
Corporate and Community
- Increase in number of council volunteers
- Develop a volunteer recognition program
- 5% - Completion
CW1.3 Promote and increase participation at the Community Garden
Corporate and Community
- Increase in number of participants
- 20
CW2.4 Actively promote and deliver the STARClub program
Corporate and Community
- Deliver on STARClub Committee key performance indicators
- 100% of KPIs delivered
CW3.1 Continue the construction of the Port Pirie Regional Sports Precinct
Chief Executive Officer
- Project delivered on time, on budget and within specifications
- Completion
CW4.1 Deliver youth activities at Council’s libraries
Corporate and Community
- Youth programs delivered
- Number of reading challenge participants
- 38 - Greater than
60
CW4.1 Develop and maintain the public WiFi in Port Pirie and Crystal Brook
Corporate and Community
- WiFi available - WiFi coverage
optimised
- 99% - Complete CBD
coverage
CW4.1 Facilitate a workshop to identify the service needs and expectations of our youth
Chief Executive Officer
- Run a workshop - Completion
Page 21

Port Pirie Regional Council Business Plan 2017/18 – 2019/20
Goal & Strategy
Action Accountability Performance measure
Target
CW4.3 Run free community events
Corporate and Community
- Increase in attendance
- Increase in events - Proactive
Community Events Group
- 10%
- 25% - Formed and
active
CW7.1 Develop Foreshore Masterplan for both sides of the river from Solomontown Beach through to Berth 3
Infrastructure - Develop foreshore masterplan
- Consider water park facility
- Complete in 2018/19
- Completion
CW7.3 Develop a street scaping plan for The Terrace, Mary-Elie, Alexander and Gertrude Streets
Infrastructure - Street scaping plan approved by Council
- Completion
CW7.5 Redevelop the Crystal Brook Library and Community Centre
Infrastructure - Project delivered on time, on budget and within specifications
- Completion
CW7.5 Place sand on beach in December and before Australia Day to improve the beach experience
Infrastructure - Sand placed - Twice a year
CW7.5 Increased public art in the Council area
Corporate and Community
- Funds allocated to increase in the number of artworks and art displays
- % of capital works allocated to public art
CW7.7 Prepare and implement a footpath strategy, incorporating cycling
Infrastructure - Develop footpath strategy
- Completion
CW7.9 Prepare a Napperby Flood Plain Mitigation Study
Infrastructure - Prepare Napperby Flood Mitigation study
- Completion
CW7.9 Maintain and develop Port Pirie CCTV system
Corporate and Community
- All cameras operational
- 90%
CW8.2 Continue the implementation of gateway entries for our towns
Development and Regulation
- Number of entries to communities complete
- Five
Page 22

Port Pirie Regional Council Business Plan 2017/18 – 2019/20
Economic Prosperity Build a sustainable economically thriving and competitive Council area. Goal & Strategy
Action Accountability Performance measure
Target
EP1.1 Implement the key actions from the Economic Development Strategy
Chief Executive Officer
- Key actions implemented on time and on budget
- 100%
EP1.1 Implement Come See Change branding
Corporate and Community
- Improved brand recognition as measured through survey
- 80%
EP1.4 Review Council’s procurement policy to support local businesses where practical
Infrastructure - Policy reviewed and updated
- Completion
EP1.8 Improve the appearance of Port Pirie’s roundabouts
Infrastructure - Number of roundabouts complete
- Four
EP2.1 Complete a Tourism and Events Strategy for Council
Corporate and Community
- Tourism and Events Strategy prepared with community input
- Adopted by Council
EP2.4 Implement the Phoenix Wetlands Masterplan
Infrastructure - Plan Implemented - 100%
Page 23
Port Pirie Regional Council Business Plan 2017/18 – 2019/20
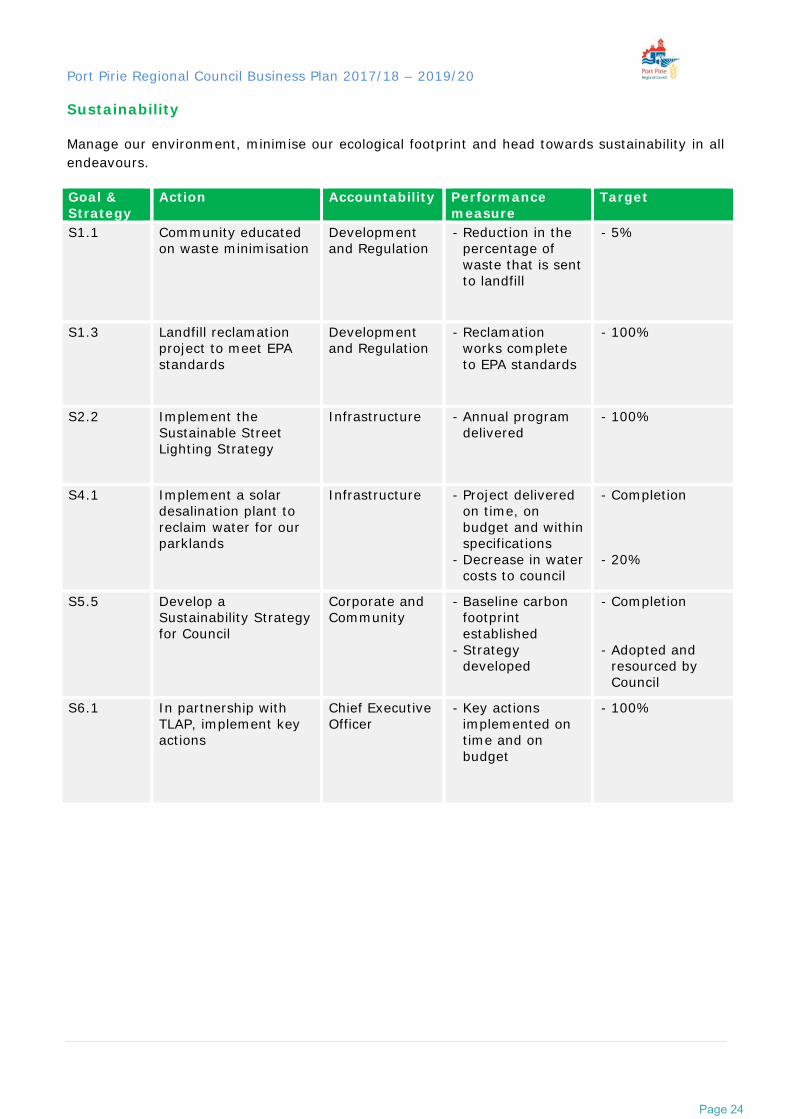
Sustainability Manage our environment, minimise our ecological footprint and head towards sustainability in all endeavours.
Goal & Strategy
Action Accountability Performance measure
Target
S1.1 Community educated on waste minimisation
Development and Regulation
- Reduction in the percentage of waste that is sent to landfill
- 5%
S1.3 Landfill reclamation project to meet EPA standards
Development and Regulation
- Reclamation works complete to EPA standards
- 100%
S2.2 Implement the Sustainable Street Lighting Strategy
Infrastructure - Annual program delivered
- 100%
S4.1 Implement a solar desalination plant to reclaim water for our parklands
Infrastructure - Project delivered on time, on budget and within specifications
- Decrease in water costs to council
- Completion - 20%
S5.5 Develop a Sustainability Strategy for Council
Corporate and Community
- Baseline carbon footprint established
- Strategy developed
- Completion - Adopted and
resourced by Council
S6.1 In partnership with TLAP, implement key actions
Chief Executive Officer
- Key actions implemented on time and on budget
- 100%
Page 24

Port Pirie Regional Council Business Plan 2017/18 – 2019/20
Leadership and Governance Provide best practice governance and administration that are inclusive, innovative, sustainable, transparent and achievement/outcome focussed while providing regional leadership.
Goal & Strategy
Action Accountability Performance measure
Target
L&G1.1 Review and upgrade business reporting to Council and community
Corporate and Community
- Council and community satisfaction with the reports
- 95%
L&G1.1 Dog and cats services provided online
Corporate and Community
- Online system implemented
- Completion
L&G1.1 Obtain 3D images of central Port Pirie to support marketing and economic development
Corporate and Community
- Images completed and uploaded for users
- Completion
L&G1.8 Continue the business excellence program
Corporate and Community
- Processes or problems mapped and solutions implemented
- Improved organisation culture
- Six - 5%
improvement in the employee survey
L&G1.8 Provide 3D printer training and services
Corporate and Community
- Number of people trained
- Number of items printed outside training
- 15 - 40
L&G2.3 Strengthen our project management framework and templates
Infrastructure - Revised framework and tools implemented
- Annual capital program delivered
- 100% - 85%
L&G5.2 Annually benchmark against other Councils and other sectors
Corporate and Community
- Reports provided to Council
- Reported annually
Page 25

Port Pirie Regional Council Business Plan 2017/18 – 2019/20
Funding the Business Plan The Budget describes how the proposed outcomes of the Business Plan are funded. All income and expenses are included for the business operations and the capital works program. Business Operations The Operating result is a small surplus of $0.12 million which will be directed towards the funding of the capital works program for 2017/18. Operating Income Income is raised from property rates, fees and charges, investment income and other income including reimbursements and contributions, donations and sale of surplus assets. The total operating income for 2017/18 is estimated to be $25.2 million. The estimated amount of operating income from each source is:
Property Rates $17.6m Statutory Fees $0.4m User Charges $1.5m Grants & subsidies $5.2m Investment Income $0.1m Other $0.4m
Rates, 70%
Statutory Fees, 1%
User Charges, 6%
Grants & Subsidies, 22%
Investment Income, 1%
Other, 2%
Income by Source
Page 26

Port Pirie Regional Council Business Plan 2017/18 – 2019/20
Operating Expenses The total operating expenses for 2017/18 are estimated to be $25.0 million. Operating expenses include payments for employees, contractors, materials, plant & equipment maintenance, loan interest and an amount for asset depreciation. The following projects and initiatives are included in the operating budget for 2017/18:
Contributions for various sporting facilities and community assistance grants; Cemetery masterplan works; Increased service levels for roadside tree planting, including Port Pirie and township
entrances; Continuing maintenance of park structures, public conveniences, swimming pools, halls
and buildings; Stormwater Drainage surveys; and Asset management.
Community Services / Amenities, $1,689
Culture / Library, $1,387
Tourism / Economic Dev, $1,520
Waste Management, $3,575
Environment / Stormwater
Drainage, $690Street Services,
$1,898Parks / Recreation / Marine, $2,776
Regulatory, $1,608
Roads/Foot/Kerb, $5,520
Aerodrome, $235
Plant/Depot/Works Admin, $1,611
Governance/Admin, $2,367
Finance Interest & Charges, $163
Expenses by Activity
Page 27
Port Pirie Regional Council Business Plan 2017/18 – 2019/20
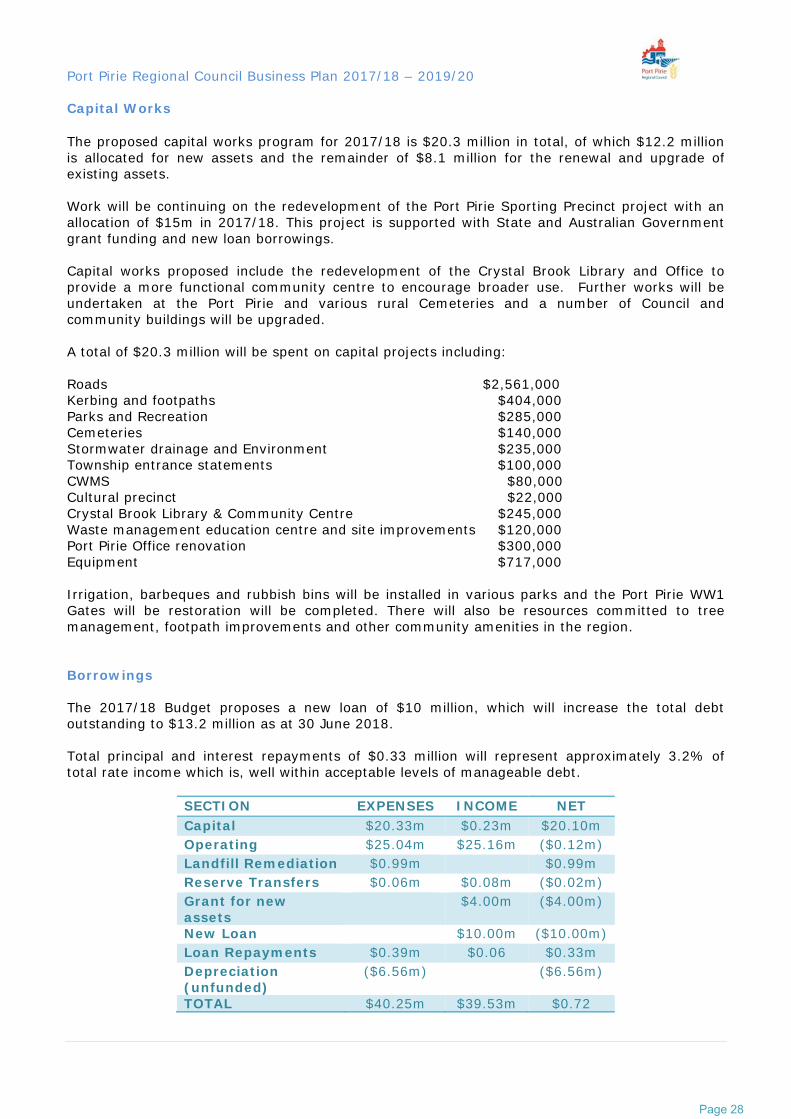
Capital Works The proposed capital works program for 2017/18 is $20.3 million in total, of which $12.2 million is allocated for new assets and the remainder of $8.1 million for the renewal and upgrade of existing assets. Work will be continuing on the redevelopment of the Port Pirie Sporting Precinct project with an allocation of $15m in 2017/18. This project is supported with State and Australian Government grant funding and new loan borrowings. Capital works proposed include the redevelopment of the Crystal Brook Library and Office to provide a more functional community centre to encourage broader use. Further works will be undertaken at the Port Pirie and various rural Cemeteries and a number of Council and community buildings will be upgraded. A total of $20.3 million will be spent on capital projects including: Roads $2,561,000 Kerbing and footpaths $404,000 Parks and Recreation $285,000 Cemeteries $140,000 Stormwater drainage and Environment $235,000 Township entrance statements $100,000 CWMS $80,000 Cultural precinct $22,000 Crystal Brook Library & Community Centre $245,000 Waste management education centre and site improvements $120,000 Port Pirie Office renovation $300,000 Equipment $717,000 Irrigation, barbeques and rubbish bins will be installed in various parks and the Port Pirie WW1 Gates will be restoration will be completed. There will also be resources committed to tree management, footpath improvements and other community amenities in the region. Borrowings The 2017/18 Budget proposes a new loan of $10 million, which will increase the total debt outstanding to $13.2 million as at 30 June 2018. Total principal and interest repayments of $0.33 million will represent approximately 3.2% of total rate income which is, well within acceptable levels of manageable debt.
SECTION EXPENSES INCOME NET Capital $20.33m $0.23m $20.10m Operating $25.04m $25.16m ($0.12m) Landfill Remediation $0.99m $0.99m Reserve Transfers $0.06m $0.08m ($0.02m) Grant for new assets
$4.00m ($4.00m)
New Loan $10.00m ($10.00m) Loan Repayments $0.39m $0.06 $0.33m Depreciation (unfunded)
($6.56m) ($6.56m)
TOTAL $40.25m $39.53m $0.72
Page 28
Port Pirie Regional Council Business Plan 2017/18 – 2019/20
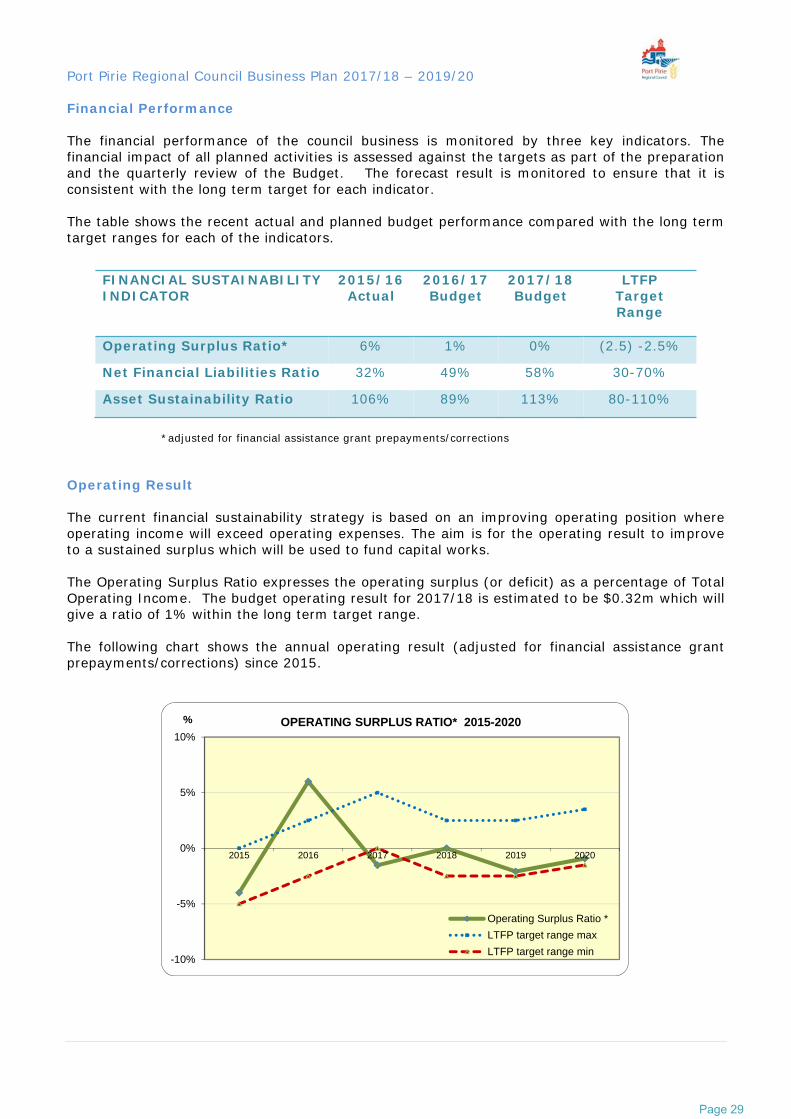
Financial Performance The financial performance of the council business is monitored by three key indicators. The financial impact of all planned activities is assessed against the targets as part of the preparation and the quarterly review of the Budget. The forecast result is monitored to ensure that it is consistent with the long term target for each indicator. The table shows the recent actual and planned budget performance compared with the long term target ranges for each of the indicators.
*adjusted for financial assistance grant prepayments/corrections
Operating Result The current financial sustainability strategy is based on an improving operating position where operating income will exceed operating expenses. The aim is for the operating result to improve to a sustained surplus which will be used to fund capital works. The Operating Surplus Ratio expresses the operating surplus (or deficit) as a percentage of Total Operating Income. The budget operating result for 2017/18 is estimated to be $0.32m which will give a ratio of 1% within the long term target range. The following chart shows the annual operating result (adjusted for financial assistance grant prepayments/corrections) since 2015.
-10%
-5%
0%
5%
10%
2015 2016 2017 2018 2019 2020
% OPERATING SURPLUS RATIO* 2015-2020
Operating Surplus Ratio *
LTFP target range max
LTFP target range min
FINANCIAL SUSTAINABILITY INDICATOR
2015/16 Actual
2016/17 Budget
2017/18 Budget
LTFP Target Range
Operating Surplus Ratio* 6% 1% 0% (2.5) -2.5%
Net Financial Liabilities Ratio 32% 49% 58% 30-70%
Asset Sustainability Ratio 106% 89% 113% 80-110%
Page 29

Port Pirie Regional Council Business Plan 2017/18 – 2019/20
Financial Liabilities The Net Financial Liabilities are calculated as the difference between amounts owed and amounts held. The Net Financial Liabilities Ratio measures the net financial liability amount against total operating income. A ratio trend that is reducing indicates the improving capacity to meet financial obligations. For 2017/18 the Financial Liabilities are expected to increase to $13.2 million in 2018 and this will give a ratio of 57% which includes a proposed new loan of $10 million. In the draft LTFP 2017-2027, the target range is 30 – 70%.
Asset Sustainability The Asset Sustainability Ratio measures the extent to which existing assets are being renewed or replaced, compared to the planned Capital works in the Asset Management Plan(s). If the capital expenditure budget for the renewal or replacement of existing assets matches that projected in the Asset Management Plan(s), then the ratio will be 100%. If the ratio is less than 100% for any extended period, this will lead to a deterioration of asset condition over time, leaving future generations of ratepayers to fund high asset maintenance and replacement to restore the asset service level. The Council is proposing a very large capital works program for 2017/18. The major works are well advanced in their planning and implementation and are supported by external grant funds. The Budget has included projects to achieve a ratio of 113% in 2017/18.
0%
10%
20%
30%
40%
50%
60%
70%
80%
2015 2016 2017 2018 2019 2020
% NET FINANCIAL LIABILITIES RATIO 2015-2020
Net Financial Liabilities Ratio
LTFP target range max
LTFP target range min
0%
20%
40%
60%
80%
100%
120%
2015 2016 2017 2018 2019 2020
%ASSET SUSTAINABILITY RATIO 2015-2020
Asset Sustainability Ratio
LTFP target range max
LTFP target range min
Page 30

Port Pirie Regional Council Business Plan 2017/18 – 2019/20
31 | P a g e
RATES 2017/18 Property Rates
Council intends to raise $17.6 million (after rebates and remissions, excluding fines) in total property rates, including service charges. This will enable Council to deliver the planned activities and services in 2017/18 and to partly fund the capital works program. The amount represents an overall increase of $0.81 million from the previous year which is increase of 4.8%. Calculation of Rates The Local Government Act provides for a Council to raise income through a general rate, which applies to all rateable properties, or through a differential general rate, which applies to different classes of property such as land use type. In addition, Council can raise a separate rate for specific areas of the Council or a service rate or charge for specific services. The method of calculation of rates is: General Rates: Fixed Charge (applicable to all properties) + Valuation x Rate in $ (differential rates determined by land use) and Service charges: + Waste Management Service Charge (applicable to all residential properties) + CWMS (applicable to all Crystal Brook and Napperby properties) + NRM Levy (applicable to all rateable properties) = Total Property Rates Payable. The following table shows the amounts for General rates and Service Charges for 2016/17 and the estimated proposed amounts for 2017/18:
Rates including rebates (excluding fines)
2015/16 $ (m)
2016/17 $ (m)
% increase
2017/18 $ (m)
% increase
General 13.895 14.426 3.8 15.050 4.3 WMC 1.732 1.732 0 1.801 4.0 CWMS 0.173 0.173 0 0.175 2.0 NRM 0.310 0.379 22.3 0.390 2.9 TOTAL 16.082 16.710 3.7 17.416 4.2
Fixed Charge The proposed rating structure continues with the approach of a single fixed charge amount to be applied to all properties in the region, with the exception of contiguous properties and single farm enterprises. Total rate income from the fixed charge must not exceed 50%. Differential Rates The differential rates are calculated using the property capital valuation and a rate in the dollar value to raise the balance of general rate income. The proposed total general rate income of $15.4 million (excluding rebates) comprises the following elements:
Fixed Charge $5.0m (all properties - approx. 33% of General Rates) Differential Rating $10.4m (valuation based – approx. 67% of General Rates)
Page 31

Port Pirie Regional Council Business Plan 2017/18 – 2019/20
RATES 2017/18 (continued) This is proportionally the same as in 2016/17. The Valuer-General has provided the property valuations that have been used as the basis for rating purposes. Capital valuation updates will continue to be applied up until the date of declaration of rates. The overall average property valuation for the region has increased by 2.48% with larger variations of decreases and increases in the average valuation for each land use category. The change in valuation for each land use category and the amount of general rates collected:
Land Use Category Valuation change %
Rate in $ Property Rate Revenue
Residential - All 0.02% 0.4016 $9.37m Commerce/Industry – Port Pirie 10.32% 0.8033 $1.96m Commerce/Industry - Other 8.00% 0.8033 $0.22m Industry - Other 0.89% 4.8720 $1.36m Primary Production - All 8.77% 0.3213 $1.78m Vacant - All -2.35% 0.8033 $0.56m Other - All -1.03% 0.4016 $0.16m TOTAL 2.48% $15.41m
The average residential rates for 2017/18 will increase to $1,239 from $1,189 which is an increase of $50 compared to an increase of $86 in 2016/17. Individual property rates will vary; with some decreases and increases depending on the property capital value movement. The most recent information provided by the SA Local Government Grants Commission is for the year ended 30 June 2015 and shows that the State average residential rate was $1,417. The current average residential rates in Port Pirie Regional Council are less than the State average in 2015. The rating components for 20107/18 will be:
Fixed Charge Differential Rates $475 (increase $15) Increase by 5%
This would result in an increase in general rates of up to 5% for 9,718 properties or 92% of the total rateable properties, compared to 7,796 properties or 77% for 2016/17 while 552 properties would have a reduction in the rates compared to 1,163 in 2016/17. There are 205 properties that will have an average increase greater than 5%. The increases and decreases in general rates will vary due to changes in property valuation. As a result some rates will decrease while others increase by a similar rate and there are some properties that would have a significant increase due to significant improvements to the property such as the completion of a new residence or building, or a land subdivision creating a land parcel which has previously not been rated. High increase percentages will show for low valued properties however the actual amount of the increase will be low in comparison to higher value properties. The valuation for many properties particularly residential has not changed for 2017/18.
Page 32

Port Pirie Regional Council Business Plan 2017/18 – 2019/20
RATES 2017/18 (continued) An example of the general rates for selected value residential property values:
Property Value 2016/17 2017/18 $ 200,000 $ 1,225.00 $ 1,278.20 $ 350,000 $ 1,799.00 $ 1,880.60
Waste Management Service Charge (WMSC) A three bin waste collection service is provided for all residential properties. The setting of the charge is guided by legislation which does not allow Council to charge more than the actual cost of providing the service. Total Waste Management service income would be approximately $1.824 million. A number of rural properties receive a discounted charge where their property access point is more than 500 metres from their bin collection point. Rebates are applied automatically to these properties and total approximately $2,500. The charge for 2017/18 will increase by $8 which is still below the amount in 2014.
Year 2016/17 2017/18 Residential Waste Collection Service Charge
$212 $220
NB: Many commercial properties voluntarily participate in the collection service and are invoiced by Council for this service, with no impact on rates. Community Wastewater Management Schemes (CWMS) Effluent disposal systems service all properties in Crystal Brook and Napperby. The full cost of operating and maintaining the service is recovered through a charge to each property where the service is available and this includes non-rateable properties. The following principles are used in setting the charges:
each system is to be assessed independently, as each is of a different type and age; Total charges will reflect the average annual cost of operations (including depreciation); Charges on vacant properties will be 75% of occupied properties, reflecting pump out cost
recovery from occupied properties; Ongoing Napperby irrigation costs to be treated as general Council and not a CWMS cost.
Any surplus of revenue over expense is kept in a dedicated reserve account for future replacement and upgrades of the respective schemes. The CWMS charges will increase for 2017/18 as shown below:
CWMS Crystal Brook Napperby
Property type 2016/17 2017/18 2016/17 2017/18 Vacant $135 $139 $315 $323 Occupied $180 $185 $420 $430
Page 33

Port Pirie Regional Council Business Plan 2017/18 – 2019/20
Natural Resources Management Levy The Natural Resource Management Act 2004 requires Council to raise a levy on behalf of the Northern and Yorke Natural Resources Management Board. This levy is shown separately on the rates notice. Council does not retain this revenue, nor determine how the revenue is spent. Council is required to raise $390,800 (after rebates) being an increase of $11,000 or 5%. Council will recover this amount by applying a rate in the dollar of approximately 0.00180 against the capital value of every property. Northern & Yorke Natural Resources Natural Resources Centre - Clare (head office), 155 Main North Road, Clare SA 5453 Phone: (08) 8841 3400. Monday to Friday from 9am till 5pm. Website: http://www.naturalresources.sa.gov.au/northernandyorke/ Payment of Rates The Council has decided that the payment of rates will be by quarterly billing, due on the 13 September 2017, 13 December 2017, 14 March 2018 and 13 June 2018. A quarterly rates notice will be sent to ratepayers at least 30 days prior to each due date.
13 September 2017 13 December 2017 14 March 2018 13 June 2018 The following payment services are available:
BPAY through a bank or financial institution; Australia Post in person at a post office; Post Billpay Service using online facilities and a credit card; Online using Council website – www.pirie.sa.gov.au; Mail a cheque to PO Box 45, Port Pirie, 5540; In person using EFTPOS, cheque or cash at the administration office, Ellen St, Port Pirie
available Monday to Friday from 9am to 5pm In person using EFTPOS or cheque at the Library at Crystal Brook available Monday to
Friday from 10am to 4pm. Late Payment of Rates * The Local Government Act provides for Councils to impose a penalty of a 2% fine on any payment for rates, whether due by instalment or otherwise that are unpaid after the due date. A payment that continues to be in arrears is then charged penalty interest at an interest rate, set each year according to a formula in the Act, for each month it continues to be late. Penalty fines allow the Council to recover some of the administration costs that arise because rates were not received by the due date. *The rate is set by legislation and is reviewed each year in June. Rebate of Rates The Local Government Act requires Councils to rebate the rates payable on certain land-use types. Specific provisions are made in the Act for land used for health services, community services, religious purposes, public cemeteries, the Royal Zoological Society and educational institutions.
Page 34

Port Pirie Regional Council Business Plan 2017/18 – 2019/20
Rate Concessions The rates concessions have changed. Concessions for Community Wastewater Management Scheme will be provided by council on the principal place of residence. The State Government has changed the concessions for general rates. They will make the payment of a ‘cost of living’ allowance which will be paid directly to pensioners and concession card holders, to replace the former rates concession. The payment is administered by State agencies who will determine eligibility. Further information is available from the Department of Communities and Social Inclusion on 1800 307 758 or by visiting the website http://www.dcsi.sa.gov.au Exemption from Rates Section 147(2) of the Local Government Act 1999 specifies those types of public properties that are exempt from rates. Section 147(2)(f) of the Local Government Act 1999 specifies that land occupied or held by the Council, except land held from a Council under a lease or licence, is exempt from rates. Some community owned land that is operated under lease or licence may be eligible for rates exemption subject to the requirements of the Recreational Grounds Act. Postponement of Rates for State Seniors Card Holders Section 182A of the Local Government Act 1999 provides for the option for State Seniors Card Holders to postpone part of the rates on a long term basis. A deferred amount is subject to a monthly interest charge with the accrued debt being payable on the disposal or sale of the property. Applications are subject to the same conditions as deferral or postponement of rates. Remission of Rates Section 182 of the Local Government Act permits the Council, on the application of a ratepayer, to partially or wholly remit rates or to postpone payment of rates, on the basis of hardship. The Council has a strategy that where the payment of rates will cause a ratepayer demonstrable hardship, the Council is prepared to make extended payment provisions or defer the payment of rates. Such inquiries are treated by Council as confidential. Sale of Land for Non-payment of Rates The Local Government Act provides that a Council may sell any property where the rates have been in arrears for three years or more. The Council is required to notify the owner of the land of its intention to sell the land, provide the owner with details of the outstanding amounts, and advise the owner of its intention to sell the land if payment of the outstanding amount is not received within one month. Except where extraordinary circumstances can be demonstrated, the Council will enforce the sale of land where rates remain unpaid. Further information For further information refer to the Rates Policy available from the Council website.
Page 35
Port Pirie Regional Council Business Plan 2017/18 – 2019/20
RATING STRATEGY – 2017/18 PROPERTY RATES Overview Rates are a major income source to support the delivery of the many Council services and activities. Periodically Council will review its approach to the setting of property rates, particularly as part of the preparation of the Annual Business Plan and Budget and also when reviewing Strategic long term plans. In 2016 Council decided that future rate increases will be both reasonable and consistent across all land use types. This follows the completion of the previous Rating Strategy which contained a number of changes in the rating structure. Council will also continue to actively seek alternate funding sources in an effort to reduce the impact of the rate burden. Purpose of Rates Each year Council seeks to raise an amount in general rate income, including the waste management service charge that will provide a level of funding to enable Council to meet all of its operating expenses and to make a significant contribution towards the capital works program. The Local Government Act 1999 provides for a Council to raise income to be spent for the purposes of its operations. Chapter 10 of the Act describes the requirements for the setting of property rates. A Council is also able to raise a separate rate for specific areas of the Council or a service rate or charge for any specific service. Previous rating strategy In 2013, Council conducted a review of its rating structure, which resulted in a reduction of the business differential rate in the dollar and an increase to primary production rates in the dollar to 80% of the residential rate. In addition, the ‘Other’ differential rate was reduced to align with the Residential rate, resulting in reduced rates for many sporting and community groups.
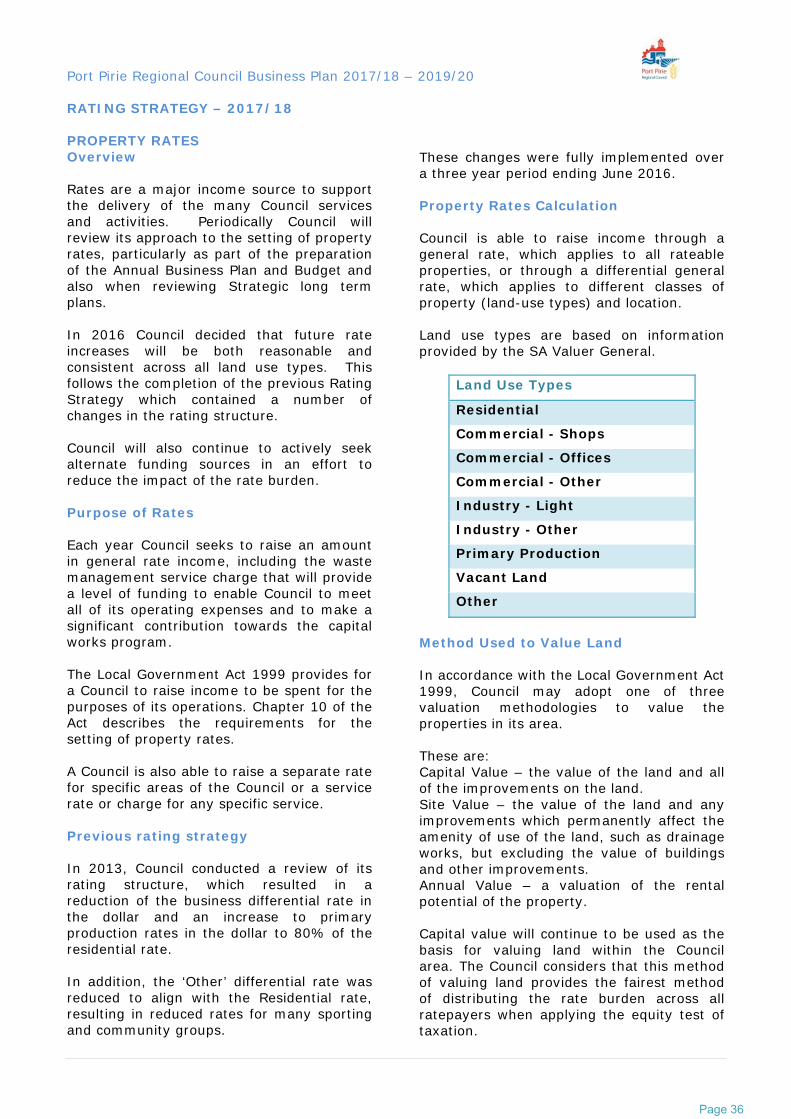
These changes were fully implemented over a three year period ending June 2016. Property Rates Calculation Council is able to raise income through a general rate, which applies to all rateable properties, or through a differential general rate, which applies to different classes of property (land-use types) and location. Land use types are based on information provided by the SA Valuer General.
Land Use Types
Residential
Commercial - Shops
Commercial - Offices
Commercial - Other
Industry - Light
Industry - Other
Primary Production
Vacant Land
Other
Method Used to Value Land In accordance with the Local Government Act 1999, Council may adopt one of three valuation methodologies to value the properties in its area. These are: Capital Value – the value of the land and all of the improvements on the land. Site Value – the value of the land and any improvements which permanently affect the amenity of use of the land, such as drainage works, but excluding the value of buildings and other improvements. Annual Value – a valuation of the rental potential of the property. Capital value will continue to be used as the basis for valuing land within the Council area. The Council considers that this method of valuing land provides the fairest method of distributing the rate burden across all ratepayers when applying the equity test of taxation.
Page 36

Port Pirie Regional Council Business Plan 2017/18 – 2019/20
The valuation method adopted also takes into account the locality of property and accessibility to facilities and services. Impact of Rating Council considers the impact of rate increases on residential, business, including manufacturing and retail, service industry and primary production sectors. It takes into account the goals of the strategic community plan, comments received from community consultation and the current economic conditions. Changes in the valuation of different types of properties, and the equity balance of the distribution of the rate burden are reflected in the Council decision to set a differential general rate based on the land-use types across the entire council area. Setting of Rates In setting the rates, Council considers a number of matters including the: service delivery needs and related
expenditure priorities in relation to the Strategic Plan, community needs, and Federal and State grants received;
need for an ongoing sustainable capital works program to renew and upgrade essential infrastructure assets;
amount and type of resources required to deliver Council services;
impact of rate increases on the community, including householders, businesses and primary producers;
the broad principle that the rate in the dollar should be the same for all properties except where there is clearly a different level of services available to ratepayers or some other circumstance to consider a variation;
minimising the level of general rates by setting fees and charges for council goods and services, on a user pays basis, where it is possible to recover the full cost of operating or providing the service or goods, with provision for concessions to those members of the community unable to meet the full cost;
increase or decrease in the capital values of properties.
Fixed Charge and Differential General Rates Council has decided to apply differential rating strategies across the council area. Property rates for individual properties comprise of a fixed charge plus an amount calculated by multiplying the rating factor (determined by Council) by the capital value of the property (determined by the Valuer-General.) The fixed charge component of individual property rates will continue to provide 33% of the total rate income by equal contribution. The remaining 67% is provided through the differential rates in the dollar. In recognition of the variation in the level of services provided or available to occupiers of the different land-use categories and locations throughout Council’s area, a differential rating factor has been applied. In setting the variable rate, Council is mindful to apply consistency across all assessments, and to ensure that the rate burden does not shift significantly from one sector to another. Council has decided to apply the following differential rating strategies across the entire area, according to principal use of the land: the assumption that residential properties
represent the majority number of properties (75%) and that any other categories should be calculated as a percentage of this ‘base rate’.
acknowledgement that businesses can
generate a greater relative consumption of Council’s infrastructure and services, therefore being a greater draw on Council’s resources.
A differential rate of 200% of the base rate is applicable for Commerce and Industry. Acknowledgement of the economic and social importance of primary production to the district and therefore to support its long term viability. A differential rate of 80% of the base rate is applicable for Primary Production property.
Page 37

Port Pirie Regional Council Business Plan 2017/18 – 2019/20
Acknowledgement that vacant land can incur a significant holding cost for constructed infrastructure (above what valuations would produce), to encourage its development or sale and to recover a meaningful contribution towards the provision of community facilities and services, a differential rate of 200% of the base rate is applicable for Vacant property. Other land generally includes properties owned by community groups and sporting associations, many of which are eligible and receive rebates from Council. A differential rate of 100% of the base rate is applicable for Other property.
SERVICE CHARGES Waste Management Service Charge (WMSC) Council has a three bin waste collection service for all residential properties. Council is required to recover no more than the actual cost of providing the service. A number of rural properties will receive a discounted charge where their property access point is more than 500 metres from their bin collection point. Rebates will be automatically applied to these properties. NB: Many commercial properties have voluntarily participated in the new collection service and are invoiced through Council’s debtor system, with no impact on rates.
Community Wastewater Management Schemes Council provides effluent disposal systems to residential and commercial properties in Crystal Brook and Napperby. The full cost of operating and maintaining the service is recovered through a charge for each property to which the service is available, including non-rateable properties. The following charging principles apply: CWMS systems to be assessed
independently, as each is of a different type and age;
total charges will reflect the average annual cost of operations (including depreciation);
charges on vacant properties will be 75% of occupied properties, reflecting pump out cost recovery from occupied properties;
ongoing Napperby irrigation costs be treated as general Council and not CWMS cost.
any surplus of income over expense is kept in a dedicated reserve account for future scheme replacement or upgrades.
Natural Resources Management Levy The Natural Resource Management Act 2004 requires Council to raise a levy on behalf of the Northern and Yorke Natural Resources Management Board. This levy is shown separately on the rates notice.
Council is required to raise the levy amount on each property and it recovers this amount by applying a ‘rate in the dollar’ against the capital value of every property in the area. Council does not retain this income, nor determine how the income is spent.
Page 38
Port Pirie Regional Council Business Plan 2017/18 – 2019/20
Long Term Financial Plan 2017-27 A revised Long Term Financial Plan 2017-27 has been prepared and a summary is attached to the Business Plan. The Long Term Financial Plan is one of several key documents that form the long term planning suite:
Community Strategic Plan Asset Management Strategy and Plans Capital Works Program
The objectives of the Long Term Financial Plan are:
1. To achieve and maintain an Operating Surplus Aim for a breakeven operating position in the short to medium term. In the longer term, seek to achieve and maintain consistent operating surpluses to reduce and eventually eliminate the need for regular borrowing to fund new assets and asset backlogs.
2. To fund Existing Asset Renewal/Replacement Target an average Asset Sustainability Ratio of 100% (measured against the planned Capital works program). This would mean that the existing assets are being renewed and replaced to maintain the existing services levels.
3. To review New Asset Requirements Identify and include priority new works, including a number of major projects to be primarily funded by grants and future operating surpluses.
4. To reduce Reliance on Borrowing Provide for new loans for major capital projects until the operating surpluses can be achieved to fund the capital program.
5. Achieving the Plan The success of the Plan is totally reliant on ongoing consistency with its objectives. The level of adherence to the plan is reviewed annually at the end of each year, when preparing the Budget and at each budget review to identify any issues which could impact on the successful achievement of the Plan.
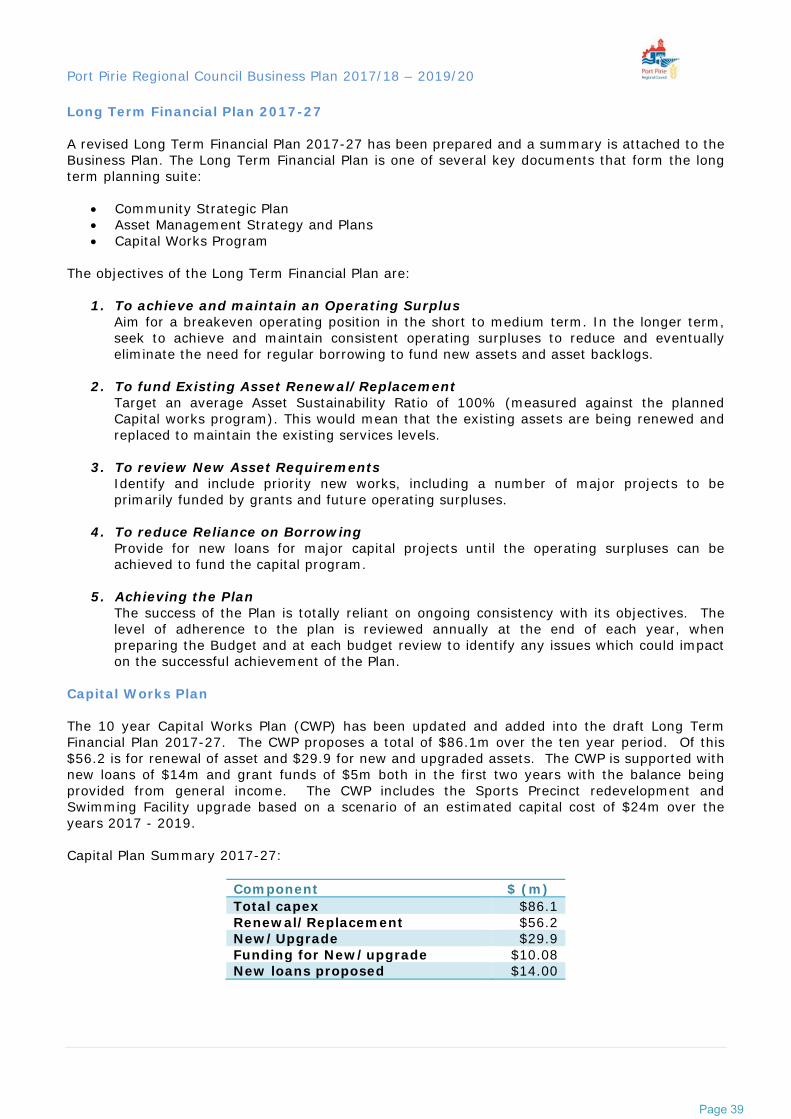
Capital Works Plan The 10 year Capital Works Plan (CWP) has been updated and added into the draft Long Term Financial Plan 2017-27. The CWP proposes a total of $86.1m over the ten year period. Of this $56.2 is for renewal of asset and $29.9 for new and upgraded assets. The CWP is supported with new loans of $14m and grant funds of $5m both in the first two years with the balance being provided from general income. The CWP includes the Sports Precinct redevelopment and Swimming Facility upgrade based on a scenario of an estimated capital cost of $24m over the years 2017 - 2019. Capital Plan Summary 2017-27:
Component $ (m) Total capex $86.1 Renewal/Replacement $56.2 New/Upgrade $29.9 Funding for New/upgrade $10.08 New loans proposed $14.00
Page 39

Port Pirie Regional Council Business Plan 2017/18 – 2019/20
Long Term Financial Plan 2017 – 2027 Capital Works Plan (cont’d) There are also a number of unfunded projects which will require further investigation of partnership funding, detailed costing and the expected Council contribution. The decisions about including these in the LTFP will need to consider all aspects and the influence on the future financial sustainability. Landfill liability The remediation of the Port Pirie landfill site consistent with the Environmental protection Authority approved Closure Plan will be primarily complete in 2017/18 with some minor work in 2018/19. The ongoing monitoring of the site will be an operation expense. Proposed expenditure to complete the landfill program is: 2017/18 - $0.994m 2018/19 - $0.046m Loans Borrowing options include overdraft, fixed term or combination of arrangements. The amounts used in the LTFP are based on fixed term loans due to the low cost of funds at present. The LTFP requires borrowings of $14m during the first two years. It is proposed that there will be a loan of $10 over 15 years in 2017/18 and a second loan in 2018/19 of $4m over 10 years. All the funds will be directed towards the Port Pirie Sport Precinct redevelopment and all the repayments of principal and interest payments are included in the LTFP over the proposed period of the loans. Interest payments are shown in operating expenses. In 2017/18 the Loan repayments of $0.6m represent 3.5% of total rate income which is well within an acceptable level of manageable debt and one of the lower amounts in the sector. A review of the current debt position shows that from 2023 there is capacity to borrow funds for new capital works. The strategy of the long term plan is to reduce the need for new borrowings by funding future renewal/replacement capital works from the operating surplus. Reserves Council maintains several reserve funds for specific purposes. These include:
Community Wastewater Management Scheme (CWMS) Reserves hold unspent rates paid by Crystal Brook and Napperby ratepayers to provide for maintenance programs, repairs and capital upgrades and replacements.
Fisherman’s Wharf Reserve holds mooring fees used to provide future capital works to this
area.
Asset Revaluation Reserve is an unfunded record of changes in the fair value of Council’s fixed assets.
Financial Indicators – Financial Sustainability The financial performance of the council business is monitored by three key indicators. Target ranges for each of these indicators are set in the Long Term Financial Plan.
Page 40

Port Pirie Regional Council Business Plan 2017/18 – 2019/20
Financial Indicators – Financial Sustainability (cont’d) Operating Surplus Ratio The Operating Surplus Ratio expresses the operating surplus (or deficit) as a percentage of Total Income. Commencing with a small positive result the position declines to -2% in 2018/19 and then improves to -1% 2019/20. From 2020/21 the ratio is positive and continues with a steady increase providing surpluses which fund the CWP. Net Financial Liabilities Net financial liabilities are calculated as the difference between amounts owed and amounts held. The Net Financial Liabilities Ratio measures the net financial liability amount against total operating income. Borrowing is an important strategy for Council to fund new assets. Responsible debt management in for long term should demonstrate assessment of the impact on financial performance. A measure of 40% is a reasonably accepted sector result. In 2017/18 the financial liabilities are expected to increase to $13.2million and this will give a ratio of 57% as it includes the proposed new loan of $10million. The “net debt” peaks at 67% in 2018/19 and then reduces from this point to below 0% by 2025. As the ratio declines, this means that there is capacity to take out new loans to fund capital works in the later years of the LTFP when the ratio moves into negative result. Asset Sustainability Ratio The Asset Sustainability Ratio measures the extent to which existing assets are being renewed or replaced, compared to the planned Capital works in the Asset Management Plan/s. If the capital expenditure budget for the renewal or replacement of existing assets matches that projected in the Asset Management Plan/s, then the ratio will be 100%. If the ratio is less than 100% for any extended period, this will lead to a deterioration of asset condition over time, leaving future generations of ratepayers to fund high asset maintenance and replacement to restore the asset service level. The ratio increases to 113% in 2017/18 due the increase in the road renewal program and the renewal components of the Sports precinct project. The ratio declines in 2020 then stabilises within the target range for the remainder of the LTFP. The development of the Asset Management Strategy and updated Asset Management Plans will continue to improve the forward planning. Business Operations The Operations income and expenses reflect continuing service provision with adjustments for known circumstance changes and influences. It is proposed that the intent of the Rating Strategy will continue with consistent increases proposed for the term of the LTFP. Total Rate Income is planned to increase by 5% each year with increases in other income and expenses categories from 0 – 5% each year over the period of the LTFP. Grants have been adjusted to reflect the indexing of the Financial Assistance Grants and the cessation of the Roads to Recovery grant program in 2019/20. From 2019/20 the Operating expenses include an estimation of ongoing expenses for the Port Pirie Sport Precinct known increase for employee costs and estimated increases in other expenses.
Page 41

Port Pirie Regional Council Business Plan 2017/18 – 2019/20
Port Pirie Regional Council
Phone Number
(08) 8633 9777
Postal Address
PO Box 45 Port Pirie SA 5540
Street Address
115 Ellen Street Port Pirie SA 5540
Page 42

2017/18 2018/19 2019/20
$'000 $'000 $'000
Income 25,157 26,127 26,597
less Expenses 25,035 26,466 26,947
122 (339) (350)
less Net Outlays on Existing Assets
Capital Expenditure on renewal and replacement of Existing Assets 8,076 5,814 3,941
less Depreciation, Amortisation and Impairment 6,560 7,333 7,457
less Proceeds from Sale of Replaced Assets 230 290 200
1,286 (1,809) (3,716)
less Net Outlays on New and Upgraded Assets
Capital Expenditure on New and Upgraded Assets 12,251 5,363 1,320
less Amounts received specifically for New and Upgraded Assets 4,000 1,000 -
less Proceeds from Sale of Surplus Assets - - -
8,251 4,363 1,320
Net Lending / (Borrowing) for Financial Year (9,415) (2,893) 2,046
Operating Surplus Ratio 0% (2%) (1%)
Operating SurplusOperating Result / Total Operating Income
Operating Surplus Ratio (adjusted) 0% (2%) (1%)
Adjusted for Grant funds rec'd in advance
Net Financial Liabilities Ratio 58% 67% 57%
Net Financial LiabilitiesFinancial Liabilities less Financial Assets / Total Income
Asset Sustainability Ratio 113% 86% 58%
Net Asset RenewalsAsset Management Plan required expenditure
FINANCIAL INDICATORS
Port Pirie Regional Council
UNIFORM PRESENTATION OF FINANCES
Page 43

2017/18 2018/19 2019/20
$'000 $'000 $'000
INCOME
Rates - general 17,592 18,472 19,395
Statutory Charges 345 354 363
User Charges 1,526 1,602 1,682
Grants, subsidies and contributions 5,156 5,223 4,675
Investment Income 102 41 48
Reimbursements 415 415 415
Other Income 20 20 20
TOTAL INCOME 25,157 26,127 26,597
EXPENSES
Employee Costs 7,527 7,697 7,866
Materials, contracts & other expenses 10,785 10,829 10,874
Finance Charges 163 607 750
Depreciation, amortisation & impairment 6,560 7,333 7,457
TOTAL EXPENSES 25,035 26,466 26,947
Operating Surplus/(Deficit) before Capital Revenue 122 (339) (350)
CAPITAL REVENUE
Asset disposal & fair value adjustments -
Amounts received specifically for new or upgraded assets 4,000 1,000
NET SURPLUS/(DEFICIT) 4,122 661 (350)
transferred to Equity Statement
Other Comprehensive Income -
TOTAL COMPREHENSIVE INCOME 4,122 661 (350)
Port Pirie Regional Council
STATEMENT OF COMPREHENSIVE INCOME
Page 44

2017/18 2018/19 2019/20
$'000 $'000 $'000
ASSETS
Current Assets
Cash and cash equivalents 285 568 1,240
Trade and other receivables 840 840 840
Other 98 98 98
Total Current Assets 1,223 1,506 2,178
Non-current Assets
Financial Assets 241 183 124
Infrastructure, Property, Plant and Equipment 250,710 254,265 251,868
Other non-current assets 1,930 1,930 1,930
Total Non-Current Assets 252,881 256,378 253,922
TOTAL ASSETS 254,104 257,884 256,100
LIABILITIES
Current Liabilities
Trade and other payables 1,378 1,378 1,378
Borrowings 883 1,247 1,308
Provisions 1,159 1,113 1,113
Total Current Liabilities 3,420 3,738 3,799
Non-current Liabilities
Borrowings 12,314 15,067 13,759
Provisions 139 185 -
Total Non-Current Liabilities 12,453 15,252 13,759
TOTAL LIABILITIES 15,873 18,990 17,558
NET ASSETS 238,231 238,894 238,542
EQUITY
Accumulated Surplus 66,321 66,943 66,591
Asset Revaluation Reserve 171,152 171,152 171,152
Other Reserves 759 799 799
TOTAL EQUITY 238,231 238,894 238,542
Port Pirie Regional Council
STATEMENT OF FINANCIAL POSITION
Page 45

2017/18 2018/19 2019/20
$'000 $'000 $'000
CASH FLOWS FROM OPERATING ACTIVITIES
Receipts
Operating Receipts 25,054 26,086 26,549
Investment Receipts 102 41 48
Payments
Operating Payments to suppliers & employees (18,312) (18,196) (18,735)
Finance Payments (163) (607) (750)
Net Cash provided by (or used in) Operating Activities 6,681 7,324 7,112
CASH FLOWS FROM INVESTING ACTIVITIES
Receipts
Amounts specifically for new or upgraded assets 4,000 1000 -
Sale of Replaced Assets 230
Sale of Surplus Assets -
Repayments of loans by community groups 61 64 67
Payments
Expenditure on renewal/replacement of assets (8,076) (5,812) (3,940)
Expenditure on new/upgraded assets (12,250) (5,363) (1,319)
Expenditure on landfill provision (994) (46) -
Loans made to community groups -
Net Cash provided by (or used in) Investing Activities (17,029) (10,157) (5,192)
CASH FLOWS FROM FINANCING ACTIVITIES
Receipts
Proceeds from Borrowings 10,000 4000
Payments
Repayment of Borrowings (393) (883) (1,247)
Net Cash provided by (or used in) Financing Activities 9,607 3,117 (1,247)
Net Increase (Decrease) in cash held (741) 284 673
Cash & cash equivalents at beginning of period 1,026 285 569
Cash & cash equivalents at end of period 285 569 1,242
Port Pirie Regional Council
STATEMENT OF CASH FLOWS
Page 46

2017/18 2018/19 2019/20
$'000 $'000 $'000
Accumulated Surplus
Balance at end of previous reporting period 61,878 66,321 66,943
Net Surplus / (Deficit) for Year 4,122 661 (350)
Transfers (to) from reserves 321 (39) (1)
Balance at end of period 66,321 66,943 66,592
Asset Revaluation Reserve
Balance at end of previous reporting period 171,152 171,152 171,152
Revaluation Adjustments During Year -
Balance at end of period 171,152 171,152 171,152
Other Reserves
Balance at end of previous reporting period 775 759 799
Tranfers to (from) reserves (17) 40 -
Balance at end of period 759 799 799
TOTAL EQUITY
Balance at end of previous reporting period 233,805 238,231 238,894
Net Surplus / (Deficit) for Year 4,122 661 (350)
Revaluation Adjustments During Year - -
Transfers between reserves 304 2 (2)
Balance at end of period 238,231 238,894 238,542
Port Pirie Regional Council
STATEMENT OF CHANGES IN EQUITY
Page 47

Port Pirie Regional Council: LTFP Financial Indicators 2017-2027
Scenario $24m: Sporting Precinct $24m Capital; $10m Grant, $14m Loan ($10m over 15yr + $4m over 10yr)Depreciation +$550k/year from 2019Operating +$250k/year from 2019
Water Reuse: $2m ($1m grant) removed from 2022
Assumptions 2017 2018 2019 2020 2021 2022 2023 2024 2025 2026 2027
Capital Renewal $5,755 $8,076 $5,814 $3,941 $5,128 $5,245 $6,045 $5,758 $5,376 $5,386 $5,473
Capital New $5,728 $12,251 $5,363 $1,320 $1,665 $1,885 $670 $1,728 $1,855 $1,489 $1,640
Capital Total $11,483 $20,327 $11,177 $5,261 $6,793 $7,130 $6,715 $7,485 $7,231 $6,875 $7,113
Rate Inc. (inclu CPI) 5% 5% 5% 5% 5% 5% 5% 5% 5% 5% 5%
New Loans $0.0 $10.0 $4.0 $0.0 $0.0 $0.0 $0.0 $0.0 $0.0 $0.0 $0.0
-4%
-2%
0%
2%
4%
6%
8%
10%
12%
14%
16%
18%
2017 2018 2019 2020 2021 2022 2023 2024 2025 2026 2027
Operating Surplus Ratio
LTFP Projected Max Target Min Target
-60%
-40%
-20%
0%
20%
40%
60%
80%
100%
120%
2017 2018 2019 2020 2021 2022 2023 2024 2025 2026 2027
Net Financial Liabilities Ratio LTFP Projected Max Target Min Target
0%
20%
40%
60%
80%
100%
120%
140%
2017 2018 2019 2020 2021 2022 2023 2024 2025 2026 2027
Asset Sustainability Ratio
LTFP Projected Max Target Min Target
Page 48
Port Pirie Regional Council - Policy Manual (Governance) 1
Port Pirie Regional Council
RATES POLICY Type Governance
Category Corporate & Community
Responsible Officer Director Corporate & Community
First Issued / Adopted January 2009
Review Period Annually
Last Reviewed 27 January 2016
23 April 2014
Minutes Reference OM17/16
Next Review Date 31 December 2017
Applicable Legislation Local Government Act 1999, Local Government (Financial Management) Regulations 2011, Local Government (General) Regulations 2013
Related Documents Nil
Public Consultation Required Annually with Annual Business Plan
File Reference 605.84
Purpose To provide legislative requirements and policy guidelines for the setting of rates every year.
1. COUNCIL’S DUTIES AND POWERS
Council’s powers to raise rates are found in Chapter 10 of the Local Government Act 1999 (“the Act”). The Act provides the framework within which the Council must operate, but also leaves room for the Council to make a range of policy choices. This document includes compulsory features of the rating system, as well as the policy choices that the Council has made on how it imposes and administers the collection of rates.
All land within a Council area, except for land specifically exempt (e.g. Crown Land, Council occupied land and a few other limited categories) is rateable.
Rates are not a fee for services. They constitute a system of taxation for Local Government purposes. Local Government functions are defined broadly in the Act. All systems of taxation try to balance various principles of taxation.
Page 49
Port Pirie Regional Council - Policy Manual (Governance) 2
RATES POLICY
1. COUNCIL’S DUTIES AND POWERS (Cont’d)
In addition to general rates, Council also raises revenue through:
Compulsory service charges on residential ratepayers for waste collection and disposal;
Compulsory service charges on properties serviced by the community wastewater management scheme at Crystal Brook and Napperby;
User charges (eg waste disposal, cemetery fees, leases and rentals); and
Statutory charges (eg development fees, dog registrations, parking expiations).
2. PRINCIPLES OF TAXATION
This Policy represents the Council’s commitment to balancing the five main principles of taxation:
a) Benefits received. (i.e. services provided, or resources consumed). Reliance on this principle suggests that (all other things being equal) a person who received more benefits should pay a higher share of tax.
b) Capacity to pay. This principle suggests that a person who has less capacity to
pay should pay less; and that persons of similar means should pay similar amounts.
c) Administrative simplicity. This principle refers to the costs involved in applying
and collecting the tax and how difficult it is to avoid.
d) Economic efficiency. This refers to whether or not the tax distorts economic behaviour.
e) Policy consistency. The principle that taxes should be internally consistent, and
based on transparent, predictable rules that are understandable and acceptable to taxpayers.
3. VALUATION OF LAND
Council is permitted to adopt one of three valuation methodologies to value the properties in its area. They are:
Capital Value – the value of the land and all of the improvements on the land.
Site Value – the value of the land and any improvements which permanently affect the amenity of use of the land, such as drainage works, but excluding the value of buildings and other improvements.
Annual Value – a valuation of the rental potential of the property.
Page 50

Port Pirie Regional Council - Policy Manual (Governance) 3
RATES POLICY
3. VALUATION OF LAND (Cont’d)
Council has decided to continue to use capital value as the basis for valuing land. Council considers that this method provides the fairest way to distribute the rate burden across all ratepayers on the following basis:
the ‘capacity to pay’ principle of taxation requires that ratepayers of similar wealth pay similar taxes and ratepayers of greater wealth pay more tax than ratepayers of lesser wealth;
property value is a relatively good indicator of wealth (when lifetime incomes, including incomes from capital gains, are taken into account). Capital value, which closely approximates the market value of a property, provides the best indicator of overall property value.
Council has a choice whether to employ its own valuers, or accept the valuations made by the Valuer-General; i.e. the State Valuation Office. Council adopts the valuations made by the State Valuation Office as provided to the Council each year.
Objections to valuations may be made to the State Valuation Office. The Council has no role in this process. The lodgement of an objection does not change the due date for the payment of rates.
Certain properties may be eligible for a “notional value” under the Valuation of Land Act 1971. This may apply if the property is the ratepayer’s principal place of residence, and its value is enhanced by unrealised subdivision potential or a different potential land use. A notional value is generally less than the capital value and therefore would result in reduced rates. An application for a notional value must be made to the State Valuation Office.
A notional value will stay with the property until any of the conditions are no longer relevant to the property. (e.g. the owner sells the property to an investor who then rents the property out, therefore the property is then not being used as a primary place of residence so its no longer applicable for a notional value)
4. COMPONENTS OF RATES
4.1 A Rate in the Dollar
The largest component of rates is the component that is calculated by reference to the value of the land. Every year, the Council officially “declares” what percentage of the value of land will be payable in rates. The Act allows councils to impose rates that differ (i.e. higher or lower) based on the location of land, or the uses to which the land is put (residential, commercial, primary production, industrial, vacant, etc).
Property values reflect, among other things, the relative availability of and access to Council services. This applies to all types of land use, and to land in all locations.
Page 51

Port Pirie Regional Council - Policy Manual (Governance) 4
RATES POLICY
4. COMPONENTS OF RATES
4.1 A Rate in the Dollar (Cont’d)
Council has decided to apply the following differential rating strategies across the entire district, according to principal use of the land:
Council’s differential rating structure is based on the assumption that residential properties represent the majority number of properties (75%) and that other categories should be calculated as a percentage of this “base rate”.
Council acknowledges that businesses can generate a greater relative consumption of Council’s infrastructure and services, therefore being a greater draw on Council’s resources. A differential rate of 200% of the base rate has been adopted for this land use category.
A higher rate in the dollar is applied for Nyrstar and associated smelters properties, given the unique nature of these properties, and a degree of subjectivity as to their capital values. Council seeks to recover about 8% of the Council’s total rate revenue from these properties.
Council acknowledges the economic and social importance of primary production to the district and therefore to support its long term viability. A differential rate of 80% of the base rate has been adopted for this land use category.
Council acknowledges that vacant land can incur a significant holding cost for constructed infrastructure (above what valuations would produce) and seeks to encourage its development or sale. A differential rate of 200% of the base rate has been adopted for this land use category.
Other land generally includes properties owned by community groups and sporting associations, many of which are eligible and receive rebates from Council. A differential rate of 100% of the base rate has been adopted for this land use category.
These differentials were adopted following public consultation of the 2013 Rating Review.
4.2 Fixed Charge
Council has the discretion to apply either:
a fixed charge (applying equally to all rateable properties); or a minimum rate (to lower-value properties) (or neither) but cannot use both of these mechanisms.
To the extent that many (though not all) Council services are provided and available relatively uniformly to all ratepayers, and that property values vary because of a range of factors (not just the relative extent of Council services) the Council considers it is equitable, from the perspective of the benefit principle, to recover the costs of such services by way of a uniform fixed charge, set at an appropriate level. However, applying the benefit principle exclusively would not take account of the capacity to pay principle.
Page 52

Port Pirie Regional Council - Policy Manual (Governance) 5
RATES POLICY
4. COMPONENTS OF RATES
4.2 Fixed Charge (Cont’d)
Council has discretion to collect up to 50% of its general rate revenue from a fixed charge.
Accordingly, to appropriately balance both the benefit principle and the capacity to pay principle, the Council’s policy is to limit the amount collected by a fixed charge to approximately 33% of general rate revenue. The amount of the fixed charge is clearly indicated on the rates notice.
4.3 Service Charges
The Act allows Councils to apply a charge to ratepayers to recover the cost of dedicated services provided to specific properties. The use of such a charge is appropriate whenever beneficiaries can be identified and it is practical to do so. It helps service recipients appreciate costs involved and provide feedback on value to service providers. It also means that properties that don’t receive the service aren’t paying higher taxes to help fund its provision to others.
4.3.1 Community Wastewater Management Scheme (CWMS)
All Councils that provide CWMS services, levy affected properties with a charge to recover the actual operating and maintenance costs for the scheme, in addition to making provision for future upgrades and development.
Charges are made to both rateable and non-rateable properties in Crystal Brook and Napperby townships, according to the number of services connected to a property. A reduced amount is charged for vacant properties within the service area.
Any amounts recovered but unspent in any year are retained by Council in a dedicated reserve fund, from which future costs of the services will be recovered.
The annual service charge amount is reviewed annually in conjunction with a review of the long term operating, maintenance and replacement of each system.
4.3.2 Waste Management Service Charge
Many Councils directly charge residential ratepayers for their kerbside waste collection services. The total amount recovered must not exceed the cost of providing the service. The charge is reviewed annually against the cost to provide the service.
NB: Commercial properties have voluntarily participated in the collection service and are invoiced through Council’s debtor system, with no impact on rates.
Properties may receive a discounted charge where their property access point is more than 500 metres from their bin collection point. These rebates are applied automatically against these properties.
Page 53

Port Pirie Regional Council - Policy Manual (Governance) 6
RATES POLICY
4. COMPONENTS OF RATES (Cont’d)
4.4 Natural Resources Management Levy
Council is required under the Natural Resources Management Act 2004 to make a specified contribution to the Northern and Yorke Natural Resources Management Board. It does so by applying a rate in the dollar against the capital value of every property .
This separate rate is effectively a State tax that Councils are required to collect, and return to a State Government agency, the local NRM Board. Even though it appears on the Council’s rates notice, enquiries about this component should be directed to the Northern and Yorke Natural Resources Management.
5. HELP WITH RATES
5.1 Concessions
The State Government has introduced the payment of a ‘cost of living’ allowance which will be paid directly to pensioners and concession card holders, and replaces the previous pensioner concession amount which was deducted from rates. The payment will be administered by State agencies who will determine eligibility.
Community Wastewater Management Scheme concessions will continue to be provided on a principal place of residence.
A concession may be provided if the ratepayer is:
a pensioner and have a current Pensioner Concession Card or Department of Veteran’s Affairs (DVA) Gold Card (TPI, EDA, WW) or receive a Centrelink Allowance.
a Self Funded Retiree who holds a State Seniors card.
a low income earner, or unemployed person who meets the DCSI low income threshold.
Ratepayers awaiting the outcome of an application for one of these concessions should not delay in paying the rates, as penalties apply for late payment.
5.2 Remission of Rates
Council has a discretion to partially or wholly remit (i.e. waive) rates on the basis of financial hardship.
5.3 Postponement of Rates
Holders of a State Seniors Card are eligible (under certain conditions) to postpone on a long‐term basis, a large component of the rates on their principal pace of residence. The postponed amount is subject to a monthly interest charge, with the accrued debt falling due for payment only when the property is sold or transferred to someone else.
Page 54
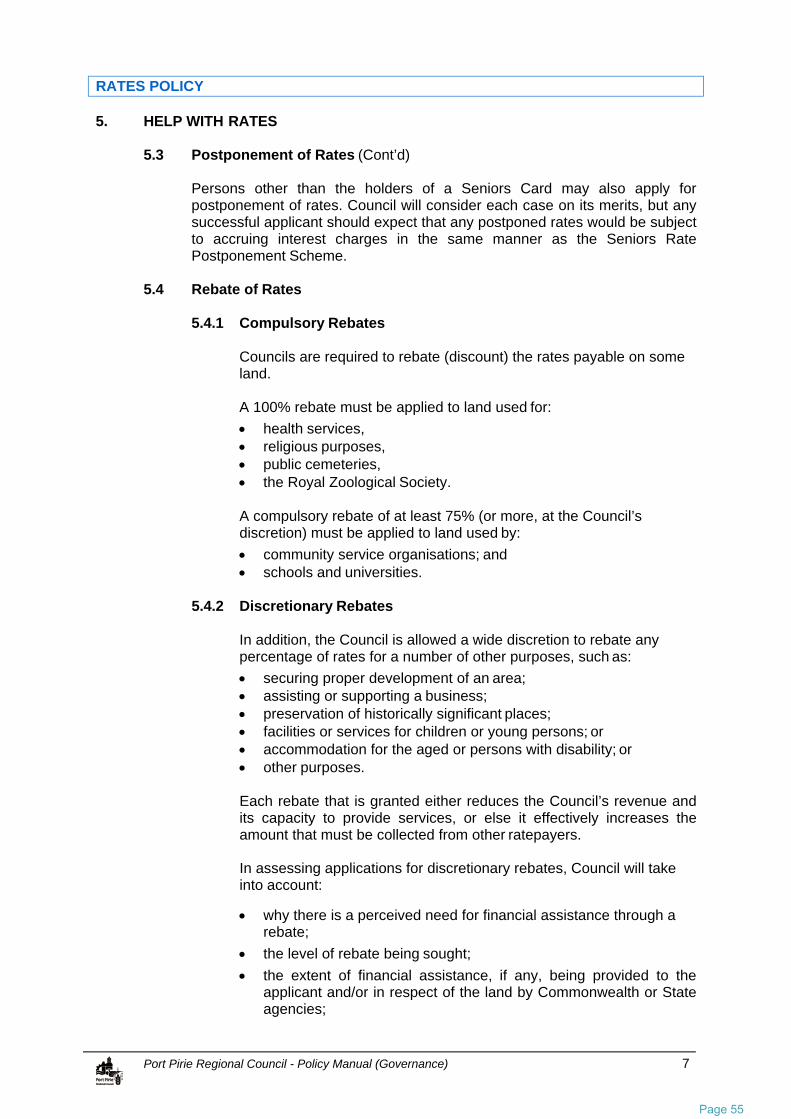
Port Pirie Regional Council - Policy Manual (Governance) 7
RATES POLICY
5. HELP WITH RATES
5.3 Postponement of Rates (Cont’d)
Persons other than the holders of a Seniors Card may also apply for postponement of rates. Council will consider each case on its merits, but any successful applicant should expect that any postponed rates would be subject to accruing interest charges in the same manner as the Seniors Rate Postponement Scheme.
5.4 Rebate of Rates
5.4.1 Compulsory Rebates
Councils are required to rebate (discount) the rates payable on some land.
A 100% rebate must be applied to land used for:
health services, religious purposes, public cemeteries, the Royal Zoological Society.
A compulsory rebate of at least 75% (or more, at the Council’s discretion) must be applied to land used by:
community service organisations; and schools and universities.
5.4.2 Discretionary Rebates
In addition, the Council is allowed a wide discretion to rebate any percentage of rates for a number of other purposes, such as:
securing proper development of an area; assisting or supporting a business; preservation of historically significant places; facilities or services for children or young persons; or accommodation for the aged or persons with disability; or other purposes.
Each rebate that is granted either reduces the Council’s revenue and its capacity to provide services, or else it effectively increases the amount that must be collected from other ratepayers.
In assessing applications for discretionary rebates, Council will take into account:
why there is a perceived need for financial assistance through a rebate;
the level of rebate being sought;
the extent of financial assistance, if any, being provided to the applicant and/or in respect of the land by Commonwealth or State agencies;
Page 55
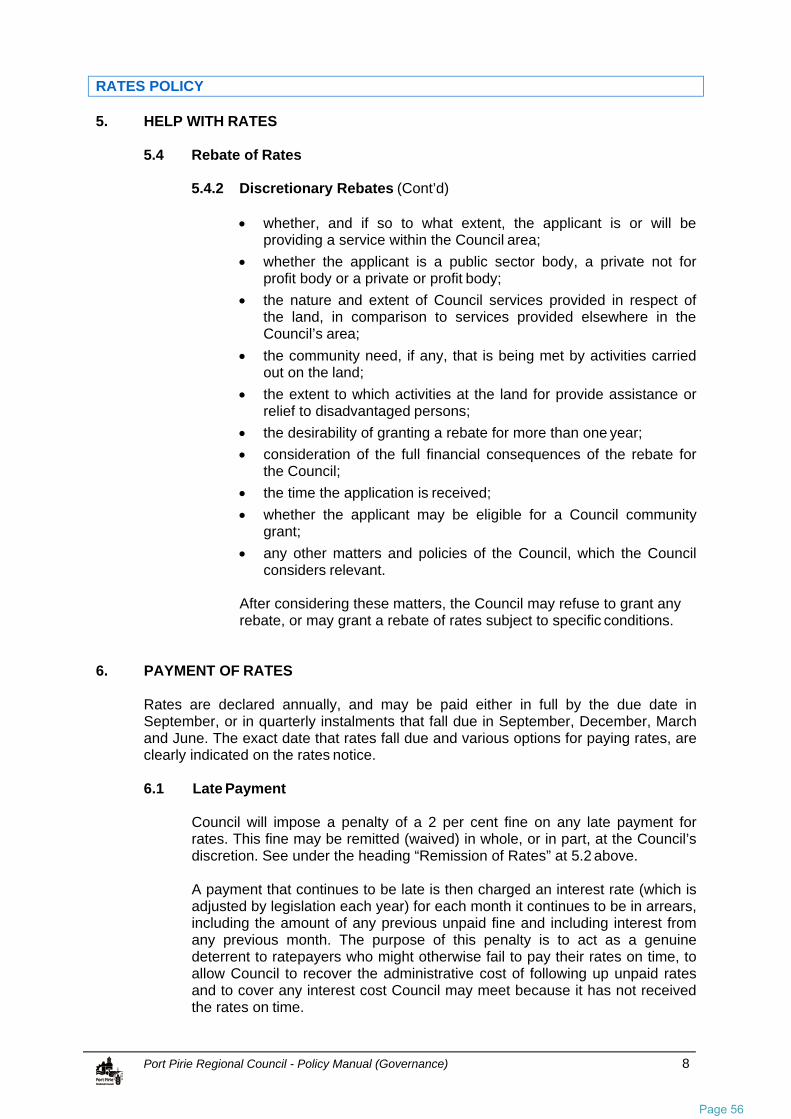
Port Pirie Regional Council - Policy Manual (Governance) 8
RATES POLICY
5. HELP WITH RATES
5.4 Rebate of Rates
5.4.2 Discretionary Rebates (Cont’d)
whether, and if so to what extent, the applicant is or will be providing a service within the Council area;
whether the applicant is a public sector body, a private not for profit body or a private or profit body;
the nature and extent of Council services provided in respect of the land, in comparison to services provided elsewhere in the Council’s area;
the community need, if any, that is being met by activities carried out on the land;
the extent to which activities at the land for provide assistance or relief to disadvantaged persons;
the desirability of granting a rebate for more than one year;
consideration of the full financial consequences of the rebate for the Council;
the time the application is received;
whether the applicant may be eligible for a Council community grant;
any other matters and policies of the Council, which the Council considers relevant.
After considering these matters, the Council may refuse to grant any rebate, or may grant a rebate of rates subject to specific conditions.
6. PAYMENT OF RATES
Rates are declared annually, and may be paid either in full by the due date in September, or in quarterly instalments that fall due in September, December, March and June. The exact date that rates fall due and various options for paying rates, are clearly indicated on the rates notice.
6.1 Late Payment
Council will impose a penalty of a 2 per cent fine on any late payment for rates. This fine may be remitted (waived) in whole, or in part, at the Council’s discretion. See under the heading “Remission of Rates” at 5.2 above.
A payment that continues to be late is then charged an interest rate (which is adjusted by legislation each year) for each month it continues to be in arrears, including the amount of any previous unpaid fine and including interest from any previous month. The purpose of this penalty is to act as a genuine deterrent to ratepayers who might otherwise fail to pay their rates on time, to allow Council to recover the administrative cost of following up unpaid rates and to cover any interest cost Council may meet because it has not received the rates on time.
Page 56

Port Pirie Regional Council - Policy Manual (Governance) 9
RATES POLICY
6. PAYMENT OF RATES
6.1 Late Payment (Cont’d)
Council issues a fines notice for payment of rates when rates are overdue i.e. unpaid by the due date. Should rates remain unpaid, debt collection will be commenced. This attracts additional fees that are recoverable from the ratepayer.
When Council receives a partial payment of overdue rates, the Council must apply the money as follows:
first – to satisfy any costs awarded in connection with court proceedings (if applicable);
second – to satisfy any interest costs; third – in payment of any fines imposed; fourth – in payment of rates, in chronological order (starting with the
oldest account first).
6.2 Sale of Land for Non-Payment of Rates
Council may sell any property where the rates have been in arrears for three years or more.
Council is required to notify the owner of the land of its intention to sell the land, provide the owner with details of the outstanding amounts, and advise the owner of its intention to sell the land if payment of the outstanding amount is not received within one month.
7. FURTHER INFORMATION
This policy will be available for inspection at the Council offices listed below during ordinary business hours and available to be downloaded, free of charge, from Council’s internet site: www.pirie.sa.gov.au
Port Pirie Council Administration Centre, 115 Ellen Street, Port Pirie Crystal Brook Rural Office, Bowman Street, Crystal Brook.
Copies will be provided to interested parties upon request, and upon payment of a fee in accordance with Council’s Schedule of Fees and Charges.
Page 57

FINANCIAL STATEMENTS AND FINANCIAL INDICATORS
Port Pirie Regional Council - Long Term Financial Plan 2017-27 (draft)
STATEMENT OF COMPREHENSIVE INCOME 2017 2018 2019 2020 2021 2022 2023 2024 2025 2026 2027
$'000 $'000 $'000 $'000 $'000 $'000 $'000 $'000 $'000 $'000 $'000
INCOME
Rates - general 16,883 17,592 18,472 19,395 20,365 21,383 22,453 23,575 24,754 25,992 27,291
Statutory Charges 344 345 354 363 372 381 391 401 411 421 431
User Charges 1,497 1,526 1,602 1,682 1,766 1,855 1,947 2,045 2,147 2,254 2,367
Grants, subsidies and contributions 5,250 5,156 5,223 4,675 4,743 4,813 4,884 4,956 5,029 5,103 5,178
Investment Income 93 103 41 48 66 68 88 175 245 351 534
Reimbursements and Other 669 435 435 435 435 435 435 435 435 435 435
TOTAL INCOME 24,736 25,157 26,127 26,597 27,748 28,935 30,198 31,586 33,021 34,555 36,236
EXPENSES
Employee Costs 7,384 7,527 7,697 7,866 8,036 8,293 8,539 8,822 9,144 9,466 9,790
Materials, contracts & other expenses 11,066 10,785 10,829 10,874 11,026 11,007 11,242 11,396 11,580 11,766 11,955
Finance Charges 182 163 607 750 693 633 571 506 451 392 340
Depreciation, amortisation & impairment 6,256 6,560 7,333 7,457 7,619 7,788 7,952 8,131 8,302 8,437 8,574
TOTAL EXPENSES 24,889 25,035 26,466 26,947 27,374 27,721 28,304 28,855 29,476 30,061 30,658
Operating Surplus/(Deficit) before Capital Income (153) 122 (339) (350) 374 1,214 1,894 2,732 3,544 4,494 5,578
CAPITAL INCOME
Asset disposal & fair value adjustments - - - - - - - - - - -
Amounts received specifically for new or upgraded assets 6,866 4,000 1,000 - - - 1,000 - - 1,000 250
TOTAL COMPREHENSIVE INCOME 6,713 4,122 661 (350) 374 1,214 2,894 2,732 3,544 5,494 5,828
Page 58

Port Pirie Regional Council - Long Term Financial Plan
STATEMENT OF FINANCIAL POSITION 2017 2018 2019 2020 2021 2022 2023 2024 2025 2026 2027
$'000 $'000 $'000 $'000 $'000 $'000 $'000 $'000 $'000 $'000 $'000
ASSETS
Current Assets
Cash and cash equivalents 1,263 285 568 1,240 1,318 2,025 4,936 7,288 10,821 16,929 23,213
Trade and other receivables 840 840 840 840 840 840 840 840 840 840 840
Other 98 98 98 98 98 98 98 98 98 98 98
Total Current Assets 2,201 1,223 1,506 2,178 2,256 2,963 5,874 8,226 11,759 17,867 24,151
Non-current Assets
Financial Assets 302 241 183 124 99 81 63 47 32 22 15
Infrastructure, Property, Plant and Equipment 237,174 250,710 254,265 251,868 250,882 250,064 248,657 247,841 246,600 244,867 243,234
Other 1,930 1,930 1,930 1,930 1,930 1,930 1,930 1,930 1,930 1,930 1,930
Total Non-Current Assets 239,406 252,881 256,378 253,922 252,911 252,075 250,650 249,818 248,562 246,818 245,179
TOTAL ASSETS 241,607 254,104 257,884 256,100 255,167 255,038 256,524 258,044 260,321 264,685 269,330
LIABILITIES
Current Liabilities
Trade and other payables 2,090 1,378 1,378 1,378 1,378 1,378 1,378 1,378 1,378 1,378 1,378
Borrowings 393 883 1,247 1,308 1,343 1,408 1,211 1,268 1,130 1,185 1,242
Provisions 2,123 1,159 1,113 1,113 1,113 1,113 1,113 1,113 1,113 1,113 1,113
Total Current Liabilities 4,606 3,420 3,738 3,799 3,834 3,899 3,702 3,759 3,621 3,676 3,733
Non-current Liabilities
Borrowings 2,707 12,314 15,067 13,759 12,416 11,007 9,796 8,527 7,397 6,212 4,971
Provisions 489 139 185 - - - - - - - -
Total Non-Current Liabilities 3,196 12,453 15,252 13,759 12,416 11,007 9,796 8,527 7,397 6,212 4,971
TOTAL LIABILITIES 7,802 15,873 18,990 17,558 16,250 14,907 13,498 12,287 11,018 9,888 8,703
NET ASSETS 233,805 238,231 238,894 238,542 238,917 240,131 243,024 245,757 249,303 254,797 260,626
EQUITY
Accumulated Surplus 61,878 66,320 66,943 66,592 66,966 68,140 70,928 73,661 77,006 82,298 87,924
Asset Revaluation Reserve 171,152 171,152 171,152 171,152 171,152 171,152 171,152 171,152 171,153 171,154 171,155
Other Reserves 775 759 799 799 799 839 944 944 1,144 1,345 1,547
TOTAL EQUITY 233,805 238,231 238,894 238,542 238,917 240,131 243,024 245,757 249,303 254,797 260,626
Page 59

Port Pirie Regional Council - Long Term Financial Plan
UNIFORM PRESENTATION OF FINANCES 2017 2018 2019 2020 2021 2022 2023 2024 2025 2026 2027
$'000 $'000 $'000 $'000 $'000 $'000 $'000 $'000 $'000 $'000 $'000
Income 24,736 25,157 26,127 26,597 27,748 28,935 30,198 31,586 33,021 34,555 36,236
less Expenses 24,889 25,035 26,466 26,947 27,374 27,721 28,304 28,855 29,476 30,061 30,658
(153) 122 (339) (350) 374 1,214 1,894 2,732 3,544 4,494 5,578
less Net Outlays on Existing Assets
Capital Expenditure on renewal/replacement of Existing Assets 5,755 8,076 5,814 3,941 5,128 5,245 6,045 5,758 5,376 5,386 5,473
less Depreciation, Amortisation and Impairment (6,256) (6,560) (7,333) (7,457) (7,619) (7,788) (7,952) (8,131) (8,302) (8,437) (8,574)
less Proceeds from Sale of Replaced Assets (122) (230) (290) (200) (160) (160) (170) (170) (170) (171) (172)
(623) 1,286 (1,809) (3,716) (2,651) (2,703) (2,077) (2,543) (3,096) (3,222) (3,273)
less Net Outlays on New and Upgraded Assets
Capital Expenditure on New and Upgraded Assets 5,728 12,251 5,363 1,320 1,665 1,885 670 1,728 1,855 1,489 1,640
less Amounts received specifically for New/upgraded Assets (6,866) (4,000) (1,000) - - - (1,000) - - (1,000) (250)
less Proceeds from Sale of Surplus Assets (120) - - - - - - - - - -
(1,258) 8,251 4,363 1,320 1,665 1,885 (330) 1,728 1,855 489 1,390
Net Lending / (Borrowing) for Financial Year 1,728 (9,415) (2,893) 2,046 1,361 2,032 4,301 3,547 4,785 7,227 7,461
FINANCIAL INDICATORS 2017 2018 2019 2020 2021 2022 2023 2024 2025 2026 2027
Operating Surplus Ratio -1% 0% -1% -1% 1% 4% 6% 9% 11% 13% 15%
Operating Surplus
Operating Result / Total Operating Income
Net Financial Liabilities Ratio 22% 58% 67% 58% 50% 41% 25% 13% -2% -23% -42%
Net Financial Liabilities
Financial Liabilities less Financial Assets / Total Income
Asset Sustainability Ratio 81% 113% 86% 58% 77% 79% 91% 87% 81% 81% 82%
Net Asset Renewals
Capital Renewal expenses / Asset Management Plan program
Page 60

2017/18 2018/19 2019/20 2020/21 2021/22 2022/23 2023/24 2024/25 2025/26 2026/27 Total (2018-27)
$'000 $'000 $'000 $'000 $'000 $'000 $'000 $'000 $'000 $'000 $'000
LAND & BUILDINGS 705 170 195 185 170 50 20 20 270 170 1,955
STRUCTURES & SITE IMPROVEMENTS 645 270 585 385 345 578 590 345 180 385 4,308
ROADS - Sealed 2,000 1,820 1,265 1,610 2,030 2,260 2,600 2,380 2,855 2,200 21,020
ROADS - unsealed 650 935 950 1,050 1,050 1,050 1,050 1,050 1,050 1,050 9,885
KERBING 200 275 300 300 300 350 350 350 350 350 3,125
FOOTPATHS 210 160 200 150 200 200 200 200 200 200 1,920
DRAINAGE 240 150 800 30 0 500 1,500 1,420 1,500 2,500 8,640
CWMS 80 40 0 0 40 105 0 200 0 0 465
PLANT & EQUIPMENT 600 765 795 940 840 1,460 940 1,090 400 180 8,010
IT EQUIPMENT 132 37 110 41 115 122 140 136 30 38 901
FURNITURE & FITTINGS 12 17 10 10 10 10 40 10 10 10 139
OTHER 30 538 50 92 30 30 55 30 30 30 915
MAJOR PROJECTS 14,823 6,000 0 2,000 2,000 0 0 0 0 0 24,823
TOTAL CAPITAL 20,327 11,177 5,260 6,793 7,130 6,715 7,485 7,231 6,875 7,113 86,106
TOTAL NEW/UPGRADE 12,251 5,363 1,320 1,665 1,885 670 1,728 1,855 1,489 1,640 29,865
TOTAL REPLACEMENT/RENEWAL 8,076 5,814 3,940 5,128 5,245 6,045 5,758 5,376 5,386 5,473 56,240
CAPITAL WORKS PROGRAM SUMMARY 2017-27
Page 61