PORT OF MONTREAL DRAYAGE - GDapgst.ca/projects/pdfs/APG_Montreal_Dray_Final-web.pdf · 6...
62
PORT OF MONTREAL DRAYAGE Labour Profile & Communications Study
Transcript of PORT OF MONTREAL DRAYAGE - GDapgst.ca/projects/pdfs/APG_Montreal_Dray_Final-web.pdf · 6...

PORT OF MONTREAL DRAYAGE
Labour Profile &CommunicationsStudy

2 Understanding Port of Montreal Drayage—Labour Profile and Communications Study | R.A. Malatest & Associates Ltd. APGST and MPA
The Asia Pacific Gateway Skills Table wishes to acknowledge the funding support from the Government of Canada’s Sectoral Initiatives Program.
—
La Table sur les compétences de la Porte d'entrée de l'Asie-Pacifique reçoit le soutien financier du Programme d’ initiatives sectorielles du gouvernement du Canada.
The opinions and interpretations in this publication are those of the author and do not necessarily reflect those of the Government of Canada.
—
Les opinions et les interprétations figurant dans la présente publication sont celles de l’auteur et ne représentent pas nécessairement celles du gouvernement du Canada.
—
www.apgst.ca

ACKNOWLEDGEMENTS
PrOjECT COMMITTEE MEMbErS
The Asia Pacific Gateway Skills Table is grateful for the commitment and expertise of the Project Committee members who provided their insight and guidance to this project:
JJ Magali Amiel, CargoM JJ Krista bax, Asia Pacific Gateway Skills TableJJ richard Desaulniers, Montreal Port AuthorityJJ jonathan Kassian, Asia Pacific Gateway Skills TableJJ Alexandre Montpetit, Montreal Port AuthorityJJ Daniel Olivier, Montreal Port AuthorityJJ Danièle Sansoucy, Camo-route
This study was led and the following report prepared by:
r.A. Malatest & Associates Ltd. Ottawa, ON
Some photos in this report by courtesy of the Montreal Port Authority
The Asia Pacific Gateway Skills Table is grateful for the leadership of the Montreal Port Authority in making this project a reality, especially Daniel Olivier for his guidance and management of the project, and Alexandre Montpetit for his work in ensuring seamless delivery of the survey and the report.

CONTENT
APPENDIX
Executive Summary 5
Section 1: Introduction 7
Section 2: Profile of Drayage Drivers in Monteral 8 2.1 Workforce Demographics 82.2 Employment Status 102.3 Work Schedule 112.4 Driver Compensation 12
Section 3: Approach to Drayage Driver and Employer Communications 143.1 Importance of Communicating Traffic and Port Conditions 143.2 Current and Desired Means of Communication 163.3 How Dispatchers and Drivers Communicate 17
3.4 Planned Changes to Communication Tools 18 3.5 Communicating Port Conditions to Employers/Dispatchers 19
Section 4: Conclusions 20
Appendix A: Study Methodology 22
Appendix B: Literature Review 28
Appendix C: Summary of Results and Data Tables 45

ThIS STuDy INCLuDES:
yy A labour force profile: that provides a profile of the drivers including information on: employment type, demographics and driver experience; and
yy A communication technologies profile: that identifies the tracking and communication devices cur-rently used by drayage trucking companies and drivers to obtain and relay information about traffic and port conditions, as well as what communications technologies they plan to use in the future.
The study was informed through a survey of drayage drivers in Montreal and a survey of their employers. Information contained in this report is based on responses from 413 drivers and 32 employers. The main findings of the study include the following:
SECTOr PrOfILE
yy Drayage drivers in Montreal are almost exclusively male (97%) and are on average 46.2 years old.yy The greatest proportion speak french (51%), have at least a high school diploma (33%) and are
Canadian citizens (92%).yy Most drayage drivers are employees working for a trucking company (64%) Others are owner-oper-
ators (32%) or replacement drivers hired by owner-operators (4%). few are union members (15%). yy The average drayage driver has 10.8 years of experience in the sector and has worked for their
current employer for 7.8 years. yy just over one quarter of drayage drivers (28%) supplement their income with other work, others
work exclusively in drayage.yy Most employee drayage drivers are paid by the hour (63%) while owner-operators are mostly paid
by the trip (94%).
COMMuNICATIONS PrOfILE
yy receiving real-time information on port conditions is very important to most employers (81%).yy More than one half of drivers (49%) never or rarely check traffic and port conditions prior to their
drayage trips and most (58%) are not aware that this information is available on the Port of Montreal website.
yy Many (64%) employers relay information on traffic and port conditions to their drivers.yy Drivers most often get information from dispatchers (44%). Some are happy with this approach
(32%), while others would prefer a smartphone application (32%).yy Dispatchers and drivers mostly communicate via smartphone (indicated by 53% of employers
and 63% of drivers) or SMS / texting (indicated by 47% of employers and 27% of drivers)yy Employers are increasingly integrating new communication technologies within their operations
citing opportunities to increase efficiency and productivity.yy Employers prefer to get information on port conditions via email or the Port of Montreal website.yy use of email alerts would be particularly useful when access to the Port is limited, or there are
significant traffic conditions that would result in greater than anticipated wait times.
EXECUTIVE SUMMARY
The Asia Pacific Gateway Skills Table and Montreal Port Authority commissioned R.A. Malatest & Associates Ltd. to complete a study to collect information on port drayage drivers who access the Port of Montreal, as well as on current or future communication technologies used by the industry. The objective of the study is to gain a better under- standing of the drayage sector, and to inform improvements of operational practices that will reduce truck-related greenhouse gas emissions.
5 Understanding Port of Montreal Drayage—Labour Profile and Communications Study | APGST and MPA

6 Understanding Port of Montreal Drayage—Labour Profile and Communications Study | APGST and MPA
CONCLuSION
yy Most drivers work full-time making multiple trips to and from the Port of Montreal. Therefore, congestion and wait times frustrate drivers as they have a major impact on productivity.
yy Information on traffic and port conditions is crucial to efficient drayage trucking operations. Employers noted the great importance in receiving timely and specific information about port conditions including wait times and other unforeseen circumstances that could disrupt productivity.
yy Communication between dispatchers and drivers with regard to traffic and port conditions is important as many drivers do not check this information themselves and rely solely on dispatchers to provide it.
yy Most drivers and dispatchers are moving away from the traditional communication tools in the industry such as the Cb radio and towards new communication technologies such as smartphones. Some employers noted that it was sufficient to visit the Port of Montreal website to understand current conditions; others would prefer being prompted through emails. Many noted that both approaches were necessary.
yy Most companies have integrated newer technologies such as GPS and the use of smartphones
This study highlights the importance of timely and accurate information about traffic and port conditions as well as the increasing use of new technology to support efficient and productive drayage operations. Overall, the study findings suggest the following for the development of effective and reliable communications between the Port and the sector:
With the above mentioned findings in mind, it is recommended that the Montreal Port Authority consider the following when developing a communication strategy to provide information about port traffic conditions:
within their operations, therefore the Port of Montreal and its stakeholders should consider the penetration of such technologies when developing compatible strategies/mechanisms to communicate with the sector.
yy A significant portion of the sector does not actively seek out information on traffic and port conditions but rather rely on it being provided to them. Communication strategies developed by the Port of Montreal and their stakeholders should, therefore, consider proactive communication measures in their strategy to keep the sector informed about Port conditions.
yy Some drivers are not provided information on traffic and port conditions by their dispatchers, and some have limited awareness of the resources available to get information. A communication strategy to build awareness of the resources available as well as their benefits to productivity and efficiency would be helpful in reaching all drivers and employers, particularly those with limited knowledge.
yy Proactively alerting drivers and/or employers of sudden circumstances that may cause disruptions to terminal operations and result in higher port congestion and longer wait times is seen as particularly important.
yy Develop a communications system to be accessible to dispatchers as well as to drivers.
yy Consider systems that send out timely notifications to both drivers and dispatchers used by other ports.
yy Alerts should be sent out by email and by smartphone texts.yy Continue to make port traffic conditions available on the Port of Montreal website. Consider
deepening the information available on the site with the addition of approximate wait times at each port terminal, as well as the latest notifications sent out to subscribers.
yy The location of this information on the website should be made more prominent.yy A communications strategy is required to build awareness of the resources available and to
recruit subscribers to the notification system.

7 Port of Montreal Drayage—Labour Profile and Communications Study — APGST and MPA
SECTION 1: INTRODUCTION
As part of the Government of Canada's Clean Transportation Initiative on Port-related Trucking (2013-2016), the Montreal Port Authority has set out to identify measures that reduce truck-related greenhouse gas emissions. Improvements to scheduling and increased coordination of drayage trucking movements could reduce fuel consumption and air pollutants from idling trucks within the Port or waiting to enter the Port or terminal, as well as boost productivity overall. The current study collected information on port drayage drivers who access the Port of Montreal as well as current or future communication technologies used by the industry. The objective of the study is to gain a better understanding of the drayage sector, and to inform improvements of operational practices that will reduce truck-related greenhouse gas emissions.
ThIS STuDy INCLuDES:
yy A labour force profile: that provides information on driver employment type, demographics and experience; and
yy A communication technologies profile: that identifies the tracking and communication devices currently used by drayage trucking companies and drivers to obtain and relay information about traffic and port conditions, as well as what they plan to use in the future.
The study was informed through two surveys: one of drayage drivers in Montreal and the other of trucking companies that employ these drivers. The survey with drivers was primarily conducted on site, with drivers self-completing the paper questionnaire during their wait times at Port terminals. Employers either self-completed a survey questionnaire online, or by telephone with the assistance of a surveyor. The approach and methods used to complete this study are further detailed in Appendix A.
This report presents the results associated with the nearly 450 individuals, including drivers and their employers, who participated in these surveys.
How to best reach employers and drivers, including owner-operators is beyond the scope of this study. However, based on findings, it is suggested that any communications strategy should focus the benefits of subscribing to a notification system and to accessing information on the website. For employers, this can include an increase in efficiency and productivity. For drivers, this can include a reduction in wait times and related stress.

8 Port of Montreal Drayage—Labour Profile and Communications Study — APGST and MPA
SECTION 2: PROfIlE Of DRAYAgE DRIVERS IN MONTREAl
8
The survey of drayage drivers in Montreal is the first study that focuses on this specific sector and region of the Canadian trucking industry. The following sub-sections provide a profile of the labour force that makes up the drayage sector in Montreal, including who the drivers are, their employment and work conditions as well as their compensation. In some instances, findings are compared to results of the 2013 drayage sector profile conducted in the Lower Mainland of british Columbia (bC) to highlight differences and similarities between labour forces in both regions. based on these comparisons, it appears that drivers in Montreal have more experience and are characterized as long-time residents, rather than in the Lower Mainland, which was characterized by more new Canadians.
2.1 WOrKfOrCE DEMOGrAPhICS
Similar to the trucking industry as a whole and the drayage study in the Lower Mainland, almost all drayage drivers in Montreal are male (97%). The survey of drayage drivers in the Lower Mainland in british Columbia had similar results, with 98% of surveyed drivers being male. however, results around age differ between the two regions. The average age of drayage drivers in Montreal is greater, at 46.2 years of age compared to 40.6 in the Lower Mainland. It should be noted that on average, drivers in bC are likely older now than when the study was conducted in 2013. Despite this consideration, drivers in Montreal would still be almost 4 years older.
There is little significant age difference between drayage owner-operators and employees in Montreal (see Section 2.2 for employment definitions). however, there are differences when comparing Montreal drayage driver ages to the Canadian trucking industry.1 It appears that the drivers in Montreal are older than the average for the Canadian trucking sector as there are fewer drivers under 30 years of age.2
1 Beyond the Wheel Survey
Technical Report, Canadian
Trucking Human Resources
Council, 2012.
2 The same consideration
to age should be made here,
as this study was conducted
in 2012 and the drivers age
average is now likely greater.
Montreal Drayage Driver Quick StatsJJ Male: 97%JJ Average Age: 46.2 yearsJJ Primary language: french, 51%JJ Education: high school diploma, 33%JJ Canadian citizens: 92%

9 Port of Montreal Drayage—Labour Profile and Communications Study — APGST and MPA
There are also other differences in the demographic makeup of drayage drivers in Montreal, compared to those in the Lower Mainland. first, while the majority of drivers in Montreal identified the majority language (french in Quebec) as their primary language (51%), less did so in bC (English, 40%). The majority of drivers in bC identified Punjabi as their primary language (55%). There are also fewer landed immigrants driving drayage in Montreal (8%) compared to bC (18%). finally, a smaller propor-tion of drayage drivers in Montreal have completed some college or university (25%) compared to those in the Lower Mainland.
Driver Age – Montreal Drayage Compared to Canadian Trucking Sector
Under 30 30-44 45-55 55+
20%
0%
40%
60%
80%
100%
MTL DrayageEmployee
CanadaEmployee
Montreal DrayageOwner-operator
CanadaOwner-operator
15%5%
34%
42%
19% 19%22%
35%
35%
8%
42%
34%
19%
39%
30%
17%
Education Montreal Lower Mainland, BC
Specific Level Combined Level Specific Level Combined Level
< high school 6%
52%
7%
54%Some high school 13% 10%
High school diploma 33% 37%
Some vocational 10%24%
4%7%
Completed vocational 14% 3%
Some college/university 9%25%
22%40%
College/university degree 15% 18%
Figure 2.2 – Education Level Attained by Drayage Drivers
results on language, citizenship and education suggest that Montreal’s drayage labour force is made up mostly of long-time residents compared to bC, whose workforce relies more on new Canadians, and some driverswith higher levels of education.
10 Port of Montreal Drayage—Labour Profile and Communications Study — APGST and MPA
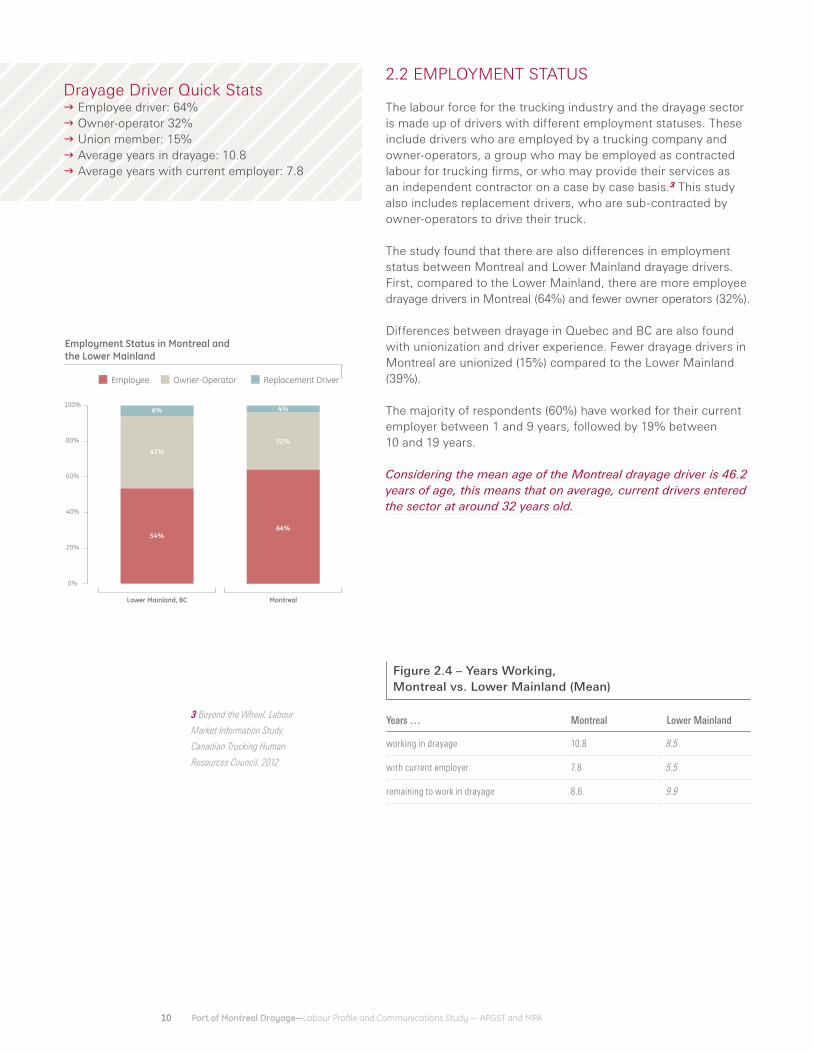
2.2 EMPLOyMENT STATuS
The labour force for the trucking industry and the drayage sector is made up of drivers with different employment statuses. These include drivers who are employed by a trucking company and owner-operators, a group who may be employed as contracted labour for trucking firms, or who may provide their services as an independent contractor on a case by case basis.3 This study also includes replacement drivers, who are sub-contracted by owner-operators to drive their truck.
The study found that there are also differences in employment status between Montreal and Lower Mainland drayage drivers. first, compared to the Lower Mainland, there are more employee drayage drivers in Montreal (64%) and fewer owner operators (32%).
Differences between drayage in Quebec and bC are also found with unionization and driver experience. fewer drayage drivers in Montreal are unionized (15%) compared to the Lower Mainland (39%).
The majority of respondents (60%) have worked for their current employer between 1 and 9 years, followed by 19% between 10 and 19 years.
Considering the mean age of the Montreal drayage driver is 46.2 years of age, this means that on average, current drivers entered the sector at around 32 years old.
Drayage Driver Quick StatsJJ Employee driver: 64%JJ Owner-operator 32%JJ union member: 15%JJ Average years in drayage: 10.8JJ Average years with current employer: 7.8
Years … Montreal Lower Mainland
working in drayage 10.8 8.5
with current employer 7.8 5.5
remaining to work in drayage 8.6 9.9
Employment Status in Montreal andthe Lower Mainland
Employee Owner-Operator Replacement Driver
20%
0%
40%
60%
80%
100%
Lower Mainland, BC
54%
41%
6%
Montreal
64%
32%
4%
Figure 2.4 – Years Working, Montreal vs. Lower Mainland (Mean)
3 Beyond the Wheel. Labour
Market Information Study.
Canadian Trucking Human
Resources Council. 2012

11 Port of Montreal Drayage—Labour Profile and Communications Study — APGST and MPA
further, on average, drayage drivers plan to work another 8.6 years. This means that the average current drayage driver will exit the sector at 55 years of age. Of those who identified what they would do after this time, almost two thirds plan to retire (64%). Most others plan to leave the industry for a different driving career (20%) or a different occupation altogether (13%).
2.3 WOrK SChEDuLE
just over a quarter of drivers (28%) indicated augmenting their drayage work by working in another job last year, including other types of trucking activities such as drybox/flatbed (34 mentions), freight and long haul (14 mentions), as well as other types of driving, such as buses or taxies (9 mentions total). A large proportion of drivers put in similar effort working year-round, completing long hours every week. As detailed in figure 2.6 below, almost three quarters of drivers indicated that they work 46 hours or more a week.
Years … Montreal Lower Mainland
working in drayage 10.8 8.5
with current employer 7.8 5.5
remaining to work in drayage 8.6 9.9
Mean %
Months worked last year (n=359)
0 to 3 months
9.8
13.4
4 to 6 months 5.3
7 to 9 months 4.7
10 to 12 months 76.6
Days worked per week (n=379)
1 days or less
4.5
5.5
2 to 3 days 9.0
4 to 5 days 82.6
6 to 7 days 2.9
Hours worked per day (n=363)
4 hours or less
10.4
6.9
5 to 8 hours 9.6
9 to 12 hours 68.9
13 hours or more 14.6
Hours worked per week (n=341)
35 hours or less
50.6
12.9
36 to 45 hours 13.5
46 to 55 hours 34.3
56 hours or more 39.3
Figure 2.4 – Years Working, Montreal vs. Lower Mainland (Mean)
Figure 2.6 – Drayage Driver Work Schedule
1-9 years60%
30+ years2%
20-29 years5%
Less than1 year
14%
10-19 years19%
Years with Current Employer

12 Port of Montreal Drayage—Labour Profile and Communications Study — APGST and MPA
There is similar conformity in the number of trips (revenue and non-revenue) completed by drayage drivers on a typical day. However there is some variance in the distance traveled last year, as identified by respondents. While the largest proportion indicated travelling more than 100,000 km last year (24%), there is a wider range of accumulated mileage among respondents.
Figure 2.7 – Drayage Trips and Distance Traveled by Drayage Drivers
Mean %
KM driven last year (n=197)
Less than 10,000 km
84,913
10.2
10,000 to 19,999 km 7.1
20,000 to 39,999 km 14.7
40,000 to 59,999 km 20.8
60,000 to 79,999 km 15.7
80,000 to 99,999 km 7.1
More than 100,000 km 24.4
Revenue drayage trips per day (n=217) 4
1 or less
3.3
5.5
2 to 3 9.0
4 to 5 82.6
Non-revenue drayage trips per day (n=198)
1 or less
1.4
60.1
2 to 3 26.8
4 to 5 13.1
2.4 DrIvEr COMPENSATION
Drayage drivers are compensated either per trip, per hour or per kilometre. Drivers in Montreal reported mostly compensated per trip (50%) or per hour (45%). Owner-operators are almost all paid per trip (94%) compared to employees for who two thirds reported being paid by the hour (63%).
Trip Hour KM
Employee 31% 63% 7%
Owner-operator 94% 5% 1%
Replacement driver for owner-operator 0% 100% 0%
Total 50% 45% 5%
Total Mean $106.96 $19.76 $0.52
Figure 2.8 – Driver Compensation Per Trip, Hour or KM
4 After reviewing responses
on the number of revenue
and non-revenue trips
completed during a typical
day, some data adjustments
were made. Responses
above 5 trips (revenue or
non-revenue) per day were
omitted from average and
percentage calculations as
they were deemed outliers by
the project committee. In the
context of Port operations as
well as distance travelled by
drayage drivers, few would be
able to complete more than 5
trips to the Port each day.

13 Port of Montreal Drayage—Labour Profile and Communications Study — APGST and MPA
Years Worked in Drayage Mean N
Less than 1 year $19,045 20
1 to 5 years $37,233 72
6 to 10 years $44,621 76
11 to 15 years $43,919 37
16 to 20 years $43,733 15
21 to 25 years $40,286 7
More than 25 years $51,476 21
Months Worked Last Year Mean N
0 to 3 months $24,388 25
4 to 6 months $31,133 15
7 to 9 months $41,743 7
10 to 12 months $43,263 186
Trips Per Week Mean N
1 to 10 $37,804 42
11 to 20 $42,285 63
21 to 30 $44,701 57
31 or more $47,900 10
Total $42,318 172
Figure 2.9 – Income by Years in Drayage
Figure 2.10 – Income by Months Worked Last Year
Figure 2.11 – Income by Weekly Revenue Drayage Trips
Many drivers (41%) reported making between $40,000 and $59,999 through drayage last year with the average being $40,434. A substantial number of respondents reported making less than $40,000 last year, but many of these also complete other work, have been working in the sector for less than one year or make fewer drayage trips. Mean income by years worked in drayage, by months worked last year and by weekly revenue drayage trip confirm that those reporting less income, worked less. (See figure 2.9, 2.10 and 2.11 below).
figure 2.9 also highlights that driver income may plateau once they reach a certain level of experience in the sector. While it is expected that newer drivers earn less, there is relatively little difference in income between drivers with 6 to 10 years of experience (average income of $44,621) compared to those with more than 25 years of experience (average of $51,476). This represents a $6,855 difference in income between the two levels of experience.
There was no significant difference in income between employees and owner-operators. However a difference is observed between union and non-union drivers. On average, drivers who identified as union members (15%) reported making nearly $6,000 more than non-union members.
14 Port of Montreal Drayage—Labour Profile and Communications Study — APGST and MPA
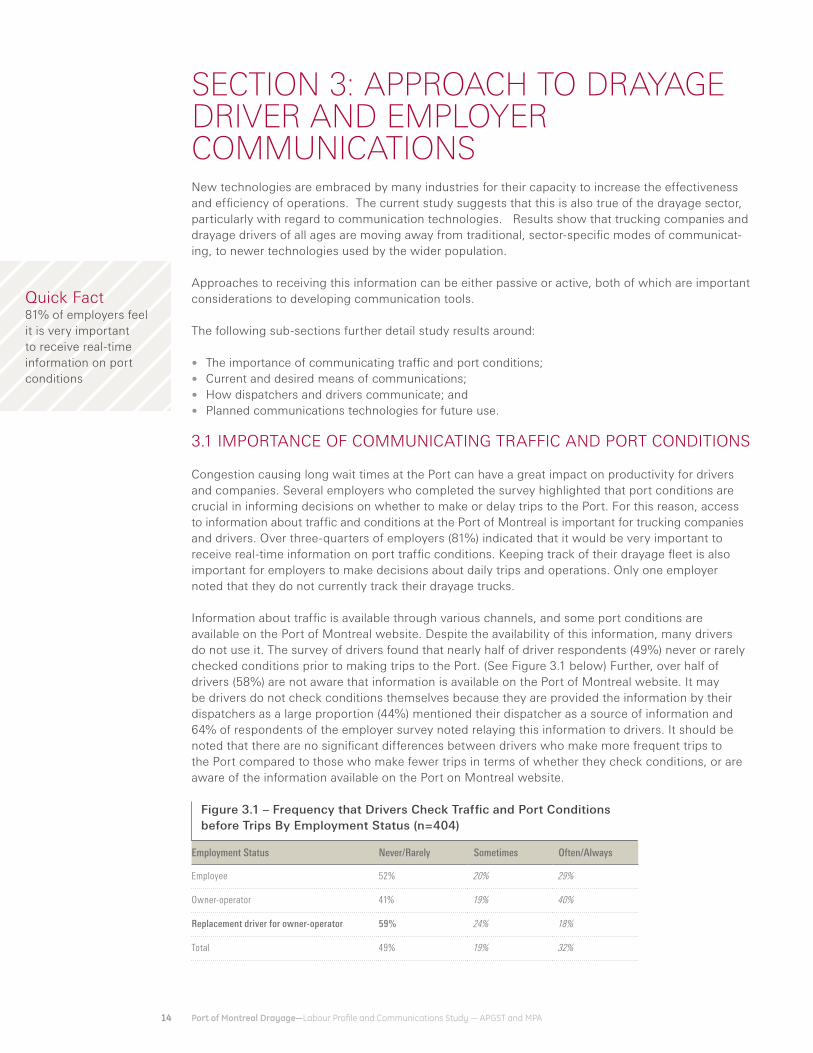
Employment Status Never/Rarely Sometimes Often/Always
Employee 52% 20% 29%
Owner-operator 41% 19% 40%
Replacement driver for owner-operator 59% 24% 18%
Total 49% 19% 32%
Figure 3.1 – Frequency that Drivers Check Traffic and Port Conditions before Trips By Employment Status (n=404)
New technologies are embraced by many industries for their capacity to increase the effectiveness and efficiency of operations. The current study suggests that this is also true of the drayage sector, particularly with regard to communication technologies. results show that trucking companies and drayage drivers of all ages are moving away from traditional, sector-specific modes of communicat-ing, to newer technologies used by the wider population.
Approaches to receiving this information can be either passive or active, both of which are important considerations to developing communication tools.
The following sub-sections further detail study results around:
yy The importance of communicating traffic and port conditions; yy Current and desired means of communications; yy how dispatchers and drivers communicate; and yy Planned communications technologies for future use.
SECTION 3: APPROACH TO DRAYAgE DRIVER AND EMPlOYER COMMUNICATIONS
3.1 IMPOrTANCE Of COMMuNICATING TrAffIC AND POrT CONDITIONS
Congestion causing long wait times at the Port can have a great impact on productivity for drivers and companies. Several employers who completed the survey highlighted that port conditions are crucial in informing decisions on whether to make or delay trips to the Port. for this reason, access to information about traffic and conditions at the Port of Montreal is important for trucking companies and drivers. Over three-quarters of employers (81%) indicated that it would be very important to receive real-time information on port traffic conditions. Keeping track of their drayage fleet is also important for employers to make decisions about daily trips and operations. Only one employer noted that they do not currently track their drayage trucks.
Information about traffic is available through various channels, and some port conditions are available on the Port of Montreal website. Despite the availability of this information, many drivers do not use it. The survey of drivers found that nearly half of driver respondents (49%) never or rarely checked conditions prior to making trips to the Port. (See figure 3.1 below) further, over half of drivers (58%) are not aware that information is available on the Port of Montreal website. It may be drivers do not check conditions themselves because they are provided the information by their dispatchers as a large proportion (44%) mentioned their dispatcher as a source of information and 64% of respondents of the employer survey noted relaying this information to drivers. It should be noted that there are no significant differences between drivers who make more frequent trips to the Port compared to those who make fewer trips in terms of whether they check conditions, or are aware of the information available on the Port on Montreal website.
Quick fact81% of employers feel it is very important to receive real-time information on port conditions

15 Port of Montreal Drayage—Labour Profile and Communications Study — APGST and MPA
just over a third of employers (10 respondents, 36%) reported that they do not relay traffic and port conditions to their drivers. These employers vary in fleet size, ranging from 16 to 250 drivers (including owner-operators). The most common reasons for companies not relaying information points to the perceived importance and need for information on traffic and port conditions. The most common reason for not relaying conditions to drivers is the lack of accessible and consistent information (mentioned by six respondents each which represents 60% of the 10 respondents who do not relay information) (See figure 3.2 below). As previously mentioned, 81% of employers indicated that it would be very important to receive real-time information on traffic conditions at the Port of Montreal, including most employers (8 of 10) who do not currently provide this information.
A few employers also indicated that drivers preferred to get traffic information and port conditions themselves (20%), or that it was the driver’s responsibility to obtain this information (30%). This could be a concern if their drivers are among the 49% who never check conditions prior to trips. It is likely that for some trucks entering the Port, neither the driver nor the dispatcher have checked port traffic conditions.
Quick fact58% of drivers are not aware that information on conditions is available on the Port of Montreal website
Reasons Companies do not Communicate Information about Traffic and Port Wait Times
20%
0%
40%
60%
80%
100%
Lack of accessibleinformation
60% 60%
30% 30%
20% 20%
Lack of consistentinformation
Lack of reliableinformation
Drivers preferto obtain their own
Lack of staff tomanage communications
Drivers are responsiblefor obtaining their own

16 Port of Montreal Drayage—Labour Profile and Communications Study — APGST and MPA
Information Source Current Source Preferred Source
Dispatcher 44% 32%
Public Radio 23% 18%
CB Radio 19% 9%
Port of Montreal website 9% 13%
Roadside variable message signs 9% 15%
Smartphone application 8% 32%
GPS application 7% 7%
Email 1% 7%
Under 30 30 to 44 45 to 55 Over 55
DispatcherCurrent 18% 42% 50% 51%
Preferred 25% 29% 36% 33%
CB RadioCurrent 4% 20% 25% 18%
Preferred 7% 6% 12% 10%
Port of Montreal websiteCurrent 21% 15% 6% 3%
Preferred 29% 16% 10% 6%
Smartphone applicationCurrent 18% 8% 7% 5%
Preferred 25% 44% 29% 24%
GPS applicationCurrent 18% 5% 7% 5%
Preferred 18% 6% 8% 3%
Public RadioCurrent 14% 25% 24% 29%
Preferred 29% 13% 22% 23%
Figure 3.3 – How Drivers Get Information on Traffic and How They would prefer to get Information
Figure 3.4 – Use and Preference of Information Sources by Driver Age
3.2 CurrENT AND DESIrED MEANS Of COMMuNICATION
Congestion causing long wait times at the Port can have a great impact on productivity for drivers As previously mentioned, many drayage drivers rely on their dispatchers to get information on traffic and port conditions. Dispatchers were the most common information source mentioned by drivers (44% of survey respondents) when asked how they get real-time information. however, there is a disparity in how drivers are currently obtaining information and how they would prefer to get this information. While a significant proportion would still prefer to get information from their dispatcher (32%), an equal amount would also prefer using a smartphone application. (See figure 3.3 below). further, there is a significant difference in the proportion that are currently using a smartphone (8%) and those that would prefer it (32%).

17 Port of Montreal Drayage—Labour Profile and Communications Study — APGST and MPA
Age Group Smartphone application GPS application Public Radio Roadside variable message signs
Under 30 46% 36% 25% 29%
30 to 44 46% 20% 49% 37%
45 to 55 28% 14% 63% 34%
Over 55 27% 18% 55% 37%
Tool Mentioned by …
Employers Drivers
Smartphone 53% 63%
SMS / Texting 47% 27%
CB radio 16% 12%
Mobile application 16% 9%
Other 22% 10%
Figure 3.5– Use of Communication Tools outside of Work by Driver Age
Figure 3.6 – How Employers and Drivers Communicate
There were no significant trends of note when considering the use and preference of communication tools between drivers who make more frequent trips to the Port compared to those who make fewer trips or between owner-operators and employee drivers.
These usage and preference trends continue outside of work. Older respondents were less likely to mention using a smartphone or GPS applications as compared to younger drivers. (See Figure 3.5).
3.3 hOW DISPATChErS AND DrIvErS COMMuNICATE
Communication between dispatchers and drivers is important and is a regular part of trucking operations, regardless of whether or not these communications include information about traffic and port conditions. results about how dispatchers and drivers communicate highlight the increasing shift to new communication technologies. for example, while the Cb radio, which is traditionally used in the trucking industry, is still in use, its use seems to be waning with the availability of newer technology such as smartphones. Only a few (4) employers mentioned mainly or exclusively using the Cb radio to communicate with drivers.
While employers are embracing new technology to communicate with drivers, they are also utilizing these technologies to track their fleets. Employers who completed the survey mentioned most often using smartphones (mentioned by 56% of respondents), followed by GPS (mentioned by 47% of respondents) to track their fleets. They also most often use smartphones (53%) and SMS/Texting (47%) to communicate with drivers.5 responses from drivers about how they communicate with dispatchers confirmed this practice (See figure 3.6 below).
Employers also seem quite satisfied with the efficiency of the tools they are using to relay information. All but four of the 32 respondents (representing 88%) are satisfied with the tools that they are currently using.
5 When asked to select the main
tool their used, most indicated
the smartphone (47%)

18 Port of Montreal Drayage—Labour Profile and Communications Study — APGST and MPA
3.4 PLANNED ChANGES TO COMMuNICATION TOOLS
Despite high levels of satisfaction with the communication tools, a few employers plan on making changes to how they track fleets and communicate with drivers. Seven employers (representing 27% of respondents) indicated they plan to change how they track their fleet. reasons for the change related to efficiency, integration and the additional functions that new technology allows. It should be noted that not all who currently use older technology (i.e. Cb radio) plan on making changes to the communication approach with drivers. Therefore, older technology will still be in use in the next five years. Those who indicated what tools they were planning to use mentioned GPS, smartphones and tablets. A few respondents were unable to specify when this change would take place, but other responses ranged from within the next year, to two years.
A few more respondents indicated they were planning on changing the tools used to communicate with drivers (10 respondents, 37%). reasons for the change are similar to the changes reported for tracking, and many will use the same technology to communicate with drivers as they will to track fleets. Texting, emails and smartphones were mentioned as the tools being considered. Timelines for these changes were slightly longer, with changes happening from now up to three years from now. Some challenges also need to be overcome prior to implementing changes to communication tools. respondents most often mentioned having to establish compatibility between the proposed and existing technology (mentioned by four respondents), and having to address the costs (mentioned by four respondents). A few also mentioned having to increase the technological literacy of drivers (mentioned by three respondents).
Why are you making the changes to tracking?
« To keep up with the times (there are) a lot of additional benefits including communication with customers, PODs etc. »
Quick factEmployers value new communication technologies for their ability to increase efficiency and productivity.

19 Port of Montreal Drayage—Labour Profile and Communications Study — APGST and MPA
3.5 COMMuNICATING POrT CONDITIONS TO EMPLOyErS/DISPATChErS
The survey of employers also prompted respondents to discuss how they would prefer to have their dispatchers receive information on wait times and conditions from the Port. Almost all responses specified wanting to receive information through the Port of Montreal website or by email message. A few specified the importance of having both approaches available as a complimentary and comprehensive approach.
Less than half (42%) of the drivers who completed the survey were aware that information was available on the Port of Montreal website, although awareness among employers seems greater. While level of awareness of the website was not explicitly explored through the survey questions, most respondents mentioned it with relation to the best way to provide dispatchers with real-time information about conditions and wait times from the Port of Montreal. Some were satisfied with the current information available on the website, including the number of cameras and the view they provided. Others mentioned the need for more cameras to provide better coverage and to observe conditions at more port locations as well as including approximate wait times, which are not currently provided on the website. One specified that a map feature, allowing you to see if there are problematic areas or if the train is blocking the Port road (which causes substantial delays) would inform whether or not they should delay trips to the Port.
« Les caméras qui changent d’ images à chaque minute nous convient pour l’ info en temps réel. »
regular emails (either daily or twice daily) were also mentioned by a significant proportion of respondents as an ideal way to receive information from the Port. One respondent specified that since dispatchers work on computers, an email would be received quickly, and the information relayed to drivers via smartphone or SMS. In additional to regular emails, a few respondents mentioned that email notification of special circumstances that change traffic conditions and could cause delays would be appreciated.
« Par courriel est la façon la plus rapide et reflète bien la situation en temps réel »
The combination of the email and website approach includes passive and active communications. The website requires dispatchers (and/or drivers) to actively seek out information while an email is passive, and requires little effort by the dispatcher. While some are happy to get information from the website, many employers stressed the importance of both measures, particularly when unforeseen circumstances cause delays that cannot be interpreted, or seen on the website before it is too late. for example, the use of email alerts could be considered when access to the Port is limited, or when there are significant traffic conditions that would result in wait times greater than a pre-determined number of minutes. The literature review identified similar systems to inform dispatchers and drivers of conditions were used by other ports. for example, the Truck Appointment System implemented by the Port of New bedford in Massachusetts incorporates web based text messages and email notifications to which drivers and companies can subscribe to receive notifications about port conditions.6,7 This system also requires companies to provide estimated truck arrival times as part of the overall appointment system.
Quick factEmployers prefer to get information on port conditions via email or Port of Montreal website.
6 Kanann Consulting US,
Inc. Port of New Bedford
Truck Appointment System
http://northeastdiesel.org/
pdf/workgroup/NewBed-
fordTrucksITS.pdf
7 An ongoing study
commissioned by APGST and
MPA is further exploring the
wide range of communication
technologies to relay informa-
tion about port conditions to
dispatchers and drivers used
by ports in North America and
overseas.

20 Port of Montreal Drayage—Labour Profile and Communications Study — APGST and MPA
This project was the first to examine the drayage workforce and communication technology usage and preferences at the Port of Montreal. Survey findings were able to show that drayage drivers in Montreal are mostly male, middle aged, francophone and Canadian citizens.
In terms of their working conditions, most drivers work full time making multiple trips to and from the Port of Montreal. Therefore, congestion and wait times frustrate drivers as they have a major impact on productivity.
Information on traffic and port condition is crucial to efficient drayage trucking operations. Employers noted the great importance in receiving timely and specific information about port conditions including wait times and other unforeseen circumstances that could disrupt productivity. While a few employers have yet to integrate newer technologies into their operations, most trucking companies have and value these technologies for their facilitation of efficiency and productivity.
Communication between dispatchers and drivers with regard to traffic and port conditions is important as many drivers do not check this information themselves and rely solely on dispatchers to provide it. however, there may be a proportion of drivers that do not receive this information from dispatchers and do not seek it out themselves. results of the study suggest that few drivers are aware of traffic information available on the Port of Montreal website.
Most drivers and dispatchers are moving away from the traditional communication tools in the industry such as the CB radio and towards new technologies such as smartphones. While driver age does have an impact on use and preference of newer technology, technology use is widespread throughout the Port of Montreal.
The notion of passive and active modes of communications is touched on throughout the study. Some drivers seek out information themselves; others rely on others to provide it. Some employers noted that it was sufficient to visit the Port of Montreal website to understand current conditions; others would prefer being prompted through emails. Many noted that both approaches were necessary. for this reason, passive and active approaches should be considered when developing communication tools and mechanisms that will relay information to dispatchers and to drivers, and ultimately improve coordination of drayage movements at the Port of Montreal.
SECTION 4: CONClUSIONS

21 Port of Montreal Drayage—Labour Profile and Communications Study — APGST and MPA
This study highlights the importance of timely and accurate information about traffic and port conditions as well as the increasing use of new technology to support efficient and productive drayage operations. Overall, the study findings suggest the following for the development of effective and reliable communications between the Port and the sector:
yy Most companies have integrated newer technologies such as GPS and the use of smartphones within their operations, therefore the Port of Montreal and its stakeholders should consider the penetration of such technologies when developing compatible strategies/mechanisms to communicate with the sector.
yy A significant portion of the sector does not actively seek out information on traffic and port conditions but rather rely on it being provided to them. Communication strategies developed by the Port of Montreal and their stakeholders should, therefore, consider proactive communication measures in their strategy to keep the sector informed about Port conditions.
yy Some drivers are not provided information on traffic and port conditions by their dispatchers, and some have limited awareness of the resources available to get information. A communication strategy to build awareness of the resources available as well as their benefits to productivity and efficiency would be helpful in reaching all drivers and employers, particularly those with limited knowledge.
yy Proactively alerting drivers and/or employers of sudden circumstances that may cause disruptions to terminal operations and result in higher port congestion and longer wait times is seen as particularly important.
With the above mentioned findings in mind, it is recommended that the Montreal Port Authority consider the following when developing a communication strategy to provide information about port traffic conditions:
yy Develop a communications system to be accessible to dispatchers as well as to drivers.yy Consider systems that send out timely notifications to both drivers and dispatchers used by
other ports.yy Alerts should be sent out by email and by smartphone texts.yy Continue to make port traffic conditions available on the Port of Montreal website. Consider
deepening the information available on the site with the addition of approximate wait times at each port terminal, as well as the latest notifications sent out to subscribers.
yy The location of this information on the website should be made more prominent.yy A communications strategy is required to build awareness of the resources available and to
recruit subscribers to the notification system.
how to best reach employers and drivers, including owner-operators is beyond the scope of this study. however, based on findings, it is suggested that any communications strategy should focus the benefits of subscribing to a notification system and to accessing information on the website. for employers, this can include an increase in efficiency and productivity. for drivers, this can include a reduction in wait times and related stress.

22 Port of Montreal Drayage—Labour Profile and Communications Study — APGST and MPA
APPENDIX ASTUDY METHODOlOgY

1. LITErATurE rEvIEW
A literature review was conducted to inform the planning and development of research tools and to provide an understanding of existing labour market and communications information for the trucking industry and, most importantly, for the drayage sector. The review examined relevant research on the drayage sector in Montreal and in other jurisdictions. This included studies and data relevant to port drayage drivers, a review of relevant provincial and international studies on labour market data, and demographic profiling of the trucking industry in Quebec and elsewhere in Canada and the uS, and a review of any best practices of data sampling strategies to improve data collected. In addition, this document summarized research on tracking and communication devices (e.g., smart phone apps, mobile devices, GPS, SMS, etc.) used by the trucking industry and the preferred and/or best methods of real-time information/communication in use or soon to be in use among drayage drivers and dispatchers/stakeholders involved in the sector.
2. SurvEy INSTruMENT DEvELOPMENT
Two separate surveys were developed for this study: one for drayage drivers and one for drayage driver employers.
Driver Survey
The driver survey questions and format were designed for easy self-completion by drivers on site at the port, during their wait time and was designed to take no more than eight minutes to complete.
Survey topics covered in the driver survey include the following:JJ Driver characteristics;JJ Working conditions (e.g., days worked and number of trips per day);JJ Communication tools;JJ Driver experience; andJJ Compensation.
Employer Survey
The survey of trucking companies integrated a hybrid survey/interview approach; using both closed and open-ended questions. Open-ended questions allowed respondents to provide greater context and rich qualitative information about current and planned communications technology.
Topics covered in the employer survey include the following:JJ Company characteristics; JJ Current tracking and communication technologies; andJJ Planned tracking and communication technologies.
The current study was informed through two surveys: one of drayage drivers in Montreal and the other of trucking companies that employ these drivers. The following sections detail the approach to conducting the surveys and completing the study.
STUDY METHODOlOgY

24 Port of Montreal Drayage—Labour Profile and Communications Study — APGST and MPA
3. TErMINAL SITE vISITS
Prior to confirming the data collection approach and logistics, a site visit to each participating terminal was conducted. The site visit was conducted on june 5, 2015 and provided the research team with an understanding of the realities of this particular field work and the logistical challenges to be considered. Primarily, surveyor location was the greatest logistical challenge; as the research team had to find the optimal location for survey distribution and collection, while ensuring the safety of the data collection team and not impacting terminal productivity. The data collection plan and survey logistics were developed with these considerations.
4. DATA COLLECTION APPrOACh
Driver Survey
Despite challenges, the driver survey was primarily an intercept survey, with most drivers completing the survey on site at one of the four participating port terminals.8 Surveyors were stationed in locations that facilitated the distribution of the questionnaire to drivers as they entered the terminals and other surveyors collected completed questionnaires at locations where truckers exited the terminal.
If the driver wished to complete the questionnaire at another time, the respondent could return it by fax or by mail using the pre-paid return envelope attached to the survey. Drivers also had the option to drop off their completed questionnaires using a secure drop box located in the Cast and racine terminals. A $15 Tim horton’s gift card was provided to drivers who completed the survey. Drivers who returned the survey by fax, mail or drop box were mailed the gift card, provided they wrote their address in the designated space on the survey.
Employer Survey
for the employer survey, a sample of 101 trucking companies in the Montreal area was compiled using contacts provided by the Port of Montreal, as well contacts previously known to the Consultant. Online searches were also conducted to locate contact names, telephone numbers and email addresses of trucking companies when this information was not already provided. Invitations to complete the survey were emailed to contacts, providing the hyperlink to the survey as well as the telephone number to call if they wished to complete the survey via telephone.
5. SurvEy TEAM SELECTION AND TrAINING
A bilingual survey team consisting of two supervisors and four surveyors was selected. The team was provided with project-specific training that informed them of the purpose and practical concerns of the survey. The training was conducted just prior to the on-site data collection, where the various security protocols and other requirements for each of the terminals were demonstrated and rich qualitative information about current and planned communications technology.
8 Terminals included in the
survey are Cast, Racine,
Termont and Empire.

25 Port of Montreal Drayage—Labour Profile and Communications Study — APGST and MPA
6. DATA COLLECTION PErIOD
Driver Survey
The entirety of the driver survey data collection was completed between june 5 and 18, 2015. This period includes a day of field testing,9 the main data collection period and an additional day of surveying. The objective of this additional day was to ensure that a sufficient number of surveys were completed to ensure sufficient representation of the population. To maximize productivity, surveying was scheduled from 6 a.m. to 12 p.m.; the period when the greatest number of trucks enter and exit the terminals.10 The data collection schedule is detailed in figure below
Employer Survey
The survey of trucking companies was launched on june 12, 2015. An initial email invitation was sent to companies including the link to the survey and a frequently answered questions sheet. following the email distribution, a surveyor contacted companies by telephone to ensure the most appropriate contact was sent the survey invitation, answer any questions and offer to complete the survey with the respondent via telephone. The first six survey completions were treated as the field test. Surveys were reviewed to ensure the programming was functioning and questions were being answered as intended. A second (reminder) email was sent to non-respondents on june 18. Access to the survey was closed on june 26, 2015.
7. SurvEy rESuLTS
Driver Survey
During the course of the driver survey data collection, 428 surveys were completed. Of these, 15 surveys were not sufficiently completed and were removed from the analysis. In total, 413 surveys were completed and available for analysis. Of the survey completions, 84% were completed on site at the terminals. The remainder was returned via fax, mail or drop box at one of the terminal offices (Cast or racine). Surveys by mode of completions are detailed in figure 2 below.
9 The primary objective of
the field test was to confirm
the approach to the data
collection, including location
of surveyors and security
protocols. However, some
survey questionnaires were
also completed with drivers
and deemed to function well.
10 This timing is with the
exception of the field test
day, which began later in
the morning and for which
the primary objective was to
confirm survey process and
surveyor locations.
Date Time
Field test June 5 9am to 1pm (approx.)
Main data collection June 8 to 12 6am to 12pm
Additional data collection day June 18 6am to 12pm
Completion Mode # % of Completions
On site 346 84%
Mail 49 12%
Drop box 14 3%
Fax 4 1%
Total 413 100%
Figure 1 – Driver Survey Data Collection Schedule
Figure 2 – Survey Completions by Mode

26 Port of Montreal Drayage—Labour Profile and Communications Study — APGST and MPA
Overall, drivers were very interested in the objective of the survey. This interest in the study is reflected in the survey response rate achieved. Over the course of the data collection, 848 survey questionnaires were distributed, representing a gross response rate of 49%.11
Employer Survey
A total of 32 drayage driver employers completed the survey. This represents a 32% response rate (based on the 101 sample of trucking companies). Similar to the driver survey, companies expressed interest in the subject matter of the survey, allowing a considerable response rate to be achieved within a limited period of time. final results are presented in figure 3 below.
Survey length was slightly shorter than anticipated, with most taking less than 15 minutes to complete.
8. DATA CLEANING AND ANALySIS
Data from the driver survey required a considerable amount of cleaning and coding prior to analysis. Without the controls and conditions programmed into an electronic survey, or the experience and guidance of a surveyor, self-completed, hard copy surveys often result in questions being answered in a variety of ways, requiring decisions to be made on how to treat the data to make it consistent. This was the case for many of the questions in the driver survey, particularly questions prompting an open-ended answer (as opposed to respondents selecting pre-coded responses from a list).
first, all responses were data entered as they appeared on the survey. Data analysts then treated the data, making decisions on how to proceed with responses, then cleaning and coding them. All 413 surveys data entered were included in the analysis. While many surveys did include non- responded questions, none were incomplete enough to warrant being removed from the dataset.
Data from the employer survey were easier to prepare due to aforementioned controls and conditions programmed into the survey instrument. Data was cleaned and extracted to SPSS for analysis.
11 The response rate signi-
fies that of the 848 surveys
distributed, 49% (413) were
completed and returned.
# % of Completions
Online Completions 24 75%
Telephone Completions 8 25%
Total 32 100%
Figure 3 – Trucking Company Survey Completions

27 Port of Montreal Drayage—Labour Profile and Communications Study — APGST and MPA
9. METhODOLOGICAL CONSIDErATIONS
There were some methodological challenges faced in completing this study. These are discussed below.
Limited understanding of the drayage driver population accessing the port
The original understanding was that the Port of Montreal processed an average of 2,500 trucks each day. The original target therefore aimed to complete surveys with 18% of this population (450 surveys). After deciding to narrow the scope of the study to container truckers, the volume trucks processed was revised to an average of 1,500 each day. This, combined with the data collection occurring during an unanticipated slower period at the port terminals resulted in less surveys than planned being completed each day. by adding an extra day of data collection, 413 surveys were completed. If looking at the population by using the average of 1,500 trucks, the data collection was able to capture 27% of this population. however, it should also be noted that drivers make multiple trips to the Port each day. This is understood by the Port and was witnessed by the survey team as they encountered the same drivers multiple times each day and throughout the data collection. Therefore the number of unique drivers, as opposed to trucks, that visit the port is less than 1,500. Consequently, this means that the 413 completed surveys represent more than 27% of drivers that regularly access the port. for a more accurate measure of the driver population and the proportion captured by the survey, data collected by the Port on the unique drivers accessing the port during the data collection period could be used.
Small sample for employer survey
Due to the voluntary and self-selecting nature of the survey research, it should be recognized that the survey results may not be representative of the range of perspectives and opinions, particularly around communications, within the port drayage. This is particularly true for the employer survey, of which a small sample of 32 employers completed the survey. Information from both surveys provide a snapshot of current and planned communication practices, but generalization to all port drayage drivers and trucking companies should not be assumed. further, the small number of employer surveys limits the depth of analysis possible. While all data were analysed in aggregate, the small sample size meant that it was not possible to look at results by company characteristics (i.e. size of vehicle fleet, number of drayage drivers etc.) that may impact communication approaches and highlight nuances.

28 Port of Montreal Drayage—Labour Profile and Communications Study — APGST and MPA
APPENDIX BlITERATURE REVIEw

29 Port of Montreal Drayage—Labour Profile and Communications Study — APGST and MPA
1. INTrODuCTION
In 2013, the Asia Pacific Gateway Skills Table produced a Labour force Profile of Port Drayage Drivers in Metro vancouver, in addition to driver demographics and employment information, the report also looked at common drayage issues including truck turnaround times and compensation both of which affect the overall industry performance. This report received positive feedback by public and private stakeholders. from this project there came interest in the potential for benefits for stakeholders in eastern Canada on undertaking similar profiles of the industry.
The Asia Pacific Gateway Skills Table (the Skills Table) has partnered with the Montreal Port Authority (MPA) to engage the services of r.A. Malatest & Associates Ltd. (Malatest) to conduct the Port of Montreal Drayage Labour Profile and Technology Penetration Study. The Skills Table and MPA are particularly concerned with port drayage and labour force issues that have received considerable attention since the 1990s. This study focuses on drayage driver serving the Port of Montreal (POM), which processes about 2,500 trucks daily but is served by a population of approximately 6,500 registered drivers. Moreover, this study will establish a labour force profile of port drayage drivers working in the POM and identify communication technologies for real-time information currently in use or planned for use by the drayage industry.
The current literature review was conducted to inform the planning and development of research tools and to provide an understanding of existing labour market and communications information for the trucking industry and most importantly for the drayage sector. The review examines relevant research on the drayage sector in Montreal and in other jurisdictions. This includes studies and data relevant to port drayage drivers, a review of relevant provincial and international studies on labour market data and demographic profiling of the trucking industry in Quebec and elsewhere, and a review of any best practices of data sampling strategies to improve data collected. In addition, this document summarizes research on tracking and communication devices (e.g., smart phone apps, mobile devices, GPS, SMS, etc.) used by various employment types and the preferred and/or best methods of real-time information/communication in use or soon to be in use among drayage drivers and dispatchers/stakeholders involved in the industry.
2. LITErATurE rEvIEW fINDINGS
The following section details the relevant literature available on the drayage sector in Montreal and in other jurisdictions. from the literature/jurisdictional scan, 28 studies were identified and examined for best practices and their relevance for the present study. A number of search engines were utilized to find articles, papers and studies including: Google Scholar, Simon fraser university electronic database (Sfu), and Government Search Databases (i.e., Transport Canada, Statistics Canada). Google Scholar was the primary search engine used, followed by Sfu electronic database for peer-reviewed papers.
lITERATURE REVIEw
30 Port of Montreal Drayage—Labour Profile and Communications Study — APGST and MPA
StudyEconomic analysis for adaption to climate change: St-Lawrence Great Lakes system and the port of Montreal
Author(s) Brian Slack and Claude Comtois
Date 2014
Focus Port of Montreal
Source File sent by author Claude Comtois
Overview The paper looks at various mitigation and adaption measures that are being presented and implemented to deal with changing water levels at the Port of Montreal. The issue of water depth is not only a contemporary one but also a future concern with climate change, since the port relies on the flow of the St. Lawrence River. The authors argue that the economics of these adaptations solutions is not well understood. The goal of the paper is to examine recent container vessel movements and the extent to which their capabilities were constrained by limited water depths and the implications of these dislocations. Additionally, the authors measure the profitability of the Montreal route through a shipping cost model. Moreover, the paper goes on to analyze solutions that are being implemented in Montreal. Options presented in other studies that were examined in this paper include engineering solutions to try to provide a deeper channel, such as the construction of lateral and parallel dykes and a barrage and control infrastructure similar to the London Flood Barrier. Additionally, technology and regulations have had positive impacts on improving the carrying capacity of ships. The authors conclude that in the short term, the best strategy are technological and regulatory changes that aim at increasing efficiency of utilizing the existing channel rather than modifying the river regime to reduce seasonal fluctuations.
Relevance This paper provides some background on current issues facing the Port of Montreal and the use of technological solutions aimed at increasing port efficiency.
Eastern (Ontario-Quebec) Gateway

31 Port of Montreal Drayage—Labour Profile and Communications Study — APGST and MPA
Study The Port at the heart of Daily Life: 2013 Annual Report
Author(s) The Montreal Port Authority
Date 2013
Focus The Port of Montreal
Source Online, http://www.port-montreal.com/files/PDF/publications/rapport-annuel-2013-en.pdf
Overview In 2013, 28.2 million tonnes of cargo moved through the Port of Montreal (POM). The volume of containerized cargo handled in 2013 was 11.9 million tonnes (down 1.1 percent compared to 2012). This embodies 1.4 million 20-foot equivalent unit containers (TEUs). With its partners, terminal operators and road and rail carriers, the POM bears a great responsibility—it plays a key role in the logistics chain of thousands of entrepreneurs, manufacturers, merchants, businesspeople, institutions and government agencies. The MPA project that is funded by Transport Canada will monitor truck movements through the network of card readers and will identify where and when too much traffic forces drivers to wait. Based on this information, action can be taken to reduce waiting time and, in turn, GHG emissions, and improve the flow of truck traffic and even transit time. The MPA invested a record $55 million in its facilities in order to provide more space for container storage.
Relevance This annual report provides useful information regarding the economic benefits; both nationally and internationally, affiliated with the Port of Montreal’s trading and other port activities. It also details the Port of Montreal’s initiative, as part of a Transport Canada program, to reduce GHG emissions from trucks transporting goods to the Port. The MPA will be tracking trucks through the use of their access cards, thus collecting data on their comings and goings in real time. Furthermore, the report provides some relevant POM data.
Study The Ontario-Quebec Continental Gateway: A Situational Analysis of Human Resources Needs
Author(s) Souleima El Achkar
Date 2009
Focus Ontario-Quebec
Source Online, http://www.csls.ca/reports/csls2009-2.pdf
Overview The report examines human resource and skills issues and challenges across the Gateway sectors in Ontario-Quebec (i.e., construction, air, marine, road and rail transportation, supply chain and multimodal transportation, and border security). According to the report, driver shortages in road transportation are attributed to recruitment and retention problems linked to low wages, difficult work conditions, changing lifestyles preferences, competition with other sectors for workers, unrealistic expectations of new entrants, and informal recruitment processes that are inconsistent with increasing skill requirements for the truck driver occupation. Several industry representatives from Ontario and Quebec state that the driver shortage was a shortage of skills (i.e., qualified drivers) rather than persons (drivers). The report highlights entry barriers for foreign workers and immigrants in the form of language barriers and foreign credentials recognition difficulties. Women and Aboriginal people are also underrepre-sented in the sector. In order to address shortages and barriers, trucking companies have initiated a number of human resource strategies, including providing more stable schedules, responding to driver requested for increased or decreased work hours, increasing salaries, and offering performance bonuses. Industry also implements professional driver certification programs; however, these can be quite costly and require cost reduction strategies such as “Earning your Wheels” (CTHRC).
Relevance The report provides useful data on demographics, skills gap, and labour shortages of the trucking industry in Ontario-Quebec, which provide context for the present study.

32 Port of Montreal Drayage—Labour Profile and Communications Study — APGST and MPA
Study NB Transportation Assets Market Research
Author(s) Mary R. Brooks Transportation Consulting and MariNova Consulting Ltd.
Date 2013
Focus Port of Halifax
Source Online, http://maryrbrooks.ca/wp-content/uploads/2013/04/T8080-120172-Port-Trucking-Final-Report-28-Mar-2013.pdf
Overview This project involved a comprehensive examination of literature that suggested improvements to port-related trucking, and analysis of trucking turnaround times will reduce GHG emissions from port-related trucking. The project conducted two focus groups, consulting with stakeholders of the industry including trucking firms, container terminals and logistics firms. From these consultations there was substantial concerns and interest in finding solutions to changing traffic lane arrangements to reduce idling/traffic congestion in the downtown core of the city, reduce gate congestions and the ability to move empty containers off-peak.
Relevance The project presents an overview of the container drayage industry and cargo flows in another jurisdiction that could provide context to the drayage sector and highlight potential issues to be explored during the employer survey. Further, the project contains a useful and comprehensive literature review and annotated bibliography of relevant studies.
Study Labour Force Profile: Port Drayage Drivers in Metro Vancouver
Author(s) Davies Transportation Consultants, Wave Point and R.A. Malatest
Date 2013
Focus Vancouver
Source Online, http://apgst.ca/projects/pdfs/LabourForceProfileReport2013.pdf
Overview The study developed a profile of the port trucking labour force in Vancouver in order to better understand employers’ and employees’ needs, to enable the industry to respond with appropriate human resource strategies, and to provide insight and recommendations that can inform and guide future initiatives in the drayage sector. The study was carried out during the winter of 2013, and a total of 1,750 surveys were distributed and 639 completed.
Relevance This study will be providing Malatest and the project team, with an in-depth understanding of the drayage sector and the intended research for Port of Montreal Drayage. In particular the study’s methodology (e.g., survey administration, data collection, data processing, etc.) will be a useful guide for the present project.
Other Gateways in Canada

33 Port of Montreal Drayage—Labour Profile and Communications Study — APGST and MPA
Study Drayage Owner-Operators; Understading Container Drayage Owner-Operators in Metro Vancouver
Author(s) Colledge Transportation Consulting
Date 2013
Focus Vancouver
Source Online, http://apgst.ca/projects/pdfs/DrayageOwner-OperatorsReport2013.pdf
Overview This study’s two objectives are: 1) detailing a toolkit for owner/operators to better understand and manage their business and money, and 2) a profile of the industry, including the local container drayage business as well as a drayage cost model, and research and interviews with successful trucking companies and owner-operators to identify best practices and recommendations.
Relevance The study highlights and includes research in Metro Vancouver that may be of relevance to the present study, particularly in the development of the employer survey. Important research in the study include the licensing, reservation and passes required to access PMV container terminals, an in-depth profile of drayage drivers (i.e., owner-operators, company drivers, etc.), and equip - ment utilized by the drayage industry and dispatching technology (e.g., proprietary freight tracking system, mobile phones, GPS units, Java-based dispatching system, Blackberrys, etc.).
Study Port Metro Vancouver Truck Turn Time Study: Analysis, Results and Recommedations
Author(s) The Tiaga Group
Date 2013
Focus Vancouver
Source Online, http://tiogagroup.com/docs/PortMetroVancouverTruckTurnTimeStudy2013.pdf
Overview This study looks at the average “truck turn times”, the distribution of turn times, and the frequency and causes of long turn times (i.e., taking more than 60 minutes). The findings showed that average turn time, in PMV (GPA data ranged from 36 minutes at Centerm to 64 minutes at Vanterm, with a three-terminal average of 56 minutes) are roughly competitive with the largest and busiest ports in North America. From the data on turn times the causes identified for long turn times (37% of the trips by GPS-equipped trucks to Vancouver ports in the summer/fall of 2012 had turn times longer than 60 minutes) include long queues in the morning, equipment problems, rail switching blockages, the effect of peak operations and terminal gate capacity. This study provides detailed descriptions of a number of recommendations intended to mitigate long truck turn time including restricting early morning arrivals, expand the use of night gates, adjust appointment allocation, compliance initiatives, etc.
Relevance Montreal and Vancouver both have high volumes at their ports; therefore, a lot of the issues identified in this study could be similar to those experiences in Montreal on potential port issues affecting both drayage drivers and employers.

34 Port of Montreal Drayage—Labour Profile and Communications Study — APGST and MPA
Study Port Metro Vancouver Truck Turn Time Study: Analysis, Results and Recommedations
Author(s) Federal-Provincial Task Force
Date 2005
Focus Lower Mainland
Source Online,http://www.bctruckingforum.bc.ca/Task_Force_Final_Report.pdf
Overview A three-person Task Force was appointed after container truckers shut most road transport to terminals in the Lower Mainland in the summer of 2005. The Task Force was mandated to examine “best practices” in other ports to identify potential operational enhancements within ports in the Lower Mainland. IBI group conducted this study of best practices in major container ports in North America, Europe and Asia. The results helped guide the Task Force in their recommendations. The research showed trucking firms in the Lower Mainland are constantly unable to exercise pricing discipline to adjust rates in response to cost pressures and changes in industry operating practices. The task force argues that this inability to respond to changing circumstances and costs increases in a timely manner that ensures the income stability of truckers is clear evidence of market failure. Included in their recommendations are modifying the licensing scheme and an exclusion or exemption from the provisions of the Competition Act.
Relevance This research is relevant when considering potential external impacts (e.g., economic costs, etc.) on port functioning and highlight potential issues for drayage drivers.

35 Port of Montreal Drayage—Labour Profile and Communications Study — APGST and MPA
Study Driver-LMC Relationship in Port Drayage: Effects on Efficiency, Innovation and Rates
Author(s) Marin Economic Consulting
Date 2014
Focus LA/Long Beach and Oakland
Source Online, http://www.marineconomicconsulting.com/whitepapers/ MEC_DrayageDrivers_081414.pdf
Overview The study presents an overview of the port drayage industry in California and goes over the different relationships between drivers and motor carriers in the modern port drayage system. They primarily fall into three models: 1) the independent owner operator (IOOS), 2) the employee driver (EDs), and 3) the lease driver (LDs). In LA/LB, there were 16,500 trucks in the fleet of licensed motor carriers (LCMs), with 6000 LMCs providing drayage services. Within the drayage sector, the study suggests two markets: 1) LMCs contract with shippers, carriers and others involved in goods movement; and 2) LMCs which contract with drivers to perform the service. Both these markets are highly competitive, as evidenced by the large number of independent owner operators and LMCs that continuously provide drayage services. The study suggests that perhaps because of this competition, much inefficiency remains to exist in the drayage system. These include long waits at the terminal gates and long turnaround time on the terminals for trucks and drivers. Furthermore, when loads have been delivered, there is insufficient coordination in the effort to find nearby containers that need to be carried back to the port. The Clean Truck program in LA attempted to replace older trucks with newer, cleaner ones. The program tried to direct that all drivers serving the port had to be employed by an LMC, because these firms were most likely to be able to afford new trucks, while IOOs were more likely to operate older vehicles (due to cost). At present, little is known about how the different driver-LMC relationships affect efficiency and pricing in the industry. The study attempts to elaborate on the three models and their respective abilities to provide efficient, innovative, and low-cost services.
Relevance This study presents information on the drayage driver composition in the US, which may provide context to the current demographics of Montreal drayage drivers.
US Studies/North America

36 Port of Montreal Drayage—Labour Profile and Communications Study — APGST and MPA
Study NCRFP Report 11: Truck Drayage Productivity Guide
Author(s) The Tioga Group, University of Texas, and University of South Carolina
Date 2011
Focus US Ports
Source Online, http://onlinepubs.trb.org/onlinepubs/ncfrp/ncfrp_rpt_011.pdf
Overview The guidebook/study’s research was conducted at the ports of Houston, LA/Long Beach and New York-New Jersey. The study utilizes a variety of evidence-based research methods including analysis of transaction databases, gate camera analysis and automated vehicle location geofencing techniques. The goal of the research is helping to better understand the causes of bottlenecks, delays, and extra trips that increase the time, cost, emissions, and congestion impacts of port drayage further than what is necessary to accomplish the primary transportation task. The impact of drayage on emissions and GHG is directly linked to the time spent idling and moving. Delays that increase idling and inefficiencies that create extra trips add to emissions and congestions without increasing productivity. According to the estimates developed from the research, the highest cost is driver and tractor time spent in marine container terminals (estimated at over US $1 billion annually) (note: the total cost of drayage is actually much higher, because it includes time in transit and at customers locations, as well as time at the ports). A potential solution presented in the study to this drayage problem is better use of port and terminal information systems to ensure that import containers are ready to be picked up.
Relevance This comprehensive study of US ports could be useful when looking at port complexities and issues that are experienced in most ports around the world (Asia, North America, etc.). However, it should be noted that each port will experience their own particular variations on these issues, and have different programs/strategies to address them. Also useful from this study is the methodology used—in particular the site visits, field data collected, survey questions and the method of administration as it is similar to the one proposed in the current project.
Study NCFRP Project 14: Truck Drayage Practices: Literature Review
Author(s) The Tioga Group, University of Texas, and University of South Carolina
Date 2009
Focus US Ports
Source Online, http://onlinepubs.trb.org/onlinepubs/archive/NotesDocs/NCFRP14_Task3LiteratureReview.pdf
Overview The study is a comprehensive literature review of 100 relevant sources on truck drayage practices (specifically on seaport drayage). The study provides detailed information on the background of the port drayage industry, drayage operations and characteristics, factors affecting drayage operations (e.g., terminal-related factors, queuing, extraneous factors (i.e., road and traffic conditions), etc.), consequences of inefficient drayage operations, current and potential initiatives to improve drayage operations (e.g., extended gate hours, appointment systems, virtual container yards, information systems, chassis pools, government and port initiatives, multi-strategy, etc. ) driver demographics, working conditions, truck characteristics, trip characteristics, wages and service areas. The literature review identified performance metrics (e.g., delay time, truck turn time, etc.) that were used in the referenced studies to assess drayage productivity.
Relevance This literature review document presents many issues that are relevant to the Atlantic and Pacific regions, as well the Eastern region. More specifically, the sections that provide data on driver demographics, labour market data, driver experience, truck specifications and improved communication and information systems will be relevant for the current study on port drayage drivers working in the Port of Montreal.
37 Port of Montreal Drayage—Labour Profile and Communications Study — APGST and MPA
Study Report on Port Truckers’ Survey at the New Jersey Ports
Author(s) David Bensman and Yael Bromberg, Rutgers University
Date 2008
Focus Port of New York/ New Jersey
Source Online, http://www.cleanandsafeports.org/wp-content/uploads/2011/01/BensmanDriver_Survey_Report-1-23-09.pdf
Overview The study consists of a survey that collected data from 299 truck drivers, who were selected at random at the ports of Newark, Elizabeth, and Bayonne.
This comprehensive study of US ports could be useful when looking at port complexities and issues that are experienced in most ports around the world (Asia, North America, etc.). However, it should be noted that each port will experience their own particular variations on these issues, and have different programs/strategies to address them. Also useful from this study is the methodology used—in particular the site visits, field data collected, survey questions and the method of administration as it is similar to the one proposed in the current project.
Relevance The survey in this study may be relevant to the present project because it will be similarly administered at random at the Port of Montreal with gratuities provided as incentive to complete the survey (in this study the respondents were given gift cards worth US $20 when redeemed at local supermarkets and convenience stores). It might also be helpful information when developing/designing the survey/sample for the present study, however, the survey size for drivers is smaller than what is planned in the present study.
Study A Survey Drayage Drivers Serving the San Pedro Bay Ports
Author(s) CGR Management Consultants LLC
Date 2007
Focus LA/Long Beach
Source Online, http://www.polb.com/civica/filebank/blobdload.asp?BlobID=3724
Overview For this project two surveys were conducted. The purpose of one of the surveys was to estimate the income of independent truckers (IOOS) who provide port container drayage services for the San Pedro Bay Ports. The goal was to help further characterize the drayage industry serving these two ports. The second survey was of the Licensed Motor Carriers (LMCs) providing services to the San Pedro Ports and LA/Long Beach. Overall, there were 54 respondents to the LMC survey and 209 to the IOO survey. For the LMC’s survey, they reported using 1,555 IOOs and have 47 employee drivers as well. The authors estimate LMC’s represent approximately 19% of the total annual container moves associated with the two Ports.
Relevance The survey data could be helpful in understanding type of questions, collection methods and for comparative purposes, when data for the present study is provided. In particular, it is interesting to note the study’s limitations (e.g., short timeframe in which the two surveys had to be designed, conducted and tabulated, etc.). Similarly to the aforementioned study, the survey data results on the demographics of the drivers, truck specifications, employment type, etc., could be useful information for the present study.

38 Port of Montreal Drayage—Labour Profile and Communications Study — APGST and MPA
StudyUnderstanding the Truck Driver Supply and Demand Gap and Its Implications for the Canadian Economy
Author(s) Vijay Gill and Alicia Macdonald
Date 2013
Focus Canadian Trucking Industry
Source Online, http://www.drivershortage.ca/wp-content/uploads/2013/03/Understanding-the-Truck-Driver-Supply-and-Demand-Gap1.pdf
Overview The study quantifies the truck driver supply requirements and the resulting pressure that the for-hire trucking industry will face to attract new drivers. The report finds that the driver supply will remain relatively stagnant until 2020. The report assumes ongoing labour productivity increase of two-thirds of 1 per cent per year for the for-hire trucking industry, thus the supply and demand gap for truck drivers will be nearly 25,000 drivers (or about 14 per cent of total driver population needed to meet demand by 2020). Issues identified in the report that could hinder the growth of drivers include congestion, changes in hours-of-service (in the US), thousands of drivers approaching retirement age and the very small number of young drivers taking their place. The results from the study project a decline in the truck driver supply by 2020 in Quebec, with a projected increase of supply in Ontario based on the anticipated stronger immigration entry and interprovincial migration. However, the demand for Quebec is projected to incrementally increase. The supply and demand gap, in 2020, estimated by the report stands at 37.2 %.
Relevance The study illustrates the Human Resource challenges and truck supply and demand gap in the wider trucking industry in Canada and its implications for the Canadian economy. There are useful statistics that could be relevant regarding the present study’s labour force profile of port drayage drivers in the Port of Montreal. The report covers the entire trucking industry and is a general representation of the trucking industry across Canada; it does not break it up by type of trucking service (e.g., drayage, etc.).
Labour Force Studies within the Canadian Trucking Industry

39 Port of Montreal Drayage—Labour Profile and Communications Study — APGST and MPA
Study Beyond the Wheel: Survey Technical Report—2012
Author(s) Canadian Trucking Human Resource Council
Date 2011-2012
Focus Labour Force Issues in the Trucking Industry
Source Online, http://www.truckinghr.com/sites/default/files/documents/LMI%20Survey%20Technical%20Report.en.pdf
Overview The following study collected a total of 1,057 surveys by trucking companies and 21 were companies in the Allied and Associated Trades sectors. The majority of companies are for-hire operators, with the highest saturation occurring in Quebec (87%) and Saskatchewan (76%).
Relevance The survey administration was conducted by R.A. Malatest & Associates Ltd. Three modes for survey completion were used, which include mail/fax, online and telephone. The sample included the entire trucking industry, counting the drayage sector, but does not disaggregate sectors in the report. This study highlights issues that the Port of Montreal may be currently or will be experiencing in terms of employment shortages, employment growth, and high demands for trucking services.
Study Beyond the Wheel: Final Report for Industry
Author(s) Canadian Trucking Human Resource Council
Date 2012
Focus Labour Force Issues in the Trucking Industry
Source Online, http://www.truckinghr.com/sites/default/files/documents/Final%20Report%20for%20Industry%20-%202012.12-029.en.pdf
Overview Human Resource challenges are a major issue in the trucking sector. It is essential that initiatives are undertaken to help address the current, and future human resource requirements in this industry. When the report was written there were approximately 31,000 trucking firms that employ upwards of 290,000 individuals, with 68% of whom are truck drivers. The current trucking industry is male-dominated and the workforce, like all industries, is aging. The CTHR survey of trucking employers shows that 18 % of the workforce included in the survey were 55 years of age and older, illustrating that the trucking sector could be losing close to 20% of its workforce to retirement. At the time of the survey, the vacancy rate for the industry as a whole was 4 %, signifying that 12,000 positions were not filled. This was reported highest for Nova Scotia, Alberta and British Columbia. Furthermore, the survey shows a high turnover rate for the industry overall (12%, including retirement), illustrating the challenge and expense for employers who have to keep recruiting and training new staff. This is important with expected growth in the Canadian economy. In 2011, the industry was expected to employ an additional 153,000 people (total 369,000), or an average of 14,100 new recruits per year, by 2021. Furthermore, a higher boundary estimate pegged the expected demand at 289,000 to account for growth in the economy and replace workers who either retire or leave the sector for other reasons.
Relevance This study is relevant for providing an overview of the HR situation for the entire trucking industry in Canada. It highlights issues particular to Quebec, which may also be experienced within the drayage sector at Port of Montreal.

40 Port of Montreal Drayage—Labour Profile and Communications Study — APGST and MPA
Study Technology and Skills in Transportation
Author(s) Asia Pacific Gateway Skills Table
Date 2013
Focus Western Canada
Source Online, http://apgst.ca/projects/pdfs/Technology-and-Skills-in-Transportation-Final-July2013.pdf
Overview Forty individuals from across western Canada and representing all six sectors (Air, Construction, Logistics, Marine, Rail and Trucking) in the Asia Pacific Gateway were surveyed or interviewed to gather their perspectives about the current priorities in technology and innovation investments. Overall, most respondents put propriety on capital infrastructure rather than human capital investments (e.g., apps, smart phones, tablets, etc.). For instance, respondents put environmental technologies at the top of the list followed by business process automation investments. When respondents answered questions regarding the most important area for innovation focus, Supply Chain/Logistics were seen as the most important area, and Cross Entity Collaboration came second for those interviewed and several of those surveyed.
Relevance The survey data on technology and innovation, and the type of questions posed may be useful for the present project’s study objectives to identify the various communication technologies in use or planned to be in use by the industry to communicate real-time information between drayage drivers and dispatchers or other relevant stakeholders.
Study Improving Truck Arrival Information at North Range Container Terminals
Author(s) Verena Flitsch and Carlos Jahn in Pioneering Supply Chain Design: A comprehensive insight into emerging trends, technologies and applications
Date 2012
Focus North Range
Source Online, http://books.google.ca/books?hl=en&lr=&id=nCuzRGxDAbYC&oi=fnd&pg=PA115&dq=Port+of+Montreal+drayage+industry&ots=b7j58EESws&sig=7KHzJdmKvMhMZwkcLyHyhZd1Vbc#v=onepage&q=Port%20of%20Montreal%20drayage%20industry&f=false
Overview The study examines the use of “truck apportionment systems” (e.g., truckers receiving traffic updates via SMS, streamlines check-in process, information on local businesses that accommodate truckers, video surveillance, etc.) implemented at several ports located mainly outside of Europe to counter long waits at the gates and yards. The study highlights potentials on truck appointment systems but also their hindrances (e.g., for meaningful application it is essential that the majority of truck trips are incorporated). The study recommends further research on the link between trucker responses and the communication platform, which they stress, is essential to evaluate technology selection.
Relevance The article in this book could be useful guide for the present study when examining the preferred method of real-time communication devices (e.g., appointment systems, etc.,) used by various employment types and between dispatchers/stakeholders (web-based or mobile).
Technology & Communication used in the Drayage/Trucking Sector

41 Port of Montreal Drayage—Labour Profile and Communications Study — APGST and MPA
Study Terminal Appointment System Study
Author(s) Philippe Morais and Elisabeth Lord
Date 2006
Focus North America
Source Online, http://www.tc.gc.ca/media/documents/policy/14570e.pdf
Overview The study reviews programs and strategies applied at North American ports to accelerate cargo handling at ports and terminals aimed at reducing congestion, gate idling time, and GHG. The study provides examples of best practices in the United States and proposes similar strategies to improve port/terminal operation efficiency and reduce emissions at Canadian ports. A quantitative method was developed by the authors to evaluate the impact of port technologies and appointment systems to reduce GHG emissions. The report suggests a comprehensive Canadian strategy would include policies, programs, regulation, air quality mitigation programs, and infrastructure improvements. Moreover, the report notes that the introduction of gate appointment systems, extended gate and new automatic technologies offers the best promise to more efficient operations.
Relevance The literature review, quantitative data, telephone interviews and site visits, and case studies are useful for understanding the use of technologies and information systems, to reduce congestion and delays. The research will provide contextual background for the technology and communication portions of the driver and employer survey.
Study Port of New Bedford Truck Appointment System
Author(s) Kanann Consulting US, Inc
Date Unknown
Focus The Port of New Bedford
Source Online, http://northeastdiesel.org/pdf/workgroup/NewBedfordTrucksITS.pdf
Overview The document provides an overview of the New Bedford Intelligent Transportation Systems (ITS) project, which includes the Truck Appointment System. The intended goal of the project in terms of terminal drivers and brokers is to reduce travel delays and improve supply chain reliability. The solution identified in the paper is to create a web based truck sharing system that has SMS and email notification capabilities that will allow truckers to subscribe to receive traffic event messages and Port Announcements. Therefore, giving trucking companies, owner operators and brokers’ estimates of their likely arrival times, streamlines the check-in process, and provide information on local businesses that accommodate truckers.
Relevance The information is useful for the background on the practices and the implementation of technology and communication devices in order to reduce travel delays and improve port efficiencies.

42 Port of Montreal Drayage—Labour Profile and Communications Study — APGST and MPA
StudyLeading US container port deploys RFID technology to support productivity, safety and sustainable growth for the coming decades
Author(s) IDENTEC Solutions
Date 2008
Focus Georgia Port Authority
Source Online, http://www.triple-itech.com/pdf/container_georgia_ports.pdf
Overview Georgia Port Authority (GPA) was interested in finding a data capturing technology that would reliably indentify trucks in the harsh marine environment, improve truck gate throughput, reduce turn time in the yard and gain highly accurate overall inventory of our truck traffic. Radio frequency identification (RFID) was the chosen technology to achieve this. Following extensive research, GPA honed the vision for an Automated Terminal Asset Management System (ATAMS), covering four new technologies to capture key data and manage business processes, plus middleware to integrate data into central terminal management applications: 1) Optical character recognition (OCR) to identify containers and chassis passing through the gates; 2) A position detection system (PDS) to locate containers and equipment in the yard; 3) RFID to track trucks moving through the gates and around the terminal ; and 4) A wireless local area network for data transmission .
Relevance The information on the system and RFID in GPA, and the improvements in productivity and reduction in congestion and emissions could be useful information when considering real-time communication technologies with dispatchers and truck drivers at the Port of Montreal.

43 Port of Montreal Drayage—Labour Profile and Communications Study — APGST and MPA
Study Report of the CTA Blue Ribbon Task Foruce on the Driver Shortage in Trucking
Author(s) Canadian Trucking Alliance
Date 2012
Focus Trucking Industry Labour Shortages
Source Online, http://www.drivershortage.ca/wp-content/uploads/2013/03/120402-Report-of- CTA-Blue-Ribbon-Task-Force-on-Driver-Shortage-in-Trucking-Final.pdf
Overview The task force panel looked at the driver shortage in the trucking industry. Based on the results from the study, the shortage is caused by: 1) demographics; 2) compensation; 3) quality of life; and 4) driver qualifications. In this industry truck drivers are the most important asset; they are the face of the industry to customers and the public. The task force concludes it is the carriers who are ultimately responsible for their businesses and thus for ensuring they have the individuals to do the work. Though the report acknowledges the role other stakeholders have in helping the industry meet this challenge, their efforts are likely to be of limited assistance until the carriers first take action themselves.
Relevance This report is helpful when considering labour market data and demographic profiling of drivers in the trucking industry. It includes a bibliographic summary of a number of older Statistics Canada studies, Price Waterhouse, as well as some conducted by the Canadian Trucking Human Resources Council (CRHRC).
Study Operating Costs of Trucking and Surface Intermodal Transportation in Canada
Author(s) Ray Barton and Associates Ltd, Logistics Solution Builders Inc. And the Research and Traffic Group
Date 2008
Focus Trucking Industry
Source Online, http://www.bctrucking.com/sites/default/files/tc_2008_operating_costs_of_trucks_in_canada_in_2007.pdf
Overview The project details estimates for operating costs of trucks on a provincial and territorial basis by different sectors within the trucking industry. It includes a comparison of direct trucking to rail intermodal transportation, the comparative truck operating cost structure for International (US based) operations, and depicts differences from base case trucking service options including use of owner operators, variations with fleet size, and private trucking costs compared to for-hire trucking costs.
Relevance This study provides useful information on truck operations productivity and costs and input unit costs, which could be important when examining the drayage sector in Montreal.
Trucking Industry
44 Port of Montreal Drayage—Labour Profile and Communications Study — APGST and MPA
3. SuMMAry Of fINDINGS
The drayage industry across North America has experienced similar economic inefficiencies due to a number of factors including, slow truck turnaround times, long queues, technological and communication issues and labour shortages in the trucking and port drayage industry. Ports across North America represent a vital and critical economic engine for local, national, and international markets. The issue especially of truck turnaround times and the impact on productivity for those companies serving ports has led to substantial capital and time invested in designing new gate facilities and tracking and communication technologies. Additionally, regulations have been used and implemented in some regions to unionize the industry, set standards for vehicles used by independent drayage drivers and companies and extend gate times to increase productivity, competitiveness and reduce GhG emissions.
for the drayage industry, truck drivers are critical. Drayage drivers include three key employment types: 1) Independent Owner Operators (IOOs); 2) Lease Drivers (LDs); and, 3) Employee Drivers (EDs). The Canadian Trucking Alliance report (2012) sheds light on the labour shortages in the trucking industry. The taskforce that prepared the report suggest the shortage is caused by demographics, compensation, quality of life, and driver qualifications. Moreover, according to report by Souleima El Achkar (2009), immigrants, women and Aboriginal people are under- represented in the trucking industry. The demographics of these drivers are typically male and over the age of forty.
This study will be focusing on the drayage sector in the Port of Montreal (POM). under the Clean Transportation Initiative on Port-related Trucking (2013–2016), the POM set out to determine measures to reduce truck-related GhG. The purpose of this literature review is to provide more in-depth understanding and information on the drayage industry in Montreal and other jurisdictions, and in particular look at turnaround times and communication of road information to drivers. In 2012, the beyond the Wheel report projected the supply and demand gap for the trucking industry in Quebec, by 2020, at 37.2 percent. The aim of this study is to create a better labour profile and deeper understanding of the drayage industry in Quebec to narrow this estimated gap.
Other emerging issues related to drayage drivers and the industry today and in the future include:
1. Temporary foreign Worker Program and regulations;2. recruitment and Attrition rates of younger Truck Drivers;3. recruitment of female Truck Drivers;4. recruitment of Aboriginal Truck Drivers;5. Skills and Educational Training/Programs and funding; and,6. Efficient Communications Technologies used by fleet.
45 Port of Montreal Drayage—Labour Profile and Communications Study — APGST and MPA
APPENDIX CSUMMARY Of RESUlTS
AND DATA TABlE
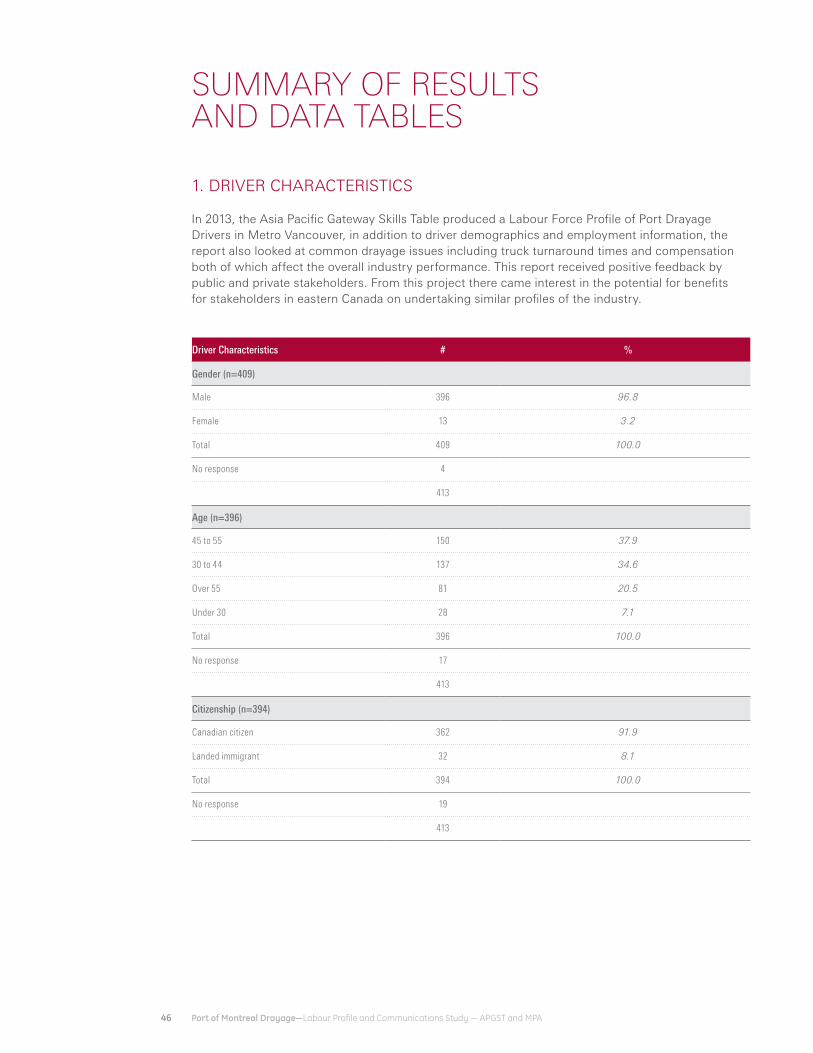
46 Port of Montreal Drayage—Labour Profile and Communications Study — APGST and MPA
1. DrIvEr ChArACTErISTICS
In 2013, the Asia Pacific Gateway Skills Table produced a Labour force Profile of Port Drayage Drivers in Metro vancouver, in addition to driver demographics and employment information, the report also looked at common drayage issues including truck turnaround times and compensation both of which affect the overall industry performance. This report received positive feedback by public and private stakeholders. from this project there came interest in the potential for benefits for stakeholders in eastern Canada on undertaking similar profiles of the industry.
SUMMARY Of RESUlTS AND DATA TABlES
Driver Characteristics # %
Gender (n=409)
Male 396 96.8
Female 13 3.2
Total 409 100.0
No response 4
413
Age (n=396)
45 to 55 150 37.9
30 to 44 137 34.6
Over 55 81 20.5
Under 30 28 7.1
Total 396 100.0
No response 17
413
Citizenship (n=394)
Canadian citizen 362 91.9
Landed immigrant 32 8.1
Total 394 100.0
No response 19
413

47 Port of Montreal Drayage—Labour Profile and Communications Study — APGST and MPA
Language (n=378)
French¬ 191 50.5
English 106 28.0
English and French 43 11.4
Other 14 3.7
English, French and other 14 3.7
English and Punjabi 4 1.1
French and other 4 1.1
English and other 2 .5
Total 378 100.0
No response 35
413
Education (n=406)
Completed high school 135 33.3
College/university diploma or degree 60 14.8
Completed vocational/trades/apprenticeship 57 14.0
Some high school 54 13.3
Some vocational/trades/apprenticeship 40 9.9
Some college/university 35 8.6
Less than high school 25 6.2
Total 406 100.0
No response 7
413

48 Port of Montreal Drayage—Labour Profile and Communications Study — APGST and MPA
2. COMMuNICATION TOOLS
The majority of drayage drivers do not check traffic and port conditions before starting their trips (34.9%) and less than half are aware that port traffic conditions are available on the Port of Montreal website (41.8%). The Smartphone is by far the most common tool currently being used to communicate with dispatchers (62.7%). Dispatchers are also the most common source of real-time information on traffic conditions (43.8%), which is preferred by many drivers (31.2%), but the same proportion of drivers would also prefer getting information through a Smartphone application (32%). half of the survey respondents said that outside of work, they get information on traffic conditions from the public radio (51.1%). Many also use Smartphone applications (34.6%) and from roadside messages (33.7%).
Communication Tools # %
Frequency that drivers check traffic and port conditions before trips (n=407)
Never 142 34.9
Sometimes 79 19.4
Often 71 17.4
Always 60 14.7
Rarely 55 13.5
Total 407 100.0
No response 6
413
Awareness that port traffic conditions are available on the Port of Montreal website (n=407)
No 237 58.2
Yes 170 41.8
Total 407 100.0
No response 6
413
Communication with dispatcher during drayage trips (n=413) % of cases
Smartphone 259 50.8% 62.7%
SMS / Texting 112 22.0% 27.1%
CB radio 49 9.6% 11.9%
Other 40 7.8% 9.7%
Mobile application 38 7.5% 9.2%
People Net 8 1.6% 1.9%
No response 4 .8% 1.0%
510 100.0% 123.5%

49 Port of Montreal Drayage—Labour Profile and Communications Study — APGST and MPA
How drivers get real-time information (n=413) % of cases
Dispatcher 181 29.7% 43.8%
Public Radio 94 15.4% 22.8%
CB Radio 79 13.0% 19.1%
Other 53 8.7% 12.8%
Port of Montreal website 36 5.9% 8.7%
Roadside variable message signs 35 5.7% 8.5%
Friends / Colleagues / Other drivers 33 5.4% 8.0%
Smartphone application 31 5.1% 7.5%
GPS application 29 4.8% 7.0%
Other mobile device 11 1.8% 2.7%
None / I don't 9 1.5% 2.2%
Email 3 .5% .7%
No response 15 2.5% 3.6%
609 100.0% 147.5%
How drivers prefer to get real-time information (n=413)
Smartphone application 132 22.8% 32.0%
Dispatcher 131 22.7% 31.7%
Public Radio 76 13.1% 18.4%
Roadside variable message signs 62 10.7% 15.0%
Port of Montreal website 52 9.0% 12.6%
CB Radio 36 6.2% 8.7%
GPS application 30 5.2% 7.3%
Email 27 4.7% 6.5%
Other 18 3.1% 4.4%
Other mobile device 8 1.4% 1.9%
No response 6 1.0% 1.5%
578 100.0% 140.0%
Types of communication tools used outside of work to get information on traffic conditions (n=413)
Public Radio 211 33.8% 51.1%
Smartphone application 143 22.9% 34.6%
Roadside variable message signs 139 22.3% 33.7%
GPS application 77 12.3% 18.6%
None 18 2.9% 4.4%
Other 15 2.4% 3.6%
Other mobile device 11 1.8% 2.7%
No response 10 1.6% 2.4%
624 100.0% 151.1%

50 Port of Montreal Drayage—Labour Profile and Communications Study — APGST and MPA
3. DrIvEr ExPErIENCE
Most drayage drivers work for a company (63.6%) and do not own or lease their truck (58.9%). The majority of current drivers have been working in drayage for five years or less (41.2%) and for their current employer for between 1 and 9 years (59.9%). Drayage drivers usually exclusively work in this sector (72.5%) full time; between 10 and 12 months a year (76.6%), 4 to 5 days a week (82.6%) and between 9 and 12 hours a day (68.9%). Most drivers make 3 to 5 revenue trips per day (56.8%) and 2 or less non-revenue trips (70.8%). Almost half of the survey respondents intend to continue work for 5 years or less (48%); most intend to retire (55.8%).
Driver Experience # %
Employment status (n=409)
Employee 260 63.6
Owner-operator 132 32.3
Replacement driver for owner-operator 17 4.2
Total 409 100.0
No response 4
413
Truck ownership (n=399)
No, I neither own nor lease my truck 235 58.9
Yes, I own my truck 145 36.3
No, I lease my truck 19 4.8
Total 399 100.0
No response 14
413
Year of truck (Categorized) (n=361)
1984 to 1991 2 .6
1992 to 1999 31 8.6
2000 to 2007 192 53.2
2008 or newer 136 37.7
No response 52
413
Year of truck (Categorized) (n=361)
1984 1 .3
1989 1 .3
1994 1 .3
1995 1 .3
1996 4 1.1
1997 3 .8
1998 11 3.0
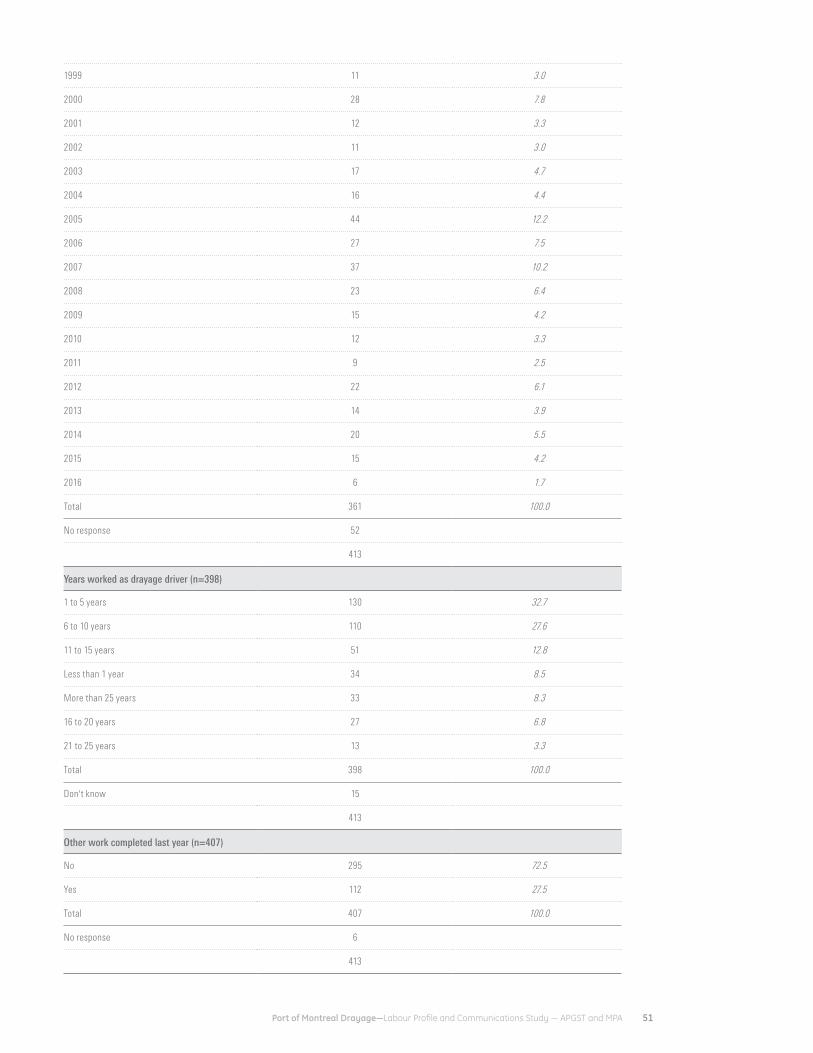
51 Port of Montreal Drayage—Labour Profile and Communications Study — APGST and MPA
1999 11 3.0
2000 28 7.8
2001 12 3.3
2002 11 3.0
2003 17 4.7
2004 16 4.4
2005 44 12.2
2006 27 7.5
2007 37 10.2
2008 23 6.4
2009 15 4.2
2010 12 3.3
2011 9 2.5
2012 22 6.1
2013 14 3.9
2014 20 5.5
2015 15 4.2
2016 6 1.7
Total 361 100.0
No response 52
413
Years worked as drayage driver (n=398)
1 to 5 years 130 32.7
6 to 10 years 110 27.6
11 to 15 years 51 12.8
Less than 1 year 34 8.5
More than 25 years 33 8.3
16 to 20 years 27 6.8
21 to 25 years 13 3.3
Total 398 100.0
Don't know 15
413
Other work completed last year (n=407)
No 295 72.5
Yes 112 27.5
Total 407 100.0
No response 6
413

52 Port of Montreal Drayage—Labour Profile and Communications Study — APGST and MPA
Percentage of trucking that is drayage (n=392)
76 to 100 % 351 89.5
1 to 25 % 17 4.3
26 to 50 % 15 3.8
51 to 75 % 9 2.3
Total 392 100.0
Don't Know 21
413
Years with company (n=401)
1 to 9 240 59.9
10 to 19 77 19.2
Less than one year 56 14.0
20 to 29 19 4.7
30 or more 9 2.2
Total 401 100.0
Don't Know 12
413
Months worked last year (n=359)
10 to 12 months 275 76.6
0 to 3 months 48 13.4
4 to 6 months 19 5.3
7 to 9 months 17 4.7
Total 359 100.0
Don't Know 54
413
Days worked in a week (n=379)
4 to 5 313 82.6
2 to 3 34 9.0
1 or less 21 5.5
6 to 7 11 2.9
Total 379 100.0
Don't know 34
413

53 Port of Montreal Drayage—Labour Profile and Communications Study — APGST and MPA
Hours worked in a day (n=363)
9 to 12 hours 250 68.9
13 or more hours 53 14.6
5 to 8 hours 35 9.6
0 to 4 hours 25 6.9
Total 363 100.0
Don't Know 50
413
KM driven last year (197)
More than 100,000 km 48 24.4
40,000 to 59,999 km 41 20.8
60,000 to 79,999 km 31 15.7
20,000 to 39,999 km 29 14.7
Less than 10,000 km 20 10.2
10,000 to 19,999 km 14 7.1
80,000 to 99,999 km 14 7.1
Total 197 100.0
Invalid response 10
Don't know 206
413
Revenue drayage trips in a day (n=259)
3 to 5 147 56.8
2 or less 65 25.1
6 to 8 45 17.4
9 or more 2 .8
Total 259 100.0
Invalid response 10
Don’t know 144
413

54 Port of Montreal Drayage—Labour Profile and Communications Study — APGST and MPA
Non-revenue drayage trips in a day (n=202)
2 or less 143 70.8
3 to 5 51 25.2
6 to 8 8 4.0
Total 202 100.0
Invalid response 5
Don’t know 206
413
Years left as drayage driver (n=175)
5 or less 84 48.0
6 to 10 52 29.7
11 to 15 18 10.3
16 to 20 11 6.3
21 or more 10 5.7
Total 175 100.0
Invalid response 6
Don't know 232
413
Future plans (n=294)
Retire 164 55.8
Leave the drayage industry for a different career 43 14.6
Leave the drayage industry for different type of occupation
34 11.6
Other 16 5.4
No response 37 12.6
Total 294 100.0
Don't know 119
413

55 Port of Montreal Drayage—Labour Profile and Communications Study — APGST and MPA
4. DrIvEr COMPENSATION
The majority of respondents indicated that their income from drayage driving is between $40,000 and $59,999 (41%). Most are paid by the trip (50.6%) and do not receive a fuel surcharge (74.6%). Most respondents are not members of a union (85%).
Compensation # %
Income last year (n=256)
$40,000 to $59,999 105 41.0
$20,000 to $39,999 72 28.1
$60,000 to $79,999 39 15.2
$10,000 to $19,999 22 8.6
$9,999 or less 14 5.5
$80,000 to $99,999 2 .8
$100,000 or more 2 .8
Total 256 100.0
Invalid response 12
System 145
413
Payment format (n=249)
Per trip mean 126 50.6
Per hour mean 111 44.6
Per km mean 12 4.8
Total 249 100.0
No response 164
413
Fuel surcharge (n=386)
No 288 74.6
Yes 98 25.4
Total 386 100.0
No response 27
Union member (n=401)
No 341 85.0
Yes 60 15.0
Total 401 100.0
No response 12
413
413

56 Port of Montreal Drayage—Labour Profile and Communications Study — APGST and MPA
5. COMPANy ChArACTErISTICS
Most companies who completed the survey do not exclusively work in the drayage sector and do other types of trucking (68.8%). Drivers who work for these companies also complete trips that are non-drayage (95.5%). Most (45.5%) use between 75 and 100% of their fleet to make drayage trips. The majority of companies (64.5%) make up to 24 drayage trips each day.
Company Characteristics # %
Companies that include other types of trucking (n=32)
Yes 22 68.8
No 10 31.3
Total 32 100.0
Drayage drivers also make non-drayage trips (n=22)
Yes 21 95.5
No 1 4.5
Total 22 100.0
System 10
32
Total employees (n=31)
0 to 49 25 80.6
50 to 99 4 12.9
100 to 150 2 6.5
Total 31 100.0
System 1
32
Total owner-operators (n=31)
0 to 49 26 83.9
50 to 99 4 12.9
100 to 150 1 3.2
Total 31 100.0
System 1
32
Percentage of drivers who make drayage trips (n=22)
75 to 100 10 45.5
50 to 74 7 31.8
25 to 49 4 18.2
0 to 24 1 4.5
Total 22 100.0
System 10
32

57 Port of Montreal Drayage—Labour Profile and Communications Study — APGST and MPA
6. COMPANy COMMuNICATIONS
A Smartphone is the most common tool used by companies to track their fleet (56%) and most do not intend to change their tracking approach in the next five years (73.1%). Companies that do not communicate real-time information about traffic and port conditions to their drivers (31.3%) most often indicated that it was due to a lack of consistent and accessible information (60% each). The majority did indicate that it is very important to receive real-time information on port conditions (81.3%).
As with tracking, the Smartphone is most commonly used to communicate with drivers; 53.1% use it and 46.9% say it is the main tool they use. The majority (68.8%) say the tool they are using is very efficient in relaying information to their drayage drivers. just over a third of companies (37%) intend to change how they communicate with drivers in the next five years. The most commonly mentioned challenges to this change are technology compatibility and financing (40% each).
Drayage trips per day (n=31)
0 to 24 20 64.5
25 to 49 5 16.1
75 + 4 12.9
50 to 74 2 6.5
Total 31 100.0
Don't Know 1
32
Tracking and Communications # % % of cases
Tools used to track fleet (n=32)
Smartphone 18 40% 56%
GPS 15 33% 47%
Mobile application 5 11% 16%
Other - Description 3 7% 9%
Other - Tool 3 7% 9%
We do not track our fleet 1 2% 3%
45 100% 141%
Plans to change tracking approach (n=32)
No 19 73.1
Yes 7 26.9
Total 26 100.0
Don't Know 6
32
Companies that communicate real-time information to drivers (n=32)
Yes 22 68.8
No 10 31.3
Total 32 100.0

58 Port of Montreal Drayage—Labour Profile and Communications Study — APGST and MPA
Tracking and Communications # % % of cases
Reasons companies do not communicate real-time information (n=10)
Lack of consistent information 6 27.3% 60.0%
Lack of accessible information 6 27.3% 60.0%
Lack of reliable information 3 13.6% 30.0%
Drivers are responsible for obtaining their own information
3 13.6% 30.0%
Lack of staff to manage communications 2 9.1% 20.0%
Drivers prefer to obtain their own information 2 9.1% 20.0%
22 100.0% 220.0%
Importance of receiving real-time information on port conditions (n=32)
1 Very important 26 81.3
2 2 6.3
3 2 6.3
4 2 6.3
Total 32 100.0
Tools used to communicate with drivers (n=32)
Smartphone 17 34.7% 53.1%
SMS / Texting 15 30.6% 46.9%
Other 7 14.3% 21.9%
CB radio 5 10.2% 15.6%
Mobile application 5 10.2% 15.6%
49 100.0% 153.1%
Main communication tool used (n=32)
Smartphone 15 46.9
SMS / Texting 6 18.8
CB radio 4 12.5
Mobile application: please specify 4 12.5
Other 3 9.4
Total 32 100.0
Efficiency of main communication tool (n=32)
1 Very efficient 22 68.8
2 6 18.8
3 2 6.3
4 2 6.3
Total 32 100.0
Plans to change communication tools (n=32)
No 17 63.0
Yes 10 37.0
Total 27 100.0
Don't Know 5
32

59 Port of Montreal Drayage—Labour Profile and Communications Study — APGST and MPA
Challenges to implement new communication tools (n=10)
Compatibility of technology 4 26.7% 40.0%
Financing 4 26.7% 40.0%
Increase technology literacy of drivers 3 20.0% 30.0%
No challenges 2 13.3% 20.0%
Additional staff to manage communications 1 6.7% 10.0%
Other 1 6.7% 10.0%
15 100.0% 150.0%
Awareness of other companies using communication technologies to relay traffic conditions (n=32)
No 10 28.1
Yes 9 31.3
Don't Know 13 40.6
Total 32 100.0


61 Port of Montreal Drayage—Labour Profile and Communications Study — APGST and MPA

Port of Montreal DrayageLabour Profile and Communications Study
—
Final Report
—
Prepared by Asia Pacific Gateway Skills Table
© September 2015
#407 – 55 Water Street Vancouver, British Columbia V6B 1A1
—
O: 604.684.1471
—
www.apgst.ca www.hrwire.ca