DRAYAGE OWNER- OPERATORS -...
56
Understanding Container Drayage Owner-Operators in Metro Vancouver DRAYAGE OWNER- OPERATORS SUMMARY REPORT
Transcript of DRAYAGE OWNER- OPERATORS -...

Understanding Container Drayage Owner-Operators in Metro Vancouver
DRAYAGE OWNER- OPERATORS
SUMMARY REPORT
Owner Operators Interviewed for this study, and
participated in January 2013
workshop.
Trucking Companies
» BST Management Ltd. / Pro-West Transport
» Harbour Link Container Services
» Canaan Group
» Indian River Transport Ltd.
» CNTL
» KTL Transport
» Damco Distribution Services
» Prudential Transport Ltd.
Industry
» BC Trucking Association
» Port Metro Vancouver
This study was led and the following report prepared by:
David Colledge, President
Colledge Transportation
Consulting (CTC) Inc.
Delta, British Columbia
With support from:
Terence D. Smyth, Director
Seaport Consultants Canada Inc.
Vancouver, British Columbia
AcknowledgementsThe Asia Pacific Gateway Skills Table (APGST) would like to thank the many
individuals and organizations who generously gave their time and advice
throughout this project:
This project is funded by the Government of Canada’s Sector Council Program.
The opinions and interpretations in this publication are those of the author and do not necessarily reflect those of the Government of Canada.
Some photos in this report by courtesy of Port Metro Vancouver
and the British Columbia Trucking Association.

UNDERSTANDING CONTAINER DRAYAGE OWNER-OPERATORS IN METRO VANCOUVER
Prepared by Asia Pacific Gateway Skills Table
© July 2013
SUMMARY REPORT
TABLE OF CONTENTS
Chapter 1 Introduction 6
1.1 Purpose of Project 6
Project Outputs 6
1.2 Methodology 7
Chapter 2 Metro Vancouver Drayage Operating Environment 8
2.1 Gateway Supply Chain Context 8
2.2 The Role of Drayage in the Container Supply Chain 9
The Drayage Process 9
Key Requirements to Access PMV Container Terminals 10
2.3 The Metro Vancouver Container Drayage Industry 12
Industry Structure 12
Key Characteristics of the Industry 13
Chapter 3 Understanding the Owner-Operator Business 14
3.1 Who Are Drayage Owner-Operators? 14
3.2 Key Business Activities 14
3.3 Basic Requirements to Enter and Operate the Business 15
3.4 Other Required Resources 17
3.5 Selection of Work 17
Selection of a Drayage Company to Work For 18
3.6 Key Business Drivers 19
Productivity 19
Truck Utilization 19
3.7 How Industry Stakeholders Impact the Business 21

TABLE OF CONTENTS
Chapter 4 Financial Aspects of the Owner-Operator Business 22
4.1 Revenue and Compensation 22
4.2 Truck Cost / Financial Model 23
Principles of Financial Models 23
Treatment of Revenue in the Financial Model 24
Understanding Truck Costs 25
Truck Cost / Financial Model 25
Methodology and Key Assumptions 26
Sensitivity of the Model to Changes in Productivity 29
Chapter 5 Best Practice Findings and Recommendations 29
5.1 Owner-Operator Value Proposition 29
5.2 Company Criteria: Selecting Good Owner-Operators 30
5.3 Owner-Operator Criteria: Selecting a Good Company to Work For 30
5.4 Key Challenges 31
5.5 Recommendations for Improving Drayage Sector Performance 32
Recommendations for Owner-Operators 32
Recommendations for Other Stakeholders 33
Toolkit Recommendations 34
Appendices Appendix 1 Interview Question Guide 36
Appendix 2 Ready Rate Scale 38
Do the Ready Rates Affect Market Rates? 40
Appendix 3 Pro Forma Financial Model Inputs 41
Appendix 4 Sample Cost / Financial Model Results 44

6
In 2007, Port Metro Vancouver (PMV) instituted a
moratorium on owner-operators to prevent an over -
supply of operators that could destabilize the market.
While this report notes there are low cost barriers for
owner-operators to enter into the drayage market,
as long as the moratorium remains in place, it acts
as a regulatory barrier. This report outlines some of the
issues and challenges associated with the entry of new
owner-operators into the market and in anticipation that
these challenges will be acknowledged and addressed
by policymakers, shippers and other stakeholders before
the moratorium is lifted.
Project Outputs
Owner-Operator Toolkit
Provides a business resource for drayage operators:
Overview of the drayage business
Getting and operating my vehicle
Managing my business and money
Project Report
Provides a profile of the owner-operator business for
trucking companies, governments, industry associations:
Understanding the drayage owner-operator business
Financial aspects of the owner-operator business
Best practice findings and recommendations
1.1 PURPOSE OF THE PROJECT —As part of the Asia Pacific Gateway Skills Table’s
mandate to ensure that Canada’s Pacific Gateway has
enough people with the right skills and training to meet
its labour needs, the organization sponsored a project to
help the 950 owner-operators in the container drayage
industry in Metro Vancouver understand and manage
their businesses more effectively. The project was
carried out in partnership with the BC Trucking
Association (BCTA).
The project objectives were to:
» Develop a better understanding of the local container
drayage business as well as a drayage cost model;
» Conduct research and interviews with successful
trucking companies and owner-operators to identify
and compile best business practices that could be shared
with other owner-operators to improve the sector’s
performance.
The project had two main outputs. One is a toolkit
(separately published) that will provide the basis for
an online resource for potential and existing owner-
operators to help them better understand and manage
their businesses. The second is this report, which
profiles the Metro Vancouver container drayage operating
environment, including its role in the supply chain, the
nature of an owner-operator businesses, its financial
and cost structures, and industry best business practices.
This information may be used to inform policy decisions,
support education and awareness campaigns, and support
human resource initiatives in the sector.
INTRODUCTION
CHAPTER 1

7CHAPTER 1
1.2 METHODOLOGY —The project’s findings are based on research and
analysis as well as on the consultant’s own experience
in the gateway.
The project methodology included:
» A literature review to compile relevant information
and data on the drayage sector (provided in a separate
Project Briefing);
» Research pertaining to existing off-the-shelf cost
models and the development of a cost model specific
to Vancouver-area container drayage operations.
The cost model was based on inputs from existing
models supplemented with current cost data derived
from industry interviews carried out between October
2012 and February 2013.
» Extensive interviews conducted with PMV, trucking
companies and individual owner-operators to identify
operating practices, equipment and skills requirements,
resource gaps, and industry best practices. The interview
question guide is provided in Appendix 1.
Consultations for the project included one-on-one
interviews with trucking companies of varying sizes
and types of operation as well as interviews with
13 individual owner-operators, including senior
representatives of the Vancouver Container Truck
Association–CAW Local 2006. Many of these operators
possess more than 20 years’ experience in the local
container drayage market. A workshop was also held
in January 2013 with 11 owner-operators to obtain
their feedback on the draft toolkit.
Companies Consulted:
» BST Management Ltd./Pro-West Transport
» Harbour Link Container Services
» Canaan Group
» Indian River Transport Ltd.
» CNTL
» KTL Transport
» Damco Distribution Services
» Prudential Transport Ltd.

8 CHAPTER 2
METRO VANCOUVER DRAYAGE OPERATING ENVIRONMENT
METRO VANCOUVER IMPORT/EXPORT CONTAINER SUPPLY CHAINConnects North American and overseas customers in 160 different countries
GOAL: CUSTOMER SERVICE EXCELLENCE THROUGH OPERATIONAL EFFICIENCY
IMPORTERS & EXPORTERS*
SHIPPING LINES
CONTAINER TERMINALS
DRAYAGE COMPANIES
OFF-DOCK FACILITIES
Participants Thousands of companies About 20 different lines
call at the Port
TSI Terminals, DP World,
Fraser Surrey Docks
158 local drayage
companies of varying sizes
50+ facilities in the
Lower Mainland
Principal Assets Cargo owners
(entity that pays the
transport cost)
8,500 TEU ships typical TSI: Vanterm, Deltaport
DP World: Centerm
FSD: Fraser Surrey Docks
A fleet of 1,050 company
trucks and thousands
of chassis
Distribution / transload /
reload centres, container
storage yards
Business Drivers Each supply chain partner seeks to maximize their own return on investment (ROI). The key business drivers are:
Reliable, cost-effective
end-to-end supply chain
performance
Market share;
environmental stewardship
Highest possible revenue
generating throughput
Revenue trips per shift,
revenue per move
Highest possible revenue
generating throughput
2.1 GATEWAY SUPPLY CHAIN CONTEXT —In 2012, Port Metro Vancouver handled 2.7 million 20-foot equivalent units (TEU) of import and export containers shipped
to and from a wide range of domestic and international locations. Approximately 32% of all loaded import containers
arriving at the port are transported by truck to locations in the Lower Mainland and beyond. Some 63% of all loaded
export containers arrive at the container (marine) terminals by truck. The remainder of container traffic is moved to/from
the container terminals by rail. It is estimated that there are about two million truck-trip legs required to handle this volume
of container traffic moving through the gateway.1
The various supply chain participants—importers, exporters, shipping lines, container terminals, drayage companies, off-dock
terminals and other participants, such as freight forwarders—must operate in a highly coordinated manner to meet customer
requirements for efficient door-to-door transportation (see Exhibit 1). The actions of any single supply chain participant may
have significant system-wide effects that impact the efficiency, performance and reputation of the entire gateway.
Exhibit 1: Container Supply Chain
*Cargo owners, also known as BCO’s, or beneficial cargo owners.
1) This volume of traffic requires about 800,000 truck gate moves. Based on US research, a gate move typically requires an average of 2.5 truck-trip legs due to the need
for some tractor-only moves associated with container repositioning, resulting in approximately two million truck-trip legs in the region (i.e., 800,000 x 2.5).

9CHAPTER 2
2.2 THE ROLE OF DRAYAGE IN THE CONTAINER SUPPLY CHAIN —The container drayage sector is an important part of the complex international supply chain serving Port Metro Vancouver,
Canada’s largest trade gateway with Asia, and more generally, the world outside North America. Drayage refers to the
pickup and delivery of containers to a seaport terminal and associated off-dock locations (e.g., warehouses, transload
centres, rail yards, container storage yards) by truck, often within an urban area—in this case, Metro Vancouver.
The Drayage ProcessExhibit 2 offers a simplified view of the import and export drayage process. The import process is driven by the shipping
manifest, provided by the shipping line to the marine terminal.2 The cargo owner contracts with the drayage company,
which in turn acquires an appointment to access the container terminal and dispatches a truck driven by either a company
driver or an owner-operator.
The export process is driven by the cargo owner (shipper), who acquires a booking number with the shipping line that
serves as a reservation for an outbound container on a specific voyage. The booking triggers several activities, including
the ordering of an empty container by a transload facility, the establishment of a delivery date to the terminal, and an
appointment by the drayage carrier with the container terminal operator to drop off the container.
Source:
Truck Drayage
Productivity Guide,
National
Cooperative Freight
Research Program,
U.S. Transportation
Research Board,
March 2011.
Note:
These flow
diagrams exclude
references to the
reservation system.
SH
IPP
ING
LIN
ED
RA
YAG
EFI
RM
TER
MIN
AL
CO
NS
IGN
EE
Manifest
Recieves
Manifest
Create Pickup
Order
Dispatch
Driver
Pick Up
Load
Bring Load
to Importer
Drop off
Empty to
Terminal
Recieves
Empty
Unload
Container
Delivers
Load
Recieves
Manifest
DR
AYA
GE
FIR
MTE
RM
INA
L
Recieves
Booking
Create Empty
Order
Dispatch
Driver
Pick Up
Empty
Bring Empty
to Exporter
Drop off
Load to
Terminal
Recieves
Load
Delivers
Empty
Receives
Booking
SH
IPP
ER
Load
Container
Export
Booking
Imp
ort
Exp
ort
2) The manifest is the list of import containers on the inbound ship. It identifies which parties to notify when the container is unloaded and ready to be picked up.
Exhibit 2: The Drayage Process

10
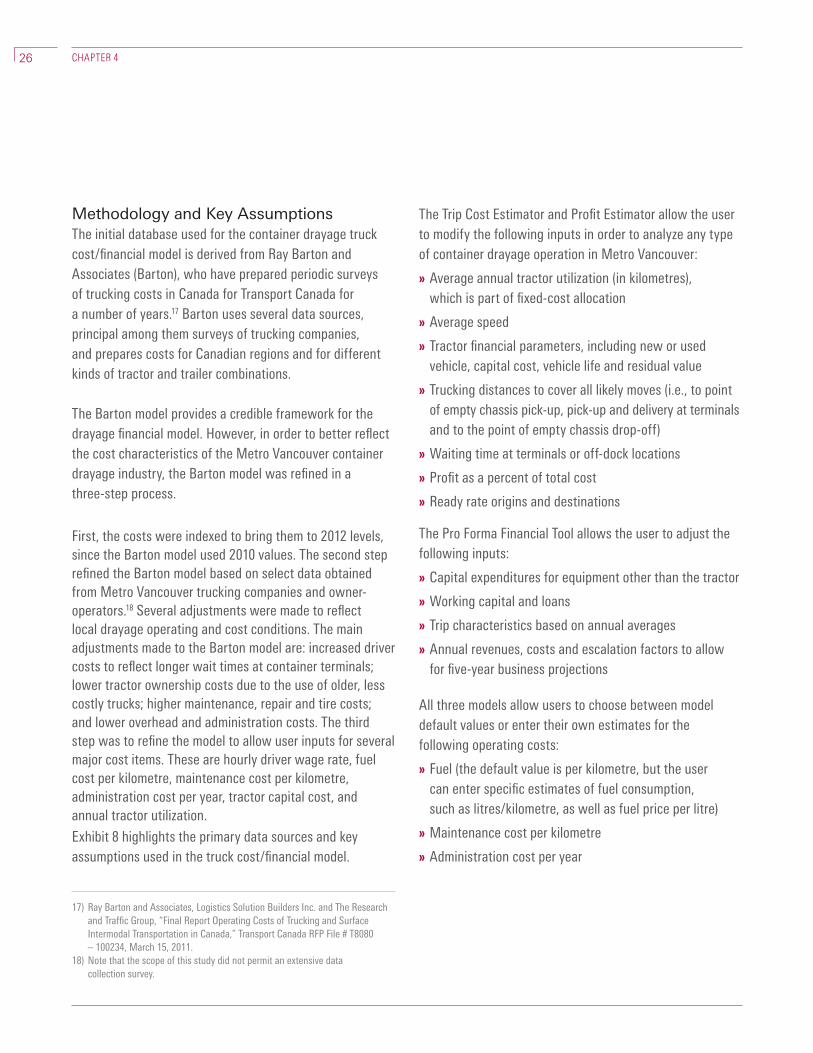
Key Requirements to Access PMV Container Terminals Three main requirements must be satisfied for drayage
companies to access the marine terminals within PMV’s
jurisdiction: they must have a valid truck license issued
by PMV; they need a Port Pass as a security measure to
access federal port property; and they need a reservation
to pick up/deliver containers, obtained through the
reservation systems administered by each marine terminal.
Each of these requirements is discussed below.
Truck Licensing System
In order for a truck to access a container terminal, it must
be registered under the Truck Licensing System (TLS)
administered by PMV. The TLS was introduced in 2005 to
manage the number of vehicles and drivers. It was later
amended to impose safety and environmental standards
regarding the condition and age of vehicles serving the
port. The TLS also gives PMV a mechanism to impose
sanctions on operators whose behavior does not meet
the port’s standards or service requirements.3
PMV issues two different types of licenses under the TLS:
» Full Service Operator (FSO) Licenses These are intended
for drayage companies that have direct relationships
with cargo interests (shippers, consignees, shipping
companies and agents), provide a complete dispatching
service, and are equipped to provide services in an
efficient and ongoing manner.
There are two types of FSO licenses:
Local: A local license allows a truck to pick up and
deliver both local and long-haul containers;
Long-Haul: A highway license restricts a truck to
picking up and delivering long-haul movements.
» Independent Owner-Operator Permits These are meant
for drayage entities that may be incorporated companies
and do not have a significant pool of equipment or access
to the reservation systems. Owner-operators can only
access port property through a subcontract with an FSO.
There has been a moratorium on owner-operator permits
since early 2007.4 The purpose of the moratorium was to
prevent an oversupply of owner-operators from destabilizing
the market. At the same time, it allowed drayage companies
that wanted to expand their fleets to invest in company-
owned equipment and employee drivers, since this business
model was deemed to be more stable than the owner-
operator model. One of the unintended consequences of
the moratorium has been the proliferation of small drayage
companies that could be formed with as few as three trucks,
further fragmenting the market and resulting in extreme
competition that puts pressure on profitability in the sector.
In July 2013, PMV launched a pilot project introducing a
new temporary driver category. This category of local TLS
3) It should also be noted that trucking company safety oversight responsibilities,
such as vehicle maintenance and driver hours of service, are governed by the
National Safety Code, which falls under provincial government responsibility.
4) In 2009, the moratorium was expanded to include all local and long-haul
license and permit holders and to preclude fleet expansions by existing
licensees. In 2011, the moratorium on the issuance of new licenses and the
restriction on fleet expansion were lifted for FSOs only to allow them some
flexibility to respond to changing market conditions.
CHAPTER 2

11
drivers will operate within the Port under a Joint Temporary
Permit ("JTP") signed by and issued jointly to the hiring TLS
approved local FSO License holder and a non-TLS approved
owner-operator.
Port Passes
All workers such as truck drivers requiring regular
and frequent access to PMV property must have port-
authorized photo identification called a Port Pass5. Failure
to have a valid Port Pass may result in being refused access
to the port. The Port Pass is a means for PMV, through its
marine facility operators, to comply with Transport Canada
security regulations that require identification of all
individuals on port property.
Reservation System
The marine container terminals in Vancouver have had
mandatory appointment systems since 2005. In order to
access a container terminal by truck, drayage companies
CHAPTER 2
must make a reservation using one of four different
reservation systems (one for each of the four different
marine terminals). Reservations are intended to make
terminal operations more efficient by limiting the arrival
of each truck at a terminal gate to a specific time window
to reduce “peaking” and truck traffic congestion. In addition
to reducing peaking of traffic during normal daytime
operations, the appointment system has been used to
shift traffic to night or to off-peak gates by restricting
the number of daytime reservations available.
The appointment system makes the coordination of
drayage operations somewhat more complex by requiring
more precise scheduling of truck trips to accommodate
the appointment windows at the terminal gates. There are
also reported difficulties in obtaining reservations because
the truck gates of three of the four container terminals are
at capacity during the day shift. Firms that do not comply
with their reservations risk reducing their ability to obtain
reservations in future and are subject to penalties issues by
the marine container terminals, which would effectively
curtail their business opportunities. 5) BCTA is authorized by PMV to issue port passes to drivers of vehicles over
5,000 kilograms and the employees of its member companies.

12
In contrast, diversified full-service drayage companies earn
income from multiple sources and may operate separate
divisions, transporting other types of freight (e.g., flat-deck
truck division to haul forest products or steel). These mixed
full-service operators may transload forest products that
have been transported by rail to Metro Vancouver into
export marine containers. Some of the larger companies
also operate off-dock container yards that can accommodate
the handling and storage of loaded and empty containers.
In some cases, a range of other services is also provided.
Examples include staging of bonded or pre-cleared
containerized cargo for delivery to customers; sufferance
bonded facilities; and warehousing.
2.3 THE METRO VANCOUVER CONTAINER DRAYAGE INDUSTRY —Industry Structure
Metro Vancouver’s container drayage industry is comprised
of approximately 160 local drayage companies operating a
fleet of about 1,050 trucks. These companies supplement
their fleet with an additional 952 trucks by contracting with
independent owner-operators who provide their own
vehicles, bringing the total drayage fleet to almost 2,000
vehicles.6 Drayage companies range in size from the
smallest operators with as few as three trucks to the
largest firms with more than 100. It is estimated that the
top 15–20 companies control some 20% of the total fleet
and handle up to about 40% of all gate movements at the
marine terminals.
There are several different types of drayage companies
(see Exhibit 3). Pure drayage operators depend entirely on
revenues earned from moving containers and use company
drivers (employees) and equipment and/or owner-operators
(independent contractors). Some companies also have
long-haul divisions to transport containers to and from
locations outside Metro Vancouver.
PURE DRAYAGE OPERATORS MIXED FULL SERVICE OPERATORS INTEGRATED COMPANIES
Depend entirely on revenue from transporting
import/export containers.
Are diversified into related logistics functions. Vertically integrated players affiliated with other
supply chain partners.
Examples: Prudential, Indian River, Quantum
Transportation
Examples: KTL, which owns Euro Asia terminal;
Harbour Link, with an off-dock yard; LEI Cartage
(warehousing); Aheer (large regional truckload carrier
in the Pacific Northwest, warehousing and storage,
brokerage)
Examples: Damco (owned by A.P. Moller-Maersk);
CNTL (owned by CN); Canaan Group (integrated
logistics, warehousing, customs brokerage,
air freight and courier service)
Exhibit 3: Different Types of Drayage Companies in the Market
6) Source: PMV, as of October 2012. These figures exclude companies registered under the TLS as long-haul carriers, which would bring the total number of companies to
more than 200. Long-haul carriers do not play a large role in local drayage operations.
CHAPTER 2
13
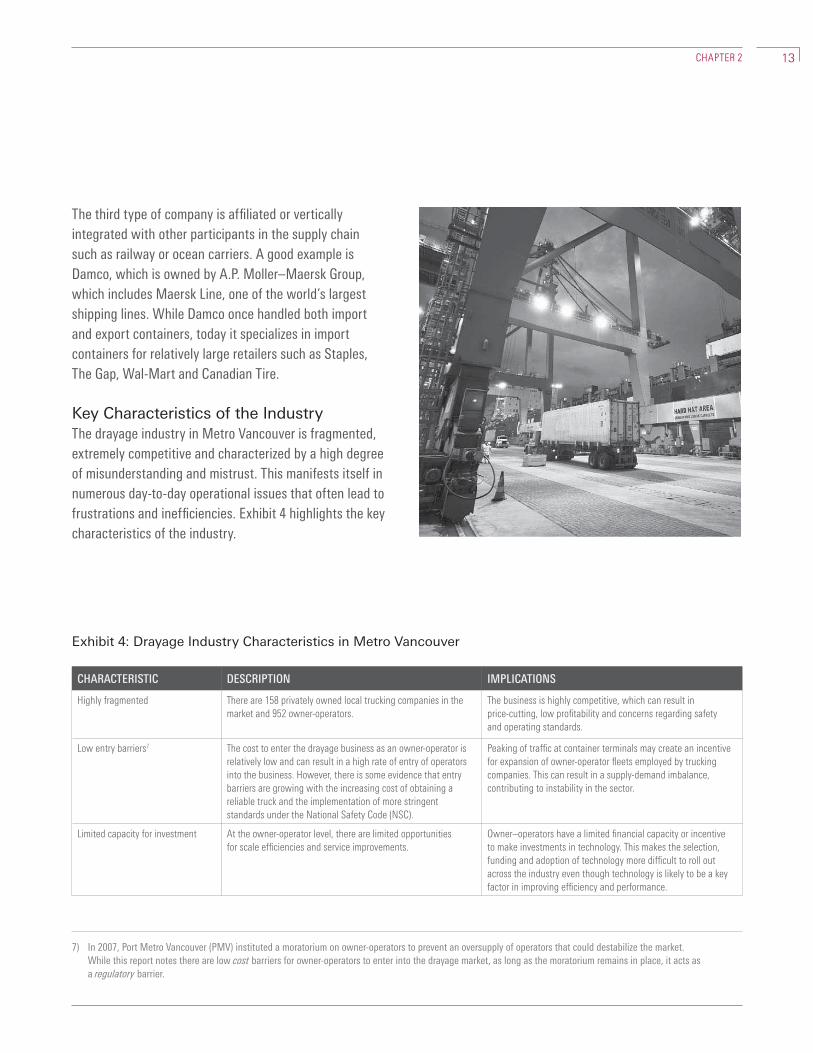
CHARACTERISTIC DESCRIPTION IMPLICATIONS
Highly fragmented There are 158 privately owned local trucking companies in the
market and 952 owner-operators.
The business is highly competitive, which can result in
price-cutting, low profitability and concerns regarding safety
and operating standards.
Low entry barriers7 The cost to enter the drayage business as an owner-operator is
relatively low and can result in a high rate of entry of operators
into the business. However, there is some evidence that entry
barriers are growing with the increasing cost of obtaining a
reliable truck and the implementation of more stringent
standards under the National Safety Code (NSC).
Peaking of traffic at container terminals may create an incentive
for expansion of owner-operator fleets employed by trucking
companies. This can result in a supply-demand imbalance,
contributing to instability in the sector.
Limited capacity for investment At the owner-operator level, there are limited opportunities
for scale efficiencies and service improvements.
Owner–operators have a limited financial capacity or incentive
to make investments in technology. This makes the selection,
funding and adoption of technology more difficult to roll out
across the industry even though technology is likely to be a key
factor in improving efficiency and performance.
Exhibit 4: Drayage Industry Characteristics in Metro Vancouver
The third type of company is affiliated or vertically
integrated with other participants in the supply chain
such as railway or ocean carriers. A good example is
Damco, which is owned by A.P. Moller–Maersk Group,
which includes Maersk Line, one of the world’s largest
shipping lines. While Damco once handled both import
and export containers, today it specializes in import
containers for relatively large retailers such as Staples,
The Gap, Wal-Mart and Canadian Tire.
Key Characteristics of the IndustryThe drayage industry in Metro Vancouver is fragmented,
extremely competitive and characterized by a high degree
of misunderstanding and mistrust. This manifests itself in
numerous day-to-day operational issues that often lead to
frustrations and inefficiencies. Exhibit 4 highlights the key
characteristics of the industry.
7) In 2007, Port Metro Vancouver (PMV) instituted a moratorium on owner-operators to prevent an oversupply of operators that could destabilize the market.
While this report notes there are low cost barriers for owner-operators to enter into the drayage market, as long as the moratorium remains in place, it acts as
a regulatory barrier.
CHAPTER 2

14 CHAPTER 3
UNDERSTANDING THEOWNER-OPERATOR BUSINESS
3.2 KEY BUSINESS ACTIVITIES —The owner-operator business is fairly straightforward.
The direct customer of an owner-operator is the trucking
company; the principal activities are indicated in Exhibit 5.
The main truck-trip legs for an owner-operator are outlined
below. Not all of these moves are necessary for each job. It
depends on the nature of the job and the owner-operator’s
activities before and after the job. The owner-operator
generally does not offer other services.
Truck trip leg possibilities:
» To the point of empty chassis pick-up. This is a bobtail
move (i.e., no chassis or container attached to the truck)
from the day’s starting point or the end of the last trip
to a point at which the owner-operator picks up an empty
chassis but no container. Such a move would not apply
if the truck already has the right chassis attached to it at
the start of the trip or if the truck has no chassis attached
because it is picking up a container already on a chassis
at the terminal of origin.
» To the terminal of origin to pick up a container.
This could be a bobtail move to pick up a chassis holding
a container (as noted above) or a move with an empty
chassis onto which a container will be loaded at the
terminal.
» From the pick-up terminal to the delivery terminal.
This is the main and often the only paid component of
the move. The move may be between a container terminal
and an off-dock terminal (customer) or between two
off-dock terminals. It could also be between two
container terminals, but this would be unusual.
3.1 WHO ARE DRAYAGE OWNER-OPERATORS? —There are generally two types of truck drivers in the
container drayage industry: company drivers and owner-
operators. Company drivers are employees of drayage
companies and may be union or non-union workers.
Industry observers estimate that approximately 70% or more
of all company drivers are non-unionized.8 Owner-operators
act as independent contractors selling their services to
drayage companies as drivers and tractor owners.
The main difference between company drivers and owner-
operators is that company drivers are usually paid by
the hour, as employees do not provide tractors. Owner-
operators, on the other hand, are normally paid by the
trip based on a share of revenue received by the drayage
company from its customers and on existing regulated or
contractually agreed rates. They are small business people
who take risks like any other small business owners. These
risks include the acquisition of the truck and the opportunity
cost of their time working in an environment where there is
little control over the business in terms of loads hauled and
revenues earned.9 Owner-operators may also be restricted
in their ability to expand due to limited financial resources.
The terms and conditions for owner-operators vary. Some
may work under the regulated rates or achieve only lower
unregulated rates between off-dock terminals.10 Others
may have superior compensation packages that include fuel
subsidies, paid waiting time at terminals, or remuneration
for deadhead moves (i.e., a bare-chassis move to pick up a
container).
8) There is no available data, however interviews with a small sample of unionized drivers indicated that Canadian Auto Workers (CAW) representation in the drayage
sector is likely less than 300, and that the number of unionized workers in the industry has been declining since 2005.
9) See also Section 3.7 for additional details regarding the impacts of various supply chain participants on an owner-operator’s business.
10) See Chapter 4 for discussion of regulated rates.

15CHAPTER 3
» From the delivery terminal to an empty chassis
drop-off point. This applies if a truck has an empty
chassis attached to it and must drop off the chassis at
a location other than the container delivery terminal.
It does not apply if the truck drops off a container and
chassis at the delivery terminal (virtually always an
off-dock terminal in this situation), or if it has the right
chassis attached for the next container move.
3.3 BASIC REQUIREMENTS TO ENTER AND OPERATE THE BUSINESS—The owner-operator drayage sector has few barriers to entry.
In Vancouver, the only requirements are:
A: Sufficient resources to purchase and insure a
post-2006, 10-wheel tractor;
B: A Class 1 commercial driver’s license;
C: Other licensing requirements;
D: Passing a safety exam and periodic commercial
vehicle inspections.
Each of these requirements is described in more detail below.
A: Equipment
The only essential equipment required for an owner-
operator is a 10-wheel tractor of appropriate vintage
to meet PMV’s requirements for accessing container
terminals. For the typical owner-operator, a reliable used
truck in the Vancouver market costs about $50,000 to
$60,000. Less expensive trucks are available, but would
require some knowledge about vehicles or the right
contacts outside of British Columbia to acquire. PMV has
specified conditions and age limits on trucks allowed to
become part of the TLS.11
The situation as of April 1, 2012 is:
» Trucks 2006 and older and not already in the TLS
are prohibited from entering the TLS;
» Trucks already in the TLS that are:
2002 and older must pass an annual exhaust
opacity test;
1998 and older can remain in the TLS only with
an approved age exemption.
IMPORT MOVES
Loaded import marine containers holding primarily consumer goods from Asia are
moved from container terminals to off-dock warehouses and distribution centres,
where they are unloaded for local distribution or transloaded into larger domestic
containers for movement by truck or rail to locations outside Metro Vancouver.
EXPORT MOVES
Loaded export containers holding mainly forest and grain products are moved
from transload centres and other shipper facilities to container terminals.
EMPTY CONTAINER MOVES
Empty containers account for a significant level of activity in order to reposition
containers between empty container storage yards, container terminals and the
large number of off-dock terminals located throughout Metro Vancouver.
Exhibit 5: Principal Drayage Activities
of Owner-Operators
11) Port Metro Vancouver, “TLS Environmental Requirements 2012
Program Overview,” January 24, 2012.
16 CHAPTER 3
» Take and pass the commercial road test.
The test has three parts:
A pre-trip inspection test, including an air brake
pre-inspection;
The road test itself;
Driver’s medical exam.
To operate vehicles equipped with air brakes, a driver
must also obtain an air brake endorsement by completing
an air brake course, pass a knowledge test, and pass a pre-
inspection test. A driver may be exempt from an air brake
training course with proof of sufficient air brake experience.
C: Other License Requirements
Owner-operators should obtain a local business license
from the municipality where the business is registered and
must obtain a truck license from the Insurance Corporation
of British Columbia (ICBC). In addition, two other require-
ments are needed to access federal port property: a Port
Pass and a truck license under the TLS that costs $300 a
year (see Section 2.2 for more details).
D: Commercial Vehicle Inspection Requirements
All commercial vehicles with a licensed gross vehicle
weight greater than 8,200 kilograms are subject to the
Province of British Columbia’s Commercial Vehicle Safety
and Enforcement (CVSE) regulations. This generally
requires an inspection by a shop accepted by CVSE as a
Designated Inspection Facility (DIF). A trucking company
that maintains its own fleet may get its shop approved as a
Preventative Maintenance Facility that can inspect its own
fleet. Most owner-operators use a DIF for such inspections.
Engine retrofits or replacements can be used to meet
emission standards regarding age exemptions. The PMV
requirements for future years are evolving. By 2017, trucks
must be 2010 and newer to meet TLS requirements, or 2007
or newer and already in the TLS. PMV’s goal beyond 2012
is to have all trucks in the TLS meet the federal 2007–2010
emission standards.
Secondary equipment includes a two-way radio for
communications with drayage company dispatchers and
a mobile telephone for general communications. A number
of owner-operators carry smartphones, but are reluctant
to use them to communicate with dispatchers; they prefer
two-way radios because the exchanges can be heard by
other parties, creating a communications record.
B: Commercial Driver’s License Requirement
To qualify for a Class 1 commercial license, a driver must:
» Hold a BC driver's license (Class 5 or 6) or an
out-of-province equivalent;
» Have an acceptable driving record with less than four
penalty point incidents in the past two years and no
motor vehicle-related criminal convictions within the
past three years; and
» Be at least 19 years of age.
The necessary steps to acquire a Class 1 commercial
driver's license are:
» Study Driving of Commercial Vehicles. The driver must
study the BC government publication Driving Commercial
Vehicles.
» Take the commercial vehicle knowledge test. The driver
must pass a knowledge and road signs test and meet
medical standards.
» Practise to gain adequate skills. Upon passing the know-
ledge test, the driver is issued a commercial learner’s
license. The driver must practice under this license until
his skills are adequate to pass the road test.
17CHAPTER 3
3.4 OTHER REQUIRED RESOURCES —The other main resource required by owner-operators
is equipment that is compatible with the dispatching
technology used by the trucking companies for whom
they work. Typically drayage companies will provide this
equipment. The dispatching systems used by trucking
companies have differing degrees of sophistication.
For example:
» An operator of a major import distribution centre that
operates an in-house drayage company to serve its
clients uses a proprietary freight tracking system. It was
developed for a major importer, is web-based, and can
be used on a mobile phone. Containers passing through
a terminal gate trigger settlement of the transactions.
» A trucking company with about 60 non-union owner-
operator tractors dispatches by mobile phone, but
believes in-cab communications units would be better.
The company also has GPS units installed in its trucks.
» A trucking company with about 70 CAW owner-operators
under contract uses a digital Java-based dispatching
system and does not have GPS.
» A large employer of CAW owner-operators with 24/7
trucking operations dispatches via Blackberrys using a
proprietary program developed by its parent company.
Other resources required to support a drayage owner-
operator’s business can include office equipment (furniture,
telephones, fax machines, computers, printers, etc.) and
small business software. Some of the most popular software
programs are Quicken (personal finance software with some
business accounting features); Simply Accounting; and
QuickBooks (small business software with more robust
features).
3.5 SELECTION OF WORK —Drayage companies provide several different services
that directly influence the businesses of the owner-
operators who work for them as independent contrac-
tors. These companies have direct relationships with
customers—cargo owners, such as big box retailers, other
types of importers and exporters, shipping lines, freight
forwarders and third party logistics providers—whereas
owner-operators generally do not have such relationships.
It is this customer relationship upon which the trucking
companies have built their businesses. Many companies
have made significant investments in land, buildings,
dispatching and cargo tracking systems, chassis, computer
systems and office staff. Owner-operators, by contrast,
have relatively low levels of investment. They provide a
truck and contract their services to trucking companies
at contracted rates.
As noted previously, the nature of drayage companies
varies depending on several factors such as their customer
base (e.g., import, export), business model (company-
owned trucks with employee drivers, owner-operators, or
a mix of the two), and their relationships with other supply
chain participants. Some companies handle all types of
traffic, including imports, exports and transload cargo,
while others focus on one segment or customer type.

18
Selection of a Drayage Company to Work ForOwner-operators generally choose drayage companies
based on word-of-mouth information. The choice of which
company (or companies) to work for is critical because it
affects shift schedules, the types of loads that are assigned
to the operator, and ultimately the owner-operator’s
revenue stream. Some of the key factors in selecting a
company to work for include: level of compensation,
payment terms, the opportunity for double-ended moves,
driver turnover rate, and how long the company has been
in business.
Drayage companies use a similar word-of-mouth approach
to hire new owner-operators. Nevertheless, some
companies that advertise for owner-operators have
received large volumes of responses. Based on industry
interviews, a “good” owner-operator possesses several
qualities, including a focus on safety; mechanical aptitude;
the ability to see the “big picture”; and the ability to
understand and manage stress.
Selection of Loads and Work SchedulesOwner-operators typically do not have much say in the
selection of loads they move because the dispatcher of the
company for which they work generally specifies the work
based on customer demand and on the marine container
terminal reservations the company has been able to obtain
for a particular day. A typical work schedule for an owner-
operator begins at 5:00 a.m. to pick up the first job of the
day. The working day usually ends between 4:00 and
5:00 p.m., when the marine terminal gates close. Including
travel time to and from the first and last jobs, operators
typically put in 12- to 13-hour days. In addition, some three
hours or so are required each week to handle administrative
aspects of the business.
Senior owner-operators generally do not work night gates.
Some junior owner-operators will work night gates as a
second shift to earn revenue as long as they remain within
the 14-hour on-duty time in a day permitted under National
Safety Code trucking hours of service regulations.
Examples of working hours based on selected industry
interviews are:
» One company operating primarily as a freight forwarder,
with its own trucks and agreements with owner-
operators and trucking companies, is open from 7:00 a.m.
to 4:00 p.m.
» A drayage company with a small storage yard for
containers is open from 6:30 a.m. to 9:00 p.m. weekdays
and on Saturdays and Sundays as required.
» A company with about 70 CAW owner-operators under
contract maintains that shifts should be 6:00 a.m. to
6:00 p.m. or 5:00 a.m. to 5:00 p.m. to give drivers a
reasonable quality of life.
For unionized owner-operators, seniority dictates work
assignments. The first move in the morning—considered
to be the best move of the day—is generally given to
operators with greater seniority. As an example, we
interviewed an experienced CAW driver who has been
driving with his current trucking company for only one
year. Even though he has been in the industry for several
decades, he is low in seniority relative to the work
assignments received. The seniority issue makes switching
among trucking companies an unattractive proposition for
unionized owner-operators with long tenures.
CHAPTER 3

19
3.6 KEY BUSINESS DRIVERS —Given that owner-operators have only a limited degree of
control over their workloads and revenue streams once
they have selected a company to work for, their profit-
ability critically depends on productivity and the utilization
of their truck. Their truck is the principal asset in the
business. These factors, discussed below, explain why
owner-operators look at the number of turns per day as a
key metric in performance evaluation. A rule of thumb in
the industry is that a minimum of three round-trip revenue
moves a day are needed for a driver to make money.
ProductivityFrom the owner-operator’s perspective, productivity
corresponds directly to the number of revenue-generating
moves completed in a working day. Productivity is a key
factor impacting an owner-operator’s income, because
compensation is typically calculated per trip and not on an
hourly basis. Therefore, the number of revenue moves per
day that a driver can complete will directly dictate how
much income the driver earns. This differs from company
employee drivers, who are typically paid on an hourly basis
and whose compensation is therefore independent of the
number of moves completed per day.
A key factor impacting container drayage productivity
(and thus owner-operator income) is the ability to achieve
double-ended moves. A double-ended move occurs, for
example, when a truck is able to deliver an export container
to a terminal and pick up another import container on the
same visit. Double-ended moves allow owner-operators to
be more productive, increase revenues and lower operating
costs by reducing unproductive travel. Reduced travel also
helps decrease road traffic congestion and lessens the
environmental impact of trucking.
There are no reliable data regarding double-ended move-
ments. Discussions with various operators revealed a wide
range of performance. Some carriers achieve more than
50% of their total moves as double-ended moves, while
others may achieve only 10–15% or less. Anecdotal
evidence based on consultations carried out for this report
suggest the industry average has deteriorated from about
30% double-ended moves in 2005 to around 20% today.
Truck UtilizationThe truck (tractor) is the largest capital expense in an
owner-operator’s business. Buying one is a fixed cost that
is incurred whether or not the truck is operating. Therefore,
increasing the use of truck equipment enables fixed costs
to be allocated across more revenue-generating trips,
decreasing fixed costs per trip. These savings, in turn,
result in increased revenue and profitability.
Given the limitations on operating hours permitted by
safety regulations, increased truck usage can only be
accomplished by adding a driver to existing truck
equipment. But owner-operators typically have little
incentive to bring in a second (relief) driver because they
want to maximize their own activity on the day shift and
there are limited opportunities to work evening shifts.
Few drivers want to work for the limited number of
moves available on a second shift.
CHAPTER 3

20
Most night-gate moves are one-way. Only the container
terminals and a limited number of warehouses and off-dock
terminals are open after 5:00 p.m. (e.g., CN intermodal in
Langley, Canadian Tire Corporation, The Bay). The only way
container terminal night gates will work is if receivers, such
as warehouses and a number of off-dock terminals, are
open until midnight (or 24/7). But many off-dock facilities
are too small to be open at night, leaving nowhere for a
drayage operator to hold the container overnight. As well,
there is no compensation for overnight storage or for the
additional unpaid trip to transport it the next day. Some
containers hold valuable cargoes and must be secured;
they cannot be left on the street.
Considering all of these factors, there is limited incentive
for an owner-operator to bring on a second driver, and the
relief driver model is not generally feasible. Furthermore,
owner-operators are cautious about risking the use of
their truck by another driver. Another option to expand
the business is to add more trucks. However, financial
constraints are often an issue in acquiring the vehicles;
and some trucking companies do not allow their owner-
operators to have more than one truck as a matter of policy.
CHAPTER 3
21
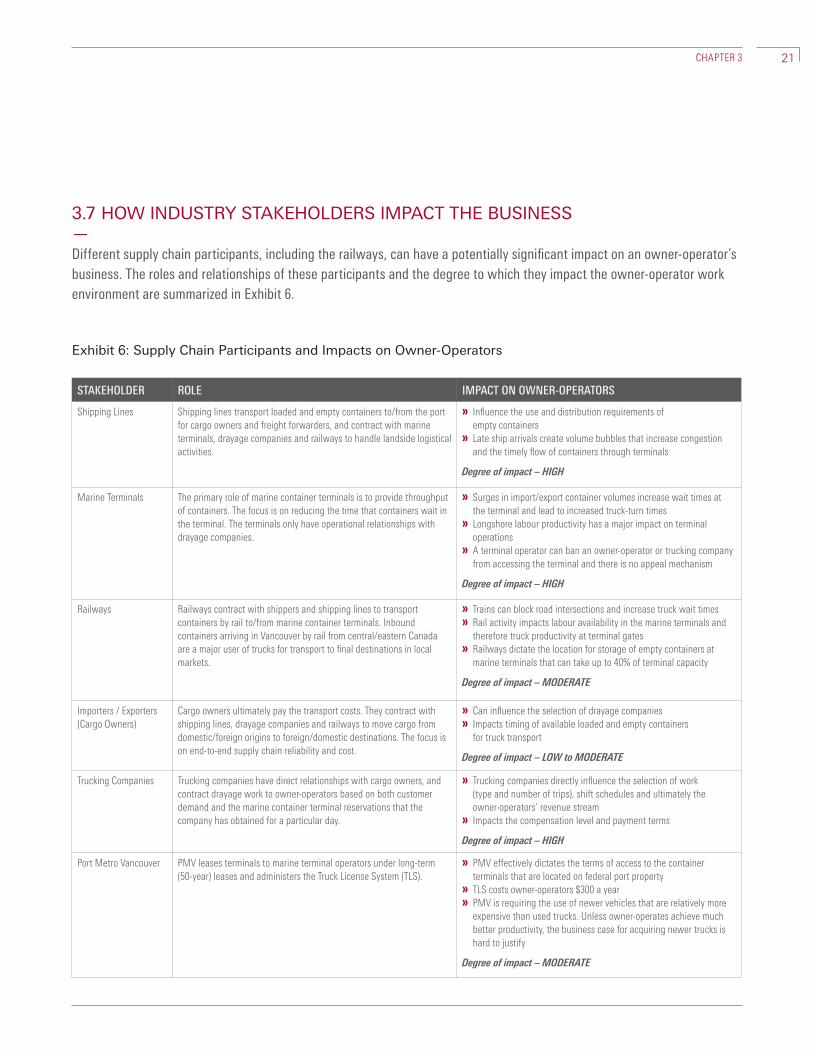
3.7 HOW INDUSTRY STAKEHOLDERS IMPACT THE BUSINESS — Different supply chain participants, including the railways, can have a potentially significant impact on an owner-operator’s
business. The roles and relationships of these participants and the degree to which they impact the owner-operator work
environment are summarized in Exhibit 6.
STAKEHOLDER ROLE IMPACT ON OWNER-OPERATORS
Shipping Lines Shipping lines transport loaded and empty containers to/from the port
for cargo owners and freight forwarders, and contract with marine
terminals, drayage companies and railways to handle landside logistical
activities.
» Influence the use and distribution requirements of
empty containers
» Late ship arrivals create volume bubbles that increase congestion
and the timely flow of containers through terminals
Degree of impact – HIGH
Marine Terminals The primary role of marine container terminals is to provide throughput
of containers. The focus is on reducing the time that containers wait in
the terminal. The terminals only have operational relationships with
drayage companies.
» Surges in import/export container volumes increase wait times at
the terminal and lead to increased truck-turn times
» Longshore labour productivity has a major impact on terminal
operations
» A terminal operator can ban an owner-operator or trucking company
from accessing the terminal and there is no appeal mechanism
Degree of impact – HIGH
Railways Railways contract with shippers and shipping lines to transport
containers by rail to/from marine container terminals. Inbound
containers arriving in Vancouver by rail from central/eastern Canada
are a major user of trucks for transport to final destinations in local
markets.
» Trains can block road intersections and increase truck wait times
» Rail activity impacts labour availability in the marine terminals and
therefore truck productivity at terminal gates
» Railways dictate the location for storage of empty containers at
marine terminals that can take up to 40% of terminal capacity
Degree of impact – MODERATE
Importers / Exporters
(Cargo Owners)
Cargo owners ultimately pay the transport costs. They contract with
shipping lines, drayage companies and railways to move cargo from
domestic/foreign origins to foreign/domestic destinations. The focus is
on end-to-end supply chain reliability and cost.
» Can influence the selection of drayage companies
» Impacts timing of available loaded and empty containers
for truck transport
Degree of impact – LOW to MODERATE
Trucking Companies Trucking companies have direct relationships with cargo owners, and
contract drayage work to owner-operators based on both customer
demand and the marine container terminal reservations that the
company has obtained for a particular day.
» Trucking companies directly influence the selection of work
(type and number of trips), shift schedules and ultimately the
owner-operators’ revenue stream
» Impacts the compensation level and payment terms
Degree of impact – HIGH
Port Metro Vancouver PMV leases terminals to marine terminal operators under long-term
(50-year) leases and administers the Truck License System (TLS).
» PMV effectively dictates the terms of access to the container
terminals that are located on federal port property
» TLS costs owner-operators $300 a year
» PMV is requiring the use of newer vehicles that are relatively more
expensive than used trucks. Unless owner-operates achieve much
better productivity, the business case for acquiring newer trucks is
hard to justify
Degree of impact – MODERATE
Exhibit 6: Supply Chain Participants and Impacts on Owner-Operators
CHAPTER 3

22
FINANCIAL ASPECTS OF THE OWNER-OPERATOR BUSINESS
The previous chapter described the owner-operator
business and what it does. This section of the report
will focus on the financial and cost characteristics of
the business.
This chapter presents the only comprehensive drayage
costing model available in Metro Vancouver today.
It also provides several analytical tools that may be
used by owner-operators to prepare a business plan,
which, in turn, may be used to evaluate and benchmark
their business or obtain financing. The purpose of these
tools is to help owner-operators better understand and
manage their businesses in order to improve their
financial performance.
These cost and financial tools may also be used to analyze
a variety of operational and policy questions, such as12:
» Should potential new owner-operators get into
the business?
» Should existing owner-operators exit the business?
» What are the financial impacts of improving productivity
in the drayage sector?
» What are the cost/financial impacts of operating new
versus used trucks?
» Do the existing regulated rates adequately compensate
owner-operators, who comprise approximately half the
drayage labour force in Metro Vancouver?
The chapter begins with a discussion of revenue and
compen sation, followed by a description of the owner-
operator truck cost/financial model and the main
assumptions used to develop the model. Appendices 3
and 4 provide additional detailed assumptions and some
sample results from the application of the model.
4.1 REVENUE AND COMPENSATION—To understand the current financial situation of Metro
Vancouver owner-operators, some background is appro-
priate. In the summer of 2005, concerns by owner-operators
regarding high fuel costs and excessive wait times at
container terminals that significantly reduced truck produc-
tivity and income led to a five-week shutdown of the port
when owner-operators withdrew their services. The dispute
was resolved through the Vince Ready Memo randum of Agreement (MOA) between trucking companies and owner-
operators, which established a schedule of minimum rates
(“Ready rates”) that non-unionized owner-operators would
be paid to move containers.13 A number of steps were taken
to develop the current Port Authority Operations Regulations14 for the purpose of facilitating stability in port operations.
The Regulations created a legal obligation for the Vancouver
Fraser Port Authority (i.e., PMV) to establish a system of
written agreements in the form of licenses (administered
under the TLS) that established minimum conditions
regarding truck trips to/from port terminals. The key aspect
regarding compensation is that owner-operators must
be paid the equivalent of a rate published in a collective
agreement of a competing drayage operation (for unionized
drivers) and not be paid less than the rates set out in
the MOA (for non-union drivers). Although the rates
are enforced by a system of audits carried out by the
BC Ministry of Transportation and Infrastructure as an
appointee of PMV, this system is widely viewed in the
industry as ineffective and virtually impossible to enforce.
12) The costing model and financial tools described herein form part of the
owner-operator toolkit mentioned in Chapter 1 and are available in a separate
Excel spreadsheet format.
13) Vince Ready was appointed by the provincial and federal governments as a
mediator to the dispute. The Memorandum of Agreement (MOA), dated July 29,
2005 between Trucking Companies (Owners/Brokers) and the Vancouver
Container Truckers’ Association, covered drayage moves to/from the Vanterm,
Centerm, Deltaport and Fraser Surrey Docks marine container terminals and the
intermodal yards of CP and CN.
14) Refers to Port Authorities Operations Regulations (SOR/2000-55).
Regulations are current to 2013-03-04 and were last amended on 2007-07-31.
See http://laws-lois.justice.gc.ca/eng/regulations/SOR-2000-55/.
CHAPTER 4

23CHAPTER 4
Although the regulated rates include a fuel surcharge
component that provides a small offset for rising fuel costs
(the surcharge is only about 6% applied to the total Ready
rate), the Ready rates have not changed since August 1,
200615 despite changing market and cost conditions. The
rates are prescribed on a per-trip basis for different origins
and destinations in Metro Vancouver to provide a
theoretical rate floor (see Appendix 2).
Initially, the MOA and Regulations were interpreted as
applying to the delivery or pick-up of containers, including
hauling containers between the marine container terminals,
customers and final locations that included off-dock sites.
However, in 2010, PMV concluded that the Regulations only
covered the trip leg between the customer and the port,
not the leg to/from an off-dock location. Transport Canada
supported this interpretation and determined that federal
regulation applied only to those moves that originate or terminate at the port’s marine container terminals.
The impact is that owner-operators may not always
be fully compensated for “third leg” moves (i.e., moves
between off-dock locations, such as terminals, storage
yards and rail yards) that are not on port property. This
is significant because large proportions of the drayage
activity in the region relate to moves between off-dock
locations, while moves to or from container terminals
often involve at least one empty chassis move.
The third-leg remuneration issue has been exacerbated
by the continued development and dispersion of off-dock
facilities throughout Metro Vancouver.
One carrier stated that up to 80% of import containers go
to an off-dock location once their import cargo is unloaded
in the Metro Vancouver area. On the export side, the figure
may be lower, perhaps in the 30–40% range. The level of
compensation for an off-dock movement varies widely
depending on company policy (see also Appendix 2 for
commentary on the Ready rates).
4.2 TRUCK COST / FINANCIAL MODEL—This section outlines the technical foundation and
methodology used to develop the owner-operator truck
cost/financial model. It begins with a review of the
principles of financial models in a trucking application,
followed by a description of the main truck cost elements,
the cost/financial model tools that were developed, data
sources and key assumptions. Sample results from the
model are provided in Appendix 4.
Principles of Financial ModelsFinancial models are generally used to evaluate business
decisions regarding operations and investments. They
incorporate revenues and expenses, estimate profits and
compare profits with the investments required. Expenses
in financial models for trucking can involve various kinds
of estimates, including:
» Estimates from first principles. Examples include fuel
cost estimated as consumption per unit, such as litres
per kilometre multiplied by the prevailing market price
for diesel; labour costs at current rates multiplied by
workload per year; and tires at a cost per set (typically
10 tires for a tractor) and their replacement cycles.
» Estimates from surveys of trucking costs. Detailed
surveys of truck operators generate a good database
of operating costs as inputs to a financial model.
Because surveys are conducted at a particular point in
time, it is generally necessary to escalate costs from
the time of the survey to reflect current price levels.
15) On July 29, 2005, the Ready MOA established the schedule of minimum
rates (Schedule 1) that came into force under an Order-in-Council requiring
Vancouver Fraser Port Authority (i.e. PMV) to implement a mandatory Truck
License System (TLS) and to enforce the Ready rates for non-unionized
owner-operators. However, the current rates are those contained in Schedule 2,
and came into effect August 1, 2006 per the regulation that replaced the
original 2005 Order-in-Council. The Schedule 2 rates are slightly higher than
those contained in Schedule 1. See Appendix 2.
24 CHAPTER 4
» Evaluations of accounting data and other records.
If an owner-operator maintains good records of costs and
business activity, it is possible to generate cost estimates
customized for particular operations for each year of
activity. It is possible to export data from accounting
software into analytical software, such as Microsoft
Excel, to estimate unit costs for modeling purposes.
The financial model that was developed for this study is
essentially a combination of all three of these approaches
and is described in the methodology section below.
Treatment of Revenue in the Financial ModelRevenue is a simple calculation in principle: payment for
the sale of a good or service multiplied by sales volume.
However, it is less simple in the case of owner-operator
container drayage. This is due to the variety of different
payment schemes (i.e., union collective agreements,
Ready rates for moves to and from marine container
terminals, and market rates for some other moves) as well
as the variety of truck movements that an owner-operator
can make to serve different origins and destinations.16
The latter includes paid movements, such as transporting
full or empty containers between terminals, and move-
ments that may be paid in some cases but not all, such
as picking up or dropping off empty chassis.
The treatment of revenue in the financial model for the
purposes of this study is straightforward. The model use
has two approaches. The first approach requires the user to
input total revenue in any given time period (i.e., per move,
per day, per month). The second approach derives revenue
from the Ready rate scale that compensates owner-
operators by the trip, depending on the origin and
destination for the container move.
Understanding Truck CostsSince the revenues that owner-operators receive are
largely beyond their control, at least in terms of the per
trip rates they receive, success as a business owner
critically depends on understanding and managing costs.
An operator who can reduce costs by five cents per kilo-
metre will save $3,000 a year over 60,000 kilometres driven
in one year. These savings go entirely to bottom-line profits.
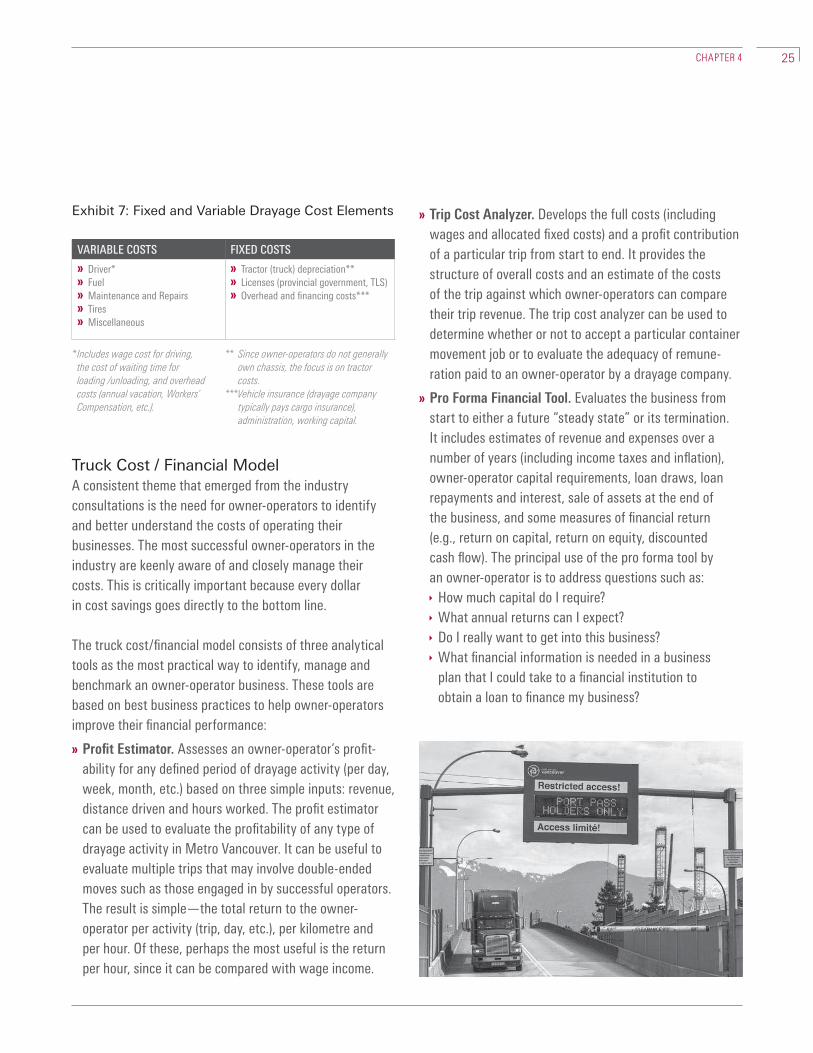
Expenses generally have fixed and variable components
(see Exhibit 7). Fixed costs may be viewed as the costs
of time—they do not change from month to month,
and include ownership of tractors (depreciation, capital
recovery, etc.), insurance and license fees. Fixed costs
are allocated to period costs, such as a trip in proportion
to distance in relation to the annual utilization of a tractor
in kilometres.
Variable costs are those costs that vary with trucking
activity, such as distance traveled or time spent, and
include fuel, operator wage allowance, and maintenance.
Some costs may have both fixed and variable components.
For example, tire costs may be treated as either variable
costs (e.g., tire replacement cost divided by tire life
measured in kilo metres) or short-term fixed costs by
treating tires as a capital replacement cost (e.g., tire
replacement cost every two years); the choice of approach
may depend on the distance driven in a year.
Costing models usually divide investments into fixed assets
(primarily tractors in the case of this study) and working
capital (funds required to run the business). The main
elements of working capital are cash, accounts receivable
(income for work performed and invoiced, but not yet paid)
and the liability of accounts payable (expenses incurred
but not yet paid). Accounts receivable are a particular
issue for small businesses like drayage owner-operators:
if customers are typically slow to pay, the owner-operator
must have sufficient capital to allow for this.
16) For example, the Ready rate (without fuel cost escalation) to move a container
from New Westminster to Deltaport is $135 per trip; the rate from New
Westminster to Vanterm or Centerm, located at Burrard Inlet, is $115 per trip.
25CHAPTER 4
VARIABLE COSTS FIXED COSTS
» Driver*
» Fuel
» Maintenance and Repairs
» Tires
» Miscellaneous
» Tractor (truck) depreciation**
» Licenses (provincial government, TLS)
» Overhead and financing costs***
* Includes wage cost for driving,
the cost of waiting time for
loading /unloading, and overhead
costs (annual vacation, Workers’
Compensation, etc.).
** Since owner-operators do not generally
own chassis, the focus is on tractor
costs.
***Vehicle insurance (drayage company
typically pays cargo insurance),
administration, working capital.
Truck Cost / Financial ModelA consistent theme that emerged from the industry
consultations is the need for owner-operators to identify
and better understand the costs of operating their
businesses. The most successful owner-operators in the
industry are keenly aware of and closely manage their
costs. This is critically important because every dollar
in cost savings goes directly to the bottom line.
The truck cost/financial model consists of three analytical
tools as the most practical way to identify, manage and
benchmark an owner-operator business. These tools are
based on best business practices to help owner-operators
improve their financial performance:
» Profit Estimator. Assesses an owner-operator’s profit-
ability for any defined period of drayage activity (per day,
week, month, etc.) based on three simple inputs: revenue,
distance driven and hours worked. The profit estimator
can be used to evaluate the profitability of any type of
drayage activity in Metro Vancouver. It can be useful to
evaluate multiple trips that may involve double-ended
moves such as those engaged in by successful operators.
The result is simple—the total return to the owner-
operator per activity (trip, day, etc.), per kilometre and
per hour. Of these, perhaps the most useful is the return
per hour, since it can be compared with wage income.
» Trip Cost Analyzer. Develops the full costs (including
wages and allocated fixed costs) and a profit contribution
of a particular trip from start to end. It provides the
structure of overall costs and an estimate of the costs
of the trip against which owner-operators can compare
their trip revenue. The trip cost analyzer can be used to
determine whether or not to accept a particular container
movement job or to evaluate the adequacy of remune-
ration paid to an owner-operator by a drayage company.
» Pro Forma Financial Tool. Evaluates the business from
start to either a future “steady state” or its termination.
It includes estimates of revenue and expenses over a
number of years (including income taxes and inflation),
owner-operator capital requirements, loan draws, loan
repayments and interest, sale of assets at the end of
the business, and some measures of financial return
(e.g., return on capital, return on equity, discounted
cash flow). The principal use of the pro forma tool by
an owner-operator is to address questions such as:
How much capital do I require?
What annual returns can I expect?
Do I really want to get into this business?
What financial information is needed in a business
plan that I could take to a financial institution to
obtain a loan to finance my business?
Exhibit 7: Fixed and Variable Drayage Cost Elements
26 CHAPTER 4
Methodology and Key AssumptionsThe initial database used for the container drayage truck
cost/financial model is derived from Ray Barton and
Associates (Barton), who have prepared periodic surveys
of trucking costs in Canada for Transport Canada for
a number of years.17 Barton uses several data sources,
principal among them surveys of trucking companies,
and prepares costs for Canadian regions and for different
kinds of tractor and trailer combinations.
The Barton model provides a credible framework for the
drayage financial model. However, in order to better reflect
the cost characteristics of the Metro Vancouver container
drayage industry, the Barton model was refined in a
three-step process.
First, the costs were indexed to bring them to 2012 levels,
since the Barton model used 2010 values. The second step
refined the Barton model based on select data obtained
from Metro Vancouver trucking companies and owner-
operators.18 Several adjustments were made to reflect
local drayage operating and cost conditions. The main
adjust ments made to the Barton model are: increased driver
costs to reflect longer wait times at container terminals;
lower tractor ownership costs due to the use of older, less
costly trucks; higher maintenance, repair and tire costs;
and lower overhead and administration costs. The third
step was to refine the model to allow user inputs for several
major cost items. These are hourly driver wage rate, fuel
cost per kilometre, maintenance cost per kilometre,
administration cost per year, tractor capital cost, and
annual tractor utilization.
Exhibit 8 highlights the primary data sources and key
assumptions used in the truck cost/financial model.
The Trip Cost Estimator and Profit Estimator allow the user
to modify the following inputs in order to analyze any type
of container drayage operation in Metro Vancouver:
» Average annual tractor utilization (in kilometres),
which is part of fixed-cost allocation
» Average speed
» Tractor financial parameters, including new or used
vehicle, capital cost, vehicle life and residual value
» Trucking distances to cover all likely moves (i.e., to point
of empty chassis pick-up, pick-up and delivery at terminals
and to the point of empty chassis drop-off)
» Waiting time at terminals or off-dock locations
» Profit as a percent of total cost
» Ready rate origins and destinations
The Pro Forma Financial Tool allows the user to adjust the
following inputs:
» Capital expenditures for equipment other than the tractor
» Working capital and loans
» Trip characteristics based on annual averages
» Annual revenues, costs and escalation factors to allow
for five-year business projections
All three models allow users to choose between model
default values or enter their own estimates for the
following operating costs:
» Fuel (the default value is per kilometre, but the user
can enter specific estimates of fuel consumption,
such as litres/kilometre, as well as fuel price per litre)
» Maintenance cost per kilometre
» Administration cost per year
17) Ray Barton and Associates, Logistics Solution Builders Inc. and The Research
and Traffic Group, “Final Report Operating Costs of Trucking and Surface
Intermodal Transportation in Canada,” Transport Canada RFP File # T8080
– 100234, March 15, 2011.
18) Note that the scope of this study did not permit an extensive data
collection survey.

27CHAPTER 4
COST ITEM DATA SOURCE ASSUMPTION / COMMENT
VARIABLE Variable costs typically comprise about 80% of total truck operating costs, or $2.50/km, including an allowance for wages.
Driver Wage User input The default value used in the model is $25.00/hour plus a 15% wage burden for CPP and workers’ compensation.
The driver wage covers the cost of driving plus wait times at pick-up and delivery points.
At the end of the day, the wage rate is what the owner-operator hopes to make from the business and may be compared
to other employment opportunities an operator may have. If a value of zero is used in the model, then the profit for the trip
(or trips) in any given time period is equal to the driver’s income.
Fuel User input or default
value from Barton
confirmed through
consultations
The Barton default value is $0.548/km. Since fuel is one of largest variable cost items, accounting for approximately 22% of
total variable costs, the model provides the option to input a specific fuel consumption rate in miles per gallon and current
price per litre. An owner-operator pays about $40,000 a year for fuel if he drives 70,000 km/year at a cost of $0.548/km.
Maintenance
& Repairs
User input or default
value from Barton
confirmed through
consultations
Barton cost is $0.081/km for a new truck, or $0.121/km for a used truck, at the user’s discretion. The used truck cost is
assumed to be 50% higher than the new truck cost. The user can choose to enter his own estimate of maintenance and
repairs in dollars per km. Maintenance and repair costs are about 5% of total variable costs.
Tires Barton $0.028/km, or about 1% of total variable costs. This assumes the cost for a set of 10 new tires that last for 2 years is
about $5,000.
Miscellaneous Barton $0.015/km, or about 0.5% of total variable costs. This cost category includes items such as small tools and equipment,
truck cleaning, communications equipment, etc.
FIXED Fixed costs comprise about 20% of total operating costs, or $0.60/km (the cost per km is sensitive to annual truck utilization).
Tractor
Ownership
User input or default
value based on
consultation results
and industry best
practices
The default value in the model is $60,000 for a typical used tractor. The user has the option of substituting any value to reflect
a specific vehicle (newer vehicles can cost $90,000 to $140,000). A key factor for ownership cost is the annual vehicle
utilization rate that is used to allocate this cost over time. Truck utilization varies widely among owner-operators. Depending
on the nature of the drayage operation (i.e., pure drayage, or shunting at a major customer, or more highway moves from rail
intermodal terminals), truck utilization ranges between 25,000 and 120,000 km a year. The tractor cost and assumed use have
a major impact on tractor ownership costs and represent 40% to 50% of total fixed costs.
Licenses Barton $2,400/year, representing about 6% of total fixed costs.
Insurance Barton $8,000/year, representing about 20% of total fixed costs.
Administration User input or default
value based on
consultation results and
industry best practices
The default value is $10,000/year based on best practices and covers general administration and bookkeeping, accounting
and legal fees. General overheads are assumed to be 45 minutes per working day. The user of the model has the option of
using any other value stated as an annual cost.
Exhibit 8: Cost/Financial Model Key Assumptions

28 CHAPTER 4
Sensitivity of the Model to Changes in ProductivityThe Profit Estimator provides a powerful tool to evaluate
the financial impacts of different drayage operating
scenarios. For example, it could be used to assess the
impact of improving productivity by increasing the number
of double-ended moves, reducing wait times at container
terminal gates, or improving travel times associated with
infrastructure improvements, such as the South Fraser
Perimeter Road. It could also be used to evaluate the
potential impacts of policy changes, such as promoting the
use of newer trucks in order to reduce the environmental
footprint of port-related activities.
Exhibit 9 illustrates the impact of improving truck
productivity on owner-operators’ returns. In the base case
scenario, the owner-operator makes three revenue trips
per day, and has to travel 20 kilometres to the terminal to
pick up the container as well as another 10 kilometres from
the delivery terminal to position for the next revenue load.
This results in a total of 30 kilometres of unpaid driving
activity, and limits the number of paid container moves that
can be handled in the day. Under this scenario, the net
return to the driver is $20.30/hour.
In the second scenario, the operator achieves four revenue
trips per day and is able to reduce unproductive driving
activity from 30 kilometres in the base case to 10 kilometres
due to double-ended moves. This reduces both the total
distance driven and unproductive time. The result under
this scenario is to improve the net return to $32.29/hour,
a gain of 60%. Under the third scenario, five revenue trips
are made in the day, and additional double-ended moves
and reduced queuing time at the terminal improve
productivity even further. The net return increases to
$38.95, a gain of 92% over the base case.
These scenarios demonstrate the high degree of sensitivity
of owner-operator returns to changes in productivity.
Productivity improvements are one of the most critical
aspects in improving operating conditions in the drayage
sector.
ITEM BASE CASE 4 TRIPS/DAY 5 TRIPS/DAY
Revenue ($) 450.00 600.00 750.00
Variable Cost ($)* 128.14 113.90 142.38
Gross Operating Profit ($) 321.86 486.10 607.62
Fixed and Overhead Costs ($) 108.67 98.59 120.74
Net Return to Owner–Operator ($) 213.19 387.51 486.88
Net Return (per hour) $20.30 $32.29 $38.95
Difference (per hour vs. base case) — +$11.99 +$18.65
Difference (per cent vs. base case) — +60% +92%
Exhibit 9: Sensitivity of Returns to Truck Productivity
Improvements (Revenue and cost, $/day)
* Excludes driver wages. Driver compensation is shown in this example as the net
return after covering all other variable costs such as fuel, tires, maintenance and
repairs.

29CHAPTER 5
BEST PRACTICE FINDINGS AND RECOMMENDATIONS
The previous sections of this report focused on the owner-operator business in terms of what the business does
(business model) and how it makes money (cost model) in order to provide a better understanding of the container
drayage sector in Metro Vancouver. This chapter builds on this information by examining the business practices of
successful operators collected through industry interviews with both drayage companies and owner-operators. The
objective is to identify the key factors and skills that lead to success in the industry and to provide recommendations
to owner-operators and industry stakeholders in order to improve the business and economic performance of the
drayage sector in Metro Vancouver.
The discussion begins with a focus on the customer value proposition and is followed by the key factors that drayage
companies look for when contracting an owner-operator, the factors owner-operators should consider when selecting
a drayage company, and finally what can be done to improve the overall performance of the drayage sector.
5.1 OWNER-OPERATOR VALUE PROPOSITION—From a drayage company perspective, owner-operators
provide benefits that enhance the value of their own
business, as well as the services they are in turn able to
offer to the importers/exporters and shipping lines who
are their primary customers:
» Cost advantages. Drayage companies could achieve
a competitive edge by using owner-operators because
they may be able to pay them less than what they pay
company drivers. This is because the company avoids the
cost burden of fringe benefits and wage overhead costs.
Such cost savings could also be used to advantage by
sharing a portion of the savings with owner-operators as
an incentive. The fact that some large drayage companies
such as CNTL have converted to a 100% owner-operator
model is evidence of the benefits.
» Reduced financial risks. Companies can reduce their
capital requirements and financial risks by using owner-
operators, since the company is able to avoid the capital
costs of purchasing a fleet of trucks.
» Flexibility. Companies that use owner-operators have
the flexibility to adjust the size of their operation by
expanding or contracting in a timely and cost-effective
manner in response to changing market conditions.
» Access to TLS Independent Owner-Operator Permits.
Given the existing moratorium on TLS licenses for owner-
operators, those who already have a license add value by
providing a ready supply of labour to companies looking
to bring on additional operators.
30 CHAPTER 5
5.2 COMPANY CRITERIA: SELECTING GOOD OWNER-OPERATORS—A common theme that emerged from the interviews is an
emphasis on safety. Several companies indicated that
owner-operators must have a clean safety record and
comply with National Safety Code (NSC) standards
regarding drivers and vehicle maintenance.
The main skills/attributes used by companies to identify
and select good operators include:
» Good reputation in the industry for reliability;
» Sufficient driving experience;
» Positive attitude, willingness to learn and an under-
standing of the gateway container supply chain
“big picture”;19
» Dependable and flexible—able to handle frequently
changing work requirements;
» Responsible and to have developed a business plan,
business systems and a regular preventative truck
maintenance program;
» Understands and manages stress (self-awareness);
» Mechanical aptitude.
5.3 OWNER-OPERATOR CRITERIA: SELECTING A GOOD COMPANY TO WORK FOR—As noted previously, there are some 160 local drayage
companies of varying sizes in Metro Vancouver. Owner-
operators contract out their equipment and services to one
or more of these companies. The choice of which company
(or companies) to work for is critical because it affects
workload, shift schedules, quality of life and income.
From an owner-operator’s perspective, the key questions
to ask when selecting a company to work for are:
» How long has the company been in business?
The longer the better.
» What is the company’s driver turnover rate? The lower
the better, because high driver turnover may indicate
poor working conditions.
» Does the company provide a signed contract with clearly
defined terms of the business arrangement?
» What do discussions with other owner-operators who
work for the company indicate about the company and
its working conditions?
» How does the company compensate its owner-operators
in general and what are its detailed compensation terms?
» Will it be possible to get double-ended revenue-
generating moves?
» Does the company pay for waiting time at marine
terminals and subsidize fuel costs?
» How long does it take to get paid after hauling a load?
» Does the company have established arrangements with
a repair shop that can help owner-operators with truck
repairs under the company umbrella?
This last point can be extremely valuable because it helps
reduce delays in getting unexpected repairs completed,
thereby minimizing downtime in the event of mechanical
problems with the vehicle that is the owner-operator’s
chief source of income.
19) Interestingly, several interviewees had the misperception that
PMV somehow controlled the container terminals.

31CHAPTER 5
5.4 KEY CHALLENGES—There are major opportunities for growth on the horizon.
Import and export container traffic volume moving through
the port is expected to approximately double by 2030 to
about 6 million TEUs. To realize the growth opportunities
ahead, the operation and performance of the drayage
sector serving the port must be improved.
The fundamental challenges confronting the drayage
sector may be grouped into three broad areas:
» Lack of a sustainable economic model. Intense price
competition, the fact that the Ready rates do not keep
pace with current market conditions, and the false
security of the rate “floor” under the regulated rate
regime mean there is no sustainable economic model
in the drayage sector—a factor that contributes to
instability and reduced profits for owner-operators.
» Lack of integrated planning and operations. Without
closer coordination among supply chain participants to
align interests, drayage productivity will continue to be
an issue, resulting in long and unpredictable truck turn
times at container terminals and sub-optimization of
double-ended revenue moves.
» Limited knowledge and understanding. There is a
general lack of knowledge in the drayage sector with
respect to understanding and managing truck operating
costs and how businesses can improve their financial
management. In addition, the roles and responsibilities
of different supply chain participants are not generally
well understood by owner-operators. This lack of clarity
poses a significant communications challenge when it
comes to addressing key issues and the implementation
of system-wide solutions.
Several of the challenges are symptoms of underlying
systemic factors, for example: the inherent seasonality
of the container trade, which causes periodic volume
fluctuations; legacy reservation systems of the terminal
operators; longshore labour paradigms; and container
terminal capacity constraints. The combination of these
and other factors results in a significant degree of “noise”
and finger-pointing in the system, and are exacerbated by
daily operational frustrations that occasionally flare up as
well as a general lack of trust. These issues cause a great
deal of anxiety in the drayage community.
The systemic challenges are beyond owner-operators’
control or influence. Other issues are a matter of policy,
such as the extent to which the provincial and federal
governments should be involved in rate regulation in the
drayage sector and whether or not market forces would
promote greater stability.

32 CHAPTER 5
5.5 RECOMMENDATIONS FOR IMPROVING DRAYAGE SECTOR PERFORMANCE—The research and analysis into best business practices carried out for this project led to recommendations for
owner-operators and other drayage sector stakeholders, and are shown below.
ITEM BEST PRACTICES
Cost ControlReducing costs by just 5 cents/km will save
$3,500 a year for an owner-operator who
drives 70,000 km per year—these savings
go directly to the bottom line.
» Understand and manage all costs, fixed and variable
» Focus on minimizing the most significant cost items, such as fuel and tractor purchase
» Implement a preventative truck maintenance program to keep costs under control and minimize revenue lost to
equipment breakdowns.
Truck AssetsAn owner-operator’s truck is the most
important asset—having a safe, reliable,
cost-effective vehicle(s) is critical for success.
» Consider acquiring a new truck that offers the following potential benefits:
May be more reliable than an older, used vehicle
Less costly due to fewer mechanical issues
Repairs covered under warranty
Complies with PMV age/emission standards, which are becoming more stringent to improve port standards
Performance MonitoringSuccessful owner-operators adjust for
changing conditions to maximize profitability
—the key here is to track performance
against a business plan and budget in order
to determine what adjustments to make.
» Develop a business plan and budget to track finances
» Keep good records to determine how the plan/budget is working and whether or not adjustments are required
» Utilize accounting software for bookkeeping and reporting
» Account for depreciation by setting aside money for eventual vehicle replacement
» Keep a reserve ($10,000–$15,000) to accommodate unforeseen expenses, such as major vehicle repairs
Recommendations for Owner-Operators
1% Tires
4% Maintenance & Other
18% Fuel
20% Fixed Costs
33% Driver Wait Time
24% Driver Operating Time
Source: CTC-Seaport Drayage Trip Cost Analyzer.
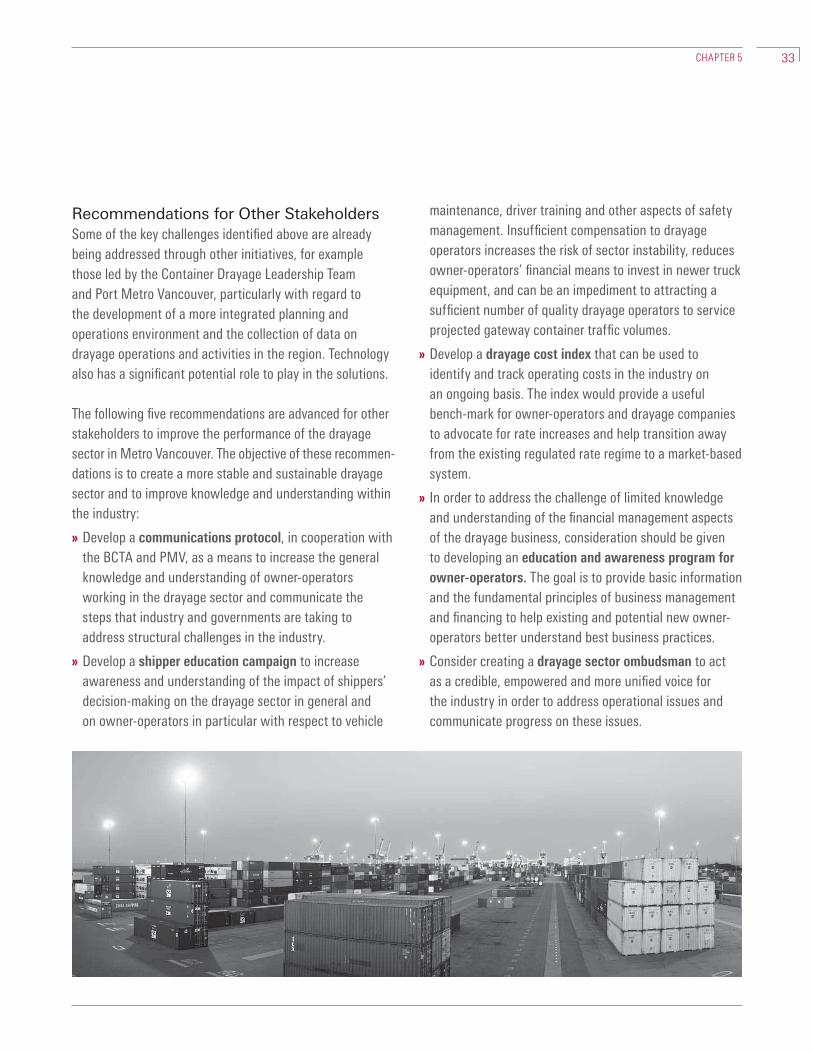
33CHAPTER 5
Recommendations for Other StakeholdersSome of the key challenges identified above are already
being addressed through other initiatives, for example
those led by the Container Drayage Leadership Team
and Port Metro Vancouver, particularly with regard to
the development of a more integrated planning and
operations environment and the collection of data on
drayage operations and activities in the region. Technology
also has a significant potential role to play in the solutions.
The following five recommendations are advanced for other
stakeholders to improve the performance of the drayage
sector in Metro Vancouver. The objective of these recommen -
dations is to create a more stable and sustainable drayage
sector and to improve knowledge and understanding within
the industry:
» Develop a communications protocol, in cooperation with
the BCTA and PMV, as a means to increase the general
knowledge and understanding of owner-operators
working in the drayage sector and communicate the
steps that industry and governments are taking to
address structural challenges in the industry.
» Develop a shipper education campaign to increase
awareness and understanding of the impact of shippers’
decision-making on the drayage sector in general and
on owner-operators in particular with respect to vehicle
maintenance, driver training and other aspects of safety
management. Insufficient compensation to drayage
operators increases the risk of sector instability, reduces
owner-operators’ financial means to invest in newer truck
equipment, and can be an impediment to attracting a
sufficient number of quality drayage operators to service
projected gateway container traffic volumes.
» Develop a drayage cost index that can be used to
identify and track operating costs in the industry on
an ongoing basis. The index would provide a useful
bench-mark for owner-operators and drayage companies
to advocate for rate increases and help transition away
from the existing regulated rate regime to a market-based
system.
» In order to address the challenge of limited knowledge
and understanding of the financial management aspects
of the drayage business, consideration should be given
to developing an education and awareness program for
owner-operators. The goal is to provide basic information
and the fundamental principles of business management
and financing to help existing and potential new owner-
operators better understand best business practices.
» Consider creating a drayage sector ombudsman to act
as a credible, empowered and more unified voice for
the industry in order to address operational issues and
communicate progress on these issues.

34 CHAPTER 5
Toolkit RecommendationsThe toolkit is the other main output for this project. It is
a separate resource for owner-operators that highlights
successful business practices and the skills required to
improve business performance. It is recommended that an
online version of the toolkit be developed as the best way
to disseminate the information and promote its use.
THE DRAYAGE BUSINESS
Owner-Operator Essentials
» 1.1 Drayage Business Environment
» 1.2 Lifestyle
» 1.3 Business & Financial Considerations
» 1.4 Choosing a Company to Work For
» 1.5 What Companies Look For
MY TRUCK
Getting & Operating My Vehicle
» 2.1 Financing Options
» 2.2 Getting Bank Financing
» 2.3 New vs. Used
» 2.4 Importance Of Maintenance
» 2.5 Safety
» 2.6 Fuel Efficiency
» 2.7 Practical Terminal Information
MY BUSINESS
Managing My Business & Money
» 3.1 Budgeting & Bookkeeping
» 3.2 How Am I Doing?
» 3.3 How Can I Make More $$$?
» 3.4 Understanding My Costs
» 3.5 Financial Tools
GLOSSARY A – Z
The recommended structure of the toolkit is shown below.

APPENDICES

36 APPENDIX 1
APPENDIX 1 INTERVIEW QUESTION GUIDE
1. What is the nature of your business and who are
your key customers (import, export, transload, etc.)?
2. What services do you provide and what are
your customer requirements?
3. What is the typical work schedule?
4. What are the most critical factors impacting this
schedule (terminal issues, road congestion, reliability
of drivers, etc.)?
5. What is the proportion of company drivers to
owner-operators in your business?
» What factors determine this?
» What issues dictate the choice between
company drivers and owner-operators?
6. Are your drivers unionized? If so, what is the proportion
of unionized drivers in your business and to what unions
do they belong?
7. How does your dispatch system work and what does it
cost to operate?
» Are there any lessons in it for owner-operators?
8. What equipment do you need for your business
(tractors, chassis, hardware, software, communications,
GPS, etc.)?
9. How was this equipment financed and what does
it cost to purchase/lease?
10. What is the average age of your own tractor fleet?
» How many kilometres a year does your average
tractor operate: for drayage and for long-haul?
11. Is there a driver shortage in the Lower Mainland?
If so, what should be done to address it?
12. Do you currently have a driver training program?
» What are your needs in this area?
» What resources would be helpful to improve driver
training?
13. How are your drivers paid (own drivers versus
owner-operators)?
14. Are the Ready rates current with respect to
market conditions?
» What is the revenue split with owner-operators for
Ready rate moves?
» How do Ready rates vary from the non-regulated
drayage market?
15. What tools/resources would you find the most useful
to improve the performance of your business?
16. What are the key factors affecting your profitability,
both within and outside of your control?
17. Would you find value in having real-time information to
operate your business? What would be most valuable?
18. Regarding owner-operators:
» How do you select owner-operators?
» What qualities define a “good” operator?
» Is there a high turnover of owner-operators at your
business and in general? If so, why?
» What is the typical age of their tractors?
» What is a typical tractor utilization in kilometres
(or hours or other)?
» How suited are their tractors to container drayage,
and what are the issues?

37APPENDIX 1 INTERVIEW QUESTION GUIDE
» How knowledgeable are owner-operators about
their own trucking businesses?
What is their understanding of basic business principles?
What is their understanding of their operational
costs and bottom lines?
To what extent do they use accounting systems?
» What skills, tools, etc. would make owner-operators
more effective in their businesses?
» What kinds of real-time information would be valuable
to owner-operators, perhaps via an app on a mobile
phone (iPhone, Android, etc.) plus a website?
Examples could include:
Real-time updates on road information, congestion
and travel speeds (Google Traffic?)
Reports on congestion at marine container terminal gates
Daily market conditions
» To what degree do you think owner-operators
understand simple and complex business and general
concepts? How much does this vary by individual?
» What are some good ways to get new concepts and
information across to owner-operators about their
business and business practices? Visuals, stories,
workshops, examples, manuals, storyboards? Other?
19. Regarding trucking costs (main focus on owner-operators):
» How do you record, evaluate and use trucking costs
in business planning?
» Are there any lessons in this for owner-operators?
» What is the price of a new tractor appropriate for
Metro Vancouver drayage?
What are its specifications?
How long would you keep such a tractor and
what would be the resale price?
» What are some typical characteristics of
owner-operator tractors?
Age at acquisition and price
Appropriateness for Metro Vancouver drayage
Typical specifications
How long would an owner-operator keep such a
tractor and what would be the resale price?
» Regarding variable tractor operating costs in general,
what are unit costs (per kilometre) for:
Maintenance? (And how does this vary for new
and older tractors?)
Tires?
Fuel?
Driver (operating)?
Driver (waiting—should this be per hour?)?
How does one handle the cost of tractor waiting
time in general?
Driver time with fixed costs allocated per kilometre
and variable costs close to zero?
Should one differentiate between standard time
allowances at terminals and non-standard time,
such as gate queuing?
» Regarding fixed tractor costs:
Licensing: What is the annual cost of licensing
a tractor?
» Insurance (operating) cost:
What is the annual tractor insurance cost,
and is it strictly fixed?
» Administration (operating) costs:
What are the key administration items for an
owner-operator?
What level of annual administration costs would you
expect for an owner-operator? How does this vary
with annual tractor utilization?
» Tractor ownership costs:
What is best way to handle them for owner-operators?
Depreciation plus interest?
Loan payments plus a return on own capital (equity)?
Capital recovery (overall return to cover debt
and equity)?
Other?
Are there any other significant fixed costs? PMV TLS?
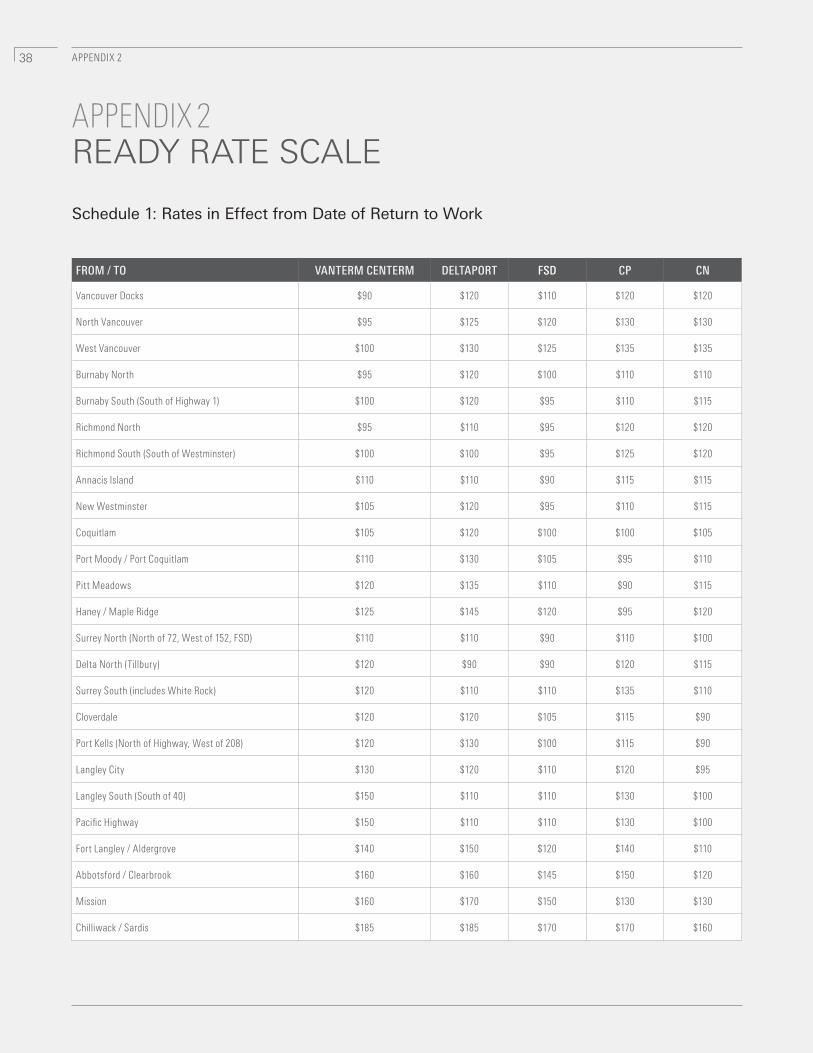
38 APPENDIX 2
APPENDIX 2 READY RATE SCALE
Schedule 1: Rates in Effect from Date of Return to Work
FROM / TO VANTERM CENTERM DELTAPORT FSD CP CN
Vancouver Docks $90 $120 $110 $120 $120
North Vancouver $95 $125 $120 $130 $130
West Vancouver $100 $130 $125 $135 $135
Burnaby North $95 $120 $100 $110 $110
Burnaby South (South of Highway 1) $100 $120 $95 $110 $115
Richmond North $95 $110 $95 $120 $120
Richmond South (South of Westminster) $100 $100 $95 $125 $120
Annacis Island $110 $110 $90 $115 $115
New Westminster $105 $120 $95 $110 $115
Coquitlam $105 $120 $100 $100 $105
Port Moody / Port Coquitlam $110 $130 $105 $95 $110
Pitt Meadows $120 $135 $110 $90 $115
Haney / Maple Ridge $125 $145 $120 $95 $120
Surrey North (North of 72, West of 152, FSD) $110 $110 $90 $110 $100
Delta North (Tillbury) $120 $90 $90 $120 $115
Surrey South (includes White Rock) $120 $110 $110 $135 $110
Cloverdale $120 $120 $105 $115 $90
Port Kells (North of Highway, West of 208) $120 $130 $100 $115 $90
Langley City $130 $120 $110 $120 $95
Langley South (South of 40) $150 $110 $110 $130 $100
Pacific Highway $150 $110 $110 $130 $100
Fort Langley / Aldergrove $140 $150 $120 $140 $110
Abbotsford / Clearbrook $160 $160 $145 $150 $120
Mission $160 $170 $150 $130 $130
Chilliwack / Sardis $185 $185 $170 $170 $160

39APPENDIX 2 READY RATE SCALE
Schedule 2: Rates in Effect from August 1, 2006
FROM / TO VANTERM CENTERM DELTAPORT FSD CP CN
Vancouver Docks $100 $135 $120 $135 $135
North Vancouver $105 $140 $135 $145 $145
West Vancouver $110 $145 $140 $150 $150
Burnaby North $105 $135 $110 $120 $120
Burnaby South (South of Highway 1) $110 $135 $105 $120 $130
Richmond North $105 $120 $105 $135 $135
Richmond South (South of Westminster) $110 $110 $105 $140 $135
Annacis Island $120 $120 $100 $130 $130
New Westminster $115 $135 $105 $120 $130
Coquitlam $115 $135 $110 $110 $115
Port Moody / Port Coquitlam $120 $145 $115 $105 $120
Pitt Meadows $135 $150 $120 $100 $130
Haney / Maple Ridge $140 $160 $135 $105 $135
Surrey North (North of 72, West of 152, FSD) $120 $120 $100 $120 $110
Delta North (Tillbury) $135 $100 $100 $135 $130
Surrey South (includes White Rock) $135 $120 $120 $150 $120
Cloverdale $135 $135 $115 $130 $100
Port Kells (North of Highway, West of 208) $135 $145 $110 $130 $100
Langley City $145 $135 $120 $135 $105
Langley South (South of 40) $165 $120 $120 $145 $110
Pacific Highway $165 $120 $120 $145 $110
Fort Langley / Aldergrove $155 $165 $135 $155 $120
Abbotsford / Clearbrook $175 $175 $160 $165 $135
Mission $175 $185 $165 $145 $145
Chilliwack / Sardis $200 $200 $185 $185 $175
40 APPENDIX 2 READY RATE SCALE
DO THE READY RATES AFFECT MARKET RATES? — This question is difficult to determine; general anecdotal evidence includes:
» A trucking company with about 60 non-union owner-operator tractors pays for container movements according to the
Ready MOA. The company also pays drivers an additional amount to compensate for their time handling empty chassis
moves. The compensation for this additional work is based on mileage at a predetermined scale.
For example:
For a five-kilometres repositioning move, the driver would receive $75.
For a 20-kilometre repositioning move, the driver would receive $85.
» An operator of a major import distribution centre that operates an in-house drayage company to serve its clients pays
its owner-operators based on the MOA plus a percentage of the Ready rates if an empty chassis move is involved.
» One company stated that it pays its owner-operators for container moves based on the MOA and must do so because
of audits. This company has adjusted the rates it pays for inflation but only at some 2% a year. If there is a mix-up at
a marine terminal that results in an unavailable container, this company will pay owner-operators, typically at 50% of
the Ready rate. The company pays 100% of the Ready rate for certain kinds of delays or lack of container availability.
» Unionized owner-operators mentioned that some non-unionized owner-operators undercut the Ready rates. They also
mentioned that “cash back” refunds occur. These involve owner-operators invoicing trucking companies at the Ready
rates to support audits, after which—following payment of invoices—the non-unionized owner-operator rebates in
cash a portion of the amount paid, resulting in a rate that is effectively below the Ready rate.

41
APPENDIX 3 PRO FORMA FINANCIAL MODEL INPUTS
APPENDIX 3
The pro forma model input worksheet has several
sections, as follows:
Average Utilization and SpeedThis is an input value with the default 40 kilometres
per hour.
Selection of Input CostsThe user can:
» Input his own value for driver compensation
and payroll burden.
» Choose between model defaults for fuel cost or enter his
own values for miles per gallon and fuel price per litre.
» Choose between model defaults for repair and
maintenance costs or enter his own value per kilometre.
» Choose between model defaults for administration
costs or enter his own value per year.
Selection of Financial ParametersThe user can enter:
» Tractor financial parameters
» Other capital expenditures, such as a computer
and tools
» Start-up year
» Income tax rate
» Working capital parameters
» Capital contributions to the business
» Loan interest rate and term
The components of the model and key assumptions
are outlined below.
Working Capital AssumptionsWorking capital is the difference between current assets
and current liabilities. The principal current assets are cash
or cash equivalents and accounts receivable. Accounts
receivable are amounts owed for services performed and
invoiced but not yet paid.
Discussions with owner-operators indicate that they are
paid several weeks after they make a container drayage
move; a value of 45 days was used for accounts receivable.
The principal current liability is accounts payable. These are
for items that have been purchased but not yet paid for. An
example is a tank of fuel bought on a credit card and paid
for as part of the credit card payment. Invoices for goods
and services often have payment terms of 30 days; a value
of 30 days was used to calculate accounts payable in the
pro forma model. Driver “wages” were not included in
accounts payable; it was assumed that owner-operators
draw “wages” throughout each month.
A loan with an interest rate of 6% and a term of five years
was assumed. This would be typical of a small business
loan secured by an asset such as a house. Some owner-
operators reported difficulty in securing line-of-credit loans
because they could not demonstrate adequate proof of
income.
Selection of Trip Characteristics & RevenueThe next section deals with trip characteristics, revenue
and related calculations. The trucking distances per
trip were generalized from discussions with trucking
companies and owner-operators. They can be modified
to reflect the outlook of each individual owner-operator
and the contract terms he has with a trucking company.
The travel time per trip is calculated at the average speed
above. The calculated annual truck utilization in kilometres
42 APPENDIX 3 PRO FORMA FINANCIAL MODEL INPUTS
is calculated based on the average trip distance, the
number of working days in a year, and the number of
trips per day (see below).
Three categories of truck waiting time are listed: waiting
at a pick-up terminal (0.5 hours assumed for a typical
off-dock terminal); waiting at a marine container terminal
to discharge a container (1.0 hour as typical at PMV
terminals); and an allowance for other queuing, which
might be at a container terminal gate or a road congestion
point. The total waiting time is the sum of these; the total
time per trip is the sum of travel and waiting time.
The basis for revenue is the number of working days per
year, the number of paid trips per day and the average
payment per trip. This version of the model assumes 250
working days a year (day-shift weekdays only, less 10 days’
holiday time) and three trips a day at $150 per trip. These
figures were generalized from discussions with owner-
operators, who reported that given the congestion at
container gates today, they typically make three trips a
day and their daily revenue is $450.
The calculated annual times are next. The total working
time of 2,625 hours that results is reasonable; working
time generally should be around 2,000 hours a year for
the owner of a small business such as owner-operator
trucking.
Escalation RatesThe final subsection deals with the escalation of revenue
and costs to allow for price increases over time. The base
year for escalation is 2013 (i.e., the first year of escalation
is 2014). Three cost categories are listed: general (consumer
price index inflation), which is used when there is no
particular escalation rate to use; and tires and fuel, both
of which have increased at rates in excess of inflation
and are likely to continue to do so in future.
In the case of revenue, the model is set up to input one set
of values for all years in Column C and escalates them over
the evaluation period. It is also possible to override the
input values for each year, such as the revenue per trip.
Only one approach should be used.
For example:
» If an owner-operator has a long-term contact with a
trucking company that specifies the rate per trip by year,
the rates should be entered manually in the line “Revenue
per Trip” and revenue escalation should be set to zero.
» If the rate per trip is known for the current year and the
market seems that it will allow revenue escalation over
the next five years, the rate should be left constant in the
line “Revenue per Trip” and revenue escalation set at a
rate that reflects the prospects. The escalation rate could
be less or greater than general inflation.
In this example, the rate per trip is left constant for each
year and the revenue escalation rate of 2.0% a year is
applied over the five-year projection period.
43APPENDIX 3 PRO FORMA FINANCIAL MODEL INPUTS
Profit and Loss Statement AssumptionsThe structure of the operating costs is similar to that of
the trip cost model but there are some differences.
The costs are built up as follows:
» All variable cost items except driver waiting time are
calculated on a per-kilometre basis. The annual cost is
the rate per kilometre multiplied by the annual tractor
kilometres.
» The cost of driver operating time is calculated as annual
operating time multiplied by the hourly rate input by the
user plus a 15% burden. The cost of driver waiting time is
calculated as annual waiting time multiplied by the same
hourly rate.
» Driver operating and waiting times are treated in the pro
forma model as expenses, which would be the case if
the owner-operator withdrew these salary-like amounts
each month. The owner-operator could also make
periodic draws through the year and sort out the
allocation of these draws to driver time and other items
at the end of the year. Inserting these items as costs in
the pro forma model provides a better overall picture of
the tractor business.
» Depreciation is calculated on a straight-line basis as
(tractor cost minus residual value, if any) divided by
life and other capital expenditures divided by life.
Note that depreciation remains constant in spite of
inflation because it is based on the historical cost of
assets and their lives.
» Interest is calculated as the average loan balance
in a year multiplied by the interest rate.
» Licenses, insurance and administration are treated
as fixed annual costs.
» Income taxes are calculated at the 13.5% rate applicable
to small incorporated businesses in 2012 and probably
in subsequent years. On the assumption that this is an
incorporated business, taxes apply only if profit before
taxes is positive; otherwise taxes are zero. Losses can
be carried forward to write off against future profits, but
this provision is not built into the pro forma model. If the
owner-operator business is not going to be profitable, it
may be better to operate it as an unincorporated business
to allow write-off of losses against other personal
income. The main taxation benefit of an incorporated
small business is the ability to retain profits in the
company at a modest tax rate and to engage in income
splitting (over time for the owner-operator and perhaps
among members of his family).
The bottom line is profit after tax. This flows to the cash
flow statement.
Strictly speaking, the straight-line depreciation used in
the pro forma model for tax calculations should be replaced
by declining-balance depreciation under the Capital Cost
Allowance (CCA) rates and rules specified by Canada
Revenue Agency (CRA). While the CCA amounts specified
by CRA result in more rapid asset write-offs, the impacts
on this simple and short-term pro forma evaluation will
be minor.
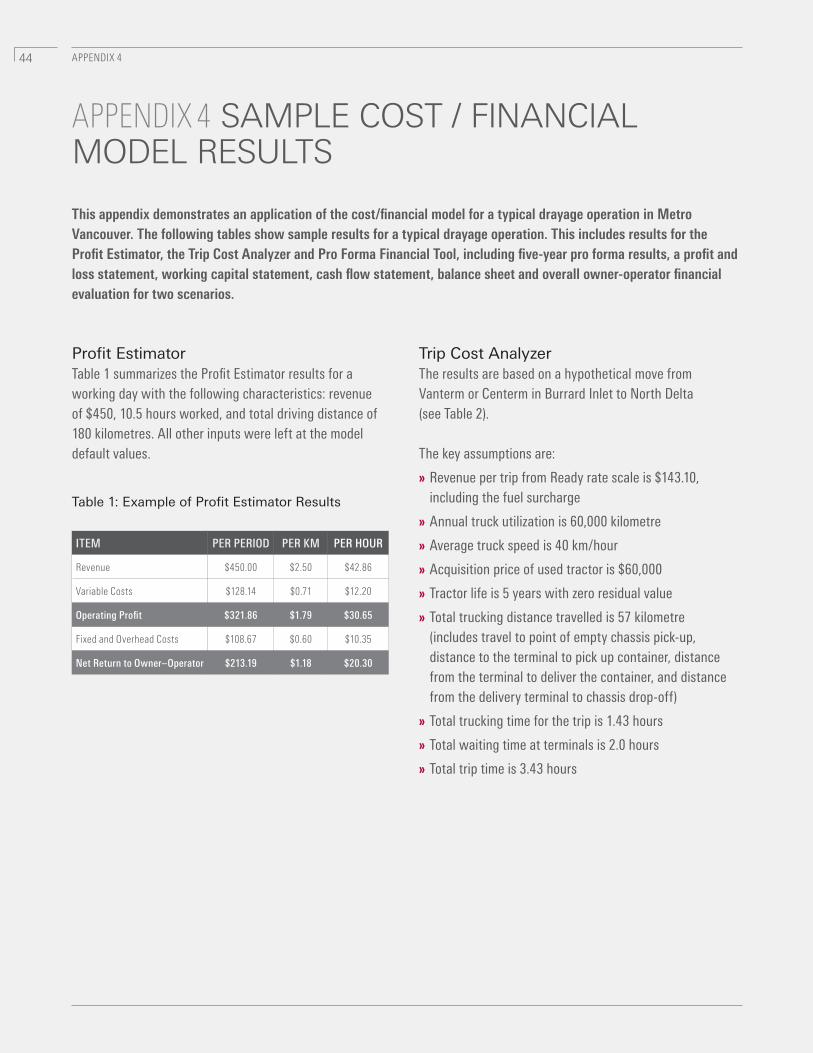
44 APPENDIX 4
APPENDIX 4 SAMPLE COST / FINANCIAL MODEL RESULTS
This appendix demonstrates an application of the cost/financial model for a typical drayage operation in Metro
Vancouver. The following tables show sample results for a typical drayage operation. This includes results for the
Profit Estimator, the Trip Cost Analyzer and Pro Forma Financial Tool, including five-year pro forma results, a profit and
loss statement, working capital statement, cash flow statement, balance sheet and overall owner-operator financial
evaluation for two scenarios.
ITEM PER PERIOD PER KM PER HOUR
Revenue $450.00 $2.50 $42.86
Variable Costs $128.14 $0.71 $12.20
Operating Profit $321.86 $1.79 $30.65
Fixed and Overhead Costs $108.67 $0.60 $10.35
Net Return to Owner–Operator $213.19 $1.18 $20.30
Table 1: Example of Profit Estimator Results
Profit EstimatorTable 1 summarizes the Profit Estimator results for a
working day with the following characteristics: revenue
of $450, 10.5 hours worked, and total driving distance of
180 kilometres. All other inputs were left at the model
default values.
Trip Cost AnalyzerThe results are based on a hypothetical move from
Vanterm or Centerm in Burrard Inlet to North Delta
(see Table 2).
The key assumptions are:
» Revenue per trip from Ready rate scale is $143.10,
including the fuel surcharge
» Annual truck utilization is 60,000 kilometre
» Average truck speed is 40 km/hour
» Acquisition price of used tractor is $60,000
» Tractor life is 5 years with zero residual value
» Total trucking distance travelled is 57 kilometre
(includes travel to point of empty chassis pick-up,
distance to the terminal to pick up container, distance
from the terminal to deliver the container, and distance
from the delivery terminal to chassis drop-off)
» Total trucking time for the trip is 1.43 hours
» Total waiting time at terminals is 2.0 hours
» Total trip time is 3.43 hours

45APPENDIX 4 SAMPLE COST / FINANCIAL MODEL RESULTS
USER INPUTS
Average Annual Truck Utilization (km) 60,000 Revenue Assumptions (user input) *Based on Ready Rates
Average Truck Speed (km/h) 40 Pick Up Terminal: Vanterm/Centerm
Tractor Financial Parameters Delivery Terminal: Delta North, Tilbury
New or Used Used
Acquisition Price of Tractor $60,000
Life (years) 5
Resale Value (% of Acquisition Price) 0
Trucking Distances (km)
To Point of Empty Chassis Pickup
To Terminal to Pick Up Container 20
From Pick-Up Terminal to Delivery Terminal 27
From Delivery Terminal to Chassis Drop-Off 10
Total Trucking Distance 57
Calculated Travel Time (Hours) 1.43
Truck Waiting Times (Hours)
At Pickup Terminal 0.50
At Delivery Terminal 1.00
Other Queuing 0.50
Total Waiting Time 2.00
Total Time (Hours) 3.43
Revenue (A) 143.10 2.51 41.78
Truck Costs Per Trip Per Km Per Hour
Variable Costs
Fuel 31.22 0.55 9.12
Repairs & Maintenance 6.92 0.12 2.02
Miscellaneous 0.85 0.01 0.25
Tires 1.58 0.03 0.46
Total Variable Costs (B) $40.58 $0.71 $11.85
Fixed Tractor Costs
Capital Recovery Charges (Ownership) $15.04 $0.26 $4.39
Licenses 2.27 0.04 0.66
Total Tractor Fixed Costs $17.31 $0.30 $5.05
Overhead Costs
Insurance $7.60 $0.13 $2.22
Administration $9.50 0.17 2.77
Total Overhead Costs $17.10 $0.30 $4.99
Total Fixed and Overhead Costs (C) $34.41 $0.60 $10.05
Total Trip Costs (Variable + Fixed) $92.30 $1.61 $21.89
Net Return to Owner-Operator (A-B-C) $68.11 $1.19 $19.89
Table 2: Example of Trip Cost Analyzer Results*
* Note that these results are for a single trip with low productivity. Depending on the number of double-ended revenue generating moves the owner-operator is able to achieve,
the returns for a longer period (such as a day/week/month) would be greater than shown above.

46 APPENDIX 4 SAMPLE COST / FINANCIAL MODEL RESULTS
Pro Forma Cost ModelThis model builds on the trip cost model, adding a pro
forma financial evaluation of an owner-operator drayage
trucking business. All models were developed in one Excel
file so they could share input costs; revisions to costs can
be made within one file. A pro forma financial model
projects the financial statements of a business over a
period of time. The model has three principal financial
statements:
» The Profit and Loss (P&L) or Income Statement
compares revenue and expenses to arrive at profit
before and after tax.
» The Cash Flow Statement shows operating cash
generated by the business and takes into consideation
the acquisition of assets (such as a tractor), how the
business is financed, and the net addition/reduction to
cash at the end of the year.
» The Balance Sheet provides a financial snapshot of
the status of the business at the end of each year.
The pro forma model addresses the most common questions
of potential owner-operators looking to enter the business,
such as:
» How much equity capital do I need?
» How much money can I borrow, and can I repay it?
» How much do I get out of the business?
» What will the position of the business be in five years?
» Do I really want to do this?
Model Inputs
The full input page to the pro forma model is described
in Appendix 3. The following comments deal with the
specifics of this illustrative case. The inputs for fuel
and other costs are all at the default model values.
Table 3 summarizes the inputs discussed below.
The average speed (40 kilometres/hour) remains. It is
used to calculate driving time from annual distance driven.
The tractor financial parameters remain, but they are
used to calculate tractor depreciation rather than capital
recovery and to provide inputs to the cash flow statement
and balance sheet. There is also an allowance for other
capital expenditures, such as office equipment (telephones,
computers, software, etc.) and tools. In the pro forma
model, annual utilization is calculated from the assumptions
regarding annual trip activity.
The start-up year is stated as 2013, which affects the
column headings in the model. A corporate tax rate of
13.5% is specified. This is the small business tax rate in
British Columbia in 2012 (and likely in future years) for
taxable business incomes under $500,000. Revenue is
assumed to be $150/trip, which generally reflects the
Ready rate for the average trip characteristics in the model.
Annual revenue is based on three trips a day, 250 days a
year, consistent with industry practices. In the pro forma
model, owner-operators are assumed to earn $450 per day
and average gross revenue of $112,500 a year. Additional
assumptions used in the model are discussed in Appendix 3.

47APPENDIX 4 SAMPLE COST / FINANCIAL MODEL RESULTS
GENERAL INPUTSAverage Truck Speed (km/h) 40
Tractor Financial Parameters Driver Compensation and Payroll Cost
New or Used Used Driver Wage ($/hr) $25.00
Acquisition Price of Tractor $60,000 Non-Voluntary Wage Burden (%) 15%
Life (years) 5 Driver Payroll Cost ($/hr) $28.75
Resale Value (% of Acquisition Price) 0
Other Capital Expenditures
Office Equipment and Tools $5,000
Life (years) 5
Start-Up Year 2013
Corporate Income Tax 13.5%
Working Capital Parameters (Days)
Accounts Receivable 45
Accounts Payable 30
Loan
Interest Rate 6%
Term (Years) 5
TRIP CHARACTERISTICS AND REVENUES
Trucking Distances per Trip (km) 2013 2014 2015 2016 2017
To Point of Empty Chassis Pickup
To Terminal to Pick Up Container 20 20 20 20 20
From Pick-Up Terminal to Delivery Terminal 30 30 30 30 30
From Delivery Terminal to Chassis Drop-Off 10 10 10 10 10
Total Trucking Distance 60 60 60 60 60
Calculated Annual Utilization (km) 45,000 45,000 45,000 45,000 45,000
Calculated Travel Time (Hours) 1.50 1.50 1.50 1.50 1.50
Truck Waiting Times (Hours)
At Pickup Terminal 0.50 0.50 0.50 0.50 0.50
At Delivery Terminal 1.00 1.00 1.00 1.00 1.00
Other Queuing 0.50 0.50 0.50 0.50 0.50
Total Waiting Time 2.00 2.00 2.00 2.00 2.00
Total Time per Trip (Hours) 3.50 3.50 3.50 3.50 3.50
Revenue Basis
Working Days per year 250 250 250 250 250
Daily Number of Trips 3 3 3 3 3
Revenue per Trip $150 $150 $150 $150 $150
Calculated Annual Times (Hours)
Travel Time 1,125 1,125 1,125 1,125 1,125
Waiting Time 1,500 1,500 1,500 1,500 1,500
Total Time 2,625 2,625 2,625 2,625 2,625
Escalation Rates (% / Annum)
Revenue 2.0%
Operating Cost Indices
General (CPI) 2.0%
Fuel 3.0%
Tires 3.0%
Table 3: Pro Forma Financial Model Inputs

48 APPENDIX 4 SAMPLE COST / FINANCIAL MODEL RESULTS
Profit and LossThe P&L Statement begins with revenue. Although there is provision for other revenue, only drayage is shown. As with all
items, the value for 2013 is not escalated; the first escalated year is 2014. Table 4 presents the P&L statement. The bottom
line is profit after tax that flows to the cash flow statement.
ITEM 2013 2014 2015 2016 2017
Revenue
Drayage $112,500 $114,750 $117,045 $119,386 $121,774
Other
Total $112,500 $114,750 $117,045 $119,386 $121,774
COSTS
Variable Costs
Driver Operating Time $32,344 $32,991 $33,650 $34,323 $35,010
Driver Waiting Time 43,125 43,988 44,867 45,765 46,680
Fuel 24,648 25,387 26,149 26,933 27,741
Repairs and maintenance 5,466 5,575 5,687 5,800 5,916
Miscellaneous 670 684 698 712 726
Tires 1,251 1,289 1,327 1,367 1,408
Total Variable Costs $107,504 $109,913 $112,378 $114,900 $117,482
Fixed Tractor Costs
Depreciation $13,000 $13,000 $13,000 $13,000 $13,000
Interest 2,430 1,890 1,350 810 270
Licenses 2,394 2,442 2,491 2,541 2,592
TOTAL TRACTOR FIXED COSTS $17,824 $17,332 $16,841 $16,351 $15,862
Overhead Costs
Insurance $8,000 $8,160 $8,323 $8,490 $8,659
Administration 10,000 10,200 10,404 10,612 10,824
TOTAL OVERHEAD COSTS $18,000 $18,360 $18,727 $19,102 $19,484
TOTAL COSTS $143,328 $145,605 $147,946 $150,353 $152,827
PROFIT BEFORE TAX -$30,828 -$30,855 -$30,901 -$30,967 -$31,053
- TAXES $0 $0 $0 $0 $0
PROFIT AFTER TAX -$30,828 -$30,855 -$30,901 -$30,967 -$31,053
Table 4: Pro Forma Profit and Loss Statement

49APPENDIX 4 SAMPLE COST / FINANCIAL MODEL RESULTS
Working CapitalThe Working Capital section shows the calculation of accounts receivable and accounts payable to estimate net working
capital other than cash. In general, net working capital increases slowly in line with inflation. If the volume of activity
(such as working hours per year or trips per day) increases, working capital also rises.
Accounts payable are calculated from out-of-pocket costs such as fuel, maintenance and insurance. They exclude
depreciation (because these are non-cash items) and interest (because there are scheduled payments). Owner-operator
compensation, i.e., driver time pay, is also excluded on the basis that the owner-operator draws the amount within the
month in which it is earned. Accounts receivable and accounts payable appear in the balance sheet. Net working capital
appears in the cash flow statement. Table 5 summarizes the calculation of non-cash working capital.
Cash Flow StatementThe Cash Flow Statement shows how funds flow through the business. It has three components:
» Cash flow from operations. This section of the statement measures the cash flow generated by the business in each year.
It begins with income after tax, adds back depreciation because depreciation is a non-cash expense, and deducts non-cash
working capital (current assets minus current liabilities). As the name implies, it begins only after operations start.
» Investment activity. In this case, investments in 2012 include a used tractor, office equipment and tools. Were the
business expanding, there would likely be more asset acquisitions over the evaluation period.
» Funding activity. This section lists the sources of funding for the business. These include an equity contribution by the
owner-operator and a loan draw. The loan amount was calculated as 70% of tractor capital expenditure. In order to
get such a loan, the owner-operator would probably have to pledge assets such as an interest in a house and either
demonstrate income from other sources or provide a good business plan. The amount of funding not only has to cover
the investment activity in 2012, it also has to provide an opening cash balance that allows projected cash balances to
remain positive as non-cash working capital builds up over time. The section also lists loan repayments and dividends
(the latter are shown as zero in this case because there is no profit).
ITEM 2012 2013 2014 2015 2016 2017
Non-Cash Working Capital
Accounts Receivable – $13,870 $14,147 $14,430 $14,719 $15,013
Accounts Payable – 4,309 4,417 4,527 4,640 4,756
Net Non-Cash Working Capital – $9,561 $9,731 $9,903 $10,079 $10,257
Changes in Non-Cash Working Capital – $9,561 $170 $173 $175 $178
Table 5: Pro Forma Calculation of Working Capital

50 APPENDIX 4 SAMPLE COST / FINANCIAL MODEL RESULTS
ITEM 2012 2013 2014 2015 2016 2017
Cash Flow from Operations
Income after Tax – -$30,828 -$30,855 -$30,901 -$30,967 -$31,053
Depreciation – 13,000 13,000 13,000 13,000 13,000
Change in Net Non-Cash Working Capital – 9,561 170 173 175 178
Operations Cash Flow – -$27,389 $18,025 $18,074 $18,143 $18,232
Investment Activity
Tractor $60,000 – – – – –
Office Equipment and Tools 5,000 – – – – –
Net Investment Activity $65,000 $0 $0 $0 $0 $0
Funding Activity
Equity Contributions $30,000 – – – – –
Loan Draws 45,000 – – – – –
Loan Repayments – 9,000 9,000 9,000 9,000 9,000
Dividends – – – – – –
Net Funding Activity $75,000 -$9,000 -$9,000 -$9,000 -$9,000 -$9,000
NET CASH FLOW $10,000 -$36,389 -$27,025 -$27,074 -$27,143 -$27,232
Table 6: Pro Forma Cash Flow Statement
The net of the three above items is net cash flow. This flows to the Cash and Cash Equivalents account of the balance sheet.
Table 6 presents the Cash Flow Statement.

51APPENDIX 4 SAMPLE COST / FINANCIAL MODEL RESULTS
Balance SheetThe Balance Sheet provides a snapshot of the business’s financial position at the end of each year (see Table 7). At start-up
in 2012, the company has $10,000 in cash and $65,000 in fixed assets. It also has owner-operator equity of $30,000 and a
loan of $45,000. The sections of the balance sheet are:
» Current assets. These are cash (and cash equivalents) and accounts receivable.
» Fixed assets. These begin with fixed assets at cost and subtract accumulated depreciation to arrive at net fixed assets.
» Current liabilities. Only accounts payable are shown.
» Equity. This is the value of the company to the owner-operator. It consists of initial equity plus retained earnings.
The company at the end of five years has equity of -$125,000, down from the initial $30,000. If the owner-operator were to
wind up the company at this point, he would lose money. The tractor and other fixed assets are assumed to have essentially
no residual value.
ITEM 2012 2013 2014 2015 2016 2017
Current Assets
Cash and Cash Equivalents $10,000 -$26,389 -$53,414 -$80,488 -$107,631 -$134,862
Accounts Receivable – 13,870 14,147 14,430 14,719 15,013
Total Current Assets $10,000 -$12,519 -$39,267 -$66,058 -$92,912 -$119,849
Fixed Assets at Cost
Truck $60,000 $60,000 $60,000 $60,000 $60,000 $60,000
Office Equipment 5,000 5,000 5,000 5,000 5,000 5,000
Total Fixed Assets $65,000 $65,000 $65,000 $65,000 $65,000 $65,000
Less Accumulated Depreciation – $13,000 $26,000 $39,000 $52,000 $65,000
Net Fixed Assets $65,000 $52,000 $39,000 $26,000 $13,000 $0
TOTAL ASSETS $75,000 $39,481 -$267 -$40,058 -$79,912 -$119,849
Liabilities
Current Liabilities – – – – – –
Accounts Payable – $4,309 $4,417 $4,527 $4,640 $4,756
Loans $45,000 $36,000 $27,000 $18,000 $9,000 $0
Equity – – – – – –
Contributed Equity $30,000 $30,000 $30,000 $30,000 $30,000 $30,000
Retained Earnings – -30,828 -61,684 -92,585 -123,552 -154,605
Total Equity $30,000 -$828 -$31,684 -$62,585 -$93,552 -$124,605
TOTAL LIABILITIES $75,000 $39,481 -$267 -$40,058 -$79,912 -$119,849
Table 7: Pro Forma Financial Model Balance Sheet

52
Financial RatiosThe simple financial ratios in Table 8 illustrate: 1) the liquidity of the owner-operator business as a measure of its ability
to withstand financial shocks; and 2) debt service to illustrate its ability to meet loan obligations. The ratios are:
Liquidity
» Current Ratio (current assets/current liabilities)
» Acid Ratio (cash/current liabilities)
Debt service coverage
» Times interest covered (income before tax plus interest/interest)
» Times loan payments covered (cash flow from operations/loan payments)
APPENDIX 4 SAMPLE COST / FINANCIAL MODEL RESULTS
ITEM 2012 2013 2014 2015 2016 2017
Liquidity
Current Ratio – -2.91 -8.89 -14.59 -20.02 -25.20
Acid Ratio – -6.12 -12.09 -17.78 -23.20 -28.36
Debt Service Coverage
Times Interest Covered (By Income) – -11.69 -15.33 -21.89 -37.23 -114.01
Times Payments Covered (By Cash Flow) – -3.04 -2.00 -2.01 -2.02 -2.03
Table 8: Financial Ratios
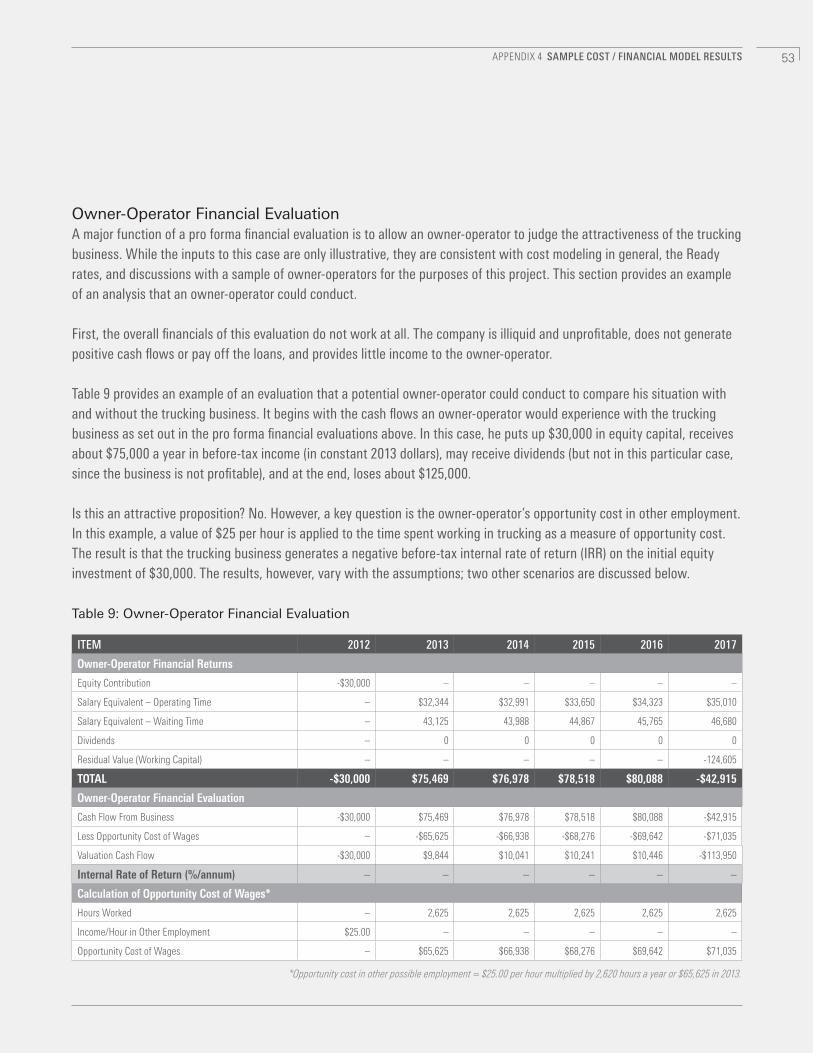
53
Owner-Operator Financial EvaluationA major function of a pro forma financial evaluation is to allow an owner-operator to judge the attractiveness of the trucking
business. While the inputs to this case are only illustrative, they are consistent with cost modeling in general, the Ready
rates, and discussions with a sample of owner-operators for the purposes of this project. This section provides an example
of an analysis that an owner-operator could conduct.
First, the overall financials of this evaluation do not work at all. The company is illiquid and unprofitable, does not generate
positive cash flows or pay off the loans, and provides little income to the owner-operator.
Table 9 provides an example of an evaluation that a potential owner-operator could conduct to compare his situation with
and without the trucking business. It begins with the cash flows an owner-operator would experience with the trucking
business as set out in the pro forma financial evaluations above. In this case, he puts up $30,000 in equity capital, receives
about $75,000 a year in before-tax income (in constant 2013 dollars), may receive dividends (but not in this particular case,
since the business is not profitable), and at the end, loses about $125,000.
Is this an attractive proposition? No. However, a key question is the owner-operator’s opportunity cost in other employment.
In this example, a value of $25 per hour is applied to the time spent working in trucking as a measure of opportunity cost.
The result is that the trucking business generates a negative before-tax internal rate of return (IRR) on the initial equity
investment of $30,000. The results, however, vary with the assumptions; two other scenarios are discussed below.
APPENDIX 4 SAMPLE COST / FINANCIAL MODEL RESULTS
ITEM 2012 2013 2014 2015 2016 2017
Owner-Operator Financial Returns
Equity Contribution -$30,000 – – – – –
Salary Equivalent – Operating Time – $32,344 $32,991 $33,650 $34,323 $35,010
Salary Equivalent – Waiting Time – 43,125 43,988 44,867 45,765 46,680
Dividends – 0 0 0 0 0
Residual Value (Working Capital) – – – – – -124,605
TOTAL -$30,000 $75,469 $76,978 $78,518 $80,088 -$42,915
Owner-Operator Financial Evaluation
Cash Flow From Business -$30,000 $75,469 $76,978 $78,518 $80,088 -$42,915
Less Opportunity Cost of Wages – -$65,625 -$66,938 -$68,276 -$69,642 -$71,035
Valuation Cash Flow -$30,000 $9,844 $10,041 $10,241 $10,446 -$113,950
Internal Rate of Return (%/annum) – – – – – –
Calculation of Opportunity Cost of Wages*
Hours Worked – 2,625 2,625 2,625 2,625 2,625
Income/Hour in Other Employment $25.00 – – – – –
Opportunity Cost of Wages – $65,625 $66,938 $68,276 $69,642 $71,035
Table 9: Owner-Operator Financial Evaluation
*Opportunity cost in other possible employment = $25.00 per hour multiplied by 2,620 hours a year or $65,625 in 2013.

54 APPENDIX 4 SAMPLE COST / FINANCIAL MODEL RESULTS
Scenario 1:Lower Driver Compensation FactorDriver compensation was reduced to $15 per hour from
$25 per hour (plus burdens in each). There is some evidence
to suggest that driver wages can be as low as $15 per hour.
When this lower rate is used, the model results indicate
(financial statements not shown):
» The business is marginally profitable from 2015; cash
flow is adequate to repay the loan; and the cash item of
the balance sheet remains positive.
» The $15 per hour is much too low a compensation level
for an owner-operator who is following best practices.
There may, however, be owner-operators who will accept
such low compensation either because they have few
other employment options or they do not understand
their business.
Scenario 2:Higher Revenue LevelRevenue per move was increased until the business
became profitable and just met cash flow needs. Table 10
summarizes this case. Its parameters and results are:
» Required revenue is $190 per move.
» The owner-operator business becomes profitable in 2015.
» There is sufficient cash flow to meet loan repayments.
» There is almost enough initial cash to meet working
capital needs (it is slightly negative in 2013).
» If the owner-operator terminates the business at the end
of five years, he contributes $30,000 to the business at
the start, receives compensation of $25 per hour plus
payroll burdens over five years, and receives a residual
value of about $30,000.
» The owner-operator should be able to achieve business
continuity. At the end of five years, the residual value
of the business could provide a contribution to the
acquisition of another tractor to continue the business.
This case shows that the revenue per move required for
an owner-operator business that has marginally acceptable
financials and provides adequate compensation to the
owner-operator exceeds the revenues earned based on
the Ready rates.
Other Possible Scenarios Several other scenarios are possible and realistic for
owner-operators who achieve best practices. Although
not evaluated in detail as part of this report, they generally
involve higher tractor productivity—that is, more time
spent on revenue-generating moves and less on unpaid
moves and waiting at terminal gates.

55APPENDIX 4 SAMPLE COST / FINANCIAL MODEL RESULTS
FINANCIAL RESULTS 2012 2013 2014 2015 2016 2017
Profit and Loss
Revenue – $142,500 $145,350 $148,257 $151,222 $154,247
Costs
Variable Costs – $107,504 $109,913 $112,378 $114,900 $117,482
Fixed Costs – 17,824 17,332 16,841 16,351 15,862
Overhead Costs – 18,000 18,360 18,727 19,102 19,484
Total Costs – $143,328 $145,605 $147,946 $150,353 $152,827
Profit before Tax – -$828 -$255 $311 $869 $1,420
- Taxes – 0 0 42 117 192
Profit after Tax – -$828 -$255 $269 $752 $1,228
Balance Sheet
Assets
Current Assets $10,000 $17,481 $21,333 $25,712 $30,577 $35,921
Net Fixed Assets 65,000 52,000 39,000 26,000 13,000 0
Total Assets $75,000 $69,481 $60,333 $51,712 $43,577 $35,921
Liabilities
Accounts Payable – $4,309 $4,417 $4,527 $4,640 $4,756
Loans 45,000 36,000 27,000 18,000 9,000 $0
Contributed Equity 30,000 30,000 30,000 30,000 30,000 30,000
Retained Earnings – -828 -1,084 -815 -63 1,165
Total Liabilities $75,000 $69,481 $60,333 $51,712 $43,577 $35,921
Owner-Operator Evaluation
Owner-Operator Returns
Equity Contribution -$30,000 – – – – –
Salary Equivalent – $75,469 $76,978 $78,518 $80,088 $81,690
Residual Value 31,165
TOTAL -30,000 $75,469 $76,978 $78,518 $80,088 $112,855
Table 10: Owner-Operator Financial Evaluation (Higher Revenue Level)
Understanding Container Drayage Owner-Operators in Metro Vancouver
—
Summary Report
—
Prepared by Asia Pacific Gateway Skills Table
© July 2013
#407, 55 Water Street Vancouver, British Columbia V6B 1A1
—
O: 604.684.1471
—
www.apgst.ca www.hrwire.ca