Pore Pressure Prediction.indd
17
ABSTRACT Rapid burial and high rates of sedimentation in the Malay Basin has lead to development of overpressure by disequilibrium compaction. Overpressure developed by this process can be quantified using industry-standard techniques that rely on porosity/effective stress relationships. However, where thermally-driven secondary processes create overpressure, porosity-based analysis that uses sonic (or seismically-derived velocity data) and resistivity data as a measure of porosity change underestimate overpressure. These processes will be active in relatively shallowly-buried shales in basins with high geothermal gradient such as the Malay Basin. Using comparative datasets from several regions where secondary overpressure generation are present (Gulf of Mexico; Halten Terrace, Mid- Norway and the Malay Basin), we discuss such secondary mechanisms and their quantification by integrating velocity vs. density cross-plots with understanding of basin history. Analysis of velocity vs. density relationships is a powerful tool to help discriminate overpressure generating processes and using this technique and log data from the Malay Basin, we identify load transfer (where rock compressibility is affected) as present, in addition to unloading and cementation effects documented by previous authors. Overpressure generated by load transfer may only be partially detected by fluid expansion-based relationships such as Bowers (1994), leading to inaccurate pre-drill pressure predictions. The identification of load transfer (and cementation) processes and their quantification is vital to accurate prediction of pore pressure in hydrocarbon-charged reservoirs in the Malay and other basins worldwide INTRODUCTION The Malay Basin is a Tertiary trans-tensional rift basin, offshore peninsular Malaysia. In this basin, both gas-rich and mixed oil/gas zones are present. Over 12km of fine-grained sediments were deposited in the last 35 Ma, with rates of sedimentation as high as 1000m/Ma are calculated for the syn-rift phase (Madon, 2007). The depth to the start of overpressure varies across the basin and is shallowest in the basin * GeoPressure Technology Ltd. ** PETRONAS *** Indiana Geological Survey Pore Pressure Prediction in challenging areas - IPA Publication May 2011 T: +44 191 334 2191 E: [email protected] W: www.geopressure.com Registered in England No.03359723 PROCEEDINGS, INDONESIA PETROLEUM ASSOCIATION Thirty-Fifth Annual Convention & Exhibition, May 2011 DEEP PORE PRESSURE PREDICTION IN CHALLENGING AREAS, MALAY BASIN, SE ASIA Stephen O’Connor* Richard Swarbrick* Jamaal Hoesni** Richard Lahann*** IPA11-G-022
Transcript of Pore Pressure Prediction.indd

ABSTRACT
Rapid burial and high rates of sedimentation
in the Malay Basin has lead to development
of overpressure by disequilibrium compaction.
Overpressure developed by this process can be
quantifi ed using industry-standard techniques
that rely on porosity/effective stress relationships.
However, where thermally-driven secondary
processes create overpressure, porosity-based
analysis that uses sonic (or seismically-derived
velocity data) and resistivity data as a measure
of porosity change underestimate overpressure.
These processes will be active in relatively
shallowly-buried shales in basins with high
geothermal gradient such as the Malay Basin.
Using comparative datasets from several regions
where secondary overpressure generation are
present (Gulf of Mexico; Halten Terrace, Mid-
Norway and the Malay Basin), we discuss such
secondary mechanisms and their quantifi cation
by integrating velocity vs. density cross-plots with
understanding of basin history. Analysis of velocity
vs. density relationships is a powerful tool to help
discriminate overpressure generating processes
and using this technique and log data from the
Malay Basin, we identify load transfer (where rock
compressibility is affected) as present, in addition
to unloading and cementation effects documented
by previous authors. Overpressure generated by
load transfer may only be partially detected by fl uid
expansion-based relationships such as Bowers
(1994), leading to inaccurate pre-drill pressure
predictions.
The identifi cation of load transfer (and
cementation) processes and their quantifi cation
is vital to accurate prediction of pore pressure in
hydrocarbon-charged reservoirs in the Malay and
other basins worldwide
INTRODUCTION
The Malay Basin is a Tertiary trans-tensional
rift basin, offshore peninsular Malaysia. In this
basin, both gas-rich and mixed oil/gas zones are
present. Over 12km of fi ne-grained sediments
were deposited in the last 35 Ma, with rates
of sedimentation as high as 1000m/Ma are
calculated for the syn-rift phase (Madon, 2007).
The depth to the start of overpressure varies
across the basin and is shallowest in the basin
* GeoPressure Technology Ltd. ** PETRONAS*** Indiana Geological Survey
Pore Pressure Prediction in challenging areas - IPA Publication May 2011
T: +44 191 334 2191
W: www.geopressure.com
Registered in England No.03359723
PROCEEDINGS, INDONESIA PETROLEUM ASSOCIATIONThirty-Fifth Annual Convention & Exhibition, May 2011
DEEP PORE PRESSURE PREDICTION IN CHALLENGING AREAS, MALAY BASIN, SE ASIA
Stephen O’Connor*Richard Swarbrick*Jamaal Hoesni**Richard Lahann***
IPA11-G-022

Registered in England No.03359723
centre, e.g. wells such as Dulang-1 and Tangga-1,
1.9-2.0 km TVDss. The Middle Miocene Unit
F shale acts as a regional seal (Madon, 2007).
All well locations named in this study are shown
in Figure 1. A similar observation was made in
Singh and Ford (1982) based on analysis of over
150 exploration wells. The Middle Miocene unit
E represents a pressure transition zone. On the
basin fl anks, overpressure starts deeper, often at
3.0 km TVDss e.g. Larut-1. In the SW of the Malay
Basin, in the vicinity of wells such as Beranang
6F-18.1 and Resak 6F-18.2, anomalously high
overpressure occurs at depths of 2.6 km TVDss,
sealed by the on-lapping, transgressive shale of
unit L (Lower Miocene). Shale seals have a strong
infl uence on overpressure distribution, as do rates
of sedimentation and subsidence (Madon, 2007).
To-date, current drilling has rarely penetrated these
deeper, highly overpressured parts of the Malay
Basin. Those wells that have drilled deep, such
as the Bergading Deep and Sepat Deep-1 wells,
encountered High Pressure/High Temperature
(HP/HT) conditions, severe mud losses, well kicks
and other operational diffi culties such as stuck
pipes, hole stability and hole caving while drilling
of the well (Mohamad et al., 2006). Prior to 1994,
80% of exploration and appraisal wells were
terminated due to overpressure in the Malay Basin
(Shariff, 1994).
Careful and accurate pore pressure prediction,
therefore, will be the key to defi ning the
next exploration phase of the Malay Basin.
A major component of this process will be
the understanding of those processes that
create overpressure, and the identifi cation of
these processes in this basin. Disequilibrium
compaction is believed to be the primary
causal mechanism for the overpressure in the
basin (Madon, 2007), however, due to the high
geothermal gradient (51.8oC/km; Halim, 1994),
we show evidence in this paper that secondary
overpressure mechanisms are also important.
Secondary mechanisms such as fl uid expansion
and cementation have previously been identifi ed
by Hoesni et al. (2007) in the Malay Basin. In this
paper, we review this work and show evidence of
additional processes, related to changes in rock
compressibility (load transfer).
Conventional porosity-based pore pressure
analysis using sonic/seismic velocity and resistivity
data as a measure of porosity retention, under-
estimates the overpressure effect of these
secondary overpressure mechanisms. Using
velocity and density data from a well in the South
and North Malay Basin, Wells A and B (Figure
1), we illustrate the methodology to identify
overpressure generation mechanisms in the Malay
Basin by using velocity vs. density cross-plotting,
and discuss implications for pre-drill prediction.
We also review approaches to allow for these
mechanisms i.e. often empirical fi ts to local data,
and results from our work in other basins, where
we have attempted to quantify these mechanisms
by integrating basin history with rock properties
and temperature data.
MECHANISMS OF OVERPRESSURE GENERATION
In environments such as the Malay Basin,
Gulf of Mexico and Nile Delta, where rates of
sedimentation are high, the sediments are young
and with low geothermal gradients, pore pressure
profi les through shale-dominated sequences can
be estimated confi dently using seismic velocity,
wireline sonic and resisitivity data. Assumptions
are that the basin is extensional and that the main
mechanism of overpressure generation is under-

Registered in England No.03359723
compaction as a result of ineffective dewatering,
referred to as disequilibrium compaction (Hubbert
and Ruby, 1959). These profi les are typically
overburden parallel (Swarbrick et al., 2002), i.e.
increasing pressure with increasing depth with (a)
constant porosity, implying (b) constant vertical
effective stress (overburden minus pore pressure).
Such pore pressure profi les are present in the
North Malay Basin (Yussof and Swarbrick, 1994;
Figure 2). Another example is shown in Figure 2 in
Madon (2007). In both these examples, a series
of thin and/or undrained, thicker sands encased
in shales contain WFT (Wireline Formation Test)
data, that acts as a proxy for measuring shale
pressures. In both cases, sharp pressure transition
zones are present involving the deep reservoirs,
producing overburden-convergent pressure
profi les, and suggesting secondary mechanisms
are likely present (Figure 2).
As porosity is reduced to low values as a result
of mechanical compaction during burial and
the temperature increases (for instance, above
70oC in some basins; Gulf of Mexico, Bruce
1984), mineralogical changes occur in the shales.
These changes lead to the two main processes
of secondary overpressure generation, fl uid
expansion/volume change and load transfer (or
framework weakening).
Fluid expansion/volume processes include
dehydration reactions such as gypsum to
anhydrite, and smectite to a more dehydrated
form. Smectite to illite transformation produces
water released and silica, which will tend to
precipitate locally. The release of bound water into
sediment pores is minor in terms of generating
overpressure (Swarbrick, and Osborne 1998).
Maturation of hydrocarbons, particularly in
the case of gas generation, produces rapid
volume expansion, reducing effective stress and
increasing pore pressure. These fl uid expansion
mechanisms such as gas generation and
dehydration reactions generate overpressure
that can be calculated using Bowers (1994), a
relationship that is based on velocity and changes
in effective stress, where porosities are low.
Other mechanisms involve changes in rock
compressibility. If the rock compressibility
is increased, there will be an extra load
superimposed onto the fl uid phase as a result
of the applied stress. These processes involve
weakening of the framework and pore collapse
driven by clay diagenesis and dissolution of
framework-supporting grains such as kerogen and
K-feldspar (Lahann (2001, 2002) and referred to
as load transfer in Swarbrick et al, 2002). These
reactions only occur where the temperature
exceeds about 80oC, although in younger
sediments the temperature at onset is more
typically > 100-120oC.
Pressures generated in shales, where porosity
is low, temperatures are increasing, and clay
mineral diagenesis and hydrocarbon generation
are ongoing, are transmitted to any associated
sands, particularly sands of restricted extent such
as turbidites. Many pressure depth profi les in
shale-dominated facies e.g. Nile Delta, Mann and
MacKenzie (1990) show increasing overpressure
with depth, proof of reservoir isolation and close
coupling with the enclosing shales e.g. in the
Malay Basin, Figure 2. Thicker, sands that are
laterally extensive have more capacity to allow
the dissipation of these pressures if a leak or
exit point is established via continuous reservoir
or fault networks to shallower levels. Examples
of reservoirs that have less pressure than the
surrounding shales and are laterally draining
pressures (and fl uids) include the Paleocene fans
of the Central North Sea (Dennis et al., 2000,
2005), as well as the Egga Sandstone Formation,

Registered in England No.03359723
Ormen Lange fi eld reservoir, Mid-Norway, and
Cauvery Basin, East India reported in O’Connor
and Swarbrick, (2008).
METHODS TO IDENTIFY SECONDARY PROCESSES OF OVERPRESSURE GENERATION
Commonly used methods to estimate the
magnitude of pore pressures, such as Equivalent
Depth or “Vertical” and Eaton Ratio or “Horizontal”
(Eaton, 1975) are based on the detection of
anomalously high porosity for depth of burial. The
porosity is high due to the ineffective dewatering of
shales during burial, whereby part of the increasing
vertical load of the overburden is transferred to
the fl uid phase, increasing pore pressure above
hydrostatic. Both relationships are derived from
Terzaghi (1953) (Equation 1) based on soil
mechanics and related to the values of log data
such as sonic and resistivity compared with those
values associated with porosity-loss on a normal
or primary compaction curve.
Sv = σv + Pf (1)
Where,
σv = vertical effective stress
Pf = pore pressure
Sv = vertical stress, derived from density data or
sonic-derived density data from the equation;
As mentioned above, processes such as gas
generation or load transfer increase the pore
overpressures reducing the grain-to-grain contact
stresses (effective stresses). However, compaction
is mostly irreversible, therefore porosity-based
pore-pressure-prediction methods (e.g. Equivalent
Depth Method) will not detect these increases in
pressure as no associated porosity anomaly is
present, tending to underestimate pore pressures
caused by mechanisms other than disequilibrium
compaction. Velocity/density vs. cross-plots can
be used to identify the presence of overpressure
generated by these other mechanisms – see
Figure 3.
In the case of gas generation, reduction of
effective stress, has the effect of reducing density
a very small amount (elastic rebound) but has
a much greater impact on the velocity. Hence
the steep downwards trend associated with
“unloading” (Figure 3; modifi ed from Hoesni,
2004). Bowers (1994) has developed this
approach to distinguish between disequilibrium
compaction and other overpressure generating
mechanisms. An example of a typical resulting
profi le for unloading is also displayed in Chopra
and Huffman (2006). Normal compaction and
disequilibrium/under-compaction display typical
increasing velocity and density magnitudes.
This profi le or primary compaction curve initially
shows increase in density with relatively little
velocity response, a pattern which corresponds to
mechanical compaction with little/no cementation,
so that grain-grain contacts are minimal and
velocity increases slowly. With increasing effective
stress and as compaction proceeds more grain-
grain contacts are made, giving a distinctive
curvature of the profi le with depth where velocity
increases more rapidly relative to density (Gardner
or Bowers relationships for shales in Bowers,
2001).
Where load transfer occurs, the transformation of
framework-supporting grains to hydrocarbons (oil
and/or gas) in the case of kerogen, smectite to
illite transformation and/ or porosity as K-feldspar
dissolves causes an increase in density - if the
system can allow some to escape. A decrease
in velocity occurs as effective stress decreases.
Registered in England No.03359723
Cementation such by silica will strengthen the
rock framework, reducing permeability (aiding
overpressure retention) and increasing the velocity
of the shales. Density increases may be variable,
depending on the types of cement and its
distribution.
Log data is the primary input for these cross-plots,
therefore, logs were initially processed, depth
matched and shale data extracted using a cut-
off based on gamma-ray data as an indicator of
lithology. Caliper logs were used to remove the
effects of wash-out that affect borehole integrity
and can cause inaccurate log responses. Finally,
a moving average fi lter can be applied to remove
spurious values such as high velocity spikes due
the localised cementation.
RESULTS FROM THE MALAY BASIN
Evidence for secondary processes in the Malay
Basin is presented in Figures 4 and 5. Both
density and sonic data were available for these
wells. In Well A, in the South of the Malay Basin,
the top of overpressure is at 1.2km, whereby shale
pressures increase parallel to the overburden (as
predicted successfully by the Equivalent Depth
Method, not shown). Below 2.0 km TVDss, shale
pressures under-estimate the K and L reservoir
pressures by 1500-2000 psi. These reservoirs are
un-drained, massive sands, overlain by thick shale
sequences (Hoesni, 2004). The estimated pore
pressure at TD is 7093 psi (15.8 ppg) (Hoesni,
2004). Figure 4 displays the velocity/density
relationship for this well. Deviation is observed
from the primary compaction curve of Bowers
(2001) at temperatures of 120oC, although more
signifi cantly at 160oC. This signature of increasing
velocity and density is identifi ed by Hoesni et al.
(2007) as suggestive of chemical compaction/
cementation effects.
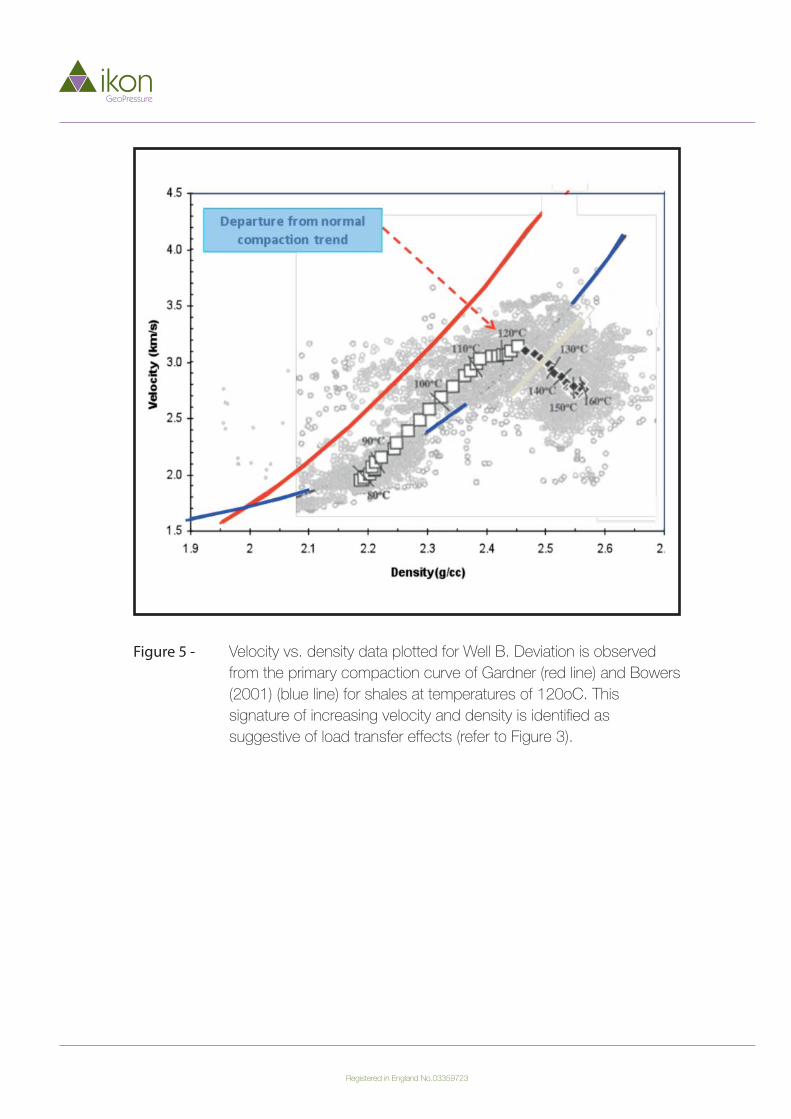
In Well B, sandy lithologies pre-dominate deeper
than in Well A, therefore overpressure commences
at 1.8 km TVDss. Shales dominate below
this depth, and reservoirs display increasing
overpressures. High mud-weights were used to
control the pore pressure in this well, and indeed,
shale pressure prediction using the Equivalent
Depth Method (not shown) suggest mud-weights
used in the well were signifi cantly below the
shale pressures. The well was abandoned, due
to wellbore instability problems attributed to high
pore pressures; at 2747m TVDss, mud-weights
used were 17.6 ppg (Hoesni, 2004). Figure 5
displays velocity and density for Well B as well
as the estimated borehole temperatures. The
depth at which the shale pressure interpretation
by the Equivalent Depth Method proves to be
inaccurate i.e. under-estimates pore pressures
as confi rmed by WFT measurements in thin,
encased sands, is approximately 2.4 km TVDss
(Hoesni, 2004), corresponding to 124oC using a
geothermal gradient of 51.8oC/km (Malay Basin;
Halim, 1994). A defl ection to slower velocity and
increased density occurs at this temperature –
this trend is similar to that shown in Figure 3. The
trend is representative of load transfer i.e. the
transformation of kerogen to hydrocarbons (oil
and/or gas), porosity as K-feldspar dissolves and/
or smectite to illite – all of these processes affect
rock compressibility and load the fl uid phase.
DISCUSSION
Madon (2007) states that disequilibrium
compaction is the primary source of overpressure
generation in the Malay Basin centre, caused by
high sedimentation rates. Modeling results suggest
that overpressure generated early during the syn-
rift phase when sedimentation rates were high
(>1000 m Ma). As post-rift rates were lower (<

Registered in England No.03359723
500 m Ma), no overpressure was generated in this
phase, such that current overpressure patterns
are due to re-distribution of overpressure via faults
and regional seals (F and L shales). Evidence
from our analysis suggests that additional
overpressure mechanisms may exist in the Malay
Basin, mechanisms that are not associated with
a porosity anomaly and therefore problematical to
detect. These mechanisms are identifi ed to be due
to load transfer processes. Hoesni et al (2007)
also provide evidence for secondary processes
in the Malay Basin via unloading, although typical
trends of rapid velocity loss (Figure 3) are not
visible on many velocity vs. density cross-plots
due to the effects of chemical compaction (via
cementation) as typifi ed in Figure 4 from Well A.
Hoesni et al. (2007) defi ne a model for chemical
compaction where shale framework collapse with
partial dewatering, followed by sequential fi lling of
pore spaces in shales by cement occurs, in both
storage (inter-granular) and connecting pores. This
cementation results in enhanced seal capacity for
shales acting as vertical barriers to migration.
Analysis of velocity vs. density cross-plot
data from Well B produces deviation from
typical shale trends characteristic of normal
compaction/disequilibrium compaction (i.e. a
primary compaction curve) (Bowers, 2001). The
defl ection to higher density and lower velocity
is characteristic of load transfer, where rock
compressibility is affected, resulting in a different
compaction profi le. This type of signature is
reported from the Gulf of Mexico by Lahann
(2001, 2002), and associated with changes
in rock compressibility by smectite to illite
transformation during clay diagenesis at 80oC
(Figure 6). However, several factors such as time
and clay type affect the temperature of onset of
this transformation. Data in Lahann (2002) from
the Gulf of Mexico suggests that overpressures of
1500-3000 psi can be attributed to this process.
Typically, 100-120oC is the temperature range at
which signifi cant overpressure can be generated
by this method. The departure from the primary
compaction trend in Figure 5 occurs at 120oC
It is not possible without further analyses e.g.
of shale samples to ascertain compaction and
mineralogical state, to determine which process
affecting rock compressibility is present/occurring.
Unloading as defi ned by Bowers (1994, 2001),
causes reduction in effective stress and velocity,
assuming plastic and elastic sediment behaviour.
Where processes occur that affect compressibility,
this behaviour will be inelastic, and the compaction
state of the rock permanently altered (Katahara,
2006). Although the velocity/effective stress model
in Lahann (2002) for the Pathfi nder well resembles
an unloading curve as discussed in Bowers
(1994), this method may only offer a partial
solution to pre-drill pore pressure prediction, where
load transfer processes are present, such as
the Malay Basin. In order to model the effects of
changes in rock compressibility, a post-unloading
compaction model as discussed in Lahann (2001,
2002) could be defi ned (if suffi cient data exists).
This model can be applied to data which are too
deep to be accurately modelled by a Bowers-
style unloading curve. The entire well profi le can
be modelled with a primary curve, a Bowers-
style unloading curve, and a deep compaction
model. Alternatively, the unloading interval may
be interpreted by a mixing function that changes
with depth from the primary model to the deep
compaction model.
This study (and Hoesni et al., 2007), would
propose that there is also evidence for additional
processes that generate overpressure in this
basin, caused by the high geothermal gradients.
An important outcome of this study is, therefore,
Registered in England No.03359723
that more complete understanding of the effects
and changes in rock compressibility are needed
as these parameters cannot be measured/
predicted pre-drill. Pressure models based on
sonic log or seismic velocity analysis data will
not be accurate if the techniques mentioned in
this paper are used e.g. Equivalent Depth, Eaton
(1975) and potentially Bowers (1994). Clearly, in
basins where temperatures are elevated e.g. the
Malay Basin, velocity data could prove problematic
below 2.0 km, therefore using seismic data will
signifi cantly under-estimate pressures by 1000’s
psi – a major drilling safety issue.
Potential solutions often rely on fi nding empirical
fi ts to existing data and applying locally, or using
relationships derived in different basins, and
applied worldwide. An example of the former is
cited in published analyses by Dolson et al. (2005)
from the Nile Delta. In these datasets, seismic
interval velocities are considered too fast for the
Miocene section, resulting in inaccurate calculation
of pore pressures. Using an Eaton exponent of
5.0 in Wells such as Akhen-1, however, provides
a match with reservoir data. Geothermal gradient
data of 25oC/km in Manzoni et al (1998) suggests
Miocene shales of the Qantara Formation are likely
affected by thermal processes, transmitted to
these reservoirs.
A more robust approach is to use velocity vs.
density cross-plots in conjunction with knowledge
of overpressure mechanisms, rock properties and
understanding of basin history. For example, the
Lower Cretaceous deep-water Lange Formation
shales provide a continuous cover of fi ne-grained
sediment over the Halten Terrace, Mid-Norway.
From analysis of temperature data, the 100oC
isotherm is generally shallower than the Lange
shales and therefore the shales are in the window
where these thermally-driven mechanisms could
be a factor. Density log data increases with depth,
indicative of a primary compaction curve. The
suggestion is that overpressuring to the current
levels proceeded independently of porosity loss
i.e. there is a signifi cant component of secondary
overpressure is the Halten Terrace region that
post-dated compaction and has no associated
porosity anomaly (Hermanrud et al., 1998).
A burial curve based on composite log data for
Well 6506/11-6 (not shown) demonstrate two
periods of rapid burial (1) Turonian/ Campanian
and (2) Plio-Pleistocene. Work by Skar et al.
(1999) suggests that pressures were hydrostatic
prior to this latest burial due to pressure bleed-off
during the Tertiary hiatus. The relative contributions
of the rapid loading during the Plio-Pleistocene
(1.7 km of sediment; Norgård Bolås et al.,
2005) and secondary contribution to the current
Lange pore pressure profi le in Well 6406/2-3 are
illustrated in Figure 7 (GPT/IHS, 2007). The blue
line on the left is the hydrostatic (normal) pressure
starting point at 3 Ma ago. The darker blue line to
its right represents the pore pressure profi le after
the rapid burial event, with a constant contribution
to overpressure from rapid loading via ineffective
dewatering. The current Lange pore pressure
profi le (as defi ned by WFT data in encased
intra-formational sands, often four per well, and
defi ning a regional shale gradient) is indicated by
purple line on the right of the fi gure.
For the deeply buried rocks such as the Lange
shales, already having low permeability, this
additional overburden will be translated into
overpressure (assuming no signifi cant dewatering)
by:
1.7 km sediment thickness x (lithostatic gradient of
3.28 psi/m - water gradient of 1.45 psi/m) = 2711
psi

Therefore, at 4.0 km depth in Figure 7, using
the purple line representing current pressures in
the Lange indicates approximately 4350 psi of
overpressure (1639 psi greater than recent loading
history calculated above could have generated).
In such old and hot rocks, seismic-based velocity
prediction of pore pressure would be unreliable,
as there is no porosity/effective stress link. The
difference between dark blue and purple lines
represents our best estimate of the contribution
to overpressure from diagenetic changes in
the shales. Velocity vs. density cross-plot
analysis suggests load transfer (smectite to
illite transformation, K-feldspar dissolution etc.)
processes are active in these shales, with a
reduction in velocity, and increase in density.
CONCLUSIONS
In conclusion, in the Malay Basin, there is a
strong correlation between rate of sedimentation
and overpressure development by disequilibrium
compaction. However, as wells are drilled deeper
into this Basin (and other basins world-wide
below the 100oC isotherm), thermal processes
in shales will result in secondary overpressure
generation, and, if this overpressure is transmitted
to reservoirs, pre-drill predictions of pore pressure
will be inaccurate, compromising safety.
Using traditional techniques of pore pressure
prediction such as Equivalent Depth and Eaton
(1975) will be inadequate. Bowers (1994) offers
only a partial solution. New relationships will
need to be developed based on integrating an
understanding of basin history, shale behaviour,
clay mineral diagenesis, thermal behaviour and
geological time to successfully predict pore
pressures in this, and other, hot and deep basins
world-wide.
ACKNOWLEDGMENTS
The authors would like to extend their thanks to
the organizing committee for the chance this work
at the IPA Conference, 18-20th May, 2011.
REFERENCES
Bowers, G., 1994. Pore pressure estimation
from velocity data: Accounting for overpressure
mechanisms besides undercompaction. IADC/
SPE 27488, IADC/SPE Drilling Conference, p.
515-530.
Bowers, G., 2001. Determining an appropriate
pore-pressure estimation strategy. OTC 13042,
Offshore Technology Conference.
Bruce 1984. Smectite dehydration – its relation
to structural development and hydrocarbon
accumulation in northern Gulf of Mexico Basin.
AAPG Bulletin, v. 68, No.6, p. 673-683.
Chopra, S and Huffman, A. 2003. Velocity
determination for pore-pressure prediction. The
Leading Edge; December 2006; v. 25; no. 12; p.
1502-1515
Dennis, H, Baillie, J, Torleif, T, Holt, T and Wessel-
Berg, D. 2000. Hydrodynamic activity and tilted
oil-water contacts in the North Sea. Norwegian
Petroleum Society Special Publications
Volume 9, 2000, Pages 171-185
Registered in England No.03359723

Registered in England No.03359723
Dennis, H, Bergmo, P and Holt, T. 2005 Tilted
oil–water contacts: modeling the effects of aquifer
heterogeneity Petroleum Geology Conference
series 2005, v. 6, p. 145-158
Dolson, J.C, Boucher, P.J, Siok, J and Heppard,
P.D 2005 Key challenges to realizing full potential
in an emerging giant gas province: Nile Delta/
Mediterranean, deep-water, Egypt. In: Dore A.G
and Vining, B (eds) Petroleum Geology: North-West
Europe and Global Perspectives – Proceedings of
the 6th Petroleum Geology Conference, p. 607-
624.
Eaton, B. 1975. The equation for geopressure
prediction from well logs. Society of Petroleum
Engineers of AIME, SPE 5544, 11 p.
Gardner, G.H.F., Gardner, L.W. and Gregory,
A.R. 1974. Formation velocity and density: the
diagnostic for stratigraphic traps. Geophysics, 39,
770-780.
GPT/IHS Mid-Norway Pressure Study, 2007. Non-
Proprietary study by GeoPressure Technology and I
H S Energy.
Halim, M, F. 1994 Thermal regimes of Malaysian
sedimentary basins Volume: 78:7; Conference:
AAPG International Conference and Exhibition,
Kuala Lumpur (Malaysia), 21-24 Aug 1994.
Hermanrud, C., Wensaas, L., Teige, G.M.G.,
Norgård Bolås, H.M., Hansen, S. & Vik, E. 1998.
Shale Porosities from Well Logs on Haltenbanken
(Offshore Mid-Norway) Show No Infl uence of
Overpressuring, In Law, B.E., Ulmishek, G.F.
& Slavin, V.I. (eds.), Abnormal pressures in
hydrocarbon environments: AAPG Memoir 70, pp.
65-85, The American Association of Petroleum
Geologists.
Hoesni, M.J., Swarbrick, R.E, and Goulty, N.R
2003. The Origins of overpressure in the Malay
Basin AAPG Barcelona Conference, Spain.
Hoesni, M.J. 2004. The origin of overpressure in
the Malay Basin and its infl uence on petroleum
systems. Unpublished PhD thesis, University of
Durham.
Hoesni, M.J., Swarbrick, R.E, and Goulty, N.R
2007. The Signifi cance of Chemical Compaction
in Modeling the Overpressure in the Malay Basin
AAPG Hedberg Conference, The Hague, The
Netherlands.
Hubbert, M. K., Ruby, W. W. 1959. The role of pore
pressure in mechanics of mechanics of overthrust
faulting. Geol. Soc.Am. Bull. 70, 115-166.
Kathara, K., 2006, Overpressure and shale
properties: Stress unloading or smectite-illite
transformation?. 76th annual International Meeting,
SEG, Expanded Abstracts, paper PPP 1.2, p.
1520-1524.
Lahann, R., McCarty, D. & Hsieh, J. 2001. Infl uence
of Clay Diagenesis on Shale Velocities and Fluid
Pressure. OTC 13046, Offshore Technology
Conference.
Lahann, R., 2002. Impact of smectite diagenesis
on compaction profi les and compaction equilibrium.
In AADE Industry Forum on Pressure regimes in
sedimentary basins and their prediction. Del Lago
Resort, Lake Conroe, Texas. 2-4 September 1998.
Madon, M. 2007. Overpressure development in rift
basins: an example from the Malay Basin, offshore
Peninsular Malaysia Petroleum Geoscience v. 13;
no. 2; p. 169-180

Registered in England No.03359723
Mann, D.M., and MacKenzie, A.S., 1990.
Prediction Of Pore Pressures In Sedimentary
Basins
Marine and Petroleum Geology, v. 7, no. 1, p. 55
– 65
Mazzoni, R, Wahdan, T, Bassem, A and Ward,
D.C 1998. Real-Time pore and fracture pressure
prediction with FEWD in the Nile Delta SPE/IADC
37669.
Mohamad, H, Jaini, N and Tajuddin, M. R 2006
drilling of deep-seated reservoir in high pressure
regime in the north of malay basin. Petroleum
Geology Conference and Exhibition 2006, 27-
28th November, 2006. Kuala Lumpur Convention
Center, Kuala Lumpur, Malaysia
Norgård Bolås, H.M., Hermanrud, C. & Teige,
G.M.G., 2005. The infl uence of stress regimes
on hydrocarbon leakage. In: Boult, P. & Kaldi,
J. eds. Evaluating fault and cap rock seals,
AAPG Hedberg Series, 2, 109-123. American
Association of Petroleum Geologists.
O’Connor, S.A and Swarbrick, R.E, 2008. Where
has all the pressure gone? Evidence from
pressure reversals and hydrodynamic fl ow. First
Break, v. 26 September 2008
Osborne, M. J. and Swarbrick, R. E., 1997.
Mechanisms which generate overpressure in
sedimentary basins: a reevaluation. AAPG
Bulletin, v 81, p 1023-1041.
Shariff Bin Kader, M. 1994. Abnormal Pressure
Study in the Malay and Penyu Basins: A Regional
Understanding. Bulletin of the Geological Society
of Malaysia, 36, p. 81-91.
Singh, I and Ford, C.H. 1982. The occurrence,
causes and detection of abnormal pressure in
the Malay Basin. Offshore South East Asia Show,
9-12 February 1982, Singapore
Skar, T., Van Balen, R.T., Arnesen, L. & Cloetingh,
S. 1999. Origin of overpressures on the Halten
Terrace, offshore mid-Norway: the potential role
of mechanical compaction, pressure transfer and
stress, In: Aplin, A.C., Fleet A.J. & Macquaker,
J.H.S (eds.) Muds and Mudstones: Physical and
Fluid Flow Properties, Geological Society Special
Publication no. 158, pp.137-156, Geological
Society of London. ISBN 1-86239-030-4.
Swarbrick, Richard E., Osborne, Mark J.,
and Gareth S. Yardley, 2002. Comparison of
overpressure magnitude resulting from the main
generating mechanisms. AAPG Memoir 76, A. R.
Huffman and G. L. Bowers, eds.
Yusoff, W.I. and Swarbrick, R.E. 1994. Thermal
and Pressure Histories of the Malay Basin,
Offshore Malaysia. AAPG International Conference
and Exhibition, Kuala Lumpur, Malaysia, August
21-24, 1994

Registered in England No.03359723
Figure 1 - Location map for Malay Basin adapted from Madon (2007).
Locations of all wells mentioned in the text are displayed.

Registered in England No.03359723
Figure 2 - Well LA-3, Malay Basin (Yusoff and Swarbrick (1994). Wireline
Formation Test (WFT) data (blue ovals) refi nes an overburden-
parallel shale pore pressure profi le, characteristic of overpressure
generated by disequilibrium compaction (black line). Sharp pressure
transition zone below 100oC suggests additional overpressure
generated by secondary processes (based on geothermal gradient
of 51.8oC/km, Halim (1994). See text for discussion.

Registered in England No.03359723
Figure 3 - Typical Velocity vs. Density signatures and their associated, causal
mechanisms of overpressure generation (from Hoesni, 2004).

Registered in England No.03359723
Figure 4 - Velocity vs. density data plotted for Well A. Estimated borehole
temperatures also plotted. Deviation is observed from the primary
compaction curve of Gardner (red line) and Bowers (2001) (blue
line) for shales at temperatures of 120oC, although more
signifi cantly at 160oC. This signature of increasing velocity and
density is identifi ed by Hoesni et al. (2007) as suggestive of
chemical compaction/cementation effects.
Registered in England No.03359723
Figure 5 - Velocity vs. density data plotted for Well B. Deviation is observed
from the primary compaction curve of Gardner (red line) and Bowers
(2001) (blue line) for shales at temperatures of 120oC. This
signature of increasing velocity and density is identifi ed as
suggestive of load transfer effects (refer to Figure 3).

Registered in England No.03359723
Figure 6 - An example of velocity/density behavior that requires load transfer
interpretation in Gulf of Mexico. Solid blue line represents the
primary compaction curve. In this case, the load transfer (or
“unloading” termed by the author) shift (orange squares) occurred
within the smectite-illite reaction window (Lahann, 2002).

Figure 7 - Hydrostatic pressure (light blue), contribution to overpressure from
recent rapid burial (light blue to dark blue) and contribution to
overpressure from load transfer (dark blue to purple) for Lange
Formation shales, Halten Terrace, Mid-Norway. Reservoir
overpressures, as measured by WRT data in encased shales in the
Lange Formation, are substantially higher than could have been
created by burial-related processes alone.
O P T I M I S E S U C C E S S T H R O U G H S C I E N C E
Registered in England No.03359723