Pore pressure prediction in Niger Delta high pressure ...
12
Vol.:(0123456789) 1 3 Journal of Petroleum Exploration and Production Technology (2021) 11:3747–3758 https://doi.org/10.1007/s13202-021-01264-5 ORIGINAL PAPER-EXPLORATION GEOLOGY Pore pressure prediction in Niger Delta high pressure, high temperature (HP/HT) domains using well logs and 3D seismic data: a case study of X‑field, onshore Niger Delta Abdulquadri O. Alabere 1 · Olayemi K. Akangbe 2 Received: 4 December 2020 / Accepted: 12 August 2021 / Published online: 1 September 2021 © The Author(s) 2021 Abstract Few wells targeting high temperature, high pressure intervals in most tertiary sedimentary basins have achieved their objec- tive in terms of technicalities and cost. Since most shallow targets have been drilled, exploration focus is drifting into deeper plays both onshore and in deep offshore areas. To ensure safe and economic drilling campaigns, pore pressure prediction methodologies used in the region needs to be improved. The research aims at generating and testing a modification of Eaton’s equation fit for high temperature, high pressure intervals on a field. The evolution of pore pressure in the field was established from offset well data by making several crossplots, and fracture gradient was computed using Mathew and Kelly’s equation. Eaton’s equation parameters were then calibrated using several wells until a desired field scale result was achieved when compared with information from already drilled intervals i.e., kicks and RFT data. Seismic velocity data resulting from high density, high resolution velocity analysis done to target deep overpressured intervals were then used to predict 1D pore pres- sure models at six selected prospect locations. Analyses reveal depths shallower than 3800 m TVD/MSL with geothermal gradient 3.0 °C/100 m and pressure gradient less than 1.50sg EMW are affected mainly by undercompaction; depths greater than 3800 m TVD/MSL with geothermal gradient of 4.1 °C/10 m and pressure gradients reaching 1.82–2.12sg EMW are affected by unloading with a narrow drilling margin for the deep highly pressured prospect intervals. Eaton’s n-exponent was modified to 6, and it proved accurate in predicting high overpressure in the first prospect wells drilled. Keywords Fracture gradient · Drilling window · Eaton equation · Pore pressure · Overburden gradient Introduction Rapid sedimentation associated with young tertiary sedi- mentary basins [e.g., Niger Delta, Gulf of Mexico, South East Asia, Trinidad] have led to entrapment of pore fluids in thick sequences of low permeability shales [Holland et. al. 1990; Nehring, 1991; Grauls and Baleix 1994; Heppard et. al. 1998]. The reduction in porosity and permeability associated with this burial coupled with increase in geother- mal gradient with depth sometimes lead to the development of deep high pressured, high temperature intervals. These intervals create challenges for both exploration and drilling activities as high overpressures might affect the hydrocarbon retention capacity of traps due to hydrofracturing of seals as well as pose additional risk and uncertainties to drilling teams and facilities. If overpressures are not accurately predicted prior to drill- ing, it can greatly increase drilling non-productive time, result in reduced drilling speed and may cause catastrophic incidents such as well blowouts, pressure kicks and well complexities (Zhang 2011; Zhang 2013; Sen and Ganguli 2019; Baouche et al. 2020a, b, 2020c; Ganguli and Sen 2020; Radwan and Sen 2020). Other minor incidents that might occur include unintended fracturing of the formation and consequent mud losses. While it is rare to find a well that did not meet at least a part of its objectives, only few wells drilled in Niger Delta to target high pressure, high * Abdulquadri O. Alabere [email protected] Olayemi K. Akangbe [email protected] 1 Department of Georesources and Energy, Institut Francais du Petrole et de Moteurs (IFP School), Rueil-Malmaison, France 2 Department of Geology, University of Ibadan, Ibadan, Nigeria
Transcript of Pore pressure prediction in Niger Delta high pressure ...
Vol.:(0123456789)1 3
Journal of Petroleum Exploration and Production Technology (2021) 11:3747–3758 https://doi.org/10.1007/s13202-021-01264-5
ORIGINAL PAPER-EXPLORATION GEOLOGY
Pore pressure prediction in Niger Delta high pressure, high temperature (HP/HT) domains using well logs and 3D seismic data: a case study of X‑field, onshore Niger Delta
Abdulquadri O. Alabere1 · Olayemi K. Akangbe2
Received: 4 December 2020 / Accepted: 12 August 2021 / Published online: 1 September 2021 © The Author(s) 2021
AbstractFew wells targeting high temperature, high pressure intervals in most tertiary sedimentary basins have achieved their objec-tive in terms of technicalities and cost. Since most shallow targets have been drilled, exploration focus is drifting into deeper plays both onshore and in deep offshore areas. To ensure safe and economic drilling campaigns, pore pressure prediction methodologies used in the region needs to be improved. The research aims at generating and testing a modification of Eaton’s equation fit for high temperature, high pressure intervals on a field. The evolution of pore pressure in the field was established from offset well data by making several crossplots, and fracture gradient was computed using Mathew and Kelly’s equation. Eaton’s equation parameters were then calibrated using several wells until a desired field scale result was achieved when compared with information from already drilled intervals i.e., kicks and RFT data. Seismic velocity data resulting from high density, high resolution velocity analysis done to target deep overpressured intervals were then used to predict 1D pore pres-sure models at six selected prospect locations. Analyses reveal depths shallower than 3800 m TVD/MSL with geothermal gradient 3.0 °C/100 m and pressure gradient less than 1.50sg EMW are affected mainly by undercompaction; depths greater than 3800 m TVD/MSL with geothermal gradient of 4.1 °C/10 m and pressure gradients reaching 1.82–2.12sg EMW are affected by unloading with a narrow drilling margin for the deep highly pressured prospect intervals. Eaton’s n-exponent was modified to 6, and it proved accurate in predicting high overpressure in the first prospect wells drilled.
Keywords Fracture gradient · Drilling window · Eaton equation · Pore pressure · Overburden gradient
Introduction
Rapid sedimentation associated with young tertiary sedi-mentary basins [e.g., Niger Delta, Gulf of Mexico, South East Asia, Trinidad] have led to entrapment of pore fluids in thick sequences of low permeability shales [Holland et. al. 1990; Nehring, 1991; Grauls and Baleix 1994; Heppard et. al. 1998]. The reduction in porosity and permeability
associated with this burial coupled with increase in geother-mal gradient with depth sometimes lead to the development of deep high pressured, high temperature intervals. These intervals create challenges for both exploration and drilling activities as high overpressures might affect the hydrocarbon retention capacity of traps due to hydrofracturing of seals as well as pose additional risk and uncertainties to drilling teams and facilities.
If overpressures are not accurately predicted prior to drill-ing, it can greatly increase drilling non-productive time, result in reduced drilling speed and may cause catastrophic incidents such as well blowouts, pressure kicks and well complexities (Zhang 2011; Zhang 2013; Sen and Ganguli 2019; Baouche et al. 2020a, b, 2020c; Ganguli and Sen 2020; Radwan and Sen 2020). Other minor incidents that might occur include unintended fracturing of the formation and consequent mud losses. While it is rare to find a well that did not meet at least a part of its objectives, only few wells drilled in Niger Delta to target high pressure, high
* Abdulquadri O. Alabere [email protected]
Olayemi K. Akangbe [email protected]
1 Department of Georesources and Energy, Institut Francais du Petrole et de Moteurs (IFP School), Rueil-Malmaison, France
2 Department of Geology, University of Ibadan, Ibadan, Nigeria
3748 Journal of Petroleum Exploration and Production Technology (2021) 11:3747–3758
1 3
temperature intervals achieved their stated objectives. Some drilling campaigns have either failed, been terminated or resulted in actual drilling cost very high compared to well cost estimates (Hope 2017).
Several researchers have also worked on pore pressure evolution and reservoir characterization in the Niger Delta basin across all depobelts using well and seismic pore pres-sure prediction methods (Ola et al. 2021; Udo et al. 2020; Umar et al. 2020; Emujakporue and Enyenihi 2020; Emu-dianughe and Ogagarue 2019; Emudianughe and Ogagarue 2018; Ola and Alabere 2018; Adewole and Healy 2017; Oweh et al. 2017; Horsfall et al. 2017; George et al. 2017; Abija et al. 2016; Nwankwo and Kalu 2016; Ugwu and Nwankwo 2014; Reginald-Ugwuadu et al. 2014; Adewole and Healy 2013, Francis and Dosunmu 2013) but very few have ventured into deep high pressure, high temperature domains.
In most explored intervals of the Niger Delta basin, the dominant primary overpressure mechanism is undercompac-tion due to high sedimentation rate which is more rapid than fluid expansion rate. Based on the latest downhole meas-urements, shallow sandstone reservoirs are found to have sub-hydrostatic pore pressure, while the lower reservoir unit is presently at hydrostatic pressure regime (Agbasi et al. 2020). As drilling activities are now focused into deeper plays, secondary overpressure mechanisms become increas-ingly important which necessitates a proper understanding of these mechanisms and modified approach to prediction techniques.
This study integrates well logs, seismic velocity data, 3D seismic data, reservoir formation pressures (RFT data), leak-off test (LOT data), temperature data from several wells in the field to generate a modified Eaton’s equation which would efficiently predict pore pressure evolution Onshore, Niger Delta. The objective of the project includes (a) to identify the different overpressure mechanisms in the Niger Delta (b) to identify regions impacted by secondary overpressure mechanisms (c) to set regional shale normal compaction trends and compute overburden gradients (d) to predict pore pressure in disequilibrium compactions and secondary overpressure domains (e) to compute fracture gra-dient (FIP) profiles, (f) to build cube models of pore pressure gradient, overburden gradient and fracture gradient for the field.
Theoretical background
Overpressure generating mechanisms has been broadly classified into five categories; namely disequilibrium compaction, fluid expansion, diagenesis, tectonic compres-sion and pressure transfer (Zhao et. al 2018). The cause of overpressure in many sedimentary basins is undercompac-tion i.e., disequilibrium compaction which makes it the
primary overpressure mechanism. Secondary overpressure mechanisms include fluid expansion which is related to thermal stress (hydrocarbon generation/kerogen crack-ing, oil cracking to gas, hydrothermal expansion), diagen-esis (illite–smectite transformation, quartz dissolution, cementation) and lateral and vertical overpressure trans-fer (dynamic transfer) (Osborne and Swarbrick 1997). An example of fluid transfer is that of a sealed interval having pore fluid pumped into it from another, higher-pressure zone. Sometimes this can be caused by charging along faults or along dipping sand enclosed in shale. The sand transmits pore fluid and pressure from deeper shales up dip (Hall 1993; Swarbrick et al. 2002; Yardley and Swar-brick 2000). Causes of overpressure differ in lithology; for mudstones, the overpressured formation in source rocks is usually different from those of non-source rocks, the former which is frequently related to hydrocarbon genera-tion and sometimes also affected by diagenesis, while the latter which is commonly related to disequilibrium com-paction, diagenesis and pressure transfer. Phenomena such as quartz dissolution and cementation is also important in some Cenozoic basins especially in Nigeria where fine grained, poorly sorted texturally mature, platykurtic silt-stones are heavily affected by cementation and compaction (Alabere et al. 2020). Dehydration reactions associated with mineral diagenesis is another mechanism of overpres-sure development. Smectite dehydration is a complex pro-cess but can lead to overall volume increases of both the rock matrix and the pore water system (Hall 1993). Fluid expulsion from montmorillonite lattices during phase tran-sition to illite typically occur at a temperature of 100 °C in the Gulf of Mexico and this correlate to the depth at which overpressure has been observed (Bruce 1984). The transition of anhydrite to gypsum is another dehydration reaction that can lead to overpressure development, but only at relatively shallow depths as the temperature at which this dehydration occurs is only about half that of the smectite–illite transition.
Several direct (empirical analysis) and indirect (theoreti-cal analysis) have been proposed for the study of overpres-sure. The empirical analysis refers to the analysis of the geo-logic-geophysical logging response to and the experimental test of overpressures, while the latter refers to the analysis of geologic conditions for and numerical simulation of over-pressured formation (Zhao et al. 2018). With more and more application of empirical methods in the study of overpres-sured formations, most of the overpressure cases that are traditionally thought to be caused by disequilibrium compac-tion are denied totally or partially. Instead hydrocarbon gen-eration is demonstrated to be of increasing significance, the clay diagenesis (especially illite–smectite transformation) as well as tectonic compression and pressure transfer also started becoming important in recent literatures. In addition,
3749Journal of Petroleum Exploration and Production Technology (2021) 11:3747–3758
1 3
the overpressured formation in many basins is thought to be influenced by the combination of two or more overpressur-ing mechanism (Zhao et al. 2018).
Six methods have been proposed for the study of over-pressure, and they include; Bower’s method, velocity-den-sity crossplotting method, porosity correlation method, log curves combination analysis, pressure calculation and cor-relation method and the comprehensive analysis method (Zhao et al. 2018). In this research, a combination of veloc-ity-density crossplotting method, pressure calculation and correlation method was used.
The Bowers approach proposed by Bowers (1994) which involves the use of porosity-vertical effective stress chart which is also known as the Bower’s chart or load-ing–unloading curves pointed out that overpressures caused by disequilibrium compaction would reflect on the loading curve while those caused by fluid expansion would reflect on the unloading curve. He proposed two key indicators for the identification of unloading origin; which are that the velocity of sediments should be very small when compared with the noticeable change of effec-tive stress and that density is not sensitive to unloading (Bowers 1994, 2002). Therefore, to determine overpres-sures caused by unloading it’s necessary to make both the effective stress-velocity relation diagram and the effec-tive stress-density relation diagram when compiling load-ing–unloading charts. Sediment unloading can be elastic, inelastic or transitional. For elastic unloading, the acous-tic velocity decreases while the density remains constant in the overpressured interval (Bowers 1994), or porosity
slightly increases due to elastic rebound while the veloc-ity decreases significantly (Bowers 2011). In the case of inelastic unloading, the density increases while the acous-tic velocity slightly decreases or remains constant (Lahann and Swarbrick 2011).
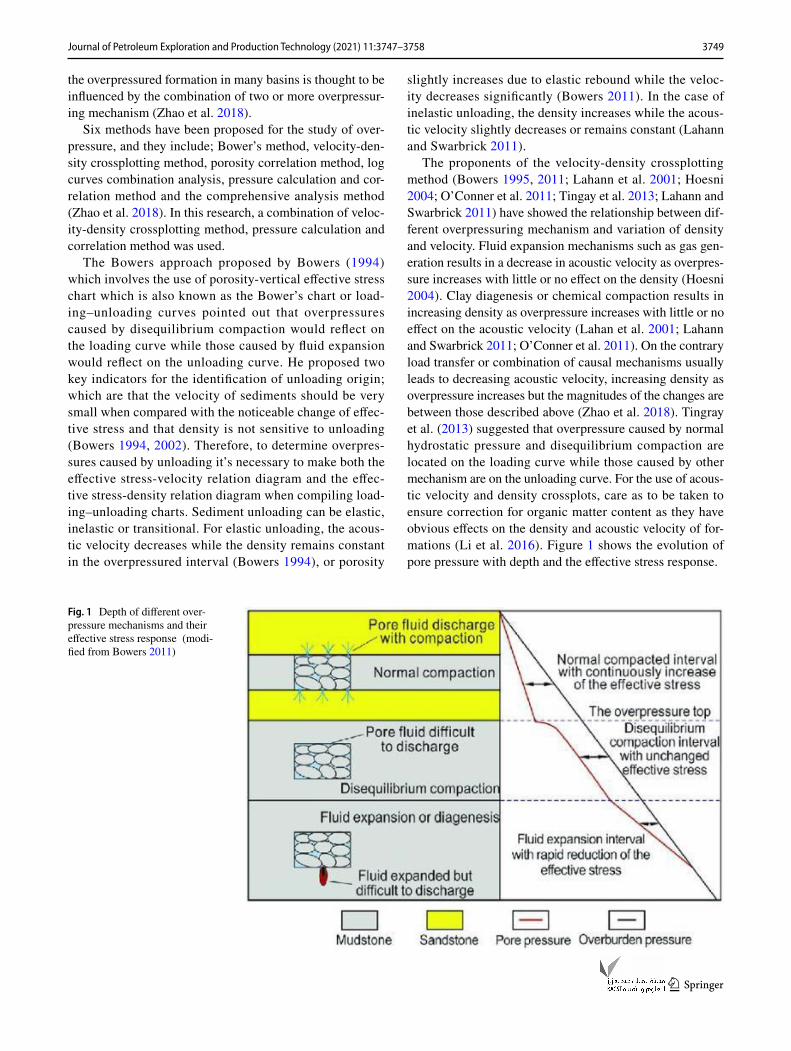
The proponents of the velocity-density crossplotting method (Bowers 1995, 2011; Lahann et al. 2001; Hoesni 2004; O’Conner et al. 2011; Tingay et al. 2013; Lahann and Swarbrick 2011) have showed the relationship between dif-ferent overpressuring mechanism and variation of density and velocity. Fluid expansion mechanisms such as gas gen-eration results in a decrease in acoustic velocity as overpres-sure increases with little or no effect on the density (Hoesni 2004). Clay diagenesis or chemical compaction results in increasing density as overpressure increases with little or no effect on the acoustic velocity (Lahan et al. 2001; Lahann and Swarbrick 2011; O’Conner et al. 2011). On the contrary load transfer or combination of causal mechanisms usually leads to decreasing acoustic velocity, increasing density as overpressure increases but the magnitudes of the changes are between those described above (Zhao et al. 2018). Tingray et al. (2013) suggested that overpressure caused by normal hydrostatic pressure and disequilibrium compaction are located on the loading curve while those caused by other mechanism are on the unloading curve. For the use of acous-tic velocity and density crossplots, care as to be taken to ensure correction for organic matter content as they have obvious effects on the density and acoustic velocity of for-mations (Li et al. 2016). Figure 1 shows the evolution of pore pressure with depth and the effective stress response.
Fig. 1 Depth of different over-pressure mechanisms and their effective stress response (modi-fied from Bowers 2011)
3750 Journal of Petroleum Exploration and Production Technology (2021) 11:3747–3758
1 3
A couple of researchers (Hertmanrud et al. 1988; Tiege et al. 1999; Tingray et al. 2009; Dasgupta et al. 2016) used the porosity correlation method which depends on com-parison between porosity of overpressured mudstones with normally pressured intervals at similar depth to determine the presence of a porosity anomaly which would indicate the activity of an overpressure generating mechanism. The log curves combination analysis which is the most basic method and one of the most reliable in investigating over-pressure origin in use since 1970s (Fertl and Timko 1972; Fertl 1976). Some researchers such as Bowers (2002) believe that when multiple logs are used for overpressure prediction, a synchronous reversal of acoustic, resistivity and density logging curves should occur. On the contrary if the rever-sal is not synchronous i.e., if density reversal lags behind, that indicates that the overpressure present is not caused by undercompaction but by other mechanisms such fluid expansion, pressure transfer, tectonic loading or smectite-illite transformation.
The pressure calculation and correlation method involves calculating overpressure using different methods (Eaton’s method, equivalent depth method, the Bower’s method, etc.) and correlating it with measured formation pressures. The mechanism by which the calculated formation pressures are most approximate to the measured pressure is most likely the cause of the overpressure. The equivalent depth method is based on porosity and thus effectively predicts disequi-librium compaction while the Eaton’s equation prediction depends on the value of the Eaton’s exponent. An exponent (n) of 3.0 suggests disequilibrium compaction while expo-nent (n) greater than 6 could be predictive of fluid expansion or pressure transfer mechanisms. Whichever of these meth-ods that matches the measured pressure in the wells ready suggests the possible overpressure mechanism at play. The comprehensive analysis combines the empirical methods described above with knowledge of geological setting and distribution of overpressures as well as simulation studies (Zhao et al. 2018). Knowledge of the basin would involve understanding the geothermal and compaction setting and depositional environment.
Materials and methods
A dataset that comprised 3D seismic, reservoir formation pressure (RFT), leak-off test (LOT), Suite of well logs (wire-line and LWD logs consisting of sonic, density, gamma ray and resistivity logs), mudlogging data and end of well reports were employed in this study. Our analysis was car-ried out in five stages:
(1) Offset wells post-mortem pore pressure analyses and establishing the cause of overpressure.
(2) High-Density High-Resolution (HDHR) velocity analy-sis.
(3) Prospects 1D pore pressure prediction.(4) 3D Pore pressure modeling.(5) Uncertainty and sensitivity analysis.
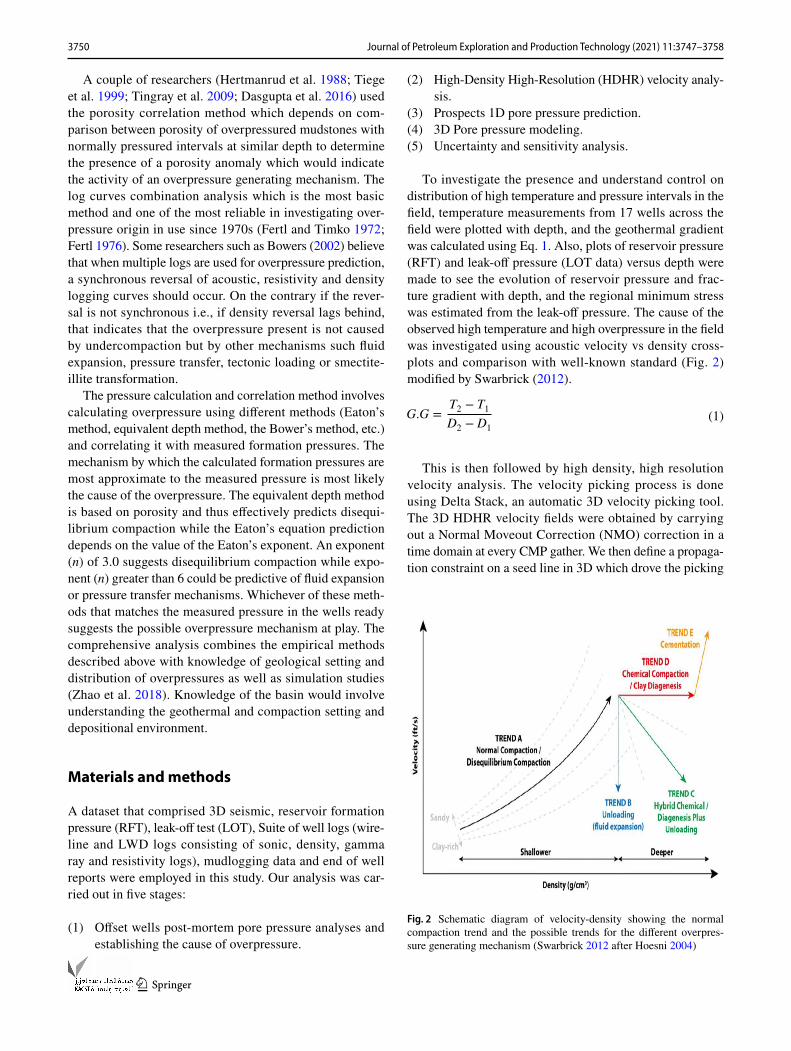
To investigate the presence and understand control on distribution of high temperature and pressure intervals in the field, temperature measurements from 17 wells across the field were plotted with depth, and the geothermal gradient was calculated using Eq. 1. Also, plots of reservoir pressure (RFT) and leak-off pressure (LOT data) versus depth were made to see the evolution of reservoir pressure and frac-ture gradient with depth, and the regional minimum stress was estimated from the leak-off pressure. The cause of the observed high temperature and high overpressure in the field was investigated using acoustic velocity vs density cross-plots and comparison with well-known standard (Fig. 2) modified by Swarbrick (2012).
This is then followed by high density, high resolution velocity analysis. The velocity picking process is done using Delta Stack, an automatic 3D velocity picking tool. The 3D HDHR velocity fields were obtained by carrying out a Normal Moveout Correction (NMO) correction in a time domain at every CMP gather. We then define a propaga-tion constraint on a seed line in 3D which drove the picking
(1)G.G =T2− T
1
D2− D
1
Fig. 2 Schematic diagram of velocity-density showing the normal compaction trend and the possible trends for the different overpres-sure generating mechanism (Swarbrick 2012 after Hoesni 2004)
3751Journal of Petroleum Exploration and Production Technology (2021) 11:3747–3758
1 3
and is automatically propagated and adapted according to neighboring values already available. The interval veloc-ity cube is then computed from this RMS velocity field at two offset (post-mortem) well locations and Dix converted (Eq. 2), then pseudo-sonic was computed using Eq. 3. Ani-sotropy corrections were applied to obtain a pseudo-sonic consistent with actual sonic acquired in the wells. This was done to calibrate the pseudo-sonic and determine what cor-rections needed to be applied at any prospect well location. 1D interval velocities were picked at six random locations to cover the area where the possible deep prospects are located and extended to reach deep prospect intervals between 4200 and 4500 m TVD/MSL.
The LWD and Wireline logs had gamma ray log, density and sonic log though the density and GR log were missing in some wells. Where there was no density log, a pseudo density log was created using Gardner’s equation (Eq. 4) and applying the constant A & B calibrated from wells where both sonic and density logs were present.
The gamma ray logs were first interpreted to delineate sandstones from shaly rocks, then a line group was drawn using a cut-off of 75 API which was increased in some areas to 80 API for some wells to ensure that only the shales were included in the line groups used to create shale points. The shale points were then transferred to the sonic log so as to have interval transit time for only the shaly intervals as res-ervoir pressure would be an input from the RFT data. Then logs were then filtered using shrink boxcar (equal weight method) to reduce the density of points. In wells were there was no gamma ray logs, the whole sonic logs were filtered as shale points cannot be picked.
Since the density logs are usually acquired in the reservoir sections of interest, thus lacking at shallow intervals, there is a need to extrapolate the density to the surface. This is important for overburden gradient computation as it involves integrating the density log from the surface till total depth (TD) of the well as all the overlying weight of rocks has to be considered. The extrapolation was done using Miller’s equation (Eq. 5) and then all the depth-corrected density logs for the 11 wells as well as the Rhob_miller (density from miller’s equation) was averaged to get the regional Rhob_average log which is filtered using the shrink boxcar
(2)Vint
=
(
t2Vrms2
− t1Vrms1
(
t2− t
1
)
)1∕2
(3)Δt�s∕ft= 304800∕Vms∕ft
(4)� = A ∗
(
106
DTsonic
)B
(equal weight) approach and then displayed in all wells after the depth was corrected for ground level elevation due to differences in topography. The correction was necessary because the reference for overburden gradient calculations onshore is the ground level. The overburden gradient was then computed by integrating the depth-corrected regional Rhob_average in each well from the top to TD (Eq. 6).
The normal compaction trend was then computed for all eleven wells using NCT-3P equation (Eq. 7), and calibrated using values from the hydrostatic shale points on sonic log by adjusting the DTmax, DTmin and K parameters of the NCT-3P until the resulting normal compaction trend best fits the filtered sonic log. Any sharp points of departure that cannot be fitted already gives an indication of overpressure.
The shale pore pressure was computed using Eaton’s sonic equation (Eq. 8) and the computed normal compac-tion trend, overburden gradient, shale point filtered sonic log and Eaton exponent, n = 3 for regions shallower than 3800 m TVD/MSL as the input parameters. For regions deeper than 3800 m TVD/MSL which are impacted by unloading, the normal Eaton’s equation could not adequately account for the pressures observed in shales assuming pressure equi-librium between shale and reservoir sands in these depth intervals. Pressure estimates came from kicks recorded in thin isolated sand layer within the shales. Modified Eaton’s equation was used for pore pressure prediction below this depth by fitting shale pore pressure predicted to the observed events in these wells (kicks and RFT) by adjustment of the Eaton exponent. The Eaton’s n-parameter was tested in the range of 3–6, with n = 6 best predicting the shale pore pres-sure in the deep pressured intervals. Measured reservoir pressure from RFT measurements was integrated into the shale pore pressure prediction to get the final pore pressure profile.
The fracture gradient was then computed using Matthews & Kelley’s equations (Eq. 9), and the effective stress ratio (K) was calibrated by using the leak-off test results as control to see the minimum and maximum case.
(5)V = Vmatrix
∗(
Vmatrix
− Vmudline
)
e−��e
(6)�v = g
z
∫0
�bZdz
(7)Δtn =(
Δtml
− Δtma
)
e−
z
k + Δtma
(8)Psh= � −
(
� − Ph
)
(
Δtn
Δt0
)n
3752 Journal of Petroleum Exploration and Production Technology (2021) 11:3747–3758
1 3
3D cube modeling
The 1D pore pressure models created using well data and seismic velocities give a good representation of the pressure regime at the well scale which is sparsely located across the field. As these wells are a few kilometers apart, the entire process of pore pressure prediction using seismic velocities would have to be repeated for each future exploration well location. The purpose of 3D modeling is to create cubes of the geopressure data that would give a more cohesive evolution of pore pressure components across the field such that 1D pressure profiles could be extracted from the cube at any prospect or infill well location. Drillworks 3D appli-cation was used to create 3D models of geopressure data from 1D post-drilling and pre-drilling models. Drillworks 3D software converts the 1D interpretation of geopressure data from all wells into 3D models taking into account the spatial distance between these one-point datasets and inter-polating using kriging.
Results and discussion
The results from well log analysis, seismic interpretation and crossplots revealed the origin and causes of overpressure. Normally, geothermal gradient in tertiary sedimentary basin like the Niger Delta is around 3 °C per 100 m of descent
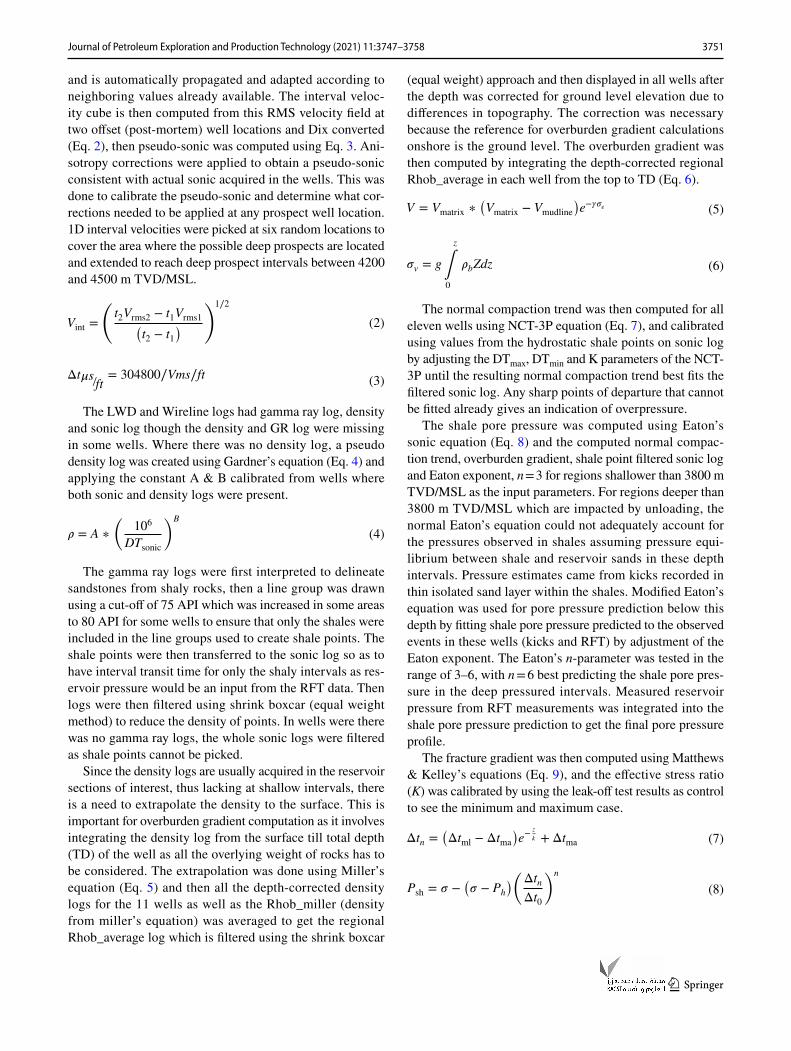
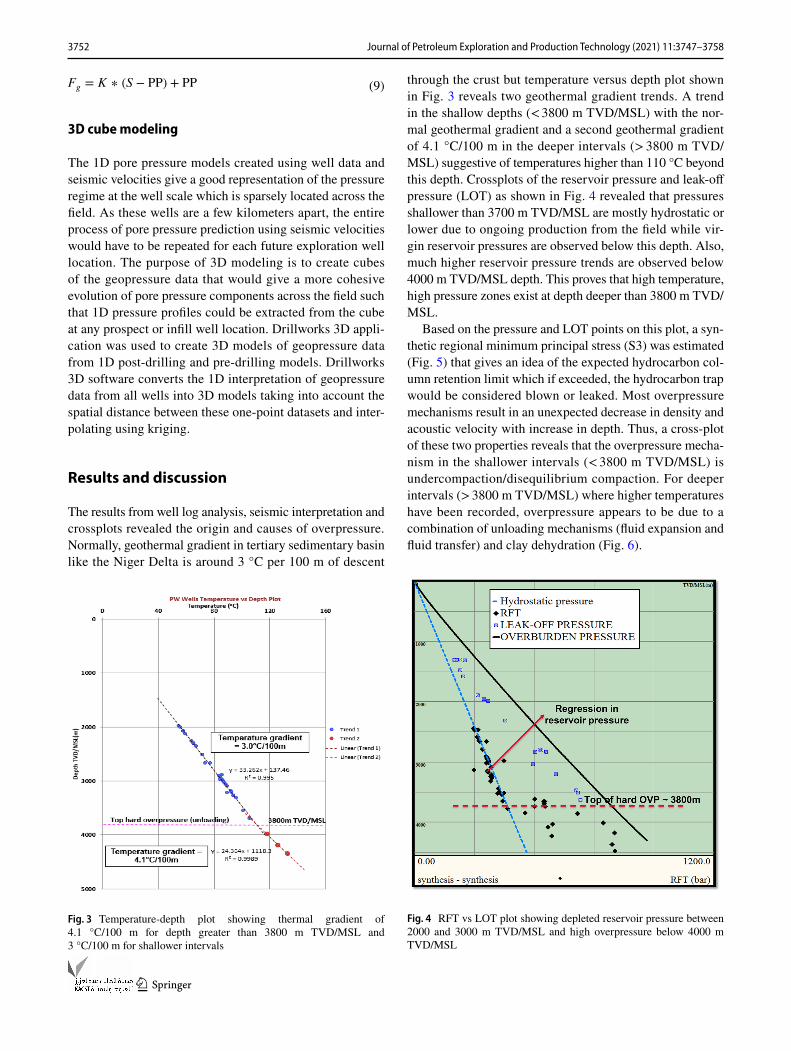
(9)Fg = K ∗ (S − PP) + PP through the crust but temperature versus depth plot shown in Fig. 3 reveals two geothermal gradient trends. A trend in the shallow depths (< 3800 m TVD/MSL) with the nor-mal geothermal gradient and a second geothermal gradient of 4.1 °C/100 m in the deeper intervals (> 3800 m TVD/MSL) suggestive of temperatures higher than 110 °C beyond this depth. Crossplots of the reservoir pressure and leak-off pressure (LOT) as shown in Fig. 4 revealed that pressures shallower than 3700 m TVD/MSL are mostly hydrostatic or lower due to ongoing production from the field while vir-gin reservoir pressures are observed below this depth. Also, much higher reservoir pressure trends are observed below 4000 m TVD/MSL depth. This proves that high temperature, high pressure zones exist at depth deeper than 3800 m TVD/MSL.
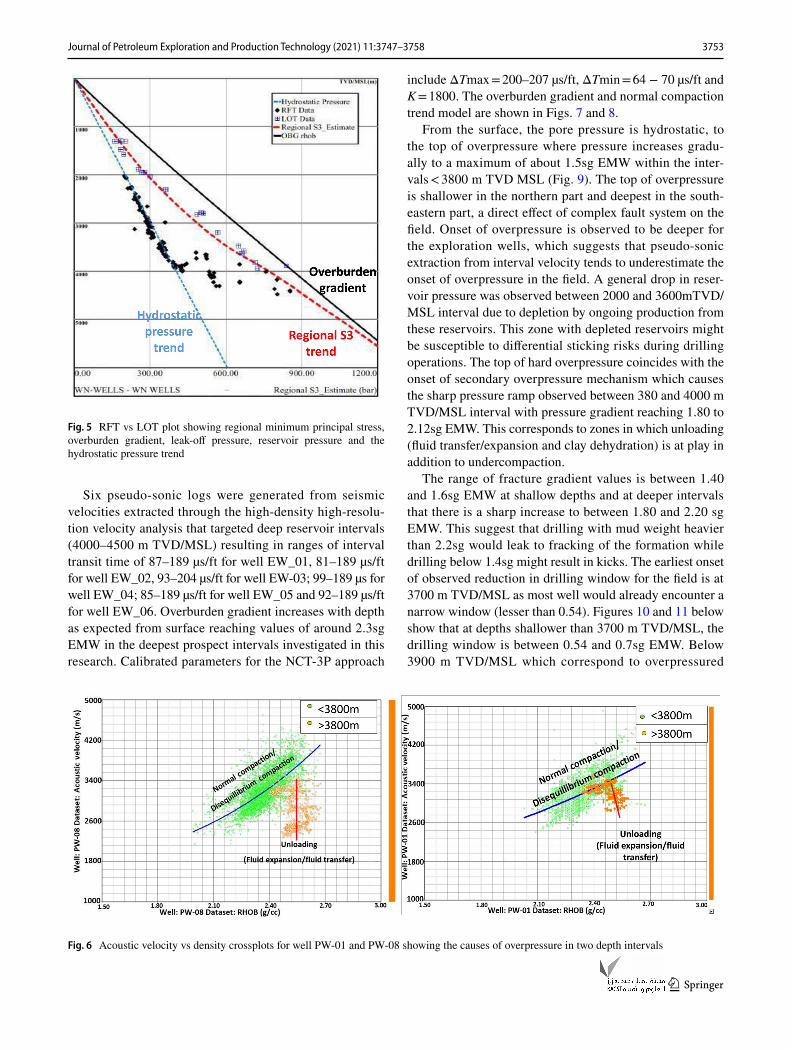
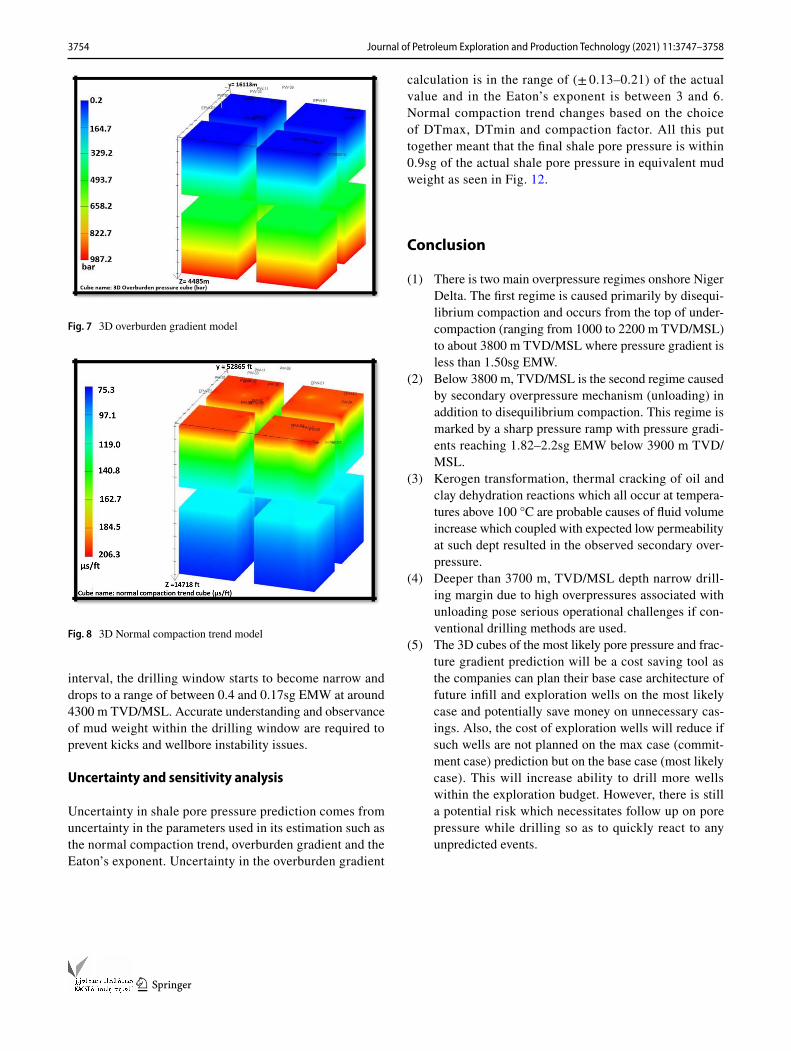
Based on the pressure and LOT points on this plot, a syn-thetic regional minimum principal stress (S3) was estimated (Fig. 5) that gives an idea of the expected hydrocarbon col-umn retention limit which if exceeded, the hydrocarbon trap would be considered blown or leaked. Most overpressure mechanisms result in an unexpected decrease in density and acoustic velocity with increase in depth. Thus, a cross-plot of these two properties reveals that the overpressure mecha-nism in the shallower intervals (< 3800 m TVD/MSL) is undercompaction/disequilibrium compaction. For deeper intervals (> 3800 m TVD/MSL) where higher temperatures have been recorded, overpressure appears to be due to a combination of unloading mechanisms (fluid expansion and fluid transfer) and clay dehydration (Fig. 6).
Fig. 3 Temperature-depth plot showing thermal gradient of 4.1 °C/100 m for depth greater than 3800 m TVD/MSL and 3 °C/100 m for shallower intervals
Fig. 4 RFT vs LOT plot showing depleted reservoir pressure between 2000 and 3000 m TVD/MSL and high overpressure below 4000 m TVD/MSL
3753Journal of Petroleum Exploration and Production Technology (2021) 11:3747–3758
1 3
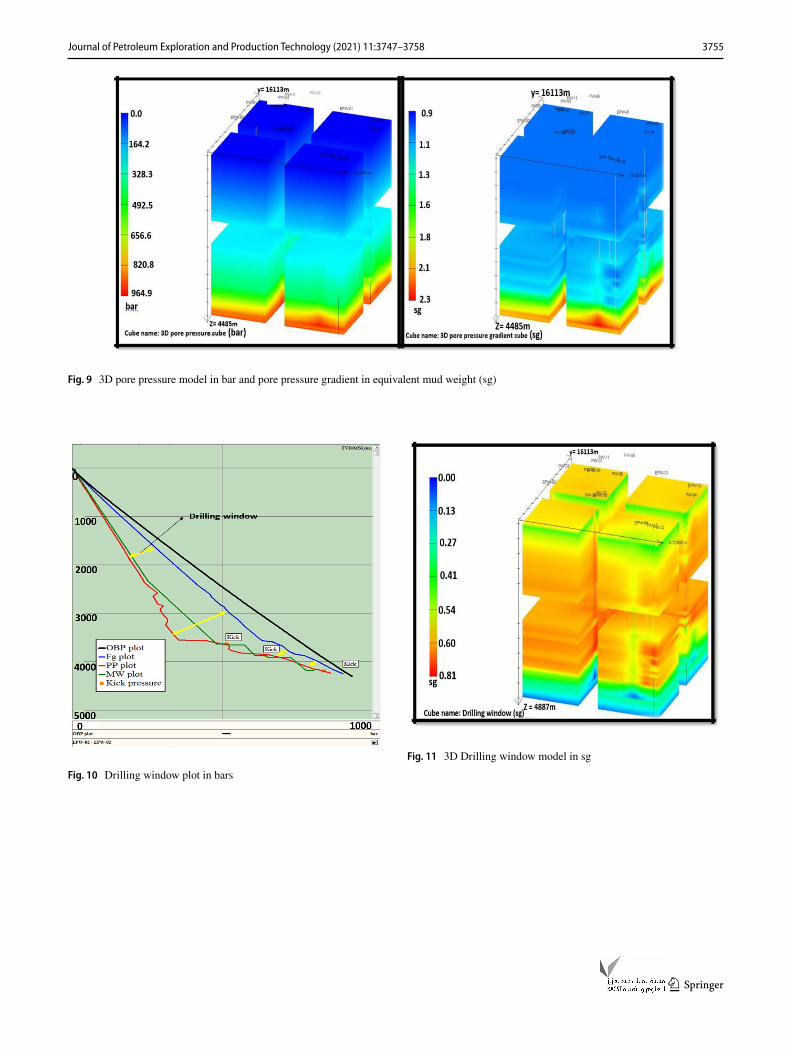
Six pseudo-sonic logs were generated from seismic velocities extracted through the high-density high-resolu-tion velocity analysis that targeted deep reservoir intervals (4000–4500 m TVD/MSL) resulting in ranges of interval transit time of 87–189 µs/ft for well EW_01, 81–189 µs/ft for well EW_02, 93–204 µs/ft for well EW-03; 99–189 µs for well EW_04; 85–189 µs/ft for well EW_05 and 92–189 µs/ft for well EW_06. Overburden gradient increases with depth as expected from surface reaching values of around 2.3sg EMW in the deepest prospect intervals investigated in this research. Calibrated parameters for the NCT-3P approach
include ΔTmax = 200–207 µs/ft, ΔTmin = 64 − 70 µs/ft and K = 1800. The overburden gradient and normal compaction trend model are shown in Figs. 7 and 8.
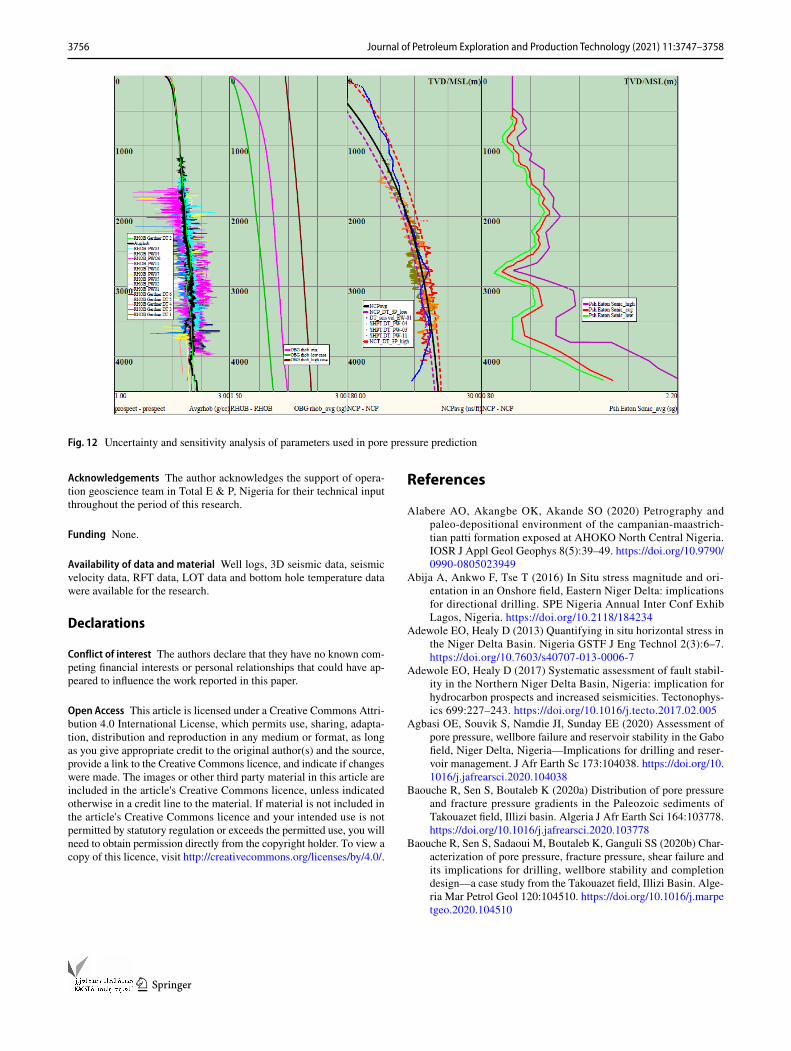
From the surface, the pore pressure is hydrostatic, to the top of overpressure where pressure increases gradu-ally to a maximum of about 1.5sg EMW within the inter-vals < 3800 m TVD MSL (Fig. 9). The top of overpressure is shallower in the northern part and deepest in the south-eastern part, a direct effect of complex fault system on the field. Onset of overpressure is observed to be deeper for the exploration wells, which suggests that pseudo-sonic extraction from interval velocity tends to underestimate the onset of overpressure in the field. A general drop in reser-voir pressure was observed between 2000 and 3600mTVD/MSL interval due to depletion by ongoing production from these reservoirs. This zone with depleted reservoirs might be susceptible to differential sticking risks during drilling operations. The top of hard overpressure coincides with the onset of secondary overpressure mechanism which causes the sharp pressure ramp observed between 380 and 4000 m TVD/MSL interval with pressure gradient reaching 1.80 to 2.12sg EMW. This corresponds to zones in which unloading (fluid transfer/expansion and clay dehydration) is at play in addition to undercompaction.
The range of fracture gradient values is between 1.40 and 1.6sg EMW at shallow depths and at deeper intervals that there is a sharp increase to between 1.80 and 2.20 sg EMW. This suggest that drilling with mud weight heavier than 2.2sg would leak to fracking of the formation while drilling below 1.4sg might result in kicks. The earliest onset of observed reduction in drilling window for the field is at 3700 m TVD/MSL as most well would already encounter a narrow window (lesser than 0.54). Figures 10 and 11 below show that at depths shallower than 3700 m TVD/MSL, the drilling window is between 0.54 and 0.7sg EMW. Below 3900 m TVD/MSL which correspond to overpressured
Fig. 5 RFT vs LOT plot showing regional minimum principal stress, overburden gradient, leak-off pressure, reservoir pressure and the hydrostatic pressure trend
Fig. 6 Acoustic velocity vs density crossplots for well PW-01 and PW-08 showing the causes of overpressure in two depth intervals
3754 Journal of Petroleum Exploration and Production Technology (2021) 11:3747–3758
1 3
interval, the drilling window starts to become narrow and drops to a range of between 0.4 and 0.17sg EMW at around 4300 m TVD/MSL. Accurate understanding and observance of mud weight within the drilling window are required to prevent kicks and wellbore instability issues.
Uncertainty and sensitivity analysis
Uncertainty in shale pore pressure prediction comes from uncertainty in the parameters used in its estimation such as the normal compaction trend, overburden gradient and the Eaton’s exponent. Uncertainty in the overburden gradient
calculation is in the range of (± 0.13–0.21) of the actual value and in the Eaton’s exponent is between 3 and 6. Normal compaction trend changes based on the choice of DTmax, DTmin and compaction factor. All this put together meant that the final shale pore pressure is within 0.9sg of the actual shale pore pressure in equivalent mud weight as seen in Fig. 12.
Conclusion
(1) There is two main overpressure regimes onshore Niger Delta. The first regime is caused primarily by disequi-librium compaction and occurs from the top of under-compaction (ranging from 1000 to 2200 m TVD/MSL) to about 3800 m TVD/MSL where pressure gradient is less than 1.50sg EMW.
(2) Below 3800 m, TVD/MSL is the second regime caused by secondary overpressure mechanism (unloading) in addition to disequilibrium compaction. This regime is marked by a sharp pressure ramp with pressure gradi-ents reaching 1.82–2.2sg EMW below 3900 m TVD/MSL.
(3) Kerogen transformation, thermal cracking of oil and clay dehydration reactions which all occur at tempera-tures above 100 °C are probable causes of fluid volume increase which coupled with expected low permeability at such dept resulted in the observed secondary over-pressure.
(4) Deeper than 3700 m, TVD/MSL depth narrow drill-ing margin due to high overpressures associated with unloading pose serious operational challenges if con-ventional drilling methods are used.
(5) The 3D cubes of the most likely pore pressure and frac-ture gradient prediction will be a cost saving tool as the companies can plan their base case architecture of future infill and exploration wells on the most likely case and potentially save money on unnecessary cas-ings. Also, the cost of exploration wells will reduce if such wells are not planned on the max case (commit-ment case) prediction but on the base case (most likely case). This will increase ability to drill more wells within the exploration budget. However, there is still a potential risk which necessitates follow up on pore pressure while drilling so as to quickly react to any unpredicted events.
Fig. 7 3D overburden gradient model
Fig. 8 3D Normal compaction trend model
3755Journal of Petroleum Exploration and Production Technology (2021) 11:3747–3758
1 3
Fig. 9 3D pore pressure model in bar and pore pressure gradient in equivalent mud weight (sg)
Fig. 10 Drilling window plot in bars
Fig. 11 3D Drilling window model in sg
3756 Journal of Petroleum Exploration and Production Technology (2021) 11:3747–3758
1 3
Acknowledgements The author acknowledges the support of opera-tion geoscience team in Total E & P, Nigeria for their technical input throughout the period of this research.
Funding None.
Availability of data and material Well logs, 3D seismic data, seismic velocity data, RFT data, LOT data and bottom hole temperature data were available for the research.
Declarations
Conflict of interest The authors declare that they have no known com-peting financial interests or personal relationships that could have ap-peared to influence the work reported in this paper.
Open Access This article is licensed under a Creative Commons Attri-bution 4.0 International License, which permits use, sharing, adapta-tion, distribution and reproduction in any medium or format, as long as you give appropriate credit to the original author(s) and the source, provide a link to the Creative Commons licence, and indicate if changes were made. The images or other third party material in this article are included in the article's Creative Commons licence, unless indicated otherwise in a credit line to the material. If material is not included in the article's Creative Commons licence and your intended use is not permitted by statutory regulation or exceeds the permitted use, you will need to obtain permission directly from the copyright holder. To view a copy of this licence, visit http:// creat iveco mmons. org/ licen ses/ by/4. 0/.
References
Alabere AO, Akangbe OK, Akande SO (2020) Petrography and paleo-depositional environment of the campanian-maastrich-tian patti formation exposed at AHOKO North Central Nigeria. IOSR J Appl Geol Geophys 8(5):39–49. https:// doi. org/ 10. 9790/ 0990- 08050 23949
Abija A, Ankwo F, Tse T (2016) In Situ stress magnitude and ori-entation in an Onshore field, Eastern Niger Delta: implications for directional drilling. SPE Nigeria Annual Inter Conf Exhib Lagos, Nigeria. https:// doi. org/ 10. 2118/ 184234
Adewole EO, Healy D (2013) Quantifying in situ horizontal stress in the Niger Delta Basin. Nigeria GSTF J Eng Technol 2(3):6–7. https:// doi. org/ 10. 7603/ s40707- 013- 0006-7
Adewole EO, Healy D (2017) Systematic assessment of fault stabil-ity in the Northern Niger Delta Basin, Nigeria: implication for hydrocarbon prospects and increased seismicities. Tectonophys-ics 699:227–243. https:// doi. org/ 10. 1016/j. tecto. 2017. 02. 005
Agbasi OE, Souvik S, Namdie JI, Sunday EE (2020) Assessment of pore pressure, wellbore failure and reservoir stability in the Gabo field, Niger Delta, Nigeria—Implications for drilling and reser-voir management. J Afr Earth Sc 173:104038. https:// doi. org/ 10. 1016/j. jafre arsci. 2020. 104038
Baouche R, Sen S, Boutaleb K (2020a) Distribution of pore pressure and fracture pressure gradients in the Paleozoic sediments of Takouazet field, Illizi basin. Algeria J Afr Earth Sci 164:103778. https:// doi. org/ 10. 1016/j. jafre arsci. 2020. 103778
Baouche R, Sen S, Sadaoui M, Boutaleb K, Ganguli SS (2020b) Char-acterization of pore pressure, fracture pressure, shear failure and its implications for drilling, wellbore stability and completion design—a case study from the Takouazet field, Illizi Basin. Alge-ria Mar Petrol Geol 120:104510. https:// doi. org/ 10. 1016/j. marpe tgeo. 2020. 104510
Fig. 12 Uncertainty and sensitivity analysis of parameters used in pore pressure prediction
3757Journal of Petroleum Exploration and Production Technology (2021) 11:3747–3758
1 3
Bowers GL (1994) Pore pressure estimation from velocity Data: accounting for overpressuring mechanisms besides undercom-paction. Society of Petroleum Engineers, Tulsa
Bowers GL (1995) Pore pressure estimation from velocity data; accounting for overpressure mechanisms besides undercompac-tion. SPE Drill Complet 10:89–95
Bowers GL (2002) Detecting high overpressure. SEG Publication, The leading edge, pp 174–177
Bowers, G. (2011). Determining an appropriate pore-pressure estima-tion strategy. In: Offshore technology conference, Houston.
Bruce (1984) Smectite dehydration—its relation to structural develop-ment and hydrocarbon accumulation in northern Gulf of Mexico Basin. AAPG Bull 68(6):673–683
Dasgupta S, Chatterjee R, Mohanty SP (2016) Magnitude, mecha-nisms and prediction of abnormal pressure using well data in the Krishna-Godavari Basin East Coast of India. AAPG Bull 100(12):1833–1855
Emudianughe JE, Ogagarue DO (2018) Investigating the subsurface pressure regime of Ada-field in onshore Niger Delta Basin Nige-ria. J Geol Geophys. https:// doi. org/ 10. 4172/ 2381- 8719. 10004 52
Emudianughe JE, Ogagarue DO (2019) Well-based pore pressure vali-dation: a case study of Akos field, coastal depobelt, Niger Delta Basin. FUPRE J Sci Ind Res 3(1):104–111
Emujakporue GO, Enyenihi EE (2020) Identification of seismic attributes for hydrocarbon prospecting of AKOS field, Niger Delta. Niger SN App Sci 2:910. https:// doi. org/ 10. 1007/ s42452- 020- 2570-1
Fertl W (1976) Abnormal formation pressure, implication to explora-tion, drilling and production of oil and gas reservoirs. Elservier, Amsterdam, p 382
Fetrl WH, Timko DH (1972) How down hole temperature, pressure affect drilling part 3: overpressure detection from wireline meth-ods. World Oil 8:36–66
Francis NI, Dosunmu A (2013) Analytical model to predict pore pres-sure in planning high pressure, high temperature (HPHT) wells in Niger Delta. Int J Eng Sci 2(8):50–62
Ganguli SS, Sen S (2020) Investigation of present-day in-situ stresses and pore pressure in the south Cambay Basin, western India: implications for drilling, reservoir development and fault reac-tivation. Mar Petrol Geol 118:104422. https:// doi. org/ 10. 1016/j. marpe tgeo. 2020. 104422
Grauls DJ, Baleix JM (1994) Role of overpressure and in-situ stress in fault-controlled hydrocarbon migration: a case study. Mar Pet Geol 11:734–742
George CO, Thomas SW, John M, Gani A, Emmanuel AK, Norbert AE (2017) Analysis of post-drill pore pressure and fracture gradient model of G-Field, offshore, Niger Delta. In: SPE Nigeria annual international conference and exhibition, Lagos, Nigeria. Doi: https:// doi. org/ 10. 2118/ 189170- MS.
Hall PL, (1993). Mechanisms of overpressuring: an overview, In: Man-ning DAC, Hal PL, Hughes CR, (eds), Geochemistry of clay-pore fluid interactions: London, Chapman and Hall, pp 265–315
Heppard PD, Cander HS, Eggertson EB (1998) Abnormal pressure and the occurrence of hydrocarbons off the east coast of Trini-dad, West Indies. In: Law BE, Ulimshek GF, Slavin VI (eds), Abnormal pressures in hydrocarbon environments, Vol 70 AAPG Memoir, pp 215–246
Hermanrud C, Wensaas L, Tiege GMG, Bolas HMN, Hansen S, Vik E (1988) Shale porosities from well logsbon Haltenbanken (offshore mid-Norway) show no influence of overpressuring. In: Law BE, Ulmishek GF, Salvin VI (eds) Abnormal pressures in hydrocarbon Environments. AAPG, Tulsa, pp 65–85
Hoesni J (2004) Origins of overpressure in the Malay Basin and its influence on petroleum systems, Durham, PhD thesis. University of Durham, UK
Holland DS, Leedy JB, Lammlein DR, (1990). Eugene Island Block 330 field-USA, offshore Louisiana. In: Beaumont EA Foster NH (eds), Structural traps III, tectonic fold and fault traps: AAPG Treatise of Petroleum Geology Atlas of Oil and Gas Fields, pp 103–143.
Hope O (2017) Why drilling projects are mostly unsuccessful in the Niger Delta. Post [LinkedIn page]. LinkedIn Retrieved June 28, 2020, from https:// www. linke din. com/ pulse/ why- drill ing- proje cts- mostly- unsuc cessf ul- niger- delta- okwa-p- eng.
Horsfall OI, Uko ED, Tamunoberetonari I, Omubo-Pepple VB (2017) Rock-physics and seismic-inversion based reservoir characteriza-tion of AKOS field, coastal swamp depobelt, Niger delta. Nigeria IOSR J Appl Geol Geophys 5(4):59–67
Lahann RW, Lahann C, McCarty D, Hseih J (2001) Influence of clay diagenesis on shale velocities and fluid pressure. In: Offshore tech-nology conference, Houston
Lahann RW, Swarbrick RE (2011) Overpressure generation by load transfer following shale frameworkweakening due to smectite diagenesis. Geofluids 11:362–375
Li Y, Qui N, Xie Z, Yao Q, Zhu C (2016) Overpressure compart-ments in the central paleo-uplift. Sichuan China AAPG Bull 100(5):867–888
Nehring R, (1991). Oil and gas resources. In: Salvador A (ed.) The Gulf of Mexico Basin: deacde of North American geology. Geology Society of America, pp 445–495
Nwankwo CN, Kalu SO (2016) Integrated approach to pore pres-sure and fracture pressure prediction using well logs: case study of onshore Niger-Delta sedimentary Basin. Open J Geol 6:1279–1295
O’Conner S, Swarbrick RE, Lahann RW (2011) Geologically driven pore fluid pressure models and their implications for petroleum exploration. Intro Thematic Set Geofluids 11(4):343–348
Ola PS, Alabere AO (2018) Reservoir characterization and structural mapping of UVO field, Onshore Niger Delta using well logs and 3-D seismic data. J Sci Eng Res 5(6):17–24
Ola PS, Aghomon JO, Alabere AO (2021) Sequence stratigraphy and petrophysical analysis of ‘Aje’ field, offshore Niger Delta. J Sci Eng Res 8(4):1–12
Osborne MJ, Swarbrick RE (1997) Mechanisms for generating overpressure in sedimentary basins: re-evaluation. AAPG Bull 81:1023–1041
Oweh BN, Uko ED, Tamunobereten-ari I, Ngah SS (2017) Mapping of overpressured zones in Coastal Swamp Depobelt of Niger Delta Nigeria, using well log and seismic data. Mediterr J Basic Appl Sci 1(1):164–183
Radwan AE, Sen S, (2020) Stress path analysis for characterization of in situ stress state and effect of reservoir depletion on present-day stress magnitudes: reservoir geomechanical modeling in the Gulf of suez rift basin, Egypt. Natural Resour Res. Doi: https:// doi. org/ 10. 1007/ s11053- 020- 09731-2
Reginald-Ugwuadu OG, Alabi TI, Eze JO, Ebisike RC (2014) Fracture gradient estimation in the Niger Delta—a practical and statistical approach. SPE Niger Annu Int Conf Exhi, Lagos, Nigeria. https:// doi. org/ 10. 2118/ 172481
Sen S, Ganguli SS, (2019) Estimation of pore pressure and fracture gradient in volve field, Norwegian North Sea. In: SPE oil and gas india conference and exhibition. doi: https:// doi. org/ 10. 2118/ 194578.
Swarbrick RE, Osborne MJ, Yardley GS, (2002). Comparison of Over-pressure Magnitude Resulting from the Main Generating Mecha-nisms. In: Huffman AR and GL Bowers (eds). Pressure regimes in sedimentary basins and their prediction. Vol 76 AAPG Memoir, pp. 1–12
Swarbrick RE (2012) Review of pore-pressure prediction challenges in high-temperature areas. Lead Edge 31(11):1288–1294. https:// doi. org/ 10. 1190/ tle31 111288.1.
3758 Journal of Petroleum Exploration and Production Technology (2021) 11:3747–3758
1 3
Teige CMG, Hermanrud C, Wensaas L, Bolas HMN (1999) The lack of relationship between overpressure and porosity in North Sea and Haltenbanken shales. Mar Petrol Geol 16:321–335
Tingay MRP, Hillis RR, Swarbrick RE, Morley CK, Damit AR (2009) Origin of overpressure and pore pressure prediction in the Baram Delta Province. Brunei AAPG Bull 93(1):51–74
Tingay MRP, Morley CK, Laird A, Limpornpipat O, Krisadasima K, Pabchanda S, Macintyre HR (2013) Evidence for overpressure generation by kerogen-to-gas maturation in the northern Malay Basin. AAPG Bull 97(4):639–672
Udo KI, George NJ, Akankpo AO, Azuoko G-B, Aka MU (2020) Determining fracture pressure gradients from well logs. Int J Adv Geosci 81(1):5–9
Ugwu SA, Nwankwo CN (2014) Integrated approach to geopressure detection in the X-field, Onshore Niger Delta. J Pet Explor Prod Technol 4:215–231. https:// doi. org/ 10. 1007/ s13202- 013- 0088-4
Umar BA, Gholami R, Nayak P, Shah AA, Adamu H (2020) Regional and field assessments of potentials for geological storage of CO2:
a case study of the Niger Delta Basin. Nigeria J Nat Gas Sci Eng 77:103195. https:// doi. org/ 10. 1016/j. jngse. 2020. 103195
Yardley GS, Swarbrick RE (2000) Lateral transfer: A source of extreme overpressure? Mar Pet Geol 17(4):523–537. https:// doi. org/ 10. 1016/ S0264- 8172(00) 00007-6
Zhao J, Jun L, Zeyang X (2018) Advances in the origin of overpres-sures in sedimentary basins. J Pet Res 3:1–24. https:// doi. org/ 10. 1016/j. ptlrs. 2018. 03. 007
Zhang FQ, Wang ZL, Song Y (2011) The new method of quantitative evaluation on pressurization according to tectonic compression in Kuqa depression. J China Uni of Pet (edition of Natural Sci-ence) 35(4):1–7
Zhang J (2013) Borehole stability analysis accounting for anisotro-pies in drilling to weak bedding planes. Int J Rock Mech Min Sci 60:160–170. https:// doi. org/ 10. 1016/j. ijrmms. 2012. 12. 025
Publisher's Note Springer Nature remains neutral with regard to jurisdictional claims in published maps and institutional affiliations.