Population structure and migration pattern of a conifer ... in western North America and genotyped...
16
Population structure and migration pattern of a conifer pathogen, Grosmannia clavigera, as influenced by its symbiont, the mountain pine beetle CLEMENT K. M. TSUI,* AMANDA D. ROE,† YOUSRY A. EL-KASSABY,* ADRIANNE V. RICE,† SEPIDEH M. ALAMOUTI,‡ FELIX A. H. SPERLING,† JANICE E. K. COOKE,† JO ¨ RG BOHLMANN*,§ and RICHARD C. HAMELIN*, – *Department of Forest Sciences, The University of British Columbia, Vancouver, British Columbia, Canada V6T 1Z4, †Department of Biological Sciences, University of Alberta, Edmonton, Alberta, Canada T6G 2E9, ‡Department of Wood Science, The University of British Columbia, Vancouver, British Columbia, Canada V6T 1Z4, §Michael Smith Laboratory, The University of British Columbia, Vancouver, British Columbia, Canada V6T 1Z4, –Natural Resources Canada, Laurentian Forestry Centre, 1055 du P.E.P.S., Que ´bec City, Que ´bec, Canada G1V 4C7 Abstract We investigated the population structure of Grosmannia clavigera (Gc), a fungal symbiont of the mountain pine beetle (MPB) that plays a crucial role in the establishment and reproductive success of this pathogen. This insect–fungal complex has destroyed over 16 million ha of lodgepole pine forests in Canada, the largest MPB epidemic in recorded history. During this current epidemic, MPB has expanded its range beyond historically recorded boundaries, both northward and eastward, and has now reached the jack pine of Alberta, potentially threatening the Canadian boreal forest. To better understand the dynamics between the beetle and its fungal symbiont, we sampled 19 populations in western North America and genotyped individuals from these popula- tions with eight microsatellite markers. The fungus displayed high haplotype diversity, with over 250 unique haplotypes observed in 335 single spore isolates. Linkage equilibria in 13 of the 19 populations suggested that the fungus reproduces sexually. Bayesian clustering and distance analyses identified four genetic clusters that corresponded to four major geographical regions, which suggested that the epidemic arose from multiple geographical sources. A genetic cluster north of the Rocky Mountains, where the MPB has recently become established, experienced a population bottleneck, probably as a result of the recent range expansion. The two genetic clusters located north and west of the Rocky Mountains contained many fungal isolates admixed from all populations, possibly due to the massive movement of MPB during the epidemic. The general agreement in north–south differentiation of MPB and G. clavigera populations points to the fungal pathogen’s dependence on the movement of its insect vector. In addition, the patterns of diversity and the individual assignment tests of the fungal associate suggest that migration across the Rocky Mountains occurred via a northeastern corridor, in accordance with meteorological patterns and observation of MPB movement data. Our results highlight the potential of this pathogen for both expansion and sexual reproduction, and also identify some possible barriers to gene flow. Understanding the ecological and evolutionary dynamics of this fungus–beetle association is important for the modelling and prediction of MPB epidemics. Keywords: approximate Bayesian computation, demography, fungi, insect dispersal, landscape, migration, population genetics, symbiosis, vector Received 21 June 2011; revision received 16 September 2011, 7 October 2011; accepted 16 October 2011 Correspondence: Richard Hamelin, Fax: (+1) 604 822 9102; E-mail: [email protected] Ó 2011 Crown in the right of Canada Molecular Ecology (2012) 21, 71–86 doi: 10.1111/j.1365-294X.2011.05366.x
-
Upload
nguyenkien -
Category
Documents
-
view
214 -
download
2
Transcript of Population structure and migration pattern of a conifer ... in western North America and genotyped...

Molecular Ecology (2012) 21, 71–86 doi: 10.1111/j.1365-294X.2011.05366.x
Population structure and migration pattern of a coniferpathogen, Grosmannia clavigera, as influencedby its symbiont, the mountain pine beetle
CLEMENT K. M. TSUI , * AMANDA D. ROE,† YOUSRY A. EL-KASSABY,* ADRIANNE V. RICE,†
SEPIDEH M. ALAMOUTI ,‡ FELIX A. H. SPERLING,† JANICE E. K. COOKE,† JORG
BOHLMANN*,§ and RICHARD C. HAMELIN*,–
*Department of Forest Sciences, The University of British Columbia, Vancouver, British Columbia, Canada V6T 1Z4,
†Department of Biological Sciences, University of Alberta, Edmonton, Alberta, Canada T6G 2E9, ‡Department of Wood Science,
The University of British Columbia, Vancouver, British Columbia, Canada V6T 1Z4, §Michael Smith Laboratory, The
University of British Columbia, Vancouver, British Columbia, Canada V6T 1Z4, –Natural Resources Canada, Laurentian
Forestry Centre, 1055 du P.E.P.S., Quebec City, Quebec, Canada G1V 4C7
Corresponde
E-mail: richa
� 2011 Crow
Abstract
We investigated the population structure of Grosmannia clavigera (Gc), a fungal
symbiont of the mountain pine beetle (MPB) that plays a crucial role in the establishment
and reproductive success of this pathogen. This insect–fungal complex has destroyed
over 16 million ha of lodgepole pine forests in Canada, the largest MPB epidemic in
recorded history. During this current epidemic, MPB has expanded its range beyond
historically recorded boundaries, both northward and eastward, and has now reached the
jack pine of Alberta, potentially threatening the Canadian boreal forest. To better
understand the dynamics between the beetle and its fungal symbiont, we sampled 19
populations in western North America and genotyped individuals from these popula-
tions with eight microsatellite markers. The fungus displayed high haplotype diversity,
with over 250 unique haplotypes observed in 335 single spore isolates. Linkage equilibria
in 13 of the 19 populations suggested that the fungus reproduces sexually. Bayesian
clustering and distance analyses identified four genetic clusters that corresponded to
four major geographical regions, which suggested that the epidemic arose from multiple
geographical sources. A genetic cluster north of the Rocky Mountains, where the MPB
has recently become established, experienced a population bottleneck, probably as a
result of the recent range expansion. The two genetic clusters located north and west of
the Rocky Mountains contained many fungal isolates admixed from all populations,
possibly due to the massive movement of MPB during the epidemic. The general
agreement in north–south differentiation of MPB and G. clavigera populations points to
the fungal pathogen’s dependence on the movement of its insect vector. In addition, the
patterns of diversity and the individual assignment tests of the fungal associate suggest
that migration across the Rocky Mountains occurred via a northeastern corridor, in
accordance with meteorological patterns and observation of MPB movement data. Our
results highlight the potential of this pathogen for both expansion and sexual
reproduction, and also identify some possible barriers to gene flow. Understanding the
ecological and evolutionary dynamics of this fungus–beetle association is important for
the modelling and prediction of MPB epidemics.
Keywords: approximate Bayesian computation, demography, fungi, insect dispersal, landscape,
migration, population genetics, symbiosis, vector
Received 21 June 2011; revision received 16 September 2011, 7 October 2011; accepted 16 October 2011
nce: Richard Hamelin, Fax: (+1) 604 822 9102;
n in the right of Canada

72 C. K. M. T SUI E T A L.
Introduction
The mountain pine beetle (Dendroctonus ponderosae;
MPB) is a native destructive pest that is distributed
from northern Mexico to central British Columbia (BC),
southwestern Alberta (AB), the Cypress Hills of south-
western Saskatchewan and most of the western United
States (Carroll et al. 2004). The MPB normally attacks a
few damaged or suppressed trees, and the infestation
follows a cyclical pattern, but it occasionally erupts into
large-scale outbreaks (Carroll et al. 2004; Safranyik et al.
2010). The MPB epidemic that started in late 1990s has
destroyed over 16 million ha of pine forests in western
Canada and is by far the largest in recorded history.
The impact of the current epidemic is unprecedented
and has led to substantial economical losses and ecolog-
ical damage (Kurz et al. 2008). Climate change com-
bined with fire suppression and the availability of
mature and over-mature lodgepole pine populations
(i.e. of susceptible age) are thought to have created
ideal conditions that could explain the magnitude of
the current epidemic and population expansion (Stahl
et al. 2006; Kurz et al. 2008; Raffa et al. 2008). The MPB
primarily attacks lodgepole pine (Pinus contorta Dougl.
ex Loud. var. latifolia Engelm.), but its host range
encompasses other pines, such as jack pine (Pinus bank-
siana Lamb.), western white pine (Pinus monticola
Dougl. ex D. Don), whitebark pine (Pinus albicaulis Eng-
elm.) and ponderosa pine (Pinus ponderosa Dougl. ex
Laws.) as well as natural hybrids between lodgepole
and jack pines (Safranyik & Carroll 2006; Rice et al.
2007; Rice & Langor 2009; Cullingham et al. 2011). The
beetles have also killed conifers in several US states,
such as Colorado, Idaho and Montana (Carroll et al.
2004; Mock et al. 2007).
The Chilcotin Plateau in south-central BC has sus-
tained a long period of consecutive MPB epidemics,
with reports in the early 1900s, 1960s and mid-1970s
to mid-1980s (Safranyik & Carroll 2006). Modelling
approaches suggest that the current epidemic may
have started in west-central BC, near Tweedsmuir Pro-
vincial Park, during the late 1990s, but that multiple
MPB populations have erupted in synchrony in several
regions of BC (Aukema et al. 2006). The MPB popula-
tion genetics analyses support the hypothesis of multi-
ple regional eruptions as opposed to its spread from
an epicenter (Bartell et al. 2008). During the past dec-
ade, the MPB population has expanded from west-
central BC to northern BC and from eastward to
northwestern AB and the eastern slopes of the north-
ern Rocky Mountains (Taylor et al. 2006; Safranyik
et al. 2010).
The MPB form a symbiotic relationship with several
species of ophiostomatoid blue-stain fungi (Harrington
1993; Six & Klepzig 2004; Lee et al. 2006). These fungi
are adapted to dissemination by the MPB as they pro-
duce small, sticky spores on the apices of long-necked
sexual and asexual fruiting structures that line the gal-
leries and pupal chambers of the beetles (Harrington
1993; Six & Klepzig 2004). Spores are acquired and
transmitted by the MPB through their mycangia and on
their exoskeleton before their emergence to infest new
trees (Harrington 1993; Six 2003; Safranyik & Carroll
2006). During successful attacks on host trees, MPB
adults tunnel under the bark to feed and lay eggs,
simultaneously introducing blue-stain fungi into the
tree (Klepzig & Six 2004; Safranyik 2004; Safranyik &
Carroll 2006). The combined effects of blue-stain fungal
colonization and the mass attack of MPB and subse-
quent larval feeding can kill a tree in a few months
(Klepzig & Six 2004).
Grosmannia clavigera (Ophiostomatales, Ascomycetes)
is the most aggressive fungus commonly associated
with MPB (Solheim & Krokene 1998; Lee et al. 2006;
Rice et al. 2007; Roe et al. 2011a). Its spores germinate
quickly and grow rapidly in the host tree phloem
and sapwood, eventually blocking the host tree’s
water transport system and producing melanin that
discolors the phloem and sapwood of the tree (Yam-
aoka et al. 1995; Solheim & Krokene 1998). The gen-
ome sequence of G. clavigera lineage Gs (sensu
Alamouti et al. 2011) is providing novel information
about the role of this fungus in its interactions with
the host, the symbiotic vector and the environment
(DiGuistini et al. 2011). For example, G. clavigera con-
tributes to the detoxification of terpenes produced by
the pine for defence, and can use terpenes as a sole
source of carbon, suggesting that the fungus plays a
role in tree–MPB interaction beyond occluding tra-
cheid water transport (DiGuistini et al. 2007, 2011). In
addition, G. clavigera was found to be able to utilize
monoterpenes as a sole source of carbon (DiGuistini
et al. 2011).
As mating experiments have been unsuccessful in the
laboratory and fruiting bodies are rarely observed in
the field (Six & Paine 1999; Lee et al. 2003), there are
still unanswered questions about the occurrence and
frequency of sexual reproduction in this fungus in nat-
ure. The genome sequence revealed that a single mating
type allele was present in the sequenced strain, suggest-
ing that the fungus is heterothallic and has two mating
types in the populations (DiGuistini et al. 2011). The
presence of the repeat-induced point mutation (RIP)
genome defence mechanism suggested that meiosis
occurs and that the fungus’ sexual cycle is active
(DiGuistini et al. 2011). Multilocus sequence analysis
also indicated the presence of recombination within the
species (Alamouti et al. 2011), as well as the presence of
� 2011 Crown in the right of Canada

POPULATI ON GE NETICS OF A C ONIFER PATHOGEN 73
distinct lineages on different hosts (Alamouti et al.
2011).
Given the known and potential roles of G. clavigera in
MPB–host interactions, obtaining a better knowledge of
its biology is important. In particular, a thorough investi-
gation of the fungal symbiont’s genetic structure could
help with understanding of some characteristics of the
epidemic, such as founder effects, specialization, frag-
mentation and reproduction, and this knowledge could
translate into better epidemic prediction. Previous stud-
ies have revealed basic information on the genetic struc-
ture of G. clavigera populations across some portions of
its geographical range. Using amplified fragment length
polymorphism (AFLP), G. clavigera was demonstrated to
have two genetically distinct populations in MPB epi-
demic areas (Lee et al. 2007). Multilocus sequence also
revealed differentiation in the northern and southern
populations of the Rocky Mountains (Roe et al. 2011b).
Its abundance appeared to drop with increasing latitude
(Roe et al. 2011a). As MPB is the vector of G. clavigera, it
could be hypothesized that MPB dynamics and MPB
population structure affect G. clavigera distribution
and ⁄ or population structure. Indeed, the pattern of
northern and southern populations of G. clavigera identi-
fied in these studies is concordant with the dominant
pattern of MPB population structure (Bartell et al. 2008).
The aim of the present study was to investigate the
population structure of G. clavigera using previously
developed microsatellite markers (Tsui et al. 2009a) to
infer the distribution pattern, geographical origin and
movement of the populations, as well as the extent to
which the pathogen population structure is influenced
by MPB movement. We predicted that the genetic struc-
ture of G. clavigera within the current outbreak would
be consistent with the multiple eruptions scenario of
the present MPB epidemic, and that bottlenecks would
be observed in newly established populations. We also
used approximate Bayesian computation (ABC) to con-
struct the demographic histories of major populations,
and to compare competing scenarios that gave rise to
the epidemic population in north western AB.
Material and methods
Fungal isolates
A total of 335 single spore isolates of Grosmannia
clavigera lineage Gs from BC, AB (Canada), Idaho and
Montana (USA) were included in this study (Table 1).
Fungi were isolated and obtained from MPB or their
galleries within infected lodgepole pine trees from 19
locations (Fig. 1). All cultures were isolated between
2002 and 2008 according to the methods outlined in Lee
et al. (2007) and Roe et al. (2011b).
� 2011 Crown in the right of Canada
DNA extraction, PCR and microsatellite genotyping
The DNA was extracted following protocols described
in Lee et al. (2007) and Roe et al. (2010, 2011b). Eight
simple sequence repeat (SSR) loci (SSR10, SSR18, SSR
26, SS45, SSR47, SSR51-53) were amplified (see Tsui
et al. 2009a for primer sequences and running condi-
tions). The PCR amplifications were carried out in
10 lL reactions with fluorescent labelled primers, geno-
typed on a LI-COR 4200 DNA analyser and scored
using LI-COR SAGA software 2 as previously described
(Tsui et al. 2009a). The strain SL KW-1407, used for full
genome sequencing (DiGuistini et al. 2011), was
included in every PCR plate to ensure genotyping and
scoring consistency across runs.
Population genetics analyses
Genetic polymorphism was assessed for each micro-
satellite locus across the populations by calculating
the number of alleles and genetic diversity using Gen-
AlEx6 (Peakall & Smouse 2005). The number of
unique multilocus haplotypes per geographical popu-
lation was determined to quantify the proportion of
individuals that belonged to the same clonal lineages.
The data set was subsequently clone-corrected, such
that multilocus haplotypes occurring more than once
in a population were removed, resulting in a data set
containing only unique multilocus haplotype per geo-
graphical location. All subsequent analyses were
based on this clone-corrected data set to ensure that
the estimation of allele frequencies would not be
influenced by the over-representation of clones
(McDonald 1997).
The index of association (IA) was computed to test for
random mating in the population using Multilocus 1.3b
(Agapow & Burt 2001). The IA is a measure of the mul-
tilocus linkage disequilibrium, which gives information
on whether individuals sharing the same allele at one
locus are more likely to share the same allele at another
locus. The IA approaches zero for outcrossing popula-
tions when there is no linkage disequilibrium (Maynard
Smith et al. 1993) and increases as linkage disequilib-
rium increases in asexual or inbreeding populations.
The null hypothesis of complete panmixia was tested
by comparing the observed data set with 500 random-
ized data sets (Agapow & Burt 2001).
Population structure
The population structure of G. clavigera was investi-
gated using various approaches. First, three analytical
tools utilizing Bayesian clustering algorithms (TESS,
STRUCTURE, and BAPS) were used to infer population

Table 1 Summary information on the 19 populations of Grosmannia clavigera, including sampling locations and time, host origin,
N (sample size), He (genetic diversity), allelic richness and IA (index of association)
Code
Population (location,
Province or State) Host origin
Year of
isolation N Haplotypes H (SE)
Allelic
richness (SE) IA† (P value)
H Houston, BC Pinus contorta 2003 19 16 0.402 (0.09) 2.875 (0.479) 0.225 (0.118)
FSJ Fort St. James, BC P. contorta 2003 27 23 0.4 (0.109) 3.000 (0.463) 0.032 (0.390)
TUR Tumbler Ridge, BC P. contorta ⁄ P.
contorta · Pinus
banksiana hybrids
2007 ⁄ 2008 14 13 0.538 (0.089) 3.125 (0.515) 0.288 (0.034)*
FAR Fairview, AB P. contorta ⁄ P.
contorta · P.
banksiana hybrids
2007 15 11 0.504 (0.09) 3.000 (0.5) 0.169 (0.190)
GRP Grande Prairie, AB P. contorta ⁄ P.
contorta · P.
banksiana hybrids
2007 ⁄ 2008 22 20 0.51 (0.102) 3.625 (0.653) )0.066 (0.722)
FCR Fox Creek, AB P. contorta ⁄ P.
contorta · P.
banksiana hybrids
2007 ⁄ 2008 13 12 0.534 (0.1) 3.375 (0.565) 0.077 (0.350)
KAK Kakwa, AB P. contorta 2007 ⁄ 2008 19 17 0.542 (0.088) 3.625 (0.596) 0.175 (0.108)
VAL Valemount, BC P. contorta 2007 ⁄ 2008 8 8 0.567 (0.094) 3.250 (0.559) )0.348 (0.940)
WL Williams Lake, BC P. contorta 2003 16 15 0.45 (0.11) 3.125 (0.515) 0.464 (0.004)**
MP Manning Park, BC P. contorta 2003 27 19 0.43 (0.081) 3.755 (0.532) 0.011 (0.458)
GOL Golden, BC P. contorta 2007 ⁄ 2008 8 8 0.538 (0.067) 3.000 (0.378) )0.343 (0.924)
YOH Yoho, BC P. contorta 2007 ⁄ 2008 8 7 0.522 (0.053) 2.625 (0.263) 0.640 (0.0260)*
BAN Banff, AB P. contorta 2003 25 20 0.568 (0.055) 3.500 (0.627) 0.355 (0.002)**
CAN Canmore, AB P. contorta 2007 ⁄ 2008 44 39 0.572 (0.053) 4.000 (0.707) )0.017 (0.588)
CYH Cypress Hills, AB P. contorta 2007 ⁄ 2008 5 5 0.456 (0.07) 2.000 (0.189) )0.218 (0.766)
SPA Sparwood, BC P. contorta 2007 ⁄ 2008 9 7 0.604 (0.045) 2.750 (0.366) )0.097 (0.540)
CPA Crowsnest Pass, AB P. contorta 2007 ⁄ 2008 9 9 0.49 (0.103) 3.125 (0.515) )0.519 (0.900)
HV Hidden Valley, MT Dendroctonus
ponderosae
2003 20 20 0.58 (0.056) 3.750 (0.559) 0.325 (0.006)**
HR Hell Roaring, ID D. ponderosae 2002 27 24 0.537 (0.077) 4.000 (0.535) 0.419 (0.006)**
Total 335 293 0.513 (0.019) 3.217 (0.118) 0.065 (0.005)**
†The null hypothesis of random association of alleles in random mating (IA = 0) was tested by comparing the observed value of the
statistic with that obtained after 500 randomizations to simulate distribution (*P value <0.05; **P value <0.01).
74 C. K. M. T SUI E T A L.
structure and genetic clustering of the 19 geographical
populations. These computational methods have
emerged as very useful tools in population genetics and
molecular ecology studies (Beaumont & Rannala 2004).
We used these methods simultaneously as they have
different prior distributions and assumptions and we
wished to compare and evaluate the robustness of the
resulting genetic clusters and population structuring.
The TESS 2.3 (Francois et al. 2006) was used to esti-
mate the number of genetic clusters (K) present in the
data by incorporating geographical coordinates of indi-
viduals as prior information to detect discontinuities in
allele frequencies. We used an admixture model with a
burn-in of 10 000 iterations followed by the recom-
mended 60 000 iterations from which estimates were
obtained. We initially performed five independent runs
on each number of clusters K (K = 2 ) 11) with spatial
interaction influence w at 0.6 (default value). The opti-
mal value of K was determined by the lowest value of
the deviance information criterion (DIC), and then we
performed 10 independent runs of optimal K with wranging from 0.01 to 0.9. Data from TESS were plotted
graphically using the software DISTRUCT (Rosenberg
2004) with the optimal value of K.
The STRUCTURE 2.3.2 was also used to study the affilia-
tion of individual isolates from sampling locations to
specific clusters and test for admixture (Pritchard et al.
2000). The STRUCTURE uses a Bayesian Monte Carlo Mar-
kov Chain (MCMC) approach to cluster individuals into
K distinct populations that minimize Hardy–Weinberg
disequilibrium and gametic phase disequilibrium
between loci within groups, with the option of includ-
ing prior information on the spatial location of popula-
tions (Pritchard et al. 2000; Hubisz et al. 2009). The
model allowed individuals to have mixed ancestry
(admixture) and correlated allele frequencies. The num-
ber of clusters K was set from 1 to 11, with each K repli-
cated 10 times after a burn-in period of 100 000
� 2011 Crown in the right of Canada

H
FSJ
TUR
FAR
GRP
FCR
KAK
VAL
WL
MP
GOLYO
BAN
CAN
CYHSPACPA
HV
HR
‘SBC’
‘NBC’
‘NORTH’
‘ROCKY’
Houston
Fort St. James
Fox Creek
Fairview
Kakwa
Valemount
Williams Lake
Manning Park
Banff
Canmore
Cypress Hill
Tumbler Ridge
YohoGolden
Hell Roaring
Hidden Valley
Sparwood Crowsnest Pass
Grande Prairie
British Columbia Alberta
Montana
Idaho
(a) (b)
Fig. 1 Population structure of Grosmannia clavigera based on eight microsatellites using TESS, and sampling location of the 19 popula-
tions. (a) Each horizontal bar represents the assignment of fungal isolates (based on membership coefficient) from various sampling
locations to each of the four optimal clusters (‘NBC’, ‘North’, ‘SBC’, ‘Rocky’) identified with Bayesian inference software TESS. Black
lines separate isolates sampled from different locations. (b) Map showing all sampling locations.
POPULATI ON GE NETICS OF A C ONIFER PATHOGEN 75
generations followed by 600 000 generations to check
for convergence of likelihood values for each K value.
We used the spatial sampling location of each popula-
tion as prior and the admixture model in which the
fraction of ancestry from each cluster was estimated for
each individual. To estimate the optimal value of K, DK
was computed (Evanno et al. 2005) using Structure Har-
vester (http://taylor0.biology.ucla.edu/struct_harvest/).
The BAPS v. 5.2 uses a stochastic optimization proce-
dure rather than the MCMC implemented in STRUCTURE
and TESS (Corander et al. 2003). We used the ‘clustering
of group’ option in BAPS, in which clusters are formed by
assembling all the populations with or without the spa-
tial information of each sampling population. The pro-
gram was run for each number of clusters K ranging
from 2 to 19, with five replicates for each value. The out-
� 2011 Crown in the right of Canada
put of BAPS was also used to perform an admixture anal-
ysis to determine individual coefficients of ancestry with
regard to the inferred clusters of samples. For the admix-
ture analysis, 100 iterations were used to estimate the
admixture coefficient for individuals. We also used 100
reference individuals from each cluster, and we repeated
the admixture analysis 50 times per individual.
Nei’s unbiased genetic distance (Nei 1978) was calcu-
lated among all pairs of sampling populations and visu-
alized by Principal Coordinates Analysis (PCoA) with
GenAlEx6. Based on Nei’s unbiased genetic distance
(Nei 1978), a neighbour joining (NJ) tree was con-
structed using PHYLIP (Felsenstein 2002). One hundred
bootstrap pseudoreplicates were obtained with Micro-
satellite Analyser (MSA) (Dieringer & Schlotterer 2002),
and the tree was generated with Neighbour and Consense
76 C. K. M. T SUI E T A L.
implemented in PHYLIP (Felsenstein 2002) to evaluate the
robustness of clustering among populations.
Genetic differentiation was calculated using an analy-
sis of molecular variance (AMOVA) with ARLEQUIN v. 3.11
(Excoffier et al. 2005). The statistical significance of u-
statistics was tested based on 1023 permutations
(default). The level of genetic differentiation among
G. clavigera populations was also quantified using FST
(Weir & Cockerham 1984). Pairwise FST was calculated
and evaluated using a randomization test with 1000
iterations using ARLEQUIN v. 3.11 (Excoffier et al. 2005).
Spatial analysis of molecular variance (SAMOVA) was
used to define groups of populations that were geograph-
ically homogeneous and maximally differentiated from
each other (Dupanloup et al. 2002). The method uses a
simulated annealing procedure to divide the n sampled
populations into K group to find the composition of the K
groups and to maximize the proportion of total genetic
variance due to differences between groups (FCT) of
populations (Dupanloup et al. 2002). We used the Mon-
monier algorithm implemented in BARRIER v.2.2 (Manni
et al. 2004) for a posteriori detection of boundaries to
gene flow in the landscape. To detect barriers, we used
input coordinates of each sampling location and Nei’s
genetic distance with 100 bootstrap matrices from MSA.
Isolation by distance was evaluated by assessing the
correlation between pairwise geographical distance and
Nei’s unbiased genetic distance (Nei 1978) for all popu-
lation pairs with GENEPOP (using Isolde) (Raymond &
Rousset 1995), also using a total of 1000 random permu-
tations.
Individual assignment and migration pattern
The GENECLASS 2.0 (Piry et al. 2004) was used to generate
probability for the assignment of individuals to popula-
tions. The probability of individuals coming from each
area was calculated using the standard criterion
described by Rannala & Mountain (1997) and by simu-
lating 1000 individuals per regional group of samples
using the method of Paetkau et al. (2004). Individuals
were assigned to a regional group when this group had
the highest probability of being the source of this indi-
vidual.
The possibility and rate of migration among genetic
clusters (derived from the results of TESS and STRUCTURE)
were tested with MIGRATE v. 3.0 (Beerli & Felsenstein
1999), which uses an expansion of the coalescent theory
to estimate migration rates between populations (Nem)
and h (2Nel), where Ne is the effective population size,
m is the constant migration rate between population
pairs and l is the mutation rate per generation at the
locus considered. Likelihood surfaces for each parameter
were estimated by simulating genealogies using MCMC
approach. The computations were carried out under a
Brownian motion approximation of the stepwise muta-
tion model (SMM). The runs consisted of two replicates
of 10 short chains (with 10 000 genealogies sampled)
and three long chains (with 100 000 genealogies sam-
pled), with the first 10 000 genealogies discarded. A like-
lihood ratio test was used to compare the likelihoods of
all models (Beerli & Felsenstein 1999). The models were
run three times to confirm convergence of parameter
estimates, and only the results of the run that yielded
the highest Ln likelihood value are presented.
As MPB epidemics are relatively recent in northern
AB and in some parts of BC, we used BOTTLENECK v. 1.2
(Piry et al. 1999) to determine if there was an excess (a
recent population bottleneck) or deficit (a recent popula-
tion expansion) in genetic diversity (H) relative to the
number of alleles present in G. clavigera populations. We
pooled the 19 sampling populations into four major
genetic clusters identified using the Bayesian clustering
methods described above. The Sign and Wilcoxon signif-
icance tests were used to determine whether loci dis-
played a significant excess of H > HEQ (genetic diversity
expected under mutation drift equilibrium) or deficit in
gene diversity under a mutation drift equilibrium for
loci evolving under the infinite allele model (IAM), SMM
and two-phase mutation models (TPM) (70% SMM and
30% IAM) (Cornuet & Luikart 1996; Piry et al. 1999).
To investigate the influence of MPB expansion on the
demographic history and genetic clusters of G. clavigera,
we used the ABC method (Beaumont et al. 2002) to
compare the posterior probabilities of five competing
scenarios which could have given rise to the epidemics
population in Northern BC and AB. We used the
pooled data set of four major genetic clusters (from 19
sampling populations) inferred from the Bayesian clus-
tering methods and distance methods described above.
We considered five competing scenarios which dif-
fered in the order of population divergence and demo-
graphic histories, as well as the origin of admixed
individuals in epidemics population (Fig. S1, Support-
ing information). In scenarios 1, 2 and 3, the new epi-
demic population is the result of admixture between
populations in BC and the Rocky Mountains at a rate
ra. In scenarios 4 and 5, the new epidemic population
diverged from the demographic expansion of popula-
tions in southern BC and the Rocky Mountains. The
posterior probabilities were estimated using the Win-
dow package DIYABC (Cornuet et al. 2008) available at
http://www1.montpellier.inra.fr/CBGP/diyabc/. The
ABC analyses were performed using parameter values
drawn from prior distributions (Table S1, Supporting
information) and by simulating 1 million microsatellite
data set for each competing scenario. For each popula-
tion and each population pair, we estimated the mean
� 2011 Crown in the right of Canada

POPULATI ON GE NETICS OF A C ONIFER PATHOGEN 77
number of alleles per locus and the mean expected het-
erozygosity. The other statistics used were the pairwise
FST values and maximum-likelihood estimate of admix-
ture proportion. Then, the posterior probability of each
scenario was estimated using logistic regression on the
0.1 % of simulated data set closest to the observed data
set (Cornuet et al. 2008).
Results
Genetic variation and linkage disequilibrium
Gene diversity (He) for the total sample and each popu-
lation separately was high, with values ranging from
0.4 (Fort St. James, BC) to 0.604 (Sparwood, BC), and
overall allelic richness ranging from 2 (Cypress Hill,
AB) to 4 (Canmore, AB and Hell Roaring, ID) (Table 1).
In general, populations in the Rocky Mountains had
greater gene diversity (0.456–0.604) than those from
northern AB (0.51–0.542), or west-central BC (0.4–0.45)
(Table 1). Among the 335 isolates that were analysed
(Table S2, Supporting information), we identified 250
(i.e. 74%) unique multilocus haplotypes, with clonal
multilocus haplotypes (i.e. identical multilocus haplo-
types within the same location) occurring infrequently.
The number of alleles per locus varied between 3 and
10, and gene diversity per locus ranged from 0.246 to
0.769 (Table 2). The proportion of total genetic diversity
attributed to population differentiation ranged from
0.133 to 0.373 for the eight loci, with an overall average
of 0.181 (Table 2).
The index of association (IA) did not significantly
deviate from zero in 13 of 19 populations (Table 1), sug-
gesting that recombination is occurring. The remaining
six populations as well as the IA computed on the total
sample exhibited significant but low index values, indi-
cating that population differentiation may be a result of
assortative mating, selection or the Wahlund effect.
Table 2 Summary of heterozygosity and FST from each locus
(from clone-corrected data)
Locus
No. total
alleles FST
H
Mean SE
SSR10 6 0.177 0.591 0.043
SSR26 3 0.183 0.364 0.038
SSR18 4 0.373 0.246 0.057
SSR45 10 0.148 0.769 0.020
SSR47 7 0.137 0.466 0.043
SSR51 7 0.133 0.514 0.040
SSR52 6 0.166 0.516 0.040
SSR53 9 0.135 0.637 0.030
Mean 0.181
� 2011 Crown in the right of Canada
Population structure and differentiation
In general, the various analyses using Bayesian cluster-
ing algorithms offered concordant population structure
patterns with four clusters, regardless of the weightings
of spatial location priors during the analyses.
The model-based clustering results in TESS consistently
supported the existence of four clusters based on the
lowest DIC value (Fig. 1), and adjusting spatial interac-
tion factor values (ranging from 0.01 to 0.9) had no
influence on the optimal number of cluster K estimated
in the analyses. The four clusters included northwestern
BC (‘NBC’), containing H and FSJ, southern BC (‘SBC’),
comprising MP and WL, ‘North’, comprising popula-
tions TUR, FCR, GRP, FAR, KAK and VAL in stands
where MPB is only recently established, while the rest
belonged to ‘Rocky’ (Fig. 1). The ‘NBC’ and ‘Rocky’
clusters were more homogeneous and unique, with 66.7
and 55% of their individuals having a very high mem-
bership coefficient of >0.9 (Fig. 1, Table S3, Supporting
information). In contrast, ‘North’ and ‘SBC’ clusters
were more heterogeneous, with a higher level of admix-
ture. Less than 20% of individuals from ‘North’ had a
membership coefficient of >0.9, whereas 59% of indi-
viduals from ‘SBC’ had a membership coefficient <0.5
(Table S3, Supporting information).
The STRUCTURE also generated similar population clus-
tering patterns to those revealed in TESS (Fig. S2, Sup-
porting information). The STRUCTURE analysis produced
two clusters, where members of the H and FSJ popula-
tions formed a unique cluster with a lower level of
admixture, while the remaining 17 populations formed
a second cluster showing admixed ancestry in many
populations and isolates. A subsequent STRUCTURE analy-
sis on the second cluster resulted in three additional
groups that resembled the ‘North’, ‘SBC’ and ‘Rocky’
clusters in TESS, and demonstrated a high level of
admixture (Fig. S2, Supporting information).
Bayesian spatial analysis (BAPS) produced an optimal
partition of five population groups with or even with-
out the prior spatial information of sampling popula-
tions (Fig. S3, Supporting information). Three groups
(‘NBC’, ‘North’ and ‘SBC’) detected by BAPS were simi-
lar to those detected by TESS and STRUCTURE, while the
remaining two clusters corresponded to the ‘Rocky’
cluster in TESS, where it was divided into a northern and
a southern group (Fig. S3, Supporting information).
Using the admixture analysis implemented in BAPS, a
lower level of admixture was found in each cluster
compared to those in TESS and STRUCTURE.
The PCoA spatially grouped the H and FSJ popula-
tions in ‘NBC’ on the upper right quadrant of the first
PCoA axis (explaining 45% of the variation), while the
nine Rocky Mountains populations (‘Rocky’) clustered

H
FSJBAN
CANGOL
YOCYH
HV
HR
SPA
CPAGRP
KAKFCR
TURVAL
FAR
WLMP
Coor
d. 2
Coord. 1
Principal coordinates (1 vs. 2)
HOU
TUR
KAK
FAR
FCR
VAL
CPA
GOL
HR
SPA
HV
BAN
CAN
CYH
YO
WL
MP
FSJ
GRP
9967
69
96
(a) (b)
Fig. 2 Genetic subdivision of Grosmannia clavigera populations visualized from genetic distance. (a) Principal Coordinates Analysis
among 19 populations based on Nei’s genetic distance using GenAlEx. The first and second accounted for 45% and 23% of the vari-
ance respectively. (b) Neighbour joining tree of 19 G. clavigera populations using the software implemented in the PHYLIP package.
Bootstrap support (>60%) based on 100 pseudoreplicates generated from Microsatellite Analyser is provided. For population abbrevi-
ation, please see Table 1.
78 C. K. M. T SUI E T A L.
within the two left quadrants of the first PCoA axis
(Fig. 2a). The southern WL and MP (‘SBC’) were
slightly differentiated from the northern populations
(‘North’) along the second PCoA axis (23% of the varia-
tion) (Fig. 2a); however, they were apparently sepa-
rated along the third PCoA axis (12.4% of the variation)
(Fig. S4, Supporting information). A NJ tree generated
using PHYLIP produced a trend similar to the three previ-
ous analyses (TESS, STRUCTURE and PCoA). The H and FSJ
in ‘NBC’ formed a distinct cluster with 99% bootstrap
support (Fig. 2b). In addition, MP and WL, belonging
to ‘SBC’, were separated from the ‘Rocky’ populations
with 96 and 67% support respectively (Fig. 2b). Finally,
the northern group (‘North’) formed an independent
cluster; however, it did not receive over 50% bootstrap
support (Fig. 2b). The SAMOVA was also used to deter-
mine the best grouping of populations based on geo-
graphical information and allele frequency variation,
assuming there were two to seven groups (K) and using
the distance method based on the sum of squared size
differences. The best SAMOVA grouping (the one with the
highest FCT (among populations) and the lowest varia-
tion among populations within groups) was achieved
by K = 4 (Appendix S1, Supporting information). The
grouping of populations was congruent with the one
obtained in TESS.
The analysis of molecular variance (AMOVA) performed
on the 19 populations indicated that 14.18 and 85.82%
of the genetic variation was attributed to variations
among and within populations respectively (P < 0.001)
(Table 3). To further investigate the differentiation
among the four ‘genetic clusters’ established on the
basis of the Bayesian and distance analyses, AMOVA
attributed 12.46, 4.77 and 82.77% of the total variation
to variations among clusters, among locations within
cluster and among individual isolates within popula-
tions respectively, all of which were highly significant
(P < 0.001) (Table 3). An AMOVA analysis was also per-
formed separately on 12 populations obtained in 2007–
2008, which included isolates from different hosts and
periods (period 1: January 2007–May 2007; period 2:
September 2007–May 2008) of isolation at each location
(Table 1). The genetic differentiation among popula-
tions as well as ‘North-Rocky’ differentiations contrib-
uted to only 8.57 and 8.9% of total variation
respectively (Table S4, Supporting information). By con-
trast, the genetic differentiation observed between iso-
lates of putative lodgepole pine and lodgepole–jack
pine hybrid was smaller but significant (5.73%,
P < 0.001), while that observed between the isolates
sampled at two different periods was even lower
(2.91%, P < 0.001) (Table S4, Supporting information).
With the exception of CPA and HR within the
‘Rocky’ group, pairwise genetic differentiations (FST)
between populations in general, were not significant
within the four geographical groupings, supporting
their genetic similarities (Table S5, Supporting informa-
tion). Significant population pairwise FST was common
across geographical groupings, suggesting genetic dif-
ferentiation (Table S5, Supporting information). The H
and HR (FST = 0.341, P < 0.001) and TUR and KAK
()0.013, P > 0.05) were the most and least differentiated
populations respectively (Table S5, Supporting informa-
tion), indicating the presence of isolation by distance.
� 2011 Crown in the right of Canada
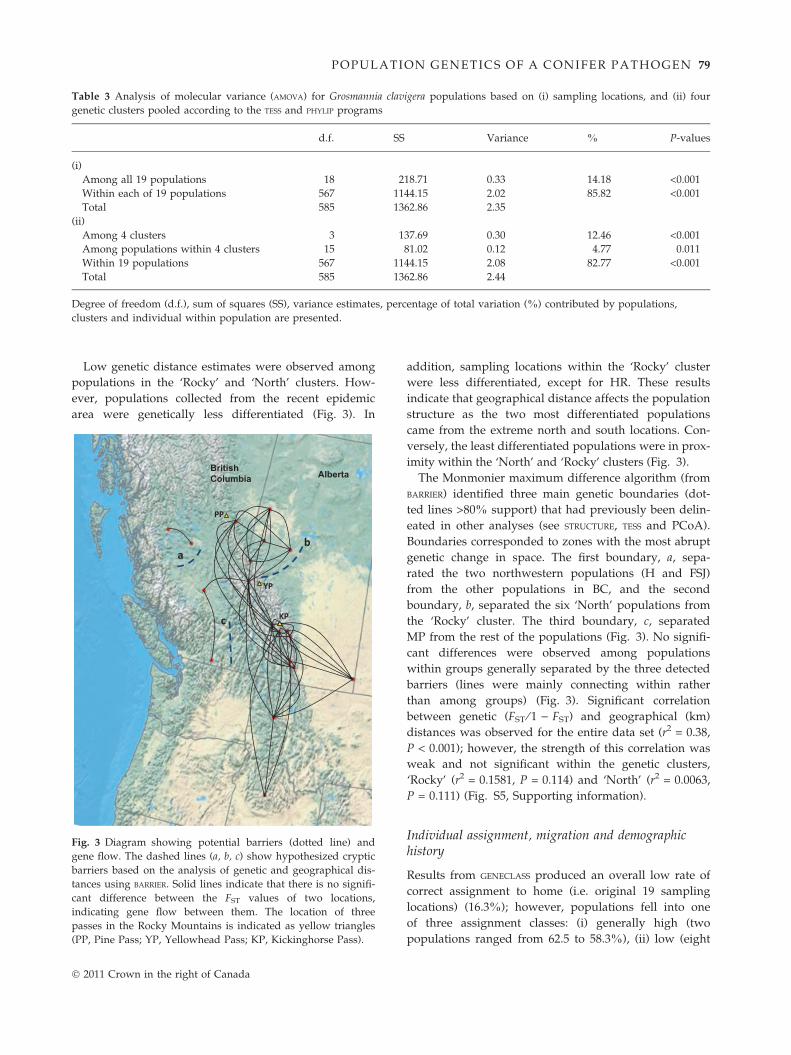
Table 3 Analysis of molecular variance (AMOVA) for Grosmannia clavigera populations based on (i) sampling locations, and (ii) four
genetic clusters pooled according to the TESS and PHYLIP programs
d.f. SS Variance % P-values
(i)
Among all 19 populations 18 218.71 0.33 14.18 <0.001
Within each of 19 populations 567 1144.15 2.02 85.82 <0.001
Total 585 1362.86 2.35
(ii)
Among 4 clusters 3 137.69 0.30 12.46 <0.001
Among populations within 4 clusters 15 81.02 0.12 4.77 0.011
Within 19 populations 567 1144.15 2.08 82.77 <0.001
Total 585 1362.86 2.44
Degree of freedom (d.f.), sum of squares (SS), variance estimates, percentage of total variation (%) contributed by populations,
clusters and individual within population are presented.
POPULATI ON GE NETICS OF A C ONIFER PATHOGEN 79
Low genetic distance estimates were observed among
populations in the ‘Rocky’ and ‘North’ clusters. How-
ever, populations collected from the recent epidemic
area were genetically less differentiated (Fig. 3). In
ab
c
BritishColumbia Alberta
PP
YP
KP
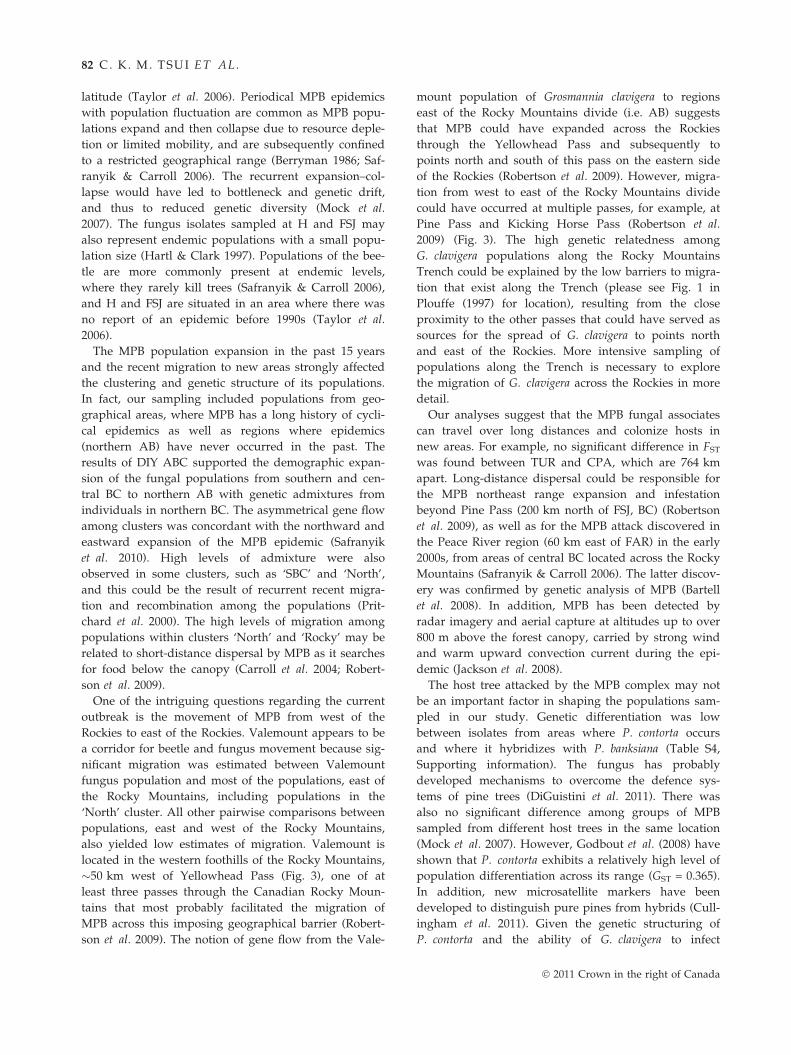
Fig. 3 Diagram showing potential barriers (dotted line) and
gene flow. The dashed lines (a, b, c) show hypothesized cryptic
barriers based on the analysis of genetic and geographical dis-
tances using BARRIER. Solid lines indicate that there is no signifi-
cant difference between the FST values of two locations,
indicating gene flow between them. The location of three
passes in the Rocky Mountains is indicated as yellow triangles
(PP, Pine Pass; YP, Yellowhead Pass; KP, Kickinghorse Pass).
� 2011 Crown in the right of Canada
addition, sampling locations within the ‘Rocky’ cluster
were less differentiated, except for HR. These results
indicate that geographical distance affects the population
structure as the two most differentiated populations
came from the extreme north and south locations. Con-
versely, the least differentiated populations were in prox-
imity within the ‘North’ and ‘Rocky’ clusters (Fig. 3).
The Monmonier maximum difference algorithm (from
BARRIER) identified three main genetic boundaries (dot-
ted lines >80% support) that had previously been delin-
eated in other analyses (see STRUCTURE, TESS and PCoA).
Boundaries corresponded to zones with the most abrupt
genetic change in space. The first boundary, a, sepa-
rated the two northwestern populations (H and FSJ)
from the other populations in BC, and the second
boundary, b, separated the six ‘North’ populations from
the ‘Rocky’ cluster. The third boundary, c, separated
MP from the rest of the populations (Fig. 3). No signifi-
cant differences were observed among populations
within groups generally separated by the three detected
barriers (lines were mainly connecting within rather
than among groups) (Fig. 3). Significant correlation
between genetic (FST ⁄ 1 ) FST) and geographical (km)
distances was observed for the entire data set (r2 = 0.38,
P < 0.001); however, the strength of this correlation was
weak and not significant within the genetic clusters,
‘Rocky’ (r2 = 0.1581, P = 0.114) and ‘North’ (r2 = 0.0063,
P = 0.111) (Fig. S5, Supporting information).
Individual assignment, migration and demographichistory
Results from GENECLASS produced an overall low rate of
correct assignment to home (i.e. original 19 sampling
locations) (16.3%); however, populations fell into one
of three assignment classes: (i) generally high (two
populations ranged from 62.5 to 58.3%), (ii) low (eight

Table 4 Results of individual assignment from GENECLASS
Cluster ⁄ location N* Nhome†
Alocation
(%)‡
Acluster
(%)§ Ratio–
NBC
Houston 16 10 62.5 75 1.31
Fort St. James 23 3 13.0 43 0.35
North
Tumbler Ridge 13 0 0 61 0.46
Fairview 11 0 0 45 0.09
Grande Prairie 20 0 0 70 0.20
Fox Creek 12 2 16.7 83 1.00
Kakwa 17 0 0 59 0.65
Valemount 8 2 25.0 50 7.00
SBC
Williams Lake 15 4 26.7 53 1.13
Manning Park 19 3 15.8 47 0.53
Rocky
Golden 8 2 25.0 75 1.38
Yoho 7 0 0 86 1.86
Banff 20 6 30.0 90 1.15
Canmore 39 0 0 79 0.10
Cypress Hills 5 0 0 60 0.20
Sparwood 7 2 28.6 71 1.71
Crowsnest Pass 9 0 0 89 1.22
Hidden Valley 20 0 0 80 0.50
Hell Roaring 24 14 58.3 90 2.58
Total 293 48 16.3 70
*Sample size (N).†Number of individuals assigned to original sampling location
(correct assignment).‡Assignment rate to original location (= Nhome ⁄ N).§Assignment rate to the genetic cluster recognized from TESS.–Ratio = total number of individuals (out of 293) assigned to
the location ⁄ sample size of the location (N).
80 C. K. M. T SUI E T A L.
populations ranged from 28.6 to 13.0%) and (iii) zero
(nine populations) (Table 4). The overall rate of indi-
vidual assignment to each of the four inferred clusters
was substantially increased to 70% with a minimum
assignment of 60% for 16 of the 19 studied popu-
lations, again supporting the observed low level of
differentiation among populations within the same
genetic cluster (Table 4).
Table 5 Estimates of the mean number of migrants per generation
using the software MIGRATE
Source
population
Sink population
Theta NBC
NBC 0.91 (0.86–0.98)
Rocky 1.01 (0.97–1.05) 1.03 (0.84–1.25)
North 0.96 (0.91–1.00) 0.54 (0.41–0.70)
SBC 1.02 (0.95–1.10) 1.13 (0.93–1.35)
Considerable levels of gene flow were observed
among the major genetic clusters with an estimated
number of migrants per generation M (2Nem) ranging
from 0.54 (‘NBC’ from ‘North’) to 2.00 (‘SBC’ from
‘North’) (Table 5). The observed gene flow was asym-
metric between ‘NBC’ and ‘North’ (1.20 vs. 0.54) and
between ‘Rocky’ and ‘SBC’ (1.31 vs. 1.94), depending on
the direction.
The possibility of population bottlenecks ⁄ founder
events or population expansion was tested on the four
genetic clusters with the program BOTTLENECK. The Sign
and Wilcoxon’s tests were used to detect significant
excess or deficit in gene diversity (Cornuet & Luikart
1996). One of the loci in clusters ‘North’ and ‘NBC’ was
monomorphic, and allele size was identical. Allele fre-
quency in ‘NBC’ did not follow a normal L-shaped dis-
tribution, indicating that the populations were not at
mutation-drift equilibrium and experienced a popula-
tion bottleneck. Cluster ‘North’ had a significant excess
in gene diversity under IAM and TPM, also indicating
a bottleneck. Cluster ‘Rocky’ had a significant excess in
gene diversity under IAM, but clusters ‘NBC’ and ‘SBC’
had no significant excess or deficit in gene diversity
(Table 6). These analyses appeared to be consistent
with a history of MPB population expansion. The gen-
eral lack of significance may be owing to a lack of
power of the test when the number of loci is <20 (Corn-
uet & Luikart 1996).
The ABC analysis discriminated the five competing
scenarios, and the posterior probability did not sup-
port scenarios assuming no admixtures in epidemic
populations of cluster ‘North’ (scenarios 4 and 5,
probability ranged from 0.1045 to 0.1995) (Fig. S1,
Supporting information). Instead, the scenario receiv-
ing the highest probability (0.4843) indicated that the
population of Grosmannia clavigera diverged from
genetic cluster ‘Rocky’ to ‘SBC’, and from ‘SBC’
diverged to ‘NBC’ (Fig. S1, Table S1, Supporting
information). The epidemic populations of cluster
‘North’ originated from ‘NBC’ with admixed individu-
als from the ‘SBC’ (Fig. S1, Supporting information).
This scenario is consistent with the recent expansion
M (2Nem) and mean population mutation rate (2Nel) obtained
Rocky North SBC
1.22 (1.01–1.46) 1.20 (0.98–1.47) 1.16 (0.92–1.41)
1.78 (1.52–2.02) 1.31 (1.08–1.58)
1.89 (1.62–2.18) 2.00 (1.71–2.32)
1.94 (1.67–2.24) 1.17 (0.96–1.40)
� 2011 Crown in the right of Canada

Table 6 Comparison of observed gene diversity (H) with
expected gene diversity (HEQ) at mutation-drift equilibrium
calculated from the observed number of alleles under SMM
and TPM for the four genetic clusters
Group Mutation model
D ⁄ E†
IAM SMM TPM
NBC IAM (P = 0.09ns) 2 ⁄ 5ns 3 ⁄ 4ns 2 ⁄ 5ns
North IAM (P = 0.003**) 0 ⁄ 7** 4 ⁄ 3ns 0 ⁄ 7**
Rocky IAM (P = 0.006**) 2 ⁄ 6** 5 ⁄ 3ns 2 ⁄ 6ns
SBC SMM (P = 0.05*) 3 ⁄ 5ns 5 ⁄ 3ns 4 ⁄ 4ns
IAM, infinite allele model; SMM, stepwise mutation model;
TPM, two-phase mutation models.
†D ⁄ E is the number of loci showing a deficit ⁄ excess of gene
diversity. Significance estimates of excess or deficiency across
loci were obtained using the one-tailed Wilcoxon test and the
sign test.
*P £ 0.05, **P £ 0.01, nsP > 0.05.
POPULATI ON GE NETICS OF A C ONIFER PATHOGEN 81
and movement pattern of MPB from central BC to
northern AB recently.
Discussion
The population structure uncovered in our analyses of
this MPB fungal associate is best explained by the geo-
graphical origin of the fungus, which is defined by the
geographical barriers. Landscape features can be
invoked to explain this pattern because the Rocky
Mountains populations may be physically separated
from the others, in particular from populations found
west and north of the Rocky Mountains (Safranyik &
Carroll 2006). The isolation by distance observed for the
entire data set, but not within clusters, is indicative of
barriers to gene flow (Fig. S5, Supporting information).
The cause for the differentiation of the four clusters
could be attributed to founder effects or selection (Hartl
& Clark 1997). The clustering structures are concordant
with those observed in previous studies of this fungus
(Lee et al. 2007; Roe et al. 2011b), in which a northern
and a southern group from the Rocky Mountains had
been reported.
Some parallel patterns can be observed between the
fungus and beetle population structures. The presence
of genetic clusters in the Rocky Mountains, and north
and west of the Rocky Mountains, finds similarities
with the MPB population patterns observed. A strong
north–south genetic structure was observed in MPB
populations (Mock et al. 2007; Bartell et al. 2008). The
north–south gradient in MPB genetic diversity may be
taken as a sign of range expansion from the southern
Rocky Mountains or the US to south-central and west-
central BC and AB (Mock et al. 2007). A parallel distri-
� 2011 Crown in the right of Canada
bution pattern in insect–symbiont complexes has also
been reported for the fungus Ceratocystis polonica and its
beetle vector Ips typographus (Marin et al. 2009).
The results reported herein support the scenario of
multiple localized populations of MPB and its fungal
associates erupting at spatially disjoint locations (Auk-
ema et al. 2006). Roe et al. (2011b) suggested that rem-
nant populations of MPB and fungi from previous MPB
epidemics having occurred in the last 100 years may
have existed at endemic levels and differentiated locally
or regionally. It is possible that these disjoint popula-
tions expanded and formed the current epidemics. Fun-
gal populations from BC were recovered in each of the
four clusters (‘NBC’, ‘SBC’, ‘Rocky’ and ‘North’), which
were differentiated from each other (Figs 1 and 2, Fig.
S1, Supporting information). Genetic analysis of MPB
recovered two groups of populations in northern BC
and southern BC, roughly equivalent to our ‘NBC’ and
‘SBC’ clusters (Bartell et al. 2008). Moreover, the popu-
lation structure of the fungal symbiont of MPB did not
support the scenario of an epicentre followed by the
spread of the insect–pathogen complex (Aukema et al.
2006). Populations H and FSJ (in cluster ‘NBC’) had the
lowest genetic diversity, and we detected a strong bar-
rier to gene flow between these and other populations.
Geographically, however, these populations were sam-
pled close to Tweedsmuir Provincial Park, where the
current outbreak was first recorded (Aukema et al.
2006). If these populations were at the epicentre of the
epidemic, higher genetic diversity would be expected in
source (epicenter) populations than in sink (recently
established) ones. Instead, these populations appear to
be genetically poor and disjointed from the other popu-
lations, a result that is congruent with the proposed
hypothesis of multiple centers of origin (Aukema et al.
2006). Providing support to this hypothesis is impor-
tant, and it could be useful in identifying and prioritiz-
ing landscape units for management strategies.
Several reasons can explain the reduced genetic
diversity and highly differentiated ‘NBC’ cluster. First,
populations of H and FSJ could represent a historic
establishment of populations from Idaho, Montana and
California via postglacial range expansion with their
host MPB (Mock et al. 2007). As H and FSJ shared a
fixed locus, the populations could have a common ori-
gin with those in central or southern BC, but have
diverged with time due to drift and selection outside
their native range with rare migrant exchanges (Hartl &
Clark 1997). A population genetic study of the MPB that
included populations at FSJ also had a lower genetic
and haplotypic diversity compared with those from ID,
MT and CA (Mock et al. 2007). In western Canada,
before 1999, the historical range of MPB infestation was
restricted to pine forests approximately south of 56�N
82 C. K. M. T SUI E T A L.
latitude (Taylor et al. 2006). Periodical MPB epidemics
with population fluctuation are common as MPB popu-
lations expand and then collapse due to resource deple-
tion or limited mobility, and are subsequently confined
to a restricted geographical range (Berryman 1986; Saf-
ranyik & Carroll 2006). The recurrent expansion–col-
lapse would have led to bottleneck and genetic drift,
and thus to reduced genetic diversity (Mock et al.
2007). The fungus isolates sampled at H and FSJ may
also represent endemic populations with a small popu-
lation size (Hartl & Clark 1997). Populations of the bee-
tle are more commonly present at endemic levels,
where they rarely kill trees (Safranyik & Carroll 2006),
and H and FSJ are situated in an area where there was
no report of an epidemic before 1990s (Taylor et al.
2006).
The MPB population expansion in the past 15 years
and the recent migration to new areas strongly affected
the clustering and genetic structure of its populations.
In fact, our sampling included populations from geo-
graphical areas, where MPB has a long history of cycli-
cal epidemics as well as regions where epidemics
(northern AB) have never occurred in the past. The
results of DIY ABC supported the demographic expan-
sion of the fungal populations from southern and cen-
tral BC to northern AB with genetic admixtures from
individuals in northern BC. The asymmetrical gene flow
among clusters was concordant with the northward and
eastward expansion of the MPB epidemic (Safranyik
et al. 2010). High levels of admixture were also
observed in some clusters, such as ‘SBC’ and ‘North’,
and this could be the result of recurrent recent migra-
tion and recombination among the populations (Prit-
chard et al. 2000). The high levels of migration among
populations within clusters ‘North’ and ‘Rocky’ may be
related to short-distance dispersal by MPB as it searches
for food below the canopy (Carroll et al. 2004; Robert-
son et al. 2009).
One of the intriguing questions regarding the current
outbreak is the movement of MPB from west of the
Rockies to east of the Rockies. Valemount appears to be
a corridor for beetle and fungus movement because sig-
nificant migration was estimated between Valemount
fungus population and most of the populations, east of
the Rocky Mountains, including populations in the
‘North’ cluster. All other pairwise comparisons between
populations, east and west of the Rocky Mountains,
also yielded low estimates of migration. Valemount is
located in the western foothills of the Rocky Mountains,
�50 km west of Yellowhead Pass (Fig. 3), one of at
least three passes through the Canadian Rocky Moun-
tains that most probably facilitated the migration of
MPB across this imposing geographical barrier (Robert-
son et al. 2009). The notion of gene flow from the Vale-
mount population of Grosmannia clavigera to regions
east of the Rocky Mountains divide (i.e. AB) suggests
that MPB could have expanded across the Rockies
through the Yellowhead Pass and subsequently to
points north and south of this pass on the eastern side
of the Rockies (Robertson et al. 2009). However, migra-
tion from west to east of the Rocky Mountains divide
could have occurred at multiple passes, for example, at
Pine Pass and Kicking Horse Pass (Robertson et al.
2009) (Fig. 3). The high genetic relatedness among
G. clavigera populations along the Rocky Mountains
Trench could be explained by the low barriers to migra-
tion that exist along the Trench (please see Fig. 1 in
Plouffe (1997) for location), resulting from the close
proximity to the other passes that could have served as
sources for the spread of G. clavigera to points north
and east of the Rockies. More intensive sampling of
populations along the Trench is necessary to explore
the migration of G. clavigera across the Rockies in more
detail.
Our analyses suggest that the MPB fungal associates
can travel over long distances and colonize hosts in
new areas. For example, no significant difference in FST
was found between TUR and CPA, which are 764 km
apart. Long-distance dispersal could be responsible for
the MPB northeast range expansion and infestation
beyond Pine Pass (200 km north of FSJ, BC) (Robertson
et al. 2009), as well as for the MPB attack discovered in
the Peace River region (60 km east of FAR) in the early
2000s, from areas of central BC located across the Rocky
Mountains (Safranyik & Carroll 2006). The latter discov-
ery was confirmed by genetic analysis of MPB (Bartell
et al. 2008). In addition, MPB has been detected by
radar imagery and aerial capture at altitudes up to over
800 m above the forest canopy, carried by strong wind
and warm upward convection current during the epi-
demic (Jackson et al. 2008).
The host tree attacked by the MPB complex may not
be an important factor in shaping the populations sam-
pled in our study. Genetic differentiation was low
between isolates from areas where P. contorta occurs
and where it hybridizes with P. banksiana (Table S4,
Supporting information). The fungus has probably
developed mechanisms to overcome the defence sys-
tems of pine trees (DiGuistini et al. 2011). There was
also no significant difference among groups of MPB
sampled from different host trees in the same location
(Mock et al. 2007). However, Godbout et al. (2008) have
shown that P. contorta exhibits a relatively high level of
population differentiation across its range (GST = 0.365).
In addition, new microsatellite markers have been
developed to distinguish pure pines from hybrids (Cull-
ingham et al. 2011). Given the genetic structuring of
P. contorta and the ability of G. clavigera to infect
� 2011 Crown in the right of Canada

POPULATI ON GE NETICS OF A C ONIFER PATHOGEN 83
P. contorta, P. banksiana and their hybrids, it will be
important to further explore the relationship between
the beetle, its fungal associate and its hosts.
The pattern of genetic diversity in a fungus pathogen
population may reflect its species association with vec-
tors and the distribution of host trees. High levels of
genetic diversity and genetic differentiation were
observed in the G. clavigera lineage Gs (Alamouti et al.
2011) populations in MPB in this study. By contrast,
low genetic diversity with high population differentia-
tion was reported for a G. clavigera lineage Gc (sensu
Alamouti et al. 2011) population associated with Jeffrey
pine beetle (Dendroctonus jeffreyi) (Six & Paine 1999).
The greater specialization between D. jeffreyi and the
less widely distributed Jeffrey pine could have created
opportunities for genetic drift and hence, for lower
genetic diversity, reduced gene flow and higher genetic
differentiation as opposed to populations associated
with MPB, which are known for their adaptation to a
broad range of Pinus hosts and broader geographical
distribution (Six & Paine 1999; Safranyik & Carroll
2006). High genetic diversity was also reported in
C. polonica, a blue-stain fungus associated with the bark
beetle Ips typographu, which infects several spruce spe-
cies in Europe and Japan (Marin et al. 2009). Surprising
patterns were observed for cosmopolitan fungi, such as
Ophiostoma ips and Ceratocystis resinifera, which are asso-
ciated with multiple beetles attacking various conifer
species. Low genetic diversity was observed in those
fungi, probably reflecting the limited genetic base of
introduced fungi or asexual reproduction (Morin et al.
2004; Zhou et al. 2007).
Many fungi have mixed mating systems and produce
both sexual and asexual stages in their life cyle. G. clav-
igera has been considered to reproduce asexually in the
wild as sexual fruiting bodies have rarely been
observed in MPB galleries, and artificial mating under
experimental conditions has been unsuccessful (Six &
Paine 1999; Lee et al. 2003, 2007; Alamouti et al. 2011).
The occurrence of repeated multilocus haplotypes in
most regional populations and the linkage disequilibria
in six regional populations and in the entire population
indicate clonal propagation ⁄ reproduction in the popula-
tions.
Sexual recombination is important in the evolution
and epidemiology of fungi (Milgroom 1996) and may
be a key contributor to the high genetic diversity
observed in G. clavigera in association with MPB.
Although the contribution of sexual reproduction in this
fungus is largely uncertain, linkage disequilibrium was
nonsignificant or very low in most of the populations in
this study, indicating that sexual reproduction occurs at
a level that is mostly consistent with random mating.
The 1:1 ratio of two mating types in the populations
� 2011 Crown in the right of Canada
used in the current study confirms that sexual repro-
duction occurs in the populations (Tsui et al. 2009b).
Gene genealogies also indicated the presence of recom-
bination in G. clavigera lineage Gs (Alamouti et al.
2011). In contrast, Ophiostoma novo-ulmi, a fungus caus-
ing Dutch elm disease, had low genetic diversity and
was characterized by few vegetative compatibility
groups with one mating type (Brasier 1988).
The pattern of diversity is very similar to the one
found in previous studies of this fungus (Lee et al.
2007; Tsui et al. 2009a; Roe et al. 2011b). Our clone-
corrected data yielded a much higher gene diversity
estimate than that reported by Lee et al. (2007) for the
same species and some of the same populations [0.513
vs. 0.215 (for polymorphic loci only)]. The discrepancy
observed between these two studies could be the
result of greater population coverage and ⁄ or the dif-
ference between the two genetic markers used (SSRs
vs. AFLP), reflecting the greater sensitivity and muta-
tion rate of SSR markers in detecting subtle popula-
tion changes resulting from recent phylogeographical
and demographic events (Goldstein & Schlotterer
1999).
The new range expansion of the MPB epidemic into
northwestern AB could have unpredictable outcomes
because this event is relatively recent (appearing in
northern AB in 2001) (Carroll et al. 2004). The MPB has
recently been demonstrated to attack jack pine stands
(Cullingham et al. 2011), and the fungus has been con-
sidered adapted to the cold boreal climate (Rice et al.
2008). The population expansion of a non-native patho-
gen (considered an invasive pest) can pose a significant
threat to native forest communities as a result of the
absence of prior co-evolutionary encounters and the
fungus’ evolutionary potential. Fungal pathogens with
mixed mating systems (sexual and asexual) and with
high potential for migration and gene flow stand the
greatest chance of overcoming host resistance (McDon-
ald & Linde 2002). Pathogens with high genetic variabil-
ity also have sufficient abilities to evolve rapidly in
response to climate change (McDonald & Linde 2002).
Our results highlight the potential of this pathogen for
both migration and sexual reproduction, but they also
identify some potential barriers to gene flow. There
appears to be no major biological obstacles (e.g. compet-
itors) to the spread of MPB and its fungal associates.
The epidemic has the potential to spread east to Sas-
katchewan and to the boreal forests of North America
and to create greater ecological and socioeconomical
impacts as more pine trees become infected (Safranyik
et al. 2010). Understanding the ecological and evolu-
tionary dynamics of fungus–beetle interactions is of
high importance to improve modelling and prediction
of MPB epidemics.

84 C. K. M. T SUI E T A L.
Acknowledgements
Funding for this research was provided by Genome Canada,
Genome BC, Genome Alberta and the Government of Alberta
(AAET ⁄ AFRI-859-G07) in support of the Tria I and Tria II
Projects http://www.thetriaproject.ca, of which FAHS, JEKC,
JB and RCH are Principal Investigators. We are grateful to
C. Breuil for her continued encouragement, valuable discus-
sions and financial support during the course of the experi-
ment. We thank H.-J. Chen, J. Valle, B. Lai, H. Yueh, C. Ritland
(UBC), B. Jones, D. Edwards, S. Bourassa, E. Hunt, T. Watson,
M. Ferguson (University of Alberta), D. Lux and Forest Health
Officers of the Alberta Sustainable Resource development fund
for technical assistance, as well as T. Guillemaud and P. Gladi-
eux for advice on DIY ABC. We also acknowledge A. Carroll,
B. Murray, D. Coltman, P. James, N. Bartell, G. Weerasuriya,
S. DiGuistini, T. Wang, M. Ismail, J. Corander, M. Jakobsson,
T. Giraud and D. Six for helpful discussions and support,
J. Berube for reviewing the manuscript and M.-A. Rodrigue
(CHUL) for DNA sequencing.
References
Agapow PM, Burt A (2001) Indices of multilocus linkage
disequilibrium. Molecular Ecology Notes, 1, 101–102.
Alamouti SM, Wang V, DiGuistini S et al. (2011) Gene
genealogies reveal cryptic species and host preferences for
the pine fungal pathogen Grosmannia clavigera. Molecular
Ecology, 20, 2581–2602.
Aukema BH, Carroll AL, Zhu J, Raffa K, Sickley TA, Taylor
SW (2006) Landscape level analysis of mountain pine beetle
in British Columbia, Canada: spatiotemporal development
and spatial synchrony within the present outbreak.
Ecography, 29, 427–441.
Bartell NV, Lindgren S, Cooke J, Davis C, Mock K, Murray BW
(2008) Using genetic analyses to infer mountain pine beetle
population structure and dispersal patterns in British
Columbia and Alberta. BC Journal of Ecosystems and
Management, 9, 140–142.
Beaumont MA, Rannala B (2004) The Bayesian revolution in
genetics. Nature Reviews Genetics, 5, 251–261.
Beaumont MA, Zhang W, Balding DJ (2002) Approximate
Bayesian computation in population genetics. Genetics, 162,
2025–2035.
Beerli P, Felsenstein J (1999) Maximum likelihood estimation of
migration rates and effective population numbers in two pop-
ulations using a coalescent approach. Genetics, 152, 763–773.
Berryman AA (1986) Forest Insects: Principles and Practice of
Population Management. Plenum Press, New York.
Brasier CM (1988) Rapid changes in genetic structure of epi-
demic populations of Ophiostoma ulmi. Nature, 332, 538–541.
Carroll AL, Taylor SW, Regniere J, Safranyik L (2004) Effects of
climate change on range expansion by the mountain pine
beetle in British Columbia. In: Mountain Pine Beetle
Symposium: Challenges and Solutions (eds Shore TL, Brooks JE
and Stone JE), pp. 223–232. Natural Resources Canada,
Canadian Forest Service, Pacific Forestry Centre, Information
Report BC-X-399.
Corander J, Waldmann P, Sillanpaa MJ (2003) Bayesian
analysis of genetic differentiation between populations.
Genetics, 163, 367–374.
Cornuet JM, Luikart G (1996) Description and power analysis
of two tests for detecting recent population bottlenecks from
allele frequency data. Genetics, 144, 2001–2014.
Cornuet JM, Santos F, Beaumont MA et al. (2008) Inferring
population history with DIY ABC: a user-friendly approach
to approximate Bayesian computation. Bioinformatics, 24,
2713–2719.
Cullingham CI, Cooke JEK, Dang S, Davis CS, Cooke BJ,
Coltman DW (2011) Mountain pine beetle host-range
expansion threatens the boreal forest. Molecular Ecology, 20,
2157–2171.
Dieringer D, Schlotterer C (2002) Microsatellite analyzer
(MSA): a platform independent analysis tool for large
microsatellite data sets. Molecular Ecology Notes, 3, 167–169.
DiGuistini S, Ralph SG, Lim YW et al. (2007) Generation and
annotation of lodgepole pine and oleoresin-induced
expressed sequences from the blue-stain fungus Ophiostoma
clavigerum, a Mountain Pine Beetle-associated pathogen.
FEMS Microbiology Letters, 267, 151–158.
DiGuistini S, Wang Y, Liao NY et al. (2011) Genome and
transcriptome analyses of the mountain pine beetle-fungal
symbiont Grosmannia clavigera, a lodgepole pine pathogen.
Proceedings of the National Academy of Sciences of the USA, 108,
2504–2509.
Dupanloup I, Schneider S, Excoffier L (2002) A simulated
annealing approach to define the genetic structure of
populations. Molecular Ecology, 11, 2571–2581.
Evanno G, Regnaut S, Goudet J (2005) Detecting the number of
clusters of individuals using the software STRUCTURE: a
simulation study. Molecular Ecology, 14, 2611–2620.
Excoffier L, Laval G, Schneider S (2005) Arlequin (version 3.0):
an integrated software package for population genetics data
analysis. Evolutionary Bioinformatics Online, 1, 47–50.
Felsenstein J (2002) PHYLIP (Phylogeny Inference Package),
Version 3.6a3. Department of Genome Science, University of
Washington, Seattle, Washington.
Francois O, Ancelet S, Guillot G (2006) Bayesian clustering
using hidden Markov random fields in spatial population
genetics. Genetics, 174, 805–816.
Godbout J, Fazekas A, Newton CH, Yeh FC, Bousquet J (2008)
Glacial vicariance in the Pacific Northwest: evidence from a
lodgepole pine mitochondrial DNA minisatellite for multiple
genetically distinct and widely separated refugia. Molecular
Ecology, 17, 2463–2475.
Goldstein DB, Schlotterer C (1999) Microsatellites: Evolution and
Applications. Oxford University Press, New York.
Harrington TC (1993) Biology and taxonomy of fungi
associated with bark beetles. In: Beetle-Pathogen Interactions in
Conifer Forests (eds Schowalter TD and Filip GM), pp. 37–51.
Academic Press, San Diego, California.
Hartl DL, Clark AG (1997) Principles of Population Genetics, 3rd
edn. Sinauer Associates, Sunderland, Massachusetts.
Hubisz MJ, Falush D, Stephens M, Pritchard JK (2009)
Inferring weak population structure with the assistance of
sample group information. Molecular Ecology Resources, 9,
1322–1332.
Jackson PL, Straussfogel D, Lindgren BS, Mitchell S, Murphy B
(2008) Radar observation and aerial capture of mountain
pine beetle, Dendroctonus ponderosae Hopk. (Coleptera:
Scolytidae) in flight above the forest canopy. Canadian Journal
of Forest Research, 38, 2313–2327.
� 2011 Crown in the right of Canada

POPULATI ON GE NETICS OF A C ONIFER PATHOGEN 85
Klepzig KD, Six DL (2004) Bark beetle-fungal symbiosis:
context dependency in complex associations. Symbiosis, 37,
189–205.
Kurz WA, Dymond CC, Stinson G et al. (2008) Mountain pine
beetle and forest carbon feedback to climate change. Nature,
452, 987–990.
Lee S, Kim JJ, Fung S, Breuil C (2003) A PCR-RFLP marker
distinguishing Ophiostoma clavigerum from morphologically
similar Leptographium species associated with bark beetles.
Canadian Journal of Botany, 81, 1104–1112.
Lee S, Kim JJ, Breuil C (2006) Diversity of fungi associated
with the mountain pine beetle, Dendroctonus ponderosae and
infested lodgepole pines in British Columbia. Fungal
Diversity, 22, 91–105.
Lee S, Hamelin RC, Six DL, Breuil C (2007) Genetic diversity
and the presence of two distinct groups in Ophiostoma
clavigerum associated with Dendroctonus ponderosae in British
Columbia and the northern Rocky Mountains.
Phytopathology, 97, 1177–1185.
Manni F, Guerard E, Heyer E (2004) Geographic patterns of
(genetic, morphologic, linguistic) variation: how barriers can
be detected by using Monmonier’s algorithm. Human Biology,
76, 173–190.
Marin M, Preisig O, Wingfield BD, Kirisits T, Wingfield MJ
(2009) Single sequence repeat markers reflect diversity and
geographic barriers in Eurasian populations of the conifer
pathogen Ceratocystis polonica. Forest Pathology, 39, 249–265.
Maynard Smith J, Smith NH, O’Rourke M, Spratt BG (1993)
How clonal are bacteria? Proceedings of the National Academy
of Sciences of the USA, 90, 4384–4388.
McDonald BA (1997) The population genetics of fungi: tools
and techniques. Phytopathology, 87, 448–453.
McDonald BA, Linde C (2002) Pathogen population genetics,
evolutionary potential, and durable resistance. Annual Review
of Phytopathology, 40, 349–379.
Milgroom MG (1996) Recombination and the multilocus
structure of fungal population. Annual Review of
Phytopathology, 34, 457–477.
Mock KE, Bentz BJ, O’Neill EM, Chong JP, Orwin J, Pfrender
ME (2007) Landscape-scale genetic variation in a forest
outbreak species, the mountain pine beetle (Dendroctonus
ponderosae). Molecular Ecology, 16, 553–568.
Morin C, Breuil C, Bernier L (2004) Genetic variability and
structure of Canadian populations of the sapstain fungus
Ceratocystis resinifera. Phytopathology, 94, 1323–1330.
Nei M (1978) Estimation of average heterozygosity and genetic
distance from a small number of individuals. Genetics, 89,
583–590.
Paetkau D, Slade R, Burden M, Estoup H (2004) Genetic
assignment methods for the direct, real-time estimation of
migration rate: a simulation-based exploration of accuracy
and power. Molecular Ecology, 13, 55–65.
Peakall R, Smouse PE (2005) GenAlEx 6: genetic analysis in
Excel. Population genetic software for teaching and research.
Molecular Ecology Notes, 6, 288–295.
Piry S, Luikart G, Cornuet JM (1999) BOTTLENECK: a
computer program for detecting recent reductions in the
effective population size using allele frequency data. Journal
of Heredity, 90, 502–503.
Piry S, Alapetite A, Cornuet JM, Paetkau D, Baudouin L,
Estoup A (2004) GENECLASS2: a software for genetic
� 2011 Crown in the right of Canada
assignment and first-generation migrant detection. Journal of
Heredity, 95, 536–539.
Plouffe A (1997) Ice flow and late glacial lakes of the Fraser
Glaciation, central British Columbia. In: Current Research
1997-A, pp. 133–143. Geological Survey of Canada, Canada.
Pritchard JK, Stephens M, Donnelly P (2000) Inference of
population structure using multilocus genotype data.
Genetics, 155, 945–959.
Raffa KF, Aukema BH, Bentz BJ et al. (2008) Cross-scale
drivers of natural disturbances prone to anthropogenic
amplification: the dynamics of bark beetle eruptions.
BioScience, 58, 501–517.
Rannala B, Mountain JL (1997) Detecting immigration by using
multilocus genotypes. Proceedings of the National Academy of
Sciences of the USA, 94, 9197–9201.
Raymond M, Rousset F (1995) GENEPOP (version 1.2):
population genetics software for exact tests and
ecumenicism. Journal of Heredity, 86, 248–249.
Rice AV, Langor DW (2009) Mountain pine beetle-associated
blue-stain fungi in lodgepole · jack pine hybrids near
Grande Prairie, Alberta (Canada). Forest Pathology, 39, 323–
334.
Rice AV, Thormann MN, Langor DW (2007) Virulence of, and
interactions among, mountain pine beetle associated blue-
stain fungi on two pine species and their hybrids in Alberta.
Canadian Journal of Botany, 85, 316–323.
Rice AV, Thormann MN, Langor DW (2008) Mountain pine
beetle-associated blue-stain fungi are differentially adapted
to boreal temperatures. Forest Pathology, 38, 113–123.
Robertson C, Nelson TA, Jelinski DE, Wulder MA, Boots B
(2009) Spatial-temporal analysis of species range expansion:
the case of the mountain pine beetle, Dendroctonus
ponderosae. Journal of Biogeography, 36, 1446–1458.
Roe AD, Rice AV, Bromilow SE, Cooke JEK, Sperling FAH
(2010) Multilocus species identification and fungal DNA
barcoding: insights from blue stain fungal symbionts of the
mountain pine beetle. Molecular Ecology Resources, 10, 946–
959.
Roe AD, James PMA, Rice AV, Cooke JEK, Sperling FAH
(2011a) Spatial community structure of mountain pine beetle
fungal symbionts across a latitudinal gradient. Microbial
Ecology, 62, 347–360.
Roe AD, Rice AV, Coltman DW, Cooke JEK, Sperling FAH
(2011b) Comparative phylogeography, genetic
differentiationand contrasting reproductive models in three
fungal symbionts of a multipartite bark beetle symbiosis.
Molecular Ecology, 20, 584–600.
Rosenberg NA (2004) DISTRUCT: a program for the graphical
display of population structure. Molecular Ecology Notes, 4,
137–138.
Safranyik L (2004) Mountain pine beetle epidemiology in
lodgepole pine. In: Mountain Pine Beetle Symposium:
Challenges and Solutions (eds Shore TL, Brooks JE and Stone
JE), pp. 33–40. Natural Resources Canada, Canadian Forest
Service, Pacific Forestry Centre, Information Report BC-X-
399.
Safranyik L, Carroll AL (2006) The biology and epidemiology
of the mountain pine beetle in lodgepole pine forests. In: The
Mountain Pine Beetle: A Synthesis of Biology, Management, and
Impacts on Lodgepole Pine (eds Safranyik L and Wilson B), pp.

86 C. K. M. T SUI E T A L.
3–66. Natural Resources Canada, Canadian Forest Service,
Pacific Forestry Service, Victoria, British Columbia, Canada.
Safranyik L, Carroll AL, Regniere J et al. (2010) Potential for
range expansion of mountain pine beetle into the boreal
forests of North America. The Canadian Entomologist, 142,
415–442.
Six DL (2003) A comparison of mycangial and phoretic fungi
of individual mountain pine beetles. Canadian Journal of
Forest Research, 33, 1331–1334.
Six DL, Klepzig KD (2004) Dendroctonus bark beetles as model
systems for studies on symbiosis. Symbiosis, 37, 207–232.
Six DL, Paine TD (1999) Allozyme diversity and gene flow in
Ophiostoma clavigerum (Ophiostomatales: Ophiostomataceae),
the mycangial fungus of the Jeffrey pine beetle, Dendroctonus
jeffreyi (Coleoptera: Scolytidae). Canadian Journal of Forest
Research, 29, 324–331.
Solheim H, Krokene P (1998) Growth and virulence of
mountain pine beetle associated blue-stain fungi, Ophiostoma
clavigerum and Ophiostoma montium. Canadian Journal of
Botany, 76, 561–566.
Stahl K, Moore RD, McKendry IG (2006) Climatology of winter
cold spells in relation to mountain pine beetle mortality in
British Columbia, Canada. Climate Research, 32, 13–23.
Taylor SW, Carroll AL, Alfaro RI, Safranyik L (2006) Forest,
climate and mountain pine beetle outbreak dynamics in
western Canada. In: The Mountain Pine Beetle: A Synthesis of
Biology, Management, and Impacts on Lodgepole Pine (eds
Safranyik L and Wilson B), pp. 67–94. Natural Resources
Canada, Canadian Forest Service, Pacific Forestry Service,
Victoria, British Columbia, Canada.
Tsui CKM, Feau N, Ritland CE et al. (2009a) Characterization
of microsatellite loci in the fungus Grosmannia clavigera, a
pine pathogen associated with the mountain pine beetle.
Molecular Ecology Resources, 9, 1501–1503.
Tsui CKM, Massoumi Alamouti S, Bernier L, Bohlmann J, Breuil
C, Hamelin RC (2009b) Population structure of Grosmannia
clavigera, a pine pathogen associated with mountain pine
beetle. Canadian Journal of Plant Pathology, 31, 139.
Weir BS, Cockerham CC (1984) Estimating F-statistics for the
analysis of population structure. Evolution, 38, 1358–1370.
Yamaoka Y, Hiratsuka Y, Maruyama PJ (1995) The ability of
Ophiostoma clavigerum to kill mature lodgepole-pine trees.
European Journal of Forest Pathology, 25, 401–404.
Zhou XD, Burgess TI, de Beer ZW et al. (2007) High
intercontinental migration rates and population admixture in
the sapstain fungus Ophiostoma ips. Molecular Ecology, 16, 89–
99.
C.K.M.Tsui is a research associate at UBC whose research
interests include evolution, ecology and population genetics of
fungal pathogens, as well as molecular detection of fungal dis-
eases. A.D.R. is a postdoctoral researcher at the University of
Alberta, and her research focuses on speciation and phylogeo-
graphy across a diverse range of organisms. Y.A.El-K. is a pro-
fessor at UBC with research interests on tree breeding and
forest genetics. A.V.R. is a postdoctoral researcher, and her
research interests are in the ecology and taxonomy of fungi
associated with the mountain pine beetle. S.M.A. is a doctoral
candidate investigating the speciation, evolution and ecological
adaptations of ophiostomatoid fungi. F.A.H.S. is a professor,
and his lab deals with patterns and processes of arthropod bio-
diversity ranging from the diversification to intraspecific phy-
logeography. J.E.K.C. is an assistant professor at the University
of Alberta, and her lab uses molecular and physiological
approaches to investigate how trees respond to environmental
cues such as fungal pathogen attack. J.B. is a professor of plant
biology with a research program on forest genomics and plant
biochemistry. R.H. is a research scientist and a professor of for-
est pathology with research interests in molecular epidemiol-
ogy and monitoring of forest pathogens.
Data accessibility
Sample locations and microsatellite data: DRYAD entry
doi:10.5061/dryad.48jg20v0.
Supporting information
Additional supporting information may be found in the online
version of this article.
Fig. S1 Graphical representation of five scenarios modelled in
DIY ABC for demographic expansion patterns of four genetic
clusters with the posterior probabilities (95% interval are in
brackets).
Fig. S2 Assignment of 293 isolates from 19 populations into
each of the optimal clusters identified using STRUCTURE.
Fig. S3 Assignment of 293 isolates from 19 populations to each
of the five optimal clusters identified using BAPS, in parallel to
the four clusters recognized in TESS.
Fig. S4 Principal Coordinates Analysis (PCoA) among 19 popu-
lations based on Nei’s unbiased genetic distance using GenAlEx.
Fig. S5 Plot of isolation by distance for the entire population
(blue diamonds), the genetic cluster ‘North’ (green triangles)
and the genetic cluster ‘Rocky’ (red squares).
Table S1 Prior distributions and the demographic and histori-
cal parameters estimated in DIY ABC analyses.
Table S2 Microsatellite profiles for 335 single-spore isolates
(isolates in grey were not included in the clone-corrected data
set).
Table S3 Admixture analysis for 293 single-spore isolates of
G. clavigera from 19 locations: average membership coefficients
in four clusters inferred with TESS.
Table S4 AMOVA results for the 12 G. clavigera populations
obtained in 2007–2008.
Table S5 Pairwise FST calculated with ARLEQUIN (assessed after
1000 permutations).
Appendix S1 Output file from SAMOVA for K = 4.
Please note: Wiley-Blackwell is not responsible for the content
or functionality of any supporting information supplied by the
authors. Any queries (other than missing material) should be
directed to the corresponding author for the article.
� 2011 Crown in the right of Canada