POPULATION ECOLOGY Objectives: I will be able to describe differences between exponential and...
18
POPULATION ECOLOGY
-
Upload
damon-joseph -
Category
Documents
-
view
216 -
download
1
Transcript of POPULATION ECOLOGY Objectives: I will be able to describe differences between exponential and...
POPULATION ECOLOGY

Objectives:• I will be able to describe differences between exponential
and logistic models of population growth.• I will be able to discuss characteristics of human population
growth.
Intro:
On a scrap piece of paper sketch two graphs:1.Linear growth graph2.Exponential growth graph
What will you plot on the x-axis?What will you plot on the y-axis?
Give your graphs appropriate titles.

Population EcologyPopulation = organisms of the same species that live in the same
area and interbreed.
Size of a population (N) = total number of individuals in the population.
Density of a population = total number of individuals per area occupied (i.e. 100 mosquitos/m2).
Dispersion = describes how individuals in a population are distributed (clumped, uniform, or random).
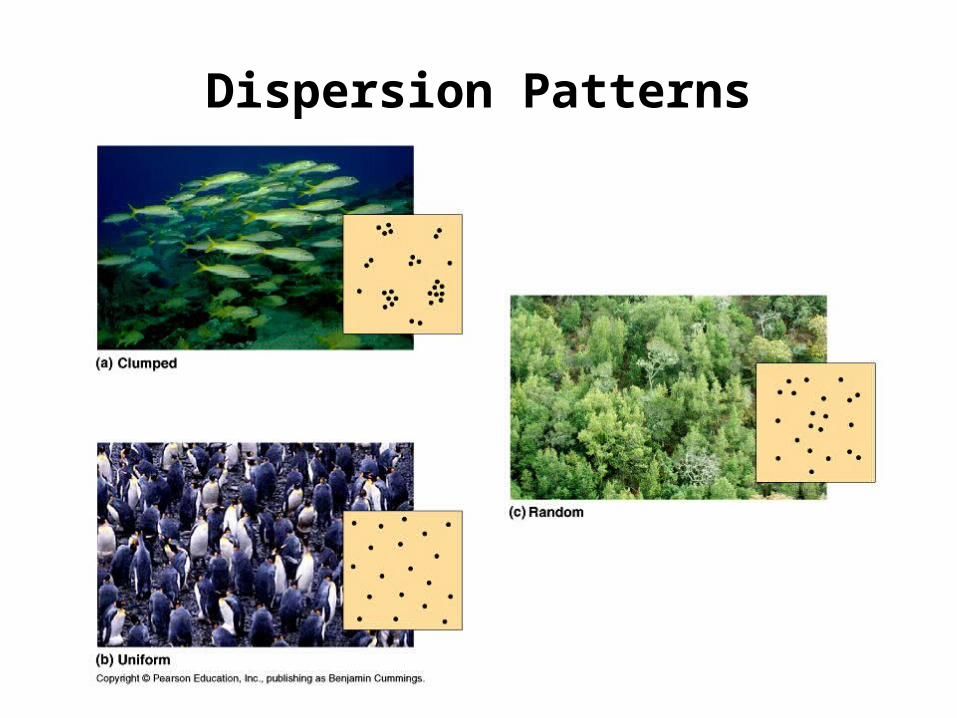
Dispersion Patterns
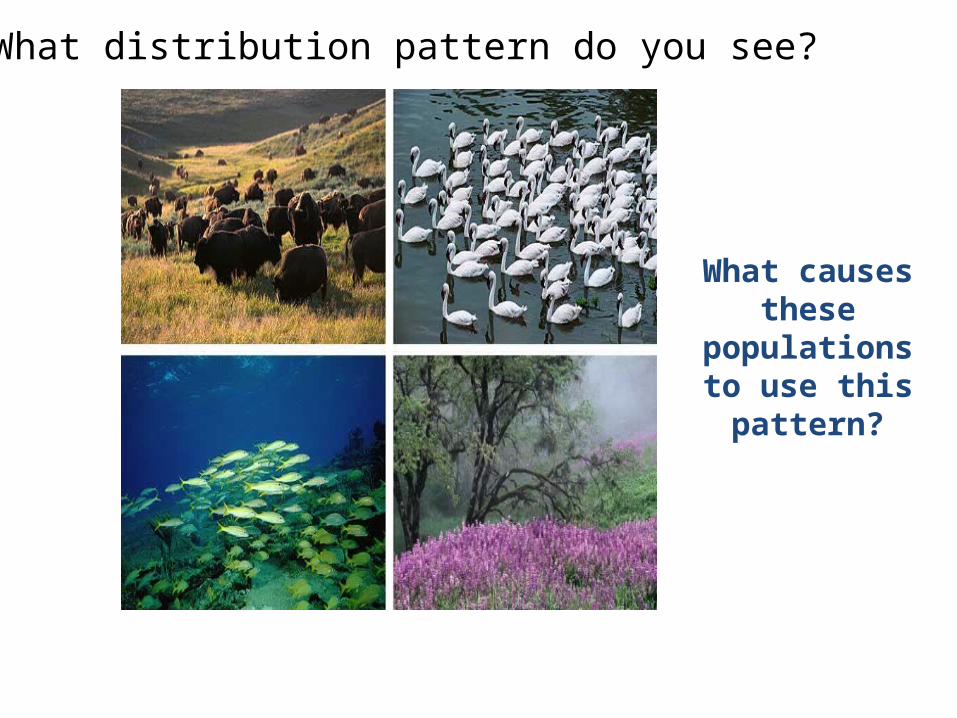
What distribution pattern do you see?
What causes these populations
to use this pattern?

Growing
Boom and bust
Shrinking
Population Sizes Fluctuate Over Time• Due to environmental conditions (presence of predators,
immigration/emigration, availability of nutrients, etc.).
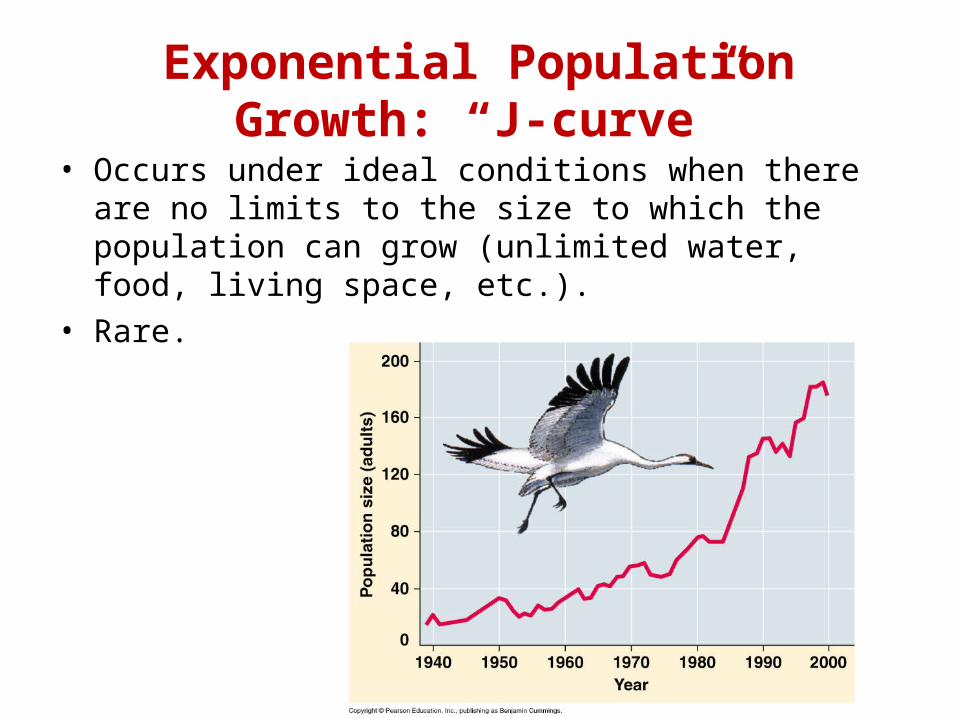
Exponential Population Growth: “J-curve”• Occurs under ideal conditions when there are no limits to the
size to which the population can grow (unlimited water, food, living space, etc.).
• Rare.
9
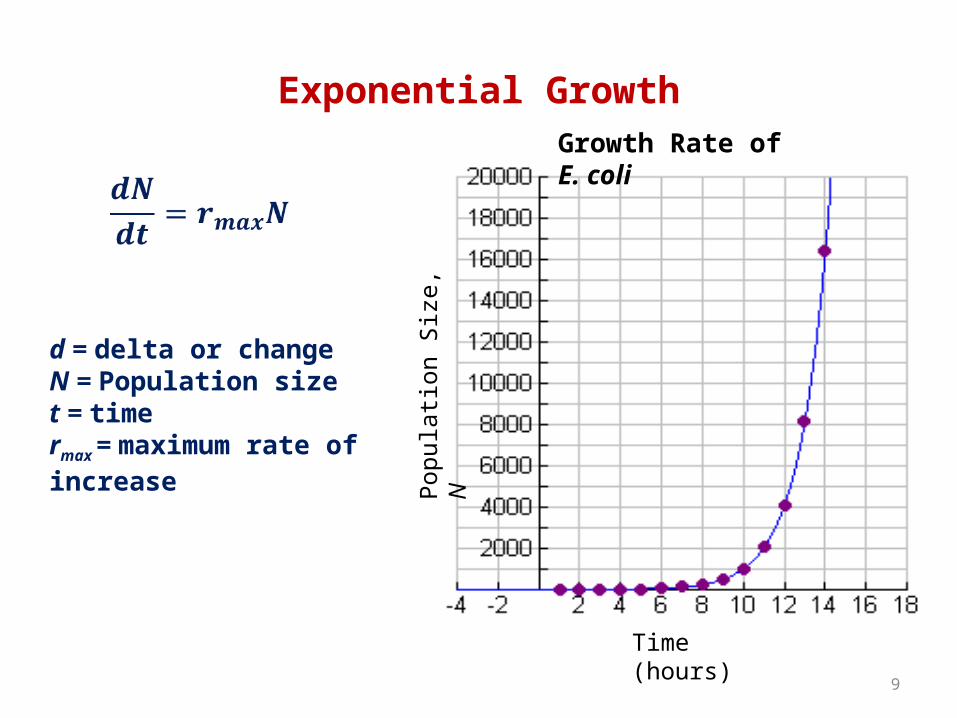
d = delta or changeN = Population sizet = timermax = maximum rate of increase
Pop
ulat
ion
Siz
e, N
Time (hours)
Growth Rate of E. coli
Exponential Growth
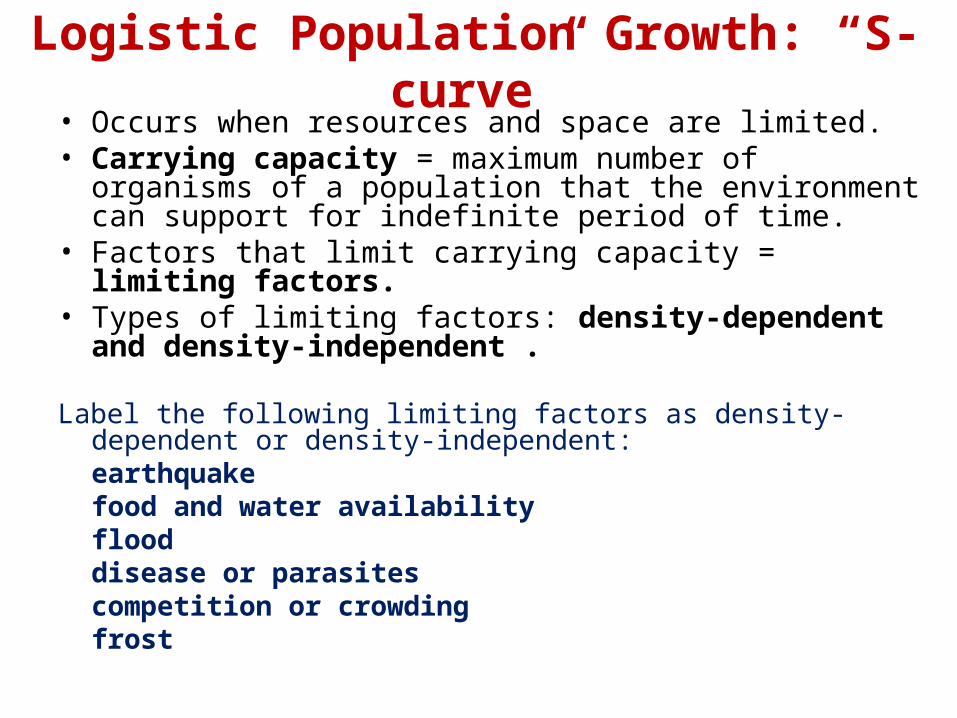
Logistic Population Growth: “S-curve” • Occurs when resources and space are limited.
• Carrying capacity = maximum number of organisms of a population that the environment can support for indefinite period of time.
• Factors that limit carrying capacity = limiting factors.• Types of limiting factors: density-dependent and density-
independent .
Label the following limiting factors as density-dependent or density-independent:
earthquakefood and water availabilityflooddisease or parasitescompetition or crowdingfrost
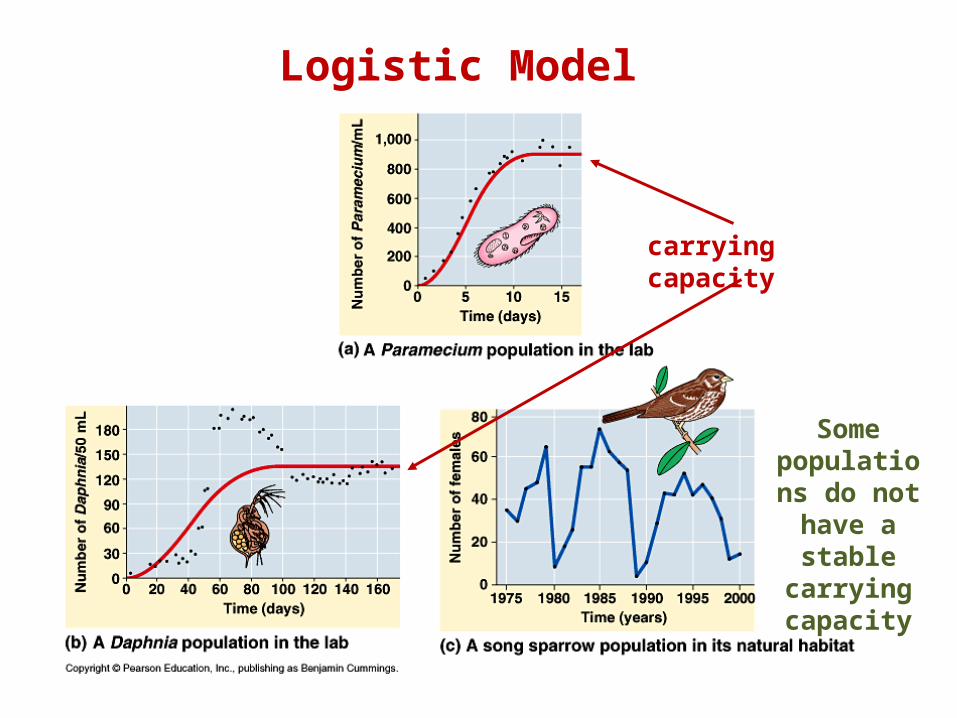
Logistic Model
carrying capacity
Some populations do not have
a stable carrying capacity
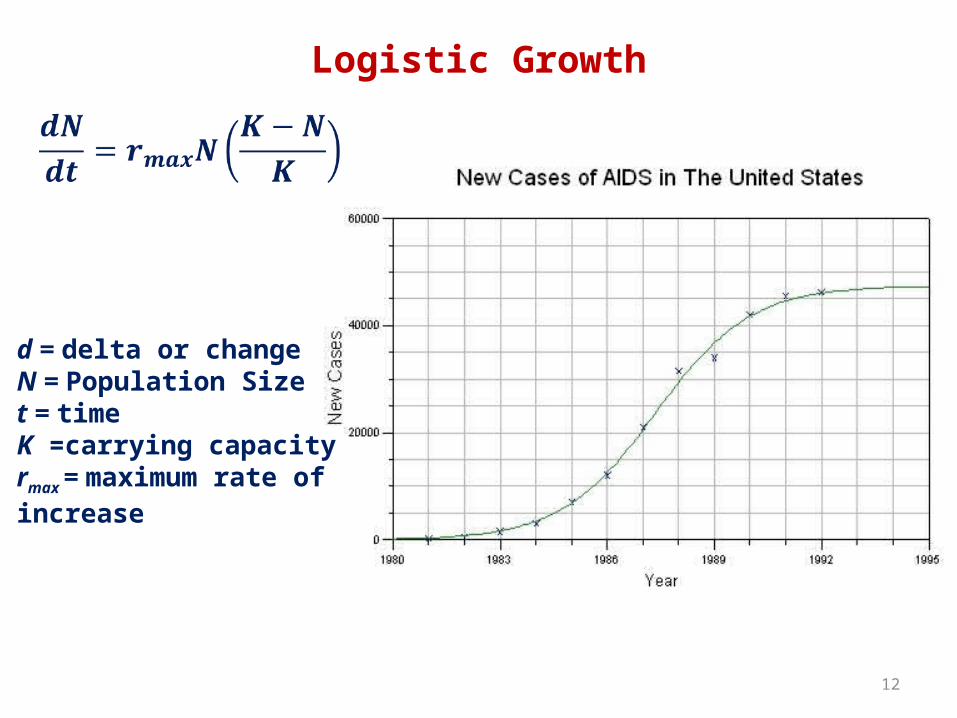
Logistic Growth
12
d = delta or changeN = Population Sizet = timeK =carrying capacityrmax = maximum rate of increase

Population Reproductive Strategies
r-selected species •Exhibit J-shaped curve,•Opportunistic species that quickly invade a habitat,•Short maturation and lifespan,•Many small offspring,•No parental care,•High death rate.
K-selected species •Exhibit S-shaped curve,•Long maturation & lifespan,•Few large offspring,•Extensive parental care,•Low death rate.
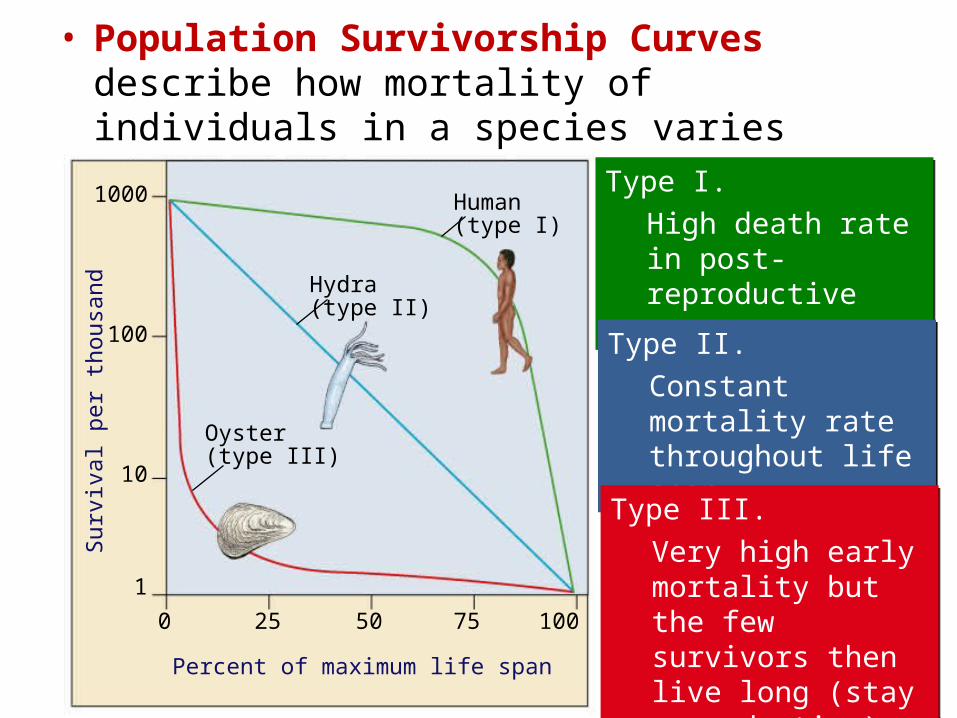
Survivorship curves• Population Survivorship Curves describe how
mortality of individuals in a species varies during their lifetimes.
0 25
1000
100
Human(type I)
Hydra(type II)
Oyster(type III)
10
1
50
Percent of maximum life span
10075
Su
rviv
al p
er th
ousa
nd
Type I.
High death rate in post-reproductive years.
Type I.
High death rate in post-reproductive years.
Type II.
Constant mortality rate throughout life span.
Type II.
Constant mortality rate throughout life span.
Type III.
Very high early mortality but the few survivors then live long (stay reproductive).
Type III.
Very high early mortality but the few survivors then live long (stay reproductive).
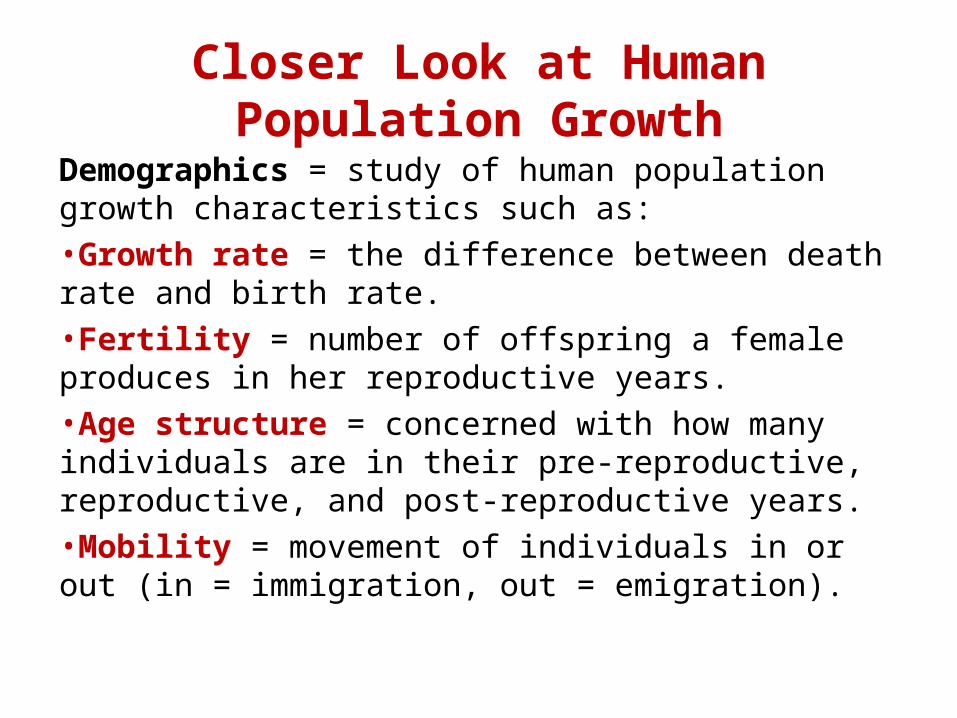
Closer Look at Human Population Growth
Demographics = study of human population growth characteristics such as:•Growth rate = the difference between death rate and birth rate.•Fertility = number of offspring a female produces in her reproductive years.•Age structure = concerned with how many individuals are in their pre-reproductive, reproductive, and post-reproductive years.•Mobility = movement of individuals in or out (in = immigration, out = emigration).
Percent of population Percent of population Percent of population
AfghanistanUnited States
Italy
Male Male MaleFemale Female FemaleAge85+
80–8475–7970–7465–6960–6455–5950–5445–4940–4435–3930–3425–2920–2415–1910–14
5–90–4
Age85+
80–8475–7970–7465–6960–6455–5950–5445–4940–4435–3930–3425–2920–2415–1910–14
5–90–4
10 0108 8 8 8 886 6 6 6 6 64 4 4 4 4 4222222 00
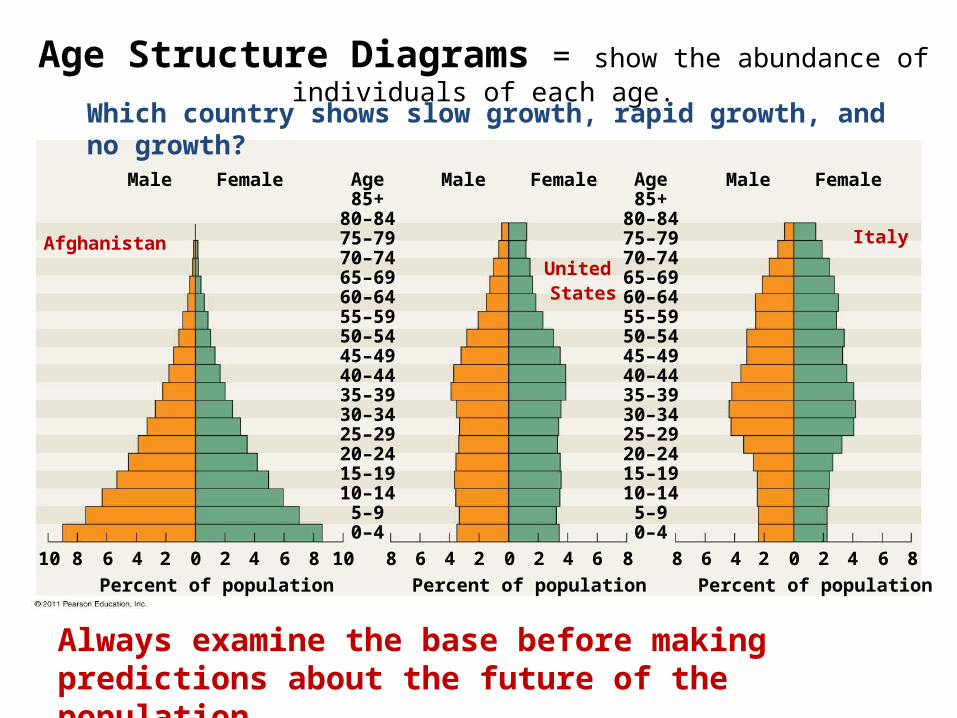
Age Structure Diagrams = show the abundance of individuals of each age.
Always examine the base before making predictions about the future of the population.
Which country shows slow growth, rapid growth, and no growth?
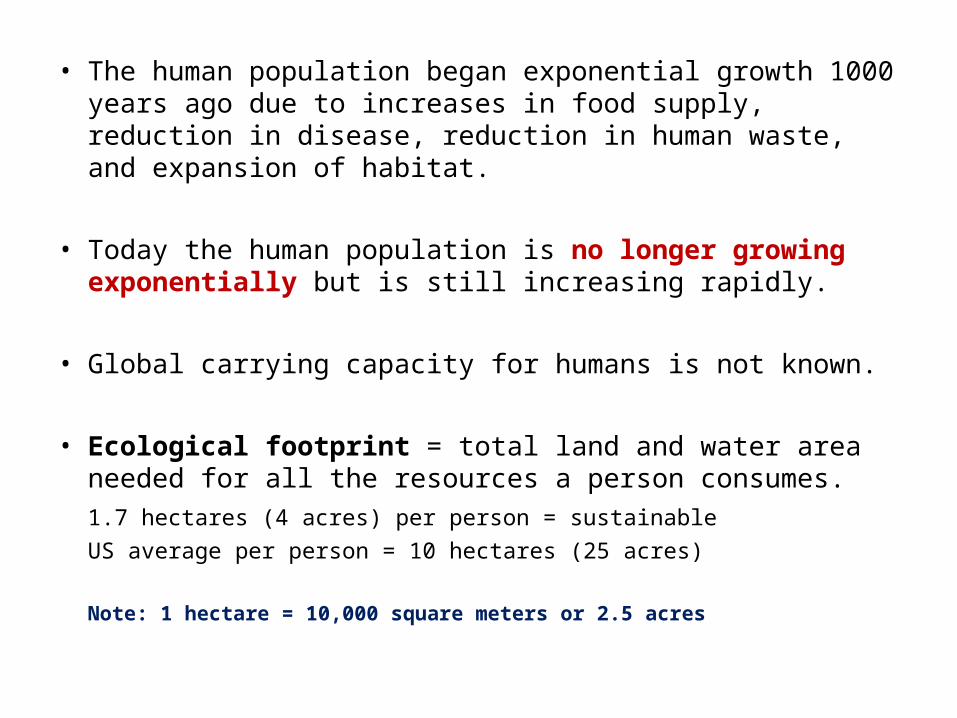
• The human population began exponential growth 1000 years ago due to increases in food supply, reduction in disease, reduction in human waste, and expansion of habitat.
• Today the human population is no longer growing exponentially but is still increasing rapidly.
• Global carrying capacity for humans is not known.
• Ecological footprint = total land and water area needed for all the resources a person consumes.1.7 hectares (4 acres) per person = sustainableUS average per person = 10 hectares (25 acres)
Note: 1 hectare = 10,000 square meters or 2.5 acres
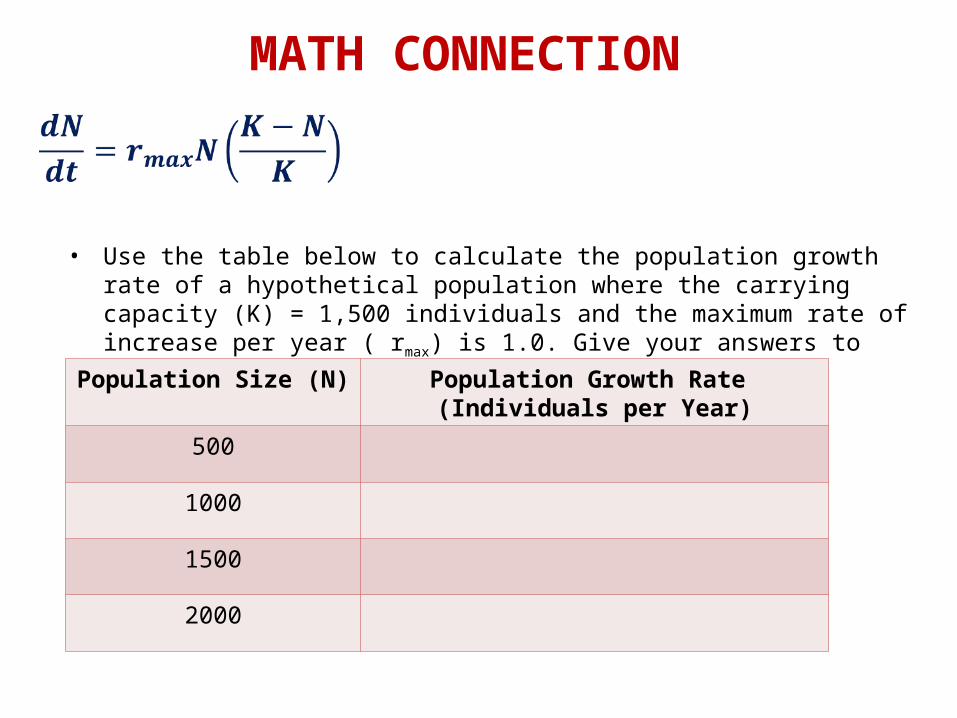
MATH CONNECTION
• Use the table below to calculate the population growth rate of a hypothetical population where the carrying capacity (K) = 1,500 individuals and the maximum rate of increase per year ( rmax) is 1.0. Give your answers to the nearest whole numbers.
Population Size (N) Population Growth Rate (Individuals per Year)
500
1000
1500
2000