POLISH INFORMATION AND FOREIGN INVESTMENT · PDF file · 2017-05-30POLISH...
21
POLISH INFORMATION AND FOREIGN INVESTMENT AGENCY World Investment Conference 2016, Istanbul Krzysztof Senger, Executive V-ce President Wojciech Fedko, Executive V-ce President
Transcript of POLISH INFORMATION AND FOREIGN INVESTMENT · PDF file · 2017-05-30POLISH...

POLISH INFORMATION
AND FOREIGN INVESTMENT AGENCY
World Investment Conference 2016, Istanbul
Krzysztof Senger, Executive V-ce President
Wojciech Fedko, Executive V-ce President

Diagnosis
Responsible Development Plan
Polish Trade and Investment Agency

Poland - Key Facts
Source: IMF, World Economic Outlook, http://www.tradingeconomics.com/poland/rating, 2016
6th largest country in the EU: area, population and economy
GDP: USD 1003 billion (PPP, 2015) – IMF
GDP per capita: USD 26,403 (PPP, 2015) – IMF
GDP growth (at market prices) 2008-2015: Poland 40% vs the EU: 12,5%
largest EU funds beneficiary: ~100 bn EUR in years 2014-2020
low public debt: 51.0% of the GDP v. the EU average 87.8%
FDI stock: 208.6 bn USD as of the end of 2014
membership: EU, NATO, OECD, WTO, Schengen Zone, AIIB

Main pillars of Poland’s economic performance
1
Public debt at safe level of 50% of GDP
Fiscal deficit below 3%
Well capitalized and efficient banking sector
Internal demand
2
38.5 million population with rising middle class and increasing
purchasing power parity
Poland is set to invest EUR 82.5 bn between 2014-2020 from EU,
which makes Poland the single largest recipient of the EU Funds
The investment are aimed at inclusive and sustainable growth,
improving innovativeness and improving communication
infrastructure
EU Funds inflow
3
Productivity improvements
25% productivity improvement between 2005-2015
Stronger real labour productivity than wages increase
Purchasing Managers’ Index (PMI) in manfacturing continued in
expansionary territory
4
FDI inflows
Most attractive FDI destination in CEE
Strong manufacturing base and booming BPO/SSC sector
EUR 171.6 bn of FDI stock at the end of 2014
5
EUR 3.5 bn foreign trade surplus with 7% annual export
dynamics in 2015
European leader in sectors such as: automotive parts and
components, processed food, furniture, yachts.
Exports
6Macroeconomic stability
5
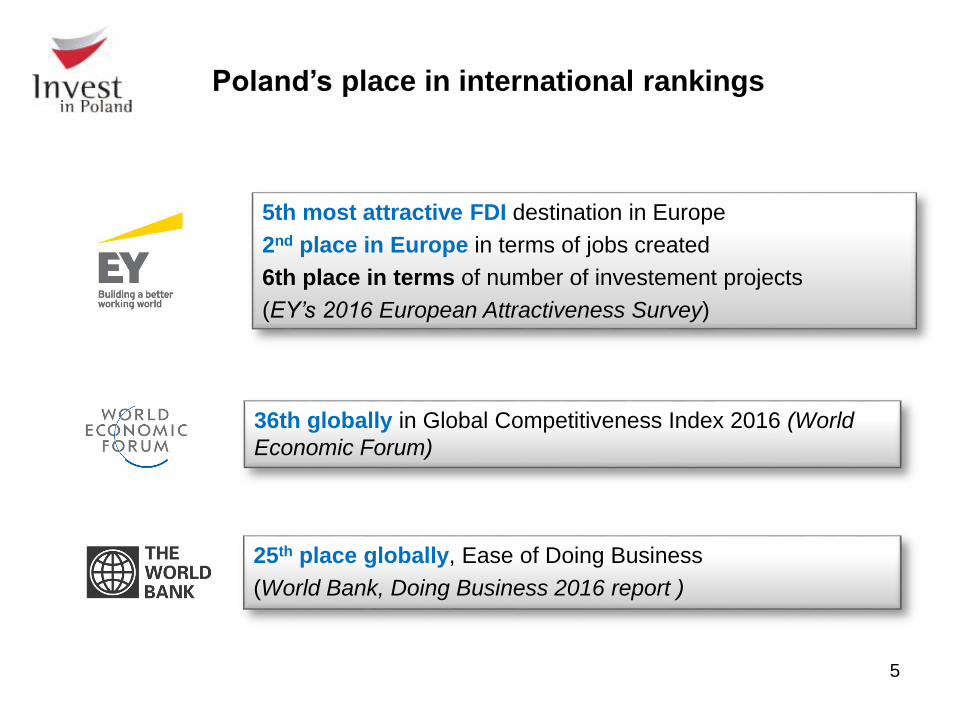
Poland’s place in international rankings
5th most attractive FDI destination in Europe
2nd place in Europe in terms of jobs created
6th place in terms of number of investement projects
(EY’s 2016 European Attractiveness Survey)
36th globally in Global Competitiveness Index 2016 (World
Economic Forum)
25th place globally, Ease of Doing Business
(World Bank, Doing Business 2016 report )

6
EY’s European Attractiveness Survey 2016
Source: EY, European Attractiveness Survey, 2016.
0
200
400
600
800
1,000
1,200
UK
Ger
man
y
Fran
ce
Spai
n
Net
her
lan
ds
Be
lgiu
m
Po
lan
d
Ru
ssia
Turk
ey
Ire
lan
d
Number of FDI projects
2014
2015
0
5,000
10,000
15,000
20,000
25,000
30,000
35,000
40,000
45,000
UK
Po
lan
d
Ger
man
y
Ru
ssia
Fran
ce
Ro
man
ia
Hu
nga
ry
Ire
lan
d
Serb
ia
Slo
vaki
a
FDI jobs created
2014
2015
0%
20%
40%
60%
80%
Germany UK France Netherlands Poland
TOP 5 countries for FDI in Europe
Poland’s comparative advantages
Quality/cost ratio of labour
Improving infrastructure
Social and economic stability

Wrocław
Services and Manufacturing Hubs in Poland I
HOUSEHOLD APPLIANCES
ELECTRONICS
AUTOMOTIVE

Services and Manufacturing Hubs in Poland II
AEROSPACE
Wrocław
BUSINESS SERVICES SECTOR
R & D

-500
-400
-300
-200
-100
0
100
200190
-469
-279
Poland’s FDI outflows lower than FDIs
inflows
0
5
10
15
20
25
30
Netherlands Germany Luxembourg France Spain
TOP 5 FDI source countries in Poland (FDI stock, 2014, EUR bn)
0
1
2
3
4
5
6
7
8
Cyprus Luxembourg Switzerland Netherlands CzechRepublic
TOP 5 FDI destination countries of Poland (FDI stock, 2014, EUR bn)
Poland’s net international investment position
(2015, EUR bn)
Source: NBP, Central Bank of Poland
Foreign Direct Investment – key figures
Diagnosis
Responsible Development Plan
Polish Trade and Investment Agency

More effective state
Solid public finance as a foundation for the
development
Modern infrastructure for the benefit of the
economic needs and quality of life
Increasing of Polish capital as a key to success
The best investment is investment in people
Responsible development is the
inclusive and not exclusive
development
Responsible development is the development
sustainable in territorial terms
Responsible development
is the development with a view to
future generations
Responsible Development Plan -increasing the responsibility of the state institutions in the economy
Sustainable economic growth based on innovative companies
Strong enterprises as a foundation of the economy

Main objective of the Responsible Development Plan
Creating the conditions for the growth of income of the Poles with the increase in the social, economic and territorial cohesion
Expected results
20-22%
Increase in gross disposable income of households percapita according to PPP in relation to the EU average
Further convergence of GDP per capitaof Poland and EU-28
Reduced percentge of people at risk of poverty or social exclusion

Foreign expansion
maintaining high export growth rate, while improving the level of its innovation and stimulating Polish FDI.
Intensifying the export and investment activity will allow Polish companies to achieve: higher and diversified revenue, higher efficiency and profitability and better technological level, which will translate into the improvement in their competitiveness in foreign markets
Expected effects
Average annual growth rate of the export value of goods Data source: GUS
Share of the export of high-tech products in the total export Data source: Eurostat
Increase in receivables due to Polish foreign direct investment (FDI)
Data source: NBP, unit of measure: billion EUR

Diagnosis
Responsible Development Plan
Polish Trade and Investment Agency

Optimal operating model
Polish Development Fund
Integration of various institutionsProject assumptions
Goal
Intended results
Market conditions
High potential
Polish development bank of extensive
investment potential
Achieving adequate scale for carrying out
large investment projects
Capital mobilized on international markets
Taking advantage of synergy between
various state owned enterprises i.a. PZU,
PKO BP,

• Export supportunit within PFR
• Financial offer
• Strong brandPoland
• Economicdiplomacyreform
FOREIGNEXPANSION
Foreign expansion – one of 5 main pillars of
Responsible Development Plan
Export and outwards
foreign directinvestment
support
Creation of Polish Trade and Investment Agency– integration and expansion of available tools
Reform of current Trade Promotion system–new network of overseas Trade Offices
Moden financial and advisory services –integrated financial tools scheme under Polish Development Fund
Completely new, comprehensive system of export and outwards investment support system, based on new institutions and new financial and advisory instruments
Modern, efficiency-driven network of institutions helping Polish companies in theiroperations abroad

New institutional framework
Targets setting, supervisionand control, bilateral policy in international economicrelations
Instytucje centralne
Dostęp do wiedzy i informacji
Placówki zagraniczn
e
Instrumenty wsparcia
Polish Development
Fund
KUKE BGKPolish Trade &
Investment Agency
Trade Officesabroad
Foreign Expansion Fund
Targets and strategy fulfilment, support instruments adjustedto needs and requirements of the businesses
Competence centers and executiveorganisations ensuring financialand advisory instruments
Overseas trade offices, supportingenterprises in the target markets
Ministry of Economic
Development

Polish economy promotion &
export support
Pillars of Polish Trade & Invest Agency
Comprehensive advisory, promotional and informational services in new Agency
Supporting foreignexpansion of
Polish enterprises
High quality FDIinflow into Poland
Estimated budget of around EUR 25 million in 2017 r. and EUR 50 million in 2018, as compared to EUR 3 million currently

Key markets for Poland are located in Europe Intensifying Poland’s presence on prospective markets: Asian, African and North-American Promotional programms implementedd on 5 markets: India, Vietnam, Iran, Algieria, Mexico
Supporting new directions in foreign expansion of Polish companies
new
remain
to be closed
Economicdiplomacyoffices
Heavy industry, furniture
Mineralresources, machinery
Food-processingchemical and wood-processing industries
Teheran (Iran)
First Trade Offices to be opened
San Francisco (USA)Nairobi (Kenya) Singapore Ho Chi Minh (Vietnam)

• state budget resources, resources from state special purpose funds and implementing agencies
• budget resources of local government units
• funds managed within the framework of the Polish Development Fund
• resources of other entities and organisational and legal forms of the public finance sector
National public resources
• European Structural & Investment Funds resources from the EU budget allocated for the programming period 2014-2020 (PA, operational programmes, RDP)
• EU programmes and initiatives other than the ESIF (e.g. CEF, Horizon 2020, COSME, LIFE, Erasmus +, EaSI)
• EEA and NFM financial mechanisms
• foreign credit, guarantee and warranty programmes (Juncker Plan, EIB, EIF, EBRD, WB and AIIB programmes)
• banking sector resources (credits granted under the system of warranties and guarantees)
• investment potential of enterprises
• investment potential of state-owned companies
Financing Responsible Development Plan
Foreignsources
Private resources

Thank you for your attention
00-585 Warszawa, ul. Bagatela 12
tel. (+48 22) 334 98 00, fax (+48 22) 334 99 99
e-mail: [email protected]