Spike timing dependent plasticity Homeostatic regulation of synaptic plasticity.

PLASTICITY IN THE AUDITORY CORTEX AND CHANGES IN PERCEPTUAL
DISCRIMINATION AFTER NUCLEUS BASALIS STIMULATION IN RATS
by
Amanda Christine Reed
APPROVED BY SUPERVISORY COMMITTEE:
__________________________________________
Dr. Michael P. Kilgard, Chair
__________________________________________
Dr. Marco Atzori
__________________________________________
Dr. Alice J. O’Toole
__________________________________________
Dr. LucienT. Thompson

Copyright 2008
Amanda Christine Reed
All Rights Reserved

PLASTICITY IN THE AUDITORY CORTEX AND CHANGES IN PERCEPTUAL
DISCRIMINATION AFTER NUCLEUS BASALIS STIMULATION IN RATS
by
AMANDA CHRISTINE REED, B.S., M.S.
DISSERTATION
Presented to the Faculty of
The University of Texas at Dallas
in Partial Fulfillment
of the Requirements
for the Degree of
DOCTOR OF PHILOSOPHY IN COGNITION AND NEUROSCIENCE
THE UNIVERSITY OF TEXAS AT DALLAS
August, 2008
3323630
3323630 2008

iv
PREFACE
This dissertation was produced in accordance with guidelines which permit the inclusion
as part of the dissertation the text of an original paper or papers submitted for publication. The
dissertation must still conform to all other requirements explained in the “Guide for the
Preparation of Master’s Theses and Doctoral Dissertations at The University of Texas at Dallas.”
It must include a comprehensive abstract, a full introduction and literature review and a final
overall conclusion. Additional material (procedural and design data as well as descriptions of
equipment) must be provided in sufficient detail to allow a clear and precise judgment to be
made of the importance and originality of the research reported.
It is acceptable for this dissertation to include as chapters authentic copies of papers
already published, provided these meet type size, margin and legibility requirements. In such
cases, connecting texts which provide logical bridges between different manuscripts are
mandatory. Where the student is not the sole author of a manuscript, the student is required to
make an explicit statement in the introductory material to that manuscript describing the
student’s contribution to the work and acknowledging the contribution of the other author(s).
The signatures of the Supervising Committee which precede all other material in the dissertation
attest to the accuracy of this statement.
v
ACKNOWLEDGEMENTS
First I must sincerely thank my husband Nick for his encouragement and patience
throughout this process. I am also so thankful to my parents for everything they’ve given to me.
I’m so lucky and proud to have all of you in my life.
Second, I’ve had one of the most ideal graduate experiences possible, and this is in large
part because of my mentor. I’ve worked with Dr. Kilgard for the past eight years, and I think it’s
a special thing that I’ve enjoyed working with him for all of those eight years. I’ve had the
opportunity to learn just about everything I need to know to be a scientist, but I was never left to
flounder for too long when I was stuck. Thank you so much for always being so encouraging
and optimistic about my work, even when I couldn’t see past its flaws. I would also like to thank
my committee members, Dr. Alice O’Toole, Dr. Marzo Atzori, and Dr. Tres Thompson, for their
encouragement and advice during the dissertation writing process.
I have worked with many wonderful colleagues. I would like to thank Crystal Engineer
for being such a wonderful friend and behavior training partner throughout the years. I would
like to thank Vikram Jakkamsetti for always being so willing to help out with experiments, even
when he was very busy with work of his own. I would also like to thank Benjamin Porter,
Kamalini Ranasinghe and Jai Shetake for being great labmates over the past year. Finally, I want
to thank Pritesh Pandya, Navzer Engineer, Cherie Percaccio, Raluca Moucha, Claudia Perez,
Dwayne Listhrop, Wendy Dai, and Hoang Ho for being wonderful mentors and labmates as I
was starting out.
vi
I have worked with dozens of talented undergraduate students, and without their help I
would never have been able to complete this dissertation. I want to especially thank Jonathan
Riley for all of his hard work during my last year of data collection and analysis. It is difficult to
overstate how helpful he has been, and I am very proud of how much he has been able to
accomplish in the past few years. Ryan Carraway was also instrumental to the completion of this
project because of his tireless dedication to training students and collecting data. I never would
have completed this project without my own expert physiologist who was always willing to work
a night shift. I am truly blessed to have been able to work with both of these students.
I would also like to say a very sincere thank you to the following students who also
contributed to the collection of data and completion of these research projects: Chris Heydrick,
Matt Perry, Holley Fenus, Pei-Lan Kan, Joanna Gibbons, Alyssa McMenamy, Anushka Meepe,
Vismay Badhiwala, Jarod Roland, Kevin Chang, Jonathan Seale, Juliann Record, Yormynelly
Grajales, Maria Luisa de la Vega, Trishna Sharma, Robert Frazier, Cathy Haupstueck, Jeans Lee
Choi, Chikara Dablain, Jeanne Pan, Christie Cherian, Brian Frankel, Bardiya Shadmehr, Ryan
Williams, Ashley Hudson, Binny Philip, Jeremy Strain, Julian Mensah, Cherri Whang, Judie
Abraham, Valerie Roberts, Fern Yoon, Adria Webb, Jesse Alaniz, Nick Hatate, Charles Coats,
Tara Jasti, Denisa Kavikova, Ryan Cheung, Liliana Garland, and Seth Ferguson. I wish I had
enough room to enumerate how much each of you have contributed and meant to me.
Finally, I would like to thank Dean Michael Coleman for starting me off down this path
by first introducing me to the UTD campus and then to Dr. Kilgard. You have had a profound
impact on my life, and I am very grateful.
June, 2008

vii
PLASTICITY IN THE AUDITORY CORTEX AND CHANGES IN PERCEPTUAL
DISCRIMINATION AFTER NUCLEUS BASALIS STIMULATION IN RATS
Publication No. _________
Amanda Christine Reed, Ph.D.
The University of Texas at Dallas, 2008
Supervising Professor: Michael P. Kilgard, Ph.D.
Humans and many other species have the capacity to learn and change their behavioral responses
when they repeatedly practice a discrimination task. This change in behavior must be caused by
changes in response properties of the nervous system. Understanding the relationship between
learning and changes in neural responses has been an important field of study for the past twenty
years. Numerous papers have observed correlations between plasticity in primary cortical areas
and improved perceptual discrimination abilities, implying that this plasticity is the underlying
cause of improved performance. However, a causal relationship cannot be proven unless
plasticity is induced outside of a behavioral context. In the following dissertation I document the
perceptual consequences of plasticity induced using stimulation of the nucleus basalis paired
with auditory stimuli. The nucleus basalis is a deep-brain structure which releases acetylcholine
onto the neocortex during behaviorally important events. Damage to this structure has been
shown to impair both learning and plasticity, and stimulation during presentation of sensory
stimuli produces plasticity which mimics the effects observed after behavioral training. We

viii
demonstrate for the first time that pairing nucleus basailis stimulation with a tone can alter
learning and performance of a frequency discrimination task. We also document a pattern of
plasticity after discrimination training and nucleus basalis stimulation which indicates that
cortical plasticity in primary sensory areas may be important for learning but not performance of
a discrimination task. Finally, we report a further possible source of cortical plasticity and
behavioral improvement by showing that nucleus basalis-stimulation pairing can cause stimulus-
specific plasticity in both primary and secondary cortical areas. The results of these studies
reveal that cortical plasticity contributes to sensory discrimination and perceptual learning, and
provide new insights about the relationship between cortical plasticity and continued
performance of well-learned behavioral tasks.
ix
TABLE OF CONTENTS
Preface............................................................................................................................................ iv
Acknowledgements ......................................................................................................................... v
Abstract ......................................................................................................................................... vii
Table of Figures ............................................................................................................................. xi
Chapter 1: Introduction ................................................................................................................... 1
Chapter 2: Perceptual consequences of cortical receptive field plasticity ...................................... 6
Acknowledgements ..................................................................................................................... 7
Abstract ....................................................................................................................................... 8
Introduction ................................................................................................................................. 9
Results ....................................................................................................................................... 11
Discussion ................................................................................................................................. 18
Methods ..................................................................................................................................... 20
Appendix 1: Figures .................................................................................................................. 25
Appendix 2: Supplemental Data ............................................................................................... 30
Appendix 3: Automatic tuning curve analysis .......................................................................... 33
References ................................................................................................................................. 39
Chapter 3: Plasticity in the rat posterior auditory field following nucleus basalis stimulation .... 41
Acknowledgements ................................................................................................................... 42
Abstract ..................................................................................................................................... 43
Introduction ............................................................................................................................... 44
Methods ..................................................................................................................................... 46
x
Results ....................................................................................................................................... 52
Discussion ................................................................................................................................. 61
Appendix 1: Figures .................................................................................................................. 68
References ................................................................................................................................. 79
Chapter 4: Conclusion................................................................................................................... 84
References ..................................................................................................................................... 89
Vita

xi
LIST OF FIGURES
Figure 2. 1. . ................................................................................................................................. 25
Figure 2. 2. .................................................................................................................................... 26
Figure 2. 3 .................................................................................................................................... 27
Figure 2. 4.. .................................................................................................................................. 28
Figure 2. 5. ................................................................................................................................... 29
Figure A2. 1.. ............................................................................................................................... 30
Figure A2. 2. ................................................................................................................................ 31
Figure A2. 3 .................................................................................................................................. 32
Figure A3. 1.. ................................................................................................................................ 33
Figure A3. 2. ................................................................................................................................. 36
Figure 3. 1.. ................................................................................................................................... 68
Figure 3. 2. .................................................................................................................................... 69
Figure 3. 3.. ................................................................................................................................... 70
Figure 3. 4. .................................................................................................................................... 71
Figure 3. 5. .................................................................................................................................... 72
Figure 3. 6.. ................................................................................................................................... 73
Figure 3. 7.. ................................................................................................................................... 74
Figure 3. 8. .................................................................................................................................... 75
Figure 3. 9. .................................................................................................................................... 76
Figure 3. 10. .................................................................................................................................. 77
Figure 3. 11. .................................................................................................................................. 78

1
CHAPTER 1
INTRODUCTION
The capacity of our nervous system to change its response properties is called plasticity.
This capacity is most recognizable when we watch young children learn to walk and talk. In
infants, the nervous system is constantly plastic as the brain adjusts to new environmental stimuli
and develops the circuitry that will be necessary to communicate with others and interpret and
interact with their surroundings. Once we reach adulthood, much of our basic neural circuitry is
intact, but we still acquire new skills throughout our lifetime. Plasticity occurs as parents learn
to interpret their young child’s first attempts at speech, as athletes practice and perfect their golf-
swings, and as new college students learn how to find their classes on a unfamiliar college
campus. Even more importantly, these people are able to learn and acquire these skills without
sacrificing other abilities that they posses. This capacity to acquire plasticity in a balanced way
shows that plasticity is tightly controlled by both what we experience (stimulus inputs) and how
much we respond to these inputs (attention/behavioral engagement).
Plasticity in adults is observed when stimulus inputs have been permanently altered or when
stimuli are behaviorally relevant. Peripheral nerve injuries can lead to a complete and permanent
disruption in the pattern of inputs that a sensory cortex receives. For example, after amputation
of a finger, the area of cortex that had represented that finger would lose its primary source of
input activity. However, rather than simply becoming a ‘silent’ area of cortex that does not
respond to any inputs, this cortical area reorganizes its receptive field properties to begin to
respond in a similar fashion as neighboring cortex (Merzenich et al. 1984). Similarly, central

2
nervous system injuries such as stroke or traumatic brain injury can lead to a situation in which
peripheral nerve inputs are no longer represented within sensory cortex. Surrounding areas may
then take over the functional role of the lesioned cortex. This plasticity can lead to
improvements in sensation or movement abilities, and is hypothesized to be one of the primary
sources of stroke recovery (Cramer and Riley 2008). However, in addition to plasticity after
traumatic peripheral and central nervous system injuries, the adult brain experiences plasticity
during normal learning situations. For example, monkeys who were trained to perform a simple
frequency discrimination task showed changes in their primary auditory cortex so that more
auditory cortex neurons were responsive to the behaviorally relevant stimuli (Recanzone et al.
1993). This finding has been reproduced across several species, including rats and humans
(Menning et al. 2000; Polley et al. 2006; Rutkowski and Weinberger 2005). The type of
plasticity that is observed after training seems to be dependent on the task parameters that were
most behaviorally important. For example, rats and monkeys that were trained to perform a
temporal discrimination task showed improved temporal processing in primary cortical areas
(Bao et al. 2004; Recanzone et al. 1992). Training on an intensity discrimination task leads to
changes in the intensity response profiles of primary auditory cortex neurons (Polley et al. 2006).
Plasticity is also dependent on behavioral relevance, in that stimuli that are not behaviorally
relevant do not lead to changes in receptive field properties (Bao et al. 2004; Recanzone et al.
1993; Zhang et al. 2001).
In adults, plasticity during learning is primarily controlled by attention/arousal, and therefore
by neuromodulator release. Behaviorally important events lead to activation of the limbic
system, which in turn results in the activation of several subcortical structures that project to the
cortex and release neuromodulators. Several neurotransmitters such as acetylcholine,
3
norepinephrine, dopamine and serotonin are released during behaviorally important events
(Myhrer 2003). The gating of plasticity through the release of these neuromodulators prevents
plasticity in response to behaviorally irrelevant stimuli.
The cholinergic system seems to be particularly important for learning and plasticity. The
entire neocortex receives cholinergic inputs from the nucleus basalis, which is active during both
positive and negative behavioral events (Richardson and DeLong 1991). Disruption of these
cholinergic fibers impairs learning and cortical plasticity associated with skilled reaching tasks
(Conner et al. 2005; Conner et al. 2003). It has also been shown that stimulation of the nucleus
basalis (NB-stimulation) causes cortical plasticity that resembles the changes that occur after
behavioral training (Bakin and Weinberger 1996; Kilgard and Merzenich 1998). Therefore,
activation of the cholinergic system appears to be necessary for normal plasticity and for
improvements caused after learning to take place. Just as in behavioral studies, the stimulus
parameters that are paired with NB-stimulation pairing control the form that cortical plasticity
takes. For example, pairing NB-stimulation with a simple tone results in enlarged representation
of that tone in primary auditory cortex(Kilgard and Merzenich 1998), while pairing NB-
stimulation with temporally modulated stimuli leads to changes in temporal response properties
of auditory cortex neurons(Kilgard et al. 2001). The similarity between plasticity after NB-
stimulation and the plasticity that occurs after behavior implies that these two techniques employ
similar plasticity mechanisms.
If plasticity is the basis of perceptual discrimination improvement, then any techniques that
lead to plasticity should also lead to changes in perceptual abilities. For example, subjects
commonly report improved discrimination thresholds for stimuli that have an expanded
representation because they are at the edge of peripheral lesions (i.e., frequencies that are
4
adjacent to a hearing loss due to cochlear damage) (Irvine et al. 2001; McDermott et al. 1998).
Plasticity induction techniques can also change perceptual discrimination performance. A study
in the auditory system looking for changes in frequency discrimination after intracortical
microstimulation did not show alterations in frequency discrimination performance after
stimulation (Talwar and Gerstein 2001). However, Dinse and colleagues used a tactile
coactivation protocol to produce temporary receptive field reorganization in the primary
somatosensory system, and found that subjects had improved two-point discrimination
performance while receptive field reorganization persisted (Dinse et al. 2003; Godde et al. 2000).
These two studies together indicate that short-term plasticity may induce altered perceptual
abilities if this plasticity is of sufficient magnitude. The plasticity created after intracortical
microstimulation and after tactile coactivation is smaller and more transient in nature than the
plasticity observed after nucleus basalis stimulation. We predict that a technique such as NB-
stimulation that causes extensive long-term plasticity will cause long-lasting alterations in
discrimination abilities. This hypothesis is tested in Chapter 2 of this dissertation.
Many studies that examine plasticity after behavioral training or other plasticity techniques
focus on a single station within the auditory cortex. However, plasticity after behavioral training
or nucleus basalis stimulation can affect the response properties of many subcortical and cortical
stations simultaneously. Studies of classical conditioning have found evidence of plasticity in
subcortical stations such as the thalamus and inferior colliculus (Edeline 2003; Edeline and
Weinberger 1992, 1991a, b; Ji et al. 2001), and have also found evidence of plasticity in both
primary and secondary cortical areas (Diamond and Weinberger 1986, 1984). If plasticity after
NB-stimulation is mechanistically similar to the plasticitiy observed after behavioral training, we
would expect to see a similar pattern plasticity across multiple auditory stations after NB-
5
stimulation pairing. Pairing NB-stimulation with a single tone stimulus causes receptive field
reorganization of primary auditory cortex. This reorganization in A1 then causes receptive field
reorganization in the auditory thalamus and in the inferior colliculus via top-down connections
that alter response properties in both of these subcortical areas(Ma and Suga 2005; Zhang and
Yan 2008). The purpose of Chapter 3 of this dissertation was to verify that both primary and
secondary cortical areas show stimulus-specific plasticity after NB-stimulation pairing.
The rest of this dissertation contains three chapters and two appendix sections. Chapter 2
addresses the main aim of this dissertation, which was to determine the perceptual consequences
of cortical map plasticity induced by NB-stimulation pairing. The two appendix sections provide
supplementary data and a more detailed description one of the analysis techniques employed in
this paper. Chapter 3 of this dissertation reports on plasticity in secondary cortical areas after
NB-stimulation pairing. Chapter 4 discusses the interpretation and clinical relevance of the
primary findings of this dissertation.

6
CHAPTER 2
PERCEPTUAL CONSEQUENCES OF CORTICAL RECEPTIVE FIELD PLASTICITY
Amanda C. Reed, Jonathan Riley, Ryan Carraway, Rafael Carrasco, Vikram Jakkamsetti,
Claudia Perez, Michael P. Kilgard
Department of Brain and Behavioral Sciences, GR41
The University of Texas at Dallas
800 West Campbell Road
Richardson, Texas 75080

7
ACKNOWLEDGEMENTS
Many people have contributed to the experiments which are reported in this chapter. My
advisor, Michael Kilgard, participated in the initial design of these experiments, and performed
many of the physiology surgeries. His guidance in writing and editing this manuscript has been
invaluable. Jonathan Riley conducted the experiments reported as the Task-Naïve group for his
honors thesis experiment. He helped design the experiments, supervised the daily behavior and
NB-stimulation data collection, performed preliminary analysis of behavioral data, and assisted
with mapping experiments for the Task-Naïve and Pretrained groups. Ryan Carraway helped
collect data for every experimental and control mapping for the NB-stimulation and behavior
experiments. He also assisted with the initial design of the Task-Naïve groups of experiments,
managed teams of undergraduate students who collected behavioral data, and performed portions
of the initial electrophysiology experiments. Rafael Carrasco designed, implemented, and
collected all of the mapping data for NB-stimulation time course experiments. These
experiments are being included in the draft of this paper, but should not be considered to be a
portion of Amanda Reed’s dissertation. Vikram Jakkamsetti performed several
electrophysiological surgeries for control and experimental groups for the behavior and NB-
stimulation experiments. Claudia Perez helped extensively with data collection for these groups.
The authors would also like to thank Kevin Chang, Crystal Engineer, Navzer Engineer, Ben
Porter and Jai Shetake for input on the manuscript and experimental assistance.
8
ABSTRACT
A correlation between behavioral improvement and cortical plasticity has been observed
over many studies in the past twenty years. However, a causal relationship between cortical
plasticity and perceptual abilities has been difficult to establish. In the current study, we used
nucleus basalis stimulation pairing to induce receptive field plasticity in the primary auditory
cortex and examined how this plasticity altered frequency discrimination abilities. We found
that receptive field plasticity induced outside of a behavioral context is sufficient to alter
frequency discrimination performance. We also observed that cortical plasticity is not
maintained in highly-trained animals and thus is not necessary for frequency discrimination
performance. These results highlight the complexity of the relationship between cortical
plasticity and perceptual discrimination.

9
INTRODUCTION
Learning must be accompanied by changes in brain responses. In the field of sensory
learning, it has often been assumed that improvements in discrimination performance are the
result of altered representations of stimuli within a particular sensory station. However, the
plasticity which enables improved discrimination performance may be labile in and of itself, and
may not always be representated in the same way within sensory areas. Discrimination
performance improves and representation of task-relevant stimuli is increased in the visual cortex
during early learning, but after a few weeks plasticity fades while discrimination performance
remains the same (Yotsumoto et al. 2008). A similarly complex relationship exists in the
auditory system – an increase in the representation of behaviorally relevant stimuli within
primary auditory cortex has been correlated with improved discrimination performance (Polley
et al. 2006; Recanzone et al. 1993; Rutkowski and Weinberger 2005) but this increased
representation is not always present after discrimination training which results in perceptual
improvement(Brown et al. 2004). These contradictions in the literature may be resolved by the
hypothesis that receptive-field plasticity in sensory systems is important for learning of a
discrimination task, but that sensory plasticity is not necessary for the performance of learned
discriminations.
If plasticity is important for discrimination learning, then plasticity induced outside of a
behavioral context should have behavioral consequences. In order to significantly impact
discrimination learning or performance, plasticity would have to induce long-lasting stimulus-
10
specific plasticity within sensory systems. Plasticity could improve behavior if it mimics changes
usually observed during learning. Plasticity could worsen behavior if it leads to contrary shifts in
receptive field plasticity.
Long-term, stimulus specific plasticity can be induced in the auditory system by stimulating
the cholinergic nucleus basalis (NB) concurrently with auditory stimulus presentation (20 daily
sessions of 300-320 tone/stimulation pairings in each session). Previous studies have
demonstrated that NB-tone pairing leads to receptive field plasticity in the primary auditory
cortex which mimics the changes observed after behavioral training (Kilgard and Merzenich
1998a). These changes are also observed in secondary cortical areas such as the posterior
auditory field(Puckett et al. 2007), and subcortical stations of the auditory system, such as the
inferior colliculus and thalamus (Ma and Suga 2005). This indicates that NB-tone pairing is an
effective technique to induce widespread, stimulus-specific plasticity in the auditory system apart
from a behavioral context.
To determine if plasticity in the auditory system is important for learning and performance of
auditory discrimination tasks, we used NB-tone pairing to induce auditory system plasticity and
examined performance on a low-frequency discrimination task.
11
RESULTS
We predicted that low-frequency receptive field plasticity induced by NB-tone pairing would
improve learning of a low-frequency discrimination task because animals would enter training
with distinct neural representations of low-frequency tones. Fifteen rats were trained to perform
an easy noise-discrimination task so they would be familiar with the procedural aspects of the
go/no-go task before moving on to one month of tone exposure (Figure 2.1A, and see Appendix
2 for noise discrimination behavior data). During tone exposure, all groups heard both low (2
kHz) and high (19 kHz) tones. This balanced design was possible because none of the animals
were familiar with tones before NB-tone pairing and would not have formed any behavioral
associations other than those induced by NB-stimulation. The low tone was paired with NB
stimulation for the Task-Naïve Low group (n=5), while the high tone was paired with NB
stimulation for the Task-Naïve High group (n=5). A passive control group (Task-Naïve Passive,
n=5) heard both tones but received no NB-stimulation pairing. After tone exposure, all rats were
trained to perform a low frequency tone discrimination task (1.8 kHz target vs. distracters 0.5,
1.0, and 2.4 octaves above the target).
The Task-Naïve Low group learned to perform the low frequency discrimination task more
quickly than the Task Naïve High or Task-Naïve Passive groups (Figure 2.1B). By the end of
the easy discrimination period, the Task-Naïve Low group performed the discrimination task
significantly better than the other two groups (d’ discrimination of all three distracter tones, F
(2,14) = 4.9399, p = 0.0272, repeated measures ANOVA). While the Task-Naïve Low group
was able to discriminate all three distracter stimuli from the target (Figure 2.1C), the Task-Naïve
12
High group was only able to perform the easiest discrimination task (Figure 2.1D). After seven
days of testing the Task-Naïve Passive group was not able to perform any of the discriminations
above chance (Figure 2.1E). These results indicate that NB-tone pairing enhances tone
frequency discrimination learning most when the paired tone is in a frequency range that is
relevant to the task.
If cortical plasticity is a substrate of discrimination performance, then well-trained animals
should also be susceptible to changes in discrimination performance after NB-tone pairing,
especially pairing protocols which might cause plasticity for tones that were completely
unrelated to the discrimination task. In particular, we predicted that NB-tone pairing with high-
frequency tones would impair performance of a low-frequency discrimination task in well-
trained animals. Three groups of animals were trained to perform the low-frequency
discrimination before exposure to NB-tone pairing (Figure 2.2A), and showed similar
performance of the low-frequency discrimination task before NB-tone pairing (Figure 2.3B, d’
discrimination of 0.38 to 1.0 octave distractors, F(2,16) = 0.0572, p = 0.9446, repeated measures
ANOVA). The Pretrained Low frequency group (n=7) heard only 2kHz tones during NB-
stimulation pairing, and the Pretrained High frequency group (n =6) heard only 19 kHz tones
during NB-stimulation pairing. Although the 2 kHz tone played during NB-stimulation had
different temporal characteristics than the sounds which rats heard during behavior training (the
tone during NB-tone pairing was a single 250 ms long stimulus, while the target stimulus during
behavior was a train of tone pips), we were concerned that even simple exposure to the 2 kHz
tone might interfere with behavior, either by causing additional plasticity as animals recalled the
behavior task, or by causing habituation to the tones which would decrease behavioral

13
performance after Tone Exposure. Therefore, a Pretrained Passive group (n=5) heard the 2 kHz
tone with no NB-stimulation.
Since all three groups had reached asymptotic task performance, we expected that NB
stimulation paired with the high frequency tone would impair discrimination of the low
frequency tones. The Pretrained High group was significantly impaired compared with the
Pretrained Low or Pretrained Passive groups during the first three days after tone exposure/NB-
tone pairing (Figure 2.2C, d’ discrimination of 0.3 to 1.0 octave distracters, F(2,16) = 3.6454, p =
0.0496, repeated measures ANOVA). Therefore, Experiments 1 and 2 confirm our hypothesis
that receptive field plasticity is important for learning and discrimination, and confirm that
plasticity induced outside of a behavioral context can improve learning or worsen discrimination
performance.
Although the behavioral results from Experiment 1 and 2 confirm that NB-tone pairing can
significantly improve discrimination learning, these results do not definitively prove that
plasticity in primary cortical areas is necessary for maintenance of behavioral performance.
Previous literature has demonstrated that plasticity in specific areas can increase during learning,
but fade after steady discrimination performance has been reached (Yotsumoto et al. 2008).
Therefore, we examined receptive field plasticity in the primary auditory cortex (A1) after a two-
period of difficult discrimination testing in all groups of animals in Experiments 1 and 2. We
predicted that plasticity would be most prevalent in the animals in Experiment 1, especially those
who had shown recent learning of the discrimination task (Task Naïve High and Task Naïve
Passive animals, Figure 2.3A). On the other hand, we did not expect to see plasticity in animals
from Experiment 2, who had been trained extensively on the low-frequency discrimination
(Figure 2.3B). We recorded multiunit responses from the right primary auditory cortex of all
14
Task-Naïve and Pretrained groups and compared their responses to naïve controls (n=9) .
Previous studies of plasticity have found that behavioral training commonly results in increased
representation and refined receptive fields of target stimuli (Polley et al. 2006; Recanzone et al.
1993). Both the Task-Naïve High and Task-Naïve Passive groups showed low-frequency
receptive field plasticity which was similar to that observed in previous studies of plasticity.
These groups had an increase in the relative percentage of cortex which responded to low-
frequency tones compared to naïve controls (Figure 2.4E, Naïve controls vs. Task-Naïve High, p
= 0.0259; Naïve controls vs. Task-Naïve Passive, p = 0.0285, t-tests). Sites which were
responsive to the target stimulus were narrowed in both groups, (Figure 2.4F, BW30 for Naïve
controls vs. Task-Naïve High, p = 0.0177, Naïve controls vs. Task-Naïve Passive, p = 0.0016, t-
tests), but sites which did not respond to the target stimulus were unaltered for both the Task-
Naïve High and Passive groups (see Appendix 1 for supplementary data). These results support
our hypothesis that recent learning of a discrimination task is most likely to generate stimulus-
specific plasticity. The Task-Naïve Low group, who showed the greatest initial behavioral
improvement and fastest learning of the discrimination task, did not show evidence of receptive
field plasticity, either in terms of increased preference for low-frequency tones (Figure 2.4E,
Naïve controls vs. Task-Naïve group, p = 0.2715, t-test), or narrowed receptive fields in target
responsive sites (Figure 2.4 F, Naïve controls vs. Task-Naïve group, p 0.09506, t-test). These
results imply that the NB-stimulation paired with low-frequency tones which the Task-Naïve
Low group experienced served as a surrogate for behavioral training in terms of improving
discrimination performance and causing plasticity to shift back to a normal state.
All of the Pretrained groups (Experiment 2) had learned to perform the discrimination task
and shown steady discrimination performance before the NB-stimulation or Tone Exposure.

15
Because these animals had been steadily performing the discrimination task for several weeks,
we predicted that stimulus-specific plasticity in these groups might not be present even though
discrimination performance had remained high. Although the Pretrained High group showed an
initial deficit in frequency discrimination immediately after NB-tone pairing, there was no
significant difference in performance between the three Pretrained Groups by the end of training
(Figure 2.4G, discrimination of 0.38 to 1.0 octave disctracters, F(2,16) = 0.5499, p = 0.5875,
repeated measures ANOVA). We found no evidence of receptive field reorganization in any of
the Pretrained groups (Figure 2.4H, BW30 for Naïve controls vs. Pretrained Low, High and
Passive respectively, p = 0.2452, p = 0.7912, p = 0.3244, t-test).
Our hypothesis predicts that the Pretrained groups of animals should have shown receptive
field plasticity earlier during their training, immediately after they had learned to perform the
low-frequency discrimination task. In order to confirm this, we conducted a high density
microelectrode mapping study in A1 immediately after a group of six rats were trained to
perform the low frequency tone discrimination task (Behavior Only group, n=6, Figure 2.4A).
These animals went through the same pretraining procedure as animals in the Pretrained Groups.
Animals in this group showed an increase in the percentage of A1 responded to low-frequency
(trained) tones vs. high frequency (untrained) tones compared to naïve controls (Figure 2.4B,
Naïve controls (n=9) vs. Behavior Only (n=6), p = 0.0186, t-test). In addition, A1 sites which
were responsive to the target behavioral stimulus (1.7818 kHz) had narrower receptive fields
than naïve controls (Figure 2.4C, BW30 of target stimulus responsive sites, p < 10-3
, student’s t-
test). Receptive fields of sites which did not respond to the target frequency did not change (see
Appendix 2 for supplementary data). Taken together, these results indicate that a short course of
frequency discrimination training was sufficient to induce receptive field reorganization toward

16
the behaviorally relevant stimulus and confirm previous studies (Polley et al. 2006; Recanzone et
al. 1993). In addition, long periods of behavior training and NB-tone pairing seemed to
encourage a renormalization of map plasticity so that the receptive organization of primary
auditory cortex resembled that of naïve controls.
Similar to behavioral training, we observed that the plasticity induced by NB-stimulation
lasts for a number of days, but then fades. We examined the time course of plasticity in A1 after
NB-tone pairing in five grounps of animals who experienced NB-stimulation paired with a 19
kHz tone. One group of animals was mapped twenty four hours after NB-tone pairing (1 day
group), and three other groups were housed in standard laboratory conditions for 10, 20 and 100
days before mapping. The 1, 10 and 20 day groups showed an increase in the percentage of A1
neurons which responded to the paired tone compared to naïve controls (Figure 2.5, control(n=6)
vs. 1-day group(n=5): p = 0.0368; 10 day group (n=5): p = 0.0114; 20 day group (n=5): p =
0.0071, one-tailed t-tests). However, receptive field plasticity after NB-tone pairing was not
permanent – the 100 day group showed no evidence of receptive field shifts (Figure 2.5, n=6, p =
0.4341, one-tailed t-test). Our results indicate that prolonged NB-stimulation/tone pairing is
sufficient to produce long-lasting but not permanent plasticity in A1.
The plasticity results from experiment 1 and 2 implied that the duration of plasticity is likely
to be influenced by behaviorally relevant stimuli such as those experienced during behavioral
training. Although plasticity was relatively stable when animals were housed in a standard
animal care environment, enrichment hastened the restoration of A1 to a normal state (Figure
2.5). The percent of cortex which responded to the paired tone was only slightly larger than
normal controls after 20 days of housing in an enriched environment (n=5, p = 0.1930, one-tailed

17
t-test). Therefore, receptive field plasticity in primary auditory cortex can be eliminated by
either behavioral training or environmental enrichment.
18
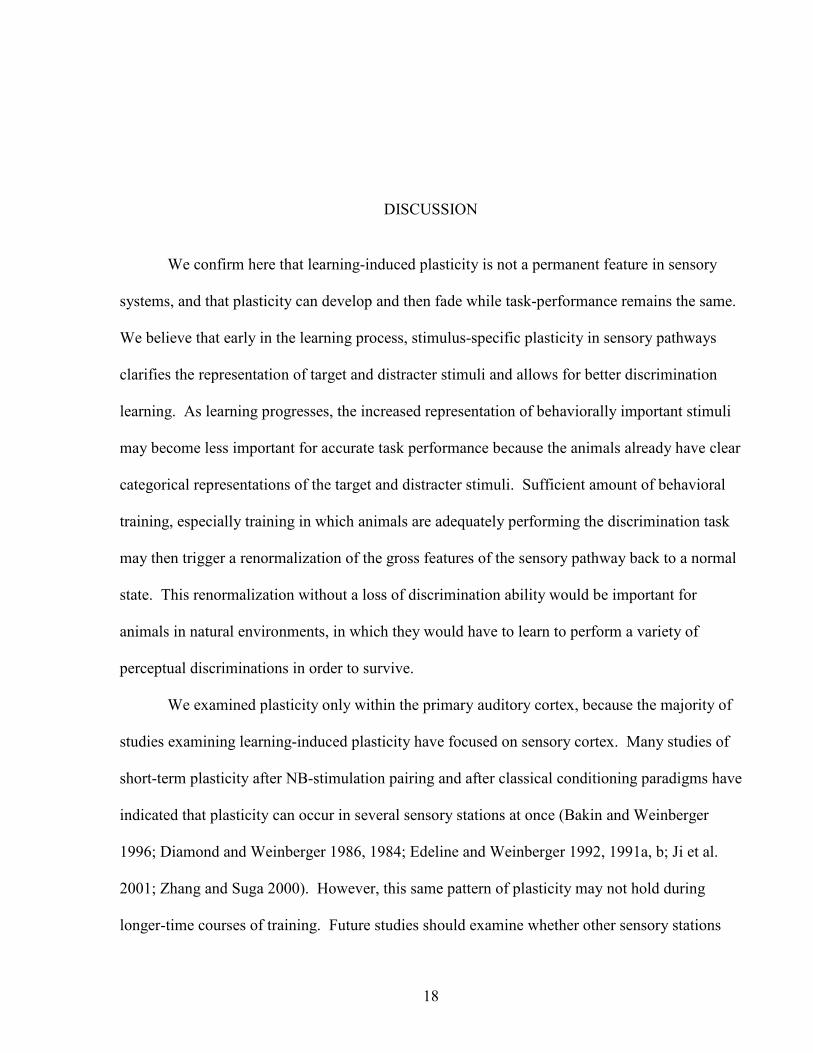
DISCUSSION
We confirm here that learning-induced plasticity is not a permanent feature in sensory
systems, and that plasticity can develop and then fade while task-performance remains the same.
We believe that early in the learning process, stimulus-specific plasticity in sensory pathways
clarifies the representation of target and distracter stimuli and allows for better discrimination
learning. As learning progresses, the increased representation of behaviorally important stimuli
may become less important for accurate task performance because the animals already have clear
categorical representations of the target and distracter stimuli. Sufficient amount of behavioral
training, especially training in which animals are adequately performing the discrimination task
may then trigger a renormalization of the gross features of the sensory pathway back to a normal
state. This renormalization without a loss of discrimination ability would be important for
animals in natural environments, in which they would have to learn to perform a variety of
perceptual discriminations in order to survive.
We examined plasticity only within the primary auditory cortex, because the majority of
studies examining learning-induced plasticity have focused on sensory cortex. Many studies of
short-term plasticity after NB-stimulation pairing and after classical conditioning paradigms have
indicated that plasticity can occur in several sensory stations at once (Bakin and Weinberger
1996; Diamond and Weinberger 1986, 1984; Edeline and Weinberger 1992, 1991a, b; Ji et al.
2001; Zhang and Suga 2000). However, this same pattern of plasticity may not hold during
longer-time courses of training. Future studies should examine whether other sensory stations

19
follow a similar time course of plasticity and identify which brain regions in highly trained
animals respond differently than naïve animals.
Although plasticity is not strictly necessary for task performance, inducing stimulus-
specific plasticity in sensory systems alters both learning and discrimination performance.
Therefore, treatments which can induce long-lasting plasticity within sensory systems should
induce long-lasting improvements in the recovery of patient populations. Using a technique such
as NB-stimulation which pairs precise neuromodulator release with sensory input might afford
greater functional improvement than therapies which rely on sensory stimulation alone or
medications which are unable to create temporally or spatially specific effects.

20
METHODS
Behavior Training
All rats were trained to perform a simple go/no-go stimulus recognition task. Target or
distracter stimuli were presented approximately every ten seconds, and animals were required to
press a lever within three seconds of target presentation and refrain from hitting after
presentation of a distracter. Rats received a 45-mg sugar pellet when they pressed three seconds
after a target stimulus presentation, but pressing the lever after a distracter or during silent
periods between sound presentations resulted in a timeout period in which all lights in the cage
were extinguished and further sound presentations were delayed for 6-8 seconds.
Experiment 1(Figure 2.1A): For the easy noise-discrimination task before the tone
exposure period, the target stimulus was a train of six white noise bursts (25 ms duration, 60 dB
intensity, 1-32kHz frequency range) presented at a rate of 5 Hz, while the distracter stimulus was
a complex noise stimulus with irregular temporal and spectral features which had the same
duration and overall intensity as the target noise-burst train (1025 ms duration, 60 dB intensity,
1-48kHz frequency spectrum). The Task Naïve animals spend 15 days learning to reliably
respond immediately after presentation of the target noise stimulus and then spent 3 days
learning to discriminate between the target and distracter noise stimuli before moving on to tone
exposure. For the low frequency discrimination tasks, the target stimulus was always a train of
six tone pips (25 ms duration, 60 dB intensity, 1.7818 kHz carrier frequency) presented at a rate
of 5 Hz, while the distracter stimuli varied only in carrier frequency (from 1.9 to 9.5 kHz, or 0.1
to 2.4 octaves above the CS+ stimulus). During the easy discrimination stage for Task Naïve

21
groups, the distracter stimuli were 0.5, 1.0 and 2.4 octaves above the target stimulus, and during
the Difficult Tone Task, the distracter stimuli wee 0.1, 0.26, 0.38, 0.5, 0.75, 1, 1.5 and 2.4
octaves above the target stimulus.
Experiment 2 (Figure 2.2A): The Pretrained groups learned to perform a frequency
discrimination task before tone exposure. The target stimulus for this group was identical to the
frequency target for the Task Naïve groups (1.78 kHz tone train) and distracter stimuli ranged
from 0.1 to 1.0 octaves above the target stimulus. During the pretraining Easy Tone Task,
Pretrained rats spent 20 days learning to reliably respond after presentation of the target stimulus,
and then spent 10 days learning to respond to target stimulus and ignore a distracter 1.0 octaves
above the target stimulus. During the difficult discrimination task, the distracter stimuli were
0.1, 0.2, 0.25, 0.32, 0.38, 0.44, 0.5, 0.75 and 1.0 octaves above the target stimulus.
Discrimination performance was measured using the signal detection theory measure d-
prime during all stages of training (Klein 2001). We determined that all groups could reliably
discriminate distracter stimuli which were at least 0.38 octaves above the target stimulus, and so
used discrimination performance on those stimuli to measure changes in discrimination
performance after tone exposure. Statistical comparisons between three or more groups were
done using repeated measure ANOVAs. Statistical comparisons between only two groups or
relative to zero were done using t-tests.
NB-stimulation pairing
NB-stimulation pairing was conducted using the same methods as in previous
publications (Kilgard and Merzenich 1998a, 2002, 1998b; Kilgard et al. 2001a; Kilgard et al.
2001b; Puckett et al. 2007). All NB-stimulated animals and the Pretrained Passive group
underwent an implantation surgery 2-3 weeks before training began. A platinum bipolar
22
stimulating electrode was lowered 7 mm below the cortical surface from a location 2.3 mm
posterior and 3.3 mm lateral to bregma in the right hemisphere. Bone screws located
approximately 5 mm posterior to the implant and above the cerebellum were used to monitor
EEG activity.
During NB-stimulation pairing the paired stimulus was presented approximately every
ten seconds 275-350 times per day for a period of 20 days. Silent intervals (and unpaired stimuli
for the Task Naïve Groups) were inserted at random to prevent habituation, and each pairing
session lasted approximately three and a half hours. Paired stimuli were either a 2 kHz or 19
kHz tone, 250 ms duration, presented at 50 dB SPL. Each tone presentation was accompanied
by a short burst of current delivered to the bipolar stimulating electrode (20 biphasic pulses, 0.1
ms duration at 100 Hz) 50 ms after tone onset. The current amplitude ranged from 120-200
µamps for each animal, and was selected to reliably elicit brief EEG desynchronization for 1-3
seconds whenever the animal was in slow wave sleep. Passive exposure animals were trained
the same booths and heard the same acoustic stimuli, but were not connected to the stimulators.
Physiology
Physiological experiments used similar methods as reported in previous publications
(Kilgard and Merzenich 1998a, 2002; Kilgard et al. 2001a; Kilgard et al. 2001b; Puckett et al.
2007). Physiological recordings in took place under pentobarbital anesthesia (50 mg/kg).
Multiunit responses were recorded using two bipolar parylene-coated tungsten electrodes (250
µm separation, 2 MOhm at 1 kHz, FHC Inc., Bowdoinham, ME) which were lowered ~550 µm
below the cortical surface (layer IV/V). At each site, a tuning curve consisting of 81 frequencies
spanning from 1 to 32 kHz at 16 intensities spanning from 0 to 75 dB SPL was presented (1,296

23
tones, 25 ms duration, 5 ms rise and fall time, 1 repetition of each). In total, we recorded from
6414 sites in 77 animals.
All sites from control and experimental rats were analyzed using an automated tuning
curve analysis program (see Appendix 3 for detailed description). A post-stimulus time
histogram (PSTH) was constructed from all of the responses to tone-intensity combinations
within the receptive field using 1 ms width bins. The receptive field area was then calculated
using image analysis techniques from a grid of the responses to each frequency-intensity
combination during the driven response period (from onset to end of peak latency). Several
receptive field characteristics were then calculated based on the identified area of driven activity.
The lowest intensity that evoked a reliable neural response was defined as the threshold, and the
frequency at which this response occurred defined the characteristic frequency (CF). Four
bandwidths (BW10-BW40) were calculated as the range of frequencies (measured in octaves)
which evoked reliable responses at 10, 20, 30 and 40 dB above threshold.
Voronoi tessellation was used to transform the discretely sampled surface into a
continuous map using the assumption that each point on the map has the response characteristics
of the nearest recording site. Since regions with above average sampling density have smaller
tessellations, they do not bias estimates of the cortical response. A1 sites were identified on the
basis of latency and topography. The percent of the cortical area of A1 responding to each tone
was estimated as the sum of the areas of all tessellations from sites in A1 with receptive fields
that included the tone divided by the total area of the field.
For all behaviorally trained animals, we reported changes in the representation of
behaviorally relevant tones by reporting the ratio of the percent of cortex which responded to a
2kHz, 60 dB SPL tone divided by the percentage of cortex which responded to a 19kHz, 60 dB

24
SPL tone. In behaviorally trained animals, we commonly observe both a shift in tuning towards
behaviorally relevant tones and a decrease in receptive field sizes. The net effect of this
plasticity is to cause the cortical response to behaviorally-irrelevant tones to decrease while the
response to behaviorally-relevant tones is only slightly increased or unchanged. Therefore, a
ratio measure provides a clear representation of shifts in frequency organization of A1 which is
not influenced by the shift in receptive field sizes. For the time course study in which animals
were mapped after NB-stimulation pairing alone, we chose to use the percentage of A1 cortex
which responded to a 19kHz, 60d dB SPL tone as our plasticity measure.
T-tests were used for all statistical comparisons between two groups. ANOVA was used
when the response properties of three or more groups were compared.
25
APPENDIX 1
FIGURES
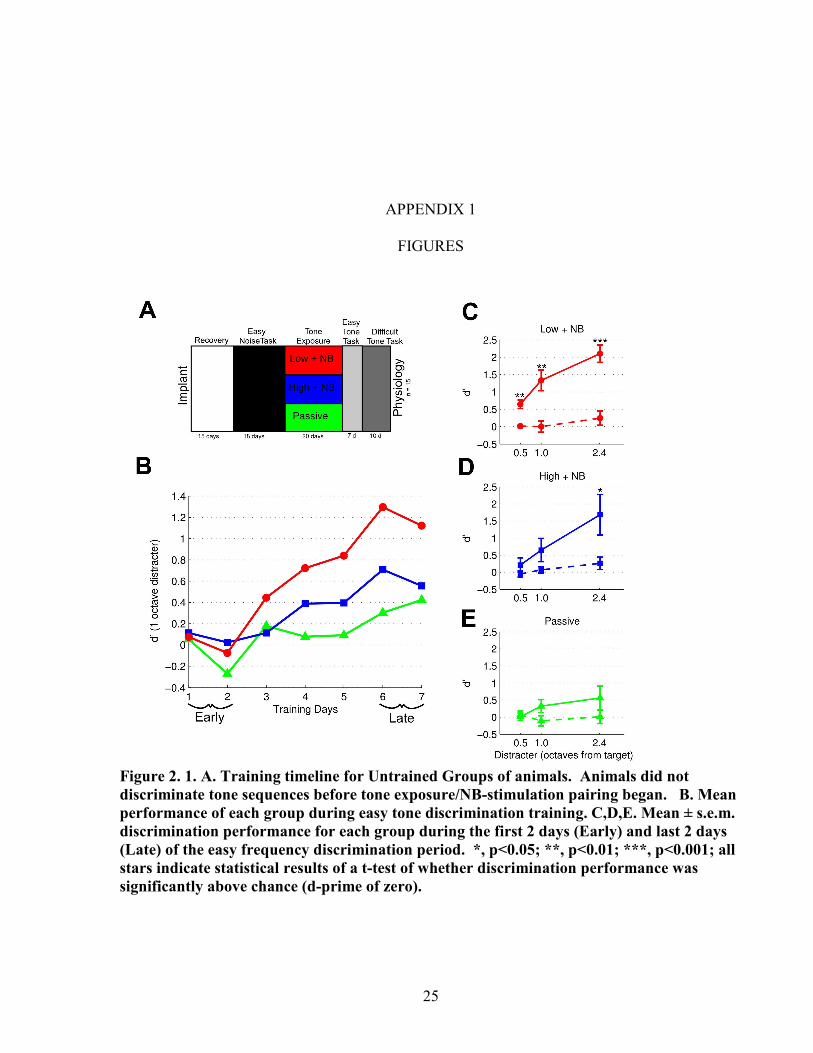
Figure 2. 1. A. Training timeline for Untrained Groups of animals. Animals did not
discriminate tone sequences before tone exposure/NB-stimulation pairing began. B. Mean
performance of each group during easy tone discrimination training. C,D,E. Mean ± s.e.m.
discrimination performance for each group during the first 2 days (Early) and last 2 days
(Late) of the easy frequency discrimination period. *, p<0.05; **, p<0.01; ***, p<0.001; all
stars indicate statistical results of a t-test of whether discrimination performance was
significantly above chance (d-prime of zero).
26
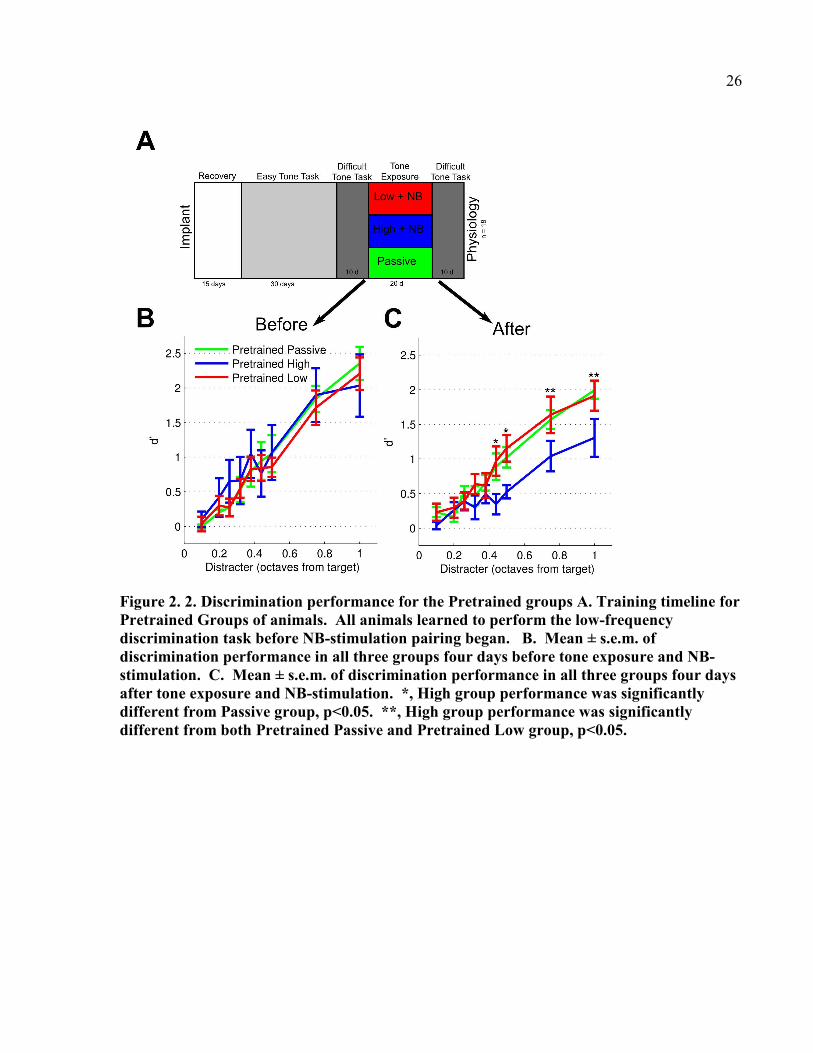
Figure 2. 2. Discrimination performance for the Pretrained groups A. Training timeline for
Pretrained Groups of animals. All animals learned to perform the low-frequency
discrimination task before NB-stimulation pairing began. B. Mean ± s.e.m. of
discrimination performance in all three groups four days before tone exposure and NB-
stimulation. C. Mean ± s.e.m. of discrimination performance in all three groups four days
after tone exposure and NB-stimulation. *, High group performance was significantly
different from Passive group, p<0.05. **, High group performance was significantly
different from both Pretrained Passive and Pretrained Low group, p<0.05.

27
Figure 2. 3. Graphs show mean discrimination performance on the 1 octave discrimination
task for each group. The plasticity schematic indicates the amount of map plasticity
measured in each group at the end of training. A. Behavior only groups were mapped
immediately after behavioral training B. Pretrained Groups mastered the low-frequency
discrimination task before tone exposure and NB-stimulation pairing began. C. Untrained
Groups were naïve to the low-frequency discrimination task until after tone exposure and
NB-stimulation.

28
Figure 2. 4. A,C,E. Receptive field plasticity after behavior training (A), and NB-
stimulation pairing in Experiment 1 (C), and Experiment 2 (E). Cortical plasticity is
measured as the ratio of percentage of cortical neurons which respond to low tones over the
neurons which respond to high tones. A value of 1 indicates equal area of response to low
and high tones, and all values over 1 indicate an increased relative response to low-
frequency tones. The solid and dotted lines in each figure indicate the mean ± s.e.m. values
for naïve controls. B,D,F. Receptive field size measured at 30dB above threshold.
Receptive field sizes are measured in octaves, so that smaller values indicate smaller
receptive fields (more selective tuning). The solid and dotted lines in each figure indicate
the mean ± s.e.m. values for naïve controls. *, p<0.05; **, p<0.01; ***, p<0.001; all stars
indicate statistical results of a t-test between an experimental group and naïve controls.
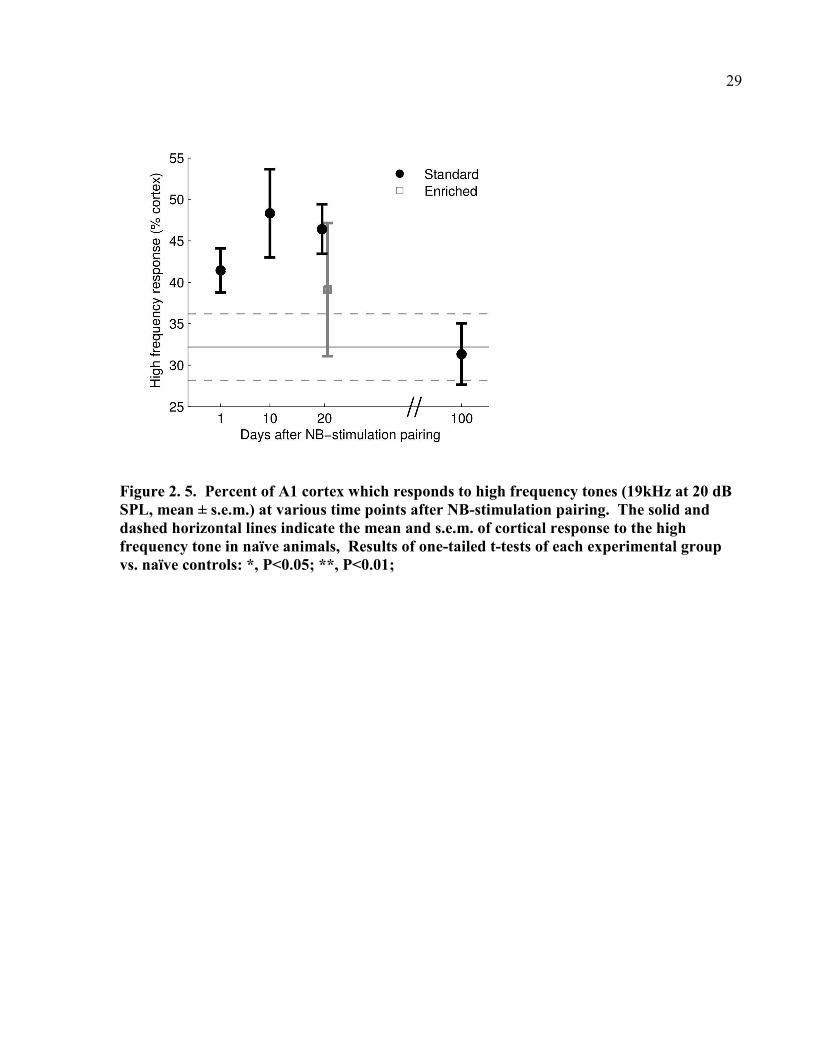
29
Figure 2. 5. Percent of A1 cortex which responds to high frequency tones (19kHz at 20 dB
SPL, mean ± s.e.m.) at various time points after NB-stimulation pairing. The solid and
dashed horizontal lines indicate the mean and s.e.m. of cortical response to the high
frequency tone in naïve animals, Results of one-tailed t-tests of each experimental group
vs. naïve controls: *, P<0.05; **, P<0.01;
30
APPENDIX 2
SUPPLEMENTAL DATA
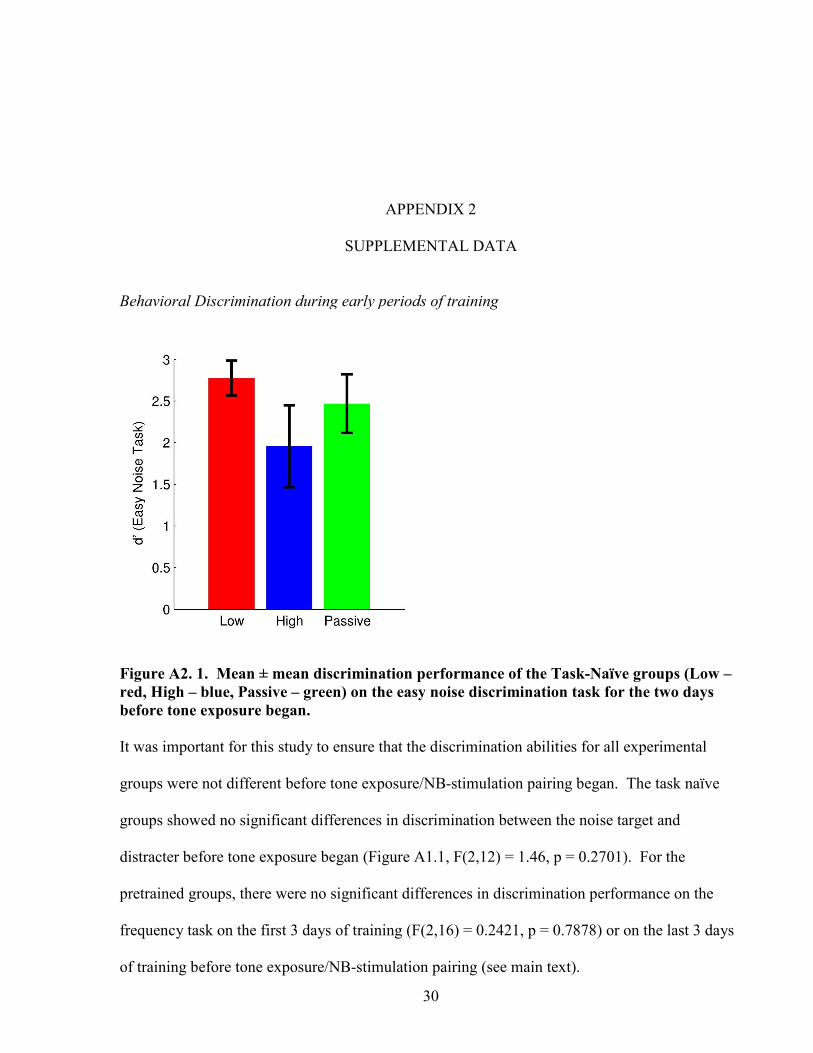
Behavioral Discrimination during early periods of training
Figure A2. 1. Mean ± mean discrimination performance of the Task-Naïve groups (Low –
red, High – blue, Passive – green) on the easy noise discrimination task for the two days
before tone exposure began.
It was important for this study to ensure that the discrimination abilities for all experimental
groups were not different before tone exposure/NB-stimulation pairing began. The task naïve
groups showed no significant differences in discrimination between the noise target and
distracter before tone exposure began (Figure A1.1, F(2,12) = 1.46, p = 0.2701). For the
pretrained groups, there were no significant differences in discrimination performance on the
frequency task on the first 3 days of training (F(2,16) = 0.2421, p = 0.7878) or on the last 3 days
of training before tone exposure/NB-stimulation pairing (see main text).
31
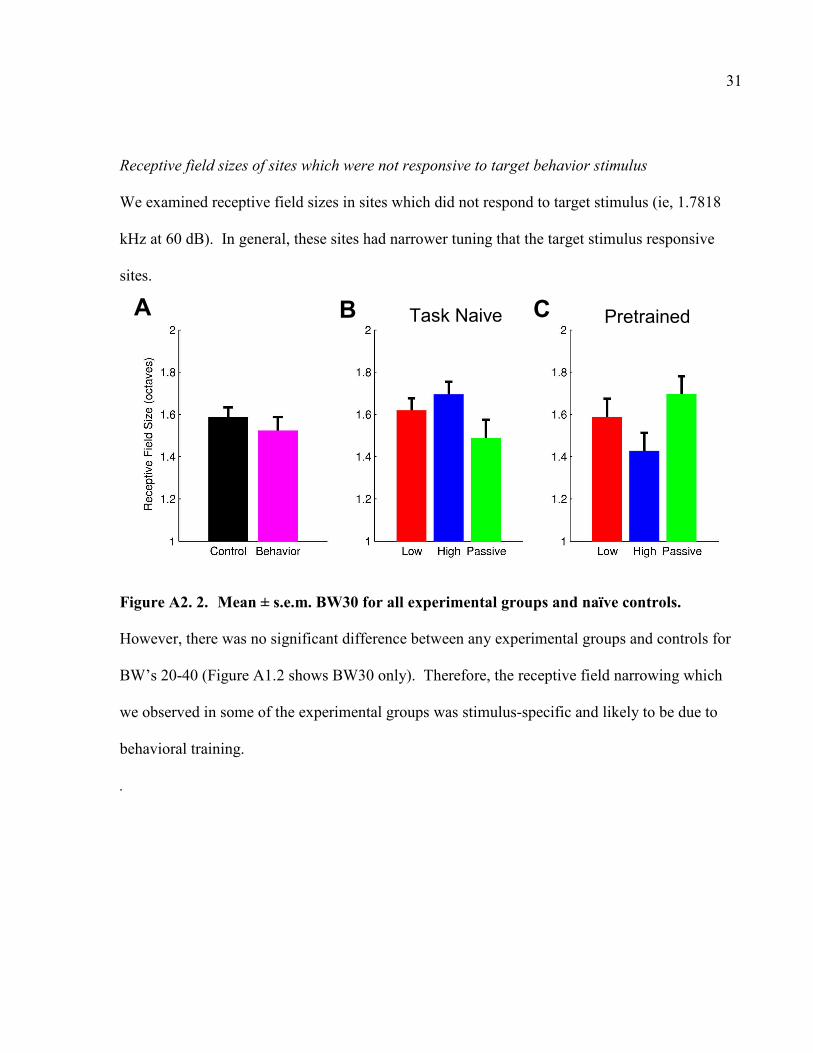
Receptive field sizes of sites which were not responsive to target behavior stimulus
We examined receptive field sizes in sites which did not respond to target stimulus (ie, 1.7818
kHz at 60 dB). In general, these sites had narrower tuning that the target stimulus responsive
sites.
Figure A2. 2. Mean ± s.e.m. BW30 for all experimental groups and naïve controls.
However, there was no significant difference between any experimental groups and controls for
BW’s 20-40 (Figure A1.2 shows BW30 only). Therefore, the receptive field narrowing which
we observed in some of the experimental groups was stimulus-specific and likely to be due to
behavioral training.
.
A B C Pretrained
Task Naive
32
Untrained GroupsPretrained GroupsBehavior OnlyA D
E
G
H
Untrained GroupsPretrained GroupsBehavior OnlyA D
E
G
H
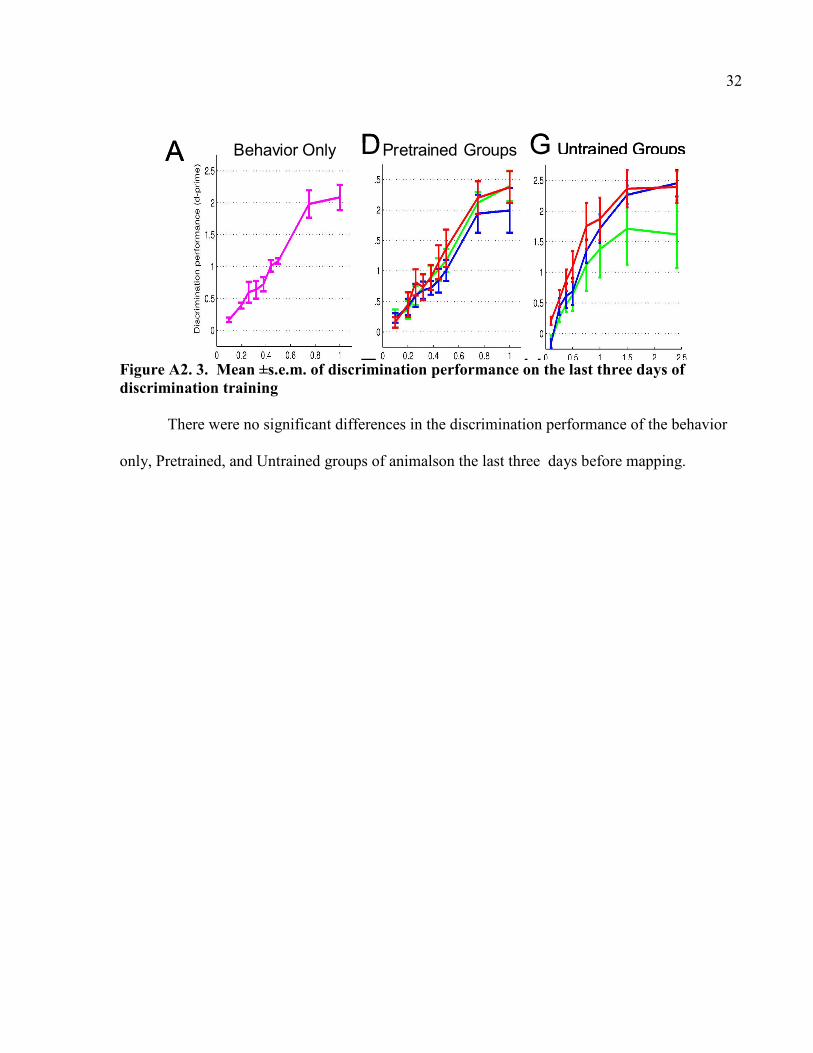
Figure A2. 3. Mean ±s.e.m. of discrimination performance on the last three days of
discrimination training
There were no significant differences in the discrimination performance of the behavior
only, Pretrained, and Untrained groups of animalson the last three days before mapping.

33
APPENDIX 3
AUTOMATIC TUNING CURVE ANALYSIS
To assess receptive field and basic latency
properties, a tuning curve consisting of 1296 tone
pips (25 ms duration, 5dB steps from 0-75 dB,
1/16th
octave steps from 1-32 kHz) were
presented at all recording sites. Spiking data was
recorded for 400 ms after tone presentation. An
automatic tuning curve analysis program was
used to extract latency and receptive field
information from all files. Using an automated
program allowed for fast analysis with less noise
due to human error, and also removed the
possibility of experimenter bias. Figure A2.1
shows an example of PSTH and tuning curve
data.
The automated tuning curve analysis
program comprised three basic steps. First, the
driven response time period was defined based
on the PSTH (post-stimulus time histogram) of each site. Second, a receptive field area was
defined using image analysis techniques. Finally, latency information was recalculated using
Figure A3. 1. A) Raw tuning curve
data for an example site. Only
spiking data from within the driven
response time period is shown. The
length of each red line indicates the
strength of response evoked by each
frequency/intensity combination. B)
PSTH data from the example site.
The vertical lines indicate the
minimum (green) and end of peak
(red) latencies which were chosen by
the automated tuning curve
program.
A
B
0 10 20 30 40 50 60 70 80 90 100 110 120 130 140 150 160 170 1800
20
40
60
80
100
120
140PSTH of Tuning Curve Stimuli
Milliseconds after tone onset
1 1.3 1.6 2 2.5 3.2 4 5 6.3 8 10.1 12.7 16 20.2 25.4 320
10
20
30
40
50
60
70
80
Tuning Curve for TT4dense003e4.f32

34
only frequency/intensity combinations within the defined receptive field area, and then the
receptive field was redefined using spike information from the updated driven response time
period.
Definition of driven response time period
The initial driven response time period was defined by calculating a minimum and end of
peak latency for the PSTH. First, the average and standard deviation of the spontaneous firing
rate was calculated as the average and standard deviation of the number of spikes evoked in each
1 ms bin during the first 9 milliseconds after each presentation of the 1296 frequency/intensity
combinations. (average spontaneous firing rate was set to 0.00001 spikes/ms if the spontaneous
spiking rate was zero). The peak latency was defined as the time point in the PSTH which
elicited the greatest response. The minimum latency is the latest time point before the peak
latency when the PSTH reached a firing rate that was more than two standard deviations above
the spontaneous firing rate for two consecutive milliseconds. The maximum latency was defined
as the latest time point after the peak latency when the PSTH response was still greater than two
standard deviations above the spontaneous firing rate for two consecutive milliseconds. Figure
A2.1B shows the minimum and end of peak latency defined for the example site.
Definition of initial receptive field area
A grid of activity during the driven response time period evoked by each
frequency/intensity combination was used to extract receptive field information (Figure A2.2A).
The receptive field for each site was defined as a contiguous area with response strength above a
preset threshold for driven activity. This threshold was calculated as the spontaneous activity
plus 20% of the approximate driven response. The approximate driven response was calculated
as 10th
percentile of spiking activity of all points in the grid (this response was close to the
35
maximal response but avoided outliers which would cause the threshold to be inappropriately
high). The spontaneous activity for the grid was calculated as average spiking activity evoked by
zero dB tones.
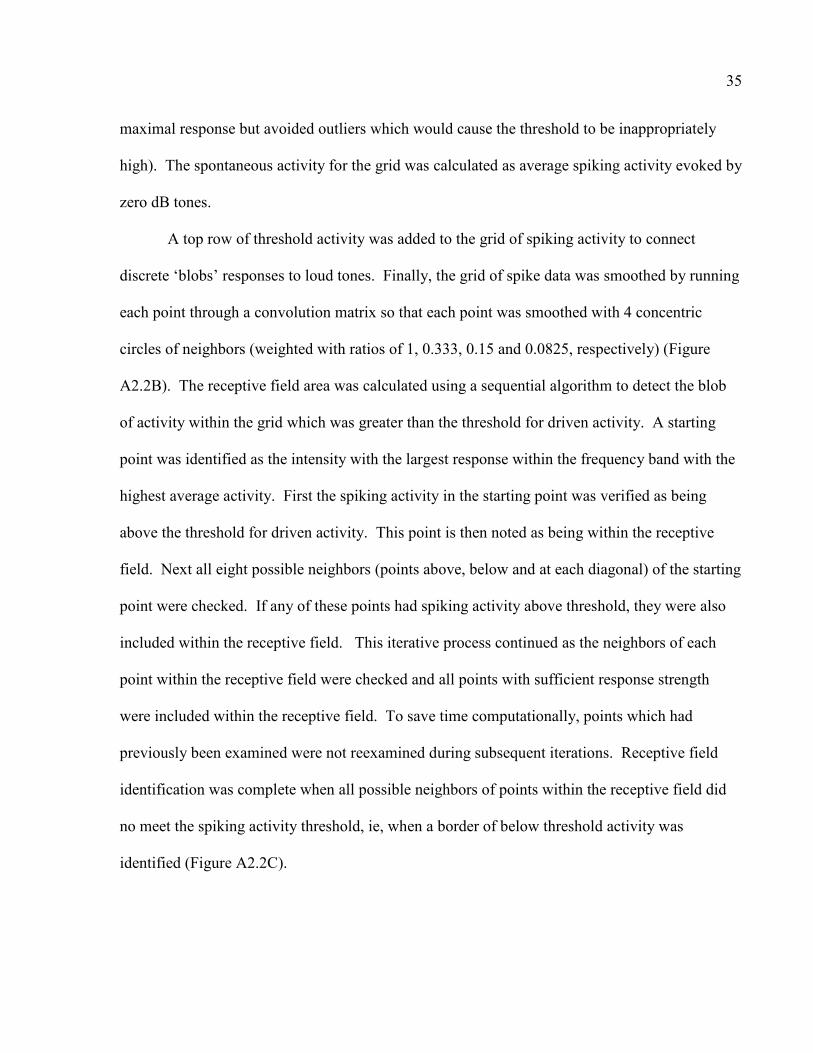
A top row of threshold activity was added to the grid of spiking activity to connect
discrete ‘blobs’ responses to loud tones. Finally, the grid of spike data was smoothed by running
each point through a convolution matrix so that each point was smoothed with 4 concentric
circles of neighbors (weighted with ratios of 1, 0.333, 0.15 and 0.0825, respectively) (Figure
A2.2B). The receptive field area was calculated using a sequential algorithm to detect the blob
of activity within the grid which was greater than the threshold for driven activity. A starting
point was identified as the intensity with the largest response within the frequency band with the
highest average activity. First the spiking activity in the starting point was verified as being
above the threshold for driven activity. This point is then noted as being within the receptive
field. Next all eight possible neighbors (points above, below and at each diagonal) of the starting
point were checked. If any of these points had spiking activity above threshold, they were also
included within the receptive field. This iterative process continued as the neighbors of each
point within the receptive field were checked and all points with sufficient response strength
were included within the receptive field. To save time computationally, points which had
previously been examined were not reexamined during subsequent iterations. Receptive field
identification was complete when all possible neighbors of points within the receptive field did
no meet the spiking activity threshold, ie, when a border of below threshold activity was
identified (Figure A2.2C).

36
Refinement of latency and receptive field information
After estimating an initial receptive field area, the driven response time period (minimum and
maximum latency) was redefined using only responses to frequency/intensity combinations
which were included in the initial receptive field area. This step helped to identify a precise
latency measure in sites which had large amounts of spontaneous activity. Finally, the receptive
B
D
A
C
Figure A3. 2 A) Color-coded grid of raw tuning curve data for the example site. Only
spiking data from within the driven response time period is shown. B) Color-coded
grid of tuning curve data after smoothing. C) Final receptive field (red pixels)
surrounded by a frequency/intensity combinations which were checked but did not
meet threshold requirements (green pixels). D) Tuning curve characteristics which
were extracted from the final receptive field. The blue dot indicates the location of the
threshold and CF, and horizontal lines indicate the bandwidths at 10, 20, 30 and 40 dB
above threshold.
10 20 30 40 50 60 70 80
2
4
6
8
10
12
14
16
1 1.3 1.6 2 2.5 3.2 4 5 6.3 8 10.1 12.7 16 20.2 25.4 320
10
20
30
40
50
60
70
80
Tuning Curve for TT4dense003e4.f32
10 20 30 40 50 60 70 80
2
4
6
8
10
12
14
16
10 20 30 40 50 60 70 80
2
4
6
8
10
12
14
16
37
field area was redefined using the refined driven response time period. The procedure was
identical to those used to define the initial receptive field area.
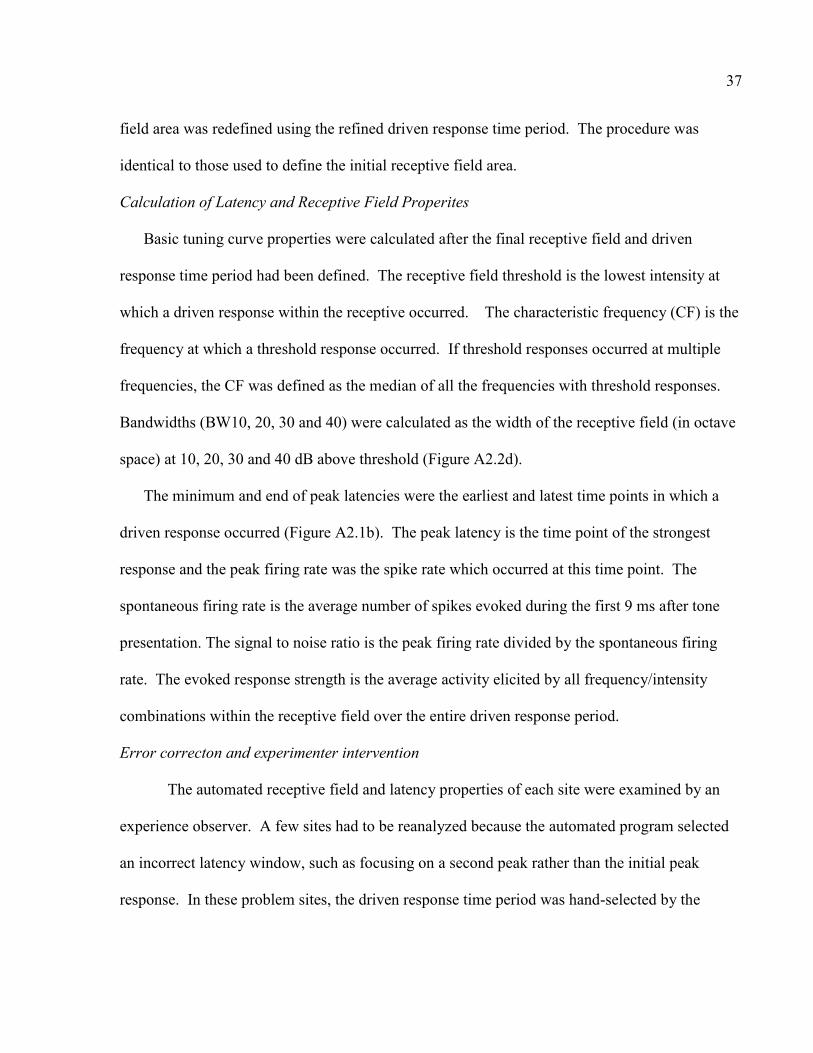
Calculation of Latency and Receptive Field Properites
Basic tuning curve properties were calculated after the final receptive field and driven
response time period had been defined. The receptive field threshold is the lowest intensity at
which a driven response within the receptive occurred. The characteristic frequency (CF) is the
frequency at which a threshold response occurred. If threshold responses occurred at multiple
frequencies, the CF was defined as the median of all the frequencies with threshold responses.
Bandwidths (BW10, 20, 30 and 40) were calculated as the width of the receptive field (in octave
space) at 10, 20, 30 and 40 dB above threshold (Figure A2.2d).
The minimum and end of peak latencies were the earliest and latest time points in which a
driven response occurred (Figure A2.1b). The peak latency is the time point of the strongest
response and the peak firing rate was the spike rate which occurred at this time point. The
spontaneous firing rate is the average number of spikes evoked during the first 9 ms after tone
presentation. The signal to noise ratio is the peak firing rate divided by the spontaneous firing
rate. The evoked response strength is the average activity elicited by all frequency/intensity
combinations within the receptive field over the entire driven response period.
Error correcton and experimenter intervention
The automated receptive field and latency properties of each site were examined by an
experience observer. A few sites had to be reanalyzed because the automated program selected
an incorrect latency window, such as focusing on a second peak rather than the initial peak
response. In these problem sites, the driven response time period was hand-selected by the

38
experimenter and spiking activity from this time window was used to recalculate the receptive
field just as in the automated analysis.
39
REFERENCES
Bakin JS and Weinberger NM. Induction of a physiological memory in the cerebral cortex by
stimulation of the nucleus basalis. Proc Natl Acad Sci U S A 93: 11219-11224, 1996.
Brown M, Irvine DR, and Park VN. Perceptual learning on an auditory frequency discrimination
task by cats: association with changes in primary auditory cortex. Cereb Cortex 14: 952-965,
2004.
Diamond DM and Weinberger NM. Classical conditioning rapidly induces specific changes in
frequency receptive fields of single neurons in secondary and ventral ectosylvian auditory
cortical fields. Brain Res 372: 357-360, 1986.
Diamond DM and Weinberger NM. Physiological plasticity of single neurons in auditory cortex
of the cat during acquisition of the pupillary conditioned response: II. Secondary field (AII).
Behav Neurosci 98: 189-210, 1984.
Edeline JM and Weinberger NM. Associative retuning in the thalamic source of input to the
amygdala and auditory cortex: receptive field plasticity in the medial division of the medial
geniculate body. Behav Neurosci 106: 81-105, 1992.
Edeline JM and Weinberger NM. Subcortical adaptive filtering in the auditory system:
associative receptive field plasticity in the dorsal medial geniculate body. Behav Neurosci 105:
154-175, 1991a.
Edeline JM and Weinberger NM. Thalamic short-term plasticity in the auditory system:
associative returning of receptive fields in the ventral medial geniculate body. Behav Neurosci
105: 618-639, 1991b.
Ji W, Gao E, and Suga N. Effects of acetylcholine and atropine on plasticity of central auditory
neurons caused by conditioning in bats. J Neurophysiol 86: 211-225, 2001.
Kilgard MP and Merzenich MM. Cortical map reorganization enabled by nucleus basalis
activity. Science 279: 1714-1718, 1998a.
Kilgard MP and Merzenich MM. Order-sensitive plasticity in adult primary auditory cortex.
Proc Natl Acad Sci U S A 99: 3205-3209, 2002.
Kilgard MP and Merzenich MM. Plasticity of temporal information processing in the primary
auditory cortex. Nat Neurosci 1: 727-731, 1998b.

40
Kilgard MP, Pandya PK, Vazquez J, Gehi A, Schreiner CE, and Merzenich MM. Sensory input
directs spatial and temporal plasticity in primary auditory cortex. J Neurophysiol 86: 326-338,
2001a.
Kilgard MP, Pandya PK, Vazquez JL, Rathbun DL, Engineer ND, and Moucha R. Spectral
features control temporal plasticity in auditory cortex. Audiol Neurootol 6: 196-202, 2001b.
Klein SA. Measuring, estimating, and understanding the psychometric function: a commentary.
Percept Psychophys 63: 1421-1455, 2001.
Ma X and Suga N. Long-term cortical plasticity evoked by electric stimulation and acetylcholine
applied to the auditory cortex. Proc Natl Acad Sci U S A 102: 9335-9340, 2005.
Polley DB, Steinberg EE, and Merzenich MM. Perceptual learning directs auditory cortical map
reorganization through top-down influences. J Neurosci 26: 4970-4982, 2006.
Puckett AC, Pandya PK, Moucha R, Dai W, and Kilgard MP. Plasticity in the rat posterior
auditory field following nucleus basalis stimulation. J Neurophysiol 98: 253-265, 2007.
Recanzone GH, Schreiner CE, and Merzenich MM. Plasticity in the frequency representation of
primary auditory cortex following discrimination training in adult owl monkeys. J Neurosci 13:
87-103, 1993.
Rutkowski RG and Weinberger NM. Encoding of learned importance of sound by magnitude of
representational area in primary auditory cortex. Proc Natl Acad Sci U S A 102: 13664-13669,
2005.
Yotsumoto Y, Watanabe T, and Sasaki Y. Different dynamics of performance and brain
activation in the time course of perceptual learning. Neuron 57: 827-833, 2008.
Zhang Y and Suga N. Modulation of responses and frequency tuning of thalamic and collicular
neurons by cortical activation in mustached bats. J Neurophysiol 84: 325-333, 2000.

41
CHAPTER 3
PLASTICITY IN THE RAT POSTERIOR AUDITORY FIELD FOLLOWING NUCLEUS
BASALIS STIMULATION
*Amanda C. Puckett,
* Pritesh K. Pandya, Raluca Moucha
,WeiWei Dai, Michael P. Kilgard
Department of Brain and Behavioral Sciences, GR41
The University of Texas at Dallas
800 West Campbell Road
Richardson, Texas 75080
* These authors contributed equally to this work. This paper was published in Journal of
Neurophysiology in July 2007
42
ACKNOWLEDGEMENTS
Many thanks to Daniel Rathbun, Jessica Vasquez and Navzer Engineer for assistance in
collecting physiological data. Thank you to Hoang Ho for help with NB-stimulation sessions.
This research is supported by the James S. McDonnell Foundation.

43
ABSTRACT
Classical conditioning paradigms have been shown to cause frequency-specific plasticity in
both primary and secondary cortical areas. Previous research demonstrated that repeated pairing
of nucleus basalis (NB) stimulation with a tone results in plasticity in primary auditory cortex
(A1), mimicking the changes observed after classical conditioning. However, few studies have
documented the effects of similar paradigms in secondary cortical areas. The purpose of this
study was to quantify plasticity in the posterior auditory field (PAF) of the rat after NB
stimulation paired with a high frequency tone. NB-tone pairing increased the frequency
selectivity of PAF sites which were activated by the paired tone. This site-specific receptive
field decrease led to a reorganization of PAF such that responses to low- and mid-frequency
tones were reduced by 40%. Plasticity in A1 was consistent with previous studies - pairing a
high frequency tone with NB stimulation expanded the high frequency region of the frequency
map. Receptive field sizes in A1 were not altered after NB-tone pairing. These results
demonstrate that experience-dependent plasticity can take different forms in primary and
secondary auditory cortex.
44
INTRODUCTION
Neural plasticity in both primary and secondary sensory cortex has been associated with
learning. After long-term operant training in primates and rats, large frequency map expansions
can develop in response to trained tone frequencies in primary auditory cortex (Brown et al.
2004; Buonomano and Merzenich 1998; Polley et al. 2006; Recanzone et al. 1993; Rutkowski
and Weinberger 2005), although such expansion is not always present (Brown et al. 2004).
Long-term operant training can also cause frequency-specific plasticity in secondary cortical
areas (Polley et al. 2006). Classical conditioning shifts receptive fields in both primary and
secondary auditory cortices towards the conditioned stimulus (Diamond and Weinberger 1986,
1984; Weinberger et al. 1984). A greater proportion of neurons in secondary cortical areas are
altered by classical conditioning compared to A1 (Diamond and Weinberger 1984; Weinberger
et al. 1984). Receptive field plasticity has also been observed in the somatosensory and visual
systems, indicating that learning-induced plasticity is a general cortical phenomenon
(Buonomano and Merzenich 1998; Ghose 2004; Gilbert 1996; Recanzone et al. 1992a;
Recanzone et al. 1992b). In all of these cases, experience-dependent plasticity is specific to the
stimuli which were attended to during behavior, and passive exposure does not cause enduring
changes in neuronal responses (Bjordahl et al. 1998; Recanzone et al. 1993; Weinberger 1998).
These results indicate that stimulus-specific plasticity occurs during learning and significantly
alters sensory information processing in multiple cortical areas.
Many studies have demonstrated that attention or the presence of a neuromodulator such as
acetylcholine is necessary to generate lasting cortical plasticity. Nucleus basalis (NB), which has

45
cholinergic and GABAergic projections to all areas of the neocortex, is active when animals are
learning new tasks (Butt and Hodge 1997; Richardson and DeLong 1991). Lesions of
cholinergic NB neurons or pharmacological blockage of acetylcholine prevent both learning and
plasticity in the motor cortex (Conner et al. 2003) and in the primary auditory cortex(Ji et al.
2001). Direct stimulation of NB paired with sensory inputs is sufficient to create stimulus-
specific cortical plasticity in A1 (Bakin and Weinberger 1996; Kilgard and Merzenich 1998a).
For example, NB stimulation paired with a single tone results in an increased representation of
the paired frequency in primary auditory cortex (Kilgard and Merzenich 1998a). The plasticity
observed in A1 after NB-stimulation pairing is similar to plasticity induced by classical
conditioning and through operant training protocols. Therefore, we expect that repeated
stimulation of NB paired with a tone will cause receptive field plasticity in secondary auditory
fields that enhances the representation of the paired frequency over other frequencies.
Posterior auditory field (PAF) shows less tonotopic organization, longer latencies and larger
receptive fields than A1, and is a well characterized secondary cortical field in the rat (Bao et al.
2001; Doron et al. 2002; Pandya et al. in review; Rutkowski et al. 2003). In this study, we
implanted rats with NB stimulating electrodes, paired a high frequency tone with NB
stimulation, and measured differences in cortical frequency representation and multi-unit
response properties in PAF in experimental and control rats.
46
METHODS
Six adult female Sprague Dawley rats (250-350g) were implanted with platinum bipolar
stimulating electrodes and then exposed to a 19 kHz tone paired with NB stimulation for a period
of 20-25 days. Twenty-four hours later, animals were anesthetized and the right auditory cortex
was densely mapped by recording tuning curves. Receptive field properties and topographic
organization of both primary (A1) and posterior (PAF) auditory fields were quantified. Data
from naïve controls (n=14) served as comparisons for all the NB-stimulated animals.
Additionally, mapping data from an animal that experienced a 9 kHz tone paired with NB-
stimulation during a previous study was analyzed to ensure that plasticity in PAF is frequency-
specific. The A1 map for this animal is depicted in Figure 1C of (Kilgard and Merzenich
1998a). Analysis of thresholds and frequency range of neural responses indicate every rat had
normal hearing (data not shown). The implantation, stimulation and mapping methods described
here are identical to those used in previous studies (Kilgard and Merzenich 1998a; Kilgard et al.
2001; Moucha et al. 2005; Pandya et al. 2005). All procedures were approved by the University
of Texas at Dallas Animal Care and Use Committee.
Implantation with NB Stimulating Electrode
Each experimental animal was implanted with a bipolar stimulating electrode (SNE-200,
Rhodes Medical Instruments, Woodland Hills, CA) which was lowered 7 mm below the cortical
surface from a location 2.3 mm posterior and 3.3 lateral to bregma in the right hemisphere. This
stereotaxic location has been used in previous studies of plasticity after NB-stimulation pairing
(Bakin and Weinberger 1996; Dimyan and Weinberger 1999; Kilgard and Merzenich 1998a,
47
2002, 1998b; Kilgard et al. 2001; Moucha et al. 2005; Pandya et al. 2005), and was not
histologically confirmed in the current study. A bone screw was placed approximately 5 mm
posterior to the stimulating electrode and another screw placed above the cerebellum to record a
an EEG. A four-channel connector was used to monitor EEG and deliver current to the
stimulating electrode. The entire implant assembly was stabilized with additional bone screws
and held in place with dental acrylic. In addition to the pentobarbital anesthetic (50 mg/kg), all
animals were given a dose of ceftriaxone antibiotic (20 mg/kg) to prevent infection and atropine
(1 mg/kg) and dexamethazone (4 mg/kg) to reduce fluid accumulations in the lungs immediately
following anesthetization and after completion of the surgery. All animals were allowed to
recover for 1-2 weeks before beginning NB stimulation. Animals were singly housed in wire
cages in the animal care facility after the NB-stimulation implant procedure and between NB
stimulation sessions.
NB Stimulation Procedure
NB stimulation took place in a 25x25x25cm wire cage located inside of a 50x60x70 cm
chamber lined with acoustic insulating foam. Sounds were presented from a speaker hanging
above the wire cage. The paired stimulus was a 19 kHz tone (50 dB SPL, 250 ms duration, 5 ms
rise-fall time) that was presented approximately every ten seconds 275-350 times per day for a
period of 20-25 days. Silent intervals were inserted at random to prevent habituation, and each
pairing session lasted approximately three and a half hours. Each tone presentation was
accompanied by a short burst of current delivered to the bipolar stimulating electrode (20
biphasic pulses, 0.1 ms duration at 100 Hz) approximately 50 ms after tone onset. The current
amplitude ranged from 120-200 µamps for each animal, and was selected to be the level that
would reliably elicit brief EEG desynchronization while the animal was in slow wave sleep.

48
Dense Electrode Mapping of Auditory Cortex
Approximately 24 hours after the tone-NB pairing phase ended, animals were anesthetized
with pentobarbital (50 mg/kg), and the right auditory cortex was mapped. Similar mapping
procedures were used to collect data from 14 experimentally naïve control animals. Because
only NB-stimulated animals received connectors and acrylic headcaps used for NB-stimulation,
it was impossible to be blind to experimental group during data collection. Briefly, a
tracheotomy was performed to prevent breathing problems and head noise, and a cisternal drain
was made to minimize cerebral edema. Then the right auditory cortex was exposed and the dura
resected. The cortex was maintained under a thin film of silicone oil to prevent desiccation.
Fluids with Ringer’s solution and supplemental anesthetic (pentobarbital - 8 mg/ml) were
periodically administered throughout the mapping procedure to maintain the animal’s health and
a state of areflexia.
All recordings were performed in a shielded, double-walled sound chamber. Frequency and
intensity calibrations were performed with an ACO Pacific microphone (PS9200-7016) and
Tucker-Davis SigCal software. The speaker (Motorola model #40-1221) was positioned directly
opposite the contralateral ear at a distance of 10 cm. Tucker-Davis Technologies hardware and
software (SigGen) were used for stimulus generation. Multiunit responses were recorded using
parylene-coated tungsten electrodes (250 µm separation, 2 MOhm at 1 kHz, FHC Inc.,
Bowdoinham, ME) which were lowered ~550 µm below the cortical surface (layer IV/V). The
neural signal was filtered (0.3-8 kHz) and amplified (10,000x). Action potential waveforms
were captured using a software program (Brainware, Tucker-Davis Technology, Alachua, FL),
and each recording site location was logged on a detailed digitized photo of the exposed auditory
cortex using blood vessels as landmarks. At each site, a tuning curve consisting of 81

49
frequencies spanning from 1 to 32 kHz at 16 intensities spanning from 0 to 75 dB SPL was
presented (1,296 tones, 25 ms duration, 5 ms rise and fall time, 1 repetition of each). The tones
were randomly interleaved and presented every 500 ms. The total duration of each mapping
experiment was similar in naïve and experimental groups (31 ± 1.2 and 26 ± 1.9 hours, p > 0.1).
Data Analysis
In total, 493 experimental sites (6 animals, 295 A1, 198 PAF sites) were compared to 588
sites from naïve controls (14 animals total, 390 A1, 198 PAF sites). For the naïve control
groups, the A1 group consisted of 8 animals, while the PAF group contained 9 animals (3 naïve
controls belonged to both the A1 and PAF control groups). The control group for each cortical
field was selected so that every animal had at least 10 recording sites in the given auditory field.
All experimental animals met this criterion for both A1 and PAF.
Tuning Curve Analysis
All sites from control and experimental rats were analyzed together in a blind, randomized
batch to prevent experimenter bias. Several receptive field and latency characteristics were
defined at each site. The lowest intensity that evoked a reliable neural response was defined as
the threshold, and the frequency at which this response occurred defined the characteristic
frequency (CF). Four bandwidths (BW10-BW40) were calculated as the range of frequencies
(measured in octaves) which evoked reliable responses at 10, 20, 30 and 40 dB above threshold
(Figure 1.1 A & C). A post-stimulus time histogram (PSTH) was constructed from all of the
responses to tone-intensity combinations within the receptive field. The peak latency for each
site was calculated as the time of the maximum number of spikes in the PSTH (Figure 1.1 B &
D). The spontaneous firing rate at each site was estimated as the spike rate in the first 9 ms
recorded after tone onset (before any neural response to sounds). For all of these measures,
50
experimental and control groups were compared using two-tailed unpaired Student’s t-tests to
determine if there were statistically significant differences in receptive field or response
characteristics after NB-stimulation pairing.
Topography and map expansions
A1 was functionally defined on the basis of latency and tonotopy (Kilgard and Merzenich
1999). In general, sites with peak latencies less than 20 msec were classified as A1. Only 4% of
A1 sites in this study exhibited longer latencies. The A1-PAF border was defined using the
previously characterized change in topography and latency (Bao et al. 2001; Doron et al. 2002;
Pandya et al. in review; Rutkowski et al. 2003). The dorsal and ventral borders of A1 were also
defined by changes in topography and latency, while the anterior border of A1 was defined
primarily by a reversal in topgraphy. Other boundaries were defined using sites non-responsive
to auditory stimuli, or in some cases the limits of data collection.
Changes in cortical tone frequency representation were quantified by comparing the
distribution of receptive field tuning (CF’s) in experimental animals to naïve control animals.
Since the percent of sites with CF’s in any given frequency range could be biased if the spacing
of recording sites was not even across the cortical surface (i.e. due to blood vessels), we also
used the percent of cortical area measure used in earlier studies (Kilgard and Merzenich 1998a).
Briefly, Voronoi tessellation was used to transform the discretely sampled surface into a
continuous map using the assumption that each point on the map has the response characteristics
of the nearest recording site. Since regions with above average sampling density have smaller
tessellations, they do not bias estimates of the cortical response. The percent of the cortical area
responding to each tone was estimated as the sum of the areas of all tessellations from sites (in
A1 or PAF) with receptive fields that included the tone divided by the total area of the field.

51
Changes in PAF and A1 frequency representation were quantified by comparing the percentage
of the cortical area of each field which responded to all presented tones in the tuning curve in
naïve and experimental animals. Two-tailed unpaired Student’s T-tests were used to determine
the statistical significance of all comparisons.

52
RESULTS
Pairing NB-stimulation with a 19 kHz tone shifted the response of A1 and PAF neurons to
favor high frequency tones over low frequency tones and increased frequency selectivity in PAF.
Example of Plasticity in Primary Auditory Cortex
The primary auditory cortex (A1) of each animal was defined by its location, tonotopic
organization, narrow bandwidths and short latencies. NB-stimulation paired with a 19 kHz tone
increased the area of A1 that responded to high-frequency tones. While 35% of A1 responded to
a 19 kHz 60 dB SPL tone in the example control animal (Figure 3.2 A), 54% of A1 responded to
the same tone in an NB-stimulated animal (Figure 3.2 B). The CF of sites increases
systematically from posterior to anterior across the surface of A1. The coefficient of
determination (r2) between anterior-posterior location and CF for A1 sites in the example control
animal is 0.68 (p < 10-6
, Figure 3.2 A). All A1 maps used in this study had large, significant
coefficients of determination between anterior-posterior location and CF (r2, mean ± s.e: 0.79 ±
0.02). NB-tone pairing did not eliminate the tonotopic organization of A1. The r2 between
anterior-posterior location in A1 and CF was 0.66 (p < 10-19
, Figure 3.2 B) for the experimental
map shown. The mean r2 value for A1 in all NB-stimulated rats was 0.79 ± 0.05.
Receptive fields in A1 were narrower than PAF sites (Figure 3.1 A and C), and did not
change following NB-tone pairing. In both the representative control and experimental animals,
the bandwidths 30 dB above threshold were approximately 2 octaves (Figure 3.2 C and D). The
peak latencies for A1 sites were shorter than PAF, usually within 10-20 ms after tone onset
(Figure 3.1 B). In the representative control animal, the average peak latency was 19.8 ± 2.6ms,
53
while in the representative experimental animal the average peak latency was 17.1 ± 0.7 ms
(Figure 3.2 E and F). There was no significant change in A1 latencies in experimental animals
compared to control animals (peak latency: control, 18.0 ± 0.4; experimental, 19.4 ± 0.7, p =
0.06).
Example of Plasticity in Posterior Auditory Field
The posterior auditory field (PAF) was defined based on its location posterior to A1, poor
tonotopic organization, large receptive field sizes, and long response latencies. The anterior
border of PAF was defined by the low frequency edge of A1, while dorsal and ventral borders of
PAF were defined by sites which were non-responsive to tones. The far posterior border of PAF
was often not as well demarcated because access was limited by the edge of the craniotomy.
While the CF’s of A1 sites in controls were fairly evenly distributed (in log space) between 1 and
32 kHz, a relatively large proportion of PAF sites were tuned to frequencies between 5 and 8
kHz (Figure 3.2 A). Receptive fields in PAF of the control animal usually spanned more than 3
octaves at BW30 (Figure 3.2 C), and many sites responded to all tones within the rat hearing
range (Figure 3.1 C). The clustering of PAF CF’s towards mid-frequencies may result from the
large receptive field sizes and lower mid-frequency hearing thresholds of rats (Kelly and
Masterton 1977).
In our example experimental animal, NB-stimulation paired with a 19 kHz tone decreased the
area of the PAF cortex which responded to low frequency tones, but did not increase the total
area of PAF that responded to high-frequency tones. While 82% of PAF responded to a 2 kHz
60 dB SPL tone in the example control animal (Figure 3.2 A), only 56% of PAF responded to the
same tone in an NB-stimulated animal (Figure 3.2 B). In the control and experimental animals,
94% and 82% of PAF responded to a 19 kHz 60 dB SPL tone, indicating that the major effect of

54
NB-tone pairing may have been to decrease responses to unpaired tones which in turn lead to
sharpened tuning curves. After NB stimulation, tuning curves in PAF became significantly
narrower, and many more sites had CF’s between 11 and 20 kHz (Figure 3.2 B). In the
representative control animal, the average bandwidth of PAF sites was 3.9 ± .17 octaves, while
the average bandwidth of PAF sites in the representative experimental animal was only 2.92 ±
.16 octaves (Figure 3.2 C and D). The peak latencies in PAF for both the control and
experimental animals were significantly longer than A1, between 30 and 80 ms (Figure 3.1 B and
D, and Figure 3.2 E and F). The average peak latency of PAF sites for the representative control
and experimental animals were 51.4 ± 3.2 ms and 60.7 ± 7.9 ms, respectively. NB-tone pairing
did not significantly alter response latencies in PAF (peak latency, control: 53.1± 2.2 ms,
experimental: 54.1± 2.3 ms, p = 0.75). These two example maps illustrate that both A1 and
PAF exhibit shifts in their frequency tuning to favor high frequencies after NB-stimulation
paired with a 19 kHz tone. However, only the secondary cortical area (PAF) showed increased
frequency selectivity.
Posterior Auditory Field Topography
PAF showed evidence of weak tonotopic organization in control animals that was eliminated
after NB-tone pairing. When all PAF sites from all nine control animals were examined
together, we found a weak, but statistically significant, correlation between each site’s anterior-
posterior position (relative to the A1-PAF border) and CF (r2 = 0.09, p < 10
-5, Figure 3.3 A).
However, when each animal was considered separately, only 3 out of the 9 control rats showed
significant correlations between position and CF. In the experimental group, there was no
evidence of tonotopic organization when all PAF sites from all animals were grouped together (r2
= -0.09, p = 0.23, Figure 3.3 B). Only one of the six experimental animals showed any evidence
55
of tonotopic organization in PAF when considered individually. The average coefficient of
determination (r2) between anterior-posterior axis location and CF in PAF for all individual
experimental and control animals was 0.12 ± 0.03. The changes in frequency representation
were not accompanied by a significant increase in the overall area of the cortical field in
experimental animals compared to control animals for either A1 (1.94 ± 0.26 vs. 1.48 ± 0.17
mm2, p=.13) or PAF (1.28 ± 0.22 vs. 0.89 ± 0.18 mm
2, p = .15).
NB Stimulation Reduced PAF Responses to Low Frequency Tones
NB-stimulation paired with a 19 kHz tone resulted in an increase in the proportion of sites in
PAF which were tuned to high frequencies (Figure 3.4). In experimental animals, a larger
percentage of sites had CF’s which fell within half an octave of 16 kHz than control animals
(mean percentage of total PAF sites in the 16 kHz bin for each animal, controls: 22% ±5,
experimental: 37% ±10, p=0.11). In experimental animals, 28% ±4 of PAF sites had CF’s within
a half an octave of 8 kHz, compared to 41% ±6 in naïve controls (p = 0.11). There was no
difference in the percentage of sites falling into the 2 or 4 kHz centered bins (Figure 3.4). These
results are consistent with a shift in the CF of initially mid-frequency tuned sites (i.e. in the 8
kHz bin) towards the tone frequency paired with NB-stimulation. In the one animal that
experienced a 9 kHz tone paired with NB-stimulation, the percentage of PAF sites in the 2 and 4
kHz bins (4% and 0%, respectively) were also decreased compared to naïve controls, providing
further indication that the shift in tuning in PAF following NB-tone pairing was frequency-
specific.
Pairing NB stimulation with a 19 kHz tone increased tone frequency selectivity in PAF. The
average bandwidth 30 dB above threshold (BW30) decreased by 17%, from 3.6 ± 0.08 octaves in
controls to 3.0 ± 0.08 octaves in experimental animals (p<10-7). Sites tuned to higher
56
frequencies exhibited the largest reduction in BW. For sites with CF’s within one half octave of
16 kHz, receptive fields were significantly narrower at each analyzed suprathreshold intensity
(Figure 3.5). For example, BW30 of sites in the 16 kHz bin decreased by 30%, from 3.8 ± 0.14
octaves in control animals to only 2.7 ± 0.18 octaves in experimental animals (p<10-6
). Mid-
frequency sites (8 kHz bin) showed a more modest bandwidth decrease and the low frequency
bins did not show any change in bandwidths at any intensity above threshold (Figure 3.5).
The frequency-specific nature of the bandwidth decrease in PAF suggests the possibility that
only sites that were activated by the 19 kHz tone paired with NB stimulation became more
frequency selective, while sites that did not respond to the 19 kHz tone were unaffected. All
PAF sites in both the control and experimental groups were subdivided into those whose
receptive fields included 19 kHz played at 50 dB SPL (Tone In) and those that did not (Tone
Out). As expected based on the selection criteria, the average bandwidth of the Tone In subset of
sites was significantly larger than the average bandwidth of the Tone Out subsets in both control
and experimental animals (Figure 3.6). The Tone In subset not only included sites which had
CF’s near the paired tone, but also included virtually all broadly tuned sites (i.e., with
bandwidths greater than 4 octaves) regardless of their assigned best frequency.
NB-tone pairing decreased the bandwidth of the Tone In subset while the Tone Out subset of
PAF sites remained unchanged (Figure 3.6). The average bandwidth 40 dB above threshold
(BW40) of Tone In sites dropped by 0.79 octaves following NB-tone pairing, from 4.23 ± 0.12
octaves in control animals to 3.44 ± 0.12 octaves in experimental animals (p < 10-5
). Pairing did
not alter the average bandwidth of Tone Out sites (BW40 in octaves of Tone Out sites, controls:
2.62 ± 0.16, experimentals: 2.58 ± 0.16, p = 0.85). These results imply that plasticity in PAF
may have been restricted to those sites which were able to respond to the paired tone before NB-

57
tone pairing began (Figure 3.7). The increase in frequency selectivity in sites that responded to
the 19 kHz tone paired with NB stimulation produced a decrease in the percentage of PAF which
responded to low frequency tones. While 87% ± 3.2 of PAF responded to a 2 kHz tone played at
60dB SPL in the control rats, only 53%± 6.1 of PAF responded after NB-stimulation paired with
a 19 kHz tone (p = 0.0001, Figure 3.8 B). Thus, 39% fewer sites responded to the 2 kHz, 60 dB
SPL tone in experimental animals compared to naïve control animals. This decrease in
responsiveness to low-frequency tones was observed for all tones with frequencies below 5 kHz
played at intensities within the rat’s hearing range (Figure 3.9 C). In contrast, there was only a
modest increase in the percentage of PAF cortex which responded to high-frequency tones. For
example, the percentage of PAF which responded to a 16 kHz 60 dB SPL tone increased from
65.7% ± 6.9 in control animals to 73.7% ± 6.3 of PAF in experimental animals (p = .41, Figure
3.8 B). Therefore, after NB-stimulation paired with a 19 kHz tone, the percentage of PAF cortex
which responded to high-frequency tones increased only modestly, while the percentage of PAF
cortex which responded to low-frequency tones decreased significantly (Figure 3.9).
NB Stimulation increased A1 response to high frequency tones
Primary auditory cortex (A1) showed an expanded representation of high-frequency sounds
following NB stimulation paired with the 19 kHz tone, confirming previous studies of NB-tone
pairing (Kilgard and Merzenich 1998a). The percentage of A1 sites which responded to a 16
kHz 60 dB SPL tone increased, from 40 % ± 3.62 in control animals to 54.08 % ± 5.29 in
experimental animals (p = 0.02) (Figure 3.8 A). There were similar increases in the percentage
of A1 sites which responded to tones between 10 and 17 kHz (at intensities between 50 and 70
dB SPL). In addition, the percentage of A1 sites which responded to low-frequency tones
decreased slightly (percentage of A1 cortex responding to 2 kHz, controls: 41.7% ± 3.62,
58
experimentals: 31.54% ± 6.45, p = 0.13, Figure 3.8 A). Unlike the plasticity observed in PAF,
A1 reorganization was not accompanied by significant alterations in receptive field size (BW 30,
controls: 1.82 ± 0.05, experimentals: 1.78±0.05, p = 0.61). Therefore, NB-tone pairing in A1
appears to have created a shift of tuning curves towards the paired tone frequency, without
changing receptive field sizes.
Frequency-Specific Changes in PAF Firing Rate
It is possible that NB-tone pairing increased the number of action potentials elicited by the
paired (19 kHz) tone without significantly increasing the area of PAF cortex which responded to
that tone. The percentage of cortex measure used in this and previous publications (Kilgard and
Merzenich 1998a; Kilgard et al. 2001; Pandya et al. 2005) would not detect such an increase,
because the measure only takes into account receptive field boundaries (i.e. tones are ‘in’ or
‘out’) and not variations in the evoked response to different tones within each site’s receptive
field. To determine whether NB-tone pairing increased responses to high-frequency tones, we
quantified the mean response of all PAF sites in experimental and control animals to every
presented frequency-intensity tone combination. At each site, the number of spikes evoked by
each tone was averaged with the neighboring frequency and intensity steps (5 dB above and
below and 1/16th
of an octave above and below each tone).
Pairing NB-stimulation with a 19 kHz tone did not increase the number of spikes elicited by
high frequency tones, but did result in a large decrease in the number of spikes elicited by low
frequency tones. In control animals, a 16 kHz 60 dB SPL tone elicited 0.69 ± 0.07 spikes per
PAF site, while in the experimental group the same tone elicited 0.64 ± 0.06 spikes (p = 0.64).
In contrast, a 2 kHz 60 dB SPL tone evoked 0.97 ± 0.09 spikes per site in controls compared to
only 0.54 ± 0.06 spikes in experimental animals (p = 0.0002, Figure 3.10 A). Changes of similar

59
magnitude and statistical significance were observed in the responses to most tones played below
5 kHz (Figure 3.11). These results support our initial observation that NB-tone pairing caused a
reduction in the bandwidth of PAF sites, but did not necessarily shift receptive fields towards the
paired tone. If the reduction of bandwidth in PAF sites was due to shifts of individual neurons
within the multi-unit clusters toward the paired frequency, we would have expected to see
increased evoked responses to the paired tone. We saw no indication of increased responses to
any high-frequency tone (Figure 3.11). Previous studies of A1 that systematically evaluated this
issue observed that changes in selectivity of multi-unit responses closely mirrored the changes of
well sorted single units (Kilgard and Merzenich 1998a).
When sites were subdivided by whether they responded to the paired stimulus (Tone In) or
not (Tone Out), the decrease in response to low-frequency tones was found to originate primarily
from the Tone In subset of sites (Figure 3.10 B and C). In control animals, Tone In sites
responded to a 2 kHz 60 dB SPL tone with 0.99 ± 0.11 spikes per PAF site, but after NB-tone
pairing, the same tone elicited only 0.52 ± 0.06 spikes (p = 0.0002). Although there was some
evidence for decreased response strength to low-frequency tones in the Tone Out subpopulation
(spikes per PAF site, controls: 0.89 ± 0.11, experimentals: 0.68 ± 0.09, p = 0.16, Figure 3.10 C),
this decrease was small and not reliable. The response to high frequency tones was not increased
in either the Tone In or Tone Out subgroups (Figure 3.10 B and C). This analysis, which
required no judgments about tuning curve edges, supports our proposition that the primary effect
of NB-stimulation pairing in PAF was to cause sites which responded to the 19 kHz tone to
become more selective by decreasing their responses to low and mid-frequency tones (Figure
3.11).

60
Spontaneous firing increased in both PAF and A1 after NB-tone pairing. In PAF, the control
group had a spontaneous firing rate of 2.75 ± 0.16 Hz, while the experimental group had a
spontaneous rate of 4.68 ± 0.25 Hz (p < 10-4
). In A1, the control group’s spontaneous firing rate
was 3.74 ± 0 .16 Hz, while the experimental group had a spontaneous rate of 4.62 ± 0.21Hz
(p=0.0009). The increase in spontaneous firing showed no evidence of frequency-specificity in
either PAF or A1.

61
DISCUSSION
Summary of Results
NB-stimulation paired with a 19 kHz tone increased the cortical response to high frequency
tones relative to other tone frequencies in both primary and non-primary auditory cortex.
Consistent with earlier observations, the A1 representation of high frequencies increased without
a significant decrease in the representation of low or mid frequency tones or change in average
receptive field sizes (Kilgard and Merzenich 1998a; Kilgard et al. 2001). PAF showed a pattern
of plasticity in response to NB-tone pairing which was distinctly different from A1. Rather than
shifting tuning curves toward the paired tone, PAF sites became more selective. The principal
effect observed in PAF was not an increase in the representation of the paired tone, but a
decrease in the representation of low or mid-frequency tones. While we did not record from the
same neurons before and after NB stimulation, it appears that sites which were responsive to the
paired tone before NB stimulation increased their selectivity while low-frequency sites were left
unaltered.
Changes in Spontaneous Firing and Cortical Plasticity
We observed increased spontaneous activity in both PAF and A1 after NB-stimulation
pairing. Increased spontaneous activity has been observed in several studies of NB-stimulation
pairing using diverse types of paired auditory stimuli (Metherate and Ashe 1993; Pandya et al.
2005), although not all studies of NB-stimulation pairing have observed increased spontaneous
firing rate(Kilgard et al. 2001). Direct application of acetylcholine onto cortical neurons has also
been shown to increase spontaneous firing in some cells(Metherate and Weinberger 1990),
62
implying that it may be a generalized effect of NB-stimulation. In contrast, receptive field
properties such as frequency selectivity and response latency seem to change because of specific
attributes of the auditory stimuli which were paired with NB-stimulation (Kilgard et al. 2001).
Previous Studies of Plasticity in Non-Primary Cortex
Receptive field narrowing may be a common feature of plasticity in broadly tuned non-
primary cortical areas. Neurons in secondary cortical fields were more prone to bandwidth
decreases than primary cortical neurons after tone-shock conditioning (Diamond and Weinberger
1986). In the ventroposterior area, which is similar to PAF in terms of response characteristics
and location relative to A1, receptive fields were narrowed after stimulation of the ventral
tegmental area(VTA) (Bao et al. 2001). The results are analogous to our observation that
receptive field sizes in PAF were decreased after NB-tone pairing. However, secondary cortical
areas do not always show receptive field narrowing when undergoing plasticity. Extensive
training on an auditory frequency discrimination task led to frequency-specific reorganization of
secondary field SRAF (suprarhinal auditory field) in trained rats, but did not affect receptive
field sizes (Polley et al. 2006). This difference may have been because receptive fields in SRAF
are relatively narrow even in naïve animals or because of the sensory statistics associated with
the behavioral tasks.
Receptive field decreases have also been observed in secondary fields of the visual system
after behavioral training. Training on an orientation discrimination task leads to smaller
receptive fields in V4 (Yang and Maunsell 2004), Discriminating complex stimuli led to smaller
receptive fields in the inferotemporal cortex of monkeys(DiCarlo and Maunsell 2003). In both
of these cases, plasticity was limited to neurons which were active during performance of the

63
discrimination task, similar to our finding that PAF plasticity after NB-tone pairing may have
been limited to sites which were activated by the paired stimulus.
Models of Plasticity
The PAF plasticity observed in this study could result from changes occurring in at least
three different locations: A1, auditory thalamus, or PAF. Plasticity in PAF could be a direct
reflection of map reorganization in A1. Anatomical studies have shown that A1 sends projections
to PAF (Mascagni et al. 1993; Romanski and LeDoux 1993). In the cat, PAF requires active
inputs from A1 in order to produce driven responses (Kitzes and Hollrigel 1996). The width of
PAF receptive fields suggests that PAF neurons likely receive inputs from broad regions of A1
cortex rather than a tightly circumscribed region. High frequency tuned sites probably receive
inputs from the more anterior regions of A1, while low frequency tuned PAF sites probably
receive inputs from the more posterior regions of A1. Pairing a high frequency tone with NB
stimulation leads neurons in anterior A1 to shift their tuning curves towards the paired
frequency. PAF sites which receive inputs from the anterior region of A1 would now receive
inputs from a smaller range of frequencies near the paired tone and therefore would decrease
their receptive field sizes. On the other hand, low frequency-tuned PAF sites would still receive
inputs from A1 neurons which responded to a broad range of frequencies and would therefore
not change their receptive field sizes. This model could explain the pattern of plasticity which
we observed in PAF, and could be used to make predictions about the results of future plasticity
studies in PAF using more complex sounds based on known A1 results (Kilgard and Merzenich
2002, 1998b; Kilgard et al. 2001; Moucha et al. 2005; Pandya et al. 2005).
It is also possible that changes in the inputs PAF receives from the non-lemnisical thalamus
could explain the observed plasticity in PAF. Like other secondary auditory fields, PAF receives
64
inputs from both the non-classical ascending pathway via the dorsal and medial divisions of the
auditory thalamus and the classical ascending pathway via A1. Both the medial and dorsal
divisions of the thalamus tend to have longer latency responses and broader tuning than the
ventral MGN (Aitkin and Webster 1971; Bordi and LeDoux 1994; Calford 1983). Projections
from these nuclei into PAF are not as strictly topographically organized as projections into A1
(Arnault and Roger 1990; Kimura et al. 2003; Malmierca 2003; Winer et al. 1999). This
observation suggests that PAF response properties may be explained by its thalamic inputs, just
as the organization of A1 is likely due to projections from the narrowly tuned and
topographically-organized ventral MGN (Winer et al. 1999). Both the medial and dorsal
divisions of the thalamus exhibit shifts in receptive field tuning and sometimes reductions in
receptive field sizes after classical conditioning (Edeline and Weinberger 1992, 1991). Although
plasticity in the medial and dorsal divisions of the thalamus are known to be sensitive to
cholinergic drugs (Mooney et al. 2004), to our knowledge the direct effects of NB-stimulation
pairing on receptive field properties of the thalamus have not been reported. There are no direct
projections from NB to the auditory thalamus (Hallanger et al. 1987), so thalamic plasticity after
NB-stimulation pairing would have to occur through some indirect route (Kolmac and Mitrofanis
1999). There are projections from A1 to the auditory thalamus (Hazama et al. 2004; Kimura et
al. 2005; Winer and Larue 1987), which could cause changes in tuning in the dorsal and medial
thalamus which reflects the plasticity in A1.
Since PAF receives projections directly from NB (Arnault and Roger 1990), it is also
possible that the organization of PAF’s intrinsic connections is directly altered by NB-tone
pairing. In the visual system, training on some behavioral tasks has been shown to create cortical
plasticity in secondary visual areas with no accompanying change in the primary visual cortex

65
(DiCarlo and Maunsell 2003; Ghose 2004; Ghose et al. 2002; Yang and Maunsell 2004). The
plasticity which we observed in PAF after NB-tone pairing is likely due to some combination of
changes in A1, MGB, and PAF.
Predictions for Future Studies
Our earlier studies have shown that the type of sounds paired with NB stimulation determines
the form of plasticity generated in A1 (Kilgard and Merzenich 2002, 1998b; Kilgard et al. 2001;
Moucha et al. 2005; Pandya et al. 2005). Pairing temporally modulated tones decreases
frequency selectivity in A1, while pairing tones with many different frequencies sharpens
frequency tuning. If the A1 feed forward model outlined above is correct, PAF receptive field
narrowing would follow any A1 frequency map expansion, but would not necessarily follow
plasticity that narrows frequency bandwidth in A1 without changing tonotopy. Sounds that
broaden A1 tuning curves would have relatively little effect on PAF neurons which already
receive convergent inputs.
Earlier findings indicate that secondary cortical areas may be more amenable to plasticity in
response to complex stimuli than primary cortical fields (Diamond and Weinberger 1984;
Weinberger et al. 1984). Behavioral training causes V4 and inferotemporal cortex neurons to
increase their selectivity for trained stimuli (DiCarlo and Maunsell 2003; Ghose 2004; Yang and
Maunsell 2004). It is currently unknown how PAF is altered by pairing NB-stimulation with
complex spectrotemporal sequences. Our results and earlier studies of secondary auditory fields
support the idea that non-primary auditory cortex is plastic and likely contributes to perceptual
learning.
66
Technical Considerations
The methods of our current study did not allow us to record from the same neurons before
and after NB-stimulation pairing. The finding that only the Tone In subsets of neurons were
different between control and experimental animals implies that PAF plasticity was restricted to
neurons which were responsive to the paired tone before NB-stimulation. However, it is also
possible that the observed plasticity was caused by more generalized effects in which some PAF
neurons shifted away from the paired tone (and thus joined the Tone Out group) while other PAF
neurons shifted towards the paired tone (joining the Tone In group). While we favor the first
explanation because it is less complicated (i.e., one type of plasticity limited to the activated
population), the second explanation cannot be excluded without recording from the same
neurons before and after NB-tone pairing.
All of the physiological recordings for this study were made under pentobarbital anesthesia.
Several studies have indicated that anesthesia can change the response properties of auditory
neurons (Gaese and Ostwald 2001; Zurita et al. 1994). In addition, some forms of plasticity are
only expressed during the awake state, such as shifts in response properties during a difficult
behavioral task (Fritz et al. 2005; Ito and Gilbert 1999; Li et al. 2004). Our observation that the
changes in both A1 and PAF cortex caused by NB-tone pairing were present under deep
anesthesia implies that the observed changes reflect plasticity in the circuitry of the auditory
system, and that feedback activity from higher associational areas may not be necessary for some
forms of experience-dependent plasticity to be expressed.
Conclusions
This study demonstrates for the first time that NB-tone pairing causes stimulus-specific
plasticity in a non-primary cortical area. PAF sites showed a tendency to become selective for
67
the paired stimulus at the exclusion of other frequencies. This plasticity differs significantly
from the concurrent plasticity in A1. Therefore, even simple stimuli can create complex patterns
of plasticity across many stations of the auditory system. Recent behavioral and physiological
studies have explored the role of primary auditory cortex in processing complex stimuli
including speech sounds (Ohl and Scheich 1997; Reed et al. 2003; Sakai and Kudoh 2005;
Steinschneider et al. 2003; Toro et al. 2005; Wang and Kadia 2001; Wetzel et al. 1998). It has
been speculated that secondary fields may be specialized for extracting behaviorally relevant
features from complex stimuli (Rauschecker 1998), and that learning-induced plasticity in these
areas enhances this specialization (Ghose 2004). To fully understand perceptual learning, it will
be critical to systematically explore plasticity in response to complex stimuli in both primary and
non-primary sensory cortex.
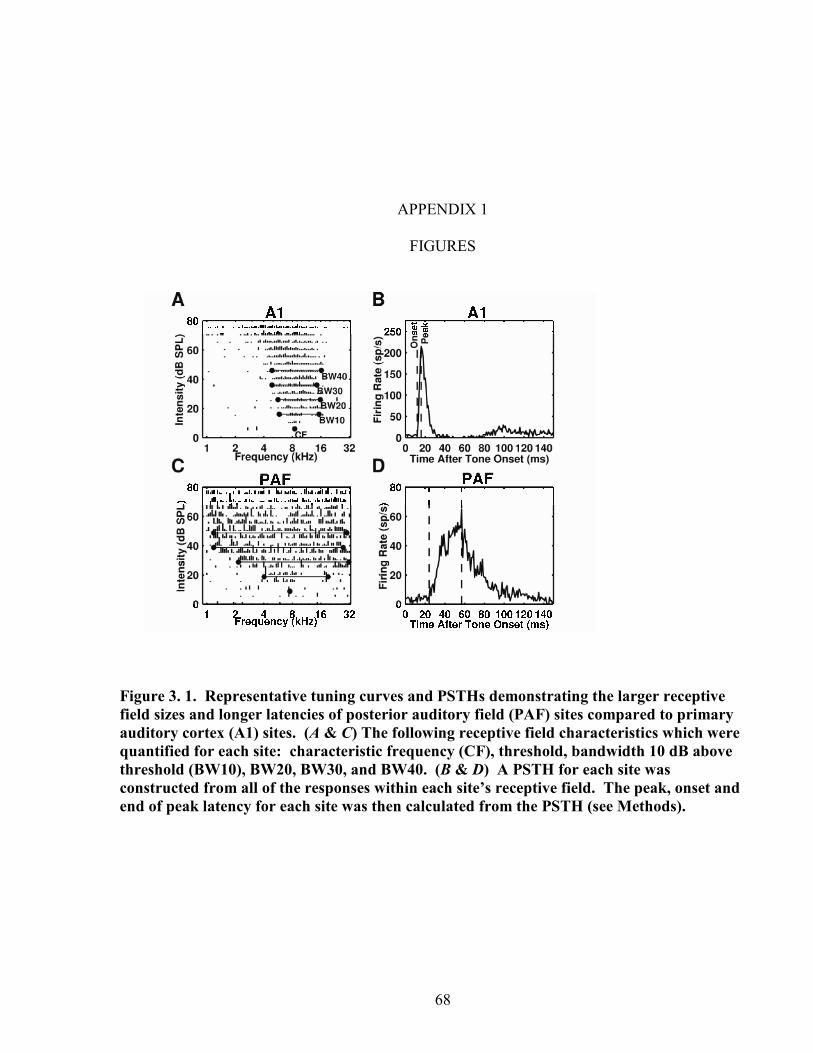
68
APPENDIX 1
FIGURES
Figure 3. 1. Representative tuning curves and PSTHs demonstrating the larger receptive
field sizes and longer latencies of posterior auditory field (PAF) sites compared to primary
auditory cortex (A1) sites. (A & C) The following receptive field characteristics which were
quantified for each site: characteristic frequency (CF), threshold, bandwidth 10 dB above
threshold (BW10), BW20, BW30, and BW40. (B & D) A PSTH for each site was
constructed from all of the responses within each site’s receptive field. The peak, onset and
end of peak latency for each site was then calculated from the PSTH (see Methods).
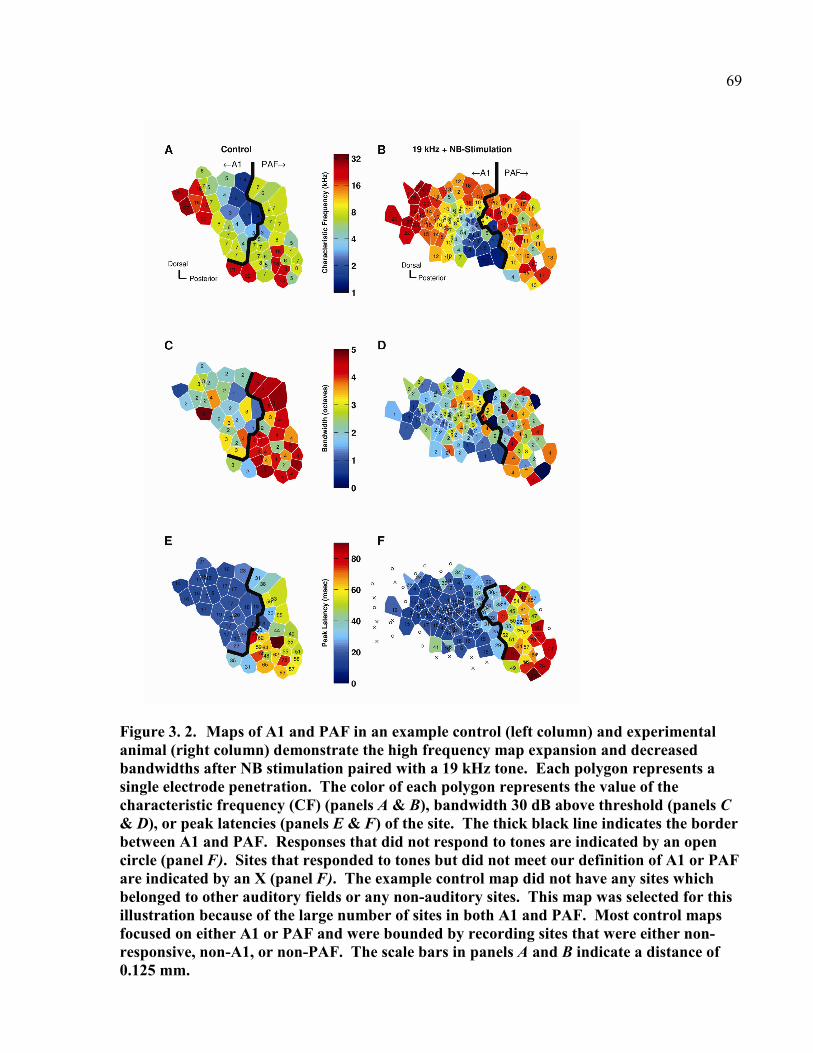
69
Figure 3. 2. Maps of A1 and PAF in an example control (left column) and experimental animal (right column) demonstrate the high frequency map expansion and decreased
bandwidths after NB stimulation paired with a 19 kHz tone. Each polygon represents a
single electrode penetration. The color of each polygon represents the value of the
characteristic frequency (CF) (panels A & B), bandwidth 30 dB above threshold (panels C
& D), or peak latencies (panels E & F) of the site. The thick black line indicates the border
between A1 and PAF. Responses that did not respond to tones are indicated by an open
circle (panel F). Sites that responded to tones but did not meet our definition of A1 or PAF
are indicated by an X (panel F). The example control map did not have any sites which
belonged to other auditory fields or any non-auditory sites. This map was selected for this
illustration because of the large number of sites in both A1 and PAF. Most control maps
focused on either A1 or PAF and were bounded by recording sites that were either non-
responsive, non-A1, or non-PAF. The scale bars in panels A and B indicate a distance of
0.125 mm.

70
Figure 3. 3. Scatter plots of A1 and PAF with best-fit lines demonstrate that PAF is more
loosely tonotopically organized than A1. In order to normalize for irregular borders and
differing sizes of the A1 and PAF fields between animals, the A1 and PAF border was
chosen as the mean position between the most posterior A1 site and most anterior PAF site.
Because the border between A1 and PAF is frequently irregular, some A1 sites were
located further posterior than the most anterior PAF site. A1 sites are denoted by open
circles while PAF sites are denoted by points in the plot for controls (panel A) and for NB-
stimulated animals (panel B).

71
Figure 3. 4. Histogram of the proportion of PAF sites (±SEM) for each control or
experimental group with characteristic frequency (CF) falling into each of 4 frequency
bins, demonstrating the shift in tuning of PAF sites following NB-tone pairing. The one-
octave wide bins are centered on 2, 4, 8, and 16 kHz.
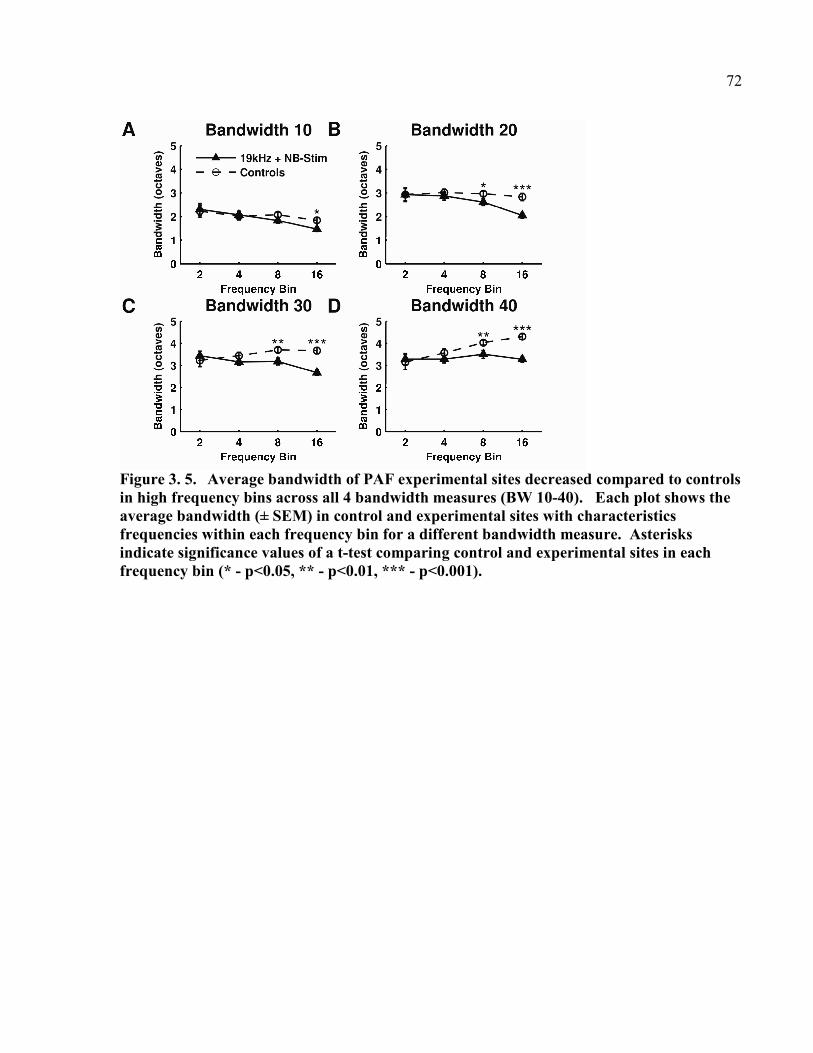
72
Figure 3. 5. Average bandwidth of PAF experimental sites decreased compared to controls in high frequency bins across all 4 bandwidth measures (BW 10-40). Each plot shows the
average bandwidth (± SEM) in control and experimental sites with characteristics
frequencies within each frequency bin for a different bandwidth measure. Asterisks
indicate significance values of a t-test comparing control and experimental sites in each
frequency bin (* - p<0.05, ** - p<0.01, *** - p<0.001).

73
Figure 3. 6. The average bandwidth of PAF sites which contained the paired tone (19 kHz,
50 dB SPL) in their receptive field (Tone In) were decreased in control versus experimental
animals. Tone Out sites did not change their receptive field sizes. BW40 was chosen for
this measure because the paired tone fell closer to BW40 than other bandwidth measures in
the receptive field of most PAF sites. However, the same pattern of results was observed
for all bandwidth measures. Asterisks indicate level of significance (* - p<0.05, ** - p<0.01,
*** - p<0.001). The average bandwidths of Tone In sites were significantly larger than the
average bandwidths of Tone Out sites in both control and experimental animals (see
Results).

74
Figure 3. 7. NB-tone pairing narrows frequency tuning and shifts characteristic
frequencies (CF) toward the paired tone frequency (19 kHz). Every PAF recording site for
controls (A) and experimental animals (B) is shown sorted by the highest frequency
contained within its receptive field for 50 dB SPL tones. Sites which included 19 kHz
within their receptive field are plotted in dark gray, while sites which did not are depicted
in light gray. The black circles denote the assigned CF of each site. The vertical black line
on each panel is located at 19 kHz.

75
Figure 3. 8. Percentage of A1 and PAF that responds to several tones presented at 60 dB SPL. The average percentage of each field which responded to each tone frequency
presented at 60 dB SPL is depicted. While A1 (panel A) showed an increase in the number
of neurons which responded to high-frequency tones (such as 16 kHz), PAF (panel B) sites
showed a decrease in the number of neurons which responded to low-frequency tones (2
and 4 kHz). Stars indicate level of significance in a comparison between controls and
experimentals (* - p<0.05, ** - p<0.01, *** - p<0.001).

76
Figure 3. 9. The percentage of PAF that responded to all low-frequency tones decreased
after NB-tone pairing. (A) The average percentage of PAF cortex in controls which
responds to each tone frequency-intensity combination is shown. Contour lines on the plot
indicate the tones which elicit responses from 0, 20, 40, 60 and 80% of PAF neurons. (B)
The average percentage of PAF cortex in experimental animals responding to each tone
frequency-intensity combination. The 60 and 80% contour lines were shifted towards
high-frequencies in the experimental animals compared to controls. (C) The difference in
the percentage of PAF responding to each tone-intensity combination (experimental –
controls) is shown. White lines delineate the frequency-intensity combinations with a
significant decrease in the percent of cortex responding after NB-stimulation pairing (solid
– p< 0.05, dashed – p<0.01). No increases in the percentage of cortex responding were
statistically significant. The white point in Panels A-C indicates the tone which was paired
with NB-stimulation in experimental animals (19 kHz @ 50 dB SPL).

77
Figure 3. 10. Depiction of the number of spikes elicited by tones played at 60 dB SPL.
Panel A shows the average evoked response for all PAF sites. Panels B and C show the
responses of those subsets of sites which contained the paired tone within their receptive
field (panel B) or did not (panel C). A decrease in the number of spikes elicited by low-
frequency tones (panel A) was primarily caused by a decrease in responsiveness of the Tone
In subset of sites (panel B). Asterisks indicate level of significance (* - p<0.05, ** - p<0.01,
*** - p<0.001).

78
Figure 3. 11 Average number of spikes responding to each frequency-intensity combination per PAF site. For each site, the spontaneous rate (calculated as the activity to
0 dB SPL tones) was subtracted from the response to all the other frequency-tone
combinations. Panel A shows the average number of spikes evoked from all control sites
while panel B shows the average number of spikes from all experimental sites. The black
lines in panels A & B delineate the 0.5, 0.75 and 1 spike per tone boundaries on each plot.
Panel C shows the subtraction of the average of the control sites (panel A) from the average
of the experimental sites (panel B). A zero (orange) indicates that there was no difference
between the two groups in the number of spikes evoked by the frequency-intensity
combination. Panel D shows the result of t-tests between the number of spikes evoked by
each frequency-intensity combination in control and experimental sites. The color bar
indicates degrees of significance (a value of 3 denotes p<0.001, while a value of 4 denotes
p<0.0001).
79
REFERENCES
Aitkin LM and Webster WR. Tonotopic organization in the medial geniculate body of the
cat. Brain Res 26: 402-405, 1971.
Arnault P and Roger M. Ventral temporal cortex in the rat: connections of secondary
auditory areas Te2 and Te3. J Comp Neurol 302: 110-123, 1990.
Bakin JS and Weinberger NM. Induction of a physiological memory in the cerebral cortex by
stimulation of the nucleus basalis. Proc Natl Acad Sci U S A 93: 11219-11224, 1996.
Bao S, Chan VT, and Merzenich MM. Cortical remodelling induced by activity of ventral
tegmental dopamine neurons. Nature 412: 79-83, 2001.
Bjordahl TS, Dimyan MA, and Weinberger NM. Induction of long-term receptive field
plasticity in the auditory cortex of the waking guinea pig by stimulation of the nucleus basalis.
Behav Neurosci 112: 467-479, 1998.
Bordi F and LeDoux JE. Response properties of single units in areas of rat auditory thalamus
that project to the amygdala. I. Acoustic discharge patterns and frequency receptive fields. Exp
Brain Res 98: 261-274, 1994.
Brown M, Irvine DR, and Park VN. Perceptual learning on an auditory frequency
discrimination task by cats: association with changes in primary auditory cortex. Cereb Cortex
14: 952-965, 2004.
Buonomano DV and Merzenich MM. Cortical plasticity: from synapses to maps. Annu Rev
Neurosci 21: 149-186, 1998.
Butt AE and Hodge GK. Simple and configural association learning in rats with bilateral
quisqualic acid lesions of the nucleus basalis magnocellularis. Behav Brain Res 89: 71-85, 1997.
Calford MB. The parcellation of the medial geniculate body of the cat defined by the
auditory response properties of single units. J Neurosci 3: 2350-2364, 1983.
Conner JM, Culberson A, Packowski C, Chiba AA, and Tuszynski MH. Lesions of the Basal
forebrain cholinergic system impair task acquisition and abolish cortical plasticity associated
with motor skill learning. Neuron 38: 819-829., 2003.
Diamond DM and Weinberger NM. Classical conditioning rapidly induces specific changes
in frequency receptive fields of single neurons in secondary and ventral ectosylvian auditory
cortical fields. Brain Res 372: 357-360, 1986.
80
Diamond DM and Weinberger NM. Physiological plasticity of single neurons in auditory
cortex of the cat during acquisition of the pupillary conditioned response: II. Secondary field
(AII). Behav Neurosci 98: 189-210, 1984.
DiCarlo JJ and Maunsell JH. Anterior inferotemporal neurons of monkeys engaged in object
recognition can be highly sensitive to object retinal position. J Neurophysiol 89: 3264-3278,
2003.
Dimyan MA and Weinberger NM. Basal forebrain stimulation induces discriminative
receptive field plasticity in the auditory cortex. Behav Neurosci 113: 691-702, 1999.
Doron NN, Ledoux JE, and Semple MN. Redefining the tonotopic core of rat auditory
cortex: physiological evidence for a posterior field. J Comp Neurol 453: 345-360, 2002.
Edeline JM and Weinberger NM. Associative retuning in the thalamic source of input to the
amygdala and auditory cortex: receptive field plasticity in the medial division of the medial
geniculate body. Behav Neurosci 106: 81-105, 1992.
Edeline JM and Weinberger NM. Subcortical adaptive filtering in the auditory system:
associative receptive field plasticity in the dorsal medial geniculate body. Behav Neurosci 105:
154-175, 1991.
Fritz JB, Elhilali M, and Shamma SA. Differential dynamic plasticity of A1 receptive fields
during multiple spectral tasks. J Neurosci 25: 7623-7635, 2005.
Gaese BH and Ostwald J. Anesthesia changes frequency tuning of neurons in the rat primary
auditory cortex. J Neurophysiol 86: 1062-1066, 2001.
Ghose GM. Learning in mammalian sensory cortex. Curr Opin Neurobiol 14: 513-518, 2004.
Ghose GM, Yang T, and Maunsell JH. Physiological correlates of perceptual learning in
monkey V1 and V2. J Neurophysiol 87: 1867-1888, 2002.
Gilbert CD. Learning and receptive field plasticity. Proc Natl Acad Sci U S A 93: 10546-
10547, 1996.
Hallanger AE, Levey AI, Lee HJ, Rye DB, and Wainer BH. The origins of cholinergic and
other subcortical afferents to the thalamus in the rat. J Comp Neurol 262: 105-124, 1987.
Hazama M, Kimura A, Donishi T, Sakoda T, and Tamai Y. Topography of corticothalamic
projections from the auditory cortex of the rat. Neuroscience 124: 655-667, 2004.
Ito M and Gilbert CD. Attention modulates contextual influences in the primary visual cortex
of alert monkeys. Neuron 22: 593-604, 1999.
Ji W, Gao E, and Suga N. Effects of acetylcholine and atropine on plasticity of central
auditory neurons caused by conditioning in bats. J Neurophysiol 86: 211-225, 2001.
81
Kelly JB and Masterton B. Auditory sensitivity of the albino rat. J Comp Physiol Psychol 91:
930-936, 1977.
Kilgard MP and Merzenich MM. Cortical map reorganization enabled by nucleus basalis
activity. Science 279: 1714-1718, 1998a.
Kilgard MP and Merzenich MM. Distributed representation of spectral and temporal
information in rat primary auditory cortex. Hear Res 134: 16-28, 1999.
Kilgard MP and Merzenich MM. Order-sensitive plasticity in adult primary auditory cortex.
Proc Natl Acad Sci U S A 99: 3205-3209, 2002.
Kilgard MP and Merzenich MM. Plasticity of temporal information processing in the
primary auditory cortex. Nat Neurosci 1: 727-731, 1998b.
Kilgard MP, Pandya PK, Vazquez J, Gehi A, Schreiner CE, and Merzenich MM. Sensory
input directs spatial and temporal plasticity in primary auditory cortex. J Neurophysiol 86: 326-
338, 2001.
Kimura A, Donishi T, Okamoto K, and Tamai Y. Topography of projections from the
primary and non-primary auditory cortical areas to the medial geniculate body and thalamic
reticular nucleus in the rat. Neuroscience 135: 1325-1342, 2005.
Kimura A, Donishi T, Sakoda T, Hazama M, and Tamai Y. Auditory thalamic nuclei
projections to the temporal cortex in the rat. Neuroscience 117: 1003-1016, 2003.
Kitzes LM and Hollrigel GS. Response properties of units in the posterior auditory field
deprived of input from the ipsilateral primary auditory cortex. Hear Res 100: 120-130, 1996.
Kolmac C and Mitrofanis J. Organization of the basal forebrain projection to the thalamus in
rats. Neurosci Lett 272: 151-154, 1999.
Li W, Piech V, and Gilbert CD. Perceptual learning and top-down influences in primary
visual cortex. Nat Neurosci 7: 651-657, 2004.
Malmierca MS. The structure and physiology of the rat auditory system: an overview. Int Rev
Neurobiol 56: 147-211, 2003.
Mascagni F, McDonald AJ, and Coleman JR. Corticoamygdaloid and corticocortical
projections of the rat temporal cortex: a Phaseolus vulgaris leucoagglutinin study. Neuroscience
57: 697-715, 1993.
Metherate R and Ashe JH. Nucleus basalis stimulation facilitates thalamocortical synaptic
transmission in the rat auditory cortex. Synapse 14: 132-143, 1993.
Metherate R and Weinberger NM. Cholinergic modulation of responses to single tones
produces tone-specific receptive field alterations in cat auditory cortex. Synapse 6: 133-145,
1990.
82
Mooney DM, Zhang L, Basile C, Senatorov VV, Ngsee J, Omar A, and Hu B. Distinct forms
of cholinergic modulation in parallel thalamic sensory pathways. Proc Natl Acad Sci U S A 101:
320-324, 2004.
Moucha R, Pandya PK, Engineer ND, Rathbun DL, and Kilgard MP. Background sounds
contribute to spectrotemporal plasticity in primary auditory cortex. Exp Brain Res 162: 417-427,
2005.
Ohl FW and Scheich H. Orderly cortical representation of vowels based on formant
interaction. Proc Natl Acad Sci U S A 94: 9440-9444, 1997.
Pandya PK, Moucha R, Engineer ND, Rathbun DL, Vazquez J, and Kilgard MP.
Asynchronous inputs alter excitability, spike timing, and topography in primary auditory cortex.
Hear Res 203: 10-20, 2005.
Pandya PK, Rathbun DL, Engineer ND, Moucha R, and Kilgard MP. Spectral and Temporal
Processing in Rat Posterior Auditory Cortex. Cereb Cortex, in review.
Polley DB, Steinberg EE, and Merzenich MM. Perceptual learning directs auditory cortical
map reorganization through top-down influences. J Neurosci 26: 4970-4982, 2006.
Rauschecker JP. Parallel processing in the auditory cortex of primates. Audiol Neurootol 3:
86-103, 1998.
Recanzone GH, Merzenich MM, and Jenkins WM. Frequency discrimination training
engaging a restricted skin surface results in an emergence of a cutaneous response zone in
cortical area 3a. J Neurophysiol 67: 1057-1070, 1992a.
Recanzone GH, Merzenich MM, Jenkins WM, Grajski KA, and Dinse HR. Topographic
reorganization of the hand representation in cortical area 3b owl monkeys trained in a frequency-
discrimination task. J Neurophysiol 67: 1031-1056, 1992b.
Recanzone GH, Schreiner CE, and Merzenich MM. Plasticity in the frequency representation
of primary auditory cortex following discrimination training in adult owl monkeys. J Neurosci
13: 87-103, 1993.
Reed P, Howell P, Sackin S, Pizzimenti L, and Rosen S. Speech perception in rats: use of
duration and rise time cues in labeling of affricate/fricative sounds. J Exp Anal Behav 80: 205-
215, 2003.
Richardson RT and DeLong MR. Electrophysiological studies of the functions of the nucleus
basalis in primates. Adv Exp Med Biol 295: 233-252, 1991.
Romanski LM and LeDoux JE. Information cascade from primary auditory cortex to the
amygdala: corticocortical and corticoamygdaloid projections of temporal cortex in the rat. Cereb
Cortex 3: 515-532, 1993.

83
Rutkowski RG, Miasnikov AA, and Weinberger NM. Characterisation of multiple
physiological fields within the anatomical core of rat auditory cortex. Hear Res 181: 116-130,
2003.
Rutkowski RG and Weinberger NM. Encoding of learned importance of sound by magnitude
of representational area in primary auditory cortex. Proc Natl Acad Sci U S A 102: 13664-13669,
2005.
Sakai M and Kudoh M. Characteristics of sound discrimination enhancement after sound
exposure in adult rats. Behav Neurosci 119: 961-973, 2005.
Steinschneider M, Fishman YI, and Arezzo JC. Representation of the voice onset time (VOT)
speech parameter in population responses within primary auditory cortex of the awake monkey. J
Acoust Soc Am 114: 307-321, 2003.
Toro JM, Trobalon JB, and Sebastian-Galles N. Effects of backward speech and speaker
variability in language discrimination by rats. J Exp Psychol Anim Behav Process 31: 95-100,
2005.
Wang X and Kadia SC. Differential representation of species-specific primate vocalizations
in the auditory cortices of marmoset and cat. J Neurophysiol 86: 2616-2620, 2001.
Weinberger NM. Physiological memory in primary auditory cortex: characteristics and
mechanisms. Neurobiol Learn Mem 70: 226-251, 1998.
Weinberger NM, Hopkins W, and Diamond DM. Physiological plasticity of single neurons in
auditory cortex of the cat during acquisition of the pupillary conditioned response: I. Primary
field (AI). Behav Neurosci 98: 171-188, 1984.
Wetzel W, Ohl FW, Wagner T, and Scheich H. Right auditory cortex lesion in Mongolian
gerbils impairs discrimination of rising and falling frequency-modulated tones. Neurosci Lett
252: 115-118, 1998.
Winer JA and Larue DT. Patterns of reciprocity in auditory thalamocortical and
corticothalamic connections: study with horseradish peroxidase and autoradiographic methods in
the rat medial geniculate body. J Comp Neurol 257: 282-315, 1987.
Winer JA, Sally SL, Larue DT, and Kelly JB. Origins of medial geniculate body projections
to physiologically defined zones of rat primary auditory cortex. Hear Res 130: 42-61, 1999.
Yang T and Maunsell JH. The effect of perceptual learning on neuronal responses in monkey
visual area V4. J Neurosci 24: 1617-1626, 2004.
Zurita P, Villa AE, de Ribaupierre Y, de Ribaupierre F, and Rouiller EM. Changes of single
unit activity in the cat's auditory thalamus and cortex associated to different anesthetic
conditions. Neurosci Res 19: 303-316, 1994.

84
CHAPTER 4
CONCLUSION
The purpose of this dissertation was to examine the relationship between cortical
plasticity and perceptual discrimination. Learning to perform a discrimination task is correlated
with stimulus-specific plasticity in both human and animal species in all major sensory
modalities and in the motor system (Buonomano and Merzenich 1998; Conner et al. 2005; Ghose
2004; Polley et al. 2006; Recanzone et al. 1993). The sensory inputs that are activated during a
behavioral task guide the form that plasticity takes, while the release of neuromodulators acts as
a gain control so that plasticity only occurs in behaviorally important contexts. However,
learning to perform a discrimination task also involves a ‘cognitive’ component - specific
knowledge of the requirements of the discrimination. This component of learning is thought to
be mediated by higher cortical structures such as association cortex or pre-frontal cortex.
Cortical association areas receive input from primary sensory cortices as well as from the nuclei
that release neuromodulators. In turn, these association areas influence the neural activity of
sensory cortices and neuromodulator-releasing nuclei through the activity of feedback
connections (Gilbert and Sigman 2007).
One possible role of these feedback connections is to direct neural activity in sensory
cortical areas so that plasticity takes on task-relevant characteristics. For example, Polley and
colleagues showed that learning either a frequency or intensity discrimination using stimuli with
very similar auditory characteristics can result in differential types of plasticity depending on the
task demands (Polley et al. 2006). These results implied that plasticity was mediated not only by

85
activation of sensory and motivational circuitry, but also by top-down influences. These results
also reveal an uncertainty as to the nature of the plasticity observed in primary cortical areas after
discrimination training and the role of these areas during performance of a discrimination task.
One possibility is that the auditory cortex functions primarily to process incoming sensory
stimuli and then relays this information on to association areas with specific task-knowledge.
The second possibility is that plasticity in primary cortical areas directly represents a specific
memory of the discrimination task, and therefore plasticity must take place within a behavioral
context in order to be functionally useful.
In Chapter 2, we used nucleus basalis stimulation pairing with an auditory stimulus to induce
cortical plasticity in primary auditory cortex that was stimulus-specific without the influence of
any specific task knowledge (ie, top-down information). It was not known whether this
information could be ‘useful’ to animals when they went on to learn a discrimination task. We
found that plasticity induced outside of a behavioral context improved learning and acquisition
of the frequency discrimination task. This improvement in learning implies that at least part of
the role of primary auditory cortex is to act as a sensory processor, and that the brain is able to
take advantage of plasticity no matter what the context was when plasticity was induced. This
finding is supported by studies in several other modalities. In some subjects, plasticity that has
been induced because of peripheral injuries or in other learning situations can cause generalized
improvement in discrimination. In the auditory system, subjects with steeply-sloping hearing
loss functions tend to have better discrimination of tones that are close to the area of hearing loss
(and presumably now have an expanded representation within the cortex) (McDermott et al.
1998). Subjects with specialized skills, such as professional musicians or Braille readers, tend to
show enhanced responses to auditory or tactile stimuli and also show generalized improvements
86
in discrimination abilities using many different types of stimuli (Besson et al. 2007; Fahle 2005;
Jednorog and Grabowska 2008). A study of tactile coactivation has shown that using passive
stimulation of the finger to induce a temporary shift in the representation of a single digit in
somatosensory cortex also leads to a temporary improvement in two-point discrimination
performance(Godde et al. 2000). These results support our own findings and indicate that
plasticity in primary cortical areas is able to confer some perceptual advantages when performing
discrimination tasks no matter how this plasticity was induced. This further strengthens the
hypothesis that plasticity in primary cortical areas represents an alteration in how basic stimulus
properties are processed rather than storage of specific task knowledge.
The results of our study in Chapter 2 also indicate that receptive field plasticity in primary
auditory cortex may be important for learning a discrimination task rather than performing a task
that has already been mastered. For example, rats that had been well-trained to perform a
discrimination task, exposed to NB-tone pairing with a behaviorally relevant tone, and then
tested on the discrimination task after NB-tone pairing showed no stimulus-specific plasticity in
the primary auditory cortex even though previous studies have indicated that all of these
activities should promote plasticity (Kilgard and Merzenich 1998; Recanzone et al. 1993).
Therefore, although plasticity in primary sensory cortex seems to be helpful early in the learning
process, it may not be necessary for skilled task performance once the discrimination has been
learned. This result has been mirrored in previous learning studies in both the visual and motor
systems that have shown consolidation and reduction in plasticity as subjects become
progressively more skilled. In the visual system, learning to perform a visual discrimination task
resulted in plasticity in V1 that faded after further discrimination training with no decrement in
performance(Yotsumoto et al. 2008). In the motor system, these shifts (from plasticity in both

87
the cortical-striatal and cortical-cerebellar pathways in a behavior to plasticity in only pathways)
are associated with a transition from skilled to habitual performance of the motor task(Doyon
and Benali 2005). This shift of plasticity in sensory and motor systems back to a normal state
would allow subjects to learn and acquire new skills while still performing previously learned
discrimination tasks. While simultaneous performance of many types of tasks is not often
studied in laboratory environments, this skill would be essential for survival in real-world
situations.
If discrimination performance has been improved on a permanent basis, then some aspect
of the central nervous system must also be permanently altered. An important avenue for future
study will be to identify where plasticity is persistent throughout the full course of task learning
and performance. In Chapter 3 of this dissertation we presented the results of a pilot study
indicating that nucleus basalis-tone pairing results in stimulus specific plasticity in both primary
and secondary cortical areas(Puckett et al. 2007). Previous studies of plasticity after nucleus
basalis -tone pairing and classical conditioning have shown that plasticity in primary auditory
cortex is much more long-lasting that plasticity in either the thalamus or inferior colliculus,
implying that plasticity becomes more permanent in higher sensory stations (Ji et al. 2001; Ma
and Suga 2005; Zhang and Suga 2000). It would be important to examine plasticity in secondary
and association areas of animals that have been well-trained to perform a discrimination task but
no longer show overt signs of cortical plasticity in primary cortical areas.
Clinical relevance
The results of our studies provide support for the hypothesis that inducing cortical plasticity
is important for improving functional recovery after stroke or other brain injury. Short-term
plasticity techniques such as transcranial magnetic stimulation have already been used to

88
improve plasticity and functional performance after brain injury(Takeuchi et al. 2005). Our
results indicate that creating longer-acting plasticity by activating neuromodulator systems could
lead to more effective discrimination improvement. Many current studies already employ
pharmacological agents such as amphetamines to improve the functional outcome of therapy
after stroke(Walker-Batson et al. 2001; Walker-Batson et al. 1995). However, techniques such
as nucleus basalis stimulation might be more effective than pharmacological agents because the
timing of neuromodulator release can be specifically matched to target stimuli, leading to more
rapid and specific plasticity.
Speeding the time course of recovery in patient populations could greatly improve functional
recovery. For many patients, recovery is slowed because the behaviors that are practiced during
therapy take a long time to become functionally useful. For example, if patients lose the use of
an arm after stroke, they often learn to compensate and learn to perform tasks with only one
hand. This means that plasticity created during physical therapy has to ‘fight’ with plasticity that
is being developed because of this compensatory behavior (Kleim and Jones 2008). Combining
physical therapy with a technique such as nucleus basalis -stimulation or a pharmacological
intervention could speed functional recovery and might allow patients to recover normal function
quickly rather than having to learn and unlearn compensatory behaviors.
89
REFERENCES
Bakin JS and Weinberger NM. Induction of a physiological memory in the cerebral cortex by
stimulation of the nucleus basalis. Proc Natl Acad Sci U S A 93: 11219-11224, 1996.
Bao S, Chang EF, Woods J, and Merzenich MM. Temporal plasticity in the primary auditory
cortex induced by operant perceptual learning. Nat Neurosci 7: 974-981, 2004.
Besson M, Schon D, Moreno S, Santos A, and Magne C. Influence of musical expertise and
musical training on pitch processing in music and language. Restor Neurol Neurosci 25: 399-
410, 2007.
Buonomano DV and Merzenich MM. Cortical plasticity: from synapses to maps. Annu Rev
Neurosci 21: 149-186, 1998.
Conner JM, Chiba AA, and Tuszynski MH. The basal forebrain cholinergic system is essential
for cortical plasticity and functional recovery following brain injury. Neuron 46: 173-179, 2005.
Conner JM, Culberson A, Packowski C, Chiba AA, and Tuszynski MH. Lesions of the Basal
forebrain cholinergic system impair task acquisition and abolish cortical plasticity associated
with motor skill learning. Neuron 38: 819-829, 2003.
Cramer SC and Riley JD. Neuroplasticity and brain repair after stroke. Curr Opin Neurol 21: 76-
82, 2008.
Diamond DM and Weinberger NM. Classical conditioning rapidly induces specific changes in
frequency receptive fields of single neurons in secondary and ventral ectosylvian auditory
cortical fields. Brain Res 372: 357-360, 1986.
Diamond DM and Weinberger NM. Physiological plasticity of single neurons in auditory cortex
of the cat during acquisition of the pupillary conditioned response: II. Secondary field (AII).
Behav Neurosci 98: 189-210, 1984.
Dinse HR, Ragert P, Pleger B, Schwenkreis P, and Tegenthoff M. Pharmacological modulation
of perceptual learning and associated cortical reorganization. Science 301: 91-94, 2003.
Doyon J and Benali H. Reorganization and plasticity in the adult brain during learning of motor
skills. Curr Opin Neurobiol 15: 161-167, 2005.
Edeline JM. The thalamo-cortical auditory receptive fields: regulation by the states of vigilance,
learning and the neuromodulatory systems. Exp Brain Res 153: 554-572, 2003.

90
Edeline JM and Weinberger NM. Associative retuning in the thalamic source of input to the
amygdala and auditory cortex: receptive field plasticity in the medial division of the medial
geniculate body. Behav Neurosci 106: 81-105, 1992.
Edeline JM and Weinberger NM. Subcortical adaptive filtering in the auditory system:
associative receptive field plasticity in the dorsal medial geniculate body. Behav Neurosci 105:
154-175, 1991a.
Edeline JM and Weinberger NM. Thalamic short-term plasticity in the auditory system:
associative returning of receptive fields in the ventral medial geniculate body. Behav Neurosci
105: 618-639, 1991b.
Fahle M. Perceptual learning: specificity versus generalization. Curr Opin Neurobiol 15: 154-
160, 2005.
Ghose GM. Learning in mammalian sensory cortex. Curr Opin Neurobiol 14: 513-518, 2004.
Gilbert CD and Sigman M. Brain states: top-down influences in sensory processing. Neuron 54:
677-696, 2007.
Godde B, Stauffenberg B, Spengler F, and Dinse HR. Tactile coactivation-induced changes in
spatial discrimination performance. J Neurosci 20: 1597-1604, 2000.
Irvine DR, Rajan R, and Brown M. Injury- and use-related plasticity in adult auditory cortex.
Audiol Neurootol 6: 192-195, 2001.
Jednorog K and Grabowska A. Behavioral manifestations of brain plasticity in blind and low-
vision individuals. Acta Neurobiol Exp (Wars) 68: 83-90, 2008.
Ji W, Gao E, and Suga N. Effects of acetylcholine and atropine on plasticity of central auditory
neurons caused by conditioning in bats. J Neurophysiol 86: 211-225, 2001.
Kilgard MP and Merzenich MM. Cortical map reorganization enabled by nucleus basalis
activity. Science 279: 1714-1718, 1998.
Kilgard MP, Pandya PK, Vazquez JL, Rathbun DL, Engineer ND, and Moucha R. Spectral
features control temporal plasticity in auditory cortex. Audiol Neurootol 6: 196-202, 2001.
Kleim JA and Jones TA. Principles of experience-dependent neural plasticity: implications for
rehabilitation after brain damage. J Speech Lang Hear Res 51: S225-239, 2008.
Ma X and Suga N. Long-term cortical plasticity evoked by electric stimulation and acetylcholine
applied to the auditory cortex. Proc Natl Acad Sci U S A 102: 9335-9340, 2005.
McDermott HJ, Lech M, Kornblum MS, and Irvine DR. Loudness perception and frequency
discrimination in subjects with steeply sloping hearing loss: possible correlates of neural
plasticity. J Acoust Soc Am 104: 2314-2325, 1998.

91
Menning H, Roberts LE, and Pantev C. Plastic changes in the auditory cortex induced by
intensive frequency discrimination training. Neuroreport 11: 817-822, 2000.
Merzenich MM, Nelson RJ, Stryker MP, Cynader MS, Schoppmann A, and Zook JM.
Somatosensory cortical map changes following digit amputation in adult monkeys. J Comp
Neurol 224: 591-605, 1984.
Myhrer T. Neurotransmitter systems involved in learning and memory in the rat: a meta-analysis
based on studies of four behavioral tasks. Brain Res Brain Res Rev 41: 268-287, 2003.
Polley DB, Steinberg EE, and Merzenich MM. Perceptual learning directs auditory cortical map
reorganization through top-down influences. J Neurosci 26: 4970-4982, 2006.
Puckett AC, Pandya PK, Moucha R, Dai W, and Kilgard MP. Plasticity in the rat posterior
auditory field following nucleus basalis stimulation. J Neurophysiol 98: 253-265, 2007.
Recanzone GH, Merzenich MM, and Schreiner CE. Changes in the distributed temporal response
properties of SI cortical neurons reflect improvements in performance on a temporally based
tactile discrimination task. J Neurophysiol 67: 1071-1091, 1992.
Recanzone GH, Schreiner CE, and Merzenich MM. Plasticity in the frequency representation of
primary auditory cortex following discrimination training in adult owl monkeys. J Neurosci 13:
87-103, 1993.
Richardson RT and DeLong MR. Electrophysiological studies of the functions of the nucleus
basalis in primates. Adv Exp Med Biol 295: 233-252, 1991.
Rutkowski RG and Weinberger NM. Encoding of learned importance of sound by magnitude of
representational area in primary auditory cortex. Proc Natl Acad Sci U S A 102: 13664-13669,
2005.
Takeuchi N, Chuma T, Matsuo Y, Watanabe I, and Ikoma K. Repetitive transcranial magnetic
stimulation of contralesional primary motor cortex improves hand function after stroke. Stroke
36: 2681-2686, 2005.
Talwar SK and Gerstein GL. Reorganization in awake rat auditory cortex by local
microstimulation and its effect on frequency-discrimination behavior. J Neurophysiol 86: 1555-
1572, 2001.
Walker-Batson D, Curtis S, Natarajan R, Ford J, Dronkers N, Salmeron E, Lai J, and Unwin DH.
A double-blind, placebo-controlled study of the use of amphetamine in the treatment of aphasia.
Stroke 32: 2093-2098, 2001.
Walker-Batson D, Smith P, Curtis S, Unwin H, and Greenlee R. Amphetamine paired with
physical therapy accelerates motor recovery after stroke. Further evidence. Stroke 26: 2254-
2259, 1995.
92
Yotsumoto Y, Watanabe T, and Sasaki Y. Different dynamics of performance and brain
activation in the time course of perceptual learning. Neuron 57: 827-833, 2008.
Zhang LI, Bao S, and Merzenich MM. Persistent and specific influences of early acoustic
environments on primary auditory cortex. Nat Neurosci 4: 1123-1130, 2001.
Zhang Y and Suga N. Modulation of responses and frequency tuning of thalamic and collicular
neurons by cortical activation in mustached bats. J Neurophysiol 84: 325-333, 2000.
Zhang Y and Yan J. Corticothalamic Feedback for Sound-Specific Plasticity of Auditory
Thalamic Neurons Elicited by Tones Paired with Basal Forebrain Stimulation. Cereb Cortex,
2008.
VITA
Amanda Christine Reed was born in Durango Colorado on September 28, 1979 to
Logan and Kathy Puckett. During her childhood, she had the opportunity to travel the
world, and lived in Korea, Fiji, New Zealand, and Indonesia before returning to the
United States and graduating as the Valedictorian of Howe High School in 1998. She
entered the University of Texas at Dallas in 1998, and was the recipient of a McDermott
Scholarship in 1999. She became interested in neuroscience and began research in Dr.
Kilgard’s lab in 2000. She completed an honor’s thesis titled Using evoked potentials to
track the time course of cortical plasticity, and graduated summa cum laude in 2002. She
entered graduate school in 2002, and completed her PhD studies in the Kilgard lab. In
November 2007, she married Nicholas Reed.