Plasma Treatment for Adhesive Bonding of Aerospace...
145
Plasma Pre-Treatment for Adhesive Bonding of Aerospace Composite Components A thesis submitted for the degree of Master of Philosophy by Berta Navarro Rodríguez College of Engineering, Design and Physical Sciences Department of Mechanical, Aerospace and Civil Engineering Brunel University London August 2016
Transcript of Plasma Treatment for Adhesive Bonding of Aerospace...

Plasma Pre-Treatment for Adhesive
Bonding of Aerospace Composite
Components
A thesis submitted for the degree of Master of Philosophy
by
Berta Navarro Rodríguez
College of Engineering, Design and Physical Sciences
Department of Mechanical, Aerospace and Civil
Engineering
Brunel University London
August 2016

The research on 'Plasma Treatment for Adhesive Bonding of Aerospace
Composite Components' was carried out as a part-time MPhil programme,
between February 2015 and August 2016 at the National Structural Integrity
Research Centre (NSIRC, Cambridge), and awarded by Brunel University
London (Department of Mechanical, Aerospace and Civil Engineering). This
research was also performed in collaboration with TWI Ltd (Cambridge).

i
ABSTRACT OF THE DISSERTATION
Plasma Treatment for Adhesive Bonding of Aerospace Composite
Components
by
Berta Navarro Rodríguez
Master of Philosophy in Mechanical, Aerospace and Civil Engineering
Brunel London University, 2016
Senior Lecturer Aerospace Engineering – Cristinel Mares
Consultant Adhesive Technology TWI – Ewen Kellar
Key words: composites, aerospace, cold atmospheric pressure plasma, adhesive bonding, surface pre-treatment
A cold atmospheric pressure plasma source was investigated as an alternative
pre-treatment for carbon fibre reinforced epoxy substrates prior to bonding.
For reference, common surface pre-treatments were also investigated (peel
ply, manual abrasion, and grit blasting). In the aerospace industry, the peel
ply, is usually added to one side of the composite surface during manufacture
and peeled off prior to bonding.
Peel ply can be used independently or in combination with other techniques.
The strength of the bonded joints of the different pre-treatments was assessed
through tensile lap shear tests. It was found that combining peel ply with
plasma increased the joint strength by 10% whereas manual abrasion or grit
blasting after peel ply improved the strength of the joints by 15% and 20%
respectively.
The effect of pre-treating the composite substrate side without peel ply (bag
side) was also investigated. The strength of the joints produced without any

ii
pre-treatment was increased by 99% for manual abrasion, 134% for grit
blasting and by 146% for plasma.
Comparing both surfaces of the composite substrates, it was found that using
peel ply improved the performance of the joints by 91%.
In order to understand better the effects of the different pre-treatments, surface
characterisation of the substrates (surface roughness, surface free energy,
and analysis of chemical changes) was also conducted.
The effect of roughness did little to affect the strength values (for both surfaces
of the composite). The adhesive used in this research was very good at wetting
the surface, regardless of the roughness.
However, when the adhesive was able to wet the surface, the relationship
between bond strength and surface free energy was unclear.
Plasma was shown to increase levels of oxygen at the surface and
reduce/eliminate the concentration of fluorine at the surface on the bag side of
the composite.

iii
ACKNOWLEDGEMENTS
First of all I would like to express my gratitude to Brunel University (London),
NSIRC (Cambridge) and TWI Ltd (Cambridge) for giving me the possibility to
execute my studies in these prestigious centres. Thanks to my academic
supervisor, Cristinel Mares (Senior Lecturer in the Aerospace Department of
Brunel University), and my industrial supervisor, Ewen Kellar (TWI’s Adhesive
Bonding and Surface Preparation Consultant), for their support and guidance,
and to my manager, Mihalis Kazilas, who has always believed in me.
I would like to thank also HEXCEL Composites Ltd, especially Matt Cleaver,
for the supply of the materials, the use of their facilities and their kind support
and help during my research.
I am highly indebted to my colleague David Williams for his guidance and
support enabling me to have a better understanding of the research topic.
I would like to thank Helen Wickens, Jacob Greenwood, and Stuart Lewis for
always helping me with a lovely smile.
I am heartily thankful to my flat mates, work mates and really good friends
Karthik and Rashmi for all our moments together. With them, I have learnt
what the real meaning of sharing is. I thank them for their kindness, for taking
care of me and for their endless support.
Particular thanks to Emmanouela and Silvia for their love and interminable
positivity, making me smile and for being full of energy whenever I see them.
I would like to give my special thanks to my lovely friends Marta and Antonio,
who have been always there for me, making my days so special.
I want to offer my best regards and blessing to all those who supported me in
any respect during the completion of my research. I would also like also to
thank myself, for the hard work during the last years, and for always following
my heart, for falling many times and always standing up stronger, for learning
from my mistakes, and for trying to be a better person every day.

iv
I am grateful to have Conchi, Tania, Ana, Irene, and Miriam in my life. Since
childhood we have grown together, discovering the meaning of life and making
the most of it. Thanks to all of them for extending their hands to catch me
before I fall and if I fell, thank you for lifting me up.
Last but not least, I cannot finish without saying how grateful I am for my family.
I wish to thank my mother, my sister and Lolito for their infinite love, support
and encouragement throughout my whole life. I am what I am now because of
them and for that, I love them so much. My special thanks go to my lovely
father, who left us a few years ago to be in a better place. His brightness and
smile guide me every day.

v
TABLE OF CONTENTS
ABSTRACT OF THE DISSERTATION i
ACKNOWLEDGEMENTS iii
ACRONYMS vii
LIST OF FIGURES viii
LIST OF TABLES x
Introduction 1
Background 1
Research need 5
Objectives 5
Contribution to knowledge 6
Scope of the thesis 6
Literature Review 8
Surface pre-treatments 9
Mechanical pre-treatments 10
Chemical pre-treatments 12
Energetic pre-treatments 13
Adhesive selection 22
Joint design 24
Considerations upon the technology requirements using QFD analysis 28
Methodology 34
Materials 34
Adherents 34
Adhesives 35
Glass beads 35
Manufacturing composite laminates 36
Specimen cutting 41
Surface preparation 42
Pre-treatment peel ply plus manual abrasion 43
Pre-treatment peel ply plus grit blasting 43
Pre-treatment peel ply 45
Pre-treatment peel ply plus plasma 45
No pre-treatment: samples as received 49

vi
Summary of pre-treatment types 50
Joint assembly 51
Joint assessment 55
Results and Discussion 58
Joint assessment 58
Joint assessment, peel ply side 59
Joint assessment, bag side 67
Surface characterization 72
Roughness assessment 72
X-ray photoelectron spectroscopy (XPS) analysis 78
Wettability study 82
Adhesive void calculation 86
Conclusions 89
References 92
Appendix A: Measurements samples 99
Appendix B: Experimental results – LSS values 105
Appendix C: X-ray photoelectron spectroscopy results 124

vii
ACRONYMS
AP Atmospheric Pressure Plasma BLT Bond Line Thickness BS British Standard CAP Cold Atmospheric Pressure Plasma CT Computerised Tomography EHS Environmental Health & Safety eV Electron-volts FRPs Fibre Reinforced Polymers GB Grit Blasting HOQ House of Quality ILSS Interlaminar Shear Strenght IPA Isopropyl Alcohol ISO International Organization for Standardization LSS Lap Shear Strength MA Manual Abrasion MEK Methylethylketone NDT Non-Destructive Testing PP Peel Ply PTFE Polytetrafluoroethylene QFD Quality Function Deployment SEM Scanning Electron Microscope UD Unidirectional XPS X-ray photoelectron spectroscopy

viii
LIST OF FIGURES
Figure 1 Commercial aerospace – composite penetration (courtesy of HEXCEL). 2
Figure 2 Fracture possibilities upon peel ply removal. 12
Figure 3 States of matter. 13
Figure 4 a. hydrophobic surface; b. hydrophilic surface; c. adhesive completely wets
the surface. 16
Figure 5 Components of an atmospheric pressure plasma system. 18
Figure 6 Relative bond strength improvement of a cyanate ester composite bonded
with a room temperature cured adhesive. 19
Figure 7 Lap shear strength values of bonded 410 stainless steel of different surface
pre-treatments. 20
Figure 8 Adhesive selection: considerations. 22
Figure 9 Single lap shear joint design. 24
Figure 10 Failure modes for adhesive bonding. 25
Figure 11 Rankings of each engineering characteristic with their respective
weightings. ¡Error! Marcador no definido.
Figure 12 Schematic of the vacuum bagging. 37
Figure 13 Curing cycle composite panels. 40
Figure 14 Panels and specimens obtained per panel. 42
Figure 15 SEM images grit blasted samples: top left (35psi), top right (40psi) and
bottom (45psi). 45
Figure 16 Plasma equipment. 46
Figure 17 Test matrix for plasma pre-treatment. 47
Figure 18 Path of the plasma nozzle during the treatment. 48
Figure 19 Plasma temperature evolution varying the distance of the nozzle from the
support tool. 49
Figure 20 Bag side on the left and peel ply side on the right. 49
Figure 21 Peel ply removal. 50
Figure 22 Jig manufactured for assembly of the joints. 51
Figure 23 Joint assembly: a. positioning first adherent and adhesive film,
b. positioning second adherent and foldback clips. 52
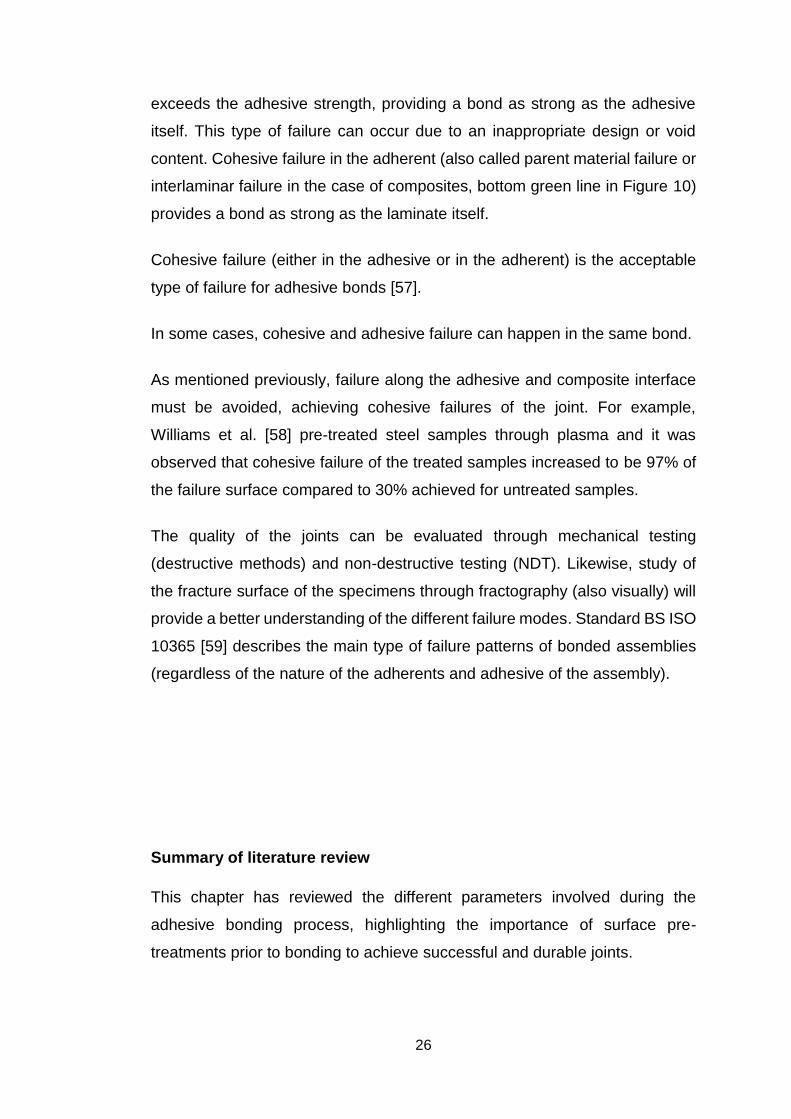
Figure 24 Specimen under tensile lap shear test. 56
Figure 25 Dimensions and tolerances of joint (mm). 56
Figure 26 a. Test matrix plasma pre-treatment, b. New test matrix plasma pre-
treatment. 59
Figure 27 LSS values versus pre-treatment type, peel ply side. 60
Figure 28 Failure of bonded sample S203-S204: peel ply side as received.
Cohesive failure. 61
Figure 29 Failure of bonded sample S186-S187: peel ply side pre-treated through
manual abrasion. Cohesive plus adhesive failure (slight delamination). 61
Figure 30 Failure of bonded sample S210-S209: peel ply side pre-treated through
grit blasting. Cohesive failure plus delamination. 62
Figure 31 Failure of bonded sample S153-S154: peel ply side pre-treated through
plasma (conditions: 10 passes, 100mm/min). Cohesive failure. 62

ix
Figure 32 a. Shape of the end of the joint through manual abrasion pre-treatment
(slightly rounded); b. Shape of the end of the joint through plasma pre-treatment. 64
Figure 33 Shear strength versus bond line thickness. 65
Figure 34 Influence of film adhesive thickness on LSS – peel ply side. 66
Figure 35 LSS values versus pre-treatment type, bag side. 67
Figure 36 Failure of bonded sample S225-S226: bag side, no pre-treatment.
Adhesive failure. 68
Figure 37 Failure of bonded sample S282-S283: bag side pre-treated through
manual abrasion. Cohesive failure plus delamination (also adhesive failure but in
much less proportion that the other failure modes). 69
Figure 38 Failure of bonded sample S216-S217: bag side treated through grit
blasting. Cohesive failure and delamination. 69
Figure 39 Failure of bonded sample S264-S263: bag side treated through plasma
(conditions: 10passes, 100mm/min). Cohesive failure plus slight delamination. 70
Figure 40 Influence of film adhesive thickness on LSS – bag side. 72
Figure 41 Surface roughness profile of sample without peel ply and no pre-
treatment. 73
Figure 42 Average roughness Ra of different pre-treatments on peel ply side. 74
Figure 43 Average roughness Ra of different pre-treatments on peel ply side
compared to LSS values (standard deviation for LSS is shown). 75
Figure 44 Average roughness Ra of different pre-treatments on bag side. 76
Figure 45 Average roughness Ra of different pre-treatments on peel ply side
compared to LSS values (standard deviation for LSS is shown). 76
Figure 46 Ra values (left) and surface roughness profile for bag side (no pre-
treatment involved) and peel ply side (right). 77
Figure 47 XPS spectra of surface pre-treated peel ply side: (a) peel ply+plasma,
1pass-1000mm/min; (b) peel ply+plasma, 5pass-100mm/min; (c) peel ply + grist
blasting; (d) peel ply as received. 80
Figure 48 XPS spectra of surface pre-treated bag side: (e) bag side+plasma, 1pass-
1000mm/min; (f) bag side+plasma, 5pass-100mm/min; (g) bag side+grist blasting;
(h) bag side untreated. 81
Figure 49 Comparison of surface free energy of the different pre-treatments on the
peel ply side. 84
Figure 50 Comparison of surface free energy of the different pre-treatments on the
bag side. 85
Figure 51 CT scan of the bonded area of sample S128-S129. 87
Figure 52 S128-S129 Void calculation using VGStudioMax 2.1. 88

x
LIST OF TABLES Table 1 Properties of synthetic fibres; aluminium, steel and asbestos have been
included for comparison [3] 2
Table 2 Interrelationships analysis: criterion vs criterion 31
Table 3 Decision matrix (ranking parameters) 32
Table 4 HexPly 8552 prepreg 35
Table 5 Film adhesive Redux 312 35
Table 6 Manufacturing composite laminates 38
Table 7 Temperature, pressure and vacuum profiles autoclave 39
Table 8 Summary manufactured prepregs 40
Table 9 Surface pre-treatment combination 42
Table 10 Type and conditions grit blasting experiments 45
Table 11 Specifications plasma equipment 46
Table 12 Parameters and values used plasma treatment 47
Table 13 Pre-treatment types: peel ply side and bag side 50
Table 14 Pre-treatment: peel ply plus manual abrasion 53
Table 15 Pre-treatment: peel ply plus grit blasting 53
Table 16 Pre-treatment: peel ply 53
Table 17 Pre-treatment: peel ply plus plasma 54
Table 18 Pre-treatment: plasma on bag side of the substrates 54
Table 19 Pre-treatment: manual abrasion on bag side of the substrates 54
Table 20 Pre-treatment: grit blasting on bag side of the substrates 55
Table 21 No pre-treatment, bag side: samples as received 55
Table 22 Summary of Table 13: pre-treatment types 58
Table 23 LSS values peel ply side using different pre-treatments 60
Table 24 BLT lap shear joints peel ply side 66
Table 25 LSS values bag side using different pre-treatments 67
Table 26 BLT lap shear joints bag side 71
Table 27 Ra values, peel ply side, different pre-treatments 73
Table 28 Ra values bag side different pre-treatments 75
Table 29 LSS values and XPS atomic concentrations of surface pre-treated peel ply
side 79
Table 30 XPS atomic concentrations of surface pre-treated bag side 81
Table 31 Dispersive and polar components, and surface free energy values peel ply
side with LSS values 83
Table 32 Dispersive and polar components, and surface free energy values bag
side with LSS values 85
Table 33 Void content joint samples 87

1
Introduction
Background
The necessity in automotive and aerospace industries to increase fuel
efficiency is achievable by weight reduction. With the proper design,
engineering polymers can offer greater properties than metals. Reinforced
polymers are a type of composite material where the limitations of the polymer
such as fatigue sensitivity, low strength and stiffness can be overcome by
reinforcing it with fibres.
Fibre reinforced polymers (FRPs) have increasingly become attractive in
recent decades for many applications in aerospace, automotive and marine
industries due their superior specific strength (strength-to-weight ratio) and
specific modulus (stiffness-to-weight ratio) compared to aluminium and steel
[1, 2].
The fibres can be carbon, glass, aramid, basalt or polyethylene. Other lesser
used fibres include wood or asbestos. The most common fibre reinforcements
used in advanced composites applications, especially in aerospace, are
carbon fibres. Glass fibres are commonly used for infrastructure and marine
applications while aramid fibres are used in aerospace and military
applications. In comparison to metals, FRPs are lighter and corrosion
resistant.
Table 1 compares the strength and stiffness of these fibres against aluminium
and steel.

2
Table 1 Properties of synthetic fibres; aluminium, steel and asbestos have been included for comparison [3]
Material Density (g/cm3)
Young’s Modulus
(GPa)
Tensile Strength
(MPa)
Aluminium 2.70 69 77
Steel mild 7.86 210 460
Asbestos 2.56 160 3100
Carbon fibres (High Modulus) 1.86 380 2700
E-glass fibres 2.54 70 2200
Aramid fibres (Kevlar 49) 1.45 130 2900
Figure 1 shows the increasing use of composites in civil aircraft from the 80s
to the present, where now more than 50% of the weight of both the A350 and
787 aircraft comes from composite material.
Figure 1 Commercial aerospace – composite penetration (courtesy of HEXCEL) [4].
Composite materials are formed by combining two or more materials in order
to achieve properties that cannot be obtained using the original materials
alone. These materials can be selected to achieve unique combinations of

3
stiffness, strength, weight, temperature resistance, corrosion resistance,
hardness conductivity, etc. [5].
Although there are many types of composite materials, the following features
can be distinguished within all of them:
Reinforcement agent: a phase of discrete nature where its orientation is
crucial to defining the mechanical properties of the material.
Matrix: a continuous component which is responsible for the physical and
chemical properties of the composite. It transmits load to the reinforcement
agent. It also protects it and gives cohesion to the material.
Polymers can be divided into two categories: thermosets and thermoplastics.
Thermoset polymers start as a liquid at low temperature but cure irreversibly
with catalysis or heat by polymer cross-linking. This cross-linking transforms
the material into a tightly bound three-dimensional network with high molecular
weight. As these materials undergo an irreversible chemical change, they
cannot be reformed or melted with the reintroduction of heat. Unlike thermoset
polymers, thermoplastics can be re-melted and reformed with the
reintroduction of heat, as there is no chemical bonding taking place during the
curing process [6].
Joining of FRPs is an important step in the manufacturing of many composite
structures, as simple parts can be joined together to produce complex
components. In general, joining techniques can be categorized into
mechanical fastening, adhesive bonding, and fusion bonding or welding.
Selecting the most suitable joining technique for a specific application requires
careful consideration of different parameters, together with the knowledge of
the service that the joint is expected to provide.
Adhesive bonding has been extensively used alongside mechanical fastening
in the aerospace (in particular aircraft repair) and automotive industry, but not
on its own in primary structures. The qualification of the adhesive bonding
process (in terms of durability and bond strength) is still a concern that must

4
be investigated and solved before the aerospace authorities can allow the
implementation of adhesive bonding in primary structures [7].
In secondary structures, adhesive bonding is common practice [8]. It offers the
advantage of avoidance of stress concentrations and fibre cuts due to the
introduction of fasteners. Adhesive bonding offers a continuous bond between
the substrates, minimizes stress, and reduces the weight of the structure itself.
Therefore, adhesive bonding is an excellent alternative to avoid the drawbacks
coming from mechanical fastening and welding. Welding or fusion bonding is
the process of joining materials (usually metals or thermoplastics) by melting
the parts. Pressure and heat are necessary to produce the weld. Different
energy sources can be employed to melt the parts either mechanically,
electromagnetically or through external heat (hot gas, hot plate, extrusion,
etc.). It is not possible to weld thermoset systems due to their interlocked
chemical structure.
Mechanical fastening is a relatively fast and well established method.
However, it can impose penalties in terms of mechanical integrity and weight,
therefore the importance of adhesive bonding is significantly higher in the
manufacturing of advanced composite structures.
The drawbacks of adhesive bonding when compared to welding and
mechanical fastening are mainly the surface preparation of the components to
be joined and also the cure time of the adhesive. In adhesive bonding, the
parts to be joined are called adherents, and the joint is produced using an
adhesive. Weak interfacial adhesion can lead to bond-line failure prior to the
loads required to achieve cohesive failure within the adhesive.
Effective structural adhesive bonding relies on the creation of surfaces which
are easily wetted by the adhesive and provide an appropriate topography and
chemistry that promotes and maximises adhesion. These can be achieved
through different surface pre-treatments prior to bonding the substrates.

5
Research need
The current methods for preparation of material surfaces prior to bonding are
becoming progressively more constrained, due to environmental and health
and safety (EHS) legislation. In addition, these pre-treatments use a
considerable amount of time and energy. Therefore, there is a necessity for
the industry to solve EHS issues and reduce overall process time.
The possibility of using dry, gas-phase processes (such as plasma) as a
replacement for such pre-treatments could revolutionise many industries.
Plasma pre-treatment offers significant cost and time savings, less energy
consumption, application accuracy, no debris/dust generated during the
process, and can be easily automated.
Many industry sectors (especially manufacturing and repair) have shown an
interest in this technology, including aerospace, automotive and Formula 1,
marine, and defence. Several companies are actively exploring plasma as an
alternative to wet pre-treatments for titanium when bonding to carbon fibre
reinforced polymers.
Plasma pre-treatment can offer the potential for the technology to be
developed into a universal pre-treatment process.
Objectives
The main objective of this project is to analyse and evaluate the effect of
plasma pre-treatment of the different surfaces of composite materials prior to
adhesive bonding. These surfaces are the peel ply side of the composite and
the side with no peel ply, called the bag side by industry.
This will be achieved by:
Undertaking a detailed literature review to determine current state of
the art.

6
Carrying out a methodical study of the effects of different plasma
parameters using both mechanical testing and analytical methods.
Developing an understanding of the plasma technology for surface
adhesion enhancement.
Contribution to knowledge
Benefits gained from this work are expected to be:
A better understanding of plasma technology as there are different
variable parameters involved during the process.
Additional value to different market sectors interested in plasma pre-
treatment such as aerospace, motorsports, medical, defence and
electronics due to a lack of industrial awareness of this technology.
The development of possible “recipes” to use the same technology for
different substrates. These “recipes” could be used by the end users.
Scope of the thesis
The work of this thesis is presented in following order:
Chapter 1 Introduction
A description of the topic under investigation is presented with the main
objectives of this study. Research need is also discussed followed by the
contribution to knowledge of this work.
Chapter 2 Literature Review
This chapter discusses the current surface pre-treatments used by the
aerospace industry. It focuses on the importance of replacing current methods
with alternative ones that can reduce the dependence on current pre-
treatments. Plasma pre-treatment is evaluated as an alternative to current

7
methods. A review of the current use of plasma pre-treatment for processing
materials is also undertaken.
Chapter 3 Analysis of the Pre-treatments Discussed
This chapter analyses the different pre-treatments discussed in Chapter 2 to
understand customer/industry needs or requirements, in order to choose the
most appropriate pre-treatment.
Chapter 4 Methodology
This chapter describes the experimental methodology followed during this
research, and materials and equipment used are listed. A detailed description
of the different surface pre-treatments investigated is also provided.
Chapter 5 Results and Discussions
This chapter presents the data obtained for each pre-treated joint by the
different methods investigated. It also discusses the most relevant data
achieved during the investigation. An analysis of the results, in relation to the
research questions, is given.
Chapter 6 Conclusions
This chapter summarises the findings of this investigation, highlighting the
limitations of the material/technology under study.
At the end of the dissertation, different appendices are included showing the
measurements of the samples and all experimental results from each joint
tested.

8
Literature Review
There are several parameters which need to be considered for the assembly
of components by adhesive bonding to ensure the reliability and the durability
of the joint. Among these parameters, it will be necessary to select the most
appropriate surface pre-treatment and adhesive, considering also the joint
design. The performance of the joint will also be influenced by the chemical
and physical properties of the substrate material.
For any adhesive to be successful during the bonding process, it has to wet
the surface of the substrate. The capability of an adhesive to wet a solid
surface can be quantified by the surface free energy of the substrate material.
This concept will be discussed further in this thesis.
There are five main mechanisms for the adhesion between an adhesive and
an adherent: mechanical interlocking, diffusion, electrostatic attraction,
adsorption and chemisorption chemical bonding, and molecular forces and
dipole interactions. These mechanisms can happen either alone or in
combination to produce the adhesive bond [9].
Among the parameters under consideration, surface pre-treatment is the key
factor to achieve strong and durable joints [10]. The work carried out by
Matthews et al. [11] shows the importance of using the correct surface pre-
treatment on the substrates before adhesive bonding or painting.
Therefore, surface pre-treatment during the joint assembly should be carefully
carried out following the recommendations from the suppliers and industry.
Best practice is covered in different standards (e.g. BS ISO 4588 or ASTM
D2651 for surface preparation of metals and ISO 13895 or ASTM D2093 for
plastics”) [12]. These standards describe the usual procedures of surface
preparation for metals/plastics adherents before adhesive bonding.
There is no specific standard available yet for the surface preparation of FRPs.
However, some of the steps followed for surface pre-treatment of metals and
polymers can be applied to FRPs. Subchapter 2.1 “Surface pre-treatments”

9
presents an overall overview of the different pre-treatments types used by the
industry for FRPs.
Surface pre-treatments
Surface pre-treatments activate the surface of the adherents and this can lead
to higher bond strengths. Through surface pre-treatments, surface free
energy, surface roughness, and the chemical composition of the surfaces can
be modified. Surface pre-treatments also prevent or remove contamination
from the adherents. These concepts will be explained in more detail later on
in this thesis.
Surface pre-treatments can be classified into five categories: cleaning,
mechanical, chemical, energetic and use of priming or coupling agents.
Selection of the most appropriate surface pre-treatment should be based on
considerations such as cost, production, performance, compatibility, durability
and EHS aspects.
Prior to any pre-treatment, cleaning is required, as it will remove the majority
of contaminants (dust, oils, demoulding agents, etc.) from the surfaces of the
substrates. This treatment is usually carried out using solvents, or through
detergent wash and bonding cannot take place immediately as time is required
for the volatiles to evaporate and/or the substrate to dry. The use of some
chemicals for cleaning can give rise to environmental problems resulting in
ongoing work to find effective replacements.
Methyl ethyl ketone, otherwise known as butanone or MEK, was commonly
used as a solvent however, this solvent is toxic by all routes of exposure and
many governmental regulations have now banned it, and less hazardous
solvents have had to be considered [13]. Acetone and isopropyl alcohol (IPA)
are now generally used for cleaning the substrates, offering fewer
environmental issues than MEK.

10
The application of primers or coupling agents is usually the last step of the pre-
treatment process. This final process will improve the pre-treated substrate by
either creating a stable protective coating over the surface which is optimised
for adhesive bonding (priming) or by enabling the pre-treated surface to be
capable of directly reacting with the adhesive to form strong covalent bonds
(coupling).
Mechanical pre-treatments
Current surface pre-treatments in the aerospace industry involve solvent
cleaning, mechanical roughening, and peel ply removal (in the case of
composites), either separately or in combination [14, 15].
Mechanical roughening techniques use abrasion to increase the roughness of
the surfaces and remove contaminants from them.
Mechanical roughening includes manual abrasion and grit blasting. Manual
abrasion is carried out using abrasive papers through rotary pads, followed by
the cleaning of the composite structures using vacuum cleaning followed with
a solvent wipe and then allowed to dry. Grit blasting is another form of
mechanical abrasion, where a stream of abrasive material is expelled against
a surface using compressed air to roughen the surface and remove
contaminants.
Previous investigations on thermoset composites have shown that increasing
the roughness of the surface by abrasion methods leads to mechanical
interlocking, increasing the intrinsic adhesion, and therefore the strength of the
assembly [16, 17]. However, the work carried out by Pocius and Wenz [18]
determines that the critical factor for successful bonding is having
contamination-free surfaces.
Abrasion methods are time-consuming, and generate debris and dust during
the process (leading to health and safety issues). Another concern is
inconsistency during surface preparation, as it depends on operator expertise,

11
giving variability during the process. Abrasion may also produce damage to
the fibre matrix if not executed properly.
Peel ply is the other method broadly used for bonding the primary structures
of the Boeing 787 and other commercial aircrafts [14]. Peel ply is a synthetic
cloth (made from nylon or polyester), usually used during the manufacturing
process of composite structures to prevent foreign materials from becoming
integrated into the finished part [19]. Peel ply also textures the surface of
composite laminates, reducing or eliminating the need for surface preparation,
as shown in research carried out by Hollaway et al. [20] and Flinn et al. [21].
However, previous research has shown that stronger joints can be achieved
using peel ply in combination with manual abrasion and cleaning of the
surfaces prior to bonding [22].
When the composite part is cured, the peel ply can be peeled off just prior to
bonding, achieving a consistent clean surface. After removing the peel ply, a
solvent wipe is usually used to remove any possible contamination on the
composite surface. However, it has been shown that fibres from the peel ply
can be left behind during removal, and therefore can contaminate the bond
area [23, 24].
One of the disadvantages of peel ply is that it can lead to damage of the
underlying composite if the removal is not done properly. In addition, resin rich
ridges can be found after the removal of the peel ply. These areas must be
removed from the composite as they don’t have any reinforcing fibres in them,
making these regions weaker and the resulting bond will not be so strong.
The fracture possibilities upon peel ply removal are shown in Figure 2.

12
Fracture possibilities upon peel ply removal
1. Green arrow: Peel ply fibre fracture (contamination of the
composite surface)
2.Pink arrow: Interfacial fracture between the peel ply fabric and the
epoxy matrix
3.Dark blue arrow: Fracture of the epoxy between the peel ply and
carbon fibres
4.Turquoise arrow: Interlaminar failure (within the composite itself)
Figure 2 Fracture possibilities upon peel ply removal [21, 25].
The “dark blue arrow condition” shown in Figure 2 represents the fracture of
the epoxy between the peel ply and carbon fibres. This will create a fresh and
chemically active fractured resin surface, which will enhance the adhesion
between the adhesive and the substrates [21, 26].
The main reason to use peel ply by the industry is to provide a clean
roughened surface which is chemically (as it is a fresh resin surface) and
physically (due to roughness) consistent, enhancing the adhesion between the
adhesive and the substrates.
Chemical pre-treatments
Chemical treatments are quite versatile, as they can produce different surface
finishes. They have been extensively used in industry, especially for painting
and bonding of metals. Generally, these methods use strong acids or bases,
which require specialist waste disposal and extensive rinsing with distilled
water. Due to the hazardous nature of these substances, these treatments are
becoming more tightly controlled, due to EHS legislation.
4
1
2
3

13
Chemical treatments are not used for surface pre-treatment of FRPs and
therefore they will not be covered in this thesis.
Energetic pre-treatments
The other category of surface pre-treatments involves methods such as
plasma, flame, laser, etc. These physical pre-treatments cause a change in
the surface chemistry of the adherents, brought about by the interaction of
highly energetic species with the adherent surface.
These energetic processes have the advantages of not requiring contact with
the surface and by being dry.
Plasma is an excited gas containing molecules, free radicals, electrons, and
ions. It is also called the fourth state of matter [27]. The four common states
or phases of matter in the Universe (solid, liquid, gas and plasma) are
illustrated in Figure 3.
Figure 3 States of matter.
Plasma can be generated by heating a gas, or exposing it to a strong
electromagnetic field. The latter can be achieved with a laser or microwave
generator.

14
By applying an electromagnetic field electric field to a gas, the electrons
transform the energy of the field into kinetic energy. If an electron has enough
energy, it will not just bounce off an atom; it can disturb the electrons orbiting
the atom and inelastic collisions can occur. This will produce the ionisation of
neutral species and the generation of free electrons that will have the ability to
conduct electricity. In the ionisation process, atoms or molecules obtain a
positive or negative charge (by gaining or losing electrons) to form ions [28,
29].
Plasmas can be classified as either thermal (hot plasmas) or non-thermal (cold
plasmas). Thermal plasmas are nearly fully ionised and they are characterized
by an equilibrium (or near equality) among the temperature of the electrons
(Te), ions (Ti) and neutral species (Tn) (i.e., Te ≈ Ti ≈Tn) [28]. Temperatures of
several thousand degrees are not unusual in hot plasmas. These plasmas are
not suitable for most materials processing applications due their destructive
nature. They are usually used in waste treatment and sintering. High
temperature flames are an example of hot plasma [30].
The other possibility is that only a small fraction of the gas molecules a
re ionised (only 1-10%, the rest of the gas remains as neutral atoms or
molecules). In this case, the plasma is classified as non-thermal plasma or
cold plasma. Ions and neutral species are at much lower temperature than the
electrons (Te>>Ti ≈Tn). Due the large temperature values, it is more convenient
to express the temperature in electron-volts (eV). Electrons can reach
temperatures of 1-10 eV (1 eV = 11,600K). The temperature of the ions and
the neutral species vary between 323 and 573K, much lower compared to the
temperature of the electrons. This difference in temperature makes possible
the creation of chemical reactions at relatively low temperatures. An example
of cold plasma is the Aurora Borealis [28]. The low temperatures typical of
non-thermal plasmas make them suitable for material processing applications.
In fact, cold plasma technology has been used since the late 1960s by the
electronics industry for the deposition of thin film materials and for plasma
etching of semiconductors, metals, and polymers [31].

15
The use of plasma treatment for processing of materials is quite broad. Apart
from deposition of thin films, it is also used for sterilisation, where pathogens
are chemically destroyed, and also for decontamination of chemical and
biological weapons.
Different physical processes can be observed on the substrates pre-treated
through plasma prior to bonding. These processes involve surface cleaning
(removal of contaminants from the substrates) and ablation/etching of material
from the surface (removal of weak boundary layers). These weak boundary
layers could be formed during component manufacturing and must be
removed to improve the adhesion. The difference between ablation and
etching lies in the amount of material that is removed during the treatment.
Ablation implies cleaning by removing of low molecular weight organic
contaminants; and etching affects the surface morphology of the substrate
[14].
The other two physical processes that are possible during plasma pre-
treatment are the chemical modification of the surfaces (surface activation),
and crosslinking. Regarding surface activation, plasma creates reactive polar
functional groups at the surface which can intensely increase the surface free
energy of the substrate, improving the wettability of the substrate by the
adhesive and thus enhancing the adhesion. Surface free energy is a
parameter used to quantify the wettability of a solid surface. Through surface
pre-treatments the surface energy of the materials can be modified; and
therefore the strength of the joint can be enhanced. Surface free energy can
be measured using a contact angle analyser, which measures surface
energies by measuring the contact angles of different liquids. Figure 4 shows
the three possible scenarios.
If the contact angle formed by a liquid when placed in contact with a solid
surface is higher than 90°, the surfaces are called hydrophobic, and they
present a low surface free energy. These surfaces will be characterised by
poor wetting and therefore poor adhesiveness (Figure 4a). If the contact angle
is below 90° the surfaces are hydrophilic. They possess higher surface energy,
providing better wetting and therefore better adhesiveness [32, 33] (Figure

16
4b). Figure 4c shows the ideal situation where the adhesive completely wets
the surface (spreading).
Figure 4 a. hydrophobic surface; b. hydrophilic surface; c. adhesive
completely wets the surface.
As mentioned before, the ability of the adherents to be bonded depends on
their chemical and physical properties. For example, adhesive joining of some
thermoplastics (e.g. polyolefins, fluorohydrocarbons) is more challenging than
for thermosets, due to their low surface energy [32, 34].
Through plasma, possible oxidation and nitrogenation of the substrates will
occur. These two processes will produce chemical changes on the surface of
the substrate potentially creating polar moieties such as ether, carboxyl,
hydroxyl, carbonyl, imine, amine, etc. Such groups are capable of interacting
with the applied adhesive enhancing adhesion.
Depending on the substrate material and the application, other gases can be
used during the plasma process. For example plasma can be used for surface
fluorination to create hydrophobic surfaces (eg waterproof textiles) [31].
The other detectable physical process during plasma pre-treatment is
crosslinking. Exposing surfaces to noble gas plasma (such as He or Ar)
produces the creation of new free radicals. These free radicals (uncharged
molecules) are very unstable and hence highly reactive. Therefore, the free
radicals can react with other free radicals or with other chains in chain-transfer
reactions to gain stability. As a result, through crosslinking the surface of the
adherents may become cross-linked, preventing the creation of weak
boundary layers [31].
0°
>90° <90° a. b. c.

17
Current plasma technology available
Plasma pre-treatment of different materials can be executed at low pressure
and at atmospheric pressure. One of the drawbacks of low pressure plasma
systems is that the substrates to be treated must be placed inside a vacuum
chamber, which limits the size of the components, and they cannot be treated
in a continuous process, as pre-treatment of batches is then only option.
Another disadvantage is that the power consumption required is quite high,
and this makes the process relatively expensive.
In low pressure plasma technology, the plasma is generated using a high
frequency generator. This technology is highly controllable in terms of
gas/plasma composition, power, duration of the treatment, etc. When the
process is complete and the chamber is back to atmospheric pressure, the
door can be opened and the samples removed from the chamber.
Unlike low pressure plasma systems, atmospheric pressure plasmas (AP) can
treat substrates in a continuous way at high speed, achieving processing cost
savings [35]. AP has the potential to be automated with relatively low power
consumption.
In AP technology, the plasma is generated with a high tension generator. The
gas used to generate the plasma can come from different sources. It is a less
controllable system than low pressure plasma technology. Figure 5 shows the
main components of the AP system used in this research.

18
Figure 5 Components of an atmospheric pressure plasma system.
AP systems are quite versatile, as it is possible to integrate into them several
non-rotating plasma jets. Rotating nozzles can also be incorporated into AP
jet systems. Rotating nozzles can treat a large area of material in a single
pass with less treatment intensity than static nozzles [36].
AP pre-treatment prior to structural bonding has shown promising results. This
technology is already installed in some automated industrial process [37].
However, more research needs to be carried out in order for it to be
implemented into production in the aerospace industry [15].
AP has been investigated in different materials under controlled process
conditions, demonstrating an improvement of the adhesive bonding strength
on polymers [38-41], and composites [42-46].
The work carried out by Zaldivar et al. [45] compared different pre-treatments
on a cyanate ester composite. Lap shear strength values indicated an increase
of 30% for the bond strength, compared with solvent wiping, peel ply and

19
plasma (Helium plus O2) vs manual abrasion. The relative bond strength
improvement of these pre-treatments is shown in Figure 6.
Figure 6 Relative bond strength improvement of a cyanate ester composite bonded with a room temperature cured adhesive [45].
Compared to polymers and composites, less work has been done for metals
(Al, Ti, steel, etc.). Williams [29] studied the surface modification by AP of
different materials (stainless steel 410, aluminium alloy 2024, and carbon fibre
epoxy) achieving an improvement in the lap shear strength of the bonds.
Figure 7 shows lap shear strength values of bonded 410 stainless steel using
different surface pre-treatments.

20
Figure 7 Lap shear strength values of bonded 410 stainless steel of different surface pre-treatments [29].
Figure 7 confirms that plasma treatment increases the bond strength to its
maximum value. A value of 24±1MPa was achieved by cleaning the samples
with IPA (using primer), compared with the 35±1MPa obtained treating the
samples through manual abrasion and plasma activation (also using primer).
Different parameters will influence the plasma process. Among these
parameters, it is important to highlight duration (speed of process and number
of passes), power, flow rate of gas (combination of gases), and distance
treatment. For each application and each substrate, these parameters need to
be defined as the interaction between the plasma, and the surface depends
intensely on the material properties [36].
The research carried out by Baghery et al. [47] of unsized carbon fibres using
low pressure plasma shows the effects of different plasma process parameters
(power, duration, and flow rate of oxygen gas) on the interfacial adhesion
behaviour between the fibres and the resin. It could be, though, that longer
treatment will improve the adhesion between the fibres and the matrix.
However, it is shown in the investigation by Baghery that long exposure

21
treatment times decrease the bulk properties of carbon fibres, and therefore
the interlaminar shear strength (ILSS) of treated fibre composites. The same
effect was observed using high values of power.
The same effect can be observed in the investigation by Palleiro et al. [36].
High values of power showed degradation of the polymer surface leading to
lower strenght of the joint. This indicated an overtreatment of the material.
Therefore, it is important to find out the processing window for each type of
material treated. Processing window means the combination of the
parameters involved in the plasma process, which improve the adhesion
behaviour instead of damaging the materials and therefore reducing their
properties.
There are different atmospheric plasma sources which can be classified
depending on the excitation mode. Different groups can be listed [48, 49]:
Direct current and low frequency discharges (1kHz-100kHz). Some
examples within this group are corona discharge and dielectric barrier
discharge.
Radio frequency discharges: these operate in the frequency range of
1-100MHz.
Microwave discharges: in this case, typical frequency is 2.45GHz.
Another energetic pre-treatment that oxidises the substrates is flame. This
process consists of passing a flame over the surface. This will create polar
groups at the surface, which will enhance the wettability of the adhesive, and
therefore the strength of the bond. Flame temperature, and the distance
between the adherent and the flame, should be carefully chosen [50].
Other types of surface pre-treatments are ultraviolet, laser, ion beams, and X-
ray. These treatments are defined as closed systems, as the material under
treatment has to be placed inside a chamber [34, 51].

22
Adhesive selection
The selection of the most appropriate adhesive for a specific application is
another important parameter to consider in the bonding process. This task can
be challenging due to the very wide range of commercial products available.
However, the choice can be simplified by considering simple rules such as
knowing which family of adhesives meet the requirements of the assembly.
Figure 8 lists some of the parameters which need to be considered during the
selection process of the most suitable adhesive.
Figure 8 Adhesive selection: considerations.
Depending on the overall functionality of the assembly the selection of the
adhesive will be completely different. For structural purposes, the selection will
be made between thermosetting adhesives (e.g. acrylates, epoxies, and
polyurethanes).
Epoxy adhesives are widely used in aerospace and other industries due to
their excellent mechanical performance [52]. These materials have high
strength, chemical resistance, and low shrinkage. Therefore, they form strong
and durable bonds with most materials in well-designed joints. The form in
which epoxy adhesives are available varies widely, from low viscosity liquids
to solid pastes and films. Film adhesives are preferred for high precision
engineering applications. These films can be cut into desired shapes.
Within the same chemical family there are often a number of different
formulations and forms available from each supplier which can make the
Adhesive Selection: Considerations
Joint type and function In-service conditions Mechanical performance Cost Bond line thickness Cure time Temperature limits Health and safety issues Adhesive form Adherents Manufacturing conditions

23
selection process even more difficult. However, using the rules cited above in
addition to different sources of assistance (suppliers, consultants, and
software selection systems) can help to reduce the effort of choosing the most
suitable adhesive.
One important parameter that will affect the strength of the final joint is the
adhesive bond line thickness (BLT). A very thin BLT will create weak bonds
and lead to premature failure, as there is not sufficient adhesive in the bond
line to perform properly in demanding situations. Thin BLT will create poor
wetted areas. Ideally the surface of the adherents should be fully wetted by
the adhesive to achieve maximum strength of the joint.
The opposite scenario is to have very thick BLT. Thick BLT will cause offset
loads and high stress concentration at the edges of the joints reducing the
strength of the bond. This thick BLT will create an “extra” layer of material
within the joint which is not desirable.
Depending on the type of adhesive, the BLT can vary significantly. For
example, the BLT for epoxies varies between 50-300μm, for acrylics between
100-500μm, and for polyurethanes between 500-5000μm [53]. Adhesive
suppliers can guide the end user in this area.
Adhesives should be applied in the proper controlled thickness. There are
different ways to control the BLT of the adhesive. Glass beads, carrier films,
wires, fillers, etc. can be added to the adhesive for this purpose. Other
possibilities include tooling modification, adding external shims, considering
joint design, etc. For example, some of the film adhesives have a carrier
material incorporated in them, which offers a highly controlled bond-line
thickness [53].
Another important parameter to consider is the type of defects in the adhesive
layer. Voids can appear due to volatiles in the adhesive or air entrapment.
Incorrect curing can be caused due incorrect mixing of the adhesive or
contaminants. In some cases it is possible to observe cracks in the adhesive

24
layer due thermal shrinkage or curing. These defects could have an impact in
the final strength of the joint.
In order to detect these defects at the bond line, different non-destructive
methods can be used, such as ultrasound or computerised tomography (CT)
scans.
Joint design
As cited before, one of the advantages of adhesive bonding is the better
distribution of the stresses through the joint. The loading modes experienced
by adhesive joints can be compression, shear, peel, cleavage, and tension.
Adhesive bonded joints can experience several of these loading modes at the
same time.
Adhesives should preferably be loaded in compression or shear as bonded
joints are strongest under these loading modes. Peel, tension and cleavage
forces must be avoided or minimised as these stresses are too severe for
FRPs [54]. This can be achieved by applying the principles of well-designed
joints [53].
Among the loads cited above to which the assembly is submitted, shear
loading is the desirable mode. Therefore, the joint will be designed to be mostly
restricted in the shear direction [52]. Single lap shear joints will be considered
in this research as they are the simplest joint geometry where the shear
stresses are achieved by traction on the two substrates, as shown in Figure 9.
In this type of joint geometry, peel stresses will still appear.
Figure 9 Single lap shear joint design.

25
In single lap joints, initial loading is carried in shear along the line of the bonded
adherents. As load increases, peel forces start appearing at the ends of the
overlap of the joint. In addition to this, tensile loads become important across
the joint and failure can occur due to [55]:
Failure of the adhesive - cohesive failure.
Failure at the interface between the adhesive and the adherent -
adhesive failure.
Failure of one of the adherents - parent material failure.
The failure modes and the relation to bond strength are shown in Figure 10.
Figure 10 Failure modes for adhesive bonding.
Adhesive failure is the failure of the adhesive at the surface of one of the joined
adherents (red line in Figure 10). It is considered to be the result of a weak
bond and must be avoided (it is unacceptable by the aerospace industry). This
type of failure can occur due to an inadequate or poor surface preparation or
material mismatch [56].
Cohesive failure can occur either in the adhesive or in the adherents. Cohesive
failure in the adhesive (top green line in Figure 10) happens when the load
26
exceeds the adhesive strength, providing a bond as strong as the adhesive
itself. This type of failure can occur due to an inappropriate design or void
content. Cohesive failure in the adherent (also called parent material failure or
interlaminar failure in the case of composites, bottom green line in Figure 10)
provides a bond as strong as the laminate itself.
Cohesive failure (either in the adhesive or in the adherent) is the acceptable
type of failure for adhesive bonds [57].
In some cases, cohesive and adhesive failure can happen in the same bond.
As mentioned previously, failure along the adhesive and composite interface
must be avoided, achieving cohesive failures of the joint. For example,
Williams et al. [58] pre-treated steel samples through plasma and it was
observed that cohesive failure of the treated samples increased to be 97% of
the failure surface compared to 30% achieved for untreated samples.
The quality of the joints can be evaluated through mechanical testing
(destructive methods) and non-destructive testing (NDT). Likewise, study of
the fracture surface of the specimens through fractography (also visually) will
provide a better understanding of the different failure modes. Standard BS ISO
10365 [59] describes the main type of failure patterns of bonded assemblies
(regardless of the nature of the adherents and adhesive of the assembly).
Summary of literature review
This chapter has reviewed the different parameters involved during the
adhesive bonding process, highlighting the importance of surface pre-
treatments prior to bonding to achieve successful and durable joints.

27
Different aspects must be considered before creating adhesive bonds. The
following diagram illustrates some of these important aspects:
An assessment of the different surface pre-treatments used by the industry for
FRPs has been conducted and a comparison of these methods has been
carried out emphasizing the advantages and disadvantages of each one. The
capability of the adherents to be bonded depends on their chemical and
physical properties. Plasma pre-treatment has been shown to have the
potential to replace conventional methods used in the aerospace industry as
this method can create new chemical functionalities which are capable of
interacting with the adhesives added to the substrates, thus enhancing the
adhesion.
Design Activities
Select materials Design joint Select adhesive
Manufacturing Activities
Surface pre-treatments Assembly Cure Final inspection

28
Considerations upon the technology requirements using QFD analysis
In this chapter, a Quality Function Deployment (QFD) analysis of the pre-
treatments discussed in Chapter 2 was carried out. QFD is a useful tool that
defines customer/industry needs or requirements which can then be translated
into specific plans to produce products or develop technologies.
Through this tool a common understanding of the customer/industry needs is
promoted and therefore a more reliable decision can be taken. The use of QFD
tool can produce improvement in respect to cost, quality and development
time.
Technologies and customer needs are rapidly changing. The QFD charts are
ideal to reflect new facts and market conditions [60].
As previously discussed, the aim of this project is to investigate the possibility
of replacing current methods for preparation of material surfaces prior to
bonding. Therefore, an industrial analysis of the current pre-treatments was
carried out in Chapter 2 to evaluate the existing methods and consider
alternatives.
The aerospace industry uses peel ply, in combination with either manual
abrasion or grit blasting, for the pre-treatment of composite surfaces prior to
bonding. These two methods are both time and energy consuming and
therefore, there is a necessity for industry to find pre-treatments that can be
easily automated to reduce overall process time and increase efficiency. In
addition, it is important to highlight that manual abrasion and grit blasting
cause debris and dust to be generated, resulting in EHS issues. These
processes may also damage the fibres if they are not executed properly, and
they are highly dependent on the expertise of the operator.
Energetic pre-treatments, such as flame and plasma, were also evaluated.
The flame method was dismissed, due to the high temperatures involved in
the process, which would lead to the degradation of the material under study

29
(matrix of the composite). Plasma pre-treatment appears as a promising
technique, as it offers cost and time savings, and no debris or dust is
generated during operation. Plasma provides consistency, as it does not
depend on the expertise of the operator and it has the potential to replace the
chemical pre-treatments used for metals. This will be extremely interesting for
joining hybrid materials (e.g. titanium to carbon fibre reinforced polymers).
Ultraviolet, laser, and x-ray pre-treatments were also considered however, the
power consumption of these treatments is relatively high, making the
processes quite expensive.
QFD analysis
QFD analysis was carried out by taking into account different criteria that a
surface pre-treatment may be required to meet. From an industrial point of
view, the preferred pre-treatment will be the one which reduces processing
time and energy consumption. As the geometry of industrial components is
becoming more complex, the favoured pre-treatment should possess the
potential for industrialisation, making the operation relatively straightforward
and consistent. Consistency during industrial operations is essential for
reliable performance of the final component. The performance will also be
affected by the selected process parameters. Choosing the incorrect
parameters could lead to damage to the substrates, and therefore affect the
strength of the final assembly. As already mentioned, current methods are
becoming more constrained, due to EHS issues, and the selected process
should be environmentally and operationally friendly.
The different criteria analysed during the QFD analysis are collated in Table 2
(processing time, cost, potential for industrialisation, process variability, EHS
issues, and damage material).

30
Table 2 represents the interrelationship analysis that compares criteria against
each other, in order to rank them in terms of importance in the industrialisation
of a surface pre-treatment.
The rating system selected to compare criteria was 1:3:9, where 1 is
“important”, 3 is “more important” and 9 is “much more important” [61]. The
ranking for each of the criteria is calculated by dividing the raw total (rating
scores added for each raw) by the grand total.
According to the ranking obtained in Table 2, “damage material” is the highest
ranked criterion. The selected surface pre-treatment must be completely
reliable, without damaging the material under treatment, as this will affect the
final performance of the joint. Process variability is ranked second. For the
implementation of an industrial process, it is important to achieve consistency
in results to guarantee the success of the final product.
The third ranked criterion, EHS issues, is related to the importance of
implementing pre-treatments that are friendly to the environment, and not
harmful for the operators. Manufacturers are trying to be eco-friendly, which is
the reason why this criterion ranked as more important than cost. Customers
interested in this type of friendly pre-treatment are not afraid to invest in these
technologies, which is why cost was understandably the lowest ranked.
From Table 2, it can be observed that the preferred pre-treatment that met
most of the variables included in this analysis was plasma (cost and time
savings, no debris or dust generated, potential for industrialisation,
consistency). Different parameters will influence the plasma process. Among
them, it is important to highlight the speed of the process, the number of times
that the surface is pre-treated (number of passes), power, flow rate of gas, the
types of gas, and distance treatment.

31
Table 2 Interrelationships analysis: criterion vs criterion
Cost Damage material
Process variability
Potential for industrialisation
EHS issues
Process time
Raw total
Relative Ranking
Cost
1/9 1/3 1/3 1/3 1 2.11 0.041 6
Damage material
9 1 3 1 3 17.0 0.332 1
Process variability 3 1 1 3 3 11.0 0.215 2
Potential for industrialisation
3 1 1 1/3 3 8.33 0.163 4
EHS issues
3 1 1/3 3 3 10.33 0.202 3
Process time
1 1/3 1/3 1/3 1/3 2.33 0.045 5
Grand total
51.1
1/9 much less important 1/3 less important 1 important 3 more important 9 much more important

32
Table 3 Decision matrix (ranking parameters)
Weight
Type of gas Gas flow Number passes
Distance Speed Power
R
W
R
W
R
W
R
W
R
W
R
W
Damage material 0.332 1 0.332 3 0.996 3 0.996 1 0.332 1 0.332 3 0.996
Process variability 0.215 1 0.215 3 0.645 1 0.215 3 0.645 3 0.645 3 0.645
EHS issues
0.202 3 0.606 1 0.202 1 0.202 1 0.202 1 0.202 1 0.202
Potential for industrialisation
0.163 1 0.163 1 0.163 1 0.163 1 0.163 1 0.163 1 0.163
Process time 0.045 1 0.045 3 0.135 9 0.405 1 0.045 9 0.405 1 0.045
Cost 0.041 9 0.369 3 0.123 3 0.123 1 0.041 3 0.123 3 0.123
Total 1 1.730 2.264 2.104 1.428 1.87 2.174
R= Ranked, W= Weighted
Pre-treatment parameters
Industry
requirements

33
Table 3 shows the decision matrix which maps the criteria assessed in Table
2 against the different parameters involved in the plasma pre-treatment. This
matrix is a diagram which helps in determining how a product or technology
meets the customer or industry needs. It is an important step in the pre-design
phase, as this will reveal which aspects should be worked on more than others
through numerical representation.
Figure 11 shows the rankings of each engineering characteristic with their
respective weighting (taken from Table 3). Glass flow, power, and number of
passes are the top three among the engineering characteristics described in
Table 3.
Figure 11 Rankings of each engineering characteristic with their respective weightings.
The description of the plasma equipment used during this research is
explained in Chapter 4 (Section 4.3.4). The gas flow and the power used will
be fixed at the maximum capacity of the equipment. The number of passes
and the speed of the process will be modified during the research in order to
evaluate the influence of these two process parameters, while the distance will
be fixed at a constant value.
Different type of gasses can be used during the pre-treatment (argon, helium,
fluorine, etc). The control unit available can use either argon or helium. Argon
will be used as the primary gas instead of helium (argon is cheaper than
helium).

34
Methodology
Materials
Adherents
The material used in this research was an epoxy resin, reinforced with carbon
fibres. This material was supplied by HEXCEL Composites, Duxford
(Cambridge, UK), in the form of prepreg.
Prepregs consist of a combination of a matrix (resin) and fibre reinforcement.
They are ready to use in the component manufacturing process. Prepregs
need to be stored at -18°C to hinder the curing of the resin [62]. The resin
cures at high temperature, undergoing a chemical reaction that transforms the
prepreg into a solid structural material that is exceptionally stiff, lightweight,
temperature resistant, and highly durable.
Prepregs are available in two forms: unidirectional (UD) or woven fabric. In UD
form, the fibres run in only one direction. Unlike UD fabrics, woven fabrics
consist of at least two threads which are woven together (the warp and the
weft direction). Performance and cost are the two main factors that influence
the selection of the prepreg.
A UD prepreg was selected for this research, as it presents a stronger
mechanical performance in the direction of the fibres compared with that of
woven fabrics. Unlike woven fabrics, fibres in UD preform do not have a crimp
(i.e. they are straight).
The specific material chosen was HexPly8552, a certified high performance,
tough epoxy matrix used in primary aerospace structures. Table 4 provides
the information for this prepreg.

35
Table 4 HexPly 8552 prepreg [63]
Product Description
Reinforcement Matrix Form Volume Fibre (%)
HexPly8552 Carbon Fibres Epoxy UD Prepreg
58
Characteristics HexPly 8552
-Excellent mechanical properties -Elevated temperature performance, service
temperature (121°C)
Adhesives
The family of adhesive chosen was epoxy, as they are widely used in the
aerospace industry due their excellent mechanical properties. They also
present excellent wetting properties [58].
From the different epoxy adhesives available on the market, Redux 312 was
selected. Redux 312 is a high strength 120°C curing film adhesive, suitable for
metal to metal bonding, sandwich constructions and composite to composite
bonding. Some versions (such as Redux 312/5) are supported with a woven
nylon carrier for bond line thickness control purposes. Redux 312 was supplied
by HEXCEL.
Table 5 Film adhesive Redux 312 [64]
Product Description
Form Cure cycle
Characteristics
Redux 312 Film adhesive without carrier
30 minutes at
120°C
- Good mechanical performance up to 100°C
- Low volatile content
Glass beads
A pinch of ballotini beads (glass beads) were added on top of the adhesive
film Redux 312 (version without carrier) for bond line thickness control. The
material was purchased from Sigma Life Sciences with a diameter range of
212-300μm [65].

36
Manufacturing composite laminates
Five prepreg laminates were manufactured at HEXCEL using an autoclave
(four laminates of nominal size 600 x 600mm and a smaller laminate of 620 x
300mm). Each laminate had 16 layers of carbon fibre/epoxy with a final
thickness of approximately 3mm.
The first step of the manufacturing process was to remove the prepreg from
the freezer while it was still in the sealed bag. Once the prepreg reached room
temperature, it was ready to be used.
Afterwards, 80 layers of HexPly8552 were cut. In order to manufacture one
laminate, 16 plies were stacked. However, this was carried out first by stacking
four plies, and then debulking them for five minutes under vacuum (pressure
conditions: 0.95-1bar).
Debulking is an important step during the manufacturing process of composite
parts. The objective is to compact or squeeze the air out from among plies,
ensuring the seating of the plies on the tool and preventing wrinkles.
Another four plies were placed on top of the previous four plies, debulked
again. The same procedure was applied until 16 plies were stacked. It was
extremely important that each additional ply had full contact with the previous
ply, avoiding gaps among plies. Finally, the whole laminate (16 plies) was
debulked for five minutes.
After the plies of the five laminates were stacked together, the next step was
the vacuum bagging of the laminates before their cure in the autoclave.
Vacuum bagging plays a significant role in the manufacturing of composite
components. This process allows the application of compaction pressure to
consolidate plies, as well as the extraction of moisture and volatiles from curing
composites.
In order to achieve high quality composite components, great care must be
taken when using different sequencing materials during the vacuum bagging

37
stage. The prepregs and vacuum bagging materials were placed on top of a
flat aluminium tool and the first layer added was a polytetrafluoroethylene
(PTFE) film. It was used as a release film to prevent the prepregs from
adhering onto the mould surface during the curing phase. The next layer
added was a peel ply of polyester. This peel ply was used to texture the surface
of the composite laminates. The next step was to place the uncured laminates
on top of the peel ply. Glass tape was added along the edges of the prepregs
in order to create a continuous air path, followed by the addition of another
layer of release film. Several glass fibre filaments were used to create a path
for the air to be expelled. In addition, two layers of glass fibre cloth were added
to release the air, as well as two layers of breather. These last two layers were
used to keep a “breather” path through the bag to the vacuum source. This
allowed the air and volatiles to escape, so that continuous pressure could be
applied to the laminates.
Finally, the bag film was sealed at the edges of the aluminium tool. Three
vacuum valves were located above the tool’s surface. A piece of breather was
added between the valves and the tool in order to provide breather continuity.
A leak test was carried out using a vacuum gauge to detect if there were any
leaks.
The peel ply used to texture the surface of the composite laminates was a
specific product from HEXCEL. The fibre type was polyester with a maximum
use temperature of 204°C and a thickness of 0.101mm (dry peel ply).
Figure 12 shows the materials sequence during the vacuum bagging.
Figure 12 Schematic of the vacuum bagging.

38
At this point, the prepregs were ready to be cured in the autoclave. During the
curing, two thermocouples were used to check the temperature.
Table 6 summarises the steps followed during the manufacturing of the
composite laminates.
Table 6 Manufacturing composite laminates
# Step Description
1 Removing material from the
freezer
Material could be used when room temperature was reached
2 Cutting material
80 plies were needed to manufacture 5 laminates
3 Piling plies up - Debulking for 5 minutes after every 4 plies - Once 16 plies were piled up, debulking the
whole laminate for another 5 minutes
4 Vacuum bagging and leak test
Sequence vacuum bagging: - PTFE film - Peel ply - Prepregs - Glass tape - Release film and glass fibre filaments - Glass fibre cloth - Breather - Bagging film and sealant tape
Leak test
5 Prepregs ready for autoclave
Check Table 7 for processing conditions
The temperature, pressure and vacuum profiles in the autoclave are shown in
Table 7.

39
Table 7 Temperature, pressure and vacuum profiles autoclave
Temperature Profile Pressure Profile Vacuum Profile
SP Type Ramp
Rate
(°C/min)
Target
Press
(°C)
Time SP Type Ramp
Rate
(bar/min)
Target
Press
(bar)
Time SP Type Ramp
Rate
(bar/min)
Target Vac.
(bar)
Time
Dwell N/C 25 1′ Dwell N/C 0 1′ Step N/C -0.80 N/C
Ramp 0.9 80 N/C Ramp 0.10 6 N/C Dwell N/C -0.80 1′
Ramp 0.9 180 N/C Dwell N/C 6 N/C Step N/C -0.30 N/C
Dwell N/C 180 2h Dwell N/C 6 10′ Dwell N/C -0.30 10′
Ramp 2.5 60 N/C Dwell N/C 6 10′ Dwell N/C -0.30 10′
Ramp 2.5 40 N/C Ramp 0.50 0 N/C Dwell N/C -0.30 5′
N/C: Not Controlled. Ramp Rate Temperature: °C/min, Ramp Rate Pressure: bar/min, Ramp Rate Vacuum: bar/min

40
Figure 13 shows the cure cycle of the laminates.
Figure 13 Curing cycle composite panels.
Table 8 summarises the information of the prepreg laminates manufactured:
Table 8 Summary manufactured prepregs
Product Description
Number of Laminates
Size Lay up
Characteristic
HexPly8552 (Carbon
fibre/epoxy)
4 600 x 600mm [0]16
Peel ply incorporated during the manufacturing process to texture
the composite surface
1 620 x 300mm

41
Specimen cutting
Waterjet cutting was the method used to cut the composites laminates into
small coupons. A waterjet uses a high pressure stream of water or a mixture
of water and abrasive substance to erode a narrow line in the material to be
cut. Waterjet cutting offers fast cutting. Due its precision and ability to cut
almost any material, this technique is extremely versatile. It is the preferred
method when the material being cut is sensitive to the high temperatures
generated by the other cutting methods.
A mixture of water and abrasive garnet was used for cutting the composite
laminates. An Australian garnet 80mesh was used (industry standard) and the
cutting pressure applied was 60,000psi [66].
Through waterjet cutting, the composites laminates were cut into small
coupons of 100mm length and 25mm width. These dimensions were chosen
based on standard BS ISO 4587 [67] (more information about the joint
assessment can be found in Chapter 4.5).
An individual specimen-naming system was devised to guarantee traceability
to the original panels, treatment type, and joining conditions. Each specimen
was named using the following code “Sxxx”; where “xxx” is the reference
number from which panel the coupons were cut and also their position in the
panel. Figure 14 shows a sketch of the specimens obtained per panel.
Each panel of 600 x 600mm was cut into 95 specimens. From the smallest
laminate (620 x 300mm), 38 composite coupons were obtained. In total, 418
specimens were cut from the five composite panels manufactured.
Measurements of the samples can be found in Appendix A.

42
Figure 14 Panels and specimens obtained per panel.
Surface preparation
Different surface pre-treatments have been investigated in this research. The
combinations of the pre-treatments carried out in the adherents are presented
in Table 9.
After the peel ply was removed from the adherents, the surfaces were cleaned
with acetone and pre-treated by manual abrasion, grit blasting and plasma.
Each pre-treatment is discussed in more detail in the following subchapters.
Table 9 Surface pre-treatment combination
Surface pre-treatments combination
Peel ply Manual abrasion Grit blasting Plasma
Reference Line
Base Line Industry

43
Pre-treatment peel ply plus manual abrasion
As cited in Chapter 1, peel ply is broadly used for bonding primary aerospace
structures. It is added during the manufacturing process to prevent
contamination and texture the surface of the composites, reducing or
eliminating the need for abrasion.
As the aerospace industry conventionally uses abrasion and grit blasting for
surface preparation, these methods will be used as the base line industry for
comparison purposes. After the peel ply was removed from the samples, they
were lightly manually abraded with medium-grit emery paper (p150 grit sand
paper was used) [68-70]. The surfaces of the samples were abraded until the
reflective surfaces turned dull grey (firstly in the direction of the fibres for ten
seconds, afterwards in the opposite direction of the fibres for another ten
seconds more and finally circular movements along the surface for 5 seconds).
Abrasion pre-treatment should be carried out in such a way that damage to
the reinforcing fibres is avoided or minimised. It should always be followed by
solvent cleaning to ensure the removal of loose particles. Therefore, all the
samples were cleaned with acetone and left to dry (15 minutes) before the
adhesive film was added. In an industrial environment, before cleaning the
samples with the solvent, it may be necessary to use a vacuum system to
remove much of the dust generated.
Pre-treatment peel ply plus grit blasting
Grit blasting was also investigated in order to compare the results obtained
against manual abrasion.
A Guyson 400 syphon blasting system was used to grit blast the surfaces of
the substrates. This system uses compressed air to propel blast media directly
at the component through an exclusively designed blast nozzle.
Different run pressure values were investigated (35, 40 and 45psi) before
blasting the real batches of samples. Images of grit blasted samples were

44
taken using scanning electron microscope (SEM) to look for evidence of resin
on the surface and also fibre fracture. Experience has shown that resin/fibre
exposure have an influence on adhesive bonding [72].
A scanning electron microscope produces images of a sample by scanning
the surface with a focussed beam of electrons. A Zeiss 1455EP environmental
scanning electron microscope with an EDAX Genesis 2000 EDX system was
used.
Through grit blasting the original shiny texture of the surface must be
eliminated to ensure the sample is correctly blasted (rather than underblasted).
The samples treated at 40 and 45psi were shown to be over blasted with signs
of carbon fibres being removed or damaged. This was not observed with the
sample treated at 35psi.

45
Figure 15 SEM images grit blasted samples: top left (35psi), top right (40psi)
and bottom (45psi).
Table 10 presents information about the grit blasting machine used and the
run pressure used during the process.
Table 10 Type and conditions grit blasting experiments
Description
Equipment Guyson 400 syphon blasting system
Grit Saftigrit 100 mesh alumina
Nozzle Airjet 2.8mm bore
Run pressure 35psi
Time 20 seconds
Pre-treatment peel ply
Peel ply (PP) was removed from another batch of samples. This method was
used as a reference line to compare the strength of the joints against manual
abrasion, grit blasting and plasma.
Initiation of the peel ply removal was done using a razor blade; the rest could
be removed by hand.
Pre-treatment peel ply plus plasma
The following batches of samples were treated using a cold atmospheric
pressure plasma (CAP) system. A PlasmaTact Atmospheric Device was used
for the pre-treatment of the substrates, purchased from Adtec Europe Limited.
The model of the equipment was a PM01-15AR0, intended for surface
treatment for bonding or adhesion and cleaning for different materials.
This device generates plasma which uses microwave low-temperature
atmospheric pressure plasma. The main part of the equipment consists of a

46
power supply and gas control. Argon or Helium plasma is generated by means
of a plasma generator called a “mini-plasma torch”.
The device is connected to XYZ stage and parameters such as speed,
distance between the plasma and the substrate, gas composition and flow rate
can be changed and controlled.
The plasma equipment used in this research is shown in Figure 16. Table 11
summarizes the specifications of the system.
Table 11 Specifications plasma equipment
Specifications
Model PM01-15AR0
Plasma generation method
Microwave atmospheric pressure streamer plasma generation
Plasma generator Mini-plasma torch
Plasma gas -Primary gas: Argon or Helium purity ≥ 99.9%
-Possible secondary gases:N2, O2, functional gases (CH4,CF4)
Flow rate gas Primary gas: 10l/min* Secondary gas: 5l/min*
Microwave Amplifier Maximum Output: 15W solid-state system Frequency: 2.45GHz fixed
Control Manual Operation
*maximum values
Figure 16 Plasma equipment.

47
This control unit can use argon or helium gases as the carrier, and oxygen and
nitrogen as the active gases.
As explained in Chapter 2, different parameters can be considered while pre-
treating substrates through plasma.
The type of gas used during this research was argon as primary gas, combined
with 20% of air as secondary gas. Plasma conditions were fixed at 15W of
radio frequency (2.45GHz) power. The plasma exposure was defined by the
number of passes of the plasma jet over the substrate. Table 12 presents the
values of different parameters considered during the surface pre-treatment of
the samples [71].
Table 12 Parameters and values used plasma treatment
Parameter Step Value
Type of gas Fixed Argon: primary gas Air: secondary gas
Gas Flow Fixed Primary gas: 8l/min Secondary gas: 0.2l/min
Power Fixed 15W
Distance (between the nozzle and the substrate)
Fixed 4mm
Speed Variable 100, 300 and 500mm/min
Number of passes Variable 1, 3 and 5
The variable parameters (speed and number of passes) defined the test matrix
(Figure 17) used for the experiments.
Figure 17 Test matrix for plasma pre-treatment.
Number of passes
Speed
(mm/min)

48
Once the peel ply was removed from the samples, the substrates were
cleaned with acetone and dried for 10 minutes. The substrates were then
ready to be pre-treated by plasma using the values listed in Table 12.
Mach3 G-code software was used to programme the number of passes of the
plasma nozzle, the speed, the distance of the plasma to the substrates and
the path that the plasma should follow to treat the substrates. The area treated
in the composite coupons through plasma was fixed to 12.5mm which
corresponds with the overlap length value required according to BS ISO 4587
standard.
Figure 18 Path of the plasma nozzle during the treatment.
A fibre optic temperature sensor from Optocon was used to check the
temperature of the CAP system. Figure 19 represents the evolution of the
plasma temperature at the nozzle exit, varying the distance of the nozzle from
the support tool (Figure 5, temperature sensor was placed on the support tool).

49
Figure 19 Plasma temperature evolution varying the distance of the nozzle from the support tool.
No pre-treatment: samples as received
For comparison purposes, the side of the substrates with no peel ply, called
bag side (Figure 20), was also studied to investigate variances between
bonding these two different sides of the substrates. The bag side was also pre-
treated through manual abrasion, girt blasting and plasma using the
parameters defined in Table 12.
Figure 20 Bag side on the left and peel ply side on the right.
0
10
20
30
40
50
60
70
0 2 4 6 8 10 12
Tem
pera
ture
(ºC
)
Distance, mm
Peel ply side
Bag side

50
Figure 21 Peel ply removal.
Summary of pre-treatment types
Table 13 summarises the different pre-treatments types explored during this
research.
Table 13 Pre-treatment types: peel ply side and bag side
Pre-treatment type
Peel Ply Manual Abrasion Plasma Grit blasting Bag side
No Pre-treatment: samples as received
Peel ply removal

51
Joint assembly
Once the substrates had been pre-treated through the different methods (peel
ply, manual abrasion, grit blasting and plasma), the adherents were ready to
be bonded.
In order to achieve reproducible and high quality joints, the bonding process
was aided using further assembly equipment. For this purpose, the jig shown
in Figure 22 was designed and manufactured, providing two additional benefits
during the bonding process. Firstly, the correct position of the substrates will
be guaranteed since the components will not be able to move. Secondly, a
consistent overlap length of 12.5mm will be ensured for all the joints during the
bonding process.
Figure 22 Jig manufactured for assembly of the joints.
One of the substrates was placed in the jig and the adhesive film added on top
of it (Figure 23a.) A pinch of ballotini beads were added on top of the adhesive
film for thickness control. The next step was to place the other substrate in the
jig to complete the joint assembly. Pressure was required during the bonding
process to make sure that the bond will occur. For this product, cure pressures
of 100-350kPa are recommended during cure [64]. For this purpose, foldback
clips were used (Figure 23b).

52
Figure 23 Joint assembly: a. positioning first adherent and adhesive film, b. positioning second adherent and foldback clips.
At this stage, the joint was ready to be placed in the oven for curing the
adhesive at 120°C for 30 minutes. In order to cure the adhesive, a Binder
M240 high performance temperature chamber was used. This chamber can
operate in a temperature range from 5°C ambient temperature up to 300°C.
After the curing of the adhesive, the joints were cooled to below 70°C before
releasing the pressure (recommendation from the resin supplier).
Tables 14 to 21 summarise the steps followed for all the surface pre-
treatments applied during this researched for both sides of the substrates, peel
ply and bag side.
a.
b.

53
Table 14 Pre-treatment: peel ply plus manual abrasion
Pre-treatment type Steps pre-treatment
Peel ply plus abrasion
(Base line industry)
- Removing peel ply - Abrasion of the substrates - Wiping substrates acetone and dry - Place adhesive film onto one of the substrates - Add ballotini beads - Completion the joint assembly - Measurement bond line thickness before
curing - Curing at 120°C for 30 minutes - Cooling down below 70°C before removing
clamps - Measurement bond line thickness after curing
Table 15 Pre-treatment: peel ply plus grit blasting
Pre-treatment type Steps pre-treatment
Peel ply plus grit blasting
(Base line industry)
- Removing peel ply - Wiping substrates acetone and dry - Grit blasting pre-treatment - Wiping again substrates acetone and dry - Place adhesive film onto one of the substrates - Add ballotini beads - Completion the joint assembly - Measurement bond line thickness before
curing - Curing at 120°C for 30 minutes - Cooling down below 70°C before removing
clamps - Measurement bond line thickness after curing
Table 16 Pre-treatment: peel ply
Pre-treatment type Steps pre-treatment
Peel ply (Reference line)
- Removing peel ply - Wiping substrates acetone and dry - Place adhesive film onto one of the
substrates - Add ballotini beads - Completion the joint assembly - Measurement bond line thickness before
curing - Curing at 120°C for 30 minutes - Cooling down below 70°C before removing
clamps - Measurement bond line thickness after curing

54
Table 17 Pre-treatment: peel ply plus plasma
Pre-treatment type Steps pre-treatment
Peel ply plus plasma
- Removing peel ply - Wiping substrates acetone and dry - Plasma pre-treatment of the substrates,
changing the speed and number of passes - Place adhesive film onto one of the substrates - Add ballotini beads - Completion the joint assembly - Measurement bond line thickness before
curing - Curing at 120°C for 30 minutes - Cooling down below 70°C before removing
clamps - Measurement bond line thickness after curing
Table 18 Pre-treatment: plasma on bag side of the substrates
Pre-treatment type Steps pre-treatment
Plasma on bag side
- Wiping substrates acetone and dry - Plasma pre-treatment of the substrates,
changing the speed and number of passes - Place adhesive film onto one of the substrates - Add ballotini beads - Completion the joint assembly - Measurement bond line thickness before
curing - Curing at 120°C for 30 minutes - Cooling down below 70°C before removing
clamps - Measurement bond line thickness after curing
Table 19 Pre-treatment: manual abrasion on bag side of the substrates
Pre-treatment type Steps pre-treatment
Manual abrasion on bag side
- Wiping substrates acetone and dry - Abrasion of the substrates - Wiping substrates acetone and dry - Place adhesive film onto one of the substrates - Add ballotini beads - Completion the joint assembly - Measurement bond line thickness before
curing - Curing at 120°C for 30 minutes - Cooling down below 70°C before removing
clamps - Measurement bond line thickness after curing

55
Table 20 Pre-treatment: grit blasting on bag side of the substrates
Pre-treatment type
Steps pre-treatment
Grit blasting on bag side
- Wiping substrates acetone and dry - Grit blasting pre-treatment - Wiping substrates acetone and dry - Place adhesive film onto one of the substrates - Add ballotini beads - Completion the joint assembly - Measurement bond line thickness before
curing - Curing at 120°C for 30 minutes - Cooling down below 70°C before removing
clamps - Measurement bond line thickness after curing
Table 21 No pre-treatment, bag side: samples as received
Pre-treatment type Steps pre-treatment
No pre-treatment
Bag side,
samples as received
- Wiping substrates acetone and dry - Place adhesive film onto one of the
substrates - Add ballotini beads - Completion the joint assembly - Measurement bond line thickness before
curing - Curing at 120°C for 30 minutes - Cooling down below 70°C before removing
clamps - Measurement bond line thickness after curing
Joint assessment
Once the joint was assembled, the quality of the joints was assessed through
mechanical testing. The mechanical test was based on BS ISO 4587
“Adhesive – Determination of tensile lap-shear strength of rigid-to-rigid bonded
assemblies” (Figure 24) [72]. The machine used to carry out the static test was
a Zwick 100kN tensile machine.
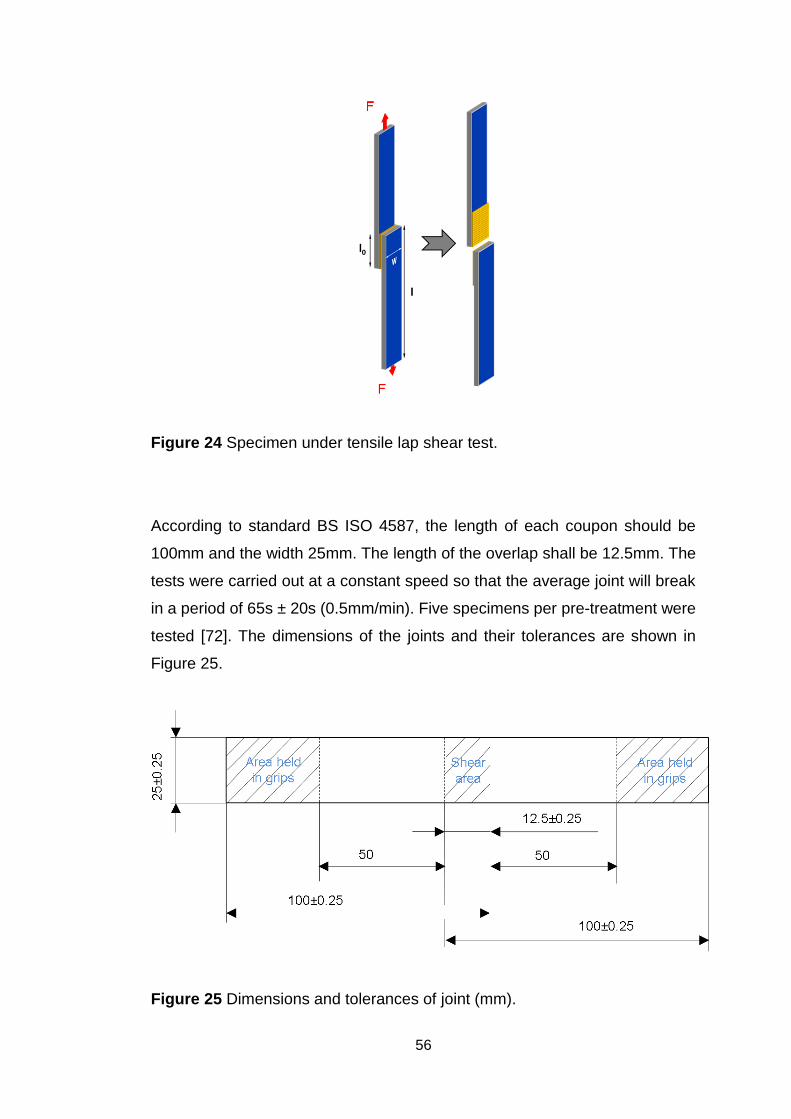
56
Figure 24 Specimen under tensile lap shear test.
According to standard BS ISO 4587, the length of each coupon should be
100mm and the width 25mm. The length of the overlap shall be 12.5mm. The
tests were carried out at a constant speed so that the average joint will break
in a period of 65s ± 20s (0.5mm/min). Five specimens per pre-treatment were
tested [72]. The dimensions of the joints and their tolerances are shown in
Figure 25.
Figure 25 Dimensions and tolerances of joint (mm).

57
Aluminium tabs were added to the specimens to avoid slipping during the
mechanical testing. The tabs were added to the specimens at the location of
the grips (see Figure 25). Therefore, the dimensions of each tab were 25mm
width and 50mm length.
Tabs were bonded using an adhesive that cures at or below the panel cure
temperature, and also below the curing temperature of the adhesive film used
to make the lap shear joint. This is to avoid adding undesirable postcure to the
panel and any effects in the film adhesive.
The adhesive used to bond the tabs onto the substrates was DP490, supplied
by 3M. DP490 is a two component epoxy adhesive that provides high quality
bonding performance. This adhesive cures at 80°C for one hour. Before
adding the tabs, each one was wiped with acetone to remove loosely attached
surface films as oils, dusts, mill-scale and all other surface contaminants.

58
Results and Discussion
The bonded joints were assessed using tensile lap shear tests, according to
the BS ISO 4587 standard [72] (detailed in subchapter 4.5). An assessment of
the different pre-treatments was carried out using lap shear strength (LSS)
values alongside a surface characterisation of the substrates (surface
roughness, surface tension measurements and analysis of potential chemical
changes).
The full data from LSS experiments are provided in Appendix B. These values
are shown in tables with the corresponding representation of load values
versus displacement.
This chapter presents a summary of the data obtained for joints which were
pre-treated using different methods followed by a discussion of the findings for
this investigation.
Joint assessment
Table 22 shows the different pre-treatments investigated in this research for
both sides of the composite coupons (peel ply side and bag side).
Table 22 Summary of Table 13: pre-treatment types
Pre-treatment type
Peel Ply + Manual Abrasion (Base line industry)
Peel Ply (Reference line)
Peel Ply + Plasma (Argon + Air)
Peel Ply + Grit Blasting (Base line industry)
Bag side + Plasma (Argon + Air)
Bag side + Manual Abrasion
Bag side + Grit Blasting
No pre-treatment
Bag side

59
Joint assessment, peel ply side
LSS values for peel ply, peel ply plus manual abrasion, peel ply plus plasma
and peel ply plus grit blasting pre-treatments are shown in Table 23. LSS
values are the result of the average of testing five specimens per
treatment/combination as established in the BS ISO 4587 standard. Values for
standard deviation (SD), which quantifies the amount of variation of a set of
data, and coefficient of variation (COV), the ratio of the SD to the mean, are
also presented.
For peel ply plus plasma pre-treatment, different joints were first bonded using
the extreme corners of the test matrix (Figure 26). The LSS values did not vary
significantly using these four different conditions (1pass-100mm/min,
5passes-100mm/min, 1pass-500mm/min and 5passes-500mm/min, shaded in
light green in Figure 26a). Therefore, the number of passes was increased to
10 passes, and the speed of the process to 1000mm/min, resulting in a new
test matrix (Figure 26b).
Figure 26 a. Test matrix plasma pre-treatment, b. New test matrix plasma pre-treatment.

60
Table 23 LSS values peel ply side using different pre-treatments
Peel Ply Side
Pre-treatment type LSS (MPa)
SD (MPa)
COV(%) Failure mode
Peel ply + manual abrasion 38.4 1.1 3.0 Cohesive Adhesive
Peel ply 33.3 0.9 2.7 Cohesive
Peel ply + grit blasting 39.9 1.4 3.5 Cohesive
Peel ply + plasma. Conditions: 1pass, 100mm/min 1pass, 500mm/min 1pass, 1000mm/min 5passes, 100mm/min 5passes, 500mm/min
10 passes, 100mm/min
34.1 35.1 32.7 36.7 33.6 35.3
1.3 0.7 0.7 0.8 0.8 0.5
3.8 1.9 2.1 2.1 2.3 1.4
Cohesive
Figure 27 represents the LSS values achieved treating the peel ply side of
the composite through the different pre-treatments.
Figure 27 LSS values versus pre-treatment type, peel ply side.
Before the discussion of results, Figures 28 to 31 illustrate some examples of
the failure mode of the different pre-treatments.

61
Figure 28 Failure of bonded sample S203-S204: peel ply side as received. Cohesive failure.
Figure 29 Failure of bonded sample S186-S187: peel ply side pre-treated through manual abrasion. Cohesive plus adhesive failure (slight delamination).
Delamination

62
Figure 30 Failure of bonded sample S210-S209: peel ply side pre-treated through grit blasting. Cohesive failure plus delamination.
Figure 31 Failure of bonded sample S153-S154: peel ply side pre-treated through plasma (conditions: 10 passes, 100mm/min). Cohesive failure.
Figure 27 shows that treating the peel ply surface of the samples using manual
abrasion (38.4MPa) and grit blasting (39.9MPa) produces an improvement of
15% and 20% respectively in the strength of the joints, compared to those just
with peel ply (33.3MPa).
During the removal of the peel ply, some synthetic peel ply cloth can remain
on the substrates. Through manual abrasion and grit blasting, these residues
Delamination

63
can be eliminated. In addition, through these processes, more resin in the
substrates is removed, and therefore the underlying composite fibres will be
highly exposed, leading to an improvement of the strength of the final joint.
The fibre exposure can be observed in Figure 29 (manual abrasion), and, more
noticeably, in Figure 30 (grit blasting).
Through grit blasting, the strength value was higher than for manual abrasion.
This is due to the nature of the process. During grit blasting, a gun is used to
propel blast media directly at the component, ensuring that the whole area will
be treated. Through manual abrasion, an even treatment over the whole area
is more difficult, due to the inconsistent manual nature of the process. It is also
important to highlight that through manual abrasion, the possible
contamination left after removing the peel ply may transfer to the abrasive
paper, and therefore it could be transferred to other areas on the surface,
rather than being removed.
The highest strength achieved using plasma pre-treatment was with 5 passes
at 100mm/min (36.7 ± 0.8 MPa), and the lowest value was reached at 1 pass
at 1000mm/min (32.7 ± 0.7 MPa). In all cases, it was noticed that the adhesive
always failed cohesively.
It is known that plasma pre-treatment is an excellent method for removing
contaminants from substrates prior to bonding. Comparing the strength values
achieved through pre-treating the samples with plasma against no pre-
treatment (ie just peel ply), there is no significant change in the LSS values.
This shows that the addition of peel ply during the manufacturing of the
composite part is very effective for preventing contaminants from being
integrated into the finished part.
Comparing manual abrasion against plasma, there is a slight improvement of
LSS when pre-treating the samples using manual abrasion. Due the nature of
the process, it is high likely that manual abrasion introduced a slight
modification at the end of the joint where the edges become rounded (Figure
32a). However, through plasma, the shape of the edges of the joints remained
the same as the original ones after the pre-treatment (Figure 32b).

64
An example to support this theory would be the modification of window profiles
in aircraft. In the past, the shape of aircraft windows was rectangular. However,
the shape was changed to oval, as it was proved that this shape had less
stress concentration around the edges of the windows and, therefore, offered
greater structural integrity [73].
This rounded or oval effect at the edges of the joints that were pre-treated
through manual abrasion (visible to the naked eye) could reduce the local load
stresses around the edges, resulting in a slight increase in the strength, as
observed in Table 23. However, this is just a possibility, and further analysis
should be carried out, as the SD of the samples that were pre-treated through
manual abrasion was slightly higher than those pre-treated through plasma.
Figure 32 a. Shape of the end of the joint through manual abrasion pre-treatment (slightly rounded); b. Shape of the end of the joint through plasma pre-treatment.
As discussed in Chapter 2, the adhesive bond line thickness (BLT) will have
an influence on joint strength. Therefore, the BLT was calculated by measuring
the thickness of the lap shear joints before and after curing the adhesive, using
a digital (Mitutoyo) micrometre (accuracy of ±2μm).
The general effect of increasing the BLT of an adhesive in single lap joints is
shown in Figure 33. It is noticeable that shear strength decreases if the layer
of the adhesive is thick. If the BLT is too thin, there will be a risk of incomplete
b. Plasma
a. Manual Abrasion

65
filling of the joint due to contact between high points on the joint substrates.
The shape of the curve will be affected by the type of adhesive. This curve is
characterised by an optimum BLT area. For each adhesive, the values within
this area will vary. In the case of epoxies, the optimum BLT area often varies
between 50-250μm [53].
Figure 33 Shear strength versus bond line thickness [53].
Table 24 shows the BLT of the specimens when pre-treating the peel ply side
with the different pre-treatments. BLT values are given by taking the average
measurements of five specimens. Figure 34 illustrates the influence of the
thickness of the film adhesive (ballotini beads added) on the joint strength.

66
Table 24 BLT lap shear joints peel ply side
Peel Ply Side
Pre-treatment type BLT
(mm) SD BLT*
(mm) LSS (MPa)
Peel Ply + Manual Abrasion 0.105 0.045 38.4
Peel Ply 0.195 0.025 33.3
Peel Ply + Grit Blasting 0.142 0.055 39.9
Peel Ply + Plasma. Conditions: 1pass, 100mm/min
1pass, 1000mm/min 5passes, 100mm/min 5passes, 500mm/min
10passes, 100mm/min
0.245 0.181 0.247 0.267 0.211
0.024 0.025 0.029 0.025 0.009
34.1 35.3 32.7 33.6 36.7
*The SD deviation is illustrated in Figure 34. However, some SD values are so small that cannot be noticeable due the markers on the graphic.
Figure 34 Influence of film adhesive thickness on LSS – peel ply side.
Figure 34 shows that the drop in strength occurs somewhere between 0.142
and 0.181mm. In thicknesses greater than 0.19mm, shear strength is roughly
constant.

67
Joint assessment, bag side
As mentioned in Subchapter 4.3.5, the bag side of the substrates was also
pre-treated and investigated. LSS values are given in Table 25.
Table 25 LSS values bag side using different pre-treatments
Bag Side
Pre-treatment type LSS (MPa)
SD (MPa) COV(%) Failure mode
Bag side + Plasma. Conditions:
1pass, 100mm/min 1pass, 500mm/min 1pass, 1000mm/min 5passes, 100mm/min 5passes, 500mm/min
10passes, 100mm/min
39.4 34.4 38.0 42.8 36.8 41.1
1.0 1.9 1.3 1.9 1.8 1.9
2.5 5.5 3.5 4.4 4.8 4.6
Cohesive Adhesive
Bag side + Manual Abrasion 34.7 1.7 4.8 Cohesive Adhesive
Bag side + Grit Blasting 40.8 0.5 0.5 Cohesive Adhesive
No pre-treatment
Bag side 17.4 1.4 8.1 Adhesive
Figure 35 represents the LSS values achieved when pre-treating the bag side
of the composite with the different pre-treatments.
Figure 35 LSS values versus pre-treatment type, bag side.

68
Figure 36 shows that the failure mode observed for the bag side with no pre-
treatment was adhesive in type. This means that the failure happened at the
interface between the adhesive and the adherent. This type of failure must be
avoided, as it is considered the result of a weak bond. This is the reason why
the value of LSS achieved was very low, reaching only 17MPa. Also, it is
possible to observe a significant number of voids at the failure interface,
making the joint relatively weak. The cause of these voids is unknown, but it
could be due to air entrapment during the bonding process.
Figure 36 Failure of bonded sample S225-S226: bag side, no pre-treatment. Adhesive failure.
As mentioned in Section 2.3, in some cases cohesive and adhesive failures
can happen in the same bond. This mixed-mode failure was experienced by
the samples that were pre-treated using grit blasting and manual abrasion.
Examples of this type of failure are shown in Figures 37 and 38.
Example area with voids

69
Figure 37 Failure of bonded sample S282-S283: bag side pre-treated through manual abrasion. Cohesive failure plus delamination (also adhesive failure but in much less proportion that the other failure modes).
Figure 38 Failure of bonded sample S216-S217: bag side treated through grit blasting. Cohesive failure and delamination.
The LSS value achieved for grit blasting was higher (40.8MPa) than for manual
abrasion (34.7MPa). As explained before, this could be due to the nature of
the process. Grit blasting provides more consistency than manual abrasion.
This fact can also be explained by comparing the SD of both processes, which
was 0.5MPa for grit blasting, and 1.7MPa for manual abrasion.
Delamination
Delamination

70
Delamination appears when pre-treating the bag side of the coupons using
manual abrasion and grit blasting (delamination is boxed in orange on Figures
37 and 38). Comparing this against bag side without any pre-treatment (Figure
36), two different colours are noticeable in Figures 37 and 38 at the failure
interface. Light grey could represent the cohesive failure through the adhesive,
while yellow could indicate adhesive plus the epoxy of the composite
(adhesive pulls some of the resin off). The amount of resin on the bag side of
the laminates is higher than on the peel ply side. This could be the reason why
the yellow colour is only noticeable at the failure interface on the bag side of
the samples (pre-treating them through manual abrasion, grit blasting, and
plasma).
Samples treated with plasma showed a very real improvement, achieving the
highest strength of 42.8MPa when treating the samples with plasma at
100mm/min and 5 passes (same conditions that the highest value was
obtained when treating the peel ply side of the material). Samples treated with
plasma also presented a mixed-mode failure. An example is shown in Figure
39.
Figure 39 Failure of bonded sample S264-S263: bag side treated through plasma (conditions: 10passes, 100mm/min). Cohesive failure plus slight delamination.
Delamination

71
This improvement by treating the bag side of the samples (17.4MPa) with
plasma (highest achieved value 42.8MPa) shows the effectiveness of the
plasma pre-treatment as a preparation method. During the manufacturing of
composite laminates, the bag side was covered by a layer of release film, as
shown in Figure 12 (Chapter 4). This means that the bag side of the laminate
was not protected from contamination during the manufacturing process.
Therefore, the possibility of the laminate being contaminated appears during
the manufacturing process, and increases during the storage period of the
laminate prior to bonding. The thicker, “less stiff” layer of resin and adhesive
on the bag side of the samples could also be another explanation for this
improvement, as this layer has greater capacity to take up more strain.
Table 26 shows the BLT of the specimens when treating the bag side using
the different pre-treatments. Figure 40 represents the influence of the
thickness of the film adhesive (ballotini beads added) on the joint strength. As
observed in this figure, all the BLT measurements are between 0.05-0.12mm
and therefore, it is difficult to observe a clear trend. BLT measurements for the
peel ply side (Figure 34) shows a clearer trend as the measurements area is
wider (~0.3mm).
Table 26 BLT lap shear joints bag side
Bag Side
Pre-treatment type BTL
(mm) SD BLT*
(mm) LSS
(MPa)
Bag side + Plasma. Conditions:
1pass, 100mm/min 1pass, 500mm/min
1pass, 1000mm/min 5passes, 100mm/min 5passes, 500mm/min
10passes, 100mm/min
0.101 0.066 0.081 0.051 0.074 0.097
0.025 0.018 0.021 0.019 0.021 0.041
39.4 42.8 41.1 34.4 36.8 38.0
Bag side + Manual Abrasion 0.113 0.027 34.7
Bag side + Grit Blasting 0.128 0.010 40.8
Bag side 0.070 0.015 17.4 *The SD deviation is illustrated in Figure 40. However, some SD values are so small that cannot be noticeable due the markers on the graphic.

72
Figure 40 Influence of film adhesive thickness on LSS – bag side.
Surface characterization
The pre-treatment effects in the joints were assessed in terms of mechanical
performance (LSS values) and also by using three different surface
characterization methods. The methods employed were roughness
assessment, X-ray photoelectron spectroscopy analysis and wettability study.
These techniques are discussed in more detail in the following subchapters.
Roughness assessment
Surface texture of the samples was measured using a calibrated Taylor
Hobson Form Talysurf Intra 50 Surface Profilometer. The profilometer is
housed on a granite slab to dampen vibrations. A Gaussian filter was applied
to separate waviness and roughness profiles.
One of the most common parameters used to measure surface roughness is
the arithmetic average roughness (Ra). Ra represents the average value of
individual heights and peaks in a surface topology, from the mean line,
recorded within the sampling length. Figure 41 illustrates an example of the
roughness profile taken from one of the samples studied in this research.

73
Figure 41 Surface roughness profile of sample without peel ply and no pre-treatment.
Evaluation lengths were selected based on the surface Ra values according to
BS ISO 4288-1996 [74] .The sampling length (lr) was 2.5mm and the number
of sampling lengths was five, making this a total of 12.5mm roughness
evaluation length (ln). Three different roughness measurements were taken
per sample.
Table 27 gives, and Figure 42 represents, the average Ra values obtained
after the roughness assessment of the different pre-treatments for the peel ply
side of the adherents.
Table 27 Ra values, peel ply side, different pre-treatments
Peel Ply Side
Pre-treatment type Ra (µm) SD (µm) COV (%)
Peel Ply 7.465 0.262 3.51
Peel Ply + Manual Abrasion 4.253 1.153 27.11
Peel Ply + Grit Blasting 7.653 0.263 3.43
Peel Ply + Plasma. Conditions: 1pass, 100mm/min 1pass, 500mm/min
1pass, 1000mm/min 5passes, 100mm/min 5passes, 500mm/min
10passes, 100mm/min
7.918 7.804 8.175 7.753 7.203 7.871
0.286 0.303 0.891 0.975 0.492 0.122
3.61 3.88 10.89 12.57 6.83 1.55

74
Figure 42 Average roughness Ra of different pre-treatments on peel ply side.
Figure 43 compares the Ra values obtained for each pre-treatment type
against the results of the shear strength for the peel ply side. Figure 43 shows
that the lowest shear strength value (32.7MPa for treatment using plasma 1
pass and 1000mm/min) was achieved with the highest roughness value, Ra
=8.1µm. The higher shear strength (39.9MPa for treatment using peel ply plus
grit blasting) was obtained with a roughness of Ra = 7.653µm. The second
highest shear strength value (38.4MPa for manual abrasion) was obtained
with the lowest roughness value Ra = 4.2µm.
The work carried out by Matienzo et al. [16] and Wingfield et al. [17] showed
that increasing the roughness of the surface led to stronger joints. However,
the investigations done by Boutar et al. [75] showed that by increasing the
roughness of the adherents, a decrease in the lap shear strength occurs.
Boutar et al. found that specimens abraded with P1000 abrasive paper, which
gave a roughness of 0.6µm, were much stronger than the ones abraded with
P500, which gave a roughness of 3µm (material used in this investigation was
an aluminium-copper alloy).

75
Figure 43 Average roughness Ra of different pre-treatments on peel ply side compared to LSS values (standard deviation for LSS is shown).
For the pre-treatments and combination conditions for the peel ply side of the
substrates under study in this research, the effect of roughness measured did
not have a major impact on the strength. Looking at the LSS values, the
adhesive used in this research was very good at wetting the surfaces,
regardless of roughness.
The same roughness assessment was carried out for the bag side of the
adherents. Table 28 and Figure 44 represent the average Ra values obtained
after the roughness assessment of the different treatments.
Table 28 Ra values bag side different pre-treatments
Bag Side
Pre-treatment type Ra
(µm) SD (µm) COV (%)
Bag side + Manual Abrasion 4.192 0.481 11.47
Bag side + Grit Blasting 8.556 0.364 4.25
Bag side + Plasma. Conditions: 1pass, 100mm/min 1pass, 500mm/min 1pass, 1000mm/min 5passes, 100mm/min 5passes, 500mm/min
10passes, 100mm/min
7.605 7.252 7.861 7.427 7.583 7.979
0.336 0.589 0.543 0.541 0.396 0.206
4.41 8.12 6.91 7.28 5.22 2.58
Bag side 7.842 0.563 7.17

76
Figure 44 Average roughness Ra of different pre-treatments on bag side.
Figure 45 compares the Ra values obtained for each treatment type against
the results of the shear strength for the bag side of the substrates.
Figure 45 Average roughness Ra of different pre-treatments on peel ply side
compared to LSS values (standard deviation for LSS is shown).
Figure 45 shows that the lowest shear strength value (17.4MPa for bag side
without any treatment) was achieved with a roughness value of Ra = 7.842µm.
In contrast, the higher shear strength value (42.8MPa for treatment using
0123456789
10
Ra (
μm
)

77
plasma 5passes and 100mm/min) was obtained with a roughness of Ra =
7.427µm.
The same outcome found on the peel ply side was observed for the bag side
of the substrates, where the effect of roughness measured did not have a
major impact on LSS strength.
When comparing both sides of the composite, it is possible to highlight that
manually abrading the surfaces produces a decrease in the original roughness
of both sides. Ra for the peel ply side has an average of 7.465μm, and after
manual abrasion the Ra decreases to 4.253μm. The same effect was observed
for the bag side of the composite, where Ra is 7.842μm, and this value dropped
to 4.192μm after manual abrasion. The drop in the Ra values is due to the
manual operation, which reduces the height of the original peaks.
Comparing the Ra values for all the pre-treatments for both sides, it is
noticeable that the values for each pre-treatment/composite side are quite
similar. However, checking the surface roughness profile for both sides, the
pattern is different for each side. An example is illustrated in Figure 46.
Figure 46 Ra values (left) and surface roughness profile for bag side (no pre-treatment involved) and peel ply side (right).
0
1
2
3
4
5
6
7
8
9
Side of the composite
Ra
(μm
)
Peel ply side Bag side
Peel ply side
Bag side

78
The Ra value for the peel ply side of the composite is 7.465μm with a LSS
value of 33.3MPa. The bag side, without any pre-treatment, has a Ra value of
7.842μm; however, its LSS value is quite low (17.MPa) compared to the
33.3MPa achieved for the peel ply side.
Ra values only give information about the roughness deviation from the centre
line. However, they do not give any information on how that deviation is
distributed. The mean spacing at the mean line roughness parameter (RSm)
expresses the mean of the width of the profile curve elements in a sampling
length. Looking at Figure 46, the surface roughness profile of the bag side has
a few large peaks, so the RSm value is higher (1768.42μm) than the value
obtained for the peel ply side (486.91μm), which has small peaks. Rsm
essentially means peak spacing, so the higher the value the few the number
of peaks (and vice versa). This parameter explains why the surface roughness
profile of these two sides is different.
X-ray photoelectron spectroscopy (XPS) analysis
XPS is a technique that measures the elemental composition of the elements
that exist at the surface in a material. It is an excellent way to analyse the
changes in surface chemistry after exposing substrates to a treatment.
XPS spectra are generated by bombarding the surface of a material with a
beam of X-rays. As the X-rays hit the surface, it emits electrons and kinetic
energy, which can be measured to create the spectrum. Emission of electrons
occurs over a range of different electron kinetic energies which can be
recorded to produce a photoelectron spectrum. Each peak represents
electrons off a particular characteristic energy emitted from the atoms. Each
element has specific binding energy (BE), is the energy required to remove an
electron from the atom or molecule. The energies and intensity of the
photoelectron peaks enable identification and quantification of all surface
elements (except hydrogen) [50, 76].

79
Chemical changes of the substrates were analysed using a VG Scientific
ESCALAB MkII fitted with a Thermo Scientific Alpha 110 analyser and a
Thermo Scientific XR3 digital X-ray source. Spot analysis on the samples was
performed using an X-ray spot size of 3mm. The methodology employed in
this analysis consisted of a low resolution survey scan with a pass energy of
300eV and 5 scans followed by a series of high resolution scans spanning
each element detected in the survey with pass energies of between 20 and
80eV depending on element intensity.
The chemical composition of the pre-treated samples for both surfaces, peel
ply and bag side, is presented in Table 29 and 30.
In these tables the calculation of hydrogen does not appear as XPS does not
detect hydrogen as it does not possess core electrons [77].
Figure 47 and Figure 48 illustrates the X-ray photoelectron spectroscopy
spectra of the surfaces treated (LSS values are also included in the table for
comparison purposes). Appendix C collects the individual spectrum of each
treatment, with their corresponding binding every value and the atomic
concentrations.
Table 29 LSS values and XPS atomic concentrations of surface pre-treated peel ply side
Peel ply side
Pre-treatment type
LSS (MPa)
Atomic concentration (%)
C O N S Si Zn
PP 33.3 75.66 13.14 - 2.34 1.39 1.15
PP+Grit blast 39.9 61.81 22.41 8.91 2.76 0.72 0.17
PP+Plasma 5passes,100mm/min
36.7 37.90 36.71 12.84 6.30 1.03 -
PP+Plasma 1pass,1000mm/min
32.7 51.50 30.21 4.61 0.91 0.44 0.22

80
Figure 47 XPS spectra of surface pre-treated peel ply side: (a) peel ply+plasma, 1pass-1000mm/min; (b) peel ply+plasma, 5pass-100mm/min; (c) peel ply + grist blasting; (d) peel ply as received.
Carbon, oxygen, nitrogen and sulphur are elements expected to be present in
epoxy composite resin. Small traces of silicon and zinc were also found in the
peel ply surface. The concentration of these elements (Si and Zn) dropped
after pre-treating the samples through grit blasting and plasma.
Through plasma pre-treatment is possible to see the oxidation effect as the
surface oxygen concentration increased from 13% to 37%.

81
Table 30 XPS atomic concentrations of surface pre-treated bag side
Bag side
Pre-treatment type
LSS (MPa)
Atomic concentration (%)
C O N F S Si
As received 17.4 55.43 14.57 6.77 20.03 1.59 1.61
BS+Grit blast 40.8 66.77 21.96 7.49 - 2.74 1.04
BS+Plasma 5passes,100mm/min
42.8 35.45 32.79 13.11 9.77 7.03 1.85
BS+Plasma 1pass,1000mm/min
38 39.77 18.43 8.98 29.32 1.75 1.75
Figure 48 XPS spectra of surface pre-treated bag side: (e) bag side+plasma, 1pass-1000mm/min; (f) bag side+plasma, 5pass-100mm/min; (g) bag side+grist blasting; (h) bag side untreated.
For the bag side of the samples (before any pre-treatment) a measurable
concentration of fluorine (F) was identified on the surfaces (20%). This fluorine
is attributed to fluoropolymer from the release film used during the
manufacturing of the composite laminates. This finding has been reported by
other researchers in the field [78].
(e)
(f)
(g)
(h)
(e)
(f)
(g)
(h)
S Si
O O
N C
F1S FKLL
OKLL

82
Checking Table 29 it was not possible to observe fluorine on the surfaces pre-
treated through peel ply as the use of peel ply (as discussed several time along
this thesis) prevents the occurrence of initial contamination.
Grit blasting pre-treatment was also successful in removing the fluorine. For
the pre-treating of the surfaces using plasma, two conditions were analysed:
the fastest pre-treatment (1pass, 1000mm/min) and the slowest one (5passes,
100mm/min). For the fastest period, the plasma did not have any effect for the
removal of fluorine. In fact, the value of fluorine was higher (29.3%) than the
one obtained for the bag side of the samples without any pre-treatment (20%).
In contrast, pre-treating the samples at lower speed (100mm/min) and
increasing the number of passes from one to five produced a decrease in the
fluorine concentration from 20% (no pre-treatment) to 10%. This fact shows
again the efficiency of plasma as a surface cleaning method.
Wettability study
As explained in subchapter 2.1.3, the wettability is the capability of a liquid to
wet and spread on a solid surface. This characteristic can be quantified
measuring the contact angle formed by a liquid when is placed in a solid
surface.
Young’s equation [Formula 1] shows that there is a relationship between the
contact angle (Ɵ), the surface free energy of the liquid (γl) and of the solid (γs)
and the interfacial tension between the liquid and the solid (γsl) [32].
γ𝑠 = γ𝑠𝑙 + γ𝑙 × 𝑐𝑜𝑠𝜃 [Formula 1]
Contact angles were measured using a Drop Shape Analyser DSA100 from
Kruss. Two solvents were employed to calculate the contact angles; water and
di-iodomethane. As shown in Figure 4, when a liquid is applied and does not
spread, a drop with a specific contact angle on the surface will be created.

83
Calculation of the contact angles was made measuring three different points
on the samples with each solvent. Through the contact angles, the surface
free energies were calculated using the Fowkes method in which surface free
energy can be expressed by two components, the dispersive energy and the
polar energy. The dispersive energy can be related to the surface roughness
or topography; while the polar energy can be associated to the chemistry of
the surface.
Table 31 and Figure 49 collect and represent respectively the values of the
dispersive and polar components and the total surface free energy for the peel
ply side (Table 31 also shows the LSS values for comparison purposes).
Table 31 Dispersive and polar components, and surface free energy values peel ply side with LSS values
Peel Ply Side
Pre-treatment type Surface energy (mN/m) LSS (MPa) γd * γp * γ *
Peel Ply + Manual Abrasion 45.62 0.78 46.40 38.4
Peel Ply 16.39 3.63 20.02 33.3
Peel Ply + Plasma. Conditions:
1pass, 100mm/min 1pass, 500mm/min
1pass, 1000mm/min 5passes, 100mm/min 5passes, 500mm/min
10passes, 100mm/min
37.63 38.26 24.19 33.45 33.62 33.12
23.53 21.67 27.17 15.81 19.26 23.29
61.16 59.93 51.36 49.26 52.88 56.41
34.1 35.1 32.7 36.7 33.6 35.3
Peel Ply + Grit Blasting 43.25 4.13 47.38 39.9
*γd: dispersive component; γp: polar component; γ: surface free energy
The SD deviation is not illustrated in Figure 49 as only one measurement per pre-treatment was taken.

84
Figure 49 Comparison of surface free energy of the different pre-treatments on the peel ply side.
Looking at Figure 49, little polar contribution was found for grit blasted and
manual abraded samples. These pre-treatments presented significantly higher
surface free energy when compared with the peel ply samples (this is due to
the improvement of the dispersive component in both pre-treatments).
In the samples that were pre-treated through plasma, a significant
improvement in the surface free energy was observed. This is mostly through
an increase in the polar component of the surface. This could imply two
possible mechanisms; either the dispersive component (nonpolar) is being
removed by plasma, or it is being functionalised by active species in the
plasma.
Compared to the other pre-treatments, peel ply presented the lowest surface
free energy (~20mN/m). However, the LSS value for the peel ply samples was
similar to the LSS values obtained when pre-treating the samples through
plasma (where the highest surface free energies were obtained). The surface
free energy values did not have a direct impact in the strength of the joints.
This indicates that once the surface possesses good wetting capability for the
adhesive, there is no real relationship between bond strength and surface free
energy.

85
The bag side of the adherents was also studied. Table 32 and Figure 50
display the values of the dispersive and polar components, and the total
surface free energy for the bag side; Table 32 shows also the LSS values for
comparison purposes.
Table 32 Dispersive and polar components, and surface free energy values bag side with LSS values
Bag Side
Pre-treatment type Surface energy (mN/m) LSS (MPa) γd * γp * γ *
Bag side + Plasma. Conditions: 1pass, 100mm/min 1pass, 500mm/min
1pass, 1000mm/min 5passes, 100mm/min 5passes, 500mm/min
10passes, 100mm/min
20.89 13.46 25.89 33.31 20.07 31.18
33.83 17.28 4.09 7.85
27.35 22.24
54.71 30.74 29.98 41.16 47.42 53.42
39.4 34.4 38.0 42.8 36.8 41.1
Bag side + Manual Abrasion 30.97 3.37 34.34 34.7
Bag side + Grit Blasting 47.68 3.18 50.87 40.8
Bag side 19.97 0.52 20.50 17.4
*γd: dispersive component; γp: polar component; γ: surface free energy
The SD deviation is not illustrated in Figure 50 as only one measurement per pre-treatment was taken.
Figure 50 Comparison of surface free energy of the different pre-treatments on the bag side.

86
Figure 50 shows that both manually abraded and grit blasted samples exhibit
higher total surface free energy compared to the samples without any pre-
treatment. Comparing these pre-treatments (manual abrasion and grit
blasting) against samples pre-treated through plasma, it is possible to observe
an increase of the polar component and a decrease of the dispersive
component. It is noticeable with the samples that were pre-treated with one
plasma pass, that when decreasing the speed of the process, the polar
component increases.
The lowest surface free energy value corresponded to the samples without
any pre-treatment. These set of samples had the lowest LSS value due to
contamination by fluorine found through XPS analysis, and the voids at the
failure interface.
Adhesive void calculation The void content at the joining interface may significantly affect the final
strength of the joint. Computerised tomography (CT) was employed as non-
destructive testing (NDT) technique to detect the voids at the bond line. This
non-destructive test was carried out before the destructive testing (lap shear
test).
CT imaging is a NDT technique which uses X-rays to create 2D and 3D
sectional images of an object. These CT images can provide various
characteristics about the internal structure of an object including defects,
dimensions, shapes and density. This is achieved by passing an array of X-
rays through an object and placing a series of detectors on the opposite side
of the object which pick up the change in density or attenuation of these X-
rays while they pass through the object.
Four samples were scanned to check the void content at the joining line. The
equipment used was a HMXCT 225kV system from NIKON. This system
possesses X-ray equipment that is capable of producing very small focal spots
which are in the micro-focus range. This small focal spot size enables the

87
system to have high magnification levels which produce very high resolution
CT scans.
Table 33 shows the samples scanned through CT and their void content. The
void content was calculated through the software “Volume Graphics Software”
(VGStudioMax 2.1) using the defect detection tool module to obtain the
relevant information about voiding.
Table 33 Void content joint samples
Sample designation
Treatment Type Void content (%)
S122-S123 Peel Ply side
7.09
S124-S125 8.04
S126-S127 Peel Ply side + plasma (5passes, 500mm/min)
8.01
S128-S129 9.55
Figure 51 shows an example of a CT scan of one of the joints assessed (S128-
S129). In this figure, the white dots at the bonding area represent the ballotini
beads added before the assembly of the joint. The black dots are the voids
present at the bonding interface. It can be seen that the areas and size of the
voids are not homogenous along the bonding interface.
Figure 51 CT scan of the bonded area of sample S128-S129.

88
There is no specific standard that defines the allowed void content in
components. The permitted porosity will depend on the component, its loading
and the distribution of the porosity within the component. The aerospace
industry is more restricted than the other industries in terms of void content;
where more than 4% should be avoided (ideal situation would be 0%).
In this case, the samples assessed through CT had a void content in the range
between 7-9.5%. In order to reduce the void concentration, a press to apply
heat and pressure for the bonding can be used.
Figure 52 illustrates one of the images taken using VGStudioMax software.
Figure 52 S128-S129 Void calculation using VGStudioMax 2.1.

89
Conclusions
The use of cold atmospheric plasma pre-treatment can be extended to new
industrial areas of investigation, where different companies have already
shown their interest, such as HEXCEL, Bombardier, and Rolls-Royce.
It is known that the addition of the peel ply during the manufacturing
process of composites protects the components from contamination. This
has been proved by comparing the LSS values achieved for both sides of
the composites. The bag side of the composites does not have the peel ply
protection during the manufacturing process, and therefore this side is
prone to contamination. This fact can be observed through the XPS
analysis, where fluorine (coming from the release film used during the
manufacturing process) is transferred to the composite side. Fluorine was
not found in the peel ply side of the composite. The contamination of the
bag side of the laminates (ie no peel ply) increases during the storage
period of the composite components prior to bonding. Protecting the
composite laminates with peel ply doubles the performance of the joint,
making them 52% stronger.
In the aerospace industry, the peel ply technique is widely used, either
separately or in combination with mechanical roughening techniques
(manual abrasion or grit blasting). This investigation has demonstrated that
the strength of the joints is higher when combining peel ply with manual
abrasion and grit blasting, rather than when using peel ply alone. Through
these mechanical roughening techniques, the remains of the peel ply,
coming from the removal of this ply, can be eliminated. Also, these
techniques remove more resin from the substrates, and therefore, the
underlying composite fibres will be highly exposed, leading to an
improvement of the strength of the joint. When comparing grit blasting and
manual abrasion, the strength value is higher for grit blasted samples than
the abraded ones. This is due to the nature of the process. Through manual
abrasion, an even treatment over the whole area is more difficult, due to

90
the inconsistent manual nature of the process. It is also important to
highlight that through manual abrasion, the possible contamination left
after removing the peel ply may transfer to the abrasive paper, and
therefore could be transferred to other areas on the surface, rather than
being removed.
The strength of the bag side of the composites without any pre-treatment
is increased by pre-treating the samples through manual abrasion, grit
blasting, and plasma. It was observed that grit blasting and plasma pre-
treatments (lowest speed process and 5 passes) were effective as cleaning
methods, as there was no evidence of fluorine on the grit blasted samples,
and the concentration of fluorine dropped considerably for the plasma pre-
treated samples.
The surface resulting from the tool can be characterised for the particular
process used. However, this varies widely, and transfer levels change such
that testing done on a tool surface is highly specific to the particular
conditions used.
Plasma pre-treatment of the peel ply side of the composite did not show a
significant change in the LSS values compared with the samples just pre-
treated with peel ply. Different plasma parameters have been varied in this
research (number of passes and speed of the process). It was found that
the highest LSS values for both sides of the composite material were
achieved using the same conditions: five passes and 100mm/min (the
lowest speed process selected for this research). For the peel ply side of
the composite, the strength of the joints was improved by 10% compared
with the samples with only peel ply. For the bag side of the composite, the
strength of the joints without pre-treatment increased from 17.4MPa to
42.8MPa while pre-treating the bag side with plasma. This improvement is

91
essentially due to the effectiveness of the plasma as a cleaning method;
as mentioned before, the bag side of the composite is prone to be
contaminated as it is not protected prior to bonding. The key differentiator
between both sides is their cleanliness.
The effect of roughness measured did not have a major impact on the
strength. The adhesive used in this research was very good at wetting the
surfaces, regardless of roughness. For both sides, manual abrasion
creates a surface that appears to be less rough than the substrate without
pre-treatment. This is due to the nature of the process, as manual abrasion
reduces the height of the original peaks.
The surface free energy values did not have a direct impact on the strength
of the joints. This indicates that once the surface possesses good wetting
capability for the adhesive, there is no real relationship between bond
strength and surface free energy.
All the pre-treatments studied in this research have shown their
effectiveness in removing contaminants. However, it is important to
highlight that the failure mode in all the cases (except for the bag side of the
samples without any pre-treatment) was cohesive, meaning that the
adhesive failed. Therefore, it is difficult to understand the joint performance,
as the adhesive is the limiting factor. More work will be carried out in the
near future using a stronger adhesive which leads to failure at the interface
between the adhesive and the adherent (adhesive failure).

92
References
[1] Soutis, C. (2005) ´Fibre Reinforced Composites in Aircraft Construction´, Progress in
Aerospace Sciences, 41 (2), pp. 143-151.
[2] Park, S. Choi, W. Choi, H. Kwon, H. and Kim, H. (2010) ´Recent Trends in Surface
Treatment Technologies for Airframe Adhesive Bonding Processing: A Review
(1995-2008)´, Journal of Adhesion, 86 (2), pp. 192-221.
[3] Matthews, F. and Rawlings, R. ´Composites Materials: Engineering and Science´.
London: Woodhead Publishing Limited, pp. 31.
[4] HEXCEL Composites (2008). Available at: http://www.hexcel.com
[5] Sharma, M. Gao, S. Mader, E. and Bijwe, J. (2014) ´Carbon Fiber Surfaces and
Composite Interphases´, Compos Sci Technol, 102, pp. 35–50.
[6] Hull, D. and Clyne, T. (1996) ´An Introduction to Composite Materials´, Cambridge
Solid State Science Series.
[7] HEXCEL Composites (2008). Available at:
http://www.sec.gov/Archives/edgar/data/717605/000110465908021748/a08-
9785_1defa14a.htm (Accessed: April 2008).
[8] Tserpes, I. and Pantelakis, S. (2013) ´Adhesive Bonding of Composite Aircraft
Structures: Challenges and Recent Developments´, Science China. Airworthiness
and Fatigue.
[9] Chang, T. (1998) ´Plasma Surface Treatment in Composites Manufacturing´, Journal
of Industrial Technology, 15 (1).
[10] Gower, M. and Broughton B. ´Preparation and Testing of Adhesive Joints. Good
Practice Guide No.47´, Adhesive Design Toolkit.
[11] Matthews, F. Kilty, P. and Godwin, E. (1982) ´A Review of the Strength of Joints in
Fibre-Reinforced Plastics. Part 2. Adhesively Bonded Joints´, Composites, 13 (1), pp.
29-37.
[12] British Standard BS ISO 4588 and American Standard ASTM D2651 ´Adhesives –
Guidelines for the surface preparation of metals´, and BS ISO 13895 or ASTM D2093
´Adhesives – Guidelines for the surface preparation of plastics´.
[13] Molitor, P. Barron, V. and Young, T. (2001) ´Surface Treatment of Titanium for
Adhesive Bonding to Polymer Composites: a Review´, International Journal of
Adhesion and Adhesives, 21 (2), pp. 129-136.

93
[14] Zaldivar, R. Nokes, J. Steckel, G. Kim,H. and Morgan,B. (2010) ´The Effect of
Atmospheric Plasma Treatment on the Chemistry, Morphology and resultant
Bonding Behaviour of a PAN-based Carbon Fiber-Reinforced Epoxy Composite´,
Journal of Composite Materials, 44 (2).
[15] Sanchez, J. Urena, A. Lazcano, S. and Blanco, T. (2015) ´New Approach to Surface
Preparation for Adhesive Bonding of Aeronautical Composites: Atmospheric
Pressure Plasma. Studies on the Pretreatment Lifetime and Durability of the
Bondline´, Composites Interfaces, 22 (8), pp. 731-732.
[16] Matienzo, L. Venables, J, Fudge, J. and Velton, J. (1985) ´Surface Preparation for
Bonding in Advanced Composites. Part I: Effect of peel ply materials and mold
release agents on bond strenght´, 30th National Symposium, pp.302.
[17] Wingfield, J. (1993) ´Treatment of Composite Surfaces for Adhesive Bonding´,
International Journal of Adhesion and Adhesives, 13 (3), pp. 151-156.
[18] Wenz, R. and Pocius, A. (1985) ´Mechanical Surface Preparation of graphite-epoxy
composites´, SAMPE, Sep/Oct:50.
[19] Hart-Smith, L. Redmond, G. and Davis, M. (1996) ´The Curse of Nylon Peel Ply´,
Douglas Aerospace and Royal Australian Air Force, 41st SAMPE International
SYMPOSIUM and Exhibition, California. Available at:
http://www.adhesionassociates.com/papers/35%201996%20Curse%20of%20Nylon
%20Peel%20Ply,%20SAMPE%20(Anaheim)%20MDC%20950072.pdf.
[20] Head, P. and Hollaway, L. (2001) ´Advance Polymer Composites and Polymers in the
Civil Infrastructure´, Oxford: Elsvier Science, First edition, pp. 121-123.
[21] Flinn, B. Clark, B. Satterwhite, J. and Van Voast, P. (2007) ´Influence of Peel Ply of
type on Adhesive Bonding of Composites´, SAMPE Annual Technical Conference
(Baltimore).
[22] Kinloch, A. (1987) ´Adhesion and Adhesives´, British Polymer Journal, 20 (3), pp.
123-127.
[23] Waghorne, R. and Parker, B. (1982) ´Surface Treatment of Carbon Fibre Reinforced
Composites for Adhesive Bonding´, Composites, 13 (3), pp. 280-288.
[24] Stone, M. (1981) ´Effect of the Degree of Abrasion of Composite Surfaces on the
Strengths of Adhesively Bonded Joints´, International Journal of Adhesion and
Adhesives, 1 (5), pp. 271-272.
[25] BTG Labs and Abaris Training , ´Webinar: Measuring Surface Energy in
Manufacturing and Repair of Composites to Assure Quality of Bonded Interfaces´.
Available at:

94
https://attendee.gotowebinar.com/recording/viewRecording/15191098285576360
99/6105965576695229452/[email protected].
[26] Hart-Smith, L. Redmond, L. and Davis, M. (1996) ´The Curse of the Nylon Peel Ply
(Mc Donnell Douglas Aerospace and Royal Australian Air Force)´, 41st Sampe
International Symposium and Exhibition, (California).
[27] Eliezer, S. and Eliezer, Y. (1989) ´The Fourth State of Matter: An Introduction to the
Physics of Plasma´, (Bristol and Philadelphia).
[28] Chang, J. and Chen, F. (2002) ´Principals of Plasma Processing´, Los Angeles: Plenum
/ Kuvler Publishers.
[29] Scott, W. (2013) ´PhD Thesis: Surface Modification by Atmospheric Pressure Plasma
for Improved Bonding´, University of California.
[30] Selwyn, G. Herrmann, H. Park, J. and Henins, I. (2001) ´Materials Proccesing using
an Atmospheric Pressure, RF-Generated, Plasma Source´, Contributions to Plasma
Physics, 41 (6), pp. 610-619.
[31] Strobel, M. Lyons, C. and Mittal, K. (1994) ´Plasma Surface Modification of
Polymers: Relevance to Adhesion´, (The Netherlands).
[32] Shaw, S. Comyn, J. and Mascia, L. (1996) ´Surface Treatment and Bonding of
Thermoplastic Composites´, 83rd Meeting of the AGARD SMP on "Bolted/Bonded
Joints in Polymeric Composites, (Italy).
[33] Hart, R. ´Contact Angle Goniometers´. Available at: http://www.ramehart.com/
contactangle.htm.
[34] Sato, C. Sekiguchi, Y. Okamoto, H. Shimamoto, K. Katano, M. Naito, K. Kuratani, Y.
Okayama, T. Katano, A. Hamaguchi, Y. Kufumoto, T. and Furukawa, K. (2014)
´Evaluation of Surface Treatments for Adhesion of Thermoplastics Composites for
Automotive Use´, ECCM16-16th European Conference on Composite Materials,
(Spain).
[35] Kusano, Y. Mortensen, H. Stenum, B. Kingshott, P. Andersen, T. and Brondsted, P.
(2007) ´Atmospheric Pressure Plasma Treatment of Glass Fibre Composite for
Adhesion Improvement´, Plasma Processes and Polymers, vol. 4.
[36] Palleiro, C. Stepanov, S. Rodriguez-Senin, E. Wilken, R. and Ihde, J. (2015)
´Atmospheric Pressure Plasma Surface Treatment of Thermoplastic Composites for
Bonded Joints´, 20th International Conference on Composite Materials, (Denmark).

95
[37] Blackman, B. Kinloch, A. and Watts, J. (1994) ´The Plasma Treatment of
Thermoplastic Fibre Composites for Adhesive Bonding´, Composites, 25 (5), pp.
332-341.
[38] Benedictus, R. Bhowmik, S. and Iqbal, H. (2010) ´Surface Modification of High
Performance Polymers by Atmospheric Pressure Plasma and Failure Mechanism of
Adhesive Bonded Joints´, International Journal of Adhesion and Adhesives, vol. 30,
pp. 418-424.
[39] Noeske, M. Degenhardt, J. Strudthoff. S and Lommatzsch. U (2004) ´Plasma Jet
Treatment of five Polymers at Atmospheric Pressure: Surface Modification and the
Relevance for Adhesion´, International Journal of Adhesion and Adhesives, vol. 24,
pp. 171-177.
[40] Zaldivar, R. Kim, H. Steckel, G. and Patel, D. (2011) ´Surface Preparation for
Adhesive Bonding of Polycyanurate-based fiber-reinforced Composites using
atmospheric plasma treatment´, Journal of Applied Polymer Science, vol. 120, pp.
921-931.
[41] Barankova, H. and Bardos, L. (2010) ´Cold atmospheric plasma: sources, process
and applications´, Thin Solid Films, vol. 518, pp. 6705-6713.
[42] Sanchez, J. Urena, A. and Lazcano, S. (2011) ´Effects of Atmospheric Pressure
Plasma as Surface Treatment for Adhesive Bonding of Aeronautical Epoxy/Carbon
Fibre Composite Laminates´, (Spain: Costa, J. and Guemes, A. MatComp11).
[43] Sanchez, J. Urena, A. Lazcano, S. and Blanco, T. (2013) ´Evaluation of Atmospheric
Plasma as Surface Pre-Treatment for Fibre-Reinforced Thermosets prior Structural
Assembly by Adhesive Bonding´.
[44] Law, V. Mohan, J. O'Neil, F. and Ivankovic, A. (2014) ´Air based Atmospheric
Pressure Plasma Jet Removal of Frekote 710-NC prio to Composite-Composite
Adhesive Bonding´, International Journal of Adhesion and Adhesives, vol. 54, pp. 72-
81.
[45] Zaldivar, R. Steckel, G. Morgan, B. Nokes, J. and Kim, H. (2012) ´Bonding
Optimization on Composite Surfaces using Atmospheric Plasma Treatment´,
Adhesion and Adhesives, vol. 26, pp. 381-401.
[46] O'Flynn, K. Dobbyn, P. and Dowling, D. (2015) ´Application of Atmospheric Plasma
Treatments to Enhance the Mechanical Properties of Unsized Carbon/Fibre Epoxy
Composites´, 20th International Conference on Composite Materials.

96
[47] Baghery, M. Mousavi, A. Nosratian, E. and Haji, A. (2016) ´Influence of oxygen
plasma treatment parameters on the properties of carbon fiber´, Journal of
Adhesion Science and Technology.
[48] Tendero, C. Tixier, C. Tristant, P. Desmaison, J. and Leprince. P (2006) ´Atmospheric
Pressure Plasmas: A Review´, Spectrochimica Acta Part B, 2 (30).
[49] Jõgi, I. (2011) PlasTEP ´Methods of plasma generation and plasma sources´Available
at: http://www.plastep.eu/fileadmin /dateien/Events/ 2011/110725_
Summer_School /Joegi_SummerSchool_2011_Part1.pdf.
[50] Williams, D. (2013) ´Master Thesis: Flame Treatment of Polypropylene: A Study by
Electron and Ion Soectroscopies´, University of Surrey.
[51] Kim, J. and Lee, D. (2003) ´Ultraviolet Surface Treatment for Adhesion Strenght
Improvement of Carbon/Epoxy Composites´, Adhesion Science and Technology´, 17
(1), pp. 1523-1542.
[52] Lecomte, J. (1996) ´The Assembly of Thermoplastics by Adhesive Bonding: Process
and Control´, 83rd Meeting of the AGARD SMP on "Bolted/Bonded Joints in
Polymeric Composites, (Italy).
[53] Adhesive Bonder Best Practice Guide (2013), TWI Training School, (Cambridge).
[54] Design Guidance - Joint Types. Adhesives Design Toolkit (TWI, NPL, ESR Technology
and MERL). Available at: http://www.adhesivestoolkit.com/ Toolkits/ Design
Guidance/ JointTypes.xtp.
[55] Bond, D. and Davis, M. (1999) ´The Importance of Failure Mode Identification in
Adhesive Bonded Aircraft Structures and Repairs´, Composites Materials, (Paris).
[56] Davs, M. and McGregor, A. (2010) ´Assesing Adhesive Bond Failures: Mixed-Mode
Bond Failures Explained´, in ISASI, Australian Safety Seminar, (Canberra).
[57] Flinn, B. Aubin, J. and Hickmott, C. ´Improving Adhesive Bonding of Composites
through Surface Characterization, Role of Surface Preparation on Durability of
Bonded Composite Joints´, (University of Washington).
[58] Williams, T. Yu, H. Yeh, P. Yang, J. and Hicks, R. (2014) ´Atmospheric Pressure
Plasma Effects on the Adhesive Bonding Properties of Stainless Steel and Epoxy
Composites´, Journal of Composite Materials, 48 (2), pp. 219-233.
[59] British Standard ISO 10365 ´Adhesives – Designation of Main Failure Patterns´.
[60] Atherton, M. and Jussel, R. ´Improve Product Development using QFD´, appeared in
the first quarter edition of Measuring Business Excellence, 4 (1).

97
[61] Mares, C. (2016) ´Principles of Aircraft Design´. Brunel University.
[62] Hexcel Composites, ´HexPly Prepreg Technology (2013)´, Available at:
http://www.hexcel.com/Resources/DataSheets/Brochure-Data-Sheets/
Prepreg_Technology.pdf.
[63] Hexcel Composites, ´Product Data Sheet HexPly 8552´. Available at:
http://www.hexcel.com/Resources/DataSheets/Prepreg-Data-Sheets/8552_us.pdf
[64] Hexcel Composites, ´Product Data Redux 312´, March 2015. Available at:
http://www.hexcel.com/Resources/DataSheets/Adhesives-Data-Sheets/312_eu.pdf
[65] Sigma Life Sciences ´Product Data Sheet Glass Beads´. Available at:
www.sigmaaldrich.com/catalog/product/sigma
[66] GMA Garnet Group, ´Optimum Setup for Waterjet Cutting´, Available at:
http://www.garnetsales.com/wp-content/uploads/2014/05/GMA-
Garnet%E2%84%A2-Waterjet-Cutting-2013.pdf.
[67] British standard BS ISO 4587 ´Adhesive – Determination of tensile lap-shear
strength of rigid-to-rigid bonded assemblies´.
[68] Landrock, A. (1985) Adhesive Technology Handbook. Noyes Publications.
[69] Henkel Corporation, ´Hysol® Surface Preparation Guide´. Available at:
http://www.loctite.ph/php/content_data/LT4536_TT_Aerospace_Surface_Preparat
ion_Guide.pdf.
[70] Wegman, R. and Twisk, J. (2012) Surface Preparation Techniques for Adhesive
Bonding, Second Edition, Elseiver.
[71] TWI Ltd, ´Unpublished TWI report´ (Cambridge, 2015).
[72] British Strandard ISO 4587: 2003, ´Adhesives - Determination of tensile lap-shear
strenght of rigid-to-rigid bonded assemblies´.
[73] Nield, D. (2016) Science Alert, ´There's a scientific reason for why plane windows
are always round´. Available at: http://www.sciencealert.com/watch-there-s-a-
scientific-reason-for-why-aeroplane-windows-are-always-round.
[74] British Strandard ISO 4288: 1998, ´Geometric Product Specification – Surface
Texture – Profile Method: Rules and procedures for the assessment of surface
texture, Table 1´.
[75] Boutar, Y. Naimi, S. Mezlini, S. Hamdaouui M. and Ali, M. (2016) ´Effect of Adhesive
Thickness and Surface Roughness on the Shear Strenght of Aluminiun one-

98
component Polyurethane Adhesive single-lap Joints for Automotive Applications´.
Journal of Adhesion Science and Technology, 30 (17), pp. 1913-1929.
[76] Thermo Scientific, ´XPS Simplified´. Available at:
http://xpssimplified.com/whatisxps. php.
[77] Stojilovic, N. (2012) ´Why can't we see Hydrogen in X-Ray Photoelectron
Spectroscopy?´, Journal of Chemical Education, 89 (10), pp. 1331-1332, 2012.
[78] Damico, D. Wilkinson, T. and Niks, S. (1994) ´Surface Pretreatment and Adhesive
Bonding of Carbon Fiber-Reinforced Epoxy Composites´, Composite Bonding (USA).

99
Appendix A:
Measurements
Samples

100
Table A1 Width and thickness of composite samples
Sample
designation
Width
(mm)
Thickness
(mm)
Sample
designation
Width
(mm)
Thickness
(mm)
Sample
designation
Width
(mm)
Thickness
(mm)
S001 25.04 3.22 S058 24.99 3.25 S115 24.98 3.19
S002 25.10 3.15 S059 25.04 3.17 S116 25.01 3.16
S003 25.11 3.16 S060 24.99 3.18 S117 24.94 3.16
S004 25.07 3.14 S061 25.04 3.14 S118 25.03 3.15
S005 25.06 3.14 S062 24.97 3.14 S119 24.95 3.15
S006 25.06 3.15 S063 24.98 3.14 S120 24.99 3.15
S007 25.06 3.14 S064 24.95 3.14 S121 25.04 3.14
S008 25.10 3.14 S065 25.01 3.12 S122 25.00 3.13
S009 25.14 3.13 S066 25.02 3.15 S123 25.07 3.12
S010 25.06 3.13 S067 25.01 3.13 S124 25.00 3.13
S011 25.11 3.12 S068 25.00 3.13 S125 25.09 3.15
S012 25.16 3.12 S069 25.14 3.15 S126 25.11 3.14
S013 25.16 3.14 S070 25.02 3.14 S127 25.09 3.14
S014 25.12 3.14 S071 25.04 3.15 S128 25.06 3.15
S015 25.04 3.11 S072 25.01 3.13 S129 25.09 3.13
S016 25.13 3.14 S073 25.06 3.15 S130 25.07 3.15
S017 25.12 3.15 S074 25.14 3.16 S131 25.07 3.17
S018 25.18 3.15 S075 25.14 3.15 S132 25.13 3.19
S019 25.08 3.19 S076 25.04 3.16 S133 24.99 3.22
S020 25.05 3.20 S077 25.02 3.12 S134 24.81 3.19
S021 25.10 3.16 S078 25.04 3.04 S135 24.93 3.15
S022 25.01 3.18 S079 25.04 3.09 S136 24.86 3.16
S023 25.10 3.15 S080 25.05 3.00 S137 24.91 3.14
S024 24.99 3.15 S081 25.01 3.00 S138 24.83 3.14
S025 25.05 3.15 S082 25.08 3.05 S139 24.84 3.14
S026 25.10 3.15 S083 25.08 3.08 S140 24.80 3.14
S027 25.06 3.16 S084 25.16 3.11 S141 24.84 3.15
S028 25.17 3.14 S085 25.13 3.06 S142 24.86 3.12
S029 25.06 3.15 S086 25.16 3.05 S143 24.86 3.12

101
Sample
designation
Width
(mm)
Thickness
(mm)
Sample
designation
Width
(mm)
Thickness
(mm)
Sample
designation
Width
(mm)
Thickness
(mm)
S030 25.14 3.18 S087 25.12 3.08 S144 24.94 3.13
S031 25.16 3.14 S088 25.10 3.07 S145 24.95 3.13
S032 25.18 3.15 S089 25.19 3.05 S146 24.94 3.15
S033 25.13 3.15 S090 25.13 3.04 S147 24.91 3.16
S034 25.07 3.15 S091 25.06 3.11 S148 24.94 3.15
S035 25.13 3.17 S092 25.18 3.04 S149 24.95 3.15
S036 25.11 3.17 S093 25.13 3.01 S150 24.92 3.15
S037 25.21 3.16 S094 25.21 3.02 S151 24.91 3.17
S038 25.10 3.21 S095 25.22 3.02 S152 24.92 3.21
S039 24.91 3.22 S096 24.95 3.22 S153 24.87 3.18
S040 25.04 3.19 S097 25.08 3.14 S154 24.96 3.16
S041 24.94 3.19 S098 25.04 3.16 S155 24.93 3.16
S042 24.99 3.14 S099 25.00 3.14 S156 24.97 3.14
S043 24.92 3.15 S100 24.99 3.14 S157 24.91 3.14
S044 24.91 3.16 S101 24.98 3.14 S158 24.91 3.12
S045 24.89 3.16 S102 24.98 3.13 S159 24.87 3.12
S046 24.95 3.15 S103 25.04 3.14 S160 24.93 3.13
S047 24.95 3.16 S104 25.07 3.14 S161 24.91 3.13
S048 24.97 3.15 S105 25.00 3.13 S162 24.92 3.14
S049 25.01 3.14 S106 25.04 3.13 S163 24.90 3.15
S050 25.02 3.13 S107 25.09 3.13 S164 24.99 3.14
S051 25.01 3.15 S108 25.09 3.14 S165 24.94 3.15
S052 24.99 3.13 S109 25.07 3.14 S166 24.97 3.15
S053 25.02 3.13 S110 24.98 3.15 S167 24.92 3.14
S054 25.05 3.15 S111 25.07 3.17 S168 24.97 3.16
S055 25.00 3.15 S112 25.03 3.17 S169 25.03 3.05
S056 25.01 3.17 S113 25.08 3.18 S170 25.04 3.07
S057 25.02 3.22 S114 25.01 3.25 S171 24.97 3.08
S172 24.96 2.96 S229 25.03 3.13 S286 25.21 3.13
S173 25.00 3.03 S230 25.04 3.12 S287 25.12 3.15
S174 25.01 3.03 S231 25.05 3.13 S288 25.10 3.15

102
Sample
designation
Width
(mm)
Thickness
(mm)
Sample
designation
Width
(mm)
Thickness
(mm)
Sample
designation
Width
(mm)
Thickness
(mm)
S175 25.03 3.00 S232 25.07 3.12 S289 25.21 3.13
S176 25.01 3.02 S233 25.09 3.14 S290 25.17 3.13
S177 25.04 3.03 S234 25.07 3.14 S291 25.17 3.13
S178 25.03 3.05 S235 25.10 3.15 S292 25.11 3.13
S179 25.06 3.06 S236 25.05 3.13 S293 25.08 3.13
S180 25.04 3.05 S237 25.05 3.11 S294 25.11 3.13
S181 25.06 2.99 S238 25.08 3.12 S295 25.16 3.12
S182 25.03 3.00 S239 24.89 3.13 S296 25.06 3.13
S183 25.03 3.08 S240 24.91 3.13 S297 24.92 3.14
S184 25.09 3.03 S241 25.01 3.13 S298 25.05 3.15
S185 25.03 3.03 S242 25.02 3.14 S299 25.11 3.14
S186 24.99 3.05 S243 24.97 3.14 S300 25.06 3.15
S187 25.09 3.06 S244 24.97 3.13 S301 25.03 3.14
S188 25.04 3.05 S245 24.90 3.15 S302 24.95 3.15
S189 25.11 3.03 S246 24.89 3.15 S303 25.10 3.14
S190 25.13 3.08 S247 24.95 3.15 S304 25.07 3.13
S191 25.12 3.14 S248 25.01 3.12 S305 25.13 3.06
S192 25.03 3.15 S249 25.06 3.15 S306 25.21 3.10
S193 25.00 3.13 S250 25.05 3.14 S307 25.21 3.10
S194 25.08 3.13 S251 25.10 3.12 S308 25.29 3.09
S195 25.01 3.14 S252 25.06 3.13 S309 25.22 3.10
S196 25.07 3.13 S253 25.06 3.13 S310 25.24 3.09
S197 25.03 3.13 S254 25.04 3.11 S311 25.17 3.10
S198 24.94 3.13 S255 25.04 3.11 S312 25.24 3.10
S199 25.01 3.13 S256 25.04 3.10 S313 25.16 3.09
S200 25.05 3.12 S257 25.04 3.09 S314 25.17 3.10
S201 24.96 3.15 S258 25.00 3.12 S315 25.15 3.10
S202 24.84 3.15 S259 24.95 3.12 S316 25.07 3.10
S203 24.96 3.12 S260 24.98 3.13 S317 25.12 3.11
S204 25.02 3.13 S261 25.04 3.13 S318 25.20 3.11
S205 24.94 3.13 S262 25.03 3.12 S319 25.06 3.12

103
Sample
designation
Width
(mm)
Thickness
(mm)
Sample
designation
Width
(mm)
Thickness
(mm)
Sample
designation
Width
(mm)
Thickness
(mm)
S206 24.91 3.16 S263 24.97 3.14 S320 25.08 3.13
S207 24.85 3.15 S264 24.83 3.15 S321 25.05 3.12
S208 24.99 3.15 S265 24.87 3.14 S322 25.07 3.11
S209 24.99 3.15 S266 24.92 3.15 S323 25.09 3.07
S210 25.04 3.13 S267 25.10 3.01 S324 25.11 3.10
S211 25.10 3.12 S268 25.16 3.08 S325 25.10 3.11
S212 25.09 3.13 S269 25.10 3.03 S326 25.11 3.14
S213 25.13 3.12 S270 25.14 3.05 S327 25.16 3.12
S214 25.15 3.14 S271 25.12 3.06 S328 25.18 3.12
S215 25.13 3.15 S272 25.13 3.07 S329 25.17 3.11
S216 25.05 3.14 S273 25.07 3.05 S330 25.20 3.13
S217 25.14 3.13 S274 25.06 3.03 S331 25.14 3.11
S218 25.06 3.13 S275 25.10 3.05 S332 25.15 3.13
S219 25.08 3.12 S276 25.05 3.06 S333 25.19 3.14
S220 25.03 3.11 S277 25.01 3.03 S334 25.01 3.12
S221 24.98 3.11 S278 24.95 3.01 S335 25.00 3.12
S222 25.06 3.14 S279 25.02 3.03 S336 25.09 3.13
S223 25.11 3.14 S280 25.03 3.05 S337 25.11 3.12
S224 25.00 3.13 S281 24.98 3.03 S338 25.05 3.12
S225 25.02 3.15 S282 24.92 3.02 S339 25.06 3.12
S226 25.00 3.16 S283 24.98 3.06 S340 25.01 3.12
S227 25.04 3.15 S284 25.02 3.06 S341 24.95 3.11
S228 25.05 3.15 S285 24.85 3.00 S342 25.00 3.13
S343 25.10 3.13 S369 25.17 2.97 S395 25.06 3.14
S344 25.19 3.14 S370 25.19 2.98 S396 25.07 3.13
S345 25.14 3.14 S371 25.18 2.94 S397 25.14 3.15
S346 25.20 3.12 S372 25.12 2.94 S398 25.21 3.15
S347 25.17 3.12 S373 25.07 3.05 S399 25.13 3.12
S348 25.16 3.12 S374 25.12 3.05 S400 25.02 3.06
S349 25.16 3.13 S375 25.14 3.06 S401 24.97 3.09
S350 25.15 3.13 S376 25.08 3.04 S402 24.90 3.10
S351 25.18 3.14 S377 25.01 3.09 S403 24.95 3.11

104
Sample
designation
Width
(mm)
Thickness
(mm)
Sample
designation
Width
(mm)
Thickness
(mm)
Sample
designation
Width
(mm)
Thickness
(mm)
S352 25.16 3.13 S378 25.10 3.04 S404 24.95 3.08
S353 25.11 3.10 S379 25.10 3.08 S405 24.96 3.10
S354 25.05 3.12 S380 24.97 3.01 S406 24.94 3.09
S355 25.09 3.14 S381 24.94 3.13 S407 24.96 3.08
S356 25.14 3.13 S382 24.96 3.15 S408 24.90 3.08
S357 25.13 3.16 S383 24.97 3.15 S409 24.99 3.11
S358 25.08 3.14 S384 25.04 3.15 S410 24.92 3.09
S359 24.92 3.12 S385 25.00 3.14 S411 24.96 3.09
S360 24.97 3.14 S386 24.97 3.16 S412 25.04 3.06
S361 25.03 3.13 S387 24.90 3.14 S413 25.05 3.07
S362 25.20 2.99 S388 24.99 3.13 S414 25.07 3.05
S363 25.24 3.00 S389 24.99 3.12 S415 25.09 3.09
S364 25.19 3.01 S390 25.04 3.13 S416 25.11 3.11
S365 25.25 2.99 S391 24.91 3.11 S417 25.16 3.08
S366 25.22 3.01 S392 24.95 3.12 S418 25.09 3.05
S367 25.22 2.98 S393 25.06 3.13
S368 25.18 2.99 S394 25.05 3.14

105
Appendix B:
Experimental Results
– LSS values

106
Table B1 LSS values and failure type: peel ply side plus grit blasting pre-
treatment
OUTPUT: Mechanical Testing # Sample
designation Max. Load (kN) LSS (MPa) Failure Type
1 S181-S182 12.9 41.2 Cohesive
(Delamination) 2 S183-S184 12.5 39.9
3 S185-S206 12.5 40.1
4 S207-S208 12.9 41.4
5 S209-S210 11.7 37.4
Mean: 39.9MPa Standard deviation: 1.4MPa COV (%): 3.5
Figure B1 Load values versus displacement: peel ply side plus grit blasting
pre-treatment.
0,000
2,000
4,000
6,000
8,000
10,000
12,000
14,000
0,000 0,200 0,400 0,600 0,800
Lao
d, k
N
Displacement, mm
S181-S182
S183-S184
S185-S206
S207-S208
S209-S210

107
Table B2 LSS values and failure type: peel ply plus manual abrasion pre-treatment
OUTPUT: Mechanical Testing # Sample
designation Max. Load (kN) LSS (MPa) Failure Type
1 S186-S187 12.4 39.6 Cohesive Adhesive
2 S188-S189 11.6 37.0
3 S190-S191 12.3 39.1
4 S192-S193 12.3 39.3
5 S194-S195 11.6 37.0
Mean:38.4 MPa Standard deviation: 1.1 MPa COV (%): 3.0
Figure B2 Load values versus displacement: peel ply plus manual abrasion pre-treatment.
0,000
2,000
4,000
6,000
8,000
10,000
12,000
14,000
0,000 0,100 0,200 0,300 0,400 0,500 0,600
Load
, kN
Displacement, mm
S186-S187
S188-S189
S190-S191
S192-S193
S194-S195

108
Table B3 LSS values and failure type: peel ply pre-treatment
OUTPUT: Mechanical Testing # Sample
designation Max. Load (kN) LSS (MPa) Failure Type
1 S196-S197 10.4 33.2
Cohesive 2 S198-S199 10.8 34.6
3 S200-S202 10.5 33.7
4 S201-S203 9.9 31.7
5 S204-S205 10.5 33.6
Mean: 33.3MPa Standard deviation: 0.9MPa COV (%): 2.7
Figure B3 Load values versus displacement: peel ply pre-treatment.
0,000
2,000
4,000
6,000
8,000
10,000
12,000
0,000 0,200 0,400 0,600 0,800
Load
, kN
Displacement, mm
S196-s197
S198-S199
S200-S202
S201-S203
S204-S205

109
Table B4 LSS value and failure type: peel ply side plus plasma pre-treatment (1pass, 500mm/min)
Plasma Parameters Gas Flow: 8l/min
Gas type: Argon + Air
Treatment distance, d=4mm
Speed, v=500mm/min
Number of passes =1
OUTPUT: Mechanical Testing # Sample
designation Max. Load (kN) LSS (MPa) Failure Type
1 S112-S113 11.1 35.6
Cohesive
2 S114-S115 11.3 36.1
3 S116-S117 11.1 35.5
4 S118-S119 10.6 33.9
5 S120-S121 10.8 34.7
Mean: 35.1MPa Standard deviation: 0.7MPa COV (%):1.9
Figure B4 Load values versus displacement: peel ply side plus plasma pre-treatment (1pass, 500mm/min).
0,000
2,000
4,000
6,000
8,000
10,000
12,000
0,000 0,200 0,400 0,600 0,800
Load
, kN
Displacement, mm
S112-S113
S114-S115
S116-S117
S118-S119
S120-S121

110
Table B5 LSS values and failure type: peel ply plus plasma pre-treatment (1 pass, 100mm/min)
Plasma Parameters Gas Flow: 8l/min
Gas type: Argon + Air
Treatment distance, d=4mm
Speed, v=100mm/min
Number of passes =1
OUTPUT: Mechanical Testing # Sample designation Max. Load
(kN)
LSS (MPa) Failure
Type
1 S130-S132 11.3 35.9
Cohesive 2 S133-S134 10.7 34.2
3 S135-S137 10.6 34.1
4 S136-S138 9.8 31.7
5 S139-S140 10.8 34.7
Mean: 34.1MPa Standard deviation: 1.3MPa COV (%): 3.8
Figure B5 Load values versus displacement: peel ply plus plasma pre-treatment (1 pass, 100mm/min).
0,000
2,000
4,000
6,000
8,000
10,000
12,000
0,000 0,200 0,400 0,600 0,800
Load
, kN
Displacement, mm
S130-S132
S133-S134
S135-S137
S136-S138
S139-S140

111
Table B6 LSS values and failure type: peel ply plus plasma pre-treatment (5 passes, 500mm/min)
Plasma Parameters Gas Flow: 8l/min
Gas type: Argon + Air
Treatment distance, d=4mm
Speed, v=500mm/min
Number of passes =5
OUTPUT: Mechanical Testing # Sample
designation Max. Load (kN) LSS (MPa) Failure Type
1 S141-S142 10.3 33.3
Cohesive 2 S143-S144 10.5 33.7
3 S145-S146 10.1 32.3
4 S147-S148 10.6 34.1
5 S149-S150 10.8 34.7
Mean: 33.6 MPa Standard deviation: 0.8MPa COV (%): 2.3
Figure B6 Load values versus displacement: peel ply plus plasma pre-treatment (5 passes, 500mm/min).
0,000
2,000
4,000
6,000
8,000
10,000
12,000
0,000 0,200 0,400 0,600 0,800 1,000
Load
, kN
Displacement, mm
S141-S142
S143-S144
S145-S146
S147-S148
S149-S150

112
Table B7 LSS values and failure type: peel ply plus plasma pre-treatment (10 passes, 100mm/min)
Plasma Parameters Gas Flow: 8l/min
Gas type: Argon + Air
Treatment distance, d=4mm
Speed, v=100mm/min
Number of passes =10
OUTPUT: Mechanical Testing # Sample designation Max. Load (kN) LSS (MPa) Failure Type
1 S151-S152 10.9 34.9 Cohesive 2 S153-S154 10.8 34.8
3 S155-S156 11.3 36.2
4 S157-S158 10.9 35.01
5 S159-S160 11.1 35.6
Mean: 35.3MPa Standard deviation: 0.5MPa COV (%): 1.4
Figure B7 Load values versus displacement: peel ply plus plasma pre-treatment (10 passes, 100mm/min).
0,000
2,000
4,000
6,000
8,000
10,000
12,000
0,000 0,200 0,400 0,600
Load
, kN
Displacement, mm
S151-S152
S153-S54
S155-S156
S157-S158
S159-S160

113
Table B8 LSS value and failure type: peel ply plus plasma pre-treatment (1pass, 1000mm/min)
Plasma Parameters Gas Flow: 8l/min
Gas type: Argon + Air
Treatment distance, d=4mm
Speed, v=1000mm/min
Number of passes =1
OUTPUT: Mechanical Testing # Sample
designation Max. Load (kN) LSS (MPa) Failure Type
1 S161-S162 10.3 33.1 Cohesive 2 S163-S164 9.9 31.8
3 S165-S166 10.6 33.9
4 S167-S168 10.2 32.8
5 S169-S170 10.05 32.1
Mean: 32.7MPa Standard deviation: 0.7MPa COV (%): 2.1
Figure B8 Load values versus displacement: peel ply plus plasma pre-treatment (1pass, 1000mm/min).
0,000
2,000
4,000
6,000
8,000
10,000
12,000
0,000 0,200 0,400 0,600 0,800
Load
, kN
Displacement, mm
S161-162
S163-S164
S165-S166
S167-S168
S169-S170

114
Table B9 LSS values and failure type: peel ply plus plasma pre-treatment (5 passes, 100mm/min)
Plasma Parameters Gas Flow: 8l/min
Gas type: Argon + Air
Treatment distance, d=4mm
Speed, v=100mm/min
Number of passes =5
OUTPUT: Mechanical Testing # Sample
designation Max. Load (kN) LSS (MPa) Failure Type
1 S171-S172 11.6 37.3 Cohesive 2 S173-S174 11.1 35.3
3 S175-S176 11.5 37.5
4 S177-S178 11.6 37.2
5 S179-S180 11.4 36.4
Mean: 36.7MPa Standard deviation: 0.8MPa COV (%): 2.1
Table B9 Load values versus displacement: peel ply plus plasma pre-treatment (5 passes, 100mm/min).
Table B10 LSS values and failure type: bag side as received, no pre-treatment
OUTPUT: Mechanical Testing
0,000
2,000
4,000
6,000
8,000
10,000
12,000
14,000
0,000 0,100 0,200 0,300 0,400 0,500 0,600
Load
, kN
Displacement, mm
S171-S172
S173-S174
S175-S176
S177-S178
S179-S180

115
# Sample designation
Max. Load (kN) LSS (MPa) Failure Type
1 S221-S222 5.2 16.6
Adhesive 2 S223-S224 6.1 19.5
3 S225-S226 5.7 18.2
4 S227-S228 5.5 17.6
5 S229-S230 4.8 15.3
Mean: 17.4MPa Standard deviation: 1.4MPa COV (%): 8.1
Figure B10 Load values versus displacement: bag side as received, no pre-
treatment.
0,000
1,000
2,000
3,000
4,000
5,000
6,000
7,000
0,000 0,050 0,100 0,150 0,200 0,250
Load
, kN
Displacement, mm
S221-S222
S223-S224
S225-S226
S227-S228
S229-S230

116
Table B11 LSS values and failure type: bag side plus plasma pre-treatment (5passes, 100mm/min)
Plasma Parameters Gas Flow: 8l/min
Gas type: Argon + Air
Treatment distance, d=4mm
Speed, v=100mm/min
Number of passes =5
OUTPUT: Mechanical Testing # Sample
designation Max. Load (kN) LSS (MPa) Failure Type
1 S231-S235 13.9 44.3 Cohesive Adhesive
2 S233-S234 12.5 39.9
3 S232-S236 14.1 45.0
4 S237-S238 13.7 43.7
5 S239-S240 12.8 41.1
Mean: 42.8MPa Standard deviation: 1.9MPa COV (%):4.4
Figure B11 Load values versus displacement: bag side plus plasma pre-treatment (5passes, 100mm/min).
0,000
2,000
4,000
6,000
8,000
10,000
12,000
14,000
16,000
0,000 0,100 0,200 0,300 0,400 0,500 0,600
Load
, kN
Displacement, mm
S231-S235
S233-S234
S232-S236
S237-S238
S239-S240

117
Table B12 LSS values and failure type: bag side plus plasma pre-treatment (1pass, 1000 mm/min)
Plasma Parameters Gas Flow: 8l/min
Gas type: Argon + Air
Treatment distance, d=4mm
Speed, v=1000mm/min
Number of passes =1
OUTPUT: Mechanical Testing # Sample
designation Max. Load (kN) LSS (MPa) Failure Type
1 S243-S244 12.1 38.8 Cohesive Adhesive
2 S245-S246 11.1 35.7
3 S247-S248 12.1 38.7
4 S249-S250 12.2 38.9
Mean: 38.03 MPa Standard deviation: 1.3MPa COV (%): 3.5
Figure B12 Load values versus displacement: bag side plus plasma pre-treatment (1pass, 1000mm/min).
0,000
2,000
4,000
6,000
8,000
10,000
12,000
14,000
0,000 0,100 0,200 0,300 0,400 0,500 0,600
Load
, kN
Displacement, mm
S243-S244
S245-S246
S247-S248
S249-S250

118
Table B13 LSS values and failure type: bag side plus plasma pre-treatment (1pass, 100mm/min)
Plasma Parameters Gas Flow: 8l/min
Gas type: Argon + Air
Treatment distance, d=4mm
Speed, v=100mm/min
Number of passes =1
OUTPUT: Mechanical Testing # Sample designation Max. Load (kN) LSS (MPa) Failure Type
1 S251-S252 12.7 40.5 Cohesive Adhesive
2 S253-S254 12.1 38.6
3 S255-S256 12.2 38.9
4 S257-S258 12.6 40.6
5 S259-S260 11.9 38.1
Mean: 39.4MPa Standard deviation: 1MPa COV (%): 2.5
Figure B13 Load values versus displacement: bag side plus plasma pre-treatment (1pass, 100mm/min).
0,000
2,000
4,000
6,000
8,000
10,000
12,000
14,000
0,000 0,200 0,400 0,600 0,800
Load
, kN
Displacement, mm
S253-S254
S255-S256
S257-S258
S259-S260
S251-S252

119
Table B14 LSS values and failure type: bag side plus plasma pre-treatment (10passes, 100mm/min)
Plasma Parameters Gas Flow: 8l/min
Gas type: Argon + Air
Treatment distance, d=4mm
Speed, v=100mm/min
Number of passes =10
OUTPUT: Mechanical Testing # Sample designation Max. Load (kN) LSS (MPa) Failure Type
1 S261-S262 12.4 39.6 Cohesive Adhesive
2 S263-S264 13.1 42.1
3 S265-S266 11.9 38.2
4 S267-S268 13.3 42.3
5 S269-S270 13.6 43.3
Mean: 41.1MPa Standard deviation: 4.6MPa COV (%): 1.9
Figure B14 Load values versus displacement: bag side plus plasma pre-treatment (10passes, 100mm/min).
0,000
2,000
4,000
6,000
8,000
10,000
12,000
14,000
16,000
0,000 0,200 0,400 0,600 0,800
Load
, kN
Displacement, mm
S261-S262
S263-S264
S265-S266
S267-S268
S269-S270

120
Table B15 LSS values and failure type: bag side plus grit blasting pre-treatment
OUTPUT: Mechanical Testing # Sample
designation Max. Load (kN) LSS (MPa) Failure Type
1 S216-S217 12.9 41.1 Cohesive Adhesive
(Delamination)
2 S218-S219 12.6 40.2
3 S220-S271 12.7 40.5
4 S272-S273 13.1 40.7
5 S274-S275 12.7 40.5
Mean: 40.8MPa Standard deviation: 0.5MPa COV (%): 1.3
Figure B15 Load values versus displacement: bag side plus grit blasting pre-treatment.
0,000
2,000
4,000
6,000
8,000
10,000
12,000
14,000
0,000 0,200 0,400 0,600 0,800
Load
, kN
Displacement, mm
S216-S217
S218-S219
S220-S271
S272-S273
S274-S275

121
Table B16 LSS values and failure type: bag side plus manual abrasion pre-treatment
OUTPUT: Mechanical Testing # Sample
designation Max. Load (kN) LSS (MPa) Failure Type
1 S276-S277 11.7 37.4 Cohesive Adhesive
2 S278-S279 10.9 34.9
3 S280-S281 11.1 35.1
4 S282-S283 10.2 32.7
5 S287-S288 10.4 33.1
Mean: 34.7MPa Standard deviation: 1.7MPa COV (%): 4.8
Figure B16 Load values versus displacement: bag side plus manual abrasion pre-treatment.
0,000
2,000
4,000
6,000
8,000
10,000
12,000
14,000
0,000 0,100 0,200 0,300 0,400 0,500
Load
, kN
Displacement, mm
S276-S277
S278-S279
S280-S281
S282-S283
S287-S288

122
Table B17 LSS values and failure type: bag side plus plasma pre-treatment (1pass, 500mm/min)
Plasma Parameters Gas Flow: 8l/min
Gas type: Argon + Air
Treatment distance, d=4mm
Speed, v=500mm/min
Number of passes =1
OUTPUT: Mechanical Testing # Sample
designation Max. Load (kN) LSS (MPa) Failure Type
1 S289-S290 10.2 32.4 Cohesive Adhesive
2 S291-S292 10.2 34.4
3 S294-S295 11.7 37.2
4 S296-S297 11.2 35.8
5 S298-S301 10.7 34.2
Mean: 34.4MPa Standard deviation: 1.9MPa COV (%): 5.5
Figure B17 Load values versus displacement: bag side plus plasma pre-treatment (1pass, 500mm/min).
0,000
2,000
4,000
6,000
8,000
10,000
12,000
14,000
0,000 0,200 0,400 0,600 0,800 1,000
Lao
d, k
N
Displacement, mm
S289-S290
S291-S292
S294-S295
S296-S297
S298-S301

123
Table B18 LSS values and failure type: bag side plus plasma pre-treatment (5passes, 500mm/min)
Plasma Parameters Gas Flow: 8l/min
Gas type: Argon + Air
Treatment distance, d=4mm
Speed, v=500mm/min
Number of passes =5
OUTPUT: Mechanical Testing # Sample
designation Max. Load (kN) LSS (MPa) Failure Type
1 S302-S303 11.5 39.7 Cohesive Adhesive
2 S304-S305 12.5 39.8
3 S325-S326 11.1 35.4
4 S311-S314 11.8 37.5
5 S307-S301 10.9 34.6
Mean: 36.8MPa Standard deviation: 1.8MPa COV (%): 4.8
Figure B18 Load values versus displacement: bag side plus plasma pre-treatment (5passes, 500mm/min).
0,000
2,000
4,000
6,000
8,000
10,000
12,000
14,000
0,000 0,100 0,200 0,300 0,400 0,500 0,600
Load
, kN
Displacement, mm
S302-S303
S304-S305
S311-S314
S307-S313
S325-S326

124
Appendix C:
X-ray Photoelectron Spectroscopy
Results

125
Table C1 Elemental ID and quantification peel ply side as received
Name Peak BE Atomic %
C1s 285.06 75.66
C1s Scan A 286.80 5.43
C1s Scan B 289.30 0.89
O1s 532.58 13.14
S2p 162.40 2.34
Si2p 102.19 1.39
Zn2p3/2 1021.80 1.15
Figure C1 XPS spectra of surface pre-treatment peel ply side as received.

126
Table C2 Elemental ID and quantification peel ply side plus grit blasting
Name Peak BE Atomic %
C1s 285.12 61.81
C1s Scan A 287.00 2.85
C1s Scan B 284.50 0.37
N1s 399.30 8.91
O1s 532.52 22.41
S2p 167.93 2.76
Si2p 102.45 0.72
Zn2p3/2 1021.93 0.17
Figure C2 XPS spectra of surface pre-treatment peel ply side plus grit blasting.

127
Table C3 Elemental ID and quantification peel ply side plus plasma
(5passes, 100mm/min)
Name Peak BE Atomic %
C1s 285.07 37.90
C1s Scan A 286.80 2.21
C1s Scan B 288.50 3.01
N1s 400.76 12.84
O1s 532.02 36.71
S2p 168.42 6.30
Si2p 103.07 1.03
Figure C3 XPS spectra of surface pre-treatment peel ply side plus plasma (5passes, 100mm/min).

128
Table C4 Elemental ID and quantification peel ply side plus plasma (1pass, 1000mm/min)
Name Peak BE Atomic %
C1s 285.11 51.50
C1s Scan A 289.00 7.31
C1s Scan B 287.20 4.80
N1s 399.40 4.61
O1s 532.52 30.21
S2p 168.04 0.91
Si2p 102.91 0.44
Zn2p3/2 1021.89 0.22
Figure C4 XPS spectra of surface pre-treatment peel ply side plus plasma (1pass, 1000mm/min).

129
Table C5 Elemental ID and quantification bag side (no pre-treatment)
Name Peak BE Atomic %
C1s 285.11 55.43
F1s 688.12 20.03
N1s 399.14 6.77
O1s 532.43 14.57
S2p 167.82 1.59
Si2p 102.62 1.61
Figure C5 XPS spectra of surface bag side (no pre-treatment).

130
Table C6 Elemental ID and quantification bag side plus grit blasting
Name Peak BE Atomic %
C1s 285.03 66.77
N1s 399.36 7.49
O1s 532.56 21.96
S2p 167.99 2.74
Si2p 102.16 1.04
Figure C6 XPS spectra of surface pre-treatment bag side plus grit blasting.

131
Table C7 Elemental ID and quantification bag side plus plasma (5passes, 100mm/min)
Name Peak BE Atomic %
C1s 285.09 35.45
F1s 688.20 9.77
N1s 400.97 13.11
O1s 532.12 32.79
S2p 168.52 7.03
Si2p 103.13 1.85
Figure C7 XPS spectra of surface pre-treatment bag side plus plasma (5passes, 100mm/min).

132
Table C8 Elemental ID and Quantification bag side plus plasma (1pass, 1000mm/min)
Name Peak BE Atomic %
C1s 285.18 39.77
F1s 688.54 29.32
N1s 399.22 8.98
O1s 532.39 18.43
S2p 168.09 1.75
Si2p 103.18 1.75
Figure C8 XPS spectra of surface pre-treatment bag side plus plasma (1pass, 1000mm/min).

133