Pipeline Gas Chapter4
18
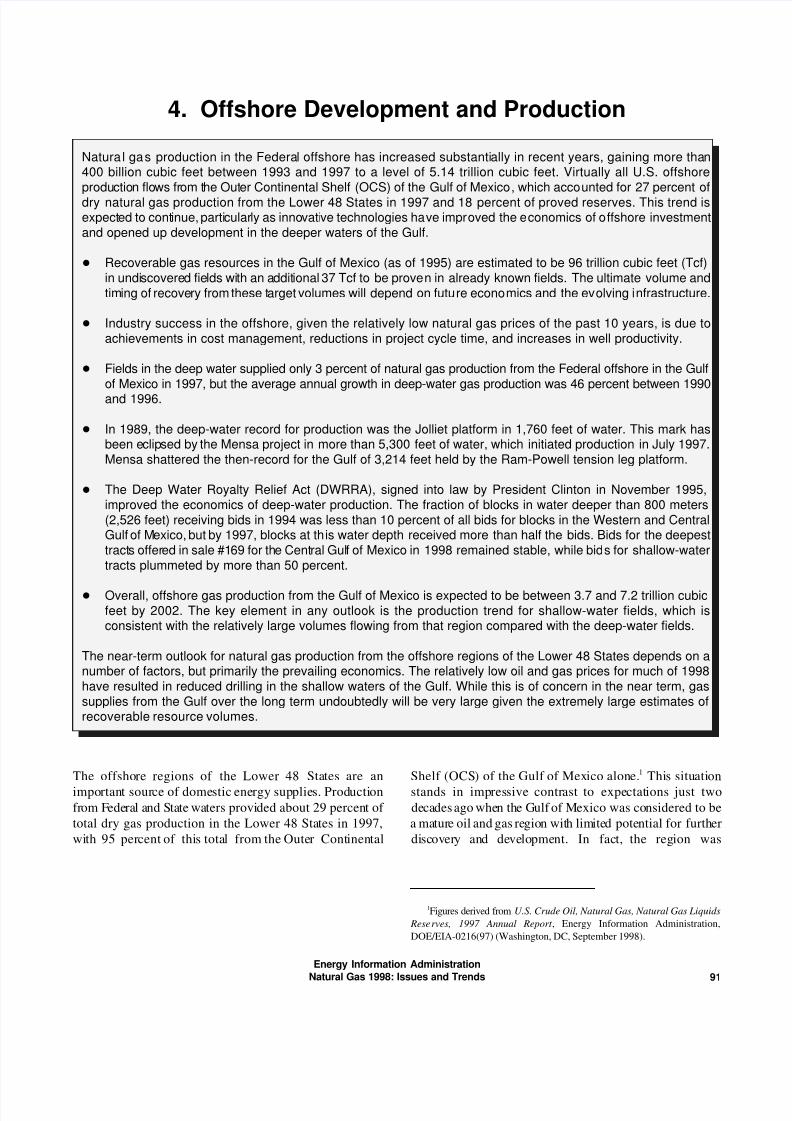
Energy Information Administration Natural Gas 1998: Issues and Trends 91 Natura l ga s production in the Federa l offshore has increased substanti ally in recent years, gaining more tha n 400 billion cubic feet between 1993 and 1997 to a level of 5.14 trillion cubic feet. Virtually all U.S. offshore produ ction flows from t he Out er Continental Shelf (OCS) of the Gulf of Mexico , which accounted for 27 percent of dry natural gas production from the Lower 48 States in 1997 and 18 percent of proved reserves. This trend is expect ed to cont inue, parti cular ly as inno vati ve technologies ha ve impr oved the e conomics of o ffshore investment and opened up development in the deeper waters of the Gulf. ü Recoverable gas resources in the Gulf of Mexico (as of 1995) are estimated to be 96 trillion cubic feet (Tcf) in undi scovere d fields wi th an a ddit ional 37 Tcf to be prove n in already known fields. The ultimate volume and timing of recove ry from these t arget volumes will depend on futu re econo mics and the ev olving i nfrastructure. ü Industry success in the offshore, given the relatively low natural gas prices of the past 10 years, is due to achievements in cost management, reductions in project cycle time, and increases in well productivity. ü Fields in the deep water supplied only 3 percent of natural gas production from the Federal offshore in the Gulf of Mexico in 1997, but the average annual growth in deep-water gas production was 46 percent between 1990 and 1996. ü In 1989, the deep-water record for production was the Jolliet platform in 1,760 feet of water. This mark has been e clip sed by the Mensa project in more than 5,300 feet of water, which initiated production in July 1997. Mensa shattered the then-record for the Gulf of 3,214 feet held by the Ram-Powell tension leg platform. ü The Deep Water Royalty Relief Act (DWRRA), signed into law by President Clinton in November 1995, improved the economics of deep-water production. The fraction of blocks in water deeper than 800 meters (2,526 feet) receiving bids in 1994 was less than 10 percent of all bids for blocks in the Western and Central Gulf of Mexico, but by 1997, blocks at this water depth received more than half the bids. Bids for the deepest tract s offer ed in sale #1 69 for th e Cent ral Gul f of Mexico in 1998 remained stable, while bid s for shallow-water tracts plummeted by more than 50 percent. ü Overall, offshore gas production from the Gulf of Mexico is expected to be between 3.7 and 7.2 trillion cubic feet by 2002. The key element in any outlook is the production trend for shallow-water fields, which is consistent with the relatively large volumes flowing from that region compared with the deep-water fields. The near-term outlook for natural gas production from the offshore regions of the Lower 48 States depends on a number of factors, but primarily the prevailing economics. The relatively low oil and gas prices for much of 1998 have resulted in reduced drilling in the shallow waters of the Gulf. While this is of concern in the near term, gas supplies from the Gulf over the long term undoubtedly will be very large given the extremely large estimates of recoverable resource volumes. 4. Offshore Development and Production The offshore regions of the Lower 48 Sta tes are an Shelf (OCS) of the Gulf of Mex ico alone. Thi s situati on importan t source of dome stic ene rgy supplie s. Prod ucti on stands in impres sive contr ast to expe ctat ions just two fr om Federal and S ta te wa ters provi ded about 29 percen t of de ca des ago whe n th e G ulf of Mexico was co nsidered to be total dry gas production in the Lower 48 Sta tes in 1997, a ma ture oil and gas re gio n wit h lim ite d pote ntial for furth er wi th 95 per cent of this tota l from the Oute r Cont inental disc ov er y and develo pme nt. In fac t, the reg ion was 1 Figures derived from U.S. Crude Oil, Natural Gas, Natural Gas Liquids 1 Rese rves, 1997 Annual Report , Energy Information Administration, DOE/EIA-0216(97) (Washington, DC, September 1998).
Transcript of Pipeline Gas Chapter4
8/9/2019 Pipeline Gas Chapter4
http://slidepdf.com/reader/full/pipeline-gas-chapter4 1/18
Energy Information Administration
Natural Gas 1998: Issues and Trends 91
Natural gas production in the Federal offshore has increased substantially in recent years, gaining more than400 billion cubic feet between 1993 and 1997 to a level of 5.14 trillion cubic feet. Virtually all U.S. offshoreproduction flows from the Outer Continental Shelf (OCS) of the Gulf of Mexico, which accounted for 27 percent of
dry natural gas production from the Lower 48 States in 1997 and 18 percent of proved reserves. This trend isexpected to continue, particularly as innovative technologies have improved the economics of offshore investmentand opened up development in the deeper waters of the Gulf.
ü Recoverable gas resources in the Gulf of Mexico (as of 1995) are estimated to be 96 trillion cubic feet (Tcf)in undiscovered fields with an additional 37 Tcf to be proven in already known fields. The ultimate volume andtiming of recovery from these target volumes will depend on future economics and the evolving infrastructure.
ü Industry success in the offshore, given the relatively low natural gas prices of the past 10 years, is due toachievements in cost management, reductions in project cycle time, and increases in well productivity.
ü Fields in the deep water supplied only 3 percent of natural gas production from the Federal offshore in the Gulfof Mexico in 1997, but the average annual growth in deep-water gas production was 46 percent between 1990and 1996.
ü In 1989, the deep-water record for production was the Jolliet platform in 1,760 feet of water. This mark hasbeen eclipsed by the Mensa project in more than 5,300 feet of water, which initiated production in July 1997.Mensa shattered the then-record for the Gulf of 3,214 feet held by the Ram-Powell tension leg platform.
ü The Deep Water Royalty Relief Act (DWRRA), signed into law by President Clinton in November 1995,improved the economics of deep-water production. The fraction of blocks in water deeper than 800 meters(2,526 feet) receiving bids in 1994 was less than 10 percent of all bids for blocks in the Western and CentralGulf of Mexico, but by 1997, blocks at this water depth received more than half the bids. Bids for the deepesttracts offered in sale #169 for the Central Gulf of Mexico in 1998 remained stable, while bids for shallow-watertracts plummeted by more than 50 percent.
ü Overall, offshore gas production from the Gulf of Mexico is expected to be between 3.7 and 7.2 trillion cubicfeet by 2002. The key element in any outlook is the production trend for shallow-water fields, which isconsistent with the relatively large volumes flowing from that region compared with the deep-water fields.
The near-term outlook for natural gas production from the offshore regions of the Lower 48 States depends on anumber of factors, but primarily the prevailing economics. The relatively low oil and gas prices for much of 1998have resulted in reduced drilling in the shallow waters of the Gulf. While this is of concern in the near term, gassupplies from the Gulf over the long term undoubtedly will be very large given the extremely large estimates ofrecoverable resource volumes.
4. Offshore Development and Production
The offshore regions of the Lower 48 States are an Shelf (OCS) of the Gulf of Mexico alone. This situation
important source of domestic energy supplies. Production stands in impressive contrast to expectations just twofrom Federal and State waters provided about 29 percent of decades ago when the Gulf of Mexico was considered to be
total dry gas production in the Lower 48 States in 1997, a mature oil and gas region with limited potential for further
with 95 percent of this total from the Outer Continental discovery and development. In fact, the region was
1
Figures derived from U.S. Crude Oil, Natural Gas, Natural Gas Liquids1
Reserves, 1997 Annual Report , Energy Information Administration,
DOE/EIA-0216(97) (Washington, DC, September 1998).
8/9/2019 Pipeline Gas Chapter4
http://slidepdf.com/reader/full/pipeline-gas-chapter4 2/18
Energy Information Administration
Natural Gas 1998: Issues and Trends92
considered so lacking in promise that it was then called the This chapter analyzes recent production trends in the
“Dead Sea.” A December 1973 report by the U.S. offshore Gulf of Mexico to provide an indicator of expected
Department of the Interior stated that all potentially production levels from the shallow-water regions and from
productive blocks in water depths up to 600 feet in the known deep-water fields. The economics of offshore
Federal Offshore Louisiana would be leased by 1978 and projects is examined by reviewing and assessing trends in
all exploration and development would be completed by costs and productivity. The chapter also discusses the effect
1985. However, development of shallow prospects of environmental laws and regulations on offshore2
continued, and by the late 1980s and early 1990s activities, especially as they pertain to deep-water
improvement in existing technologies and the introduction operations.
of new technologies enabled the industry to access
prospects in the deep-water areas and the subsalt plays. The oil and gas industry has been active in the offshore3 4
The economics of deep-water activities has improved to the century (see box, p. 93). During that time, the industry
point that operators have continued with project often found itself as a critical element in the ongoing debate
development despite the recent downturn in prices for crude regarding the best policy for managing offshore resources.
oil and natural gas, reflecting a very healthy and improving Sometimes the goals of supplying energy and preserving
environment for oil and gas production and development. water and air resources have been perceived as conflicting.
Deep-water fields require relatively long lead times for In fact, over time, certain laws and Congressional or
development and substantial capital investment even at an Presidential actions have limited activities in offshore areas
early stage, and they have relatively low operating costs. or explicitly blocked them at least temporarily. At present,
All of these factors encourage continued development and oil and gas drilling is prohibited along the entire U.S. East
operation even though the prevailing economics may seem Coast, the west coast of Florida, and the U.S. West Coast
inadequate. except for some areas off the coast of southern California.
Although this chapter does not include an economic Gulf of Mexico, and offshore development can be
analysis of the impact of recent price declines, it appears considered almost synonymous with that of the Gulf.
the recent drop in oil and gas prices may have only a
minimal impact on the long-term outlook for offshore
production unless the low prices persist for an extended
period. There has been some reduction in shallow-water
drilling activity recently, but development of deep-water
projects proceeds. The expected expansion of deep-waterfield production can help to offset declines in shallow-water
operations, but shallow-water fields yield the vast portion
of the gas total so some falloff may be expected.
regions of the United States throughout much of this
Thus, today virtually all offshore activity is confined to the
Production from the
Gulf of Mexico
The Federal offshore region of the Gulf of Mexico has
become an increasingly important source of natural gas,
accounting for nearly 27 percent of dry natural gas
production in 1997. This is in sharp contrast to earlier
years. Gas production in the mid-1950s from the Federal
waters of the Gulf of Mexico was relatively small, with
only 81 billion cubic feet (Bcf) produced in 1955, or less
than 2 percent of the volume produced in the mid-1990s.
Production surged dramatically after the mid-1950s,
exceeding 1 trillion cubic feet in 1966 and achieving a
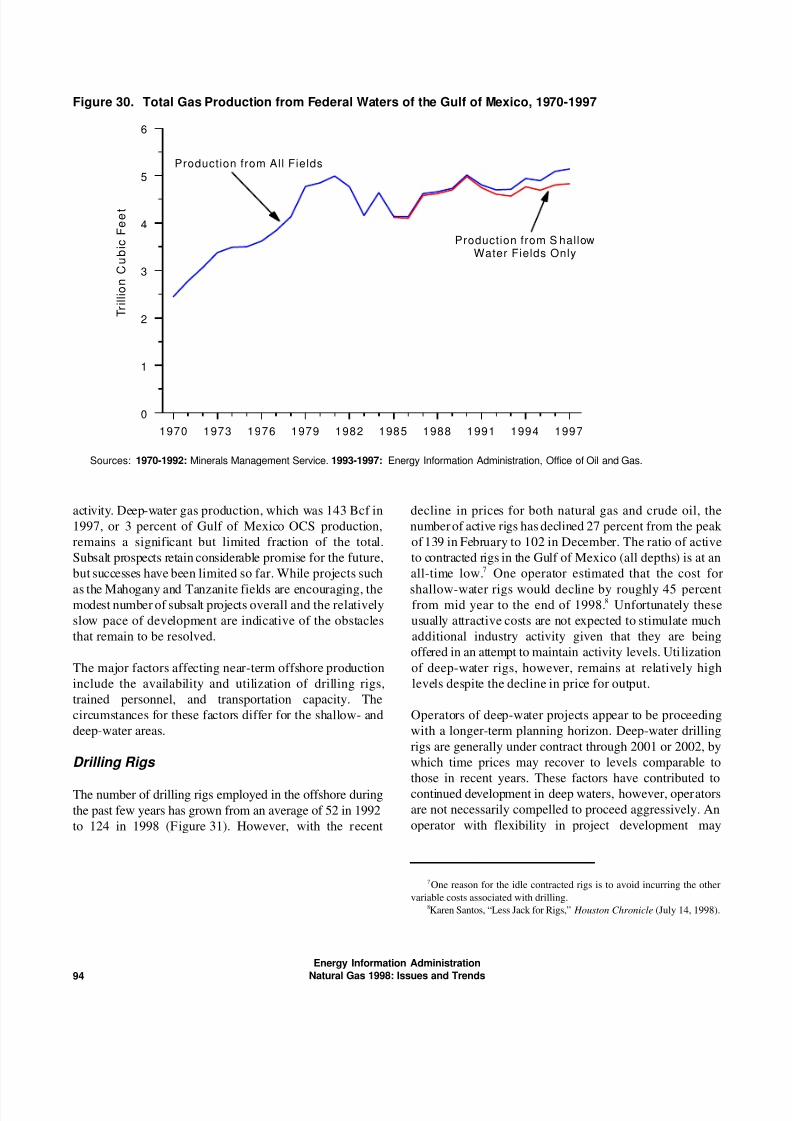
then-record 4.99 trillion cubic feet in 1981 (Figure 30).
After the surge in the early 1980s, offshore gas productiondeclined until 1986, after which it gradually has grown to
a record level of 5.14 trillion cubic feet in 1997.
The success in offshore production is expected to continue,
but the recent downturn in economic conditions may hinder
realization of production. Overall, offshore gas production
U.S. Department of the Interior, Bureau of Mines, Offshore Petroleum2
Studies Estimated Availability of Hydrocarbons to a Water Depth of 600 Feet
from the Federal Offshore Louisiana and Texas Through 1985 (December
1973).
For this report, deep waters pertain to water depths of greater than3
1,000 feet (approximately 305 meters), which establishes the effective
economic barrier between the use of fixed platforms and the new technologyof the deep-water production systems. There are different regulatory
requirements by the Minerals Management Service (MMS) for deep-water
projects in depths of 1,000 feet or more. For example, operators have to file
Deep Water Operating Plans with MMS for projects beyond 1,000 feet of
water depth and for all subsea completions.
About 85 percent of the continental shelf in the Gulf of Mexico is4
covered by salt deposits, comprising an extensive area for potential
hydrocarbon development. The salt layers pose great difficulty in geophysical
analysis and drilling through and below salt columns presents unique
challenges.
8/9/2019 Pipeline Gas Chapter4
http://slidepdf.com/reader/full/pipeline-gas-chapter4 3/18
Energy Information Administration
Natural Gas 1998: Issues and Trends 93
Offshore Milestones
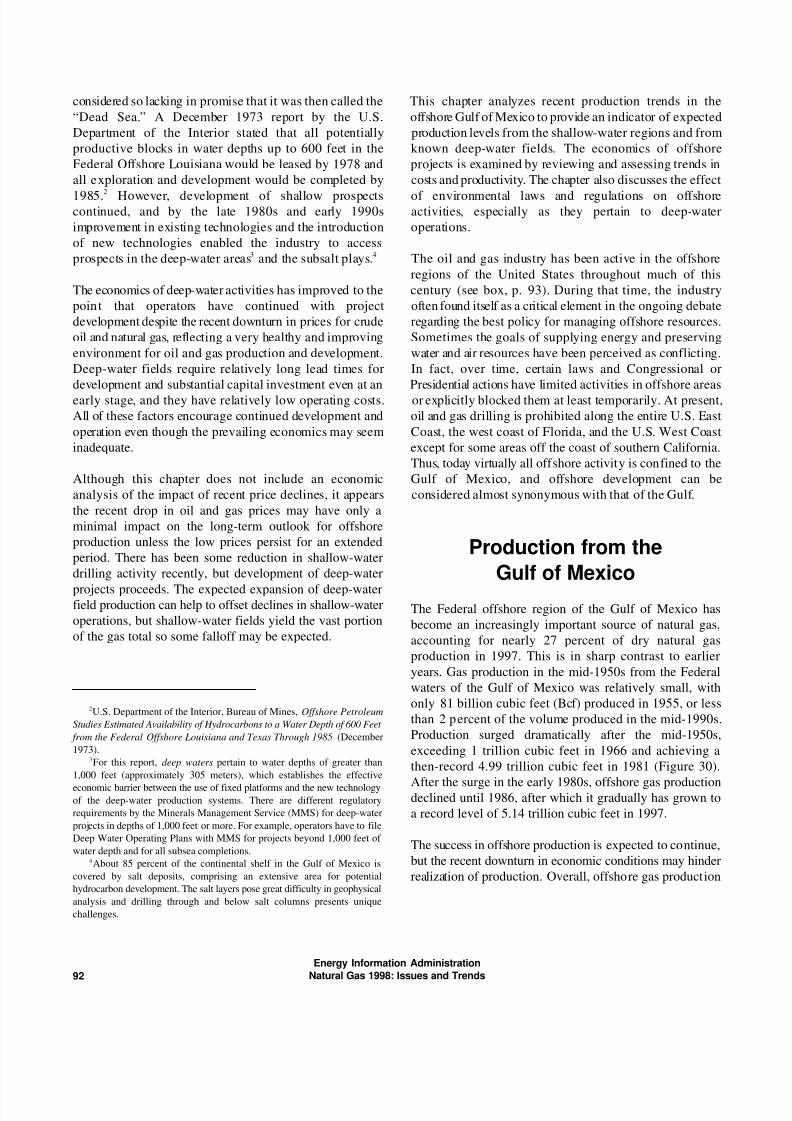
The oil and gas industry in 1997 celebrated the golden anniversary of a major milestone for activities in offshore waters.In 1947, Kerr-Mcgee, Stanolind, and Phillips Petroleum Company drilled the Kermac 16 in 20 feet of water in the ShipShoal Block 32 field. This field is located 43 miles southwest of Morgan City, Louisiana. Other wells were drilled in wateras early as 1905 in Southern California, but the Kermac 16 was the first well drilled out of the sight of land. Sixteen
24-inch piles supported the platform, which produced 1.4 million barrels of oil and 37 million cubic feet of gas. Thisplatform produced until 1984.
Another milestone event for the Gulf of Mexico took place in 1953 when the first movable offshore drill ing rig, called “Mr.
Charlie,” was built, which was a major advancement. That was also the year the State and Federal boundaries weredefined according to the U.S. Submerged Land Act. The first offshore sale of oil and gas leases also was held in 1953.Other notable events after 1953 are as follows.
ü The first semi-submersible drilling rig was launched by Shell in 1962.
ü The first subsea production system was installed for Shell in 1972 in Main Pass Block 290.
ü The Cognac Platform was installed for Shell in a record 1,025 feet of water in Mississippi Canyon block in 1979.
ü In 1988, Shell installed the Bullwinkle platform, the world's tallest standing structure, to produce in 1,353 feet ofwater, and Placid Oil first used a floating production system in Green Canyon Block 29.
ü In 1989, Conoco and Texaco established production at their Jolliet tension leg platform (TLP), located in 1,760 feetof water.
ü The Deep Water Royalty Relief Act (DWRRA) was passed in 1995, which mandates royalty relief for certain leases
in the Gulf of Mexico (the DWRRA is described in more detail later in the chapter).
ü Production began in June 1998 from Shell’s Mensa field in 5,376 feet of water, which established the then water-depth record for production. This project included a world record 68-mile subsea tieback to transport production toan existing platform in shallower water.
from the Gulf of Mexico is expected to range between
9 and 20 Bcf per day by the end of 2002, reflecting the
considerable uncertainties involved. The near-term
production outlook is affected greatly by recent
development and the expected development of the
inventory of waiting prospects. The expected volumes of
recoverable natural gas resources are significant for the
longer term. The Minerals Management Service published
an estimate for total natural gas resources in the Federal
waters of the Gulf of Mexico of 275 trillion cubic feet
(Tcf), of which 95.7 Tcf remain as conventionally
recoverable volumes in undiscovered fields as of January 1,
1995. This bountiful endowment provides opportunities5
for sizeable gas supplies from this area in the longer term.
Factors Affecting Production
An important factor contributing to the recent production
growth has been impressive technological advances, which
over time have extended the industry’s reach into areas
previously inaccessible because of major technical and
operational obstacles, such as deposits in waters greater
than 1,000 feet in depth and subsalt deposits. Despite these6
opportunities in more challenging locations, the major share
of gas production to date has flowed from those deposits in
shallow waters. Thus, the most fruitful application of newtechnologies, in terms of gas production, has been in
maintaining or increasing flow from areas that already were
subjected to considerable exploration and developmental
Minerals Management Service, Summary of the 1995 Assessment of 5
Conventionally Recoverable Hydrocarbon Resources of the Gulf of Mexico Subsalt accumulations can be found in structural traps below salt sheets
and the Atlantic Outer Continental Shelf , OCS Report MMS 96-0047 or sills, which comprise an impermeable barrier that entraps the hydrocarbons
(January 1997). in potentially commercial prospects.
6
8/9/2019 Pipeline Gas Chapter4
http://slidepdf.com/reader/full/pipeline-gas-chapter4 4/18
1970 1973 1976 1979 1982 1985 1988 1991 1994 1997
0
1
2
3
4
5
6
T r
i l l i o n
C u
b i c F e e
t
Production from All Fields
Production from S hallowWater Fields Only
Energy Information Administration
Natural Gas 1998: Issues and Trends94
Sources: 1970-1992: Minerals Management Service. 1993-1997: Energy Information Administration, Office of Oil and Gas.
Figure 30. Total Gas Production from Federal Waters of the Gulf of Mexico, 1970-1997
activity. Deep-water gas production, which was 143 Bcf in decline in prices for both natural gas and crude oil, the
1997, or 3 percent of Gulf of Mexico OCS production, number of active rigs has declined 27 percent from the peak
remains a significant but limited fraction of the total. of 139 in February to 102 in December. The ratio of active
Subsalt prospects retain considerable promise for the future, to contracted rigs in the Gulf of Mexico (all depths) is at an
but successes have been limited so far. While projects such all-time low. One operator estimated that the cost for
as the Mahogany and Tanzanite fields are encouraging, the shallow-water rigs would decline by roughly 45 percentmodest number of subsalt projects overall and the relatively from mid year to the end of 1998. Unfortunately these
slow pace of development are indicative of the obstacles usually attractive costs are not expected to stimulate much
that remain to be resolved. additional industry activity given that they are being
The major factors affecting near-term offshore production of deep-water rigs, however, remains at relatively high
include the availability and utilization of drilling rigs, levels despite the decline in price for output.
trained personnel, and transportation capacity. The
circumstances for these factors differ for the shallow- and Operators of deep-water projects appear to be proceeding
deep-water areas. with a longer-term planning horizon. Deep-water drilling
Drilling Rigs
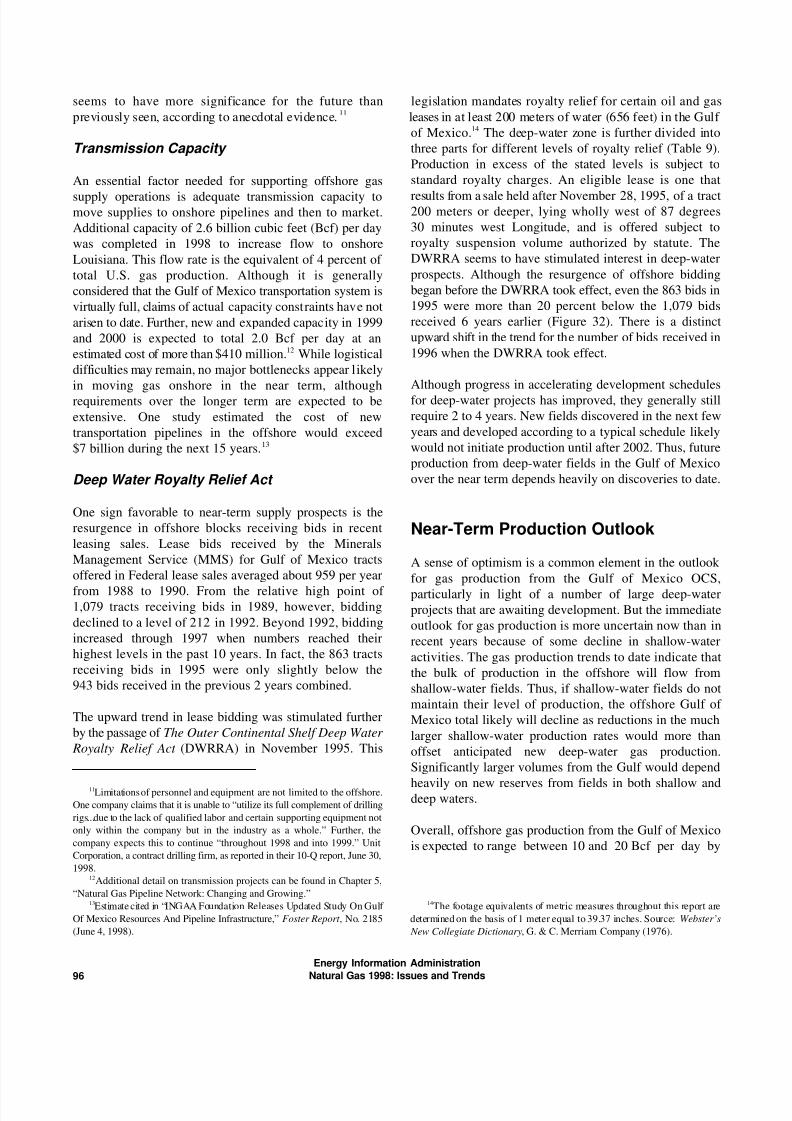
The number of drilling rigs employed in the offshore during
the past few years has grown from an average of 52 in 1992
to 124 in 1998 (Figure 31). However, with the recent
7
8
offered in an attempt to maintain activity levels. Utilization
rigs are generally under contract through 2001 or 2002, by
which time prices may recover to levels comparable to
those in recent years. These factors have contributed to
continued development in deep waters, however, operators
are not necessarily compelled to proceed aggressively. An
operator with flexibility in project development may
One reason for the idle contracted rigs is to avoid incurring the other7
variable costs associated with drilling.
Karen Santos, “Less Jack for Rigs,” Houston Chronicle (July 14, 1998).8

8/9/2019 Pipeline Gas Chapter4
http://slidepdf.com/reader/full/pipeline-gas-chapter4 5/18
Jan Jul Jan Jul Jan Jul Jan Jul Jan Jul Jan Jul Jan Jul
0
20
40
60
80
100
120
140
160
A v e r a g e
N u m
b e r p e r M
o n
t h
19951994 1998199619931992 1997
Energy Information Administration
Natural Gas 1998: Issues and Trends 95
Figure 31. Monthly Offshore Drilling Rigs, 1992-1998
Source: Energy Information Administration, Monthly Energy Review (various issues).
choose to extend a project’s schedule, and planned projects development of the set of pending deep-water prospects
that have not begun may be delayed until favorable would tend to drive well drilling costs eventually to
economic conditions return or are expected to return. If prohibitive levels. A number of new drilling rigs are being
such delays become common, the sequence of new built, but unless the industry sees very high utilization rates
production may not be timely enough to offset declines in or guaranteed contracts are offered to motivate new rig
regional production volumes. However, it appears likely at manufacture, a reluctance to build in the industry haspresent that the industry is proceeding with deep-water lingered limiting the amount of new rig construction.
development activity. The number of drilling rigs capable
of operating in deep waters would be the constraining
factor if interest in project development surged, because the
inventory of available prospects is more than sufficient to
utilize available equipment and personnel.
Before the recent falloff owing to low prices, the increase
in drilling activities had created tight markets for rigs in the
Gulf of Mexico, with signs of rig scarcity appearing
regularly. Contracts for two Global Marine jack-up rigs in
1997 were secured within a week of the company
announcement of their availability. Deep-water rig rates9
had increased tremendously during the past year and rapid
10
Availability of Trained Personnel
Another important factor in production levels is the
availability of personnel, with respect to both numbers and
skill levels. The limited number of trained and experienced
offshore workers also is likely to constrain rapid offshore
development. Previous cuts in personnel have reduced the
numbers of skilled workers, and also have discouraged
growth in the size of the workforce. Even if higher wages
were offered to entice new workers, new experts andworkers require time to train. The scarcity of qualified
personnel willing to take the risk in such a cyclic industry
Sheila Popov, “The Tide Has Turned in the Gulf of Mexico,” Hart’s according to “Deepwater semi upgrade nearing completion,” Oil and Gas9
Petroleum Engineer International (October 1997), pp. 25-35. Journal (November 10, 1997), p. 40.
A major factor impeding the construction of new rigs is the very high10
cost. Upgrading an existing rig incurs costs exceeding $100 million,
8/9/2019 Pipeline Gas Chapter4
http://slidepdf.com/reader/full/pipeline-gas-chapter4 6/18
Energy Information Administration
Natural Gas 1998: Issues and Trends96
seems to have more significance for the future than legislation mandates royalty relief for certain oil and gas
previously seen, according to anecdotal evidence. leases in at least 200 meters of water (656 feet) in the Gulf 11
Transmission Capacity
An essential factor needed for supporting offshore gas
supply operations is adequate transmission capacity tomove supplies to onshore pipelines and then to market.
Additional capacity of 2.6 billion cubic feet (Bcf) per day
was completed in 1998 to increase flow to onshore
Louisiana. This flow rate is the equivalent of 4 percent of
total U.S. gas production. Although it is generally
considered that the Gulf of Mexico transportation system is
virtually full, claims of actual capacity constraints have not
arisen to date. Further, new and expanded capacity in 1999
and 2000 is expected to total 2.0 Bcf per day at an
estimated cost of more than $410 million. While logistical12
difficulties may remain, no major bottlenecks appear likely
in moving gas onshore in the near term, although
requirements over the longer term are expected to be
extensive. One study estimated the cost of new
transportation pipelines in the offshore would exceed
$7 billion during the next 15 years.13
Deep Water Royalty Relief Act
One sign favorable to near-term supply prospects is the
resurgence in offshore blocks receiving bids in recent
leasing sales. Lease bids received by the Minerals
Management Service (MMS) for Gulf of Mexico tracts
offered in Federal lease sales averaged about 959 per year
from 1988 to 1990. From the relative high point of 1,079 tracts receiving bids in 1989, however, bidding
declined to a level of 212 in 1992. Beyond 1992, bidding
increased through 1997 when numbers reached their
highest levels in the past 10 years. In fact, the 863 tracts
receiving bids in 1995 were only slightly below the
943 bids received in the previous 2 years combined.
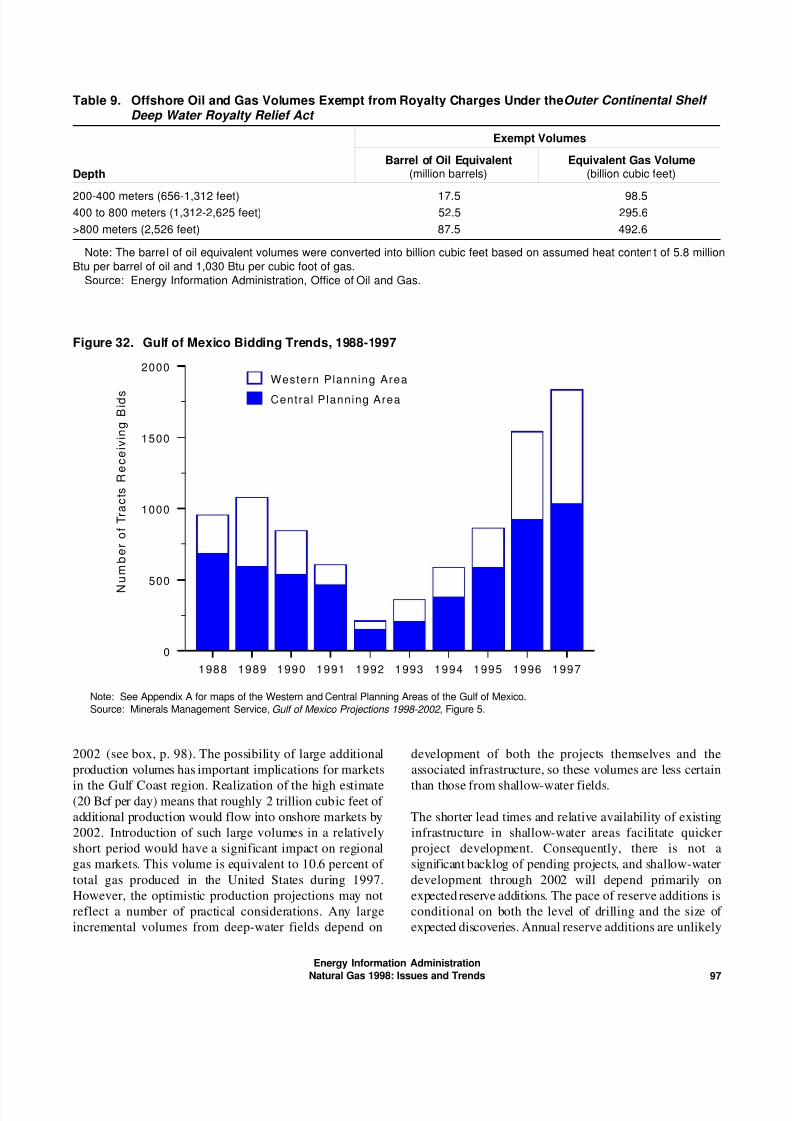
The upward trend in lease bidding was stimulated further
by the passage of The Outer Continental Shelf Deep Water
Royalty Relief Act (DWRRA) in November 1995. This
of Mexico. The deep-water zone is further divided into14
three parts for different levels of royalty relief (Table 9).
Production in excess of the stated levels is subject to
standard royalty charges. An eligible lease is one that
results from a sale held after November 28, 1995, of a tract200 meters or deeper, lying wholly west of 87 degrees
30 minutes west Longitude, and is offered subject to
royalty suspension volume authorized by statute. The
DWRRA seems to have stimulated interest in deep-water
prospects. Although the resurgence of offshore bidding
began before the DWRRA took effect, even the 863 bids in
1995 were more than 20 percent below the 1,079 bids
received 6 years earlier (Figure 32). There is a distinct
upward shift in the trend for the number of bids received in
1996 when the DWRRA took effect.
Although progress in accelerating development schedules
for deep-water projects has improved, they generally still
require 2 to 4 years. New fields discovered in the next few
years and developed according to a typical schedule likely
would not initiate production until after 2002. Thus, future
production from deep-water fields in the Gulf of Mexico
over the near term depends heavily on discoveries to date.
Near-Term Production Outlook
A sense of optimism is a common element in the outlook
for gas production from the Gulf of Mexico OCS,
particularly in light of a number of large deep-waterprojects that are awaiting development. But the immediate
outlook for gas production is more uncertain now than in
recent years because of some decline in shallow-water
activities. The gas production trends to date indicate that
the bulk of production in the offshore will flow from
shallow-water fields. Thus, if shallow-water fields do not
maintain their level of production, the offshore Gulf of
Mexico total likely will decline as reductions in the much
larger shallow-water production rates would more than
offset anticipated new deep-water gas production.
Significantly larger volumes from the Gulf would depend
heavily on new reserves from fields in both shallow anddeep waters.
Overall, offshore gas production from the Gulf of Mexico
is expected to range between 10 and 20 Bcf per day by
Limitations of personnel and equipment are not limited to the offshore.11
One company claims that it is unable to “utilize its full complement of drilling
rigs...due to the lack of qualified labor and certain supporting equipment not
only within the company but in the industry as a whole.” Further, the
company expects this to continue “throughout 1998 and into 1999.” Unit
Corporation, a contract drilling firm, as reported in their 10-Q report, June 30,
1998.
Additional detail on transmission projects can be found in Chapter 5,12
“Natural Gas Pipeline Network: Changing and Growing.”
Estimate cited in “INGAA Foundation Releases Updated Study On Gulf The footage equivalents of metric measures throughout this report are13
Of Mexico Resources And Pipeline Infrastructure,” Foster Report , No. 2185 determined on the basis of 1 meter equal to 39.37 inches. Source: Webster’s
(June 4, 1998). New Collegiate Dictionary, G. & C. Merriam Company (1976).
14
8/9/2019 Pipeline Gas Chapter4
http://slidepdf.com/reader/full/pipeline-gas-chapter4 7/18
1988 1989 1990 1991 1992 1993 1994 1995 1996 1997
0
500
1000
1500
2000
N
u m
b e r o
f T r a c
t s R e c e
i v i n g
B i d s
Western Planning Area
Central Planning Area
Energy Information Administration
Natural Gas 1998: Issues and Trends 97
Note: See Appendix A for maps of the Western and Central Planning Areas of the Gulf of Mexico.
Source: Minerals Management Service, Gulf of Mexico Projections 1998-2002 , Figure 5.
Figure 32. Gulf of Mexico Bidding Trends, 1988-1997
Table 9. Offshore Oil and Gas Volumes Exempt from Royalty Charges Under the Outer Continental Shelf Deep Water Royalty Relief Act
Exempt Volumes
DepthBarrel of Oil Equivalent Equivalent Gas Volume
(million barrels) (billion cubic feet)
200-400 meters (656-1,312 feet) 17.5 98.5400 to 800 meters (1,312-2,625 feet) 52.5 295.6
>800 meters (2,526 feet) 87.5 492.6
Note: The barrel of oil equivalent volumes were converted into billion cubic feet based on assumed heat content of 5.8 million
Btu per barrel of oil and 1,030 Btu per cubic foot of gas.
Source: Energy Information Administration, Office of Oil and Gas.
2002 (see box, p. 98). The possibility of large additional development of both the projects themselves and the
production volumes has important implications for markets associated infrastructure, so these volumes are less certain
in the Gulf Coast region. Realization of the high estimate than those from shallow-water fields.(20 Bcf per day) means that roughly 2 trillion cubic feet of
additional production would flow into onshore markets by The shorter lead times and relative availability of existing
2002. Introduction of such large volumes in a relatively infrastructure in shallow-water areas facilitate quicker
short period would have a significant impact on regional project development. Consequently, there is not a
gas markets. This volume is equivalent to 10.6 percent of significant backlog of pending projects, and shallow-water
total gas produced in the United States during 1997. development through 2002 will depend primarily on
However, the optimistic production projections may not expected reserve additions. The pace of reserve additions is
reflect a number of practical considerations. Any large conditional on both the level of drilling and the size of
incremental volumes from deep-water fields depend on expected discoveries. Annual reserve additions are unlikely
8/9/2019 Pipeline Gas Chapter4
http://slidepdf.com/reader/full/pipeline-gas-chapter4 8/18
Energy Information Administration
Natural Gas 1998: Issues and Trends98
Outlook Methodology
The outlook for offshore production in this chapter was developed using a scenario approach, in which low and highcases were developed by altering selected technical assumptions to demonstrate the range in results under reasonablypossible outcomes. Projections for gas and oil production were developed to account for both nonassociated (NA) gasand associated-dissolved (AD) gas. Most gas production in the deep-water regions has been as a coproduct of oil
projects, so AD gas projections are particularly important for this area. The projections were determined from availabledata on recent production, proved reserves, and reserves additions, as well as a number of related parameters. Theassumed technical parameters determine the projected production without explicitly incorporating current or expectedprices into the analysis. Actual production likely will differ from the projections owing to unforeseen circumstances, such
as variation in project timing, available transportation capacity, and fluctuations in market demands.
Projected production in each scenario consists of three elements: flows from currently producing fields in both shallowand deep waters, volumes from known deep-water fields undergoing or awaiting development, and production from newfield discoveries, which were derived from available offshore reserves and production information.
Low-case production from currently producing fields was based on an analytical method using the proved reservesestimates, both initially and as they are expected to “grow” over time. The reserves available in each time period are
produced according to the measured reserves-to-production (R/P) ratio, which is based on historical data. Reserve
growth was fitted to historical data and estimated using Minerals Management Service (MMS) Gulf of Mexico ratios. Thenatural decline in production performance more than offsets the gains from reserves growth, resulting in a decliningproduction profile. The high case for currently producing shallow- and deep-water fields was based on the assumptionof stable production. Detailed parameter assumptions were not established for this case, but it is deemed reasonableas a continuation of the general trend for production from shallow waters during recent years.
Volumes from known deep-water fields undergoing or awaiting development were incorporated into the projection
according to the announced schedule. The third element, production from new field discoveries, was derived fromavailable offshore reserves and production information. New field discovery volumes occur at the rate of 1.1 trillion cubicfeet per year, which is estimated from recent trends in the data. These volumes were adjusted to account for additionalrecovery growth and then produced according to the decline rate indicated by recent R/P ratios.
The high-case scenario results in increased offshore natural gas production up to 20 billion cubic feet (Bcf) per day by2002, although it also could decline significantly to 10 Bcf per day (Figure 33). The gas production outlook clearly
depends upon expected shallow-water production to a great extent. This is due to the relative size of the volumesproduced in shallow and deep fields. Reductions in the much larger shallow-water production rates can more than offsetanticipated new deep-water gas production, as seen in the low case. Total production in the low case declines eventhough new deep-water projects may add more than 1.9 Bcf per day by 2002. The importance of shallow-waterproduction is significant in light of the recent reduction of drilling efforts in these areas. The large incremental volumesfrom deep-water fields depend on development of both the projects themselves and the associated infrastructure, sothese volumes are less certain than those from shallow-water fields.
to increase significantly from historical levels because cannot proceed unconstrained. The number of rigs capable
of the expected declines in average field size and the of drilling in deep water is limited. In 1996 and 1997, 1,531
reduced levels of drilling in shallow waters. leases were granted in deep-water tracts with 10-year lease
Development of pending deep-water projects will offset only approximately 39 semi-submersibles and ships, with
some portion of any decline in shallow-water a capacity to drill four wells per year for each drillship, it
production—deep-water projects scheduled for initial would require more than 11 years to drill just a single well
production by 2002 may add more than 1.9 billion cubic in each lease. Given the uncertainties surrounding offshore
feet per day—but potential development in the deep waters development, any projections are subject to wide variation.
terms and 245 tracts with 8-year terms. As the industry has

8/9/2019 Pipeline Gas Chapter4
http://slidepdf.com/reader/full/pipeline-gas-chapter4 9/18
1997 1998 1999 2000 2001 2002
0
5
10
15
20
25
High Case
Low Case
B i l l i o n
C u b i c F e e t p e r D a y
Energy Information Administration
Natural Gas 1998: Issues and Trends 99
Figure 33. Projected Gas Production for the Federal Gulf of Mexico
Source: Energy Information Administration, Office of Oil and Gas.
Also, as noted earlier, factors contributing to uncertainty low case would produce instead a decline to 12.4 Bcf per
surrounding production outlooks for the Gulf of Mexico are day by 2002.
not limited to geologic risk, but include the relative
economics and available equipment and personnel. The low- and high-case scenario projections developed by
Perpetuation of the very high growth rates of the 1990s the Energy Information Administration (EIA) for this report
implies yearly increases in incremental production that show a wider range of possible variation than the MMSwould be a challenge in terms of available personnel and low- and high-gas scenarios. These differences arise for a
equipment and the required infrastructure. number of reasons. The MMS analysis was based on data
The deep-water regions to date have yielded fields with latest information and data available for offshore activities.
very large recoverable gas volumes. Estimates for potential These data and a greater production decline rate in the EIA
production have been quite optimistic regarding oil, with analysis result in lower projected gas production in the low-
growth in natural gas lagging behind. As one example, the case scenario, with EIA’s 10.1 Bcf per day in 2002 almost
Minerals Management Service (MMS) projected, in a high 20 percent below the MMS estimate. In contrast, the EIA
case, crude oil production from the entire Gulf of Mexico high-case scenario shows an estimated 19.8 Bcf per day,
in 2002 of 1,976 thousand barrels per day, which is a which exceeds the MMS value by 12 percent. The EIA
virtual doubling of its estimated December 1996 basis of estimate reflects the impact of more optimistic assumptions
1,047 thousand barrels per day. Even in the low case, MMS regarding the impact of field development on expected
still projected a gain of 59 percent by 2002 relative to the reserves and the likelihood of new discoveries.
end-of-1996 volume. MMS projected that gas production15
in the high case would rise by 24 percent, to 17.5 Bcf per The low- and high-case scenarios provide a reference range
day, during the same period. The conditions of the MMS of likely outcomes for offshore production, which can be
16
through June 1997, while the EIA scenarios incorporate the
All oil production figures in this chapter include lease condensate Daily Oil and Gas Production Rate Projections From 1998 Through 2002,15
liquids. OCS Report MMS 98-0013 (February 1998).
Minerals Management Service, Gulf of Mexico Outer Continental Shelf 16

8/9/2019 Pipeline Gas Chapter4
http://slidepdf.com/reader/full/pipeline-gas-chapter4 10/18
Energy Information Administration
Natural Gas 1998: Issues and Trends100
used to assess offshore outlooks. For example, the reference
case in EIA’s Annual Energy Outlook 1999 (AEO99) shows
offshore Gulf of Mexico gas production initially declining
by 13 percent from 1997 to 2000, then a reversal in trend
leads to production recovering to the 1997 level by 2002.
While the AEO99 volumes in the later years are well within
the expected range, production levels in 1998 and 1999 arebelow the low-case scenario. This discrepancy in the
analyses is attributable mainly to a difference in the
expected timing of changes driven by the recent severe
drop in prices. The AEO99 reference case and the low-case
scenario are consistent after adjusting for this lag.
The 1998 price decline caused significant declines in
certain industry activities, such as drilling and field
development, however, the lag between these changes and
production apparently is more extensive than previously
thought. The latest information from operators indicates
that, despite reductions in overall supply activities in the
offshore Gulf of Mexico, industry endeavors have yielded
sufficient new production volumes to offset any decline
from 1997 to 1998. (Production from the offshore is
expected to begin to show more dramatic declines in 1999.)
The extent of the response lag was not known at the time of
the AEO99, so this aspect of offshore supply was not
incorporated into that analysis. The response lag between
reduced industry activities in the offshore and the impact on
gas supplies apparently has obscured important trends
underlying present and future markets. As domestic gas
supplies decrease, prices should rise, although gas supply
increases expected elsewhere, including Canadian
supplies, should mitigate potential increases in wellhead17
gas prices.
The near-term outlook provides a number of insights
regarding the interplay of the underlying attributes of the
industry. The level of reserve additions assumed in each
case serves as a limiting factor that cannot support
continued production growth. Expanding production
volumes require a corresponding growth in the sequence of
reserve additions, otherwise reserves are not replenished
and the reserve stock declines. Further gains in production
might be achieved with higher extraction rates from the
existing proved reserve stock, but production growth as a
result of such attempts is not sustainable.
Economics of Offshore
Investments
The success of offshore production activities has occurred
despite the exceptionally large dollar amounts required for
development. Deep-water projects in particular haveassociated investment costs that may exceed $1 billion,18
thus requiring a favorable geology base to be successful.
Initial recovery estimates for individual fields in deep
waters have been in the range of hundreds of billions of
cubic feet, with ultimate recovery possibly approaching 1
trillion cubic feet in some cases. Fields of such magnitude
are exceptional but offshore fields in general dwarf those
expected to be found elsewhere in the Lower 48 States and
they are a clear enticement for operators to pursue
additional offshore supplies.
The presence of hydrocarbons alone is not sufficient topromote production without both favorable economics and
a means to operate in such extreme circumstances. Large
volume fields allow relatively fixed costs, such as those for
discovery wells or production platforms, to be spread over
many more units, lowering the average fixed cost per unit.
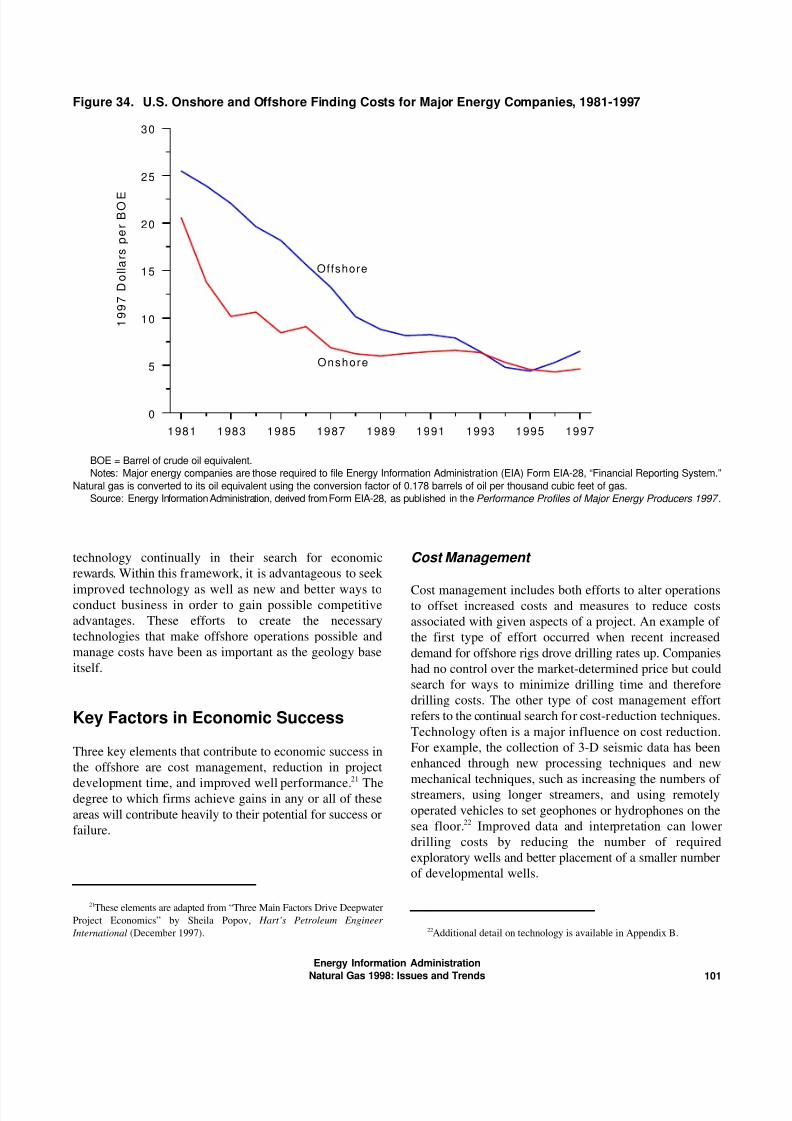
This tendency is apparent in the finding costs data for the
large major U.S. energy companies. The finding costs for19
oil and gas combined in all water depths of the offshore
declined from $15 per barrel of oil equivalent (BOE) to
$4 per BOE (1997 dollars) in the 10 years from 1986 to
1996. The differential in finding costs between the
relatively low-cost onshore and the offshore was all but
eliminated until a slight surge in offshore finding costsappeared. Despite the recent increase, offshore finding costs
remain below levels in 1992 and earlier years (Figure 34).20
It is misleading, however, to attribute the success of the
industry in offshore regions to the discovery of large fields
alone. There have been tremendous strides in innovation
and technology that have refined virtually all aspects of
exploratory and developmental costs and productivity.
Competition drives operators to push the limits of
A discussion of pending projects expected to increase U.S. imports of Energy Producers 1996 , DOE/EIA-0206(96) (Washington, DC,17
Canadian gas can be found in Chapter 1 of this report. January 1998).
The initial development phase for Shell’s Mars project is estimated to18
cost $1 billion, as reported in <http://www.offshore-technology.com/projects/
mars>.
These companies are those required to file Form EIA-28, “Financial19
Reporting System,” pursuant to Section 205(h) of the Department of Energy
Organization Act. In 1996, 24 companies filed Form EIA-28. These data are
for the offshore, including both shallow- and deep-water operations. The data
are used here as a representative sample for illustrative purposes.
Energy Information Administration, Performance Profiles of Major 20
8/9/2019 Pipeline Gas Chapter4
http://slidepdf.com/reader/full/pipeline-gas-chapter4 11/18
1981 1983 1985 1987 1989 1991 1993 1995 1997
0
5
10
15
20
25
30
1 9 9 7
D o l l a r s p e r B O E
Offshore
Onshore
Energy Information Administration
Natural Gas 1998: Issues and Trends 101
Figure 34. U.S. Onshore and Offshore Finding Costs for Major Energy Companies, 1981-1997
BOE = Barrel of crude oil equivalent.
Notes: Major energy companies are those required to file Energy Information Administration (EIA) Form EIA-28, “Financial Reporting System.”
Natural gas is converted to its oil equivalent using the conversion factor of 0.178 barrels of oil per thousand cubic feet of gas.
Source: Energy Information Administration, derived from Form EIA-28, as published in the Performance Profiles of Major Energy Producers 1997 .
technology continually in their search for economic
rewards. Within this framework, it is advantageous to seek
improved technology as well as new and better ways toconduct business in order to gain possible competitive
advantages. These efforts to create the necessary
technologies that make offshore operations possible and
manage costs have been as important as the geology base
itself.
Key Factors in Economic Success
Three key elements that contribute to economic success in
the offshore are cost management, reduction in project
development time, and improved well performance. The21
degree to which firms achieve gains in any or all of these
areas will contribute heavily to their potential for success or
failure.
Cost Management
Cost management includes both efforts to alter operationsto offset increased costs and measures to reduce costs
associated with given aspects of a project. An example of
the first type of effort occurred when recent increased
demand for offshore rigs drove drilling rates up. Companies
had no control over the market-determined price but could
search for ways to minimize drilling time and therefore
drilling costs. The other type of cost management effort
refers to the continual search for cost-reduction techniques.
Technology often is a major influence on cost reduction.
For example, the collection of 3-D seismic data has been
enhanced through new processing techniques and new
mechanical techniques, such as increasing the numbers of streamers, using longer streamers, and using remotely
operated vehicles to set geophones or hydrophones on the
sea floor. Improved data and interpretation can lower22
drilling costs by reducing the number of required
exploratory wells and better placement of a smaller number
of developmental wells.
These elements are adapted from “Three Main Factors Drive Deepwater21
Project Economics” by Sheila Popov, Hart’s Petroleum Engineer
International (December 1997). Additional detail on technology is available in Appendix B.22
8/9/2019 Pipeline Gas Chapter4
http://slidepdf.com/reader/full/pipeline-gas-chapter4 12/18
Energy Information Administration
Natural Gas 1998: Issues and Trends102
Cost reductions are achieved in a number of other ways. day, and the single Mustique well, which produces at
Outsourcing of certain services can allow for the sharing of 25 MMcf per day.
resources to avoid the cost of being on site 24 hours per
day. For example, inspection of operational equipment by
qualified contractor personnel and equipment on a part-time
basis allows those resources to be used for multiple
projects. As costs are shared across a larger volume of service, the costs associated with any one project decline.
Despite potential economic advantages, outsourcing is an
area of concern for the Minerals Management Service
(MMS). The MMS has issued a notice regarding possible
waivers from daily inspection requirements, which may
prove essential for marginally economic projects. Used23
equipment is becoming another important factor even for
deep-water operations. This approach allows for both direct
cost savings and reduction in delivery time to the site.
Another cost-saving option is subsea well completions and
transportation tiebacks to nearby platforms for production
processing. This has been a promising approach to offshore
development in deep waters. This approach lowers overall
project cost by avoiding the cost of a production platform
at the water’s surface dedicated solely to a single project.24
The record to date for a tieback is the 68-mile transmission
system connecting the Mensa subsea completions with the
production platform at West Delta 143. This record is not
expected to be broken anytime soon, owing to the
substantial costs of the transmission system.
The Shasta and Mustique projects, in water depths between
830 and 1,040 feet of water, are prime examples of the25
importance of cost management. These projects were
released by major companies to Hardy Oil and Gas USAInc. for development. Management of these projects
focused on development of a project team with active
vendor participation to allow the inclusion of their expertise
in all phases of the project. The approach to develop both
fields was to employ subsea completions with tiebacks to
existing production platforms. Additional cost savings were
achieved by the use of specialized equipment to complete
the wells at Shasta, which is expected to reduce operating
costs by 15 percent over the life of the wells. Successful
project development can be seen in the Shasta wells, each
of which can produce 30 million cubic feet (Mmcf) per
Accelerated Project Development
The success of the Shasta and Mustique projects
underscores the importance of adequate planning to ensureboth optimal resource recovery and a strong economic
return on investment. However, as experience in offshore
operations grows, companies’ need for measured caution
lessens and firms emphasize timely activity in their
approaches to project development. The goal is to
accelerate development, which increases the expected net
financial return by yielding an earlier economic return and
reducing the carrying costs of early expenditures on leases,
geology and geophysical work, and exploratory drilling.
Design improvements between the Auger (initial
production in 1994) and Mars (initial production in 1996)
projects, both at water depths of approximately 2,900 feet,
allowed Shell to cut the construction period to 9 months
with a saving of $120 million. Accelerated development26
enhances economic attractiveness by reducing project
uncertainty because adverse changes in market price for the
commodity or factor costs become more of a possibility as
development time lengthens.
One approach to achieve revenues as soon as reasonable is
the use of a subsea completion and transportation of
production to an existing platform. A key advantage to this
approach is that it provides an early contribution to project
returns while additional engineering and design work forthe full project proceeds. Another approach being
developed especially for deep-water project development is
in the overlapping of design phases and construction.
Improvements in technology and project management
allowed Shell Deepwater to develop the Ursa project in
about the same calendar time as its Mars and Ram-Powell
projects, even though Ursa is roughly twice their size.
Development for offshore projects in general had ranged up
to 5 years previously, with deep projects requiring up to
10 years. Recent field development has been accelerated
with the period from discovery to first production in
Gregg Falgout, “Outsourcing Lowers Costs,” Hart’s Oil and Gas World 23
(April 1998), pp. 33-34.
This option is quite attractive to the operator of the production platform,24
who charges for the processing service. Anecdotal evidence indicates that the
platform operator in some cases may profit more from the project than the
production operators.
The Shasta project consists of two wells, separated by 1.5 miles, in Minerals Management Service, Deepwater in the Gulf of Mexico:25
860 and 1,040 feet of water. America’s New Frontier , OCS Report MMS 97-0004 (February 1997).
26
8/9/2019 Pipeline Gas Chapter4
http://slidepdf.com/reader/full/pipeline-gas-chapter4 13/18
Energy Information Administration
Natural Gas 1998: Issues and Trends 103
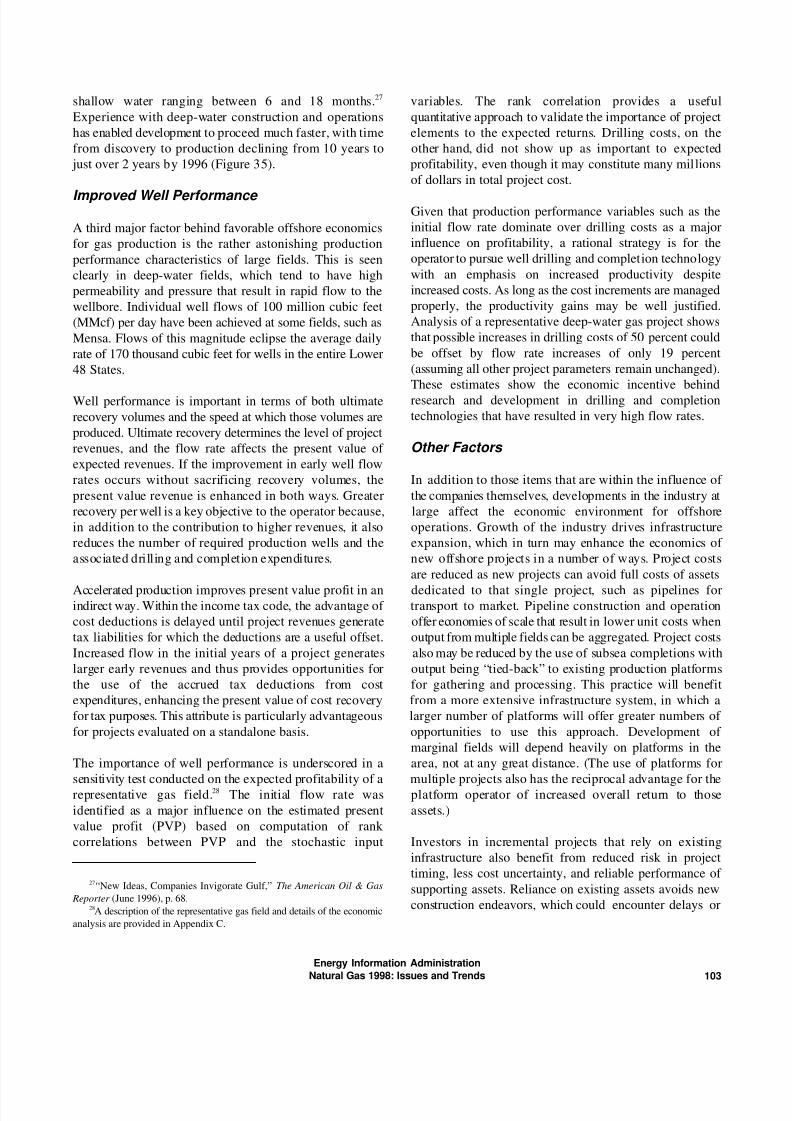
shallow water ranging between 6 and 18 months. variables. The rank correlation provides a useful27
Experience with deep-water construction and operations quantitative approach to validate the importance of project
has enabled development to proceed much faster, with time elements to the expected returns. Drilling costs, on the
from discovery to production declining from 10 years to other hand, did not show up as important to expected
just over 2 years by 1996 (Figure 35). profitability, even though it may constitute many millions
Improved Well Performance
A third major factor behind favorable offshore economics
for gas production is the rather astonishing production
performance characteristics of large fields. This is seen
clearly in deep-water fields, which tend to have high
permeability and pressure that result in rapid flow to the
wellbore. Individual well flows of 100 million cubic feet
(MMcf) per day have been achieved at some fields, such as
Mensa. Flows of this magnitude eclipse the average daily
rate of 170 thousand cubic feet for wells in the entire Lower
48 States.
Well performance is important in terms of both ultimate
recovery volumes and the speed at which those volumes are
produced. Ultimate recovery determines the level of project
revenues, and the flow rate affects the present value of
expected revenues. If the improvement in early well flow
rates occurs without sacrificing recovery volumes, the In addition to those items that are within the influence of
present value revenue is enhanced in both ways. Greater the companies themselves, developments in the industry at
recovery per well is a key objective to the operator because, large affect the economic environment for offshore
in addition to the contribution to higher revenues, it also operations. Growth of the industry drives infrastructure
reduces the number of required production wells and the expansion, which in turn may enhance the economics of
associated drilling and completion expenditures. new offshore projects in a number of ways. Project costs
Accelerated production improves present value profit in an dedicated to that single project, such as pipelines forindirect way. Within the income tax code, the advantage of transport to market. Pipeline construction and operation
cost deductions is delayed until project revenues generate offer economies of scale that result in lower unit costs when
tax liabilities for which the deductions are a useful offset. output from multiple fields can be aggregated. Project costs
Increased flow in the initial years of a project generates also may be reduced by the use of subsea completions with
larger early revenues and thus provides opportunities for output being “tied-back” to existing production platforms
the use of the accrued tax deductions from cost for gathering and processing. This practice will benefit
expenditures, enhancing the present value of cost recovery from a more extensive infrastructure system, in which a
for tax purposes. This attribute is particularly advantageous larger number of platforms will offer greater numbers of
for projects evaluated on a standalone basis. opportunities to use this approach. Development of
The importance of well performance is underscored in a area, not at any great distance. (The use of platforms for
sensitivity test conducted on the expected profitability of a multiple projects also has the reciprocal advantage for therepresentative gas field. The initial flow rate was platform operator of increased overall return to those28
identified as a major influence on the estimated present assets.)
value profit (PVP) based on computation of rank
correlations between PVP and the stochastic input Investors in incremental projects that rely on existing
of dollars in total project cost.
Given that production performance variables such as the
initial flow rate dominate over drilling costs as a major
influence on profitability, a rational strategy is for the
operator to pursue well drilling and completion technology
with an emphasis on increased productivity despite
increased costs. As long as the cost increments are managed
properly, the productivity gains may be well justified.
Analysis of a representative deep-water gas project shows
that possible increases in drilling costs of 50 percent could
be offset by flow rate increases of only 19 percent
(assuming all other project parameters remain unchanged).
These estimates show the economic incentive behind
research and development in drilling and completion
technologies that have resulted in very high flow rates.
Other Factors
are reduced as new projects can avoid full costs of assets
marginal fields will depend heavily on platforms in the
infrastructure also benefit from reduced risk in project
timing, less cost uncertainty, and reliable performance of
supporting assets. Reliance on existing assets avoids new
construction endeavors, which could encounter delays or
“New Ideas, Companies Invigorate Gulf,” The American Oil & Gas27
Reporter (June 1996), p. 68.
A description of the representative gas field and details of the economic28
analysis are provided in Appendix C.
8/9/2019 Pipeline Gas Chapter4
http://slidepdf.com/reader/full/pipeline-gas-chapter4 14/18
1976
1984
19851986
1987
1988
1989
1990
1991
1992
1993
1994
1995
1996
0 2 4 6 8 10 12
Y e a r o
f D i s c o v e r y
Years Between Discovery and Production
Energy Information Administration
Natural Gas 1998: Issues and Trends104
Figure 35. Cycle Time for Deep-Water Projects
Note: Cycle times are for projects in production or under development. Prospects without a scheduled start date are excluded.
Source: Energy Information Administration, Office of Oil and Gas.
unforeseen events that cause the project to fail outright. In
conducting project evaluation, such risk factors do not
necessarily preclude construction, but they can raise unit
costs for the associated service, thus reducing the net priceor profit received by the producers. The net price received
by producers is determined as the netback from the market
price after accounting for transportation and other services,
if any. While the markets may not yield a price sufficient to
ensure a favorable return for the production project, the net
price received by producers is subject to less risk if the
needed infrastructure is in-place and available. Reduced
risk enhances the expected profitability outlook for the
project, which underscores the importance of new pipeline
construction projects for improving the economic outlook
for this region. As economic returns for marginal fields29
improve, the minimum economic field size becomes
smaller, resulting in ever-greater volumes of economically
recoverable hydrocarbon volumes.
Environmental Aspects of
Offshore Operations
The oil and gas industry has conducted offshore activities
for more than 5 decades. As a key contributor to the
Nation’s energy supplies, the industry has periodically
found itself in the midst of a tense debate concerning the
proper balance of sometimes conflicting interests in the
offshore. Numerous people and companies are concerned
with the offshore and its coastal regions as a resource to
provide residential areas, wildlife habitat, recreation,
fishing and agriculture, in addition to oil and gas
operations. Government agencies have tried with various
strategies and policies to reflect the will of the people in
managing the offshore regions including the coastal areas.In 1953, Congress designated the Secretary of the Interior
to administer mineral exploration and development of the
OCS through the Outer Continental Shelf Lands Act
(OCSLA). While the OCS is under Federal jurisdiction,
federally approved activities must be as consistent as
possible with approved State management programs.
After the OCSLA, the next major legislation affecting
offshore operations was the National Environmental PolicyAdditional information on new pipeline construction and capacity29
expansion is available in Chapter 5 of this report.
8/9/2019 Pipeline Gas Chapter4
http://slidepdf.com/reader/full/pipeline-gas-chapter4 15/18
Energy Information Administration
Natural Gas 1998: Issues and Trends 105
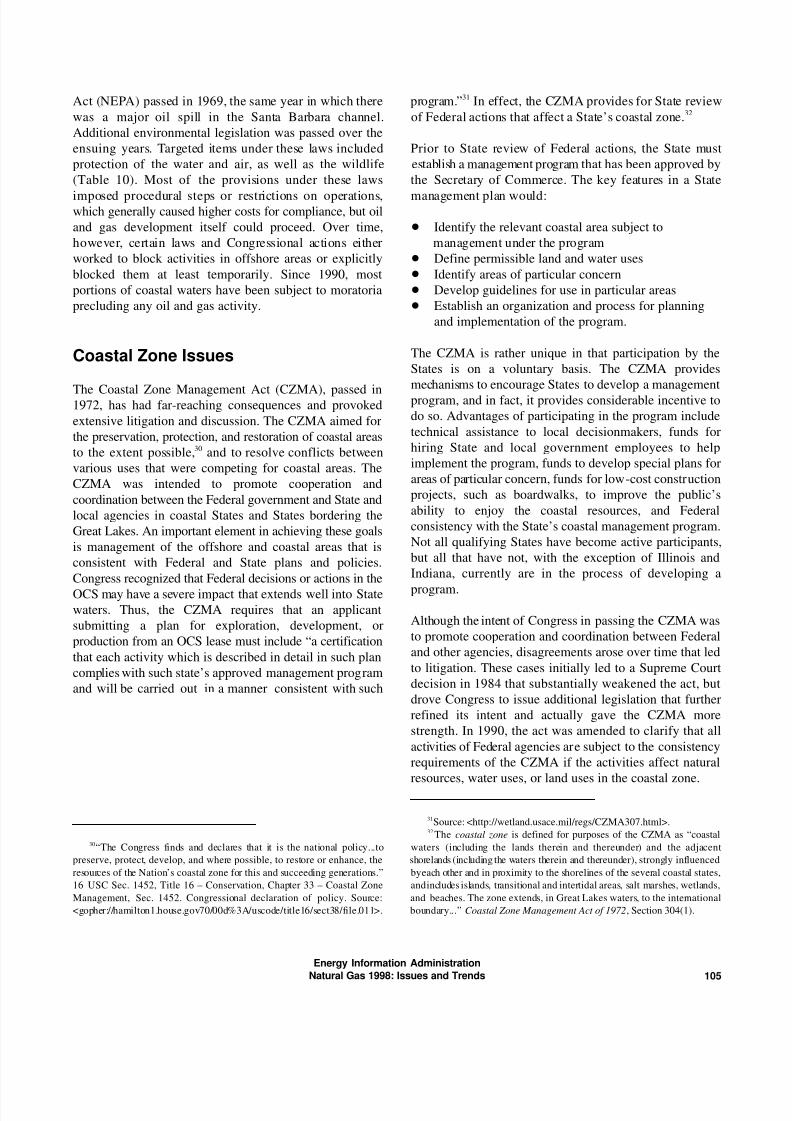
Act (NEPA) passed in 1969, the same year in which there program.” In effect, the CZMA provides for State review
was a major oil spill in the Santa Barbara channel. of Federal actions that affect a State’s coastal zone.
Additional environmental legislation was passed over the
ensuing years. Targeted items under these laws included Prior to State review of Federal actions, the State must
protection of the water and air, as well as the wildlife establish a management program that has been approved by
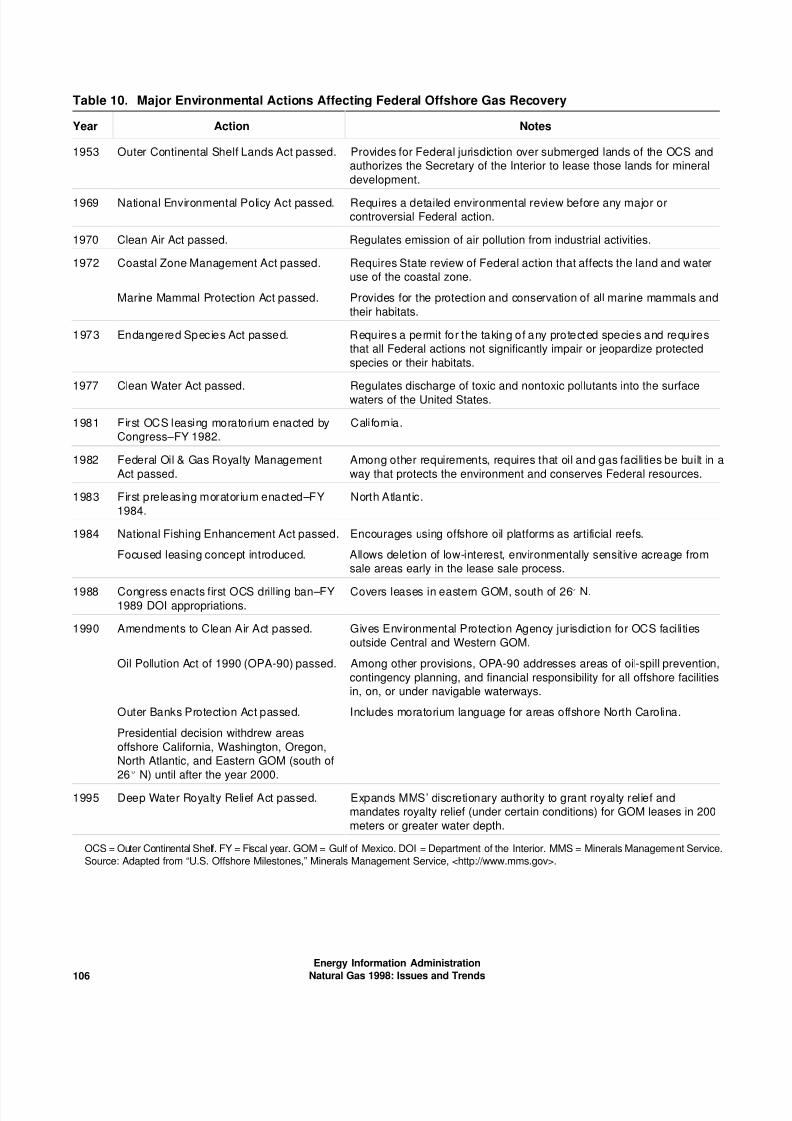
(Table 10). Most of the provisions under these laws the Secretary of Commerce. The key features in a State
imposed procedural steps or restrictions on operations, management plan would:which generally caused higher costs for compliance, but oil
and gas development itself could proceed. Over time, ü Identify the relevant coastal area subject to
however, certain laws and Congressional actions either management under the program
worked to block activities in offshore areas or explicitly ü Define permissible land and water uses
blocked them at least temporarily. Since 1990, most ü Identify areas of particular concern
portions of coastal waters have been subject to moratoria ü Develop guidelines for use in particular areas
precluding any oil and gas activity. ü Establish an organization and process for planning
Coastal Zone Issues
The Coastal Zone Management Act (CZMA), passed in1972, has had far-reaching consequences and provoked
extensive litigation and discussion. The CZMA aimed for
the preservation, protection, and restoration of coastal areas
to the extent possible, and to resolve conflicts between30
various uses that were competing for coastal areas. The
CZMA was intended to promote cooperation and
coordination between the Federal government and State and
local agencies in coastal States and States bordering the
Great Lakes. An important element in achieving these goals
is management of the offshore and coastal areas that is
consistent with Federal and State plans and policies.
Congress recognized that Federal decisions or actions in the
OCS may have a severe impact that extends well into Statewaters. Thus, the CZMA requires that an applicant
submitting a plan for exploration, development, or
production from an OCS lease must include “a certification
that each activity which is described in detail in such plan
complies with such state’s approved management program
and will be carried out in a manner consistent with such
31
32
and implementation of the program.
The CZMA is rather unique in that participation by the
States is on a voluntary basis. The CZMA provides
mechanisms to encourage States to develop a management
program, and in fact, it provides considerable incentive to
do so. Advantages of participating in the program include
technical assistance to local decisionmakers, funds for
hiring State and local government employees to help
implement the program, funds to develop special plans for
areas of particular concern, funds for low-cost construction
projects, such as boardwalks, to improve the public’s
ability to enjoy the coastal resources, and Federal
consistency with the State’s coastal management program.
Not all qualifying States have become active participants,
but all that have not, with the exception of Illinois and
Indiana, currently are in the process of developing a
program.
Although the intent of Congress in passing the CZMA was
to promote cooperation and coordination between Federal
and other agencies, disagreements arose over time that led
to litigation. These cases initially led to a Supreme Court
decision in 1984 that substantially weakened the act, but
drove Congress to issue additional legislation that further
refined its intent and actually gave the CZMA more
strength. In 1990, the act was amended to clarify that all
activities of Federal agencies are subject to the consistency
requirements of the CZMA if the activities affect natural
resources, water uses, or land uses in the coastal zone.
“The Congress finds and declares that it is the national policy...to waters (including the lands therein and thereunder) and the adjacent30
preserve, protect, develop, and where possible, to restore or enhance, the shorelands (including the waters therein and thereunder), strongly influenced
resources of the Nation’s coastal zone for this and succeeding generations.” by each other and in proximity to the shorelines of the several coastal states,
16 USC Sec. 1452, Title 16 – Conservation, Chapter 33 – Coastal Zone and includes islands, transitional and intertidal areas, salt marshes, wetlands,
Management, Sec. 1452. Congressional declaration of policy. Source: and beaches. The zone extends, in Great Lakes waters, to the international
<gopher://hamilton1.house.gov70/00d%3A/uscode/title16/sect38/file.011>. boundary...” Coastal Zone Management Act of 1972, Section 304(1).
Source: <http://wetland.usace.mil/regs/CZMA307.html>.31
The coastal zone is defined for purposes of the CZMA as “coastal32
8/9/2019 Pipeline Gas Chapter4
http://slidepdf.com/reader/full/pipeline-gas-chapter4 16/18
Energy Information Administration
Natural Gas 1998: Issues and Trends106
Table 10. Major Environmental Actions Affecting Federal Offshore Gas Recovery
Year Action Notes
1953 Outer Continental Shelf Lands Act passed. Provides for Federal jurisdiction over submerged lands of the OCS and
authorizes the Secretary of the Interior to lease those lands for mineral
development.
1969 National Environmental Policy Act passed. Requires a detailed environmental review before any major or
controversial Federal action.
1970 Clean Air Act passed. Regulates emission of air pollution from industrial activities.
1972 Coastal Zone Management Act passed. Requires State review of Federal action that affects the land and water
Marine Mammal Protection Act passed. Provides for the protection and conservation of all marine mammals and
use of the coastal zone.
their habitats.
1973 Endangered Species Act passed. Requires a permit for the taking of any protected species and requires
that all Federal actions not significantly impair or jeopardize protected
species or their habitats.
1977 Clean Water Act passed. Regulates discharge of toxic and nontoxic pollutants into the surface
waters of the United States.
1981 First OCS leasing moratorium enacted by California.
Congress–FY 1982.
1982 Federal Oil & Gas Royalty Management Among other requirements, requires that oil and gas facilities be built in a
Act passed. way that protects the environment and conserves Federal resources.
1983 First preleasing moratorium enacted–FY North Atlantic.
1984.
1984 National Fishing Enhancement Act passed. Encourages using offshore oil platforms as artificial reefs.
Focused leasing concept introduced. Allows deletion of low-interest, environmentally sensitive acreage from
sale areas early in the lease sale process.
1988 Congress enacts first OCS drilling ban–FY Covers leases in eastern GOM, south of 26( N.1989 DOI appropriations.
1990 Amendments to Clean Air Act passed. Gives Environmental Protection Agency jurisdiction for OCS facilities
Oil Pollution Act of 1990 (OPA-90) passed. Among other provisions, OPA-90 addresses areas of oil-spill prevention,
Outer Banks Protection Act passed. Includes moratorium language for areas offshore North Carolina.
Presidential decision withdrew areas
offshore California, Washington, Oregon,
North Atlantic, and Eastern GOM (south of
26( N) until after the year 2000.
outside Central and Western GOM.
contingency planning, and financial responsibility for all offshore facilities
in, on, or under navigable waterways.
1995 Deep Water Royalty Relief Act passed. Expands MMS’ discretionary authority to grant royalty relief and
mandates royalty relief (under certain conditions) for GOM leases in 200
meters or greater water depth.
OCS = Outer Continental Shelf. FY = Fiscal year. GOM = Gulf of Mexico. DOI = Department of the Interior. MMS = Minerals Management Service.
Source: Adapted from “U.S. Offshore Milestones,” Minerals Management Service, <http://www.mms.gov>.

8/9/2019 Pipeline Gas Chapter4
http://slidepdf.com/reader/full/pipeline-gas-chapter4 17/18
Energy Information Administration
Natural Gas 1998: Issues and Trends 107
Florida and North Carolina are using the CZMA attracts other creatures to eventually form a complex food
consistency provisions to block exploration and chain.
development of OCS prospects, which are thought to be
largely gas prone. Critics of the CZMA have characterized The Minerals Management Service has encouraged the
this law as “the ‘veto’ law” because of the powerful role “rigs to reefs” option owing to its environmental and33
delegated to the States, and States certainly have used its economic advantages. In 1983, MMS announced its
provisions to impede and obstruct Federal activities within support for the program, and in 1985 announced a formaltheir jurisdictions, such as oil and gas leasing. However, policy on it. Under the rigs to reefs program, companies
decisions regarding offshore activities under the provisions donate structures, install the reefs, and may make financial
of the CZMA are based on the States’ management program donations to the States from any realized savings related to
that has previously been approved at the Federal level by avoided disposal costs. In cases with high relocation costs,
the Secretary of Commerce. Thus, the outcome reflects such as moving a rig from the Gulf to the east coast of
coordinated planning on a Federal and State basis, and it Florida, there may be no savings to allow for a donation to
generally cannot be circumscribed by the program the State. However, the donation of the platform and
objectives of a single Federal or State agency. absorption of transportation costs by the company provides
Artificial Reefs
Although support for offshore oil and gas development
varies among the States, it has a long history of acceptance
in the Gulf of Mexico. Activities have been conducted for
decades off Texas and Louisiana, with industry operations
extending more recently into areas off the coasts of
Mississippi, Alabama, and Florida.
While problems have occurred from time to time, a number
of benefits have flowed from offshore operations. The more
readily apparent ones include valuable supplies of oil and
gas, government revenues, and employment. An additional
benefit comes in the form of artificial reefs formed by the
placement of obsolete operating platforms or rigs. Anartificial reef refers to the placement of a man-made object
on the sea bottom, which then becomes part of the
ecosystem. This is particularly beneficial in the Gulf of
Mexico given that the submerged terrain generally is flat
and sandy, lacking hard structures on which invertebrates
and plants can attach themselves.
The success of artificial structures in providing food and
shelter for a host of fish species has led to the use of
various materials for this purpose. Ships, airplanes, buses,
bridge rubble, old tires and other items have been installed
as artificial reefs with varying degrees of success. Trainboxcars have been found to deteriorate greatly within a year
or two of placement. Items also may shift and move when
subjected to currents. Abandoned oil and gas platforms,
however, were designed for a marine environment and so
are quite durable and they tend to be secure. New rigs tend
to become covered within 6 months to a year, which in turn
the State the opportunity to gain the benefits while avoiding
the costs otherwise associated with the installation of an
artificial reef.
The first planned rigs to reef conversion occurred in 1979
with the relocation of an Exxon experimental
subsea template from offshore Louisiana to a permitted site
off Florida. To date, at least 120 structures have been used
for the creation of artificial reefs, with 72 off Louisiana,
39 off Texas, 3 off Alabama, and 6 off Florida. Financial
contributions to the States from the companies exceed
$15 million. The advantages to the State from the program34
include the environmental benefits and funds for the
management of marine habitat, enhanced recreational areas,
and the companies benefit from lower dismantling costs.
Outlook
Relatively low gas and oil prices during 1998 have made
the outlook for offshore supply activities in the next year or
two rather uncertain. However, a recovery in prices or
further improvement in cost management, project cycle
reduction, or well productivity can help to mitigate the
impact of these price levels. Technology has contributed
greatly to improved performance in the offshore. Much of
the current attention is focused on technology
enhancements that make the deep-water and subsalt fields
increasingly attractive as investment options. However, thebulk of production historically has come from conventional
fields in shallow-water regions of the Gulf of Mexico, and
this trend is expected to persist for some time to come.
Much of the technology that holds promise for great returns
Coastal Zone Management Act , <http://moby.ucdavis.edu/GAWS/161/ Figures provided by Villere Reggio of the Minerals Management33
2metro/CZMA.html>. Service, Gulf of Mexico OCS Region (October 5, 1998).
34
8/9/2019 Pipeline Gas Chapter4
http://slidepdf.com/reader/full/pipeline-gas-chapter4 18/18
Energy Information Administration
in the deep-water areas also has wide applicability in natural gas resources. Recoverable gas resources in
shallow depths. undiscovered fields in the Federal waters of the Gulf of
Production in the longer term naturally depends on the (MMS) to be 96 trillion cubic feet (Tcf), with an additional
trend in discoveries, which is itself conditional on geologic 37 Tcf to be proven in already known fields. Combined
and economic factors. A key geologic factor is the field size with the 29 Tcf already in proved reserves for this area, this
distribution, which generally is expected to be highly is equivalent to the 1997 estimate of 165 Tcf in provedskewed with few very large fields and increasing numbers reserves for the entire United States.
as field size declines. The largest fields, being less
challenging to find, tend to be discovered first, so The estimated 96 Tcf in undiscovered fields represents the
exploration efforts yield diminishing volumes of reserve volumes of gas that are expected to be recoverable by
additions over time as smaller fields are discovered. While conventional techniques, but without regard to the35
even these smaller fields are likely to be large compared economic merit of recovery. As the economics for the
with those found in other regions in the Lower 48 States, offshore Gulf of Mexico improves, the portion of the
this perspective on resources leads to declining returns to technically recoverable resource base that is expected to be
exploration. However, exceptions to the theoretical recovered expands considerably. Industry success in its
discovery model occur often. One recent example is the efforts to manage costs, reduce cycle time, and increase
King discovery, about 70 miles southest of Louisiana in the productivity enhances the expected economic return for
Mars Basin, where development plans had not been marginal fields, allowing the minimum economic field size
completed when two additional “major” oil-bearing zones at each water depth to become smaller. The apparent
were discovered. Given the Mars and Ursa fields already success of offshore operators in improving costs and36
had been discovered in the Mars basin, this is a rather productivity has increased the set of economically viable
promising development. Elsewhere, after disappointments fields beyond the numbers previously anticipated for the
in the pursuit of subsalt prospects led to a relative lull in offshore and, in particular, the deep-water regions. Because
activity industry-wide, Anadarko announced a major of the highly skewed distribution of field sizes, the
subsalt discovery in shallow water that should contain at inclusion of ever smaller fields multiplies the number of
least 140 million barrels of crude oil equivalent (BOE), economically viable fields, which expands the
with reasonable potential of exceeding 200 million BOE. economically recoverable portion of the total, although by37
The frequency of these unexpected events indicates that
declining offshore reserve additions with no relief is not an In conclusion, the supply outlook for the Gulf of Mexico
inevitable outcome. Additionally, annual reserve additions shows considerable potential for growth. Although thealso relate to the number of wells drilled, which is relatively low oil and gas prices for much of 1998 have led
influenced by economic factors. The timing of the to reduced drilling in the shallow waters of the Gulf, over
exploitation of the resource base will depend on costs, the long term, gas supplies from the Gulf of Mexico
productivity, and the evolving infrastructure. Production undoubtedly are going to be very large in light of the
over a sustained period cannot expand unless reserve estimated recoverable resource volumes. The timing of the
additions increase. resource development is subject to both market and
The optimistic consensus regarding the long-term supply shallow- and deep-water regions potentially are so large
potential of the offshore Gulf region is heavily influenced that the supply outlook has important implications for both
by the prodigious estimates of remaining recoverable regional markets and the Lower 48 States as a whole.
Mexico are estimated by the Minerals Management Service
less than a proportionate amount.
technical influences. The expected flow volumes from both
Declining volumetric returns to exploratory drilling over time do not35
require that successive discovered fields are strictly smaller. The search
process is not perfect and the outcome for any year represents the aggregation
of fields of different sizes. The yearly average volume per discovery will
decline as the set of yearly discoveries shifts from larger to smaller sizes.
“Vastar hits deep zones at Gulf prospect,” Oilgram News36
(July 23, 1998), p. 3.
“Anadarko announces big subsalt discovery,” Oilgram News37
(July 30, 1998), p. 1.