Piedmont Unified School District - PUSD Bond · · 2016-06-21Piedmont Unified School District...
31
Piedmont Unified School District 2006 General Obligation Bonds, Election of 2006, Series A Rating Presentation to: June 30, 2006
-
Upload
truongquynh -
Category
Documents
-
view
214 -
download
0
Transcript of Piedmont Unified School District - PUSD Bond · · 2016-06-21Piedmont Unified School District...
Piedmont Unified School District2006 General Obligation Bonds, Election of 2006, Series A
Rating Presentation to:
June 30, 2006
1
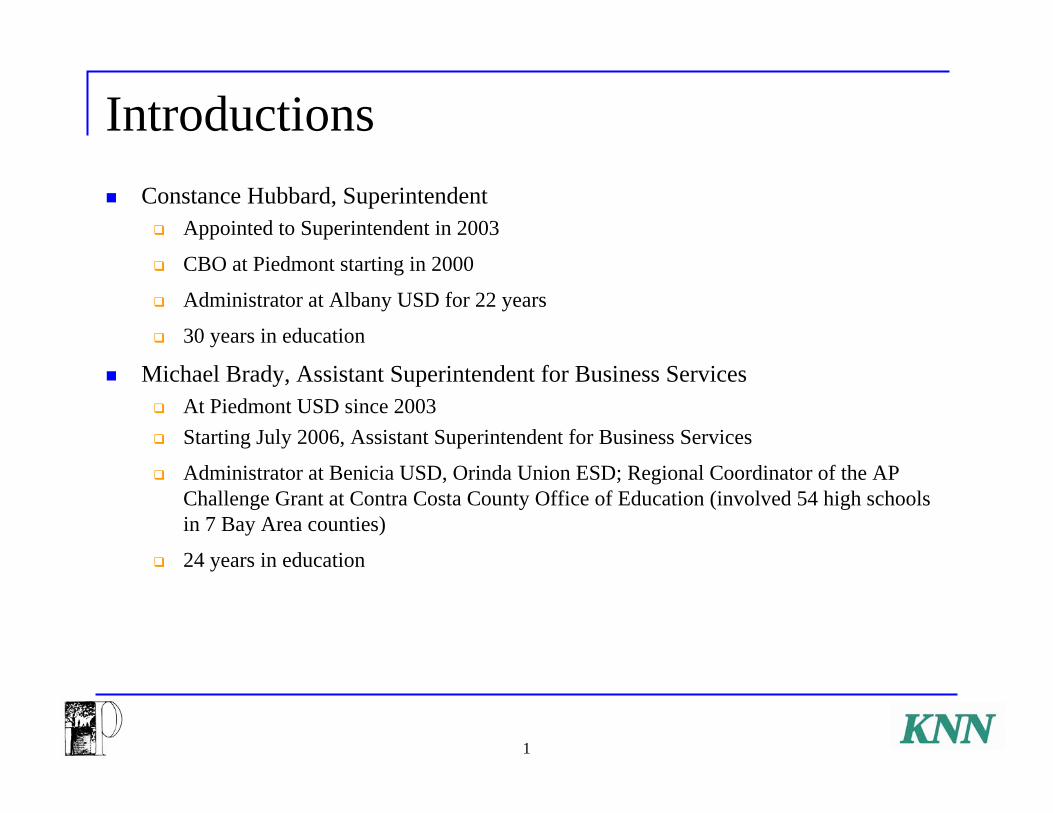
IntroductionsConstance Hubbard, Superintendent
Appointed to Superintendent in 2003
CBO at Piedmont starting in 2000
Administrator at Albany USD for 22 years
30 years in education
Michael Brady, Assistant Superintendent for Business ServicesAt Piedmont USD since 2003Starting July 2006, Assistant Superintendent for Business Services
Administrator at Benicia USD, Orinda Union ESD; Regional Coordinator of the AP Challenge Grant at Contra Costa County Office of Education (involved 54 high schools in 7 Bay Area counties)
24 years in education
2
Outline
Overview of Piedmont USD
Bond Program
District Finance
Tax Base
Overview of Piedmont USD

4
District OverviewServes the City of Piedmont, a self-contained residential community located in the East Bay hills of the San Francisco Bay Area
Total estimated population served by the District is 11,000
Small-Size District3 Elementary Schools
1 Middle School
1 comprehensive High School and 1 alternative High School
Enrollment was 2,602 in 2005/06
5
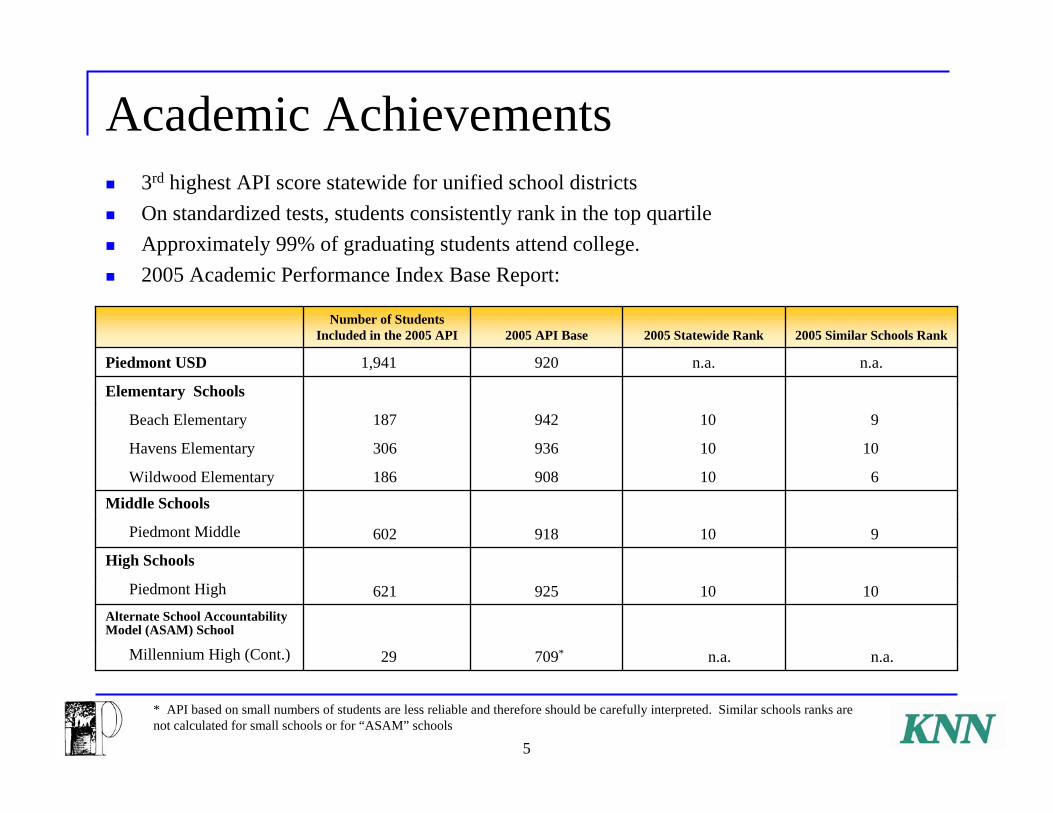
Academic Achievements3rd highest API score statewide for unified school districtsOn standardized tests, students consistently rank in the top quartile Approximately 99% of graduating students attend college.2005 Academic Performance Index Base Report:
n.a.n.a.709*29Millennium High (Cont.)
Alternate School Accountability Model (ASAM) School
1010925621Piedmont High
High Schools
910918602Piedmont Middle
Middle Schools
610908186Wildwood Elementary
1010936306Havens Elementary
910942187Beach Elementary
Elementary Schools
n.a.n.a.9201,941Piedmont USD
2005 Similar Schools Rank2005 Statewide Rank2005 API BaseNumber of Students
Included in the 2005 API
* API based on small numbers of students are less reliable and therefore should be carefully interpreted. Similar schools ranks are not calculated for small schools or for “ASAM” schools

6
Enhanced CurriculumMusic, art and athletic programs are available for all students (K-12)
Parent Clubs at each school site support during and after-school enrichment programs
CHIME supports music K-12
PAINTS supports visual arts K-12
Middle School participates in inter-mural sports
High School fields over 20 teams in sports
Professionals and SpecialistsEvery school staffed with professional librarians and counselors
Elementary schools have reading specialists and math and science enrichment teachers
Technology focusEvery elementary classroom has computers and students have access to a computer lab with a credentialed teacher
Middle school has two labs, one with 31 PCs and one with 33 Macs, that are a required part of the curriculum.
High School is going wireless in 2006/07Every teacher will have a lap top
Every classroom with be equipped with an LCD projector
7
Community SupportCommunity continues to support parcel tax
88% approval for renewal in 2005 – among highest approval rates in State’s historySunsets in 2010Average Parcel Tax: $1,771 per parcelExpected to generate about $7 million in 2006/07
Parent Club Organizations Confirmed $1.2 million annually (up to $1.4 million in past) Used for general support and personnel at school sites for enrichment programs during and after school
Educational Foundation Generates $100,000 annually from Endowment Fund to support general programsApproximately $50,000 in grants awarded annually to teachers for “innovation”
Others contribute to support needs as identifiedLois Blair Rawlings FoundationTwo anonymous grantors
8
Community InvolvementFive Member Board of EducationBudget Advisory Committee
30 members, representing all stakeholdersMeet monthly
Citizen’s Oversight Committee for G.O. Bonds12 membersHas already met twice
Seismic Risk Reduction Program Advisory CommitteeTechnical advisory committee for seismic projects
Already mentioned:Parent Clubs at each school siteAthletics Booster ClubsEducation FoundationCHIMES, PAINTS, and various other special interest groups
Bond Program

10
2006 Bond AuthorizationBased on Seismic Risk Reduction Study completed in October 2005.
“Measure E” G.O. Bond AuthorizationMarch 7, 2006 Election$56,000,000 total authorized amount58.2% voter approval
Purpose of the Authorization:“The proceeds of Bonds are authorized to repair, reconstruct, or replace Piedmont public school buildings to reduce dangers from earthquakes and to meet state and federal seismic safety standards, provide safe classrooms and facilities and to improve the likelihood of Piedmont schools qualifying for state matching funds.”

11
Bond Program Oversight
12
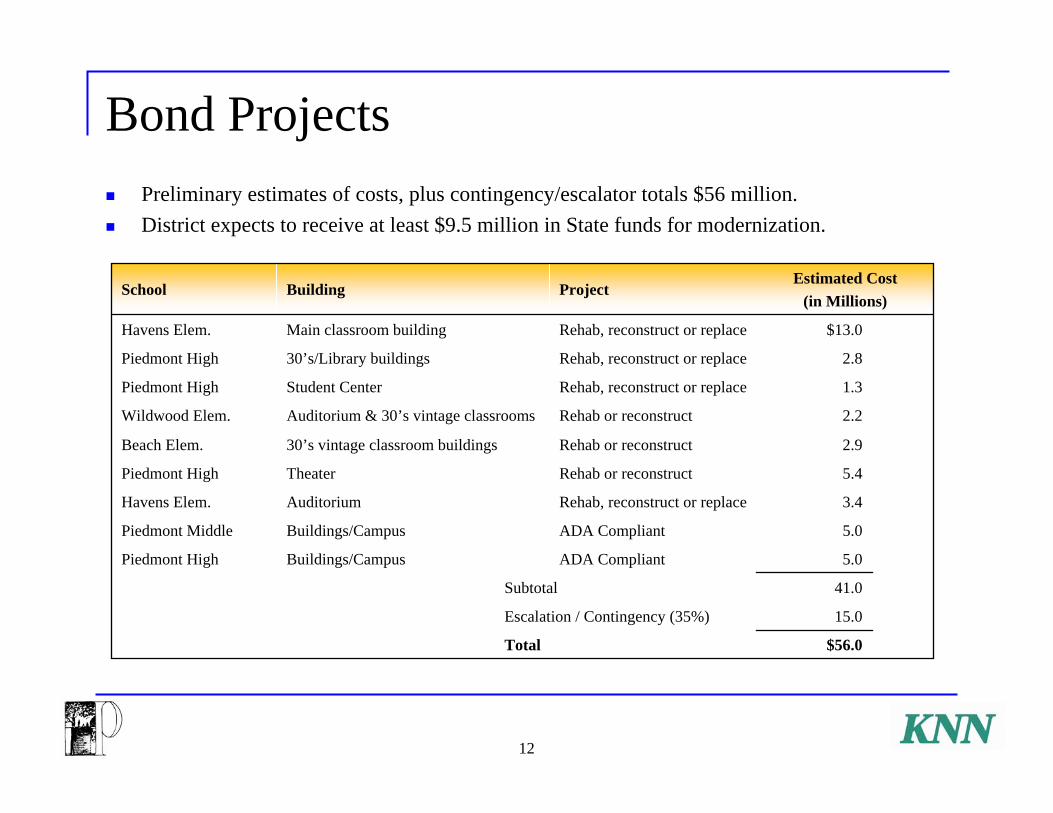
Bond ProjectsPreliminary estimates of costs, plus contingency/escalator totals $56 million.District expects to receive at least $9.5 million in State funds for modernization.
$56.0Total
15.0Escalation / Contingency (35%)
41.0Subtotal
Buildings/Campus
Buildings/Campus
Auditorium
Theater
30’s vintage classroom buildings
Auditorium & 30’s vintage classrooms
Student Center
30’s/Library buildings
Main classroom building
Building
5.0ADA CompliantPiedmont High
5.0ADA CompliantPiedmont Middle
3.4Rehab, reconstruct or replaceHavens Elem.
5.4Rehab or reconstructPiedmont High
2.9Rehab or reconstructBeach Elem.
2.2Rehab or reconstructWildwood Elem.
1.3Rehab, reconstruct or replacePiedmont High
2.8Rehab, reconstruct or replacePiedmont High
$13.0Rehab, reconstruct or replaceHavens Elem.
Estimated Cost(in Millions)
ProjectSchool
13
Outstanding Bonds
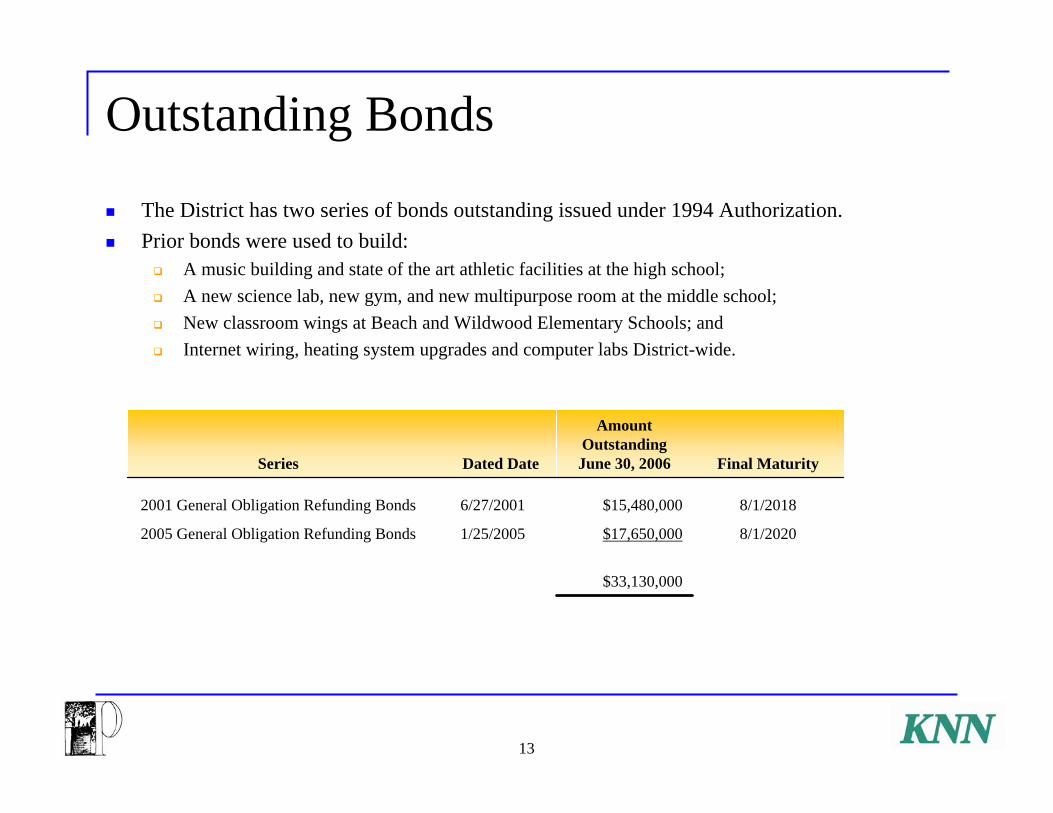
The District has two series of bonds outstanding issued under 1994 Authorization.Prior bonds were used to build:
A music building and state of the art athletic facilities at the high school;A new science lab, new gym, and new multipurpose room at the middle school; New classroom wings at Beach and Wildwood Elementary Schools; and Internet wiring, heating system upgrades and computer labs District-wide.
$33,130,000
8/1/2020$17,650,0001/25/20052005 General Obligation Refunding Bonds
8/1/2018$15,480,0006/27/20012001 General Obligation Refunding Bonds
Final Maturity
AmountOutstandingJune 30, 2006Dated DateSeries
14
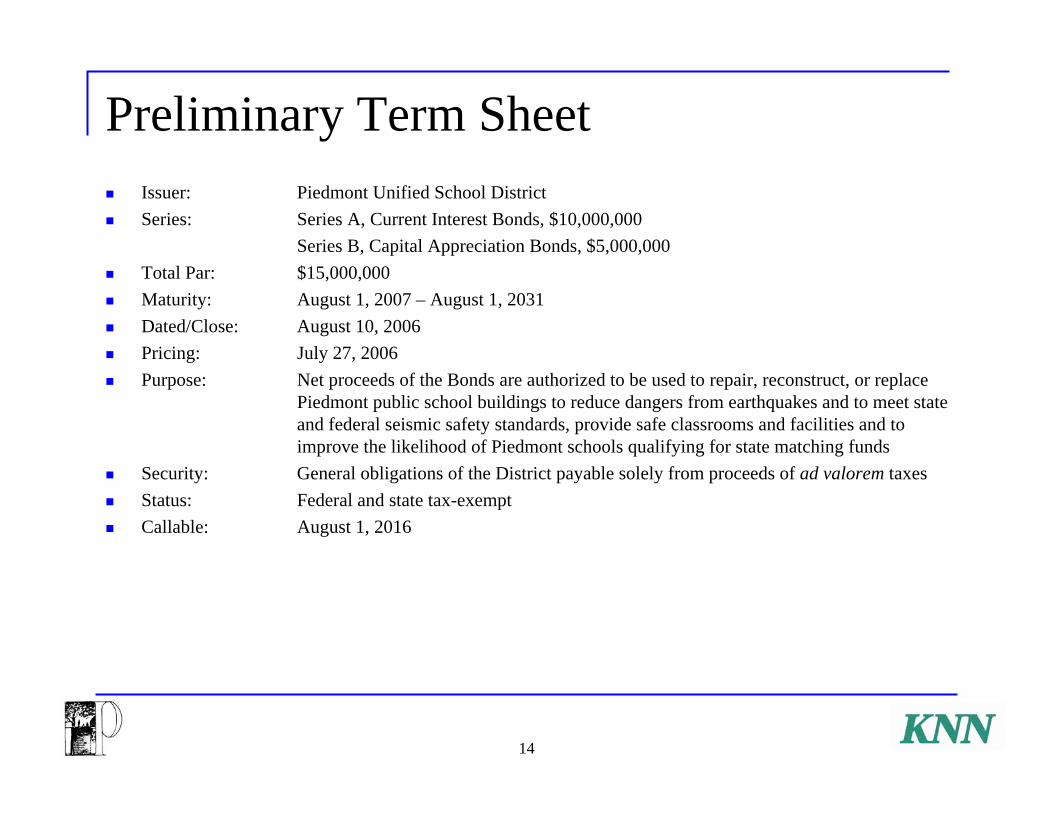
Preliminary Term SheetIssuer: Piedmont Unified School DistrictSeries: Series A, Current Interest Bonds, $10,000,000
Series B, Capital Appreciation Bonds, $5,000,000Total Par: $15,000,000Maturity: August 1, 2007 – August 1, 2031Dated/Close: August 10, 2006Pricing: July 27, 2006Purpose: Net proceeds of the Bonds are authorized to be used to repair, reconstruct, or replace
Piedmont public school buildings to reduce dangers from earthquakes and to meet state and federal seismic safety standards, provide safe classrooms and facilities and to improve the likelihood of Piedmont schools qualifying for state matching funds
Security: General obligations of the District payable solely from proceeds of ad valorem taxesStatus: Federal and state tax-exemptCallable: August 1, 2016
15
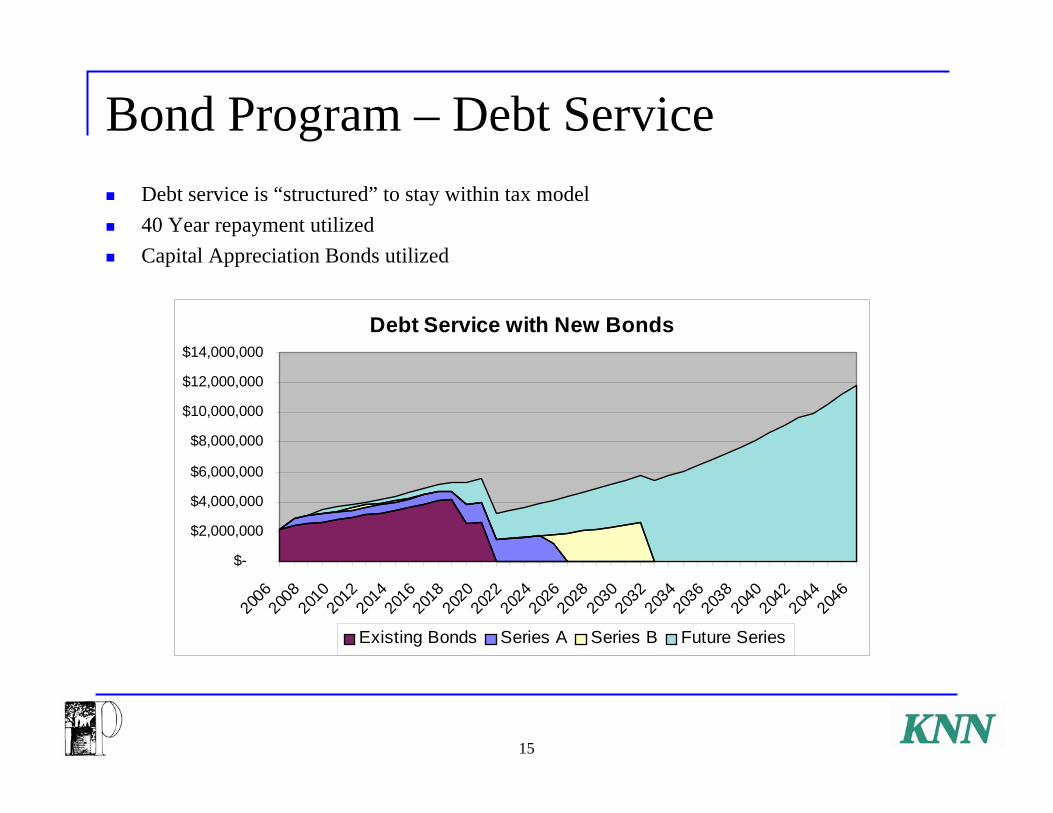
Bond Program – Debt ServiceDebt service is “structured” to stay within tax model40 Year repayment utilizedCapital Appreciation Bonds utilized
Debt Service with New Bonds
$-
$2,000,000
$4,000,000
$6,000,000
$8,000,000
$10,000,000
$12,000,000
$14,000,000
2006
2008
2010
2012
2014
2016
2018
2020
2022
2024
2026
2028
2030
2032
2034
2036
2038
2040
2042
2044
2046
Existing Bonds Series A Series B Future Series
16
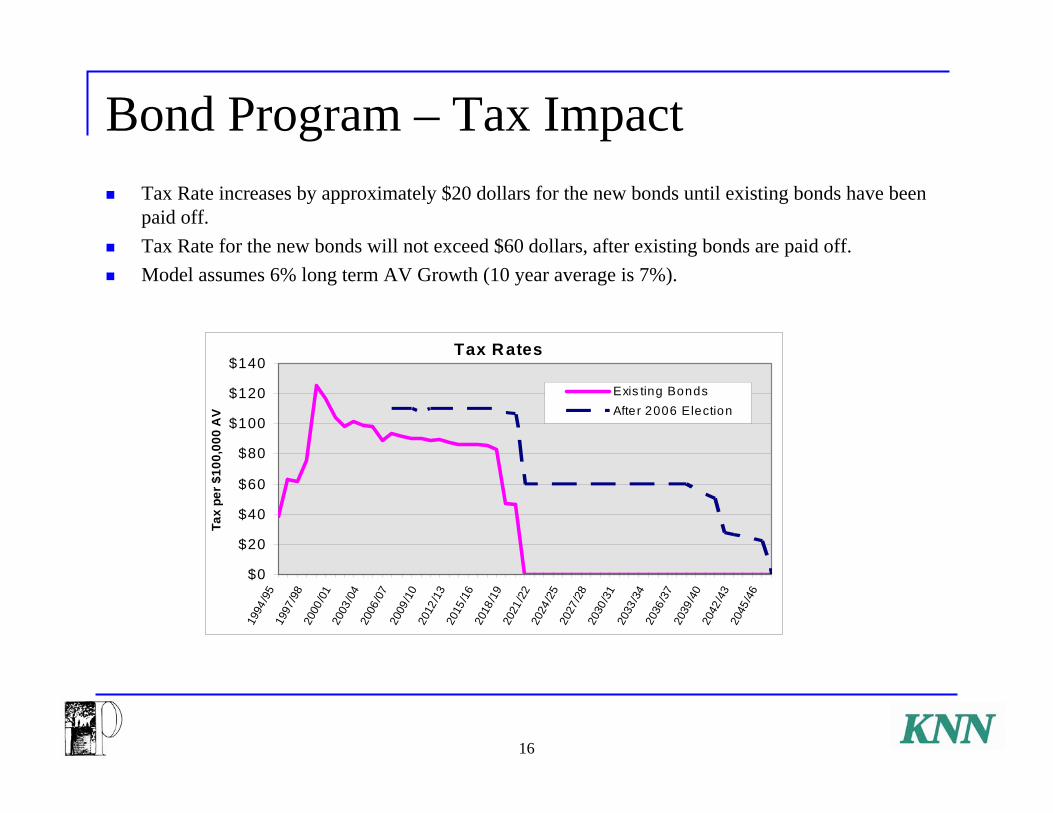
Bond Program – Tax ImpactTax Rate increases by approximately $20 dollars for the new bonds until existing bonds have been paid off.Tax Rate for the new bonds will not exceed $60 dollars, after existing bonds are paid off.Model assumes 6% long term AV Growth (10 year average is 7%).
Tax Rates
$0
$20
$40
$60
$80
$100
$120
$140
1994
/95
1997
/98
2000
/01
2003
/04
2006
/07
2009
/10
2012
/13
2015
/16
2018
/19
2021
/22
2024
/25
2027
/28
2030
/31
2033
/34
2036
/37
2039
/40
2042
/43
2045
/46
Tax
per $
100,
000
AV
Exis ting BondsAfter 2006 Election
District Finances
18
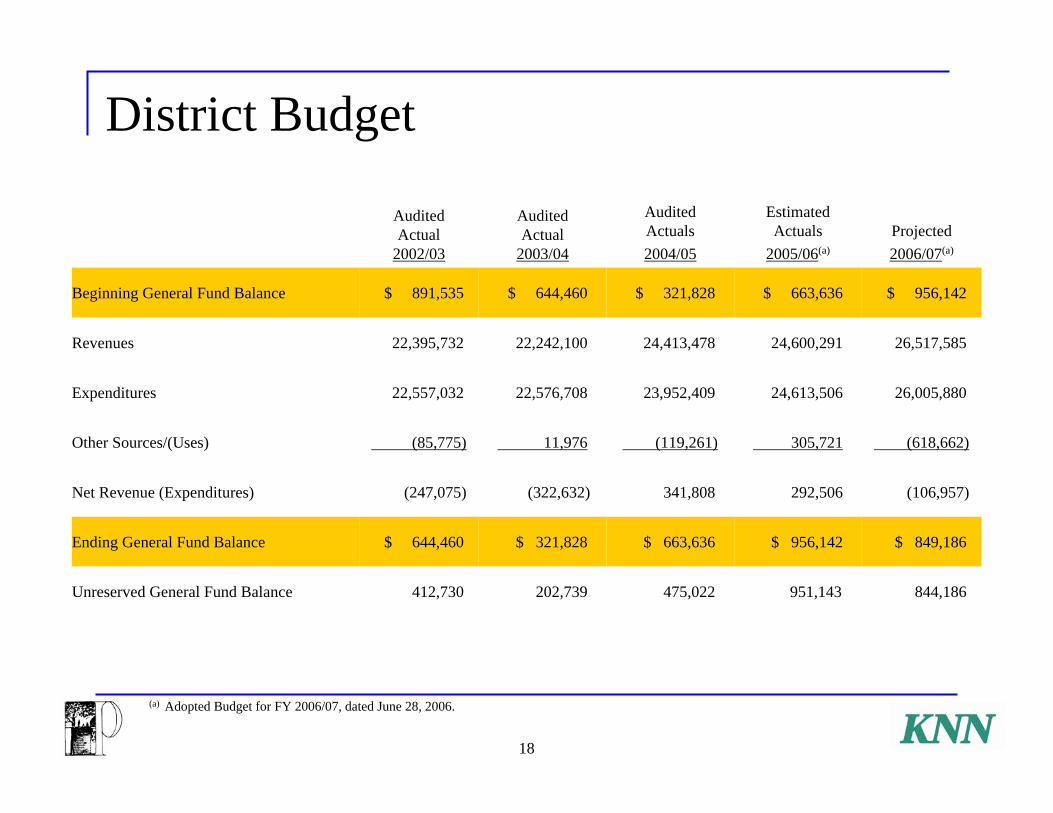
District Budget
(106,957)292,506341,808(322,632)(247,075)Net Revenue (Expenditures)
844,186951,143475,022202,739412,730Unreserved General Fund Balance
$ 849,186$ 956,142$ 663,636$ 321,828$ 644,460Ending General Fund Balance
(618,662)305,721(119,261)11,976(85,775)Other Sources/(Uses)
26,005,88024,613,50623,952,40922,576,70822,557,032Expenditures
26,517,58524,600,29124,413,47822,242,10022,395,732Revenues
$ 956,142$ 663,636$ 321,828$ 644,460$ 891,535Beginning General Fund Balance
Projected 2006/07(a)
Estimated Actuals
2005/06(a)
Audited Actuals2004/05
Audited Actual
2003/04
Audited Actual
2002/03
(a) Adopted Budget for FY 2006/07, dated June 28, 2006.
19
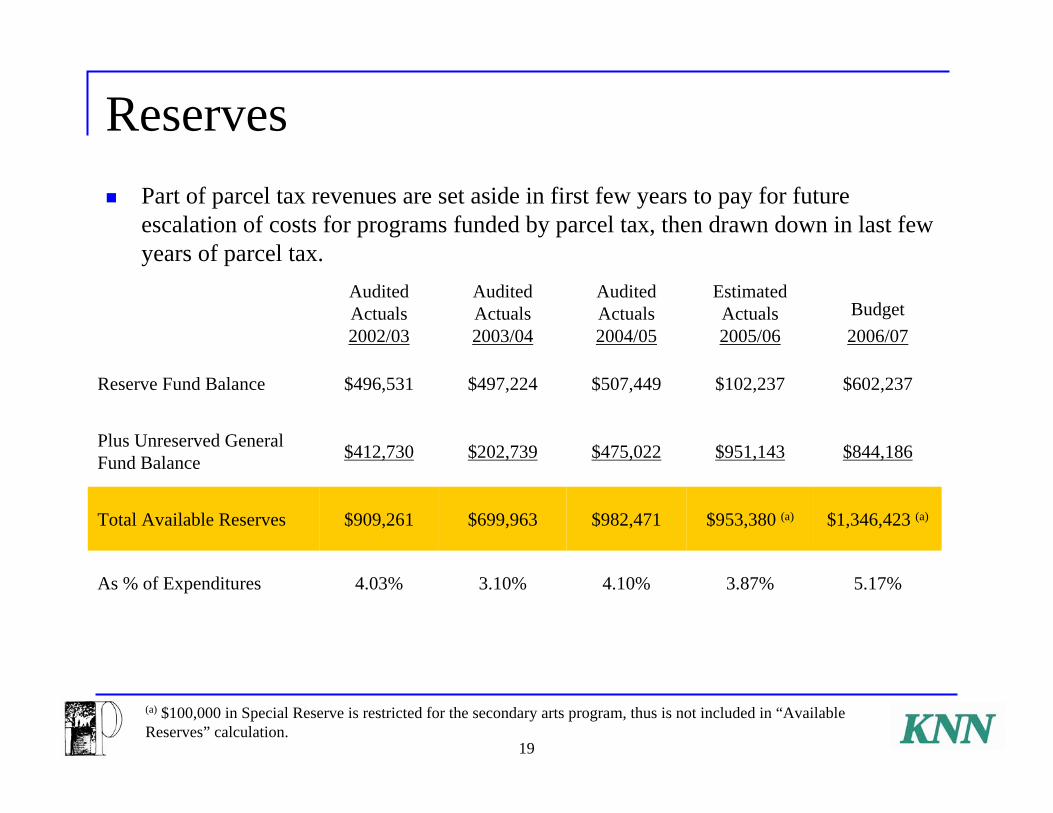
ReservesPart of parcel tax revenues are set aside in first few years to pay for future escalation of costs for programs funded by parcel tax, then drawn down in last few years of parcel tax.
5.17%3.87%4.10%3.10%4.03%As % of Expenditures
$1,346,423 (a)$953,380 (a)$982,471$699,963$909,261Total Available Reserves
$844,186$951,143$475,022$202,739$412,730Plus Unreserved General Fund Balance
$602,237$102,237$507,449$497,224$496,531Reserve Fund Balance
Budget2006/07
Estimated Actuals 2005/06
Audited Actuals 2004/05
Audited Actuals 2003/04
Audited Actuals 2002/03
(a) $100,000 in Special Reserve is restricted for the secondary arts program, thus is not included in “Available Reserves” calculation.
20
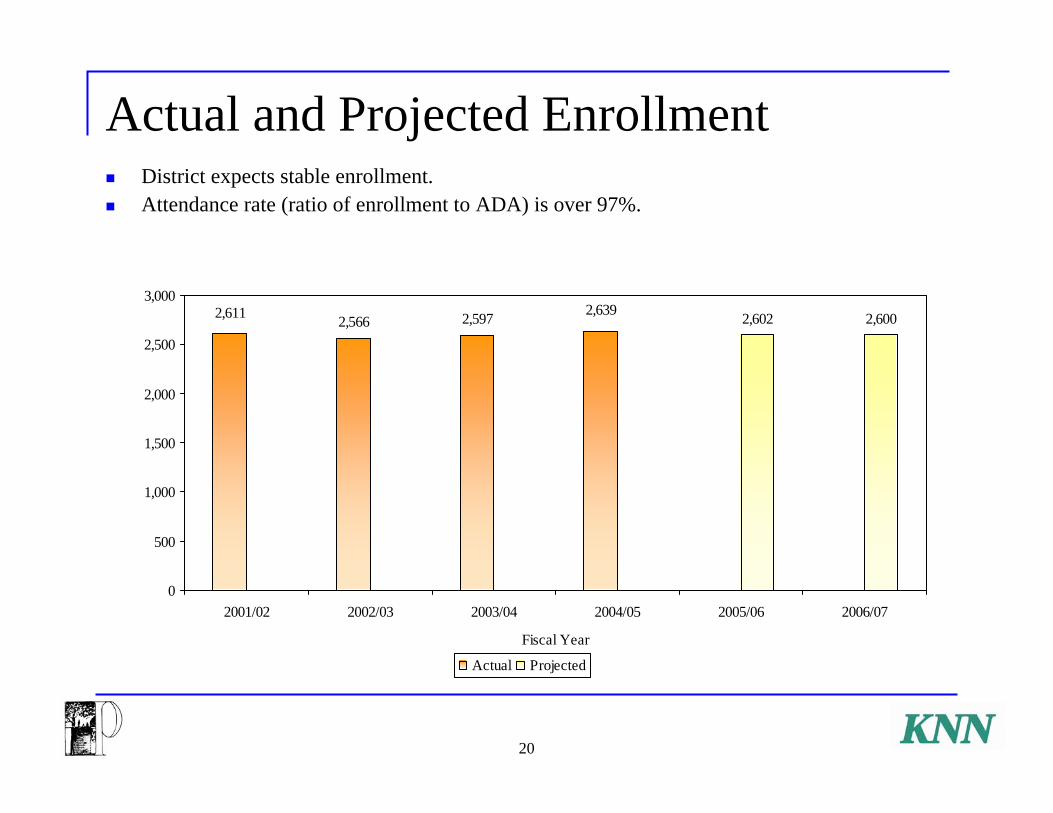
Actual and Projected EnrollmentDistrict expects stable enrollment.Attendance rate (ratio of enrollment to ADA) is over 97%.
2,602 2,6002,6392,611 2,566 2,597
0
500
1,000
1,500
2,000
2,500
3,000
2001/02 2002/03 2003/04 2004/05 2005/06 2006/07
Fiscal Year
Actual Projected
21
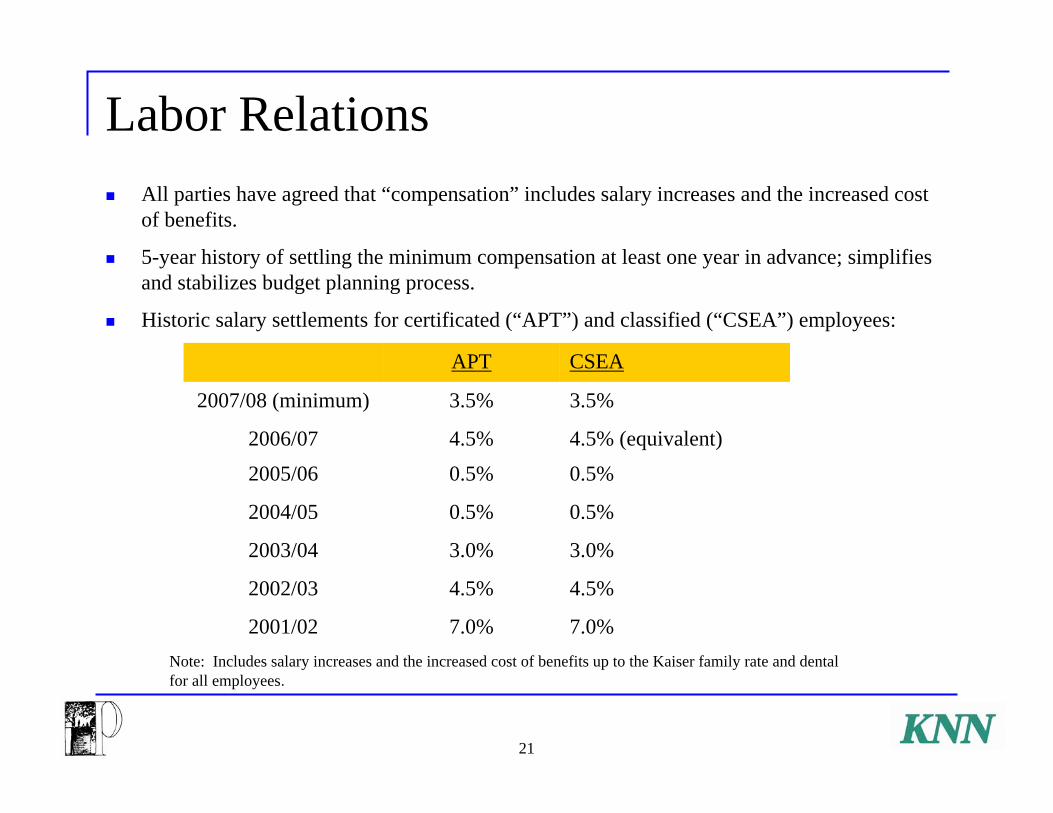
Labor RelationsAll parties have agreed that “compensation” includes salary increases and the increased cost of benefits.
5-year history of settling the minimum compensation at least one year in advance; simplifies and stabilizes budget planning process.
Historic salary settlements for certificated (“APT”) and classified (“CSEA”) employees:
4.5% (equivalent)4.5%2006/07
3.5%3.5%2007/08 (minimum)
7.0%7.0%2001/02
4.5%
3.0%
0.5%
0.5%
CSEA
4.5%2002/03
3.0%2003/04
0.5%2004/05
0.5%2005/06
APT
Note: Includes salary increases and the increased cost of benefits up to the Kaiser family rate and dental for all employees.
22
OPEBRequired implementation for the District - fiscal year 2008/09.District provides post-employment health care benefits to all employees who retire on or after attaining age 55 with at least 15 years service.
Full health coverage to Medicare age (65)Supplemental coverage after 65 - Flat rate of $100 per month for life Currently pay as you goIn 2004-05, $211,255 paid for 65 retirees.
District is in the process of contracting an actuarial study.

Tax Base
24
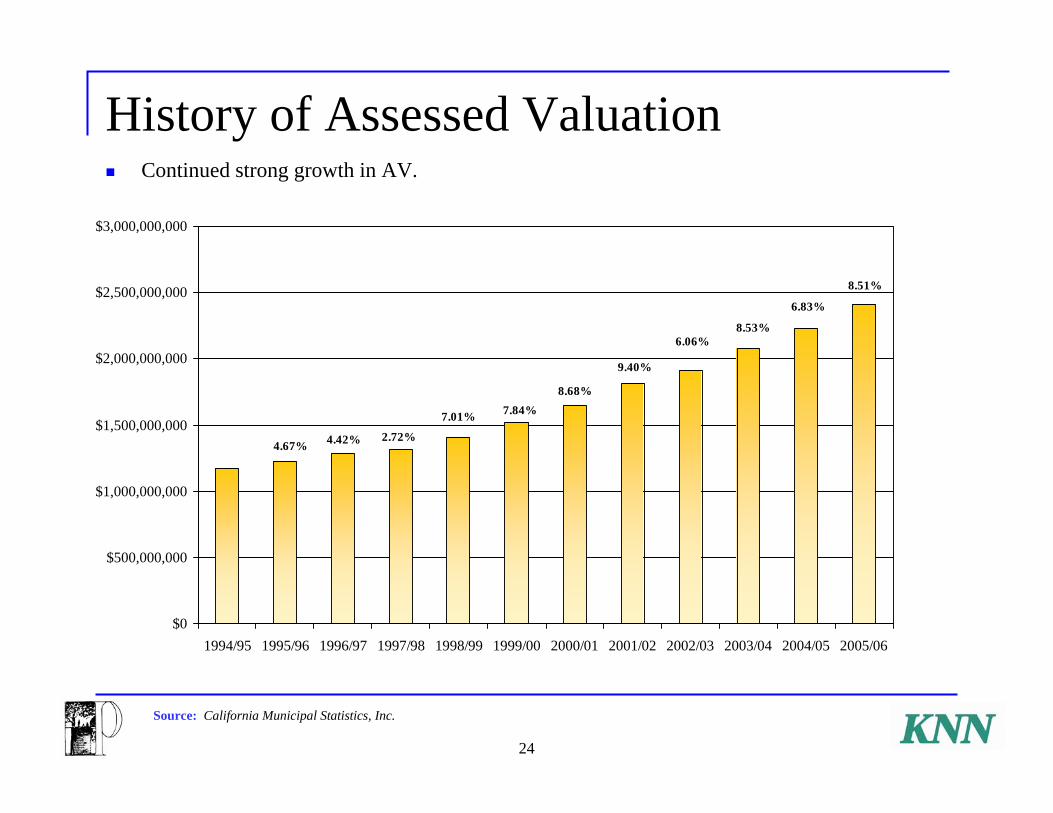
History of Assessed ValuationContinued strong growth in AV.
$0
$500,000,000
$1,000,000,000
$1,500,000,000
$2,000,000,000
$2,500,000,000
$3,000,000,000
1994/95 1995/96 1996/97 1997/98 1998/99 1999/00 2000/01 2001/02 2002/03 2003/04 2004/05 2005/06
4.67%
6.83%
8.53%6.06%
9.40%
8.68%7.84%7.01%
2.72%4.42%
8.51%
Source: California Municipal Statistics, Inc.

25
2005-06 Assessed Valuation By Land Use
Source: California Municipal Statistics, Inc.
Other Residential1.34%
Single Family98.19%
Commercial/Industrial0.47%
Nearly all AV represented by residential uses.
26
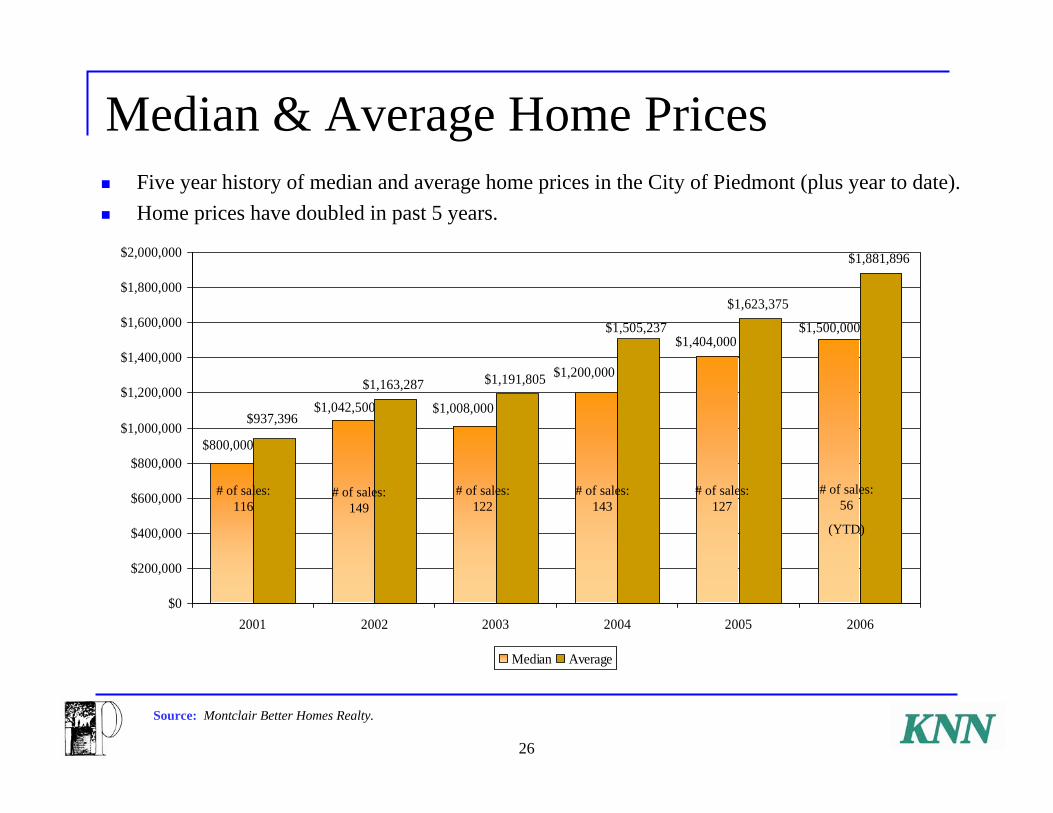
Median & Average Home PricesFive year history of median and average home prices in the City of Piedmont (plus year to date).Home prices have doubled in past 5 years.
$1,163,287 $1,191,805
$1,623,375
$1,881,896
$1,500,000
$1,042,500 $1,008,000
$1,404,000
$1,200,000
$800,000
$1,505,237
$937,396
$0
$200,000
$400,000
$600,000
$800,000
$1,000,000
$1,200,000
$1,400,000
$1,600,000
$1,800,000
$2,000,000
2001 2002 2003 2004 2005 2006
Median Average
Source: Montclair Better Homes Realty.
# of sales: 116
# of sales: 149
# of sales: 122
# of sales: 143
# of sales: 127
# of sales: 56
(YTD)
27
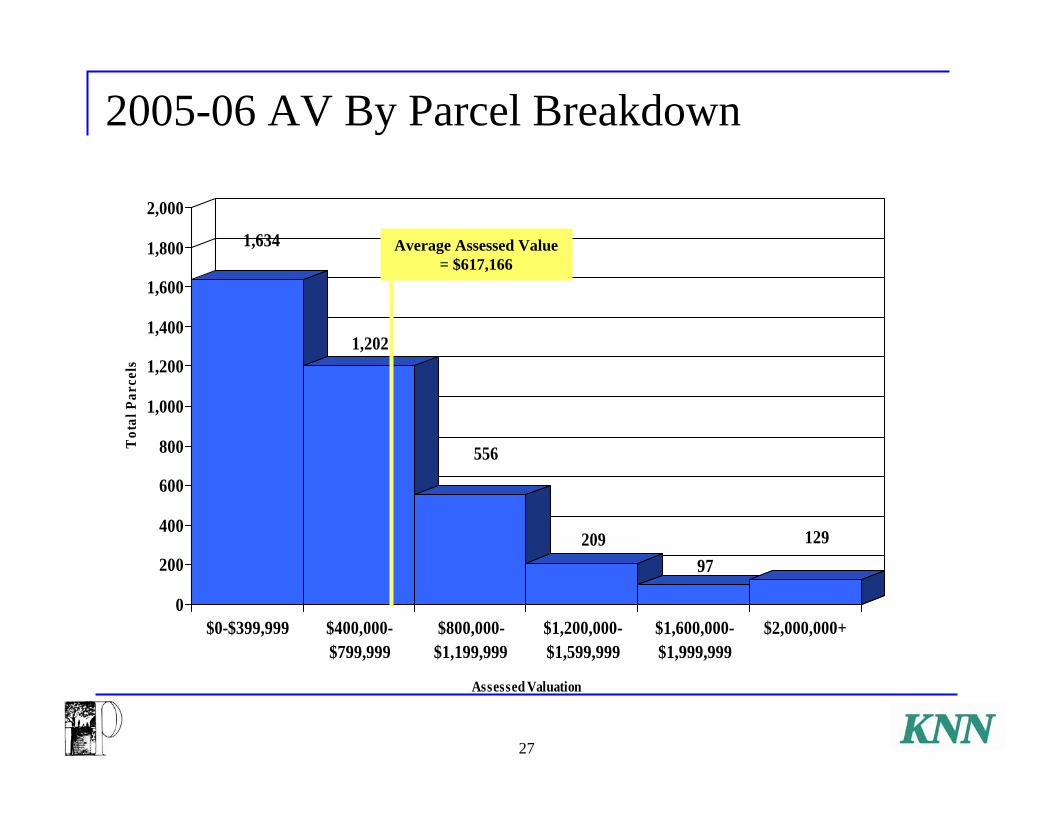
2005-06 AV By Parcel Breakdown
1,634
1,202
556
20997
129
0
200
400
600
800
1,000
1,200
1,400
1,600
1,800
2,000
Tot
al P
arce
ls
$0-$399,999 $400,000-$799,999
$800,000-$1,199,999
$1,200,000-$1,599,999
$1,600,000-$1,999,999
$2,000,000+
Assessed Valuation
Average Assessed Value = $617,166
28
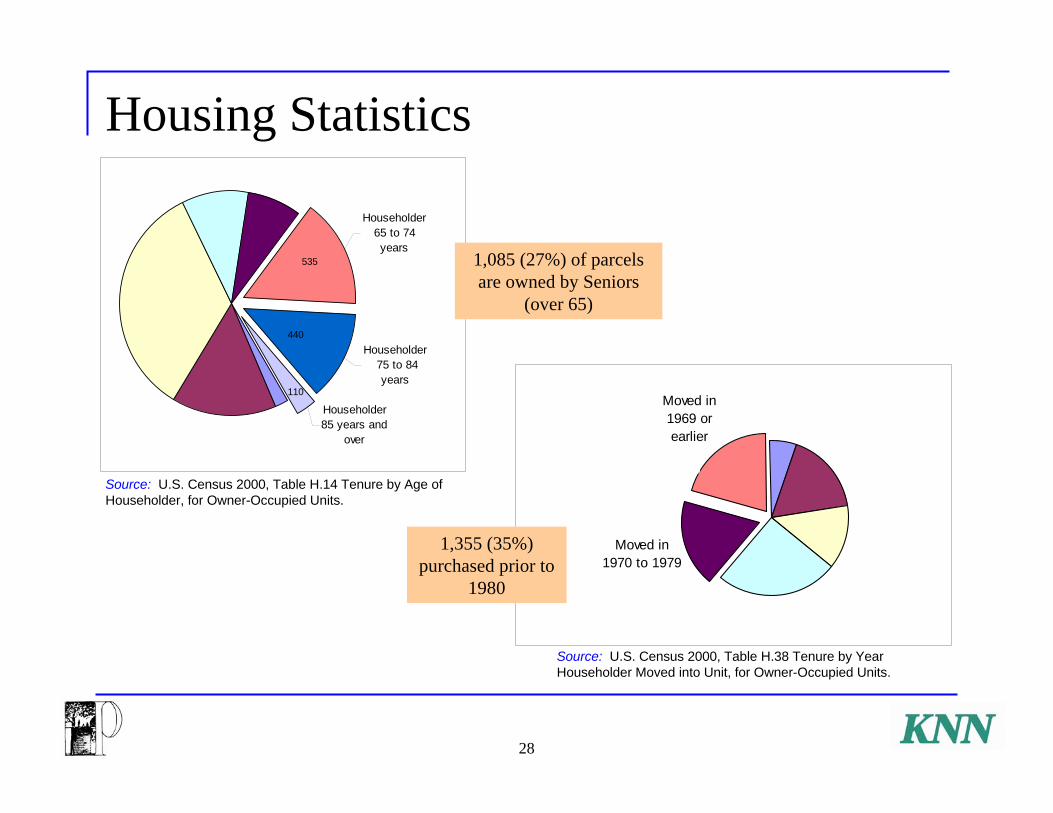
Moved in 1970 to 1979
Moved in 1969 or earlier
635
720
Householder 75 to 84
years
Householder65 to 74 years
Householder 85 years and
over
535
440
110
Housing Statistics
1,355 (35%) purchased prior to
1980
1,085 (27%) of parcels are owned by Seniors
(over 65)
Source: U.S. Census 2000, Table H.14 Tenure by Age of Householder, for Owner-Occupied Units.
Source: U.S. Census 2000, Table H.38 Tenure by Year Householder Moved into Unit, for Owner-Occupied Units.

29
Potential for Future GrowthThe District’s tax base is substantially undervalued based on current residential market values. If re-evaluated based on current residential market values only, the value of the District’s tax base would increase by 143%
(1) Average Assessed Value per SFR parcel of $617,166
Current Assessed Value
$2,361,894,2823,827Single Family Residential
Secured A.V.# of
ParcelsType
(1) Assumes Estimated Average Sales Price of $1,500,000
Potential Assessed Value
$5,740,500,0003,827Single Family Residential
Secured A.V.# of
ParcelsType

30
Closing Summary
One of highest achieving school districts in the State
Rich academic programs, requested and supported by community
Community acts as savings account
Community involved in budget process and bond oversight
Bond funds to be used for seismic work and modernization
Well-managed finances; good labor relations.
Assessed values well below market values
Affluent community demographics