PIA Roadster Battery Study v6
14
Plug In America’s Tesla Roadster Battery Study by Tom Saxton, Chief Science Officer Released: July 13, 2013 Introduction As the first full-production all-electric vehicle of the modern era, the Tesla Roadster represents a unique opportunity to study battery pack longevity. Deliveries of the vehicles began in 2008 with a total of 2,500 Roadsters produced through the end of production in January, 2012 1 . As of July 4, 2013, Tesla Motors reports that “2,100+ Roadsters” have been driven over 35 million miles 2 . For this study, Tesla Roadster owners were contacted via social media including the Tesla Motors Club and various other online groups and asked to submit data for their vehicles. As of July 5, 2013, 126 vehicles totaling 3,198,749 miles have contributed to the survey, amounting to approximately 5% of the user base and nearly 10% of the miles driven as reported by Tesla Motors. In addition, data from 106 Roadsters was collected anonymously through the Open Vehicle Monitoring System 3 (OVMS), with considerable overlap expected between the two data sets. In 2006, Tesla Motors projected 4 that the Roadster battery pack would have more than 100,000 miles of driving range and more than 5 years of useful life. Over this period, the capacity of the battery pack would be expected to decline. As an example, a Roadster driven 10,000 miles per year for 5 years would be expected to have 70% of the original battery pack capacity. The purpose of this study is to determine how the battery packs are holding up and how real world performance compares to the expectations set by Tesla Motors in the timeframe when the Roadster was first announced and described in 2006. Summary of Results Of the factors considered – miles driven, vehicle age, and climate – only mileage showed a significant correlation with battery pack capacity. Data collected suggests that, on average, a Roadster battery pack will have between 80% and 85% of original capacity after 100,000 miles. 1 Tesla Motors, Inc, Form 10-Q for the quarter ended September 30, 2012, filed with the SEC on November 7, 2012. 2 http://www.teslamotors.com/enthusiasts/millions-of-miles 3 https://www.openvehicles.com/ 4 Martin Eberhard, JB Straubel, “A Bit About Batteries” November 30, 2006 http://www.teslamotors.com/blog/bit-about-batteries
Transcript of PIA Roadster Battery Study v6

Plug In America’s Tesla Roadster Battery Study
by Tom Saxton, Chief Science Officer Released: July 13, 2013
Introduction As the first full-production all-electric vehicle of the modern era, the Tesla Roadster represents a unique opportunity to study battery pack longevity. Deliveries of the vehicles began in 2008 with a total of 2,500 Roadsters produced through the end of production in January, 20121. As of July 4, 2013, Tesla Motors reports that “2,100+ Roadsters” have been driven over 35 million miles2.
For this study, Tesla Roadster owners were contacted via social media including the Tesla Motors Club and various other online groups and asked to submit data for their vehicles. As of July 5, 2013, 126 vehicles totaling 3,198,749 miles have contributed to the survey, amounting to approximately 5% of the user base and nearly 10% of the miles driven as reported by Tesla Motors. In addition, data from 106 Roadsters was collected anonymously through the Open Vehicle Monitoring System3 (OVMS), with considerable overlap expected between the two data sets.
In 2006, Tesla Motors projected4 that the Roadster battery pack would have more than 100,000 miles of driving range and more than 5 years of useful life. Over this period, the capacity of the battery pack would be expected to decline. As an example, a Roadster driven 10,000 miles per year for 5 years would be expected to have 70% of the original battery pack capacity.
The purpose of this study is to determine how the battery packs are holding up and how real world performance compares to the expectations set by Tesla Motors in the timeframe when the Roadster was first announced and described in 2006.
Summary of Results Of the factors considered – miles driven, vehicle age, and climate – only mileage showed a significant correlation with battery pack capacity.
Data collected suggests that, on average, a Roadster battery pack will have between 80% and 85% of original capacity after 100,000 miles.
1 Tesla Motors, Inc, Form 10-Q for the quarter ended September 30, 2012, filed with the SEC on November 7, 2012. 2 http://www.teslamotors.com/enthusiasts/millions-of-miles 3 https://www.openvehicles.com/ 4 Martin Eberhard, JB Straubel, “A Bit About Batteries” November 30, 2006 http://www.teslamotors.com/blog/bit-about-batteries

Plug In America’s Tesla Roadster Battery Study
page 2
Unlike results from the Plug In America LEAF Battery Survey5, no significant correlation was found between climate and battery longevity.
There is significant variation in battery capacity reported; the difference in capacity between vehicles with similar mileage can be as large as the projected loss over 100,000 miles of use. Individual owners should therefore expect variation between their experience and the projected average performance.
Because of the variation in battery pack longevity experienced by owners, especially where such variation may be due to factors beyond the owners’ control, it would seem desirable for the manufacturers of electric vehicles to guarantee not only the life of the battery pack, but also the capacity performance over time and miles. Nissan Motors responded to the climate issues reported by LEAF owners (and confirmed by the Plug In America study) by amending their battery warranty to cover capacity. With the performance of the Roadster battery packs exceeding early expectations, it’s curious that Tesla Motors doesn’t offer any capacity warranty, even on the 85 kWh Model S, which has a warranty good for 8 years and unlimited miles.
Methodology Sample Distribution The survey was promoted through various social media services including the Tesla Motors Club forum (TMC), various online Tesla owner groups in the United States and internationally, and Plug In America’s newsletter. Owners who participated are self-selected and may be biased toward better (or worse) outcomes. Survey participants reported their location and information about their driving and charging habits.
The OVMS data was collected anonymously from 106 owners who have installed the OVMS device and chosen not to encrypt their data. These owners represent a subset of owners interested in remote monitoring their vehicles and are thus perhaps more technically savvy, which might bias the data set in other ways.
Measuring Battery Capacity
Full Charge Energy in Ideal Miles
Tesla Motors’ state-of-charge instrumentation is the most precise and objective of any mass-production electric vehicle in the modern era, providing the owner with the option to view the car’s estimate of the battery pack’s current stored energy in an energy unit referred to as an ideal range mile, or more briefly as an ideal mile (IM)6. This unit is both fairly high resolution and easily comparable between vehicles, drivers, and environments.
Other production electric vehicles on the road today report state of charge in coarse charge bars relative to the pack’s constantly varying estimated capacity and/or estimated 5 Tom Saxton, “Plug In America’s LEAF Battery Survey” http://www.pluginamerica.org/surveys/batteries/leaf/Leaf-Battery-Survey.pdf 6 Owners may also choose to see state of charge in ideal kilometers.
Plug In America’s Tesla Roadster Battery Study
page 3
miles of range based on recent driving. Both of these values depend on many factors and thus cannot be compared across time, between vehicles, or used to measure capacity variation.
By providing state-of-charge information in absolute energy units, Tesla Motors enables owners to better understand both how much charge the pack has at any moment and also how their battery pack capacity varies over time. This also facilitates more meaningful results from studies such as this.
To measure battery capacity, the owner just needs to observe the state of charge in ideal miles at the end of a charge. Several factors make this more complex than it sounds.
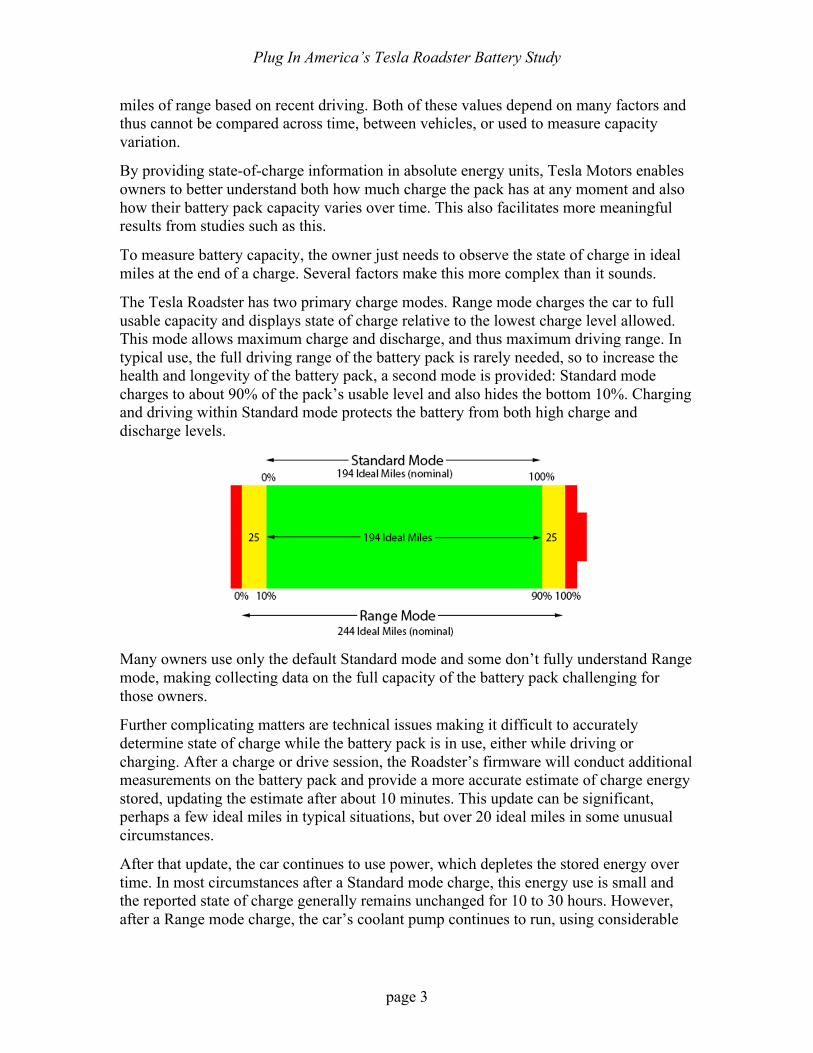
The Tesla Roadster has two primary charge modes. Range mode charges the car to full usable capacity and displays state of charge relative to the lowest charge level allowed. This mode allows maximum charge and discharge, and thus maximum driving range. In typical use, the full driving range of the battery pack is rarely needed, so to increase the health and longevity of the battery pack, a second mode is provided: Standard mode charges to about 90% of the pack’s usable level and also hides the bottom 10%. Charging and driving within Standard mode protects the battery from both high charge and discharge levels.
Many owners use only the default Standard mode and some don’t fully understand Range mode, making collecting data on the full capacity of the battery pack challenging for those owners.
Further complicating matters are technical issues making it difficult to accurately determine state of charge while the battery pack is in use, either while driving or charging. After a charge or drive session, the Roadster’s firmware will conduct additional measurements on the battery pack and provide a more accurate estimate of charge energy stored, updating the estimate after about 10 minutes. This update can be significant, perhaps a few ideal miles in typical situations, but over 20 ideal miles in some unusual circumstances.
After that update, the car continues to use power, which depletes the stored energy over time. In most circumstances after a Standard mode charge, this energy use is small and the reported state of charge generally remains unchanged for 10 to 30 hours. However, after a Range mode charge, the car’s coolant pump continues to run, using considerable
Plug In America’s Tesla Roadster Battery Study
page 4
energy, which combined with any self-discharge of the batteries causes the state of charge to decline fairly rapidly, perhaps a few ideal miles per hour for a few hours.
Thus to get the most accurate reading of the car’s full battery capacity – the ideal miles after a full Range mode charge – the owner has to read the ideal miles at least 10 minutes after the charge completes but not too much later, a challenging task as the charge completion time is not known in advance and is typically in the middle of the night.
Calculated Amp-‐hour Capacity
Another common way to measure battery capacity is amp-hours. An amp-hour is the amount of charge required to deliver a 1-amp current for one hour. This is different from estimating charge energy because the pack voltage declines as the battery discharges and that voltage profile depends on the rate at which energy is drawn from the pack. Amp-hour capacity is arguably a more fundamental measure of battery capacity.
The Tesla Roadster estimates the amp-hour capacity of the battery pack with a value known as the calculated amp-hour capacity or CAC. This number isn’t presented to the driver, but a Tesla service technician can read it and the technicians will generally share this number with owners when asked. Alternatively, the OVMS device can read the CAC. There’s also a value in the log file that the author has determined is a slightly lower resolution representation of the CAC and can be extracted by several owner-developed log parsers7.
Reading this value has a number of advantages over reading the battery capacity in ideal miles at the end of a charge: it doesn’t require that the owner understand how to get a full range mode charge and doesn’t require getting a reading at a precise time that’s both difficult to predict in advance and generally inconvenient.
About half of the study participants were able to provide CAC values in addition to at least one of Standard mode or Range mode ideal miles.
Comparing Different Battery Pack Capacity Measurements
The survey collected three different measurements on battery pack capacity: Standard mode ideal miles, Range mode ideal miles, and Calculated Amp-hour Capacity. As explained above, each measurement contributes to the understanding of the vehicle’s battery capacity in different ways. They vary in how directly they measure capacity and also in how easy or difficult they are to determine with the best accuracy.
For this reason, it’s helpful to know how the different measurements correlate with each other to understand how well one can be used as a proxy for another.
7 http://www.idleloop.com/tesla/vmsparser/

Plug In America’s Tesla Roadster Battery Study
page 5
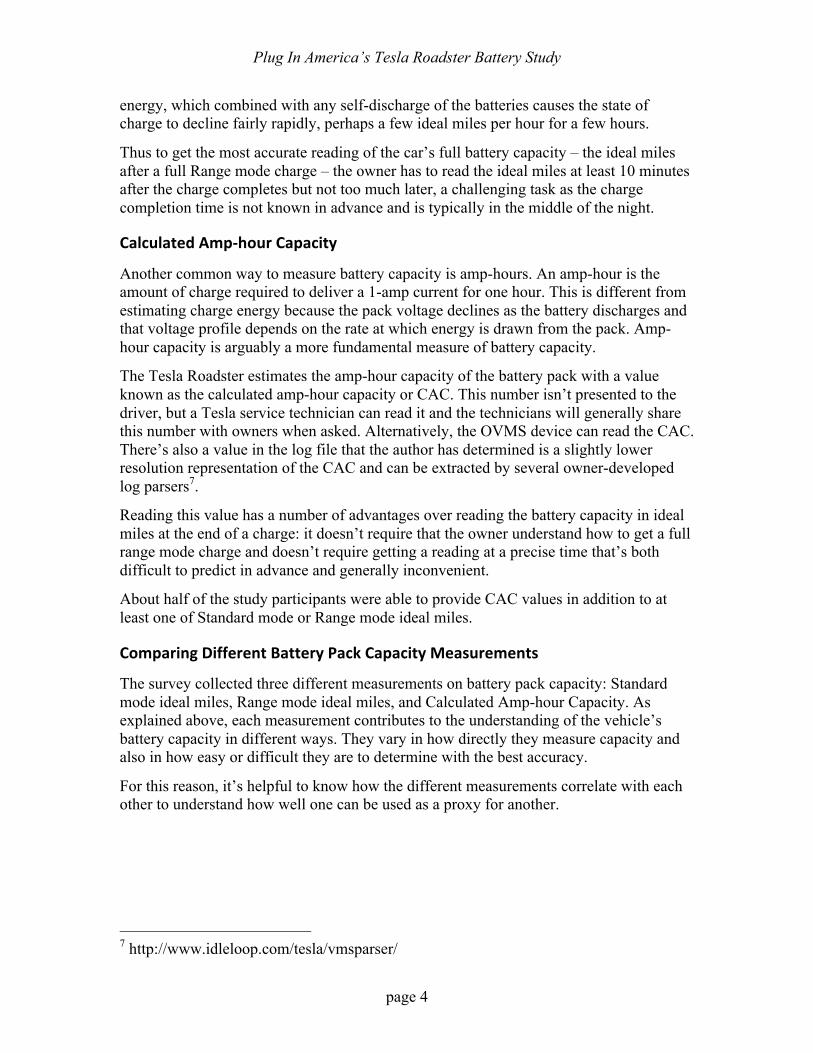
The chart below shows how the two ideal mile measurements correlate with CAC.
Standard mode ideal miles correlate very well with CAC. Range mode correlates a little less well, with a few outliers both high and low, lowering the correlation coefficient. This isn’t surprising given the difficulties in obtaining an accurate range mode reading. For the purpose of the study, any of the three measures are therefore considered reasonable measures of battery pack capacity in aggregate, with CAC being the most reliably determined and Standard mode being the most broadly reported while also being relatively easy to determine with good accuracy.
Results Below are descriptions of the data collected for the study along with a series of graphs showing data and trend lines.
Data Collected The survey has so far collected detailed data on 126 vehicles, with contributions from 21 states, 3 Canadian provinces, and eight countries outside North America.
Number of Roadsters surveyed 126 Average miles driven 25,387 Median miles driven 21,131 Most miles driven 87,111 Total miles reported 3,198,749
y = 1.563x -‐ 5.6524 R² = 0.81139
y = 1.2034x -‐ 1.8581 R² = 0.87433
150
160
170
180
190
200
210
220
230
240
250
130 135 140 145 150 155 160 165
Range (miles)
CAC (Calculated Amp-hour Capacity)
Range and Standard Ideal Miles vs CAC
Range Mode Standard Mode

Plug In America’s Tesla Roadster Battery Study
page 6
Some vehicles were not included in the full data analysis because they were submitted after analysis began or because of various issues with reports that could not be resolved or corrected in time, leaving 122 vehicles for full analysis.
Battery Capacity Reduction Over Miles Driven Lithium ion batteries used in modern plug-in electric vehicles, including the Tesla Roadster, are expected to lose capacity with use.8 This is generally stated in terms of duty cycles: the number of times a battery is fully charged and discharged. For electric vehicles, this corresponds closely to total miles driven, although differences in driving style and conditions affect the number of miles driven per charge cycle equivalent.
Survey participants reported their battery capacity and odometer reading as shown in the chart below.
The top group, blue diamonds, shows Range mode ideal miles with 81 sample points. As expected, there’s a clear but gradual downward trend, but with considerable variation between vehicles. The equation for the trend line shows an average degradation of 0.35 ideal miles (0.15%) per thousand miles driven.
8 Nagpure S. C., Bhushan B., Babu. S. S., Rizzoni G., and Guezennec Y, “Aging Mechanisms in Li-ion Batteries” http://www.mecheng.osu.edu/nlbb/files/nlbb/Battery_aging_09.pdf
y = -‐0.3538x + 236.57 R² = 0.36541
y = -‐0.2665x + 185.64 R² = 0.35238
y = -‐0.2426x + 156.07 R² = 0.47652
0
50
100
150
200
250
0 10 20 30 40 50 60 70 80 90 100
Ideal M
iles/Ah
Odometer (1000s of Miles)
Capacity vs Miles Driven
Range Mode IM Standard Mode IM
Plug In America’s Tesla Roadster Battery Study
page 7
The middle group, red squares, shows Standard mode ideal miles with 121 sample points. The trend line equation shows an average loss of 0.27 ideal miles (0.14%) per thousand miles driven.
The bottom group, green triangles, shows the calculated amp-hour capacity (CAC) with 60 data points. This group has the best correlation with the trend line, presumably due to the ease of obtaining an accurate number without having to read a value from the charge screen at just the right time. The equation for the trend line shows an average loss of 0.24 amp-hours (0.16%) loss per thousand miles driven.
Limiting Data to Original Battery Packs
A considerable number of owners reported that some or all of their battery pack had been replaced: 23 out of 122, or 18.9%. The Roadster battery pack consists of 11 equal sheets of 621 cells. A battery replacement can be anything from replacing a single sheet to replacing the entire battery pack. There are also a number of reasons for doing a partial or full replacement, not all related to battery health or capacity. Further, the replacement for a sheet or pack may be either completely new or refurbished.
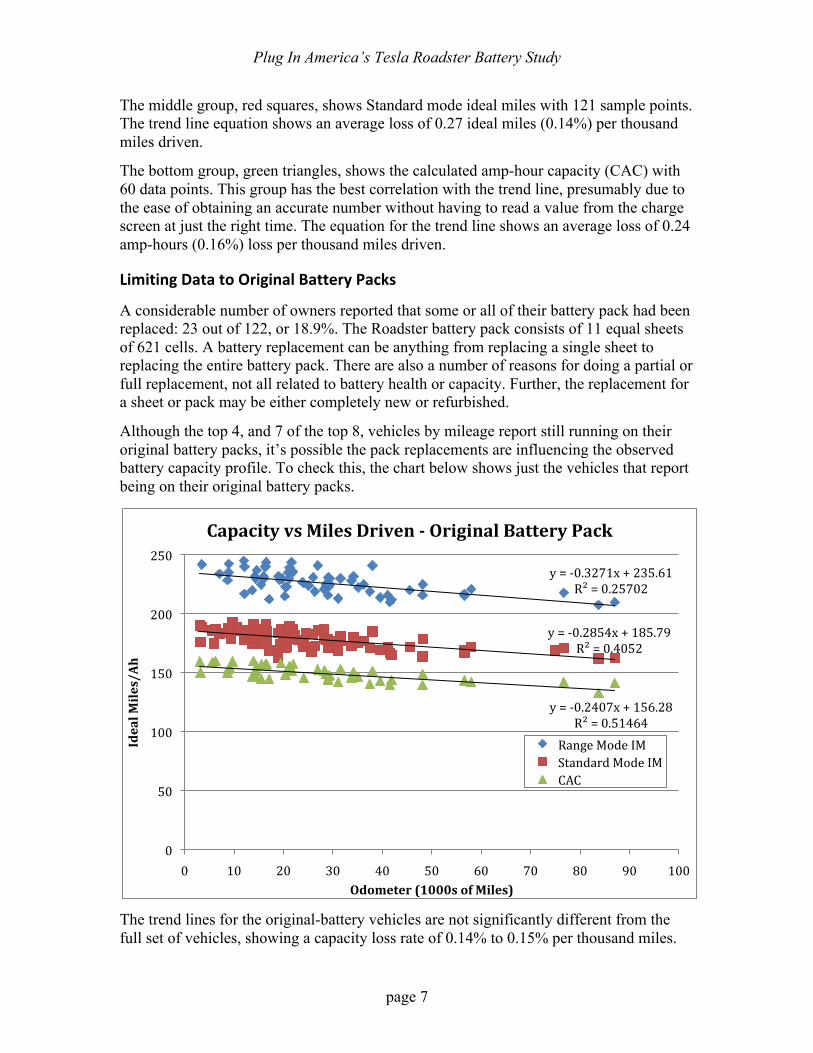
Although the top 4, and 7 of the top 8, vehicles by mileage report still running on their original battery packs, it’s possible the pack replacements are influencing the observed battery capacity profile. To check this, the chart below shows just the vehicles that report being on their original battery packs.
The trend lines for the original-battery vehicles are not significantly different from the full set of vehicles, showing a capacity loss rate of 0.14% to 0.15% per thousand miles.
y = -‐0.3271x + 235.61 R² = 0.25702
y = -‐0.2854x + 185.79 R² = 0.4052
y = -‐0.2407x + 156.28 R² = 0.51464
0
50
100
150
200
250
0 10 20 30 40 50 60 70 80 90 100
Ideal M
iles/Ah
Odometer (1000s of Miles)
Capacity vs Miles Driven - Original Battery Pack
Range Mode IM Standard Mode IM CAC
Plug In America’s Tesla Roadster Battery Study
page 8
Vehicles With Replaced Battery Packs
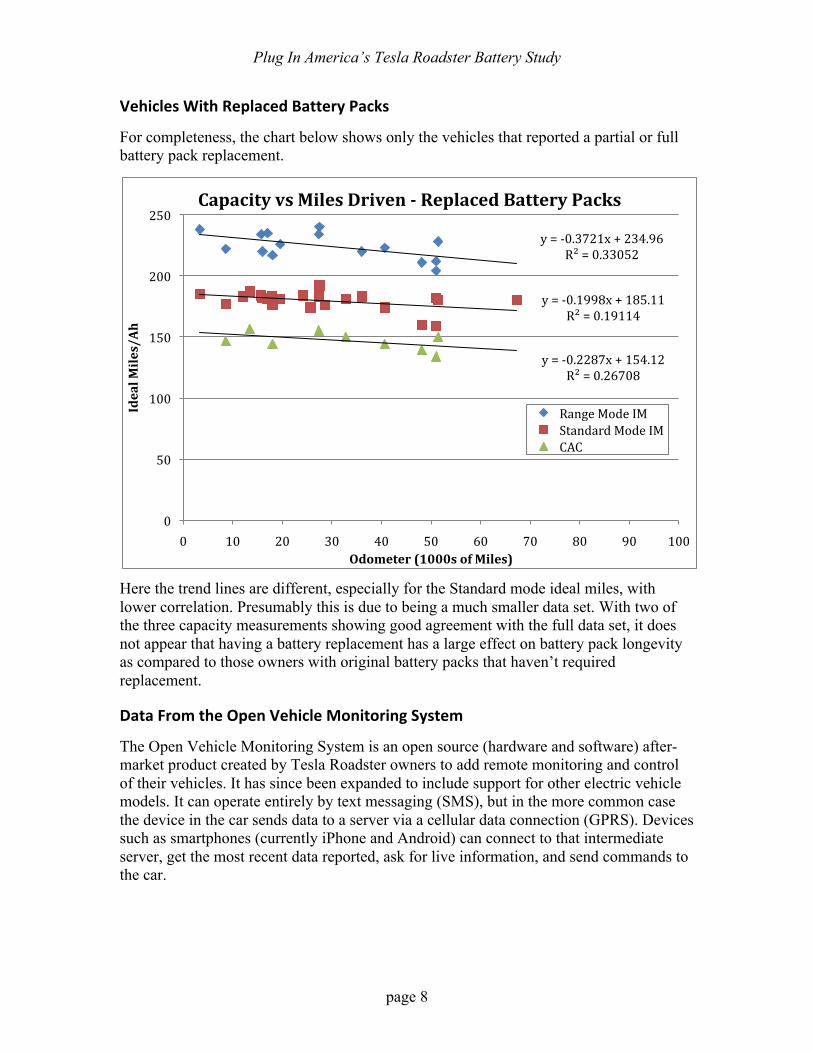
For completeness, the chart below shows only the vehicles that reported a partial or full battery pack replacement.
Here the trend lines are different, especially for the Standard mode ideal miles, with lower correlation. Presumably this is due to being a much smaller data set. With two of the three capacity measurements showing good agreement with the full data set, it does not appear that having a battery replacement has a large effect on battery pack longevity as compared to those owners with original battery packs that haven’t required replacement.
Data From the Open Vehicle Monitoring System
The Open Vehicle Monitoring System is an open source (hardware and software) after-market product created by Tesla Roadster owners to add remote monitoring and control of their vehicles. It has since been expanded to include support for other electric vehicle models. It can operate entirely by text messaging (SMS), but in the more common case the device in the car sends data to a server via a cellular data connection (GPRS). Devices such as smartphones (currently iPhone and Android) can connect to that intermediate server, get the most recent data reported, ask for live information, and send commands to the car.
y = -‐0.3721x + 234.96 R² = 0.33052
y = -‐0.1998x + 185.11 R² = 0.19114
y = -‐0.2287x + 154.12 R² = 0.26708
0
50
100
150
200
250
0 10 20 30 40 50 60 70 80 90 100
Ideal M
iles/Ah
Odometer (1000s of Miles)
Capacity vs Miles Driven - Replaced Battery Packs
Range Mode IM Standard Mode IM CAC

Plug In America’s Tesla Roadster Battery Study
page 9
The server records the data reported by the car in a way that anonymizes the data to protect owner privacy 9. The OVMS team contributed a portion of this data to the study. The data consisted of periodic records sent primarily during charge sessions and less frequently when idle. The records included the ideal range, charge voltage and current, date and time, and the odometer reading. The data did not include any geographical data or information that could be used to identify the vehicle such as the vehicle identification number (VIN).
With this data set, it was possible to reliably extract the post-charge ideal miles in the preferred time window: shortly after the 10-minute state-of-charge settling period. The data set is also a bit less self-selected since the owners didn’t have to make the effort to fill out the survey. However, the data set lacks the other information gathered by the survey, such as geographical location (and thus climate), vehicle manufacture date, and maintenance history.
The results are similar to the survey data, and there’s probably a considerable overlap between the two data sets. The OVMS data does show slightly faster loss rates, and – somewhat surprisingly – slightly lower correlation with the corresponding trend lines. The OVMS data covers fewer miles driven, which may account for the higher capacity loss rate, as lithium-ion batteries are generally expected to lose capacity at a relatively high rate early on, then level out until near the end of their useful lifetime. So the OVMS data may reflect the effect of early capacity loss more than the survey data does.
9 Owners have the option of encrypting data sent to the server to maintain complete privacy.
y = -‐0.413x + 238.49 R² = 0.25125
y = -‐0.3739x + 187.59 R² = 0.3469
0
50
100
150
200
250
0 10 20 30 40 50 60
Ideal M
iles
Odometer (1000s of Miles)
OVMS Data - Ideal Miles vs Odometer
Range Mode Standard Mode

Plug In America’s Tesla Roadster Battery Study
page 10
Although OVMS is now capable of reading and recording the CAC value, that was not the case when this data set was collected. Perhaps an update to this study will be able to include the CAC from the OVMS vehicles.
Effect of Vehicle Age on Capacity Lithium ion batteries are expected to lose capacity over time, even if they are just stored and not used. To isolate any capacity loss due to age from the loss due to use, each survey vehicle’s reported range is compared to the projected range for its miles driven.
Using the survey data for the Standard mode range in the previous section, the graph below shows each vehicle’s offset from the trend line, plotted by vehicle age.
The data shows wide variation among the data, but no discernable trend with age. As Roadster production ended in January of 2012, the survey lacks data on any capacity loss in the first year. Another Roadster battery study being conducted by Richard Kaethler10 may be able to address capacity loss in the first year of ownership.
Effect of Climate on Battery Longevity The Plug In America LEAF Battery Survey11 showed that concern about accelerated battery capacity loss among some vehicles in hot climates was justified. It found a clear
10 http://www.teslamotorsclub.com/showthread.php/6491-Roadster-Owner-Based-Study-of-Battery-Pack-Capacity-Over-Time 11 http://www.pluginamerica.org/surveys/batteries/leaf/Leaf-Battery-Survey.pdf
-‐20
-‐15
-‐10
-‐5
0
5
10
15
20
0.0 0.5 1.0 1.5 2.0 2.5 3.0 3.5 4.0 4.5 5.0 Deviation From Expected Standard Mode Range
(Ideal M
iles)
Vehicle Age (Years)
Deviation From Projected Standard Mode Ideal Miles vs Car Age
Plug In America’s Tesla Roadster Battery Study
page 11
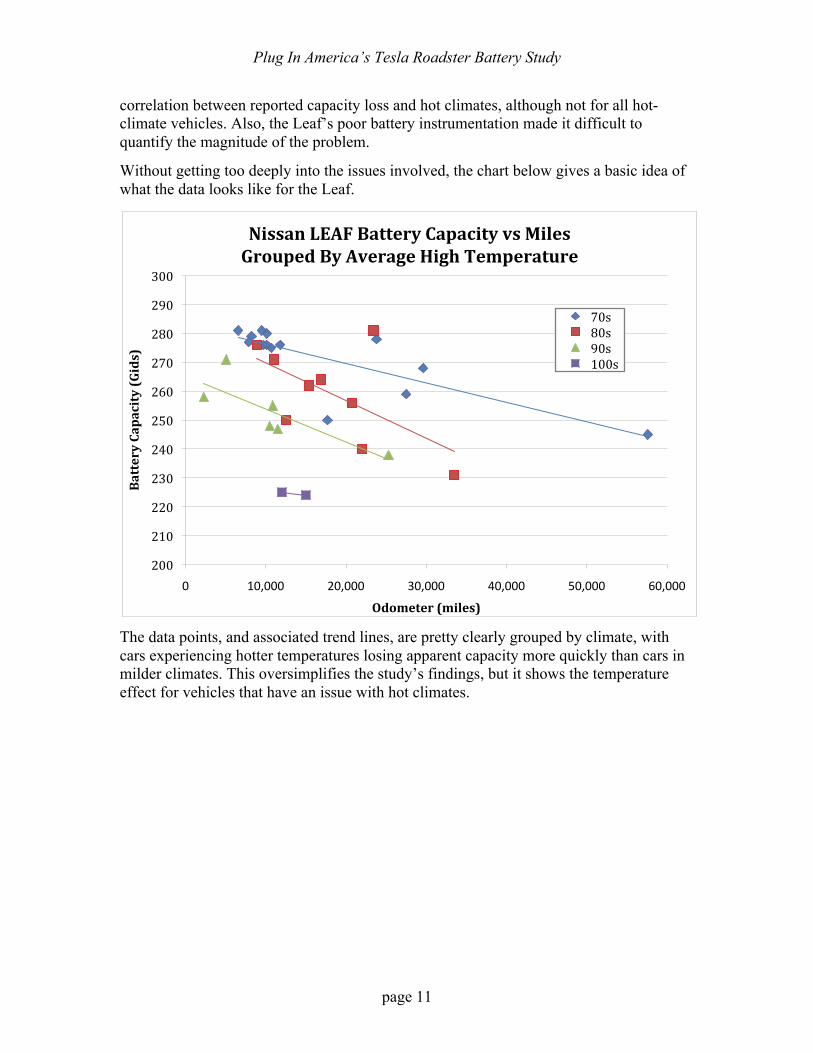
correlation between reported capacity loss and hot climates, although not for all hot-climate vehicles. Also, the Leaf’s poor battery instrumentation made it difficult to quantify the magnitude of the problem.
Without getting too deeply into the issues involved, the chart below gives a basic idea of what the data looks like for the Leaf.
The data points, and associated trend lines, are pretty clearly grouped by climate, with cars experiencing hotter temperatures losing apparent capacity more quickly than cars in milder climates. This oversimplifies the study’s findings, but it shows the temperature effect for vehicles that have an issue with hot climates.
200
210
220
230
240
250
260
270
280
290
300
0 10,000 20,000 30,000 40,000 50,000 60,000
Battery Capacity (Gids)
Odometer (miles)
Nissan LEAF Battery Capacity vs Miles Grouped By Average High Temperature
70s 80s 90s 100s

Plug In America’s Tesla Roadster Battery Study
page 12
The chart below shows the corresponding Roadster battery capacity data colored by temperature group.
In the case of the Roadster, the data points from different climates are mixed together with no discernable pattern. This shows no significant correlation between climate and battery longevity. Perhaps a pattern will emerge with more data points and more miles driven per vehicle, but there’s no clear pattern with the current data set.
Projected Battery Capacity What does this mean in terms of how well the Roadster battery packs are holding up? How does that compare to Tesla’s original (2006) guidance to prospective owners?
Of miles driven, vehicle age, and climate, only mileage showed a significant correlation with capacity variation.
150
160
170
180
190
200
0 10,000 20,000 30,000 40,000 50,000 60,000 70,000 80,000
Standard Mode Ideal M
iles
Odometer (Miles)
Standard Mode Range vs Odometer by Climate 60's (1 vehicle) 70's 80's 90's 100's (1 vehicle)

Plug In America’s Tesla Roadster Battery Study
page 13
Using the data collected from the survey and the OVMS data, battery capacity as a percent of new is projected forward to 100,000 miles. The results are shown in the chart below.
Discounting the small set of Roadsters with replaced battery packs (aka Energy Storage System or ESS), the data sets suggest an average Roadster battery pack capacity level of between 80% and 86% at 100,000 miles. This indicates average battery pack longevity well above Tesla Motor’s original guidance of 70% after five years and 50,000 miles. Individual owner experience may vary from the projected average value.
Drivetrain Maintenance Survey participants were asked about replacements of major drivetrain components: the battery pack, the power electronics module (PEM), and the motor. Below are the percentages of vehicles that reported one or more replacements for each item.
It should be noted that Tesla Motors typically replaces entire items for even small issues. A battery pack may be replaced because of a blown fuse. A PEM may be replaced because of a failed fan. So, to some degree, the above data overstates the failure rates of major components.
0%
10%
20%
30%
40%
50%
60%
70%
80%
90%
100%
PIA Survey Survey -‐ Original ESS
Survey -‐ Replaced ESS
OVMS
Projected Roadster Battery Capacity Remaining after 100,000 Miles
Standard Mode Range
Range Mode Range
Calculated Ah Capacity
0%
5%
10%
15%
20%
Battery PEM Motor
Roadster Drivetrain Replacement Rates

Plug In America’s Tesla Roadster Battery Study
page 14
Conclusions The projections from the various data sets studied suggest that Roadster batteries will be at 80% to 85% capacity after 100,000 miles, on average. Stated another way, the study shows an average loss of about 3.7 ideal miles of range (1.6%) per 10,000 miles driven.
As there is considerable variation among vehicles with similar mileage, an individual owner’s experience may vary significantly from the average.
The survey found no significant correlation between climate and battery pack longevity. Individual experience may vary. The survey data for high-mileage vehicles is sparse with little variation in climate among those vehicles, so it’s possible an effect from climate will emerge as more data is collected.
The survey found no significant correlation between vehicle age and battery pack longevity, although the study has no data on the first year of use, nor use beyond 4.5 years.
The calculated amp-hour capacity is the most reliable measure of battery pack capacity. It would be a benefit if this value were readily visible to Roadster owners.
It’s curious that Tesla does not offer any sort of warranty on battery pack capacity, not previously as part of a new Roadster purchase, not as part of the extended warranty they are now offering Roadster owners as their warranties expire, and not even to Model S owners despite the purported improvement in battery chemistry and corresponding increase in both time and miles on the Model S battery warranty.
Survey Data Availability The full survey data (except for identifying owner information, which is kept confidential to protect owner privacy) is available for third-party analysis.
http://www.pluginamerica.org/surveys/batteries/tesla-roadster/
About Plug In America Plug In America is the preeminent nonprofit organization for the promotion and support of plug-in electric vehicles for the many economic, national security, and environmental benefits they bring. We are focused on increasing the number of electric miles displacing fossil fuel miles through advocacy with industry and government and outreach to consumers. Plug In America has over a million electric miles of experience on the board rof directors and uses that to advocate for the interests of current and potential future plug-in vehicle owners.
If you find the information in this study helpful, please consider donating to Plug In America so that we can continue our critical work supporting plug-in vehicles and the consumers who drive them. http://www.pluginamerica.com/donate WE� DRIVE� ELECTRIC.� YOU� CAN� TOO.