Physics of Ultrasound Notes - nesra.co.uk · Physics of Ultrasound Notes Lynette Hassall, DMU AMS...
27
Physics of Ultrasound Notes M-Turbo ® S Series ™ NanoMaxx ™
Transcript of Physics of Ultrasound Notes - nesra.co.uk · Physics of Ultrasound Notes Lynette Hassall, DMU AMS...

Physics of Ultrasound Notes
M-Turbo®S Series™ NanoMaxx™

2
Physics of Ultrasound Notes
Lynette Hassall, DMU AMS MLI, Clinical Applications Specialist, SonoSite, Inc.
These notes are not a complete physics text, vast amounts of possibly significant information have been omitted to try to keep the notes short and relevant. The notes are meant to be an introduction to the practical physics of ultrasound only and some of the explanations have been simplified. I am attempting to provide you with a general understanding of how and why ultrasound produces an image, and how to optimise those images to achieve the best from your machine, for the benefit of your patients.Reading these notes does not imply any qualification or competence in ultrasound physics. Attendance at a practical ultrasound training course is highly recommended.
Contents
What is ultrasound? 3
Terminology 4
Transducer 6
Image orientation 9
How do we produce an image? 9
Resolution 11
Sound interaction with tissue 12
Bioeffects 14
Ultrasound Modes 15
Artifacts 18
How do we avoid artifacts? 23
Image optimisation 24
References and Bibliography 27

3
What is ultrasound?
Ultrasound is a pressure wave which requires a medium for its propagation.
Ultrasound propagates through tissue as a series of alternating areas of compression (area of high pressure) and rarefaction (area of low pressure). Sound is measured in cycles per second or hertz (Hz); the audible range of sound is from 20-20,000 Hz. A thousand Hz is termed a kilohertz (kHz), and anything above this human audible range is termed ultrasound.
Diagnostic ultrasound is higher still and is usually in the range of 1–20 megahertz (MHz) or million hertz.
Diagnostic ultrasound operates at very low intensities of power and this power is rated in milliwatts (mW) per square centimetre (cm2).
Diagnostic Ultrasound 1–20 MHz >1.0 MHz – very low intensities <mW/cm2
Ultrasound >20 kHz
Audible Sound 20 Hz – 20,000 Hz
Infrasound 0–20 Hz
Just to make it even more complicated, the speed of sound is characteristic of the tissues through which it propagates because density and compressibility change the speed the sound wave travels.
Sound travels at approximately 330 m/s in air, 1525 m/s in water (at 37°), 3000 m/s in bone, 1450 m/s in fat, 1600 m/s in muscle and 1560 cm/s in blood. (Gent p4). Due to the need for a single number for use in production of an image the speed of sound used for calculation is an average of the speeds of sound in soft tissue.
The assumed speed of sound in soft tissue is 1540 m/s. It is important to remember this is an average because the differences in speed of sound can cause some artifacts in our final image.

4
Terminology
Frequency: The number of cycles per second. Frequency is measured in Hertz and this is where the probe name originates. A curved 6-10 – MHz probe produces ultrasound in the range of six to ten megahertz.
Wavelength: The ‘distance between two consecutive, identical positions in the pressure wave’ (Gent), and is determined by the frequency of the wave, and the speed of propagation in the medium it is passing through, e.g: A frequency of 3 MHz produces a wave approximately 0.5 mm in length in soft tissue, while 10 MHz has a wavelength of approximately 0.15 mm in soft tissue. The shorter length of the wave means that the resolution of the transducer is greater, i.e: we can see smaller things more clearly.
Power: The rate of flow of energy through a given area – because an ultrasound beam has a volume, the power of the ultrasound beam is the rate of flow of energy through the cross-sectional area of the beam.
Acoustic Impedance: The speed of sound in a specific medium – is determined by the density and compressibility of a given medium – where two tissues of different acoustic impedance meet, an ultrasound interface is created, where some of the sound is reflected and some is transmitted. The amount transmitted or reflected depends on the size of the mismatch, and the angle at which the ultrasound beam strikes the interface.
Transducer: The part of the ultrasound system which transmits and receives sound to produce the image, it is the point of contact between patient and system.
Piezoelectric effect: The crystals in the ultrasound transducer have the ability to deform and produce a pressure wave when struck by an electrical impulse, and when struck by a pressure wave produce an electrical impulse. This is the basic principle of production of ultrasound.
B-mode Imaging (or 2D): (Brightness mode) The brightness of the pixel on the image is a representation of how strong the reflection back to the transducer is. The stronger the received reflection the whiter the dot on the image. The weaker the signalreceived the darker the pixel appears on our image.
M-mode Imaging: (Motion mode) Moving reflectors in the image are represented by lines on the display. This is used to record fetal heart motion on the display, or cardiac motion in an echocardiogram, or motion of the pleura sliding when documenting animage of a patient with a possible pneumothorax.
Echogenicity: The brightness of the returned echo displayed on the screen is determined by the strength of the echo received by the transducer, it is characterised by the appearance of the pixel compared to the surrounding structures.
Anechoic: The absence of returned echoes – black on the image (see image left).
Hypoechoic: (or Echolucent, Echopenic) Less echogenic (darker grey) than surrounding tissue (see image left).
Hyperechoic: (or Echogenic) Brighter (paler grey or whiter pixel) than surrounding tissue (see image left).
Isoechoic: Similar echogenicity to surrounding tissue (see image left).

5
Echotexture: How similar the shades of grey within an image are to each other.This is defined as either:
Homogenous: Where all echoes are a similar shade of greyHeterogenous: Where the echoes are dissimilar
Line of Sight: This is the term used to describe the wavefront generated from each individual piezoelectric crystal. A number of ‘lines of sight’ combine to produce an image. The lines of sight are usually parallel to each other and perpendicular to the face of the transducer, unless electronic beam steering is utilised.

6
Transducer
A basic transducer is a very complex piece of electrical equipment. It is designed to convert an electronic pulse into an ultrasound pulse, then convert the sound pulse into an electronic signal in order to be processed to produce an image.
In it simplest form it consists of a cable connecting it to the ultrasound machine, a plastic casing which encloses the electronics, a damping material, piezoelectric crystals, a matching layer and a protective layer. The transducer is also known as a ‘probe’.
Damping Material or Backing LayerThis layer acts to shorten the resonance of the crystal as it transmits the pulse. This improves the resolution of the image by decreasing the length of the pulse, allowing us to separate smaller structures along the depth of the beam.
Piezoelectric CrystalsThese crystals produce an ultrasound pulse when struck by an electrical impulse, and convert the returned ultrasound echoes into an electric signal which is interpreted by the ultrasound machine to produce the image. The crystals resonate and emit ultrasound, then stop ringing in order to ‘listen’ for the return echo – they cannot transmit and receive at the same time.
Matching LayerActs to allow the sound to penetrate through the skin into the tissue. There is a very large impedance mismatch between the transducer, the air and the skin, so unless a matching layer is added to the transducer the sound would bounce straight back to the crystals and not penetrate into the tissue.
CoverActs as a protective cover over the matching layer and piezoelectric crystals to protect them from gel or other liquids or contaminants.
Each Piezoelectric crystal is electronically and acoustically isolated from all the others, so each crystal transmits its own individual ultrasound wave, these waves join together to form a single wavefront (Huygens Principle). By timing the firing of the crystals we can steer the beam, or focus the beam at multiple levels.
Cable
Backing Layer
Matching LayerPiezoelectric Crystals
Plastic case / Electronics
7
The part of the transducer which is in contact with the patient is called the face of the transducer, and the shape and size of this face is termed the ‘footprint’.
The face of the transducer has different shapes –
A Linear array has all the piezoelectric crystals set in a line across the transducer face.This produces a rectangular ultrasound image and is usually used for:
• vessels• vascular access• needle guidance• musculoskeletal imaging• small parts such as breast and thyroid• foreign bodies• anywhere we need a wide ‘near field’ but not a lot of depth
as linear transducers tend to be higher in frequency than curved arrays.
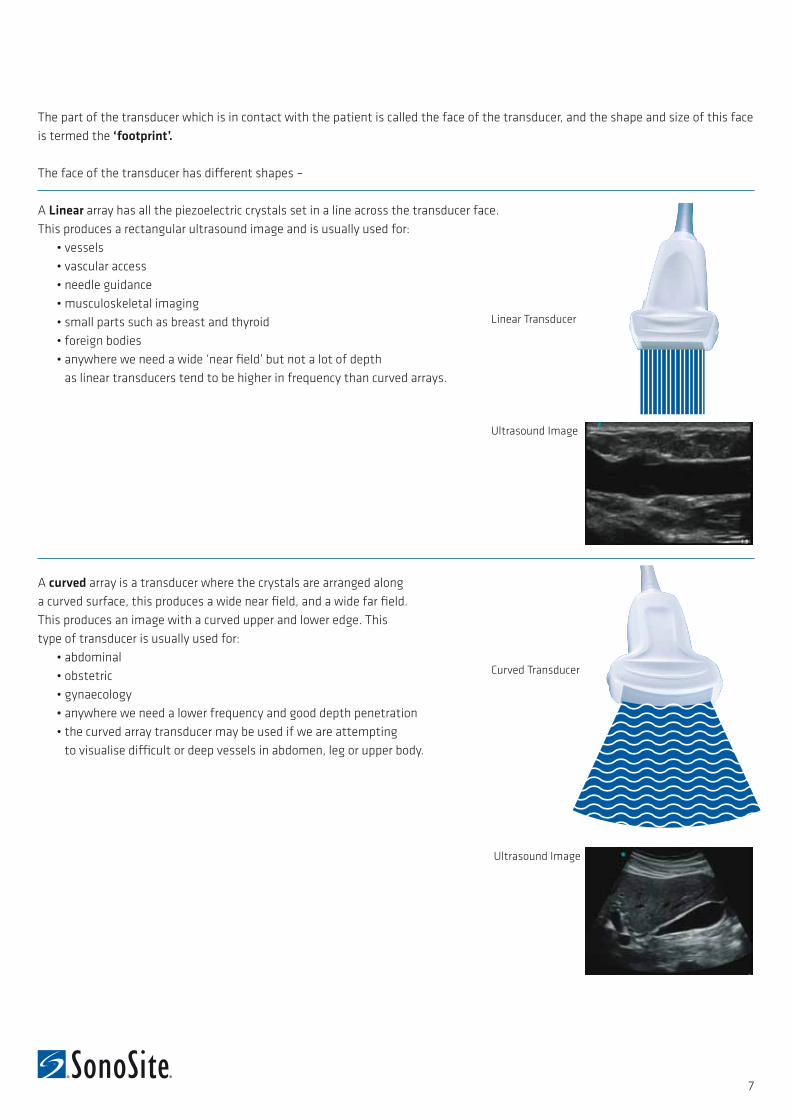
A curved array is a transducer where the crystals are arranged along a curved surface, this produces a wide near field, and a wide far field. This produces an image with a curved upper and lower edge. This type of transducer is usually used for:
• abdominal• obstetric• gynaecology• anywhere we need a lower frequency and good depth penetration• the curved array transducer may be used if we are attempting
to visualise difficult or deep vessels in abdomen, leg or upper body.
Linear Transducer
Ultrasound Image
Curved Transducer
Ultrasound Image

8
There are many other types, sizes and shapes of transducers, depending on imaging requirement.
A phased array transducer, is one which the crystals are fired in phases to produce a pizza slice shaped image on the monitor. This transducer may also be called a Sector Transducer.
This type of transducer is usually used for:• cardiac imaging• difficult or deep intercostal views of the abdomen • sometimes for neonatal head imaging.
Depth
Thickness Width
The ultrasound beam has a thickness as well as a depth into the tissue and width across the tissue. The image we see on the screen is a two dimensional representation of a three dimensional volume of tissue, so there are some artifacts associated with this representation. (See section on artifacts).
Phased Array
Transducer
Ultrasound Image

9
Image orientation
All transducers have an orientation marker on one side – usually a small ridge of plastic – that corresponds to the small mark on the ultrasound monitor.
In transverse imaging this marker is pointed to the patient’s right side, so the image is viewed as if from the patients feet looking cranial.
In longitudinal imaging this marker is pointed toward the patient’s head.
For the purposes of ultrasound needle guidance, the most important thing is knowing whether you are inserting the needle from the ‘marker’ or ‘non-marker’ side of the probe.
Producing an image?
The brightness of the pixel on the image is directly proportional to the strength of the echo received at the transducer. Our transducer produces a sound wave that is sent down into the tissue.
The sound interacts with the reflectors and some is sent back to the transducer.
These received echoes are used to produce the ultrasound image.
The stronger the reflector, the more sound is returned to the transducer, the whiter the pixel on the screen.
The weaker the reflector, the less sound returned to the transducer, the blacker the pixel appears on the screen.
Probe Marker
Right Left
Transverse Image Longitudinal Image
Probe Marker
Head Foot

10
B-mode imaging (Brightness mode) produces the best images when the reflector is at 90° to the beam because this encourages most of the echo to return to the probe where it can be used to produce the image.
In these images, when the beam strikes the posterior wall of the CCA at 90°, the three intimal layers are clearly seen; when we are even slightly off 90°, the posterior wall layers cannot be distinguished separately.
90°

11
Resolution
We speak about the resolution of the image: this term refers to how well we can distinguish the structures we need to see. The different types of resolution are as follows: temporal, contrast and spatial:
Temporal Resolution How accurately we demonstrate a moving structure over time; this is important in echocardiography and obstetric scanning.
Contrast ResolutionHow well the system displays structures with differing reflection characteristics as different shades of grey in the image.
Spatial ResolutionSpatial resolution can be divided into two different types:
• Axial – depth along the axis of the beam (parallel to the beam)• Lateral – width across the beam (perpendicular to the beam).
Axial Resolution is the ability of the system to display small structures along the axis of the beam separate from each other. If we have two small vessels, one above the other, it is important to see them separately on the image – not as if they were joined or smeared together.
Good Axial Resolution Poor Axial Resolution
Lateral Resolution is the ability of the system to display small structures side by side (same depth) as separate from each other. (Lateral Resolution is usually poorer than axial resolution due to the beam width).
Good Lateral Resolution Poor Lateral Resolution
This image demonstrates good spatial resolution in both lateral and axial dimensions; note the delineation of the median nerve fascicles in both lateral and axial dimensions.

12
Sound Interaction with Tissue
The interaction of ultrasound with tissue causes a net energy loss called attenuation. When the ultrasound waves are transmitted into the body they will:
• Reflect• Refract• Absorb• Scatter
All of these interactions together add up to attenuation.
Reflection
Diffuse reflectors: When a sound wave hits a relatively small interface, some of the wave will be transmitted through the interface and some will be reflected. When a reflector is small, we get what is termed diffuse reflection – the sound bounces around from reflector to reflector depending on the angle that the beam strikes, and eventually partially returns to the transducer and is used to produce the image. These small reflectors assist us in producing an appreciation of the texture of the organ being insonated.
Incident sound beam
Diffuse reflector Transmitted sound beam
Specular reflectors are large compared to the wavelength of the ultrasound beam. When they are insonated at 90°, all of the reflected sound returns to the transducer, so they produce a very strong bright pixel on the image. Of course, some of the sound will be transmitted through to the rest of the tissue. If the specular reflector is insonated at an angle other than 90°, the angle of reflection will equal the angle of incidence; the beam will reflect away from the transducer, so that structure will not be represented on the image and will effectively ‘disappear’.
Incident sound beam
Reflected sound beam
Specular reflector Transmitted sound beam

13
RefractionOccurs when there is an impedance mismatch and the angle of incidence is not 90°. When the speed of sound is different in two adjoining tissues AND the angle of incidence is not 90°, the ultrasound beam will deviate or bend, which can cause artifacts on the image. In this illustration, if the two tissues were the same impedance, the sound beam would continue in a straight line, but because there is a different speed of sound in the second tissue the beam deviates from its path. This is the same thing we see when we put a straw in a glass of water; the speed of light in the air is different to speed of light in water, so the straw appears to bend or break.
AbsorptionAs the beam travels through tissue some of the energy contained within the beam is absorbed by the tissue as heat. This is a cause of some of the bioeffects that are possible with ultrasound (see paragraph on bioeffects). The overall effect on the ultrasound image is that the sound loses energy and the image quality is poorer the deeper we try to penetrate. The higher the frequency the greater the absorption that occurs; this is a limiting factor for a transducer of a given frequency. ALL ULTRASOUND TRANSDUCERS OFFER YOU A COMPROMISE BETWEEN HIGH FREQUENCY HIGH RESOLUTION and LOWER FREQUENCY BUT GREATER DEPTH PENETRATION into the tissue. Remember too that depth is not a one-way street – it is a round trip from the transducer into the tissue and then reflection back to the transducer – the total path length must be taken into account.
ScatteringOccurs when an ultrasound beam strikes an interface within the tissue. The pattern of the scattering depends on the size of the interface the beam strikes.
• If it strikes an interface much larger than the wavelength, we get reflection.
• If the interface is about the same size as the wavelength, the beam scatters randomly in all directions, depending on the orientation of the reflector to the beam and the phase of the wave which strikes the interface – like diffuse reflections, we use this type of scattering to produce tissue information.
• If the interface is much smaller than the wavelength we have Rayleigh scattering. This is a pattern of scattering where the reflection is equal in all directions. In effect, it acts as a point source of sound!
Red blood cells scatter ultrasound in this manner; we use this reflection when we are obtaining a color or Doppler trace.
An important point to make is that the echogenicity of a structure or an organ is not just determined by its density; it is determined by the number and type of reflectors within it, and the manner in which they interact with the sound waves.
AttenuationAttenuation is not the same at absorption – attenuation is a combination of all the interactions of sound with tissue added together. The attenuation is equivalent to a loss of 1dB / cm / MHz (Gent p 74), but different tissues attenuate the ultrasound to varying degrees.
In some tissue, such as muscle or nerves, the attenuation rate changes with the angle of insonation. These tissues are said to be anisotropic – the echogenicity of the structure will change with the changing angle. REMEMBER to try to achieve an angle of 90° to the beam for all B-mode imaging.

14
Bioeffects
If you are using ultrasound you need to be aware of the potential for ultrasound to cause bioeffects. Ultrasound is a mechanical form of energy that interacts with the biological tissue through which it propagates. This interaction can result in physical effects within the tissue due to either thermal or mechanical effects.
Tissue heating is caused by absorption of some of the ultrasound mechanical energy as heat. This effect is used in physiotherapy ultrasound machines to create a healing effect on the tissues, but we do not want to do this with diagnostic ultrasound.
The mechanical effects are those of cavitation, which is the formation of microbubbles and their response to the fluctuations in the pressure wave applied and streaming, which is fluid movements at a microscopic level.
The ultrasound units in Australia have limited the output power and intensity levels of diagnostic ultrasound machines in Australia and the TI or MI rating visible on the monitor.
TI = Thermal index, is a rating for the beam’s potential to cause tissue heating.MI = Mechanical index is a rating for the beam’s potential to cause mechanical effects.
A Statement on Use of Diagnostic Ultrasound can be downloaded from the Australasian Society for Ultrasound in Medicine (www.asum.com.au).
For practical purposes, ultrasound should be used when medically indicated, or when there is expected benefit to be gained. It should be done for the shortest possible time, using minimum power setting possible. The ALARA principle should be applied to all ultrasound examinations; the exposure should be kept as low as reasonably achievable.
The consideration of bioeffects should not stop you from performing a medically indicated, necessary ultrasound procedure on any patient.
For those of you who will be scanning first trimester pregnancies, when you are assessing or recording fetal heart movement, only use B-mode and M-mode imaging. Do not use color or Doppler on first trimester fetuses, because these modalities increase the power of the beam and the intensity of the ultrasound to the fetus.

15
Ultrasound Modes
B-mode (Brightness mode): This is the black and grey image we see on the monitor when we first turn on the machine.
M-mode (Motion mode): This is used to record movement of tissue over time. This mode is used when we wish to document something moving on our image such as the fetal heart motion, cardiac motion, or motion of the normal lung edge when looking for a pneumothorax.
Color: This gives directional information for blood flow and is relative to the face of the transducer, i.e. towards the transducer or away from the transducer. The color box is superimposed over the B-mode image, so the frame rate will be slower. This movement is best seen at 0° – movement which is either directly towards or directly away from the transducer. Because this is virtually impossible to achieve in real patients, an angle equal to or less than 60° is best. If the angle of flow is 90° (perpendicular) to the beam, there is no movement relative to the transducer, so no color will be seen.
We use the color bar at the top of the image to indicate direction of flow; the color on the top is movement towards the probe, on the bottom is movement away from the probe. Be aware that the machine does not know whether you are examining an artery or a vein, so do not be fooled into thinking that everything that has been encoded red on your image is an artery, or blue is a vein. You control the color encoding by pressing the Invert button. To achieve good color resolution keep the color box as small as possible in both height and width.
Amplitude Mapping: This is also known as Power Doppler, Color Power Doppler or Power Doppler Imaging, or ‘Power’ for short. This is used when we want to see whether there is flow. It is only one color, so does not give a direction to the flow. Power is useful because it is not as angle dependent as color, is more sensitive to low flow states, and has better edge resolution.

16
Spectral Doppler: This is a graphical representation of flow over time. The brightness of the pixels represents the amplitude (strength) of the returned echo. Arteries and veins have characteristic patterns of flow. The Doppler line of sight is a representation of the beam from the transducer.
The sample volume is the box that represents the area of movement being sampled.
The Doppler angle is the angle between the direction of flow and the line of sight, and must be at 60° or below. Any angles higher than this cause the calculations of velocity of flow to become increasingly inaccurate.
This image shows a typical low resistance arterial waveform.
MultiBeam (SonoMB™ – SonoSite Technology): Also called compound imaging or spatial compounding.This imaging modality makes use of the electronic beam steering capabilities; different frames from differing angles are rapidly acquired. If an echo is consistent throughout all frames, it is retained; if the echo changes, it is considered to be an artifact or noise and is removed. The term ‘line of sight’ refers to the individual waves sent from each individual crystal within the transducer.
This technology is designed to remove speckle, clutter, and other acoustic artifacts from the image and provide the viewer with a clear, higher-resolution image with improved contrast resolution, tissue differentiation, and edge detection. This may, however, remove useful artifacts, such as shadowing, posterior acoustic enhancement or edge refraction, from the image; these artifacts are used to categorize some tissue types.
Conventional Imaging Multibeam Imaging + Multibeam Imaging + Multibeam Imaging
In Multibeam imaging, multiple frames are rapidly acquired and added together to produce an image – any echo which is not consistent throughout all frames is considered an artifact and not displayed on the final image.
In conventional imaging all ‘lines of sight’ are parallel to each other.
Sample Volume
Doppler Line of Sight
Doppler angle

17
Tissue Harmonic Imaging: This makes use of the tissue/sound interaction property causes sound to resonate at multiples of the fundamental frequency. The transducer emits a beam at a fundamental frequency but receives at the first harmonic of that frequency. For example, if the fundamental frequency of the transducer is 3 MHz, the first harmonic received will be at 6 MHz. This means effectively that the received echoes have a shorter path length, so there is less attenuation. It is designed to produce a higher-resolution image while still achieving good depth penetration into the tissue.
Fundamental frequency emitted
First harmonic of that frequency received

18
Artifacts
The term artifact is used to describe a range of appearances that do not accurately correspond to anatomical features or characteristics in the patient.
It is not important that you are able to recognise WHICH artifact you are seeing, but recognizing that you ARE seeing an artifact is vital.
The only RULE in ultrasound I will ever give you is:NOTHING IS REAL UNLESS YOU CAN SEE IT IN TWO PLANES,
AND PREFERABLY, FROM TWO DIFFERENT WINDOWS
The reason for this rule is that you need to assume that any appearance may be an artifact unless you have seen the same appearance in both transverse and longitudinal views, and have moved the probe and viewed the structure from a different angle.
Artifacts result from a number of assumptions that the ultrasound machine has to make in order for it to produce an image.These assumptions include the following:
• Speed of sound is constant in soft tissue.• All echoes detected by the transducer have come from the central axis of the beam.• The ultrasound beam travels in straight lines.• The time taken for a pulse to return to the transducer from a given interface is directly related to the distance from interface
to reflector.• An echo generated at an interface returns directly to the transducer without generating any secondary echoes.• Rate of attenuation is constant.
Varying resultant appearances are possible, such as:• Echoes in a display that do not correspond with their position in the patient.• Absence of echoes that should be displayed.• Separate structures might display as a single joined structure.• Brightness of echoes might not display correctly.• A single structure can display as two separate structures.• Thin membranes may display as being much thicker than in reality.
The names of some of the artifacts that may occur include the following:• Mirror image• Ring down• Slice thickness• Multipath• Velocity• Shadowing• Enhancement• Refraction• Anisotropy• Side lobe• Reverberation• Beam width

19
ShadowingOccurs when the beam passes through an area of
• Increased reflection: bone, calcifications, kidney, or biliary calculior
• Increased attenuation: scar tissue, breast malignancies
We see a loss of echo information in the image referred to as ‘shadowing’. In the image to the right, we see the vertebral artery in between the shadowing from the transverse processes.
Posterior Acoustic EnhancementThis occurs as an area of increased brightness behind an area on decreased attenuation compared to the surrounding tissue.
We use this artifact as a positive for assistance when scanning the female pelvis; we fill the bladder and get brighter echoes behind it. This phenomenon also occurs behind breast cysts, blood vessels, the gallbladder, or highly cellular carcinomas.
Edge RefractionWhen the ultrasound beam hits the curving edge of a highly reflective structure at the ‘critical angle’ (all sound is refracted, none is reflected), there is no sound returns to the transducer from that line of sight, so we see a narrow black line from the edge of the structure down towards the back of the image. This occurs in vessels, breast cysts, at the edge of the gall bladder, and sometimes at the edge of muscle fascia or ligaments.

20
ReverberationA reverberation artifact is the multiple representation of the same interface, at different depths in the display. When the sound beam returns to the transducer the sound is not ‘absorbed’ into the transducer; instead the pressure wave hits the crystals and causes them to produce the electrical pulse. If there is enough energy remaining in the wave, it is reflected down into the tissue again (and again and again) like an echo. The structure displays the exact same shape, but decreases its intensity as it displays into the image.
Comet Tail ArtifactThese artifacts are a form of reverberation . They are relatively bright echoes that taper and decrease with depth, which gives rise to the name ‘comet tail’. They are typically seen behind surgical clips, IUCDs, foreign bodies – such as shotgun pellets – and needles when performing vascular access.
Ring Down ArtifactThese artifacts are the result of resonance, induced by the ultrasound beam when it strikes a group of air bubbles; it is similar to the comet tail artifact in appearance, except that the ring down artifact does not usually decrease in intensity or brightness.
In this image we see reverberation artifact within the lumen of the vessel, mimicking thrombus
1
2
3

21
Side Lobe ArtifactWhen an ultrasound beam is produced, a single main lobe is generated; however, side lobes are also generated and radiate at a number of angles to the main lobe. Reflections are also generated from the side lobes and the main lobe. The machine has to assume that all echoes are generated from the central axis of the beam; therefore, any reflection received from one of the side lobes is written as if it has arisen from the centre of the beam.
Mirror Image ArtifactThese artifacts occur when there is a large impedance mismatch between structures.They result in a structure being displayed twice; one a mirror image of the other:
• Soft tissue / bone interface• Soft tissue / lung interface• Diaphragm / lung interface• Bladder / rectum or bowel interface
The most interesting thing about the mirror image artifact is that it is present in all modes – B-mode, power, color and Doppler
Main Lobe Main Lobe
Side Lobes
Note: In the Doppler image, the sample volume is placed within the artifact

22
Multipath ArtifactThe placement of echoes in an image is based on the assumption that the echo returns directly from the reflector to the probe.If the echo hits a second reflector on its return journey, the structure is placed along the original line of sight but deeper because it has taken more time to return to the transducer.
Beam Width ArtifactThis artifact type is due to the fact that the ultrasound beam has a finite width. Echoes from the edge of the beam are incorrectly placed within the central axis of the image.
In this line drawing the echoes from a strong reflector at the edge of the beam are written as if they come from the central axis –
• Be aware of this artifact during needle guidance; the needle may be incorrectly placed centrally within a vessel when, in fact, it is at the edge of the vessel.
Slice Thickness ArtifactThe slice thickness artifact also occurs because of the finite width of the ultrasound beam. Slice thickness is due to the dimension of the ‘elevation’ or ‘azimuth’ plane of the image, i.e. the thickness of the slice. This artifact can be equated to the partial voluming effect on CT scanning. The reflector causing the artifact is not seen on the image; it is located ‘in front of’ or ‘behind’ the image we see on the monitor.
This type of artifact occurs when:• echoes within small vessels in longitudinal view.• the appearance of ‘pseudosludge’ in the gallbladder.• the appearance of echoes in the base of the bladder.
In this line drawing, the artifact is seen at the base of the bladder, but the reflector causing the artifact is not visible on the image.
In the image the base of the bladder is ill-defined and blurry due to a combination of beam width and slice thickness artifacts.

23
Avoiding Artifacts?
Artifacts are an integral part of ultrasound interaction with tissue; they cannot be completely avoided. Artifacts do not appear in images singularly; one image may contain many types of artifacts, and artifacts in various combinations. For example, side lobe artifacts may be superimposed on slice thickness or beam width artifacts.
Artifacts must be recognized as part of the image and not mistaken for ‘real’ echoes. Conversely, it is important not to mistake a real finding for an artifact. Reverberation artifacts and beam width or slice thickness artifacts in a vessel can be mistaken for thrombus within the lumen; however, do not become over confident and say ‘that’s just an artifact’ when, in fact, there really is thrombus in the vessel.
How do we do this?• Use your clinical skills• Remember to keep a high index of suspicion• Rotate the transducer from longitudinal to transverse and assess the appearance – Is it the same? – How does it change?• Reduce the overall gain; all reflections will be reduced because artifact echoes are not as strong as the ‘real’ echoes, the
artifacts will begin to disappear first• Move the transducer and observe the structure from another ‘window’• Use compression• Move the patient – Supine – RAO or LAO – Decubitus – Move the head to look at IJV from different windows – Move the arm or leg to change the window• Use differing breathing maneuvres to see if anything in the image changes.
REMEMBER: NOTHING IS REAL UNLESS YOU CAN SEE IT IN TWO PLANES, AND PREFERABLY, FROM TWO DIFFERENT WINDOWS

24
Image Optimisation
Image optimisation is about obtaining the best image possible for the individual patient.First things first –
3Ps Probe, Patient, Preset
Probe The first ‘p’: Choose the probe you are going to use. What are you going to scan? Are you scanning an obstetric, abdominal or gynecological case? If so, choose a curved transducer.Are you scanning a cardiac patient, an obese patient or someone who has difficult windows? If so, choose a phased array transducer.Are you scanning for vascular access, veins or arteries, or are you looking for a foreign body? If so, choose a linear transducer.The choice of transducer will allow you to choose the appropriate preset.
PatientThe second ‘p’: This is to remind you to enter the patient details into the machine. Correctly identifying the patient on the hard copy is vital.
PresetThe third ‘p’: Now choose the preset you will use. The preset is a factory set starting point for any examination and provides you with average factors. Remember that there is no such thing as ‘set and forget’. The presets are only a starting point and all factors should be adjusted during the course of the scan.
Frequency: The frequency of the transducer relates to the size of the patient or the depth from the skin you are imaging. If you are trying to assess deep structures in a large patient, choose a lower frequency for your transducer, or the PEN setting on the softkeys. If you have a really thin patient, a child, or are looking at superficial structures, choose a high-frequency transducer or the RES setting on the soft keys. These settings can also be changed at any time during the examination.
Depth: Now that the probe is placed on the patient it is vital that you use the correct depth for each part of the examination. Choosing the correct depth allows you to optimise the image by filling the screen with what you are looking at. Compare the first image of the aorta (too much depth) with the second image where the depth is correct; we can see exactly what we are looking at in far greater detail.
Focus: User-controlled focal zones must be placed at the point of interest in the image. The number of focal zones may be increased, focusing over a larger portion of the image. For those using SonoSite machines, adjusting the depth automatically adjusts the number and position of the focal zones; by getting the depth correct, you are automatically getting the focus from skin to the full depth of field.

25
Gain: Overall gain allows you to adjust the brightness of the image. The gain is a ‘receive’ gain, which means all pixels in the image are brightened to the same degree, including any artifacts that may be present. It seems counterintuitive to say “if you can’t see clearly turn the gain down”, however by doing this, the ‘real’ echoes are emphasized and the artifactual echoes are decreased. Too much gain will also make everything too bright and ‘fill in’ small pockets of fluid, or obscure subtle textural changes. Too much gain also emphasizes the existing artifacts. In the two images, the first image has too much gain; it is too white. The second image shows a better liver edge and texture detail.
TGC: The time gain compensation (TGC), also called depth gain compensation: it allows the user to compensate for attenuation in the image by selectively increasing the gain at the far field to ‘even out’ the shades of grey. This is done using a rotary control for ‘near gain’ and ‘far gain’, or slider pots on some systems. In the two images, the first is too black towards the back, no detail is seen. The second image is well balanced.
ZoomThere are two types of zoom control; a write zoom (equivalent to the digital zoom on a camera) and a read zoom (equivalent of the optical zoom). Both of these techniques enlarges the image on the screen; the difference being that the write zoom is a high-resolution zoom, while the read zoom is purely magnification of pixels.
Comparing the two images, the CBD on the first image is well visualized; however on the second zoomed image, it is larger on the screen, making it easier to see and measure. You can see a small ‘Z’ instead of the probe marker which informs you that the zoom function is activated.
Write Zoom – High resolution Read Zoom – Magnification

26
Dynamic Range (or ‘Compression’): This is the number of shades of grey available to be used on the image. The lower the dynamic range, the more ‘black and white’ the image will be. This results in greater contrast within the image. This is good for vascular access or vessels.
The higher the dynamic range the more subtle the changes between the shades will be, so the less contrast the image will have. This is what we need when doing musculoskeletal studies, nerves, abdomen and obstetric examinations.
In the examples of the liver; the first image shows high dynamic range. Both the liver tissue and vessels are seen; however, there are subtle shades of grey within the vessels. In the lower dynamic range image, the whole image is far more black and white with the vessels showing as anechoic. There is more contrast between white and black. A higher dynamic range is more appropriate for the liver, while the lower dynamic range would be better for vessels.
MultiBeam may be utilised to improve the image by removing some of the artifacts. Using this may also cause useful artifacts to be removed as well. Try this if the resolution is poor.
Tissue harmonics may be useful if the patient is large and there is loss of information at the back of the image. Tissue harmonics increase over depth; this control may be tried in thinner patients, it works more effectively with larger subjects.
Low Dynamic Range
High Dynamic Range
1 2

27
Other Things to ConsiderTo improve the view attained during an ultrasound:
• Ask the patient to change positions – supine to decubitus.• Ask the patient to hold their breath – inspiration or expiration – try both.• Ask the patient to valsalva if examining a vessel.• Ask the patient to ‘push the belly out’ if examining the abdomen.• Ask the patient to change the position of the limb you are examining.• Try a different window.
• Ultrasound is a dynamic study. Follow a structure from beginning to end; do not just look at it from one window.• Change from a longitudinal to a transverse view; rotate the transducer and see if the image changes for the better.• Imagine the transducer is a torch and point your torchlight towards the structure you wish to view.• Use graded compression in the abdomen (push harder with the probe).• Lift the probe pressure if trying to visualise a superficial structure or vein.• The image is very dependent on the individual patient body habitus. We will not achieve the same image on someone who weighs
200 kg as we will on someone who weighs 50 kg. • Optimizing the image means achieving the best image we can for this patient at this time, not looking for the
‘perfect’ image every time.
The SonoSite system uses SonoADAPT™ technology, so every time the depth is adjusted manually, the system dynamically optimizes these factors automatically to provide you with an image that is optimised and focused from the surface all the way to the depth chosen.
• SonoMB• THI• Focal Zones• SonoHD™• Dynamic Range• Compression• Grey Scale Maps• Lateral and Axial Smoothing• Persistence
(Some of these parameters have not been discussed in these notes as the technical considerations are beyond the scope of this introductory reading.)
References and Bibliography
Gent, R ; Applied Physics and Technology of Diagnostic Ultrasound, 1997, Milner Publishing, ISBN 0646276018Sanders, R.C; Winter T.C ‘Clinical Sonography A Practical Guide’, 2006, Lippincott, Williams and Wilking, ISBN – 10 0781748698www.sonosite.com accessed numerous times during the preparation of the notes. This site is freely accessed and contains information and presentations on both technical and clinical aspects of ultrasound.
©2009 SonoSite, Inc. All rights reserved. Subject to change. EDU00125 01/09