Physical therapy recruitment and retention strategies of ...
80
Florida International University FIU Digital Commons FIU Electronic eses and Dissertations University Graduate School 11-6-1995 Physical therapy recruitment and retention strategies of hospitals in the US Laura Burgos Florida International University DOI: 10.25148/etd.FI14051881 Follow this and additional works at: hps://digitalcommons.fiu.edu/etd Part of the Physical erapy Commons is work is brought to you for free and open access by the University Graduate School at FIU Digital Commons. It has been accepted for inclusion in FIU Electronic eses and Dissertations by an authorized administrator of FIU Digital Commons. For more information, please contact dcc@fiu.edu. Recommended Citation Burgos, Laura, "Physical therapy recruitment and retention strategies of hospitals in the US" (1995). FIU Electronic eses and Dissertations. 1945. hps://digitalcommons.fiu.edu/etd/1945
Transcript of Physical therapy recruitment and retention strategies of ...
Florida International UniversityFIU Digital Commons
FIU Electronic Theses and Dissertations University Graduate School
11-6-1995
Physical therapy recruitment and retentionstrategies of hospitals in the USLaura BurgosFlorida International University
DOI: 10.25148/etd.FI14051881Follow this and additional works at: https://digitalcommons.fiu.edu/etd
Part of the Physical Therapy Commons
This work is brought to you for free and open access by the University Graduate School at FIU Digital Commons. It has been accepted for inclusion inFIU Electronic Theses and Dissertations by an authorized administrator of FIU Digital Commons. For more information, please contact [email protected].
Recommended CitationBurgos, Laura, "Physical therapy recruitment and retention strategies of hospitals in the US" (1995). FIU Electronic Theses andDissertations. 1945.https://digitalcommons.fiu.edu/etd/1945

FLORIDA INTERNATIONAL UNIVERSITY
Miami, Florida
PHYSICAL THERAPY RECRUITMENT AND RETENTION STRATEGIES OF
HOSPITALS IN THE US
A thesis submitted in partial satisfaction of the
requirements for the degree of
MASTER OF SCIENCE
IN
PHYSICAL THERAPY
by
Laura Burgos
1995
THESIS COMMITTEE APPROVAL SHEET
To: Judith BluckerCollege of Health
This thesis, written by Laura Burgos, and entitled PHYSICAL THERAPYRECRUITMENT AND RETENTION STRATEGIES OF HOSPITALS IN THE US,having been approved in respect to style and intellectual content, is referred to you forjudgement.
We have read this thesis and recommend that it be approved.
Awilda Haskins
Sherry Moss
Leonard Elbaum, Major Professor
Date of Defense: November 6, 1995
The thesis of Laura Burgos is approved.
Dean Judith BluckerCollege of Health
Dr. Richard L. CampbellDean of Graduate Studies
Florida International University, 1995
ii

COPYRIGHT 1995 by Laura Burgos
All rights reserved
iii

This thesis is dedicated to Geber, Patrick, Daniella and the little one to come (Jordi
or Monique).
iv

ACKNOWLEDGMENTS
Thanks to everyone who helped me with my thesis . . . co-workers, my family
and members of my committee. Special thanks to my major professor, Dr. Leonard
Elbaum, for his energetic enthusiasm, valued criticism toward my project and especially
for sharing his knowledge and experience.
v
ABSTRACT OF THE THESIS
PHYSICAL THERAPY RECRUITMENT AND RETENTION STRATEGIES OF
HOSPITALS IN THE US
by
Laura Burgos
Florida International University, 1995
Professor Leonard Elbaum, Major Professor
Hospitals are seeing a reduction of physical therapy (PT) staff due to increased
opportunities and competition. Planning effective recruitment and retention strategies for PTs
in hospital settings may play an important role in reducing the problem. The primary purpose
of this descriptive research was to compile information on recruitment and retention strategies
used for physical therapists working in hospital settings.
Four hundred surveys were mailed nationwide to hospital-based physical therapy
managers. Strategies most commonly used were: attractive benefit package, interdisciplinary
teams, competitive salaries, and student employment. The least used strategies used were:
sign-on bonus, incentive pay programs, recruitment and retention committee and temporary
staffing.
It was concluded that hospital administrators need to analyze current strategies used
and future recruitment and retention staffing trends, in order to institute successful strategies
appropriate to their departments to effectively recruit and retain their staff
vi

TABLE OF CONTENTS
Page
CHAPTER I Introduction
Statement of the Problem 1Purposes of the study 8Research Questions 8Significance of the Study 9
CHAPTER II Literature Review
Theoretical and Practical Reasons for the PT Shortage 11The Cost of PT Vacancies and High Turnover 12Methods of Recruitment and Retention Strategies of Other Allied HealthProfessions 14Methods of Recruitment and Retention Strategies for PTs 17Conclusion 22
CHAPTER III Methodology
Sample and Subjects 23Survey Instrument 23Procedure for Data Collection 24Data Analysis 24
CHAPTER IV Results
Response Rate 26Demographic Characteristics of Respondents 26Recruitment and Retention Strategies for Physical Therapists inHospital Settings 37Relationship Between Demographic Characteristics and Recruitmentand Retention Strategies for PTs in Hospital Settings 44Summary 51
CHAPTER V Discussion
Introduction 53Recruitment and Retention Strategies for PTs in Hospital Settings 54
vii

LIST OF TABLES
Page
Table 1. Top Ten Vacancy Rates by Occupation 2Table 2. Average Time to Fill Full Time Vacancy 3Table 3. Retention Difficulty for Several Selected Personnel Categories 4Table 4. Recruitment Difficulty for Several Selected Personnel
Categories 5Table 5. 1991 AHA Survey of Human Resources - PT Recruitment and
Retention Strategies 21Table 6. Age and Managerial Experience of the Respondents 27Table 7. Breakdown of Respondents by States and Districts 29Table 8. Professional Title of Respondents 31Table 9. Respondents' Profession 32Table 10. Business/Management Education of Respondents 33Table 11. Business/Management Degrees of Respondents with Business/
Management Education 34Table 12. Type of Hospital 36Table 13. Recruitment and Retention Strategies
(Responses to Questions 15 - 23) 38Table 14. Recruitment and Retention Strategies
(Responses to Questions 24 - 28) 40Table 15. Categorized Responses to Question 29: "What has been
the Most Successful Strategy you have Used to Aid in Recruitmentand Retention of PTs? Why?" 43
Table 16. Results of Chi-Square Analysis of the Relationship betweenBusiness/Management Education and the Use of FlexibleScheduling Program for PT Staff 46
Table 17. Results of Chi-Square Analysis of the Relationship betweenBusiness/Management Education and the Use of Sign-OnBonuses 47
Table 18. Results of Chi-Square Analysis of the Relationship betweenGender and the Use of Contract PT Services 48
Table 19. Results of Chi-Square Analysis of the Relationship betweenGender and the Use of On-Call or Per Diem PTs 49
Table 20. Results of Chi-Square Analysis of the Relationship between Age ofRespondents and the Use of On Call, Per Diem PTs 50
ix

i

Chapter I
Introduction
Statement of the Problem
The demand for physical therapy (PT) services has positioned physical therapy as
one of the fastest growing careers in the US. The increase in the elderly population, the
increase in the survival rate of people with serious injuries, the passage of legislation
requiring the "mainstreaming" of children with disabilities into the public system, and
more, have heightened the demand for PT services and have created new opportunities
within the PT profession (Russell, 1990)
According to the American Hospital Association's (AHA) 1991 Annual Survey of
Human Resources, physical therapists (PTs) ranked first in the top ten occupation vacancy
rates. Physical therapists showed a 17% vacancy rate, occupational therapists (OTs)
ranked 2nd with a 13%, and physician assistant (PAs) 3rd with a 12% vacancy rate (See
Table 1). Physical therapists also ranked first in average time to fill full time positions (90
days or more), while OTs ranked second and PAs ranked third (See Table 2). Physical
therapists ranked second in the most difficult staff to retain (32%) and recruit (55%). Staff
nurses ranked first in the occupation most difficult to recruit (70%) and ranked also first in
the staff most difficult to retain (73%). See Tables 3-4.
1

Table 1
Top 10 Vacancy Rates, by Occupation: A National Display by Occupation of Vacancy
Rates
Full-time Part-time FTE
Physical Therapist 16.6% 7.1% 15.4%
Occupational therapist 14.2% 8.1% 13.5%
Physician assistant 12.8% 6.5% 12.4%
Radiation therapy tech. 12.9% 6.1% 12.4%
Cytotechnologist 12.8% 8.5% 12.2%
Speech pathologist 11.1% 6.9% 10.5%
Occupational therapy assistant 10.3% 7.1% 10.0%
Certified registered nurse anesthetist 9.4% 5.5% 9.0%
Nuclear medicine tech. 8.2% 8.4% 8.2%
Physical therapy assistant 8.2% 6.6% 8.0%
Note. From "AHA's Survey of Human Resources - 1991", A Report by Barbara BloomKreml, Director Department of Human Resources.
2

Table 2
Average Time to Fill Full Time Vacancy: For Each Occupation, a National Display of the
Percentage of Total Responding Hospitals falling in Each Average Recruiting Time
Interval
Under 30 days 31-60days 61-90days 90+ days
Physical therapist 2.5% 13.8% 19.6% 64.1%
Occupational therapist 6.6 25.8 22.0 45.6
Physician assistant 11.8 23.6 21.3 43.3
Radiation therapy tech. 8.8 25.8 27.4 38.0
Cytotechnologist 8.3 29.1 20.8 41.9
Speech pathologist 12.0 34.9 25.7 27.4
Occupational therapist assistant 26.3 35.3 19.9 18.4
Certified registered nurse 5.7 20.1 20.4 53.8anesthetist
Nuclear medicine tech. 8.8 31.1 28.2 31.8
Physical therapy assistant 34.6 30.5 16.7 18.2
Note. From "AHA's Survey of Human Resources - 1991", A Report by Barbara BloomKreml, Director Department of Human Resources.
3

Table 3
Retention Difficulty for Several Selected Personnel Categories: The Percentage of
Hospitals Listings Each Occupation Among the Five Most Difficult to Retain.
Staff nurse 72.6
Physical therapist 31.6
Radiologic technologist 23.5
Medical technologist 23.1
Licensed practical vocational 19.8
nurse
Pharmacist 18.0
Respiratory therapist 17.5
Occupational therapist 14.7
Nursing aide/assistant 14.2
Medical transcriptionist 12.5
Note. From "AHA's Survey of Human Resources - 1991", A Report by Barbara Bloom
Kreml, Director Department of Human Resources.
4

Table 4
Recruitment Difficulty for Several Selected Personnel Categories: The Percentage of
Hospitals Listing Each Occupation Among the Five Most Difficult to Recruit.
Staff nurse (RN) 69.8
Physical therapist 55.3
Pharmacist 34.4
Medical technologist 32.9
Radiologic technologist 29.9
Occupational therapist 28.3
Respiratory therapist 21.3
Certified registered nurse anesthetist 17.9
Nuclear medicine technologist 16.1
Ultrasound technologist 15.3
Note. From "AHA's Survey of Human Resources - 1991", A Report by Barbara Bloom
Kreml, Director Department of Human Resources.
5

The US Department of Labor, Bureau of Labor Statistics Division has categorized
the PT profession as the seventh fastest growing occupation in the United States, with a
projection by the year 2005 of an 88 percent increase in job positions; resulting in 3,800
new jobs per year (US Department of Labor, Bureau of Labor Statistics, Occupational
Employment-Monthly Labor Review, November 1993). Approximately 39,000 new
positions in PT are expected by the year 2,000. In contrast, registered nursing is projected
to grow by 44% (Shanahan, 1993). It has also been projected that by the year 2000,
hospitals will account for 27 percent of practice settings (a decrease of 7.5 percent), while
employment in offices of other PTs, doctors, and dentists will constitute 35 percent of all
jobs (an increase of 14.3 percent), (Shanahan, 1993).
As a result of the disparity between demand and supply, PTs are assured of
acquiring jobs in numerous environments with a minimum of effort, negotiation and delay.
It has been reported that hospitals are seeing a reduction in the employment base
of PTs and high turnover rates have been documented. The shortage of physical therapists
had a greater impact on the hospitals (traditionally the largest employer of PTs) due to the
wide variety of opportunities and increased competition in today's competitive health care
arena (Russell, 1990). Therefore, recruitment and retention of PTs in the hospital setting
is a difficult task to manage.
The recruitment and retention of physical therapists in hospital settings has been
identified by the American Physical Therapy Association (APTA) as a topic requiring
research attention. Results from the 1991 annual survey of human resources (3,184
6

community and non-community hospitals), performed by Barbara Bloom Kreml, Director
Department of Human Resources of the American Hospital Association (AHA, 1991),
showed that the majority of the hospitals reported that worker shortage had remained the
same or increased, despite efforts throughout the hospital arena to address the problem.
According to the same survey, the most severe labor shortage in 1991 occurred among
full-time physical therapy positions, with a 16.6 percent vacancy rate. This was up from
16.4 percent in 1989. About 64% of the respondents also reported that physical therapists
were "the most difficult" to recruit. According to the results from a 1992 survey
performed by the American Physical Therapy Association (APTA), physical therapists are
also pursuing other settings where they can become "specialists", have better salaries and
more flexibility. Common reasons on why PTs leave hospital settings are: lack of
administrative support, low salary and lack of flexible hours (for females). For males the
main reasons are: need to specialize with specific population or within an area of practice,
lack of administrative support and paperwork (APTA, 1992).
Physical therapists can go into business for themselves or be affiliated with a
sports medicine group. In these settings the PT has more autonomy and a greater impact
on patient care (Birritteri, 1993). Therefore, recruitment and retention of PTs in hospitals
need to become priorities for hospital-based PT directors, hospital administrators and
human resources administrators in order to achieve short and long term solutions that will
address staff needs and that will help reduce the impact of the shortage on the public and
the profession.
7

In summary, hospitals are experiencing an increased reduction in the employment
base of physical therapists due to changes in today's competitive health care system and
increased opportunities for physical therapists in other settings (Russell, 1990). One
possible reason for this problem is that the strategies designed to recruit and retain PTs
working in mid-to-large size hospital settings have not been identified and analyzed. It is
important to study these strategies in order to identify their efficacy.
Purposes of the study
The primary purpose of this descriptive study was to describe strategies used
nationwide to recruit and retain PTs working in mid-to-large size general hospitals.
Secondary purposes were to: identify the percentage of respondents reporting problems
with the recruitment and retention of PTs within the last year; identify the demographic
characteristics of respondents; investigate the relationship of the demographic
characteristics of physical therapy department managers to the recruitment and retention
strategies used by those managers; and, describe the respondents' opinions on the most
successful strategies used to aid in recruitment and retention of PTs.
Research Questions
The study was descriptive in nature. Therefore a set of research questions was
8

developed which the study was designed to answer.
The questions were as follows:
1. What are the strategies used to recruit and retain PTs in hospital settings?
2. What percentage of respondents reported having problems with the
recruitment and retention of PTs within the last year?
3. What are the respondents' demographic characteristics, such as, title,
gender, age, educational background, managerial experience, and work environment
characteristics (i.e., such as, type of hospital, hospital location, inpatient capacity, and
quantity of budgeted and vacant PT positions).
4. What is the relationship between the respondents' demographic
characteristics and the recruitment and retention strategies used by the respondent.
5. What do the respondents think are the most successful strategies used to
aid in the recruitment and retention of PTs?
Significance of the Study
Hospital administrators, PT department managers and human resources managers
could improve the effectiveness of their recruitment and retention strategies for PTs
working in hospital settings by adopting strategies used nationwide, especially those
strategies viewed as the most successful ones. Their awareness toward the personnel
problem would increase if they were informed about the percentage of respondents
9

reporting having problems with the recruitment and retention of PTs in hospital settings.
If there was a relationship between the respondents' demographic characteristics and the
effectiveness of their recruitment and retention strategies, hospital administrators could
use this information to increase competitiveness and better serve health care needs.
10

Chapter II
Literature Review
Theoretical and Practical Reasons for the PT Shortage
The demand for physical therapists nationally has been greater than the supply for
many years. This demand has positioned PT as a leading "new" field in today's health
market place (Russell, 1990).
Reasons for the shortage include the increase in the elderly population. As the
elderly population grows, so will the projected need for PTs who rehabilitate patients who
have diagnosis associated with aging process, such as, total joint replacements, strokes,
and cardiac problems. Currently 67% of therapists already report treating patients 64 years
of age and older on a typical day (Shanahan, 1993). Other reasons for the shortage include
the increase in the survival rate of people with serious injuries, due to current medical and
technological advances; the passage of legislation requiring the "mainstreaming" of
children with disabilities into the public school setting; as spouses' incomes or family
responsibilities rise, allied health professionals tend to work less; and the production of an
inadequate number of graduates to meet the demand (Russell, 1990). Graduating classes
of PT schools have been increasing in size by about 300 students every 2 years, but
growth in the number of rehabilitation beds has been faster, and PTs are hired as soon as
they graduate. In addition, a nationwide surge in wellness programs and fitness regimes is
11

sphoring from the medical field (Koska, 1989).
Some of the factors mentioned above have created new opportunities and increase
competition within the physical therapy profession and hospitals are no longer the biggest
employers of PTs (Koska, 1989).
Physical therapists typically do not remain employed in hospital settings for a long
period of time. The average time of employment of physical therapists in hospital settings
is 18 months (APTA Recruitment and Retention of PTs in Hospital-Based Practice, 1989).
Poor retention is due to a lack of upward mobility opportunities, a higher intensity
workload, lack of administrative support, low salaries, lack of flexible hours, paperwork,
and lack of opportunities for clinical specialization (Koska, 1989).
The Cost of PT Vacancies and High Turnover
There are short-term, long-term and opportunity costs generated by vacancies in
staffing (Shanahan, 1993). Costs are very difficult to measure because it is not clear which
factors actually result in costs to the institution and which costs are attributable to each
factor which may be responsible for generating these difficult-to-quantify costs. Some of
these costs are related to the impressions of the facility. Chronically under-staffed facilities
develop a "bad name" within the profession, further discouraging potential new
employees. The cost to the hospital is reflected through increased amounts of time and
12

money devoted to recruiting efforts. Another example of cost could be explained by the
lack of continuity of patient care. The possible compromise in quality of care by contract
or over-worked employees hinders the ability of the hospital to attract new or previous
customers in the long run. Lower quality patient care can also increase the hospital length
of stay, thus increasing the costs to the hospital. Loss of revenue could be generated
through potential forfeited revenue in PT from patient treatments that are not scheduled as
a result of labor shortages. And finally loss of revenue could be created by missed
opportunities for long-range program development due to labor shortage. In a 1989
national survey on recruitment costs of PTs, Gandy estimated an average of $13,191 per
vacant position. This estimate included advertising, interview and orientation costs, and
any scholarship money provided. Of this total, an average of $5,889 was spent per
position on advertising (Shanahan, 1993).
Facilities in the 1989 national survey on recruitment costs of PTs, reported two to
three vacancies per year. Assuming that a hospital had two PT vacancies and employed
one contract therapist, the annual measurable cost to the hospital was $110,782. Lost
revenues, in terms of billable patient hours, due to a single PT vacancy, can equal as much
as $156,000 (assuming 6 billable hours of an 8-hour workday, at a rate of 1,560 billable
hours per year multiplied by an average of $100 per billable hour). Should the hospital opt
to fill a vacancy with a temporary therapist, the estimated cost of hiring a contract
therapist is $45 per hour, or approximately $7,200 per month, or $86,400 per year
(Shanahan, 1993).
13
These high real costs can be controlled if cost-containment plans are developed
that specifically address sources of escalating labor costs, namely the costs associated with
staffing shortages. Hospital administrators need to be aware of the short-and long term
implications of PT vacancies. The lack of attention given to the PT shortage seems to be
driven by the inability of the hospital to quantify the indirect and opportunity costs created
by the labor shortage. Adequate data are not available to quantify the amount of PT a
patient receives as it relates to the costs associated with the length of stay or providing
care for patients at a lower level of function, or to quantify how these costs are impacted
by inadequate levels of PT staffing (Shanahan, 1993).
Methods of Recruitment and Retention Strategies of Other Allied Health
Professions
The nursing shortage caused hospital administrators to address these issues for an
extended period. This shortage plagued the profession during the mid-to-late 1980s. The
nurse vacancy rate, fluctuating between 17-18 percent five years ago, today stands at 5.6
percent, and at some institutions the level is as low as 1.2 percent (Birritteri, 1993).
Recruitment and retention deterrents in the nursing field were researched and
analyzed. Hospital administrators used this information and were able to create successful
recruitment and retention strategies. Example of successful strategies were: flexible
scheduling, promotion system rewarding clinical excellence and productivity (i.e.,
14

obtaining national certification), participative management of staff nurses in the
development of policies and procedures and strategic planning, shared governance,
available day care, competitive salaries and tuition reimbursement, financial assistance for
RNs attending continuing education, financial assistance for LPNs/LVNs seeking to
become RN, financial support for RN in degree seeking programs and financial incentives
for less desirable work shifts (Birritteri, 1993).
Career ladder programs were considered a successful strategy used to retain
experienced nurses. One study demonstrated that nurses on the clinical ladder program
held slightly more positive attitudes about job satisfaction, promotional opportunities and
work rewards and had a lower intent to leave (Corley et al, 1994).
Compensation is another strategy used to recruit and retain nurses. This strategy
recognizes nurse expertise. Several pilot studies have found decreased costs, less use of
sick hours and staff nurse turnover, elimination of external agency costs and improved
documentation quality by increasing salaries (Corley et al, 1994).
Empowerment is a strategy used to retain nurses through encouraging
participatory management and increased autonomy. As a result of this strategy, studies
showed an increase of staff morale and increased accountability and professionalism.
There was also an improvement in the quality of written documentation, and sick time
usage dropped (Khan and Konsones, 1992).
Recognition and reward programs such as "Professional Excellence in Nursing"
(PEN) represent another type of strategy that recognizes and rewards practice excellence
15

of the nurse involved in direct patient care. This program was effective in promoting
behavior of professionalism by encouraging collegiality initiative, creativity, continued
learning and self-direction (Bauer et al, 1993).
The use of technology in the form of automation and telecommunication is
essential to the development of a positive, professional environment that successfully
recruits and retains nurses. Examples of this technology are: bed side, or point of care
terminals; automated skill mixed determination; telecommunication systems and
automated resource scheduling system. Results of two studies on bed terminals revealed
that the use of these terminals affected the professional nursing environment in five ways:
decreased work load, improve quality of care, increased positive public relations,
improved communication and increased positive perception of administration (Adamski,
and Hagen, 1990).
One of the top strategies used to recruit and retain licensed practical/vocational
nurses (LPN/LVN), medical laboratory technicians, pharmacists and staff nurses was the
use of "innovative scheduling", (AHA, 1991).
Results from a study on retaining occupational therapists (OTs) in rehabilitation
settings, showed that there were factors related with job satisfaction that influenced OTs
in their decision to remain employed in rehabilitation settings. Patient care and program
development were seen as rewarding aspects of their jobs and paperwork was seen as the
most stressful aspect of their jobs (Freda, 1991).
16
Methods of Recruitment and Retention Strategies for Physical Therapists
There is little published research on the effectiveness of recruitment and retention
strategies of PTs in hospital settings. A study was conducted by the Michiana
Rehabilitation Institute (MRI) at Memorial Hospital of South Bend, Indiana on the use of
the career ladder. MRI developed a recruitment and retention strategy whose goals were
to improve the quality of patient care, stabilize the current work force, reduce the turnover
rate and fill budgeted positions through the integration of a career ladder concept into the
allied health care recruitment process. This strategy or program was named "Advancement
for Clinical Excellence" (ACE). The program recognized individual professional staff
competency within the context of meeting specific job requirements and providing
monetary incentives for advancement in the program. The program is currently in practice
and its efficacy has not been documented yet, but the program anticipates improved
success in hiring and retaining quality employees (Strakal, and Egli, 1993).
Michiana Rehabilitation Institute - Comprehensive Rehabilitation Services and
Administration (CRSA) section, also developed a set of strategies to aid their staffing
crisis and high turnover rates that exceeded the national average turnover rate. CRSA
ended its staffing crisis by targeting strategies and capitalizing on its strengths. Examples
of these strategies were the identification of department's missions, the creation of a team
philosophy, and the implementation of a participatory management (decision making
power is delegated downward, as close to the problem level as possible). An open door
17

policy was adopted by the management team and there was participation of staff in
program development. Marketing strategies included brochures, open houses and
luncheons for case mangers from referring agencies and offering hour-long seminars on
topics relevant to their interests. MRI-CRSA put in place a reward system, which
included: merit pay system rewarding staff for their exemplary performance in the clinic
and for their contributions to program development and recruitment activities; staff
education programs (recruitment and retention topics are discussed at monthly staff
meetings to bolster MRI - CRSA philosophy); staff recruitment and retention survey;
continuing education; promotion of social activities; expansion of clinical affiliation
programs; and, a student loan program. Results of these strategies showed a decrease in
turnover rates from greater than 20 percent to about 14 percent, and vacancy duration
time also decreased from 3-6 months to 4-6 weeks (Strakal, 1990).
Another strategy used by hospitals to maintain optimal staff levels and effectively
recruit and retain their staff has been the hiring of personnel who are registered with
agencies in the private sector. A study was conducted to examine the degree to which the
shortage of PTs in San Diego had affected local hospitals, to assess current use and cost
of registry personnel and to examine the advantages and disadvantages of temporary
staffing through PT registries. It was concluded that registries can facilitate personal
advances for PTs, but the use of registries to supplement a hospital's permanent PT staff
has proven to be exceedingly expensive, lacks ongoing continuity for the patient, and
produces a somewhat disruptive administrative environment within the hospital.
18
Suggestions from this study were for hospital administrators to plan innovative ways to
recruit and retain personnel through improvements in compensation, creative benefits
packages, flexible working hours, opportunities to participate in management discussions
and other issues related with the working environment (Russell, Seidman, and Williams,
1990).
A unique recruitment and retention strategy for PTs was performed by a group of
hospitals in the Dayton area. Ten hospitals in the Dayton area banded together to bring
PTs to their region. They joined their financial forces and unified their recruitment goals.
This recruitment task force developed aggressive advertising strategies to market their
hospitals, the Greater Dayton area, and the Southwest Ohio area. Because this type of
strategy falls into the category of one-of-a-kind operation, its long term success was
difficult to predict. In terms of immediate success, it was a cost saving move for each of
the participating hospitals (Breske, 1993).
According to the American Hospital Association's (AHA) 1991 annual survey of
1927 urban hospitals, the following strategies were reported as the top three strategies
used in recruitment and retention of PTs in urban hospitals: changes in compensation
programs (641); scholarship/forgivable loan (472); and sign-up bonus (461). The least
used strategies were: career mobility (247); foreign recruitment (177); and restructuring
jobs (108) (Table 5). It appears that the most common strategies used in urban hospitals to
recruit and retain PTs do not coincide with the successful strategies (i.e., autonomy,
flexibility, program development, upward mobility, creativity, job restructuring) used in
19

nursing to alleviate the shortage.
20

Table 5
1991 AHA's Survey of Human Resources - PT Recruitment and Retention Strategies
Strategies: Hospitals Reporting
Changes in compensation programs 641
Scholarship/forgivable loan 472
Sign - up Bonus 461
Contract services 392
Incentive pay benefit 376
Student employment 347
Innovative scheduling 293
On call/pool staff 328
Overtime 264
Temporary staff 257
Career mobility 247
Foreign recruitment 177
Restructuring of jobs 108
Total urban hospitals responding 1927
Note. From "AHA's Survey of Human Resources - 1991", A Report by Barbara Bloom
Kreml, Director Department of Human Resources.
21
Conclusion
In conclusion, hospitals are using recruitment and retention strategies
that may not be necessarily sensitive to staff needs in today's competitive health care
environment. Hospital administrators need to increase their awareness of the adverse
effects of the shortage and the negative consequences to the staff that remains employed in
hospital settings. They could learn from the solutions adopted by the nursing field, since
there is significantly more published research, and extrapolate them to the PT field.
Hospitals must also be aware that the effectiveness of these strategies is determined by
how well the hospital can address the concerns of its therapists (Shanahan, 1993).
22

CHAPTER IH
Methodology
Sample and Subjects
Four hundred surveys were sent to PT department managers employed at general
hospitals with bed capacities of at least 300 beds. The hospitals were selected at random
from the 1995 Hospital Phone Book (US Directory Service, 1995).
Survey Instrument
The survey instrument consisted of self identification questions, forced-choice
questions (true or false and yes or no), Likert scale questions and one open-ended
question (Appendix A).
The cover letter enclosed with the survey contained information on the purpose of
the study, the average time to complete survey, and mailing procedures. A phone number
was included if extra clarification or information was needed. Assurance of anonymity was
confirmed. An offer to mail the survey results to the respondents was included.
The self-identification questions requested information on the manager's
professional title, gender, age, education, and managerial experience. They also requested
information on the type of hospital, inpatient bed capacity and quantity of budgeted and
23

vacant PT positions. The forced "yes or no" question was designed to acknowledge if
there was a problem or not with recruitment and retention of PTs within the last year
(1994). The true or false and Likert scale questions were designed to identify recruitment
and retention strategies of PTs used in hospital settings. The survey concluded with one
open-ended question that requested information on the most successful strategy used to
aid in the recruitment and retention of PTs.
Although no formal reliability or validity testing was performed, a draft of the
survey instrument was reviewed by faculty members of the Physical Therapy and
Management departments at Florida International University and in this way face-validity
of the instrument was achieved.
Procedure for Data Collection
On March 13, 1995, the survey instrument accompanied by a cover letter, along
with a self-addressed, stamped envelope, was mailed to 400 potential respondents. No
deadline date was announced in the cover letter. Instead respondents were asked to return
the survey at their earliest convenience.
Data Analysis
The analysis of the data was initiated after five consecutive days of not receiving
24

more surveys (28 days after mailing). Responses were coded and entered into a
computerized database Quattro Pro, Novell Perfect Office Version 6.01 for Windows
1993, 1994 (Novell Inc., Orem, Utah). SPSS-PC, Statistical Programs for the Social
Sciences, Version 6.2 (SPSS, Inc. Chicago, IL) was used to compute descriptive statistics
for the self-identification items. Cross tabulations were used to examine the relationship
between respondents' demographic characteristics and recruitment and retention
strategies of PTs used in hospital settings. To assess the strength of association of these
relationships, chi-square statistical procedures were done. Responses to the open-ended
question were categorized based on author's judgement. Many of these responses were
similar and were grouped into 46 different categories. These responses were grouped
according to likeness and fitness of content to the appropriate category. The most
prevalent categories, (12 categories with 464 strategies), were analyzed and the less
prevalent categories (34 with 86 strategies), were excluded from the analysis. Therefore,
only 12 categories with 464 strategies were analyzed (550 - 86 = 464).
25
CHAPTER IV
Results
Response Rate
On March 13, 1995, 400 surveys were mailed and on April 14, 1995, a total of
269 surveys were collected. This translates to a response rate of 67.2%. Of the 269, 13
were excluded because they did not meet the criteria for hospital selection.
Demographic Characteristics of Respondents
Females accounted for 69.8% (178) and males for a 30.2% (77) of the
respondents. The age of the respondents ranged between 24 - 72 years old with a mean
age of 40.9 and a mean of 8.5 years of managerial experience. Age and managerial
experience are summarized in Table 6.
26

Table 6
Age and Managerial Experience of the Respondents (in Years)
Mean SD Minimum Maximum Range
Age 40.9 8.6 24.0 72.0 48.0
Managerial Experience 8.5 7.2 0.1 39.0 38.9
27

Responses were obtained from 39 states and districts. The greatest number of
respondents came from hospitals in New York, Florida, Pennsylvania, Illinois, Ohio, New
Jersey, California, Texas, Michigan and Tennessee. (See Table 7).
28

Table 7
Breakdown of Respondents by States and Districts (Cells With Multiple State ListingsShow Each State had the Number of Respondents listed.)
State Percentage of Sample Frequency
New York 8.2 21
Florida 7.0 18
Pennsylvania 6.6 17
Illinois, Ohio 6.3 16
New Jersey 5.9 15
California, Texas 5.5 14
Michigan 5.1 13
Tennessee 4.7 12
Maryland 3.1 8
Indiana, North Carolina 2.7 7
Alabama, Georgia, Massachusetts 2.3 6
Missouri 2.0 5
Iowa, Minnesota, Mississippi 1.6 4South Carolina, WashingtonWisconsin
Arizona, Connecticut, Kansas, 1.2 3Louisiana, Nebraska
District of Columbia, Nevada, 0.8 2Oklahoma, Oregon, Virginia
Colorado, Delaware, Kentucky, 0.4 1Maine, Puerto Rico, West Virginia
Alaska, Arkansas, Hawaii, Idaho 0.0 0Montana, New Hampshire, NewMexico, North Dakota, Rhode Island,South Dakota, Utah, Vermont, Virgin Island, Wyoming
29

Of the respondents, 49% (125), indicated that their professional title was Chief or
Director of Physical Therapy, followed closely by Administrator of Rehabilitation
Services, 36.1% (92). Physical Therapy Supervisor constituted 5.1% (13), Director of
Acute Care Therapy Services 3.9% (10) and Director of Physical and Occupational
Therapy 2.7% (7). (Table 8).
Ninety two percent were physical therapists. Four percent (11) were occupational
therapists; 1.6% (4), were speech pathologists, and 0.8% (2) were administrators. (Table
9).
Of those who were physical therapists, the majority (57.3% or 143) indicated that
their highest level of education was a bachelor's degree. Thirty five percent had master's
degrees, and 7.7% (18) held certificates of completion from a PT program, not academic
degrees.
Most of the respondents did not have formal business or management education
(Table 10). Seventy seven percent (194), had no business/management education. Of the
23.3% (59) that had business or management education, 35.6% (21) had a Master's in
Business Administration; 27.1% (16) had a Master's in Health Sciences, and 5.1% (3)
had a Bachelor's in Business Administration (Table 11).
30

Table 8
Professional Title of Respondent
Percentage Frequencyof sample
Chief/Director of PT 49.0 125
Administrator of Rehab 36.1 92Services
PT supervisor 5.1 13
Director of Acute Care 3.9 10Therapy Services
Director of PT and OT 2.7 7
Clinical Specialist/Education 1.6 4
Other 1.6 4
31
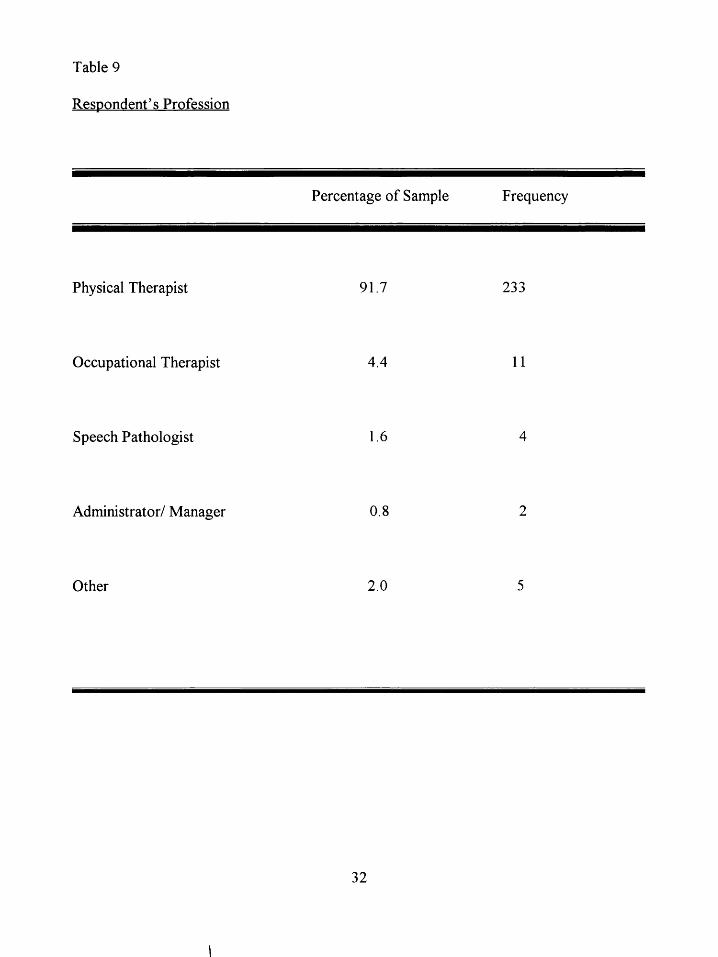
Table 9
Respondent's Profession
Percentage of Sample Frequency
Physical Therapist 91.7 233
Occupational Therapist 4.4 11
Speech Pathologist 1.6 4
Administrator/ Manager 0.8 2
Other 2.0 5
32

Table 10
Business/Management Education of Respondent
Percentage Frequencyof Sample
No Business/Management Education 76.7 194
Business/Management Education 23.3 59
33

Table 11
Business/Management Degrees of Respondents with Business/Management Education
Percentage of Sample Frequency
Master's in Business Administration 35.6 21
Master's in Health Sciences Administration 27.1 16
Bachelor's in Business Administration 5.1 3
Other 32.2 19
34

The number of PT budgeted positions ranged from 2 - 70 with a mean of 16 and a
mode of 10. Of these budgeted positions, the number of PT vacant positions ranged from
0 - 13.6 with a mean of 1.76 PT vacant positions. Most of the respondents, 36.2% (92),
had no PT vacant positions, followed by 20.1% (51) for one position and 17.3% (44) for
two vacant PT positions.
General hospital beds ranged between 300 - 1567 with a mean of 583.15 beds.
Sixty-eight percent (174) of the facilities were private-not for profit hospitals; 4.7% (12)
were investor owned hospitals; 14.1% (36) were state or local government owned
hospitals; 7.8% (20) were Federal, Veterans Administration hospitals; and 5.1% (13)
were other type of hospitals (Table 12) .
35

Table 12
Type of Hospital
Percentage of Sample Frequency
Private, not for profit 68.2 174
State or Local Government owned 14.1 36
Federal, Veteran's Administration 7.8 20
Private, investor owned 4.7 12
Other 5.1 13
36

Recruitment and Retention Strategies for PTs in Hospital Settings
Fifty-nine and two tenths percent (59.2%), or 151, of the respondents indicated
having problems with recruitment and retention of PTs within the last year and 40.8%
(104) responded as having no problems.
In questions 15 through 23, the respondents had to respond true or false to
different statements concerning recruitment and retention strategies. The most commonly
strategies used were: attractive benefit package (234), interdisciplinary team (216) and
competitive salaries (210). The least commonly occurring responses were: sign-on bonus
(110), incentive pay programs (60) and recruitment and retention committee (41)
(Table 13).
37

Table 13
Recruitment and Retention Strategies (Responses to question 15-23)
Percentage Frequencyof Sample
Strategies:
Attractive Benefit Package 92.5 234
Interdisciplinary Teams 85.0 216
Competitive Salaries 82.4 210(adjusted in a yearly basis)
Specialized Clinical 81.2 207Assignments
Flexible Scheduling Programs 68.1 173
Formal Career Ladder Policy 52.0 133
Sign-on Bonuses 43.0 110
Incentive Pay Programs 23.6 60
Recruitment and 16.0 41Retention Committee
38

In questions 24 through 28, respondents had to determine whether they had never,
seldom, occasionally, frequently or always used the recruitment and retention strategies.
The strategy least used or never used was on-call, per diem staff (117), while the strategy
most frequently used was student employment (114), (Table 14).
39

Table 14
Percentage of Respondents that used Recruitment and Retention (Responses to questions
24 - 28)
Never Seldom Occasionally Frequently Always
Percentage
Strategies (Frequency)
We use on-call, per diem 45.7 10.5 18.4 19.9 5.5staff 117 27 47 51 14
We have scholarship and/or 37.6 4.7 11.4 16.5 29.8forgivable loan program 96 12 29 42 76
We use contract PT Services 31.8 21.6 25.5 17.3 3.981 55 65 44 10
We use aggressive recruitment 9.4 22.3 41.4 18.4 8.6advertising 24 57 106 47 22
We hire students that performed .8 6.7 39.0 44.9 8.7their clinical affiliations with us 2 17 99 114 22
40

The last question was an open-ended question. Respondents were asked: "What
has been the most successful strategy you have used to aid in recruitment and retention of
PTs?". Although the question asked for "the" most successful strategy, not strategies,
most of the respondents responded more than one strategy. Therefore, a total of 550
strategies were mentioned. Many of these strategies were similar and were grouped into
46 different categories. These strategies were grouped according to likeness and fitness of
content to the appropriate category. The most prevalent categories, (12 categories with
464 strategies), were analyzed and the less prevalent categories (34 with 86 strategies),
were excluded from the analysis. Therefore, only 12 categories with 464 strategies were
analyzed (550 - 86 = 464). Results from the open-ended question, "What has been the
most successful strategy you have used to aid in recruitment and retention of PTs?",
showed that the following four strategies were felt by the respondents to be the most
successful strategies:
1. "attractive benefit package" - mentioned by 22.2% (103) of the
respondents. (Includes: continuing education, tuition assistance programs, retention
bonuses, sign on bonuses, on-site child care, excellent salary, flexible hours, opportunities
for extra income for example home health, fee for service programs after working hours,
recruitment bonuses, retirement plans.)
2. "good" student program - mentioned by 19.2% (89) of the respondents.
3. professional development opportunities - mentioned by 15.5% (72) of the
respondents. (Includes: opportunities to develop clinical expertise, career ladder,
41

participative management, empowerment and autonomy.)
4. advertising - mentioned by 10.3% (48) of the respondents. (Includes:
advertising in journals, major markets, student listing, job fair, networking, professional
meetings, annual open house for students.)
Formal hiring process occupied the last place with 3.2% (15) of the respondents
considering this strategy as successful. (Includes: interview team, selection of "good" PTs,
excellent support from human resource department, continuous recruitment even if no
positions are open.) See Table 15.
42

Table 15
Categorized Responses to Question # 29: "What has been the most successful strategy
you have used to aid in recruitment and retention of PTs?"
Percentage of sample Frequency
Strategies
Attractive benefit package 22.2 103
"Good" student program 19.2 89
Professional development opportunities 15.5 72
Advertising 10.3 48
Scholarship program 7.7 36
Varied clinical experience 6.5 30
Mentor ship program 4.3 20
Rotations of new graduates 3.9 18
Hospital/Department reputation, 3.7 17Good working environment
Team approach - energetic staff 3.4 16
Formal hiring Process 3.2 15
43
The Relationship between Demographic Characteristics and Recruitment and
Retention Strategies for PTs in Hospital Settings.
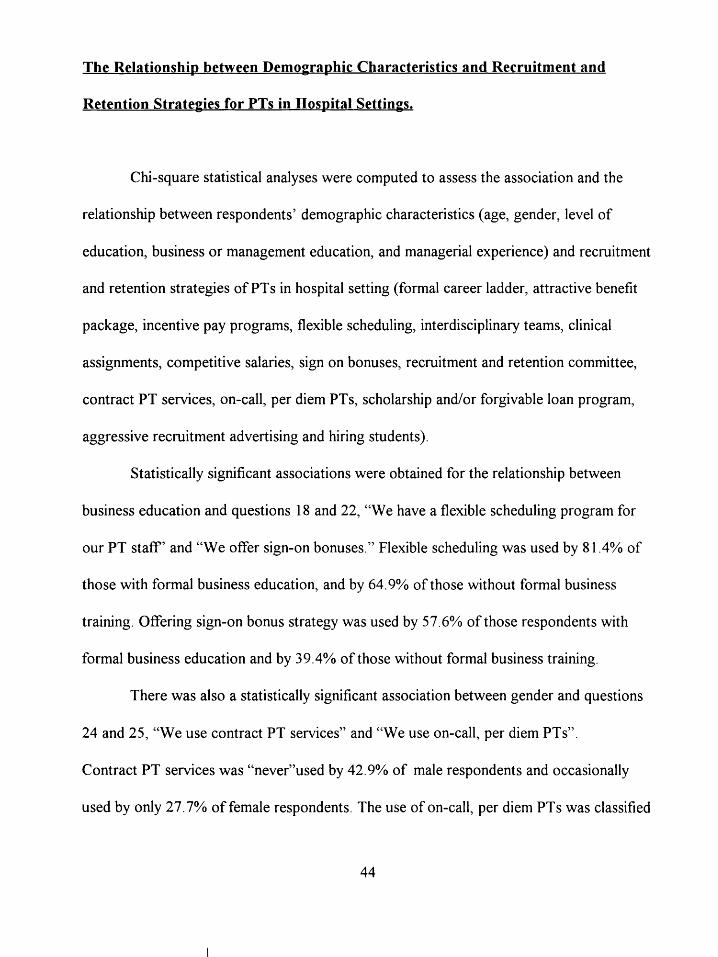
Chi-square statistical analyses were computed to assess the association and the
relationship between respondents' demographic characteristics (age, gender, level of
education, business or management education, and managerial experience) and recruitment
and retention strategies of PTs in hospital setting (formal career ladder, attractive benefit
package, incentive pay programs, flexible scheduling, interdisciplinary teams, clinical
assignments, competitive salaries, sign on bonuses, recruitment and retention committee,
contract PT services, on-call, per diem PTs, scholarship and/or forgivable loan program,
aggressive recruitment advertising and hiring students).
Statistically significant associations were obtained for the relationship between
business education and questions 18 and 22, "We have a flexible scheduling program for
our PT staff' and "We offer sign-on bonuses." Flexible scheduling was used by 81.4% of
those with formal business education, and by 64.9% of those without formal business
training. Offering sign-on bonus strategy was used by 57.6% of those respondents with
formal business education and by 39.4% of those without formal business training.
There was also a statistically significant association between gender and questions
24 and 25, "We use contract PT services" and "We use on-call, per diem PTs".
Contract PT services was "never"used by 42.9% of male respondents and occasionally
used by only 27.7% of female respondents. The use of on-call, per diem PTs was classified
44

as never used by 51.9% male respondents and by 43.3% for female respondents. A
statistically significant association was also observed between age and "We use on-call,
per diem PTs." Respondents between the age of 35-45 responded never using this strategy
(49.6%) and only 2.4% of the same age group responded always using this strategy.
Please refer to the next set of Tables 16 - 20.
45

Table 16
Results of Chi-Square Analysis of Association Between Formal Business/Management
Education and the Use of Flexible Scheduling Program for PT staff (Response to question
1.
"We have a flexible scheduling-program for our PT staff'
True False
Business/Management Education
Yes 48 11
(27.9)* (14.1)
81.4%** 18.6
No 124 67
(72.1) 85.9
64.9 35.1
Chi-square =5.67, df= 1, p = 0.01
* Expected frequencies
* * Percentage of row variable responses in this category
46

Table 17
Results of Chi-Square Analysis of the Association Between Formal Business/Management
Education and the Use of Sign on Bonus, as a Recruitment and Retention Strategy
(Response to question 22).
"We offer sign - on bonuses"
True False
Business/Management Education
Yes 34 25
(30.9)* (17.6)
57.6%** 42.4
No 76 117
(69.1) 82.4
39.4 60.6
Chi-square = 6.11, df= 1, p = 0.01
* Expected frequencies
** Percentage of row variable responses in this category
47

Table 18
Results of Chi-Square Analysis of the Association Between Male and Female Respondents
and the Use of Contract PT Services (Response to question 24).
Never Seldom Occasionally Frequently Always
Gender
Male 33 14 15 10 5
(40.7)* (25.5) (23.4) (22.7) (50.7)
(42.9%)** 18.2% 19.5% 13.0% 6.5%
Female 48 41 49 34 5
(59.3) (74.5) (76.6) (77.3) (50.0)
27.1% 23.2% 27.7% 19.2% 2.8%
Chi-square = 9.25 df= 4 p = 0.05
* Expected frequencies
* * Percentage of row variable responses in this category
48

Table 19
Results of Chi-Square Analysis of the Association Between Male and Female Respondents
and the Use of On-Call, Per Diem PTs (Response to question 25).
Never Seldom Occasionally Frequently Always
Gender
Male 40 12 14 10 1
(34.2)* (44.4) (29.8) (20.0) (7.1)
(51.9)** 15.6% 18.2% 13.0% 1.3%
Female 77 15 33 40 13
(65.8) (55.6) (70.2) (80.0) (92.9)
43.3% 8.4% 18.5% 22.5% 7.3%
Chi-square = 9.5 df= 4 p = 0.05
* Expected frequencies
* * Percentage of row variable responses in this category
49

Table 20
Results of Chi-Square Analysis of the Association Between Age of Respondents and the
Use of On-Call, Per Diem PTs (Response to question 25).
Never Seldom Occasionally Frequently Always
Age category
24-34 19 5 15 10 8
(16.7)* (19.2) (32.6) (20.4) (57.1)
(33.3%)** 8.8% 26.3% 17.5% 14.0%
35 - 45 63 4 22 25 3
(55.3) (53.8) (47.8) (51.0) (21.4)
49.6% 11.0% 17.3% 19.7% 2.4%
46andup 32 7 9 14 3
(28.1) (26.9) (19.6) (28.6) (21.4)
49.2% 10.8% 13.8% 21.5% 4.6%
Chi-square = 15.4 df = 8 p = 0.05
* Expected frequencies
* * Percentage of row variable responses in this category
50

Summary
The results of the survey showed that most of the respondents were female PTs
with professional title, "Chief or Director of Physical Therapy." The average years of
managerial experience was 8.5 and the mean age was 40.9 years old. Of those respondents
that were PTs, the great majority showed no formal business or management education
and the highest level of education was Bachelor of Science in Physical Therapy. The
greatest number of respondents came from hospitals in New York, Florida and
Pennsylvania.
Overall, little association existed between the respondents' demographic
characteristics and recruitment and retention strategies of PTs in hospital settings. The
most common strategies used in recruitment and retention of PT in hospitals settings
were: attractive benefit package, interdisciplinary teams, and competitive salaries. The
least used strategies were: sign-on bonus, incentive pay programs and recruitment and
retention committee. From the results of the Likert scale, the most "frequently" used
strategy was student employment and the most often "never" used strategy was hiring on-
call/per diem staff. Most of the respondents indicated that an attractive benefits package, a
"good" student program and professional development opportunities were the most
successful strategies employed to recruit and retain PTs in hospitals.
Statistically significant associations existed between respondents with business
education and flexible scheduling program and sign-on bonuses; between gender and
51

contract PT services, on-call and per diem PTs; and, between age and on-call and per diem
PTs.
52
Chapter V
Discussion
Introduction
The purpose of the study was to answer the following questions:
1. What were the recruitment and retention strategies used for PTs working in
hospital settings?
2. What was the percentage of respondents reporting problems with
recruitment and retention of PTs within the last year?
3. What were the respondents demographic characteristics, including work
environment?
4. What were the relationships between respondents' demographic
characteristics and recruitment and retention strategies?
5. What were the respondents' opinions on the most successful strategies
used to aid in recruitment and retention of PTs?
53

Recruitment and Retention Strategies for PTs in Hospital Settings
Most of the strategies used by general mid to large size hospitals to recruit and
retain PTs were: attractive benefit package, interdisciplinary team approach, competitive
salaries adjusted in a yearly basis and student employment. Seventy-nine percent (79%) of
the PTs surveyed by the APTA 1992 study on recruitment and retention of PTs in
hospital-based practice, classified "benefits" as one of the factors contributing to job
satisfaction for PTs who remained in hospital settings and pay was ranked number five on
the list of the seven work satisfaction factors.
An excellent source of student employment are clinical education programs.
Hafferty and Goldberg, 1986, found that among students in nonphysician health fields, the
clinical education experience was the single most important predictor of the ability of the
hospital to retain the new graduate as an employee. Clinical programs can serve two
purposes in helping to reduce recruitment and retention costs to hospitals: (1) new
employees may become better matched to the job, and (2) costs to the hospital are lower
because former students are more likely to return to the facility and remained employed
there.
When the respondents were asked to express their opinions on the most successful
strategies used to aid in the recruitment and retention of PTs, they responded - attractive
benefit package, "good" student program and professional development opportunities. We
can see again that attractive benefit package and "good" student program are not only
54

frequent observations but also successful ones as viewed by the respondents of this study.
The strategies "sign on bonus" and scholarship/forgivable loans were considered
common strategies in the results of the 1991 AHA annual survey to human resources, but
in this study they were not considered common strategies. Indeed they occupied the list of
the least used strategies in the recruitment and retention of PTs in hospital settings.
Formal career or clinical ladder has been considered a successful strategy used by
nurses to increase autonomy and job satisfaction, therefore retaining experienced nurses
and improving quality (Corley et al, 1994). In this research 52% of the respondents
responded using this strategy.
Respondents Reporting Problems with Recruitment and Retention of PTs
Approximately 60% of the respondents reported having problems and 40%
responded having no problems with recruitment and retention of PTs in 1994. It was
expected that a greater percentage of respondents would report having problems with
recruitment and retention of PTs in 1994. It is possible that this did not happen due to new
trends in the PT profession, such as the employment of PTs increasing at slower rates,
salaries not rising at the velocity of past years, effects of managed care in hospital staffing
trends, and increased foreign recruitment in specific states for less desirable
settings/locations (Murphy, 1995). There has certainly been an increase in the number of
physical therapists entering the field and also in the number of new graduates working
55

with the geriatric population because of the diversification into more rehab-driven therapy
and higher compensations. While the profession is still growing, some recruiters feel that
the current growth won't be what it used to be. Recruiting might be getting easier because
demand seems to be getting closer to the supply (Murphy, 1995). These new trends merit
new research for further analysis.
Demographic and Work Environment Characteristics
During the process of reviewing the literature, no data was found on demographic
characteristics of PT department managers. This data indicates that females continue to
dominate the field, despite the increase of males into the profession. Consistent with data
from the Bureau of Labor Statistics that about two thirds of PTs are female, this study
found that two thirds of managers were females. The respondents of this study were older
with a mean age of 41 years old, compared to 36.5 for PTs as a whole. The great majority
did not have formal management/business education.
One possible reason why PTs may not have formal business education may be that
PTs have increased opportunities in the health care field with increased salaries,
opportunities and job security within the profession due to the increase demand.
Therefore, they may not see the need to enter into another highly competitive field such as
business/management. Also since the majority of the respondents were females, they might
also have family responsibilities making it even more difficult to reenter the academic
56
arena.
Most of the respondents worked in private, not for profit, hospitals. The mean
inpatient bed capacity was of 583 beds. The mean of budgeted PT positions was 16, and
10 was the most frequent occurrence. The mean of vacant PT positions was 1.76, and
zero was the mode.
The Relationship between Respondents Demographics Characteristics and
Strategies used in Recruitment and Retention for PTs employed in hospital settings
Statistically significant correlation coefficients were obtained for the association
between respondents with formal business education and the following strategies: "flexible
scheduling program for PT staff' and "sign-on bonus." Managers formally educated in the
business/management field are trained in managing personnel. Therefore strategies, such
as, "flexibility" and "sign on bonus" might have been analyzed as "key" strategies to
recruit and retain PTs. This is consistent with findings from a study of 429 nurses in
Hawaii, where "flexibility" is on the list of the top three priorities in the process of
recruiting and retaining nurses (Corley et al., 1994).
There is a significant relationship between gender and the following strategies:
contract PT services and on-call, per diem PTs. Male PT department mangers tend not to
use temporary staffing. Forty-three percent (43%) of male PT department managers
responded never using temporary staff versus 27% of female managers responding "never"
57

using temporary staff (on-call, per diem, contract). Is it possible that males might be less
aware or sensitive to the possible complaints of overworked staff and burnout signs,
therefore not requesting the use of temporary staff to alleviate possible staffing crisis? Or
is it possible that men are more effective than female managers in recruiting and retaining
staff, therefore not requiring temporary staff?
There is also a significant relationship between age and "on-call, per diem PTs."
It appears that more experienced PT department managers do not have the need to use
temporary staff to alleviate the PT shortage. The reason behind this may be that through
experience these mangers have learned to create innovative strategies suitable to their staff
needs. Therefore their work force is stable, and there is no need for temporary staffing.
Improving Recruitment and Retention of PTs in Hospital Settings
Hospitals are using recruitment and retention strategies that may not be necessarily
sensitive to staff needs in today's competitive health care environment. Hospital
administrators could learn from the solutions adopted by the nursing field, since there is
significantly more published research, and extrapolate them to the PT field. Hospital
administrators must also be aware that the effectiveness of these strategies is also
determined by how well the hospital can address the concerns of its therapists (Shanahan,
1993).
The nursing profession's initial recruitment and retention efforts was through the
58

creation of a task force and a literature-based retention survey (Ames et al, 1992). After
analyzing results of the retention survey, this nursing services task force was able to
identify dissatisfying issues among their work environment and consequently this task
force was able to tailor strategies sensitive to staff needs.
As mentioned earlier, there is limited amount of research on the effectiveness of
recruitment and retention strategies for PTs in hospital settings, therefore suggestions to
improve recruitment and retention of PTs, will tend to be based on the effectiveness of
studies previously performed in the nursing field with a logical adaptation into the PT
profession.
Other suggestions may be based on the results of this study on the respondents'
opinion of the most successful strategies:
1. attractive benefit package,
2. student program,
3. professional development opportunities (i.e., career ladder, participative
management, clinical expertise, empowerment, flexibility and autonomy).
Limitations of the Study
Limitations of this study are that it did not look at the opinions of the PT staff on
issues related with recruitment and retention, and it ignored turnover rates, future staffing
trends and issues related with managed care.
59

Another limitation was that many available recruitment and retention strategies
were not added to the survey. Also, it is possible that there was confusion by not defining
strategies in more detail. It is also possible that it would have been better to select and
define ways of measuring the use of strategies by requesting the advice of a human
resource specialist in the health care field.
Suggestions for Future Research
The results of this study suggest numerous relevant topics for additional research.
Examples are: analysis of PT staffing trends in hospitals settings and comparison of
results of this study with new research on future PT recruitment and retention trends in the
new health care environment of managed care. Future research could survey the staff
PTs on what attracts them to work in hospital settings. Another topic of investigation is
on future trends in student programs; their organization, cost and effectiveness. Results
from this study indicated that student employment was viewed as a successful strategy.
Therefore it is crucial to know what will be the essential components of a "good" student
program, and how to organize and manage it in order to be successful in student
employment. It is also important to gather information on cost of program and feasibility
of implementing it. One of the most important strategies used to successfully recruit and
retain PTs was "attractive benefit package." It would be very interesting if we could
research what constitutes an attractive benefit package for physical therapists employed in
60

hospital settings. Other suggestions for future research are: a study on rehabilitation
administrators and rehabilitation services; including demographic characteristics of
administrators and work environment, goals for rehabilitation services and opinions on the
impact of managed care on rehabilitation personnel. It would be interesting to learn their
opinions on personnel management, more specifically rehabilitation personnel, as well as
future goals and the impact of managed care on rehabilitation staffing and the impact on
quality care; and the analysis of the expectations of experienced PTs working in hospital
settings in relationship with professional development opportunities. A common reason for
PTs leaving hospital is lack of professional opportunities. A study on this topic would
enlighten hospital administrators, PT department managers and human resources
administrators on what experienced PTs are looking for in the hospital setting.
Conclusion
The majority of the respondents to this descriptive research reported having
problems with the recruitment and retention of PTs in hospital settings.
Attractive benefit package, interdisciplinary teams, competitive salaries adjusted in
a yearly basis and student employment are common strategies used nationwide to recruit
and retain PTs in general mid-to-large size hospitals. Sign-on-bonus, incentive pay
programs recruitment and retention committee and temporary staffing are not common
strategies.
61

Attractive benefit package, "good" student program and professional development
opportunities were in the respondents' opinions, the most successful strategies used to aid
in the recruitment and retention of PTs in hospital settings in 1994.
The results of the survey showed that most of the respondents were female PTs
with professional title, "Chief' or "Director" of Physical Therapy. The average years of
managerial experience was 8.5 and the mean age was 40.9 years. Of those respondents
that were PTs, the great majority showed no formal business or management education
and their highest level of education was Bachelor of Science in Physical Therapy.
Respondents formally educated in the business/management field used strategies
such as flexibility and sign on bonus, as "key" strategies to recruit and retain PTs. The
oldest group of respondents (35-45 years old) and male respondents tended not to use
temporary staffing.
Hospital administrators need to increase their awareness toward the adverse effects
of the shortage and its negative consequences among the staff that remains employed in
hospital settings. They should learn from the solutions adopted by the nursing field, since
there is significantly more published research, and extrapolate them and adapt them
according to the staff needs. Hospitals administrators, human resource managers and PT
or rehabilitation administrators must also research their staffing trends and evaluate
strategies currently used to recruit and retain PTs and also evaluate its efficacy in order to
become successful in developing a stable working environment with a more positive
impact on patient care.
62

List of References:
Adamski, M. & Hagen, B. (1990). Using technology to create a professional environment
for recruitment and retention. Nursing Administration Quarterly, .14(4) 32-37.
AHA (American Hospital Association) (1991). Annual Survey of Human Resources.
Chicago, IL.
Ames et al. (1992). Assessing Work Retention Issues. Journal of Nursing Administration,
22(4), 37-41.
APTA (American Physical Therapy Association) (1992). Recruitment and Retention of
Physical Therapists in Hospital-Based Practice. Alexandria, VA.
Bauer, M., Cherry, R.J., Clutter, P., Nelson, B. & Sandwell, A. (1993). Retention Can be
Improved. Nursing Management, 24(10), 39-46.
Birritteri, A. (1993). Hospital Shortage in Remission. The New Jersey Business Magazine,
39(8), 22-24, 48-49.
63
Breske, S. (1993). Joining Forces 10 Hospitals Join Forces to Bring PTs to Dayton.
Advance for Physical Therapists.
Corley, M.C., Farley, B., Geddes, N., Goodloe, L. & Green, P. (1994). The Clinical
Ladder Impact on Nurse Satisfaction and Turnover. Journal of Nursing
Administration, 24(2), 42-48.
Haferty, F.W. & Goldberg, H.I. (1986). Educational Strategies for Targeted Retention of
Nonphysician Health Care Providers. Health Services Research, 21 (1), 107-125.
Freda, M. (1991). Retaining Occupational Therapists in Rehabilitation Settings:
Influential Factors. The American Journal of Occupational Therapy, 46(3), 240-
248.
Khan, K. & Konsones, D. (1992). Empowerment: charting for retention. Nursing
Management, 23(8), 64-84.
Koska, M.T. (1989). Rehabilitation Growth Fuels PT Shortages. Hospitals,
63(5), 32.
64

Murphy, J. (1995). Watching Recruitment Trends in PT Corporations. Advance for
Physical Therapists, 6(20), 6 & 20.
Norusis, M.J. (1992). SPSS-PC+ [Computer Program]. Chicago, IL:SPSS, Inc.
Novell Perfect Office (1993, 1994). Quattro Pro [Computer Program]. Novell Inc.,
Orem, Utah.
Russell, T. (1990). The PT Personnel Shortage. Clinical Management, 10(2), 15.
Russell, T. , Seidman, R. & Williams, S. (1990). The PT Personnel Shortage. Clinical
Management, 10(2), 18-23.
Shanahan, M.M. (1993). A comparative analysis of recruitment and retention of health
care professionals. Health Care Management, 18(3), 41-51.
Strakal, G. (1990). Tailoring an Incentive Program. Clinical Management, 10(2)16-17.
Strakal, G. & Egli, H.J. (1993). Career Ladder For Allied Health Professionals. Physical
Therapy Forum, 4, 4-9.
65

U.S. Department of Labor (1993). Fastest Growing Occupations. Bureau of Labor
Statistics, Occupational Employment, Monthly Labor Review.
U.S. Directory Service (1995). The Hospital Phone Book.
66

Appendix A: Copy of Cover Letter and Survey Instrument
67

Date: 3/15/95
From: Laura Burgos, PTGraduate StudentDepartment of Physical TherapyFlorida International UniversityUniversity Park CampusMiami, Florida 33199
To: Physical Therapy Director / Manager
Dear Colleague,
I am a Master's degree candidate in Physical Therapy here at Florida InternationalUniversity, and I am also on the staff of a large general hospital. I have become interestedin the problem of recruitment and retention of physical therapists in general hospitalsettings, and I am in the process of completing a thesis about this topic.
In order to complete my thesis, I need to learn about the recruitment and retentionstrategies currently in use across the country.
Would you be so kind as to take a few minutes of your time to complete the attachedsurvey? It should take less than 5 minutes.
Your responses will be completely anonymous. You will find no identifying codes on thisletter, the survey, or the return envelope. If you would like a copy of the results of thesurvey, or if you have any questions, please feel free to call me at 305/674-2844 between 9and 4:30 EST, or write to me at the address at the bottom of this page.
This survey is being sent to a relatively small group of physical therapists, so every responseis important to the success of my project. I thank you in advance for your time andconsideration.
Laura Burgos, PT
68

SURVEY FOR PHYSICAL THERAPY DIRECTORS or MANAGERS
1. What is your professional title?
2. What is your gender? ___Male ___Female
3. How old are you? ___Years
4. Which word best describes your hospital?
Private, not for profit
Private, investor ownedState or local government owned
_Federal, Veterans Administration
_Other
5. What is your inpatient capacity? __Beds
6. Which state are you located in?
7. Are you a Physical Therapist? _ Yes ___ No
8. If you are a Physical Therapist, what is your level of education?Certificate
_ Bachelors Degree
____ Masters Degree
Doctoral DegreeOther, please specify:
9. If you are not a Physical Therapist, what is your professional field?
10. Do you have a degree in business or management? Yes __No
If so, what is your degree? __BBA __MBA __MHS __Other
11. How many years have you been directing / managing a PT department?__ Years
12. How many budgeted physical therapist positions do you currently have in yourdepartment?
13. How many of these budgeted positions are currently vacant? __
14. Have you had a problem with the recruitment and retention of physical therapistswithin the last year? __Yes _No
69
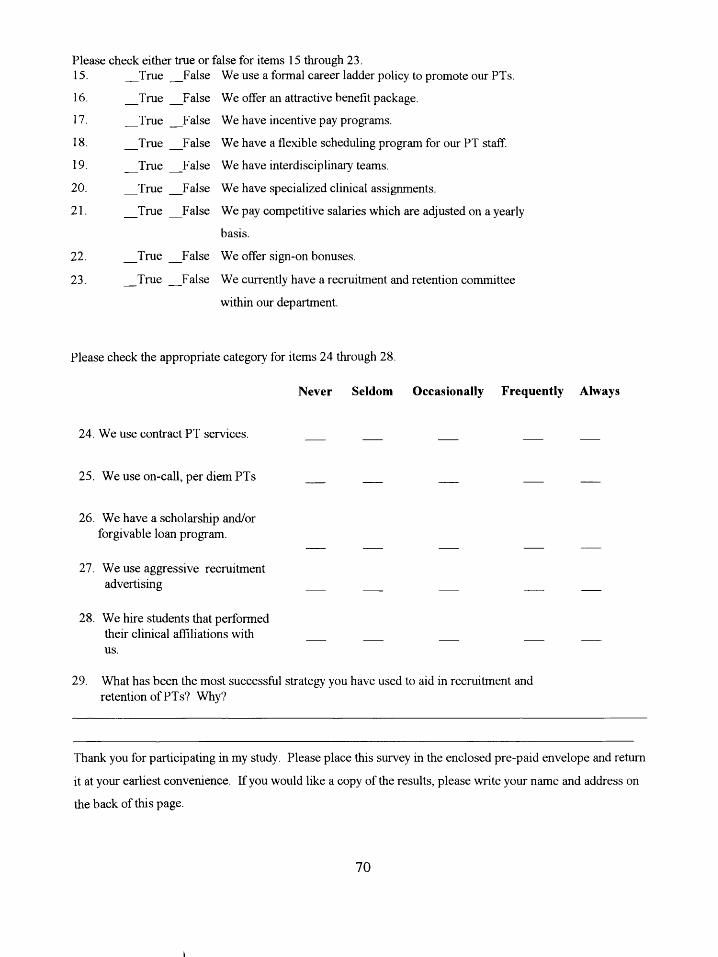
Please check either true or false for items 15 through 23.
15. __True __False We use a formal career ladder policy to promote our PTs.
16. __True __False We offer an attractive benefit package.
17. -True __False We have incentive pay programs.
18. -True __False We have a flexible scheduling program for our PT staff.
19. __True __False We have interdisciplinary teams.
20. _True _False We have specialized clinical assignments.
21. __True __False We pay competitive salaries which are adjusted on a yearly
basis.
22. __True _False We offer sign-on bonuses.
23. __True __False We currently have a recruitment and retention committee
within our department.
Please check the appropriate category for items 24 through 28.
Never Seldom Occasionally Frequently Always
24. We use contract PT services. __
25. We use on-call, per diem PTs __ ___
26. We have a scholarship and/orforgivable loan program.
27. We use aggressive recruitmentadvertising
28. We hire students that performedtheir clinical affiliations withus.
29. What has been the most successful strategy you have used to aid in recruitment andretention of PTs? Why?
Thank you for participating in my study. Please place this survey in the enclosed pre-paid envelope and return
it at your earliest convenience. If you would like a copy of the results, please write your name and address on
the back of this page.
70