
Physical simulation of Heat affected zone in grade 92 …sojom2018.com/abstract/dume Physical...
21
Physical simulation of Heat affected zone in grade 92 steel using Gleeble R.Ravibharath*, S VinothKumar**, and R Vetriselvan* *- Welding research Institute, BHEL, Trichy **- School of Physics and Materials Science, Thapar University, Patiala-147004 ABSTRACT Often, it is observed that, the steel structural welded components undergone premature failure due to cold cracking. In general, most of the failure observed in the region of heat affected zone of the weldment. The major reason of HAZ failure is diffusible hydrogen content in the weldment, stress induced on the weldment during welding and higher hardness due to un- tempered Martensitic / bainetic transformation in heat affected zone. Details understanding of heat affected zone enable to incur the solution for HAZ cracking issues. Different kinds of testing and characterisation are not possible with HAZ due to its size and shape limitation. Hence, physical simulation of the heat affected zone could aids develops metallurgically similar and wider HAZ for study. Worldwide various methodologies are adopted for physical simulation. In this present work, an attempt to develop a module for physical simulation using Gleeble with assistance of SYSWELD software. For this work, Creep strength enhanced ferritic steels (CSEFS) grade 92 (9Cr-1.8W-0.5Mo) used in coal based fissile power plant is identified, because of, it experiencing Type-IV cracking mechanisms at HAZ, in service life condition. Welding thermal cycles had been simulated with Finite Element Simulation using SYSWELD and with these thermal cycles, physically HAZs had been simulated on a sample and studied for its microstructure, hardness and toughness in-situ comparison with real time HAZ properties on welded coupon. The experimental results shows that the physically simulated samples properties has 20 % variation compares with real weld coupon’s HAZ properties. Keywords: Gleeble, Sysweld, HAZ simulation and grade 92
Transcript of Physical simulation of Heat affected zone in grade 92 …sojom2018.com/abstract/dume Physical...

Physical simulation of Heat affected zone in grade 92 steel using Gleeble
R.Ravibharath*, S VinothKumar**, and R Vetriselvan* *- Welding research Institute, BHEL, Trichy **- School of Physics and Materials Science, Thapar University, Patiala-147004
ABSTRACT
Often, it is observed that, the steel structural welded components undergone premature failure due to cold cracking. In general, most of the failure observed in the region of heat affected zone of the weldment. The major reason of HAZ failure is diffusible hydrogen content in the weldment, stress induced on the weldment during welding and higher hardness due to un-tempered Martensitic / bainetic transformation in heat affected zone. Details understanding of heat affected zone enable to incur the solution for HAZ cracking issues. Different kinds of testing and characterisation are not possible with HAZ due to its size and shape limitation. Hence, physical simulation of the heat affected zone could aids develops metallurgically similar and wider HAZ for study. Worldwide various methodologies are adopted for physical simulation. In this present work, an attempt to develop a module for physical simulation using Gleeble with assistance of SYSWELD software. For this work, Creep strength enhanced ferritic steels (CSEFS) grade 92 (9Cr-1.8W-0.5Mo) used in coal based fissile power plant is identified, because of, it experiencing Type-IV cracking mechanisms at HAZ, in service life condition. Welding thermal cycles had been simulated with Finite Element Simulation using SYSWELD and with these thermal cycles, physically HAZs had been simulated on a sample and studied for its microstructure, hardness and toughness in-situ comparison with real time HAZ properties on welded coupon. The experimental results shows that the physically simulated samples properties has 20 % variation compares with real weld coupon’s HAZ properties.
Keywords: Gleeble, Sysweld, HAZ simulation and grade 92
INTRODUCTION
Weld heat affected zone is one of the critical weldment portion to understand its nature as result of variation in time related temperature and stress. It results properties of HAZ various over all the directions. Hence, different methodologies were developed to study the heat affected zone behaviour by researchers. Physical simulation is one among these to create a real time HAZ sample with help of thermal simulators. A bigger challenge in physical simulation is to provide accurate definition of various parameters influencing the real weld heat affected zone. For example, time depended temperature measurement is one the major tasks at the selected location. Measurement of temperature at localized spot requires very fine thermo couples in order of less than one millimetre and high speed data logger with response time in the range of milliseconds. Accurate placing of thermocouple at various location also a highly skilled job. Other than, practical data capturing methods, theoretical heat transfer calculations also used for this heating and cooling rate of and weld bead at different locations heat affected zone. Hannerz Module, Rykalin 2D and 3D Modules, Rosenthal Module, etc are example for theoretical heat transfer calculations methods. These modules are derived based

on certain equations with assumptions on heat transfer. These equations must be chosen correctly according to its assumptions to generate a thermal cycle.
With sysweld, it’s possible to simulate laser heat treatment, electric beam, induction heat treatment, standard welding, yielding and thermochemical heat treatment like nitriding or carbo-nitriding, etc. Software Sysweld is simple and user friendly. A dynamic volumetric heat source has been considered for modeling of welding arc, based on the double ellipsoidal proportion proposed by Goldak et al. [18] proposed a heat source model as in figure 1.6 was used, where x, y and z are the local coordinates of the double ellipsoid model aligned with the weld line (figure 1). During modelling the fraction of heat deposited on the rear and front of the welding arc should be measured, it should be observed that much steeper temperature gradient at the front of the arc than that of the rare. Losses of Heat due to thermal radiation and heat transfer on the weld surface have been considered. Losses by radiation are more at elevated temperatures near and in the weld zone, and loss by convection for lower temperatures away from the weld zone.
Figure 1 Double ellipsoidal heat source [19]Creep strength enhanced ferritic steels (CSEFS) grade 92 (9Cr-1.8W-0.5Mo) used in coal based fissile power plant is identified, because of, it experiencing Type-IV cracking mechanisms at HAZ, in service life condition [1-6]. Hence, Grade 92 steel has consisted for this present work.
Experimentation
Insite welding of T92 tubes For the in-situ weld data collection, T92 tube with outer diameter of 45 mm and thickness of 10 mm is used in this study. T92 tube subjected to the edge prepared of 37.5° angle for joining with Gas Metal Arc Welding process using similar composition filler metal ER 90S-(G) Brand Thermanit MTS 616 of diameter (Ø) 0.8 mm. Welding parameters utilised for this trial is provided in the table 1.
Table 1: GTAW Weld Parameters for T92 base metalVariables Values
Current 110/100 Amp Voltage 9-12.5 V Polarity DCEN Wire Feed Rate (WFR) 2220 mm/min

Oscillation for 2 and 3 beads 3.5 mmGas Flow Rate (Shielding/Purging) 16 / 6 LPM Travelling Speed 1.50 mm/sec. Preheat/Interpass Temperature °C 200 °C Heat Input 1st/2nd pass 819/841 J/mm
Weldment is subjected to radiographic testing and confirmed that 100% Radiograph sample based on ASME section IX. The Weldment sample was cut into exactly two halves exactly perpendicular to the weld and post weld heat treatment for 2 hour at 760°C was performed on one of these samples. Samples for metallography analysis and mechanical properties evaluation were extracted from both the as-welded and PWHT weldments.
Metallographic specimens was manual grinded using 80, 120, 150, 220, 320, 400, 600 & 800 grit silicon carbide papers and alumina polishing in succession. Toughly cleaned samples subjected etched using either viellal’s reagent and macroscopic and microscopic analysis conducted as per the standard ASTM E407. Vickers’s hardness measurements as per ASTM E384-05 using AFFRI (model WIKI 200JS) with a load of 300grams and 10 second dwell time. The hardness survey has performed to cover various location of weld metal, heat affected zone and base metal.
HAZ Simulation Finite Element Method based Sysweld software has been used to derive weld model of tube with the help of the real welding parameters as per table 1, position of the weld as per macro scope measured shown in figure 2a and temperature dependent physical & mechanical properties of grade 92 steel as shown in table 2 [25]. Thermal cycles of eleven number of different heat affected zone points as given the figure 2b are extracted from this weld model. These heat affected zone point data were taken as input for Gleeble 3500 thermo mechanical simulator to generate physical model of the heat affect zone on 10 mm grade 92 samples to compare.
Table 2 Temperature dependent physical & mechanical properties of P92.
Temperature
(°C)
Elastic Modulus
(GPa)
Yeild Strengt
h (MPa)
Thermal Conductivity
(10-1J/s/mm/°C)
Density(10-2 g/mm)
Specific Heat
(J/g/°C)
Thermal Expansion Coefficien
t (10-7/°C)
20 212.331 454.306 0.276 0.786 0.423 158.283100 196.221 423.379 0.283 0.781 0.43 162.416200 191.208 413.424 0.286 0.781 0.462 168.254300 178.779 399.769 0.29 0.776 0.483 173.84400 162.655 381.173 0.293 0.774 0.513 177.251500 147.762 331.718 0.297 0.774 0.586 180.514600 139.042 248.922 0.3 0.76 0.604 182.125700 117.977 182.212 0.323 0.762 0.637 181.711800 106.788 122.915 0.344 0.751 0.653 182.371900 94.2904 103.082 0.281 0.725 0.683 187.7911000 45.9898 39.9694 0.274 0.713 0.702 199.68

1200 16.2019 29.9404 0.281 0.704 0.723 205.2061300 212.331 13.3142 0.286 0.7 0.73 212.3361400 196.221 5.09073 0.295 0.674 0.739 219.3881500 - - - 0.616 0.741 -
Figure 2: Gleeble® 3800 thermo mechanical simulator and simulating sample.
Results and Discussion
Weldment Macrostructure
Figure 3 Transverse View of Welded Specimen Macrostructure at same place.
Macrograph of as welded shown in Figure 3 conforming that weldment has defect free beads
with complete penetration and fusion all along the welding layers and passes. The height and
width of each pass of weld metal deposit measured as shown in figure 3. These values are
taken input for generation of simulated weld model in SYSWELD software. Further, Heat
Affected Zone (HAZ) width at face and root were measured for comparing output of
SYSWELD generated heat affected zone.

SYSWELD Simulation Analysis SYSWELD software designed based on simulation of the welding process with double
ellipsoid heat source model given input of welding parameters, materials properties such as
thermal conductivity, density, specific heat, thermal expansion coefficient, elastic modulus,
yield strength and poisson’s ratio and the weld metal profiles as per experimentation result in
figure 3. The resultant weld model is shown in figure 4.a. It is compare with the experimental
weld heat affected zone width at face and root side as per figure 4.b and c. The colour coding
in figure 3a represents the respective temperature field and thermal gradient of the material
from melting point to room temperature. Comparison purpose weld model heat affected zone
has been assumed that end of the HAZ could be the point located with peak temperature
700°C, where there is no change in microstructure and hardness as comparing base metal.
The simulated weld and HAZ where in well accordance with the real weld and HAZ which
had been compared numerically from macrostructure of the HAZ and simulated HAZ of the
SYSWELD in table 3 and also depth and width of weld pool as shown in figure 4.
Table 3 Comparison of Real and SYSWELD simulated HAZs. Details of HAZ Width (mm)
As welded As SimulatedTop 2.57 2.87
Bottom 4.32 4.26

Figure 4 SYSWELD simulation of weld thermal cycle.
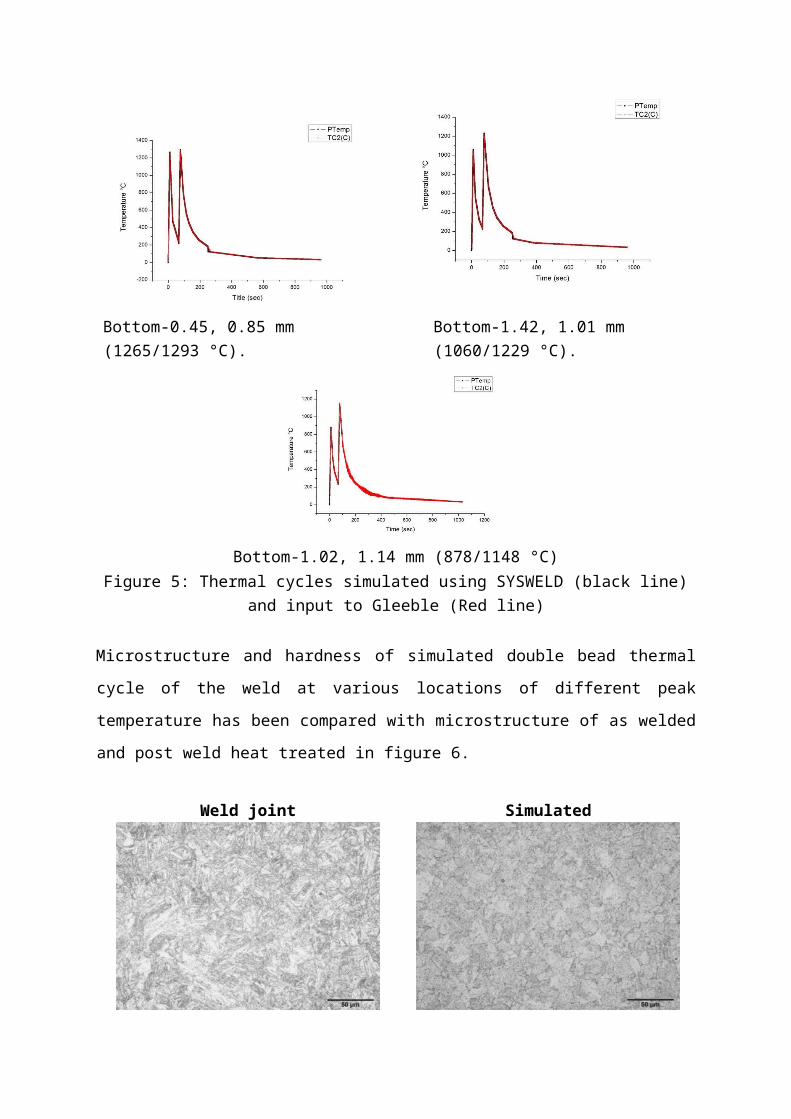
Identified peak temperature points in heat affected zone for physical simulation is indicated in
figure 4b as in top of the weld on line A to B, in Middle of the weld on line C to D and in
.mm )1.14 ,1.01) (1.02 ,0.85) (1.42 ,(0.45 - Yfrom from bottom (Y), mm 0.64 – F E .mm , 2.4mm 1 ,mm 0.88 -from X mm 0.47 –D C
.mm , 0.89mm , 0.812mm , 0.652mm 1.067 -from X , )from top (X mm 0.67 –B A

bottom of the weld on line E to F, totally 11 number of points were identified. The points
mentioned above are selected for weld thermal cycle’s simulation from sysweld which covers
over a wide range of temperatures from 1330 to 500 °C. The simulated welding thermal cycle
curves were extracted from the established double ellipsoid welding heat source model of
SYSWELD. The output data’s of SYSWELD’s weld thermal cycles were used as input for
physical simulator-Gleeble through QUICKSIM software program. Extracted thermal cycle
of the 11 points as PTemp and Gleeble QUICKSIM generated thermal cycle TC2 are
overleaped one above anther during Gleeble simulation is shown in figure 5. Further, thermal
cycle graphs are conforming that inter-pass temperature has been maintained at 200 °C.
1. Top-1.067 mm (690/1204 °C). 2. Top-0.652 mm (652/1089 °C).
3. Top-0.812 mm (612/970 °C). 4. Top-0.89 mm (567/872 °C).

5. Middle-0.88 mm (957/1330 °C). 6. Middle-1 mm (718/1122 °C).
Middle-2.4 mm (662/1013 °C). Bottom-0.64 mm along fusion line (1362/1310 °C).
Bottom-0.45, 0.85 mm (1265/1293 °C). Bottom-1.42, 1.01 mm (1060/1229 °C).
Bottom-1.02, 1.14 mm (878/1148 °C)

Figure 5: Thermal cycles simulated using SYSWELD (black line) and input to Gleeble (Red line)
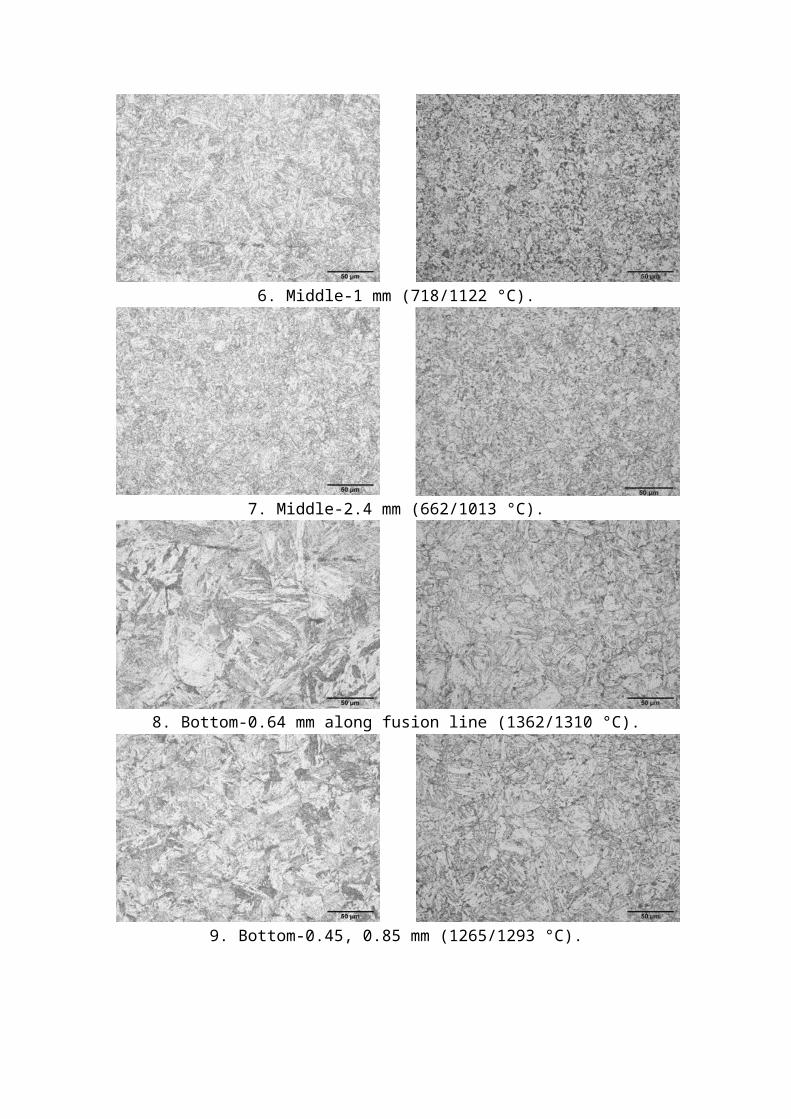
Microstructure and hardness of simulated double bead thermal cycle of the weld at various
locations of different peak temperature has been compared with microstructure of as welded
and post weld heat treated in figure 6.
Weld joint Simulated
1.Top-1.067 mm (690/1204 °C)
2.Top-0.652 mm (652/1089 °C)
3. Top-0.812 mm (612/970 °C).

4. Top-0.89 mm (567/872 °C).
5. Middle-0.88 mm (957/1330 °C).
6. Middle-1 mm (718/1122 °C).
7. Middle-2.4 mm (662/1013 °C).
8. Bottom-0.64 mm along fusion line (1362/1310 °C).
9. Bottom-0.45, 0.85 mm (1265/1293 °C).
10. Bottom-1.42, 1.01 mm (1060/1229 °C).
11. Bottom-1.02, 1.14 mm (878/1148 °C).Figure 6: Micro structures of the selected points of real weld and Gleeble simulation
Table 4 Peak temperatures and hardness comparison chart.

Peak Temperature °C Without PWHT
(HV0.3/10)
PWHT
(HV0.3/10) Welded Simulated Welded Simulated
1 - 690/1204 463 374 350 499 2 - 652/1089 416 493 293 440 3 - 612/970 409 427 273 320 4 - 567/872 320 370 267 290 5 - 957/1330 466 532 311 357 6 - 718/1122 463 528 302 330 7 - 662/1013 443 515 289 335
8 - 1362/1310 433 514 327 381 9 - 1265/1293 483 506 302 337 10 - 1060/1229 459 430 288 370 11 - 878/1148 466 523 261 435
HAZ Micro-Hardness correlation
Figure 7 Hardness comparisons for simulated and real time HAZs.
Figure 7 shows the variation of hardness in the real time and simulated heat affected zone
(HAZ) which has been discussed with microstructure below. Field represents region 1-11.
Note: Regions mentioned with scale with as preceding point as starting point in mm
Physically simulated HAZ and Real time HAZ had been compared with their microstructures
and Hardness values. The comparative results in the table 3.3 and figure 3.8 and 3.9, shows
that there has been a variation in Vickers micro-hardness values which range from 10 to 15%.
The microstructural comparison of the as welded and simulated and also with heat treated at
760 °C for 30 mins has shown that considerable significant correlation between
microstructures at large variation in hardness.
The microstructure of coarse grain HAZ (CGHAZ) as-simulated for the temperature range
1122-1293 °C simulated show irregular shaped prior austenite grains, sizes of few microns as
shown in region-1, 6, 9 & 10 where as in the real time HAZ it has untempered martensite
with prior austenitic grain boundaries. This difference made there has been considerable
variation in the hardness of ~20%, even in region-6 it shows more retained austenite and thin
delta ferrite in the as welded condition but not in simulated at the fastest cooling rate.
When the carbon content is 0.07-0.13%, the BM has dual phase microstructures with
tempered martensite and thin strips of delta (δ) ferrite or α ferrite while in the areas of HAZs,
the microstructural evolution is complex to justify which is governed by chemical
compositions and cooling rates. The maximum cooling rate to form ferrite was 0.1 °C/s for
P92 steel. When the cooling rates upto 20 °C/s had bainitic transformation and above
martensitic transformations were achieved and cooling rates above 20 °C/s had little
influence on the microstructure and micro-hardness of martensite [10].
Fine grain HAZ (FGHAZ) region where the peak temperature experienced above Ac3 i.e.
950-1100 °C has completely quenched martensite with prior austenite grains visible in
region-2 & 3, where as in simulated, finer grains of random shapes are witnessed. As in
region-7 the peak temperature was 1013 °C due lateral high heat input, it shows high quantity
of retained austenite and prior austenite grains, at even 2.4 mm far from the fusion line at the
midrange in as-welded condition where the hardness has a variation of 50HV both in
simulated and heat treated in comparison with real time. From region-11 it has experienced a
peak temperature of 1148 °C in grain growth region for CGHAZ shows a hardness variation
of 60HV at as welded/simulated condition, after PWHT it has shown grain growth but

hardness has not been reduced and this FGHAZ is the region of higher creep rate than other
regions in HAZ.
Inter-Critical HAZ region, which experienced a peak temperature in between Ac1 and Ac3
where the peak temperature was 872 °C that correspond to region-4. The resultant
microstructure shows different forms of ferrite and lath martensite, which also includes
tempered martensite, newly formed quenched martensite, and thin strip δ-Fe in the as-welded
condition where as in simulated it shows formation of tempered grains at experimental
temperature of 870 °C. In the PWHT condition, the real time HAZ shows tempered bainite
where as in simulated, shows overtempered, when compared hardness without PWHT it
shows 50HV variation where as in PWHT it shows 30HV.
The region which experienced temperature above 1300 °C contains coarser delta ferrite, so it
will not have sufficient time to complete the phase transformation process from δ-Fe to γ-Fe
and then to martensite due to high cooling rate in GTAW, the original δ-Fe in the BM grows
quickly and combined at this high temperature range and also a network of Martensite-
Austenite islands along prior austenite grains observable from region-8 and 5 in without
PWHT condition. It is evident from microstructure that grains in this region are coarser with
lath type martensite in the real time HAZ, but in correlation, simulated microstructure shows
grain size variation. Hardness comparison without PWHT shows 75HV variation where as
with PWHT, it shows upper bainitic structure with 65HV variation [30].
Conclusion
The GTAW welding heat source model had been established based on SYSWELD numerical
simulation and experimentally compared that has a variation of 20% high in simulated heat
input than experimental heat input. The microstructure and hardness comparison of simulated
heat affected zone from double pass weld thermal cycle of SYSWELD and real time heat
affected zone were found to have a variation of 15-10% at different regions. In current work,
thermal data of the weld is only considered, influence of mechanical loading on the HAZ
during welding could be the cause of property reduction in physical simulation. It can be
fine-tuned towards correlation by experimentally measuring the thermal and mechanical
properties of P92 steel at various temperatures and fine data acquisition systems. The
extrapolated temperature dependent properties have to be further confined for accuracy.

Reference
1. J.C. Vaillant, B. Vandenberghe, B. Hahn, H. Heuser, C. Jochum, Int. J. Press. Vessel
Piping 85 (2008) 38.
2. M. Lomozikn, M. Zeman, J. Brozda, archives of Civil and Mech. Eng. 12 (2012) 49.
3. The T92/P92 book “ Vallourec and Mannesmann tubes Page no: 11, 2010.
4. G.D. Janaki Ram, N.V. Ravi Kumar, K. Prasad Rao,
project#RB/1112/MET/004/BHEL/GDJA IIT Madras Met. And Mat. Eng., (2008).
5. C. Kocer, T. Abe, A. Soona, Mater. Sci. Eng. A 505 (2009) 1.
6. H. Zhang, B. Long, Y. Dai, J. Nuclear Materials 377 (2008) 122.
7. S. Prasad (2011), Simulation of precipitation in power plant steels. Project thesis.
Dept. Met. and Mater. Eng., IIT Madras. 8. G. Vimalan, and G. Ravichandran J. WRI Vol.35 No.4 (2014) 5.
9. M. Consonni, 20889/05-3/12, TWI Ltd.
10. Properties of T/P92 steel weld metals for ultra super critical power plant by Z. Zhang,
G. Holloway, A. Marshall, Metrode Products Limited, UK.
11. J. Onoro, Int. J. Press. Vessel Piping 83 (2006) 540.
12. J.D. Parker and G.C. Stratford, Strain localization in creep testing of samples with
heterogeneous microstructures, Int. J. Press. Vessel Piping 68(1996) pp. 135.
13. K. Laha, K.S. Chandravathi, P. Parameswaran, K. Bhanu Sankara Rao and S.L.
Mannan, Met. Mater. Trans.A, 38 (2007) 58. 14. Abe, Mater. Sci. and Eng. A 387–389 (2004) 565.
15. B. Kim, C. Jeong, B. Lim, Mater. Sci. Eng. A 483–484 (2008) 5.
16. B. Fournier, F. Dalle, M. Sauzay, J. Longour, M. Salvi, C. Caës, I. Tournié, P.F.
Giroux, S.H. Kim, Mater. Sci. Eng. A 528 (2011) 6934. 17. S.T. Mandziej, Procedia Eng. 2 (2010) 349.
18. J. Goldak, A. Chakravarti, M. Bibby, 1984. Metall. Trans. B. 15, 299.
19. Complete finite element solution for simulation of welding process, J. Tejc, MECAS
ESI s.r.o., CZ.
20. Y.Adonyi, Welding Journal, AWS (2006), 42.
21. W. Xue, S. Zhuan, P. Qian-gang, WU.Hong-liang, Trans. Nonferrous Met. Soc. China
19(2009) s772.

22. R. W. Niles and C. E. Jackson, Welding Research Supplement (1975) 25.
23. Shielding Gases Selection N Manual by Praxiar, Inc.
24. R. Scott Funderburk, Welding Innovation Vol. XV, No. 2, 1998.
25. L. Zhao, J. Liang, Q. Zhong, Advances in Eng. Software 68 (2014) 70.
26. Gleeble Users Training 2009, Gleeble systems and Applications by Dynamic Systems
Inc.
27. L. Falat, A. Vyrostkova, V. Homolova, M. Svoboda, Engineering Failure Analysis 16
(2009) 2114.
28. G. Magudeeswaran, V. Balasubramanian, G. Madhusudhan Reddy, Defence
Technology 10 (2014) 47.
29. B. Basu and K.K Sarkar, 3rd International Conference on Thermo-Mechanical
Simulation and Processing of steels (2012) SAIL, Ranchi.
30. J. Wang, S. Lu, W. Dong, D. Li, L. Rong, Materials and Design 64 (2014) 550.