Physical Reflectivity and Polarization Characteristics for ...
25
Remote Sens. 2013, 5, 4006-4030; doi:10.3390/rs5084006 Remote Sensing ISSN 2072-4292 www.mdpi.com/journal/remotesensing Article Physical Reflectivity and Polarization Characteristics for Snow and Ice-Covered Surfaces Interacting with GPS Signals Nasser Najibi 1,2, * and Shuanggen Jin 1 1 Shanghai Astronomical Observatory, Chinese Academy of Sciences, Shanghai 200030, China; E-Mail: [email protected] 2 University of Chinese Academy of Sciences, Beijing 100049, China * Author to whom correspondence should be addressed; E-Mail: [email protected]; Tel.: +86-21-3477-5292; Fax: +86-21-6438-4618. Received: 31 May 2013; in revised form: 22 July 2013 / Accepted: 23 July 2013 / Published: 9 August 2013 Abstract: The Global Positioning System (GPS) reflected signal has been demonstrated to remotely sense the oceans, land surfaces and the cryosphere, including measuring snow depth, soil moisture, vegetation growth and wind direction. Since the Earth surface’s characteristics are very complex, the surface reflectivity process and interaction with GPS signals is not well understood. In this study, we investigate the surface’s reflectivity and variability of snow and ice surfaces interacting with GPS L1 and L2 signals in order to retrieve multipath signals and infer surface characteristics by using the direct and reflected polarizations of each signal. Firstly, the effects of both GPS satellite elevation angle and GPS receiver’s antenna height variations on the multipath signal variability have been investigated by numerical formulations. Secondly, the specular reflection coefficients’ features and the total surface polarization for liquid and solid surfaces are discussed. Moreover, the linear polarization and circular polarizations (co-polarized and cross-polarized) as well as their corresponding convolution functions are developed horizontally and vertically. The results show that the multipath signals are more sensitive to the satellite elevation angle variations than to changes in the GPS receiver’s antenna height. The convolution function demonstrates that the snowy surface has a minimum reflectance in circular polarization but maximum reflectance in linear polarization. GPS signals reflecting from an ice-covered surface show a maximum value in circular polarization reflectance and a minimum for linear polarization reflectance. Moreover, the values for reflection from soils are between those for snow and ice in all polarization types. The placement of soil surface reflectance values between snowy and icy surface ones may be noteworthy in new remote sensing applications. OPEN ACCESS
Transcript of Physical Reflectivity and Polarization Characteristics for ...

Remote Sens. 2013, 5, 4006-4030; doi:10.3390/rs5084006
Remote Sensing ISSN 2072-4292
www.mdpi.com/journal/remotesensing
Article
Physical Reflectivity and Polarization Characteristics for Snow and Ice-Covered Surfaces Interacting with GPS Signals
Nasser Najibi 1,2,* and Shuanggen Jin 1
1 Shanghai Astronomical Observatory, Chinese Academy of Sciences, Shanghai 200030, China;
E-Mail: [email protected] 2 University of Chinese Academy of Sciences, Beijing 100049, China
* Author to whom correspondence should be addressed; E-Mail: [email protected];
Tel.: +86-21-3477-5292; Fax: +86-21-6438-4618.
Received: 31 May 2013; in revised form: 22 July 2013 / Accepted: 23 July 2013 /
Published: 9 August 2013
Abstract: The Global Positioning System (GPS) reflected signal has been demonstrated to
remotely sense the oceans, land surfaces and the cryosphere, including measuring snow
depth, soil moisture, vegetation growth and wind direction. Since the Earth surface’s
characteristics are very complex, the surface reflectivity process and interaction with GPS
signals is not well understood. In this study, we investigate the surface’s reflectivity and
variability of snow and ice surfaces interacting with GPS L1 and L2 signals in order to
retrieve multipath signals and infer surface characteristics by using the direct and reflected
polarizations of each signal. Firstly, the effects of both GPS satellite elevation angle and
GPS receiver’s antenna height variations on the multipath signal variability have been
investigated by numerical formulations. Secondly, the specular reflection coefficients’ features
and the total surface polarization for liquid and solid surfaces are discussed. Moreover, the
linear polarization and circular polarizations (co-polarized and cross-polarized) as well as their
corresponding convolution functions are developed horizontally and vertically. The results
show that the multipath signals are more sensitive to the satellite elevation angle variations
than to changes in the GPS receiver’s antenna height. The convolution function demonstrates
that the snowy surface has a minimum reflectance in circular polarization but maximum
reflectance in linear polarization. GPS signals reflecting from an ice-covered surface show
a maximum value in circular polarization reflectance and a minimum for linear polarization
reflectance. Moreover, the values for reflection from soils are between those for snow and
ice in all polarization types. The placement of soil surface reflectance values between
snowy and icy surface ones may be noteworthy in new remote sensing applications.
OPEN ACCESS

Remote Sens. 2013, 5 4007
Keywords: snow; ice; reflectivity; polarization; GPS antenna height; satellite elevation
angle; convolution function
1. Introduction
Nowadays, GPS reflectometry and scatterometry have incredible applications in the field of the
Earth system sciences as new remote sensing tools in oceanography, hydrology and glaciology [1,2].
GPS reflectometry provides a way to infer the surface properties remotely because the reflectance
spectra at radio wavelengths contain properties about the surface compositions [3–5]. The high
reflectivity of GPS signals in the frequency range of L-Band (1.2276 and 1.5754 GHz) on the liquid
water and the frozen water (e.g., ice caps, glaciers, etc.) allows us to detect the reflected signals
reasonably well [6].
Many studies have been done to observe surface reflectance features. For example, Hannah [7]
developed several multipath propagation simulations for concrete, dry ground, medium dry ground,
wet ground, fresh water and sea water in linear and circular and also effective polarizations. This study
did not consider snowy and icy surfaces or the physical reflectivity of scattered and reflected signals
on its simulations and results.
Recently, Litvinov et al. [8] investigated the reflection properties of soil and vegetation surfaces by
using airborne data to model the total and polarized reflectances in the unique form for both soil and
vegetation surfaces. They performed their experiments with airborne data instead of ground GPS
reflected signals. Moreover, Chew et al. [9] demonstrated the influence of soil moisture variations for
bare soil conditions on both amplitude and phase of multipath signature using Signal to Noise Ratio
(SNR) simulated data.
To retrieve the surface properties from ground GPS signals, the physical surface reflectivity of the
scattered and reflected signals should be taken into account. Additionally, the chemical surface
characteristic for different reflectance polarizations and different grazing angles in interacting with the
GPS signals must be understood in detail. Elosegui et al. [10] introduced the GPS multipath signals for
different satellite elevation angles with a constant GPS antenna height and a certain ratio of GPS
reflected amplitude signals, which proved that GPS multipath signature is a function of GPS antenna
height, ratio of reflected GPS signal, satellite elevation angle and the wavelength. However, they did
not discuss the variability of GPS multipath signature affected by the changes in the GPS antenna
height or satellite elevation angles variations.
In this paper, the effects of integrated satellite elevation angles variations and GPS antenna height’s
changes on multipath signature’s variability are investigated by analyzing numerically the phase shift
variation formula of reflected signals in comparison to the combined signals (direct and reflected
signals). Then, multipath signature variability during the critical conditions including GPS scattered
and reflected signals in the satellite zenith angle and the minimum or maximum GPS antenna height
are discussed.
In addition, the reaction of snow, ice and soil surface to GPS scattered L1 and L2 signals,
characteristically including the specular reflection, total surface reflectivity, the linear polarization and

Remote Sens. 2013, 5 4008
circular polarization for both GPS L1 and L2 signals, are analyzed and their corresponding convolution
functions are discussed in detail for snowy and icy surfaces. Snow and ice-covered surfaces indeed
play important roles in environmental systems, especially hydrologic cycles and climate change, and
thus, it is worthwhile to focus on them.
2. Theory and Methodology
As we can see in Figure 1, two types of polarized signals from GPS satellite and also existent
surfaces can be acquired by ground GPS receiver: Right-Hand Circular Polarization (RHCP) and
Left-Hand Circular Polarization (LHCP). It should be noted that the reflected surface’s signal is not
only LHCP, but in fact, it is a combination of RHCP and LHCP signals. Generally, incident RHCP for
the angles with less than the Brewster angle produces mainly a RHCP reflected wave. Incident RHCP
for the angles with greater than the Brewster angle produces a LHCP reflected wave. At the Brewster
angle, the reflected signal is linearly polarized (Figure 1).
Figure 1. General surface reflectance process in GPS L1 and L2 signals for Right-Hand
Circular Polarization (RHCP) and Left-Hand Circular Polarization (LHCP) components
and the Brewster angle (not to scale).
In order to sense and discriminate the snow surface and ice surface using ground GPS receivers’
observations, the physical geometry of GPS reflected signals and the characteristics of surface
reflected signals must be analyzed. This can be done through investigation of the physical status of
both scattered and reflected signals as well as the polarization of the targeted surface in different
propagation angles. The general flowchart of the proposed methodology to sense snowy and icy
surfaces is given in Figure 2.

Remote Sens. 2013, 5 4009
The general procedure is described as follows: Firstly, the physical reflectivity of GPS for both
scattered and reflected signals is considered in the presence of time variability for GPS satellite
elevation angles and GPS antenna height. Meanwhile, the reflectance characteristic is investigated with
polarization in snowy and icy surfaces by linear and circular polarization processes. These
polarizations are considered as inputs for convolution function in order to distinguish the difference in
snowy and icy surfaces (Figure 2).
Figure 2. Flowchart of the proposed methodology to sense snowy and icy surfaces via
GPS reflected signals using ground GPS station receivers’ observations.
In both cases, we generally deal with GPS scattered and reflected signals; but in physical
reflectivity, we ignore the chemical characteristics of the surface and thus, we only concentrate on the
surface’s physical status, such as the variations related to its physical shape rather than the material
features (and so we treat snow and ice surfaces as a unique surface). However, in reflectance

Remote Sens. 2013, 5 4010
characteristic procedures, we pay attention only to the chemical properties of the surface, such as
conductivity, relative permittivity and polarization parameters.
The physical outer surface of snow, ice and ground (soil) is initially assumed as flat and parallel to the
local horizontal plane (perpendicular to the local plumb line) and the influence of undesired external
factors do not exist, such as any sudden fluctuations in the satellite elevation angle or replacement of the
GPS antenna,. Additionally, any irregularity in density and temperature of these materials that will result
in inhomogeneous values for conductivity and relative permittivity are negligible.
In the following, physical reflectivity and reflectance characteristics’ steps are discussed in
detail, respectively.
2.1. Physical Reflectivity
Multipath signature depends on the following four parameters: the GPS wavelength (λ), ratio of the
reflected wave amplitude relative to the direct wave (α), GPS satellite elevation angle (ε), and the GPS
antenna height (H). It can be written as [10,11]:
(1)
where δΦ is the reflected wave phase shift value related to the total (the reflected wave plus a direct
one) (see Figure 3).
Figure 3. GPS scattered and reflected signals towards the Earth’s surface and from
surrounding ground GPS station receiver during a specified time span while the H is constant.
( )1
sin 4 sintan , , ,
1 cos 4 sin
H
HH
α π ελδ δ λ α ε
α π ελ
−
Φ = = Φ +

Remote Sens. 2013, 5 4011
Referring to Equation (1), we analyze two conditions, including multipath variations with respect to
GPS satellite elevation variability (dε) and multipath variations with respect to GPS antenna height
variability (dH) with the assumption that α is a constant parameter.
2.1.1. Multipath Variations with Respect to Satellite Elevation Angle Variability (dε)
If we rewrite Equation (1) with the following substitution:
(2)
Therefore:
(3)
Moreover, if we assume a certain condition whereby the GPS antenna height (H) does not change,
M will not vary during this certain time period. Therefore, the changes in multipath during the time
(velocity of multipath signature (VδΦ)) related to the changes in the satellite elevation angle (ε) (velocity of satellite elevation angle (Vε)) can be defined as:
(4)
and simplifying Equation (4) gives:
(5)
Equation (5) shows that the function of multipath signature variations based on satellite elevation
angle’s changes significantly depends on H value embedded in M, which is a function of H
straightforwardly (Equation (2)).
Moreover, multipath variations with respect to the satellite elevation angle variability for two
critical conditions depend on not only the satellite elevation angle but also GPS antenna height. For
instance, at the certain point that GPS satellite elevation angle is equal to zero, it is given as:
(6)
It is clear from Equation (6) that the multipath signature variability with respect to the changes in
satellite elevation angle interrelates directly to GPS antenna height at the certain point when the
satellite elevation angle is zero. However, the multipath signature variability with respect to the
changes in the satellite elevation angle in the GPS satellite zenith angle (when GPS satellite elevation
angle is π/2) will be concluded as:
(7)
4H
M πλ
=
( )( ) ( )1 sin sin
tan , ,1 cos sin
MM
M
α εδ δ α ε
α ε−
Φ = = Φ +
( )( )
( )( )
2
sin sin
1 cos sin
sin sin1
1 cos sin
Mdd d MV ddtdV d Mdt
M
δ
ε
α εδ ε α εδε ε α ε
α ε
Φ
Φ +Φ = = =
+ +
( )( )( )2
cos cos cos sin
1 cos sin
MV dM
V d M
δ
ε
α ε ε εδ αε α ε
Φ +Φ= =+
( )2
10
11
d MM
d
δ α αε αε ααΦ += → = =
++
02
d
d
π δεεΦ= → =

Remote Sens. 2013, 5 4012
Equation (7) describes when the GPS satellite is directly, vertically placed above the ground GPS
receiver antenna; the variability of multipath signature with respect to the ɛ variations is nullification.
2.1.2. Multipath Variations with Respect to GPS Antenna Height Variability (dH)
In a similar fashion, the multipath signature’s variability with respect to the changes in the GPS
antenna height during the specific time span being computed, it can be written as:
(8)
where the variables are the same ones described in Equation (1) and N is defined as a function of
satellite elevation angle (ɛ), as follows:
(9)
Simplifying Equation (8) can give us the following uncomplicated relationship between multipath
signature’s velocity and H, as:
(10)
In a similar way, if the GPS antenna height becomes zero (H = 0), then:
(11)
By referring to Equation (9), Equation (11) demonstrates how important the satellite elevation angle is
in multipath signatures variability’s analysis when the GPS antenna heights are simultaneously changing.
In order to understand when the multipath signatures variability is going to be zero (in the situation
that the multipath signature variability is independent from the GPS antenna height variations) with
respect to the changes in GPS antenna height; therefore:
(12)
Included in Equation (12) are two important assumptions as cos−1(−α) ≈ π/2 (α = 0.06 from
Elosegui et al. [10]) and also satellite elevation angle cannot be equaled to zero value during that
specific time span. In the other words, if the satellite elevation angle may be equated to one of the
given values for ɛ in Equation (12) (sin−1(λ/8H) or sin−1(3λ/16H)), the multipath signatures’ variability
will be independent of any changes in the GPS antenna height.
2.2. Reflectance Characteristic
Generally, the polarization of an electromagnetic wave is defined as the orientation of the electric
field vector where the electric field vector is perpendicular to both the direction of travel and the
( )( )
( )( )
2
sin
1 cos
sin1
1 cos
H
NHdd dH NHV ddtdHV dH NHdt
NH
δ
αδ αδ
αα
Φ
Φ +Φ = = =
+ +
4sinN
π ελ
=
( )( )( )( ) ( )2 2
cos
cos sinH
NHV dN
V dH NH NH
δαδ α
αΦ
+Φ= =+ +
1
dN
dH
δ αα
Φ =+
( )( )1
1
sin8
0 cos 03
sin16
HdN NH
dH
H
λεδ α α
λε
−
−
= Φ = → + = → =

Remote Sens. 2013, 5 4013
magnetic field vector [12]. The polarization is introduced as the geometric figure projected by the
electrical field vector in a static plane perpendicular to the direction of propagation while the wave
passes through that assumed plane [13]. In fact, when the radio waves are transmitting from a material
or space with given refractive index n1 into a second material or space with refractive index n2, both
reflection and refraction of the waves may occur [14–16].
In spectroscopy, the Fresnel equations identify which wave fraction is reflected and which one is
refracted (i.e., transmitted). Furthermore, they describe the phase shift related to the reflected wave [7].
Generally in reflectance characteristics, we are dealing with the surface chemical property constants,
especially conductivity and relative permittivity. The conductivity and relative permittivity values for
soil, snow and ice surfaces used in this study are given in Table 1 ([17–19]).
Table 1. Conductivity and relative permittivity properties values [17–19].
Surface Conductivity (mho/m) Relative Permittivity (εr)
soil 1 × 10⁻⁵ 4 to 8
snow 10−9 to 10−7 4
ice 1 × 10⁻⁵ to 3 × 10⁻⁵ 3 to 30
Here the soil is considered as dry bare soil with estimated relative permittivity less than eight
percent [19]. Moreover, the modeled snow is a soft new snow with density of 127 kg/m3
approximately [17] and the ice is pure ice with mean temperature between 0 and −10 °C [18]. The
conductivity values for modeled soil, snow and ice surface are considered as mean values of the
represented values in Table 1.
In the surface reflectance domain, commonly two waves are being analyzed: s-polarized (Rs) and
p-polarized (Rp). The incident wave, with an electric field located in the same plane of the interface
(perpendicular to the plane of the diagram in Figure 1), is called s-polarized (Rs). That incident wave
with its electric field is placed in a perpendicular direction to the s-polarized wave (in the same
geometric plane of the diagram in Figure 1) and is called p-polarized (Rp).
2.2.1. Surface Reflectance Characteristic for Linear and Circular Polarization
When an electromagnetic wave is traveling from a dense medium into a less dense one (i.e., n1 > n2),
for a specific material those angles, which are more than the incidence angle, are known as the critical
angles for that material. Then, the entire wave is being reflected and thus, Rs = Rp = 1. This
phenomenon is defined as the total internal reflection [14].
It is well-known that the reflection coefficients (RC) for horizontal (RCH) and vertical (RCV) polarization are as Equations (13) and (14), where = − [20]:
(13)
(14)
( )( )
2
2
sin cos
sin cosHRC
θ ε θ
θ ε θ
− −=
+ −
( )( )
2
2
sin cos
sin cosVRC
ε θ ε θ
ε θ ε θ
− −=
+ −

Remote Sens. 2013, 5 4014
where ɛ is the complex dielectric constant with assumption of time dependence in e−jωt [13,21] and θ is
the grazing angle.
By substituting for ω and ε0 in ɛ function, it can be written as ε = εr − j60λσ. Therefore, the
calculation of each linear coefficient is now straightforward using a given frequency (e.g., GPS L1 and
L2 frequency values) together with known grazing angle (θ), dielectric constant and conduction value
for the reflecting surface [22].
According to GPS receiver antenna property, which only can receive RHCP signals (in fact the amount
of LHCP signals which can be received by GPS receiver antenna are negligible), it is necessary
to assess these selected surfaces in cross-polarized and co-polarized cases [23]. According to
Leroux et al. [24], the co-polarization equation can be written as [24]:
(15)
Similarly for cross-polarization:
(16)
where Гo and ГX are the reflection coefficients for co-polarization and cross-polarization and RCH and
RCV are the reflection coefficients for horizontal and vertical linear polarization respectively derived
from Equations (13) and (14). By using GPS L1 and L2 signal as the scatter signals towards the
selected surfaces, reflection coefficients for GPS L1 and L2 signals versus grazing angles can be computed.
2.2.2. Convolution Functions for Surface Reflectance Characteristics
In order to get the total surface reflectance from GPS signals, the cross-correlation between vertical
and horizontal components of each L1 and L2 signal is proposed since a reflected signal is correlated
horizontally and vertically. The cross-correlation equation is the convolution of RCH and RCV written
as RCH × RCV. It is defined as the integral of the product of the two functions after one is reversed and
shifted. This particular integral transformation is given by:
(17)
where τ is a free variable and t does not represent the time domain necessarily (related to each
embedded convolution function in Equation (17), and t can be interpreted as a random variable,
independent variable or time span) [25]. Therefore, in the half plane surface angles domain (from 0 to
180 degrees), which is considered as the total angles for vertical and horizontal components, the tested
surfaces have different convolution values for linear polarization in interacting with GPS L1 and L2
signals. We investigate both GPS signals in linear polarization convolution for snow, ice and soil surfaces.
Similarly the cross-correlation polarization between co-polarized and cross-polarized of each L1
and L2 signal is happening in the convolution function of both polarizations. Since the entire reflected
signal surface is correlated, the cross-correlation equation is the convolution of Гo and ГX that is
written as Гo × ГX. It is defined as the integral of the product of the two functions after one is reversed
and shifted [23,25]. This particular integral transformation is given by:
2H V
O
RC RC+Γ =
2H V
X
RC RC−Γ =
( )( ) ( ) ( )
( ) ( )
H V H V
H V
RC RC t RC RC t d
RC t RC d
τ τ τ
τ τ τ
+∞
−∞+∞
−∞
∗ = ∗ −
= − ∗

Remote Sens. 2013, 5 4015
(18)
where τ is a free variable and t can be interpreted as a random variable, independent variable or timing
span. The selected surfaces for the half plane surface angles domain have different convolution
function values for circular polarization in dealing with GPS L1 and L2 signals.
3. Results and Discussion
3.1. GPS Reflected Signals and Physical Reflectivity
According to Equation (1), the multipath signatures caused by GPS reflected signals are critically
dependant on the satellite elevation angle (ɛ) and GPS antenna height (H). It is assumed that GPS
scattered and reflected wavelengths (λ) as well as the ratio of the reflected signal amplitude relative to
the direct one (α) (α = 0.06; according to [10]) are constants.
In order to present the multipath signature variability with respect to H and ɛ variations during the
specified time period, the velocity equations are used. In fact, the velocity equations are the derivatives
of the original shifted phase signal to the total value of direct and reflected signal upon subjecting to H
and ɛ values, which have been proposed respectively in Equations (5) and (10).
Figure 4. GPS scattered and reflected signals towards the Earth’s surface and from
surrounding ground GPS station receiver during a specified time span while the H
is constant.
( )( ) ( ) ( )
( ) ( )
O X O X
O X
t t d
t d
τ τ τ
τ τ τ
+∞
−∞+∞
−∞
Γ ∗Γ = Γ ∗Γ −
= Γ − ∗Γ

Remote Sens. 2013, 5 4016
If no change has been made into surrounding the ground GPS station receiver’s initial natural
condition practically (e.g., snow accumulation) or the GPS antenna is not being replaced with another
one, H will be constant (Figure 4). Thereafter, the variability of multipath signatures subjected to the
changes in satellite elevation angle itself (Vɛ) and also the variability of multipath signatures subjected
to the GPS antenna height variations (VH) can be analyzed in the different H values (depending on the
type of GPS antenna product). They are presented in Figures 5 and 6, respectively.
Figure 5. Variability of multipath signatures subjected to the changes in H (VΦ/VH) based
on ε variations.
Figure 6. Variability of multipath signatures subjected to the changes in ε (VΦ/Vε) based on
ε variations.
1 2 3 4 5 6 7 8 9 10-3
-2
-1
0
1
2
3
GPS Antenna Height [m]
Vφ/V
H [
Ma
gn
itu
de
/m]
ε=15 ε=20 ε=30 ε=45
1 2 3 4 5 6 7 8 9 10
-40
-30
-20
-10
0
10
20
30
GPS Antenna Height [m]
Vφ/V
ε [M
ag
nit
ud
e/d
eg
]
ε=15 ε=20 ε=30 ε=45
Remote Sens. 2013, 5 4017
Although in this case where H is constant and ε is varying as GPS satellites are moving perpetually
during the specified time span, but as presented in Figures 5 and 6, the variability of multipath
signature for ε variations is more sensitive than H ones. The VΦ/Vε for a determined H and ɛ value has a
much greater value than the same H and ɛ for VΦ/VH (for example in both Figures 5 and 6, the unique
values of H = 4 m and ɛ = 45° have VΦ/VH ≈ −3 and VΦ/Vε ≈ −10 or H = 7 m and ɛ = 30° have VΦ/VH ≈ −1
and VΦ/Vε ≈ −20, respectively). This demonstrates the determinant role of ɛ in multipath signature
variability when ɛ is changing. According to this, an investigation is needed for the case where both ɛ and H are varied.
Therefore, to take into account the ɛ variations during the certain time span, if H changes sizably
(e.g., due to snow accumulation or ice melting), it will lead to the sudden physical variations in ground
GPS station’s surrounds (Figure 7). By using Equations (5) and (10) as the derivatives of multipath
signatures variations subjected to the variability in H and ɛ, it can provide us with the trend of GPS
scattered and reflected signals interacting with the ground GPS station receiver’s environment, as
shown in Figures 8 and 9, respectively.
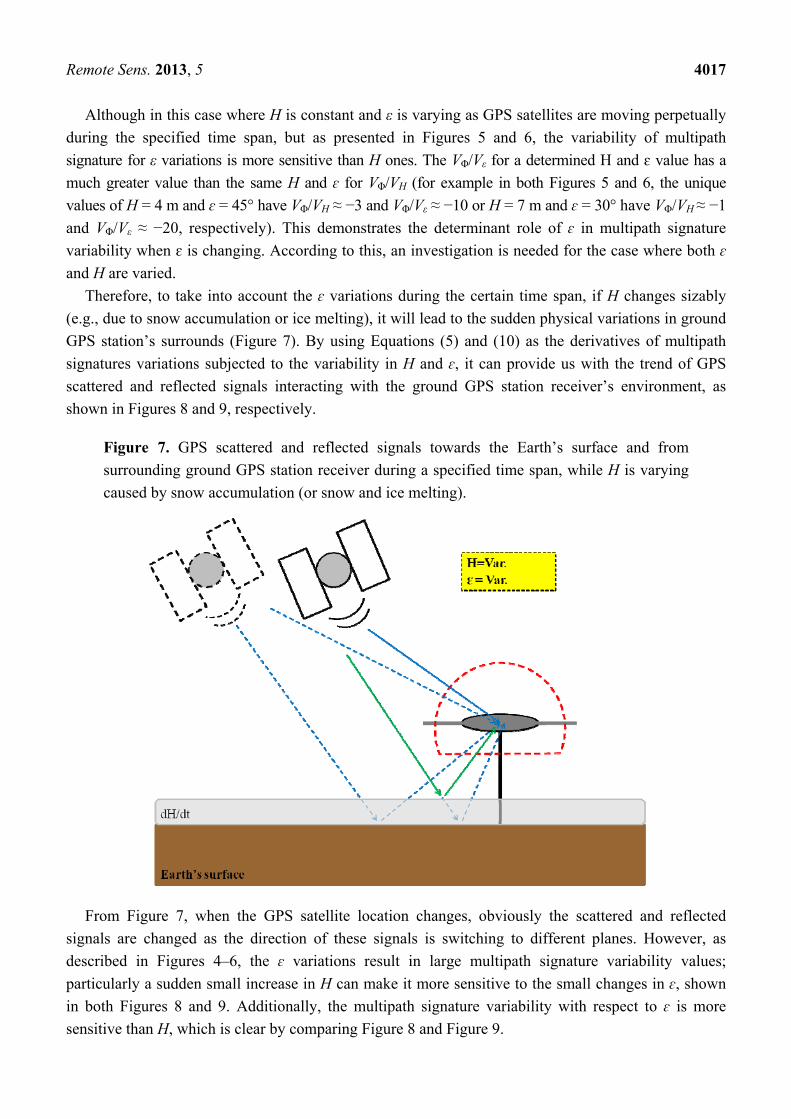
Figure 7. GPS scattered and reflected signals towards the Earth’s surface and from
surrounding ground GPS station receiver during a specified time span, while H is varying
caused by snow accumulation (or snow and ice melting).
From Figure 7, when the GPS satellite location changes, obviously the scattered and reflected
signals are changed as the direction of these signals is switching to different planes. However, as
described in Figures 4–6, the ɛ variations result in large multipath signature variability values;
particularly a sudden small increase in H can make it more sensitive to the small changes in ɛ, shown
in both Figures 8 and 9. Additionally, the multipath signature variability with respect to ɛ is more
sensitive than H, which is clear by comparing Figure 8 and Figure 9.

Remote Sens. 2013, 5 4018
Similarly, if ɛ does not vary during this time, or the ground GPS receiver only tracks a specific
single GPS satellite, and in a certain elevation (e.g., Figure 10), the multipath signature variability
values with respect to H variations will be periodic. These variability values critically depend on H
(clearly, also depend on a fixed ɛ value), which is demonstrated in Figure 11 for H between a height of
8 and 8.8 m.
The only reason that can restrict the reflected signal’s angle when ε is constant and H is varied
during the time is the sudden variation in H (it may be due to H variation manually or changes in the
physical conditions surrounding the ground receiver). As it is shown in Figure 11, a nearly 15 cm
increase in H value (e.g., from 8.15 to 8.3 m) can lead to a significant change in multipath signature
variability from a maximum value to a minimum one (See Figure 11). In addition, this variability has
periodic trend and depends on a fixed ε value which is considered here equal to 25° (ε = 25°).
Figure 8. Variability of multipath signatures subjected to the changes in H (VΦ/VH) based
on H variations.
Figure 9. Variability of multipath signatures subjected to the changes in ε (VΦ/Vε) based on
H variations.
10 20 30 40 50 60 70 80 90-5
-4
-3
-2
-1
0
1
2
3
Satellite Elevation Angle (ε) [deg]
Vφ/V
H [
Ma
gn
itu
de
/m]
H=8 m 8.1 m 10 m 14 m
10 20 30 40 50 60 70 80 90-60
-40
-20
0
20
40
60
Satellite Elevation Angle (ε) [deg]
Vφ/V
ε [M
ag
nit
ud
e/d
eg
]
H=8 m 8.1 m 10 m 14 m

Remote Sens. 2013, 5 4019
Figure 10. GPS scattered and reflected signal towards the Earth’s surface and from
surrounding ground GPS station receiver during a specified time span, while H is varying
due to snow accumulation (or snow and ice melting) but the ε is constant (here ε = 25°).
Figure 11. Variability of multipath signatures subjected to the changes in H (VΦ/VH) and
fixed ε (here ε = 25°) based on H variations.
According to Equation (11), the multipath signature variability with respect to H variations is
directly a function of ɛ. Therefore, if we assume the following schematics for the GPS satellite and
ground receiver, as shown in Figures 12 and 13.
8 8.1 8.2 8.3 8.4 8.5 8.6 8.7 8.8-4
-3
-2
-1
0
1
2
3
4
GPS Antenna Height [m]
Vφ/V
H [
Ma
gn
itu
de
/m]

Remote Sens. 2013, 5 4020
Figure 12. GPS scattered and reflected signal towards the Earth’s surface and the from
surrounds of the ground GPS station receiver during a specified time span while H is the
maximum and ε is changing up to the satellite zenith angle (practically, this case may
happen rarely).
Figure 13. GPS scattered and reflected signal towards the Earth’s surface and from the
surrounds of the ground GPS station receiver during a specified time span while H = 0 and
ε is changing up to the satellite zenith angle (practically, this case would not occur).

Remote Sens. 2013, 5 4021
It is clear that the reflected signals from maximum snow surface (or ice surface) in Figure 12 or
Earth’s surface, represented in Figure 13, are similar in terms of reflected signal angle from snow (ice)
and Earth’s ground surface, respectively. However, there are differences in signal strength and
amplitude as they have been reflected from different surfaces with unequal reflectance polarization
coefficients, but as mentioned in the physical reflectivity’s introduction, we concentrate only on the
physical status of scattered and reflected signals interacting with the selected surfaces and ground
receiver rather than signal strength and amplitude values. Therefore, the multipath signature variability
subject to H variations for both Figure 12 (H = Maximum) and Figure 13 (H = 0) are similar. These
different values for ɛ with H = 0, are presented in Figure 14.
Figure 14. Variability of multipath signatures subjected to H variations (VΦ/VH) in H = 0
for different ε values.
As it can be understood from Figures 12–14, increases in the satellite elevation angle up to its zenith
angle lead to maximum variability in multipath signatures as the reflected signals are going to interact
with the ground GPS receiver antenna. Moreover, the low satellite elevation angle gives more reflected
signals from the surface rather than what can be received by the ground GPS receiver itself.
3.2. GPS Reflected Signals Surface and Reflectance Characteristics
The reflected signals from a surface are associated principally by two factors: the physical
formation of interacting signals and the surface characteristic. The former is defined here as physical
reflectivity of multipath signatures and the latter is described as reflectance characteristics. The
physical reflectivity was expatiated completely in Section 3.1. In this part, the specular reflection and
the total reflectivity as well as linear and circular polarization and their corresponding convolution
functions are discussed in detail.
Theoretically, almost all objects can emit specular reflections, although the amount of the
reflections varies and depends on the object’s optical properties, such as the surface roughness, the
Fresnel reflection coefficients, and so on [26]. Figure 15 presents a diagram of characteristic
reflectance in interacting with incidence signal (scattered signal) from a certain surface. The result of
such interaction is refracted and reflected signals with different surface polarization reflectances.
10 20 30 40 50 60 70 80 900.5
1
1.5
2
2.5
3
3.5
4
Satell ite Elevation Angle (ε) [deg]
Vφ/V
H [
Ma
gn
itu
de
/m]

Remote Sens. 2013, 5 4022
Figure 15. Incident, reflected, refracted and Brewster angle and polarization of signal that
occurs on an interface of a surface section at Brewster’s angle (not to scale).
As pointed out in the theory and methodology section, the environment geometry of signals
(incident and reflected signal angles) and the surface electrical properties (conductivity and relative
permittivity) are playing consequential roles in the surface reflectance features where the reflection
coefficients for a surface provide applicable information on the nature of reflected signals [27].
Figure 16. Perpendicular and parallel specular reflection coefficients for the main phases
of the Earth’s surface covered materials; frozen water (blue) and soil (red).
To consider the most significant phases of natural substances covered on the Earth’s surface, frozen
water (e.g., snow or ice) and soil (mixed with rock) are the most crucial surfaces with a refractivity
0 15 30 45 60 75 900
0.2
0.4
0.6
0.8
1
scattering angle [deg]
Sp
ec
ula
r re
fle
cti
on
co
eff
icie
nt
Specular Reflection Coefficient for Frozen Water and Bare Soil
Perpendicular reflection for bare soil surfacePerpendicular reflection for frozen water surfaceParallel reflection for bare soil surfaceParallel reflection for frozen water surface

Remote Sens. 2013, 5 4023
index of 1.309 and 1.540, respectively [19], which have been analyzed through specular reflection
coefficients versus scattering perpendicular and parallel angles (see Table 1). Figure 16 represents
specular reflection coefficients for each selected surface and the parallel reflection coefficients with
deceleration to reach a unique value, rather than perpendicular ones.
The specular reflection coefficients for each surface are increasing continuously and monotonically
in Figure 16. Since the soil surface has maximum perpendicular reflection coefficients, the parallel
specular reflection coefficients are almost in the same trend-value for both these two surfaces.
Although each surface may change its reflection coefficients to signal scattering depending on the
geometry or other significant environmental factors that eventually would affect these values, initially
we assumed idealistic situations that are not changing for the scattered and reflected signals during
these results.
In order to understand the entire frozen water and soil surface interaction for scattered signals, the
total reflection of both perpendicular and parallel specular reflection is proposed. The total surface
reflectivity is computing the half plane scattered angles (Figure 17), which shows a sudden phase
change of 90° for the selected surfaces. This sudden phase change happens when the total specular
reflection coefficients increase up to 4; while the scattering angle approaches 180°. The bare soil is
reflecting the incident signals more than frozen water for the entire scattering angles. In other words,
frozen water absorbs more scattered signals than bare soil.
The comparison between bare soil and frozen water in terms of specular reflection and total
reflection coefficients (Figures 16 and 17) shows that the frozen water’s reflection is approximately
equal to half the bare soil’s reflection in interacting with incident signals for all scattered angles.
Figure 17. Total specular reflection coefficient based on both perpendicular and parallel
specular reflection coefficients of two main phases of the Earth’s surface covered
materials; frozen water (blue) and soil (red) surface.
Originally, the GPS scattered signals are Right Handled Circulated Polarization (RHCP). The
circular polarization occurred in the reflected surface is the vector sum of the linearly polarized waves
(both in vertical and horizontal). Therefore, it is appropriate to consider the reflection coefficients for
0 15 30 45 60 75 90 105 120 135 150 165 1800
0.5
1
1.5
2
2.5
3
3.5
4
4.5
scattering angle [deg]
To
tal
refl
ec
tio
n c
oe
ffic
ien
t
Total Specular Reflection Coefficient for Frozen Water and Bare Soil
Frozen waterBare soil

Remote Sens. 2013, 5 4024
linear cases initially. In order to compute linear polarization reflection coefficients, the conductivity
and relative permittivity values for selected surfaces including soil, snow and ice (as given in Table 1)
and the equations for reflection coefficients in horizontal and vertical polarization (Equations (13) and
(14)) are used. The linear polarization reflection coefficients for GPS signals (L1 = 1.575 GHz, λ1 = 19
cm and L2 = 1.227 GHz, λ2 = 24.4 cm) are represented in Figure 18.
Figure 18. Linear polarization reflection coefficients vertically (red colored plot) and
horizontally (blue colored plot) in interacting with GPS L1 (Top) and L2 (Down) signals
for selected surfaces including snow, ice and soil.
From Figure 18, it can be seen that the reflection coefficient values for each surface is varied and
unique in comparison to the other surface. The vertical component (red colored plot) increases quickly
compared to the horizontal one (blue colored plot) which increases gradually. Although the vertical
reflection coefficient increases with approximate near zero slopes for the grazing angles that is greater
than the Brewster angles, the linear polarization has a positive constant slope for the
horizontal polarization.
In addition, the soil surface linear polarization coefficient for both GPS L1 and L2 signals has a
maximum value in vertical polarization and the minimum value in horizontal polarization. Moreover,
the ice surface linear polarization coefficient has a maximum value in horizontal polarization for both
GPS signals. The snow surface has a lesser linear polarization value than soil in vertical polarization,
but it has a greater value than soil in horizontal polarization when the incident signals are gradually
getting linearly polarized by interacting with the surface.
Generally, for the angles less than the Brewster angles, the reflected signal, which is Right Hand
Elliptically Polarized (RHEP), would become increasingly more elliptic as the Brewster angle is
approaching [7]. Though at the Brewster angle, the polarization approaches that absolute point, which
is Left Hand Elliptically Polarized (LHEP), with an elliptical increase as grazing angles increase [13].
Regarding the GPS multipath signatures and reflectance characteristics, the GPS receiver antenna
only can receive RHCP signals (in fact those LHCP signals which can be received by GPS receiver
antenna are at a lower level and negligible). Then, it is necessary to assess the circular polarization
0 10 20 30 40 50 60 70 80 90-1
-0.5
0
0.5
1Linear Polarization Reflection Coefficients for GPS L1 and L2
Co
eff
icie
nt
0 10 20 30 40 50 60 70 80 90-1
-0.5
0
0.5
1
Grazing angle [deg]
Co
eff
icie
nt
Vsnow
Hsnow data4 V
iceH
ice data7 data8 Vsoil
Hsoil
L2
L1

Remote Sens. 2013, 5 4025
reflectance characteristics in the mentioned surfaces which the corresponding optical polarization
approaches presented in Equations (15) and (16). The linear polarization is necessary to understand
circular polarization as it is used in those related circular equations.
Referring to Figure 19, the co-polarized and cross-polarized plots are approximately symmetrical.
The Brewster angle in circular polarization occurs at the intersection point of co-polarization and
cross-polarization plots (e.g., 27° for snow in GPS L1 signal).
Figure 19. Circular polarization as reflection coefficients of co-polarization (red) and
cross-polarization (blue) in interacting with GPS L1 (Top) and L2 (Bottom) signals for
selected surfaces including snow, ice and soil.
Additionally, ice surface reflectance has a minimum Brewster angle, but snow surface has a
maximum one. The soil surface’s Brewster angle is less than the snow’s one but larger than soil
surface’s value. This can be attributed to the large difference between snow and ice surface in terms of
characteristic reflectance discriminating in interactions with GPS signals in circular polarization.
To demonstrate this, by referring to Figure 18 (linear polarization plots for GPS L1 and L2 signals)
and Equations (15) and (16) that consist of linear polarization values, the difference between vertical and
horizontal plots can be seen as the largest values in soil surface plots.
In order to observe the entire reflection from these surfaces (both of vertical and horizontal
polarizations or both of co-polarization and cross-polarization reflections) the convolution functions
have been proposed for soil, snow and ice surface in both linear (Equation (17)) and circular
(Equation (18)) polarization, respectively(Figures 20 and 21).
In Figure 20, the minimum of each surface occurs at 90°. This is where the first derivative of the
corresponding convolution function for the linear polarization can occur. This means the behavior of
the convolution function is inverting suddenly after 90°. In other words, this sudden reversing is
similar in order to replace the vertical linear polarization by a horizontal one after 90°. Furthermore, it
can be concluded from each convolution values’ diagram that each selected surface has a majority of
negative linear polarization values rather than positive ones.
0 10 20 30 40 50 60 70 80 90-1
-0.5
0
0.5Circular Polarization Reflection Coefficients for GPS L1 and L2
Co
eff
icie
nt
0 10 20 30 40 50 60 70 80 90-1
-0.5
0
0.5
grazing angle [deg]
Co
eff
icie
nt
Cosoil
Crsoil data3 data4 Co
snowCr
snow data7 data8 Coice
Crice
L2
L1

Remote Sens. 2013, 5 4026
Figure 20. Linear polarization convolution values for GPS L1 (Top) and L2 (Bottom)
signals interacted to selected surfaces including snow, ice and soil.
Figure 21. Circular polarization convolution values for GPS L1 (Top) and L2 (Down)
signals interacted to selected surfaces including snow, ice and soil.
Since it is presented in Figure 20, the soil surface total reflection convolution values derived from
linear polarization is located between ice and snow values. This is highly remarkable and can be strong
evidence for discriminating snow and ice surfaces from each other through GPS reflected signals.
The comparison of linear polarization convolution values for GPS L1 and L2 signals (see Figure
20) gives us the fact that the surface reflectance for GPS L2 signal is larger than L1; although the GPS
L2’s wavelength is greater than L1.
Referring to Figure 18 and linear polarization equations in GPS L1 and L2 signals for soil, the
difference between vertical and horizontal (blue and red colored plots) is more than other surfaces. For
example, in grazing angle of 30° for GPS L1 signal; the linear polarization reflection coefficient for
0 20 40 60 80 100 120 140 160 180-30
-20
-10
0
10
Co
nv
olu
tio
n v
alu
e
Convolution of Vertical and Horizontal Linear Polarization Reflection Coefficients
0 20 40 60 80 100 120 140 160 180-30
-20
-10
0
10
Total surface angle [deg]
Co
nv
olu
tio
n v
alu
e
data1 data2 data3 Soil Snow Ice
L2
L1
0 20 40 60 80 100 120 140 160 180-5
0
5
10
15
Co
nv
olu
tio
n v
alu
e
Convolution of Circular Polarization Reflection Coefficients
0 20 40 60 80 100 120 140 160 180-5
0
5
10
15
Total surface angle [deg]
Co
nv
olu
tio
n v
alu
e
data1 data2 data3 Soil Snow Ice
L2
L1

Remote Sens. 2013, 5 4027
soil, snow and ice surfaces in vertical and horizontal polarizations are as follows, respectively: 0.28,
0.21, 0.09 and −0.74, −0.62, −0.55 (see Figure 18). The absolute difference between each pair value
for soil, snow and ice surfaces will be equal to 1.02, 0.83 and 0.64. Therefore, the summation of soil
surface reflection coefficients in vertical and horizontal directions computed by convolution function is
displayed as more noteworthy.
The co-polarized and cross-polarized coefficient values vary between 0 and −1 (see Figure 19).
In Figure 21, the changing phase angle occurs at 90°. The circular convolution function trend before
and after 90° is becoming completely shifted and mirrored with a 180° phase difference. Moreover, the
point which RCH and RCV are equivalent to each other is occurring at 0° where the cross-polarization
coefficient reflectance is equal to 0. In addition, the summation of RCH and RCV s equal to 0 where the
co-polarization reflectance coefficient is equal to zero at 90°.
Additionally, the snow surface has the minimum circular reflection value in co-polarization and
maximum one in cross-polarization. However, the ice surface has maximum circular reflection values in
co-polarization and minimum values in cross-polarization. In fact, referring to Equations (15) and (16)
and Figures 19 and 21, the Brewster angle for snow surface is greater than soil surface in cross-polarized
and co-polarized GPS L1 and L2 signals. Similarly, the Brewster angle for soil surface is larger than
ice surface values.
To compare these two convolution functions for linear (Figure 20) and circular polarization
(Figure 21), for both of them the sequence order for surface reflectance in GPS L1 and L2 signals is as
follows: the total snow surface’s reflectance values are larger than both soil and ice surface’s
reflectance values during linear polarization. In circular polarization, the total reflectance of
cross-polarization and co-polarization for ice surface is greater than both soil and ice surface. For
example, for GPS L1 signal in total surface angle at 40°, the linear polarization convolution and
circular polarization convolution values for soil, snow and ice surfaces are respectively as follows: 4,
6, −2 and 6, 4, 8.5. The soil surface reflectance values in both linear and circular polarization
convolution functions are located between ice and snow surface’s reflectance values, as shown in
Figures 20 and 21.
4. Conclusions
The modeled surfaces including soil, snow and ice have special physical reflectivity and reflectance
characteristics in interacting with GPS L1 and L2 signals. It is necessary to consider both physical
reflectivity and reflectance characteristics when we deal with GPS-Reflectometry applications, such as
snow depth or height and ice thickness measurements. Since in physical reflectivity, the GPS antenna
height and satellite elevation angle have maximum effect on variability of GPS reflected signals, the
role of satellite elevation angle variations on multipath variability is more significant especially when
the physical surface formation surrounding the ground GPS station receiver is changing during the
certain time span. In fact, the variability of multipath signature depends critically on satellite elevation
angle variations rather than the GPS antenna height, while the GPS antenna height variations are being
caused mostly by snow accumulation or ice melting, particularly in snow-covered ground and
permafrost at high latitudes.

Remote Sens. 2013, 5 4028
In regards to surface reflectance characteristics, the Brewster angle is the intersection point of linear
vertical and horizontal polarization plots. Since GPS antenna receives RHCP signals mostly, the
co-polarized signal in circular polarization is analogous to RHCP polarization. Additionally, in
polarization convolution functions and integrals, the phase change point occurs at 90 degrees. This is
where the general trend before and after 90 degrees is completely, symmetrically mirrored. The soil
surface reflectance values are located between snow surface and ice surface ones (see Figures 20 and 21).
Accordingly, the different surface reflectance values in linear polarization and circular polarization
(co-polarization and cross-polarization) between snow surface and ice surface are noteworthy and can
be computed precisely (for both GPS L1 and L2 signals). Therefore, in cryosphere studies such as
snow depth and ice thickness measurements using GPS-Reflectometry technique, the different surface
reflectance values for linear and circular polarizations among soil, snow and ice play a critical role in
discriminating soil, snow and ice surfaces from each other. This discrimination between surfaces can
be improved by considering the physical reflectivity of GPS scattered and reflected signals based on
satellite elevation angle and GPS antenna height variations (see Figures 4–9).
In the future, further studies and practical case tests related to the surface physical reflectivity and
polarization characteristics are needed in order to better understand the behavior of the targeted
surfaces in interacting with GPS signals. This can be assessed by considering also the complicated
conditions, such as the slope of the surfaces and the density variability of scattered and reflected
signals for different GPS receivers.
Acknowledgments
The authors are greatly thankful to the reviewers and editors for their constructive comments and useful
suggestions to improve the manuscript. This research is supported by Main Direction Project of Chinese
Academy of Sciences (Grant No. KJCX2-EW-T03), Shanghai Science and Technology Commission
Project (Grant No. 12DZ2273300), Shanghai Pujiang Talent Program Project (Grant No. 11PJ1411500)
and National Natural Science Foundation of China (NSFC) Project (Grant No. 11173050).
Conflict of Interest
The authors declare no conflict of interest.
References
1. Jin, S.G.; Komjathy, A. GNSS reflectometry and remote sensing: New objectives and results.
Adv. Space Res. 2010, 46, 111–117.
2. Jin, S.G.; Feng, G.; Gleason, S. Remote sensing using GNSS signals: Current status and future
directions. Adv. Space Res. 2011, 47, 1645–1653.
3. Chappell, A.; Zobeck, T.M.; Brunner, G. Using bi-directional soil spectral reflectance to model
soil surface changes induced by rainfall and wind-tunnel abrasion. Remote Sens. Environ. 2006,
102, 328–343.
4. Xu, D.Q.; Ni, G.Q.; Jiang, L.L.; Shen, Y.T.; Li, T.; Ge, S.L.; Shu, X.B. Exploring for natural gas
using reflectance spectra of surface soils. J. Adv. Space Res. 2008, 41, 1800–1817.

Remote Sens. 2013, 5 4029
5. Maignan, F.; Breon, F.M.; Fedele, E.; Bouvier, M. Polarized reflectances of natural surfaces:
Spaceborne measurements and analytical modeling. Remote Sens. Environ. 2009, 113, 2642–2650.
6. Helm, A.; Stosius, R.; Montenbruck, O.; Asjaee, J.; Yudanov, S.; Beyerle, G.; Rothacher, M.
The GITEWS GNSS Occultation, Reflectometry and Scatterometry Space Receiver GORS. In
Proceedings of GITEWS Workshop on New Earth Observation Techniques for Tsunami
Detection and Geohazard Monitoring, Jakarta, Indonesia, 26–28 November 2007.
7. Hannah, B.M. Modeling and Simulation of GPS Multipath Propagation. Ph.D. Thesis, the
Cooperative Centre for Satellite Systems, Queensland University of Technology, Kelvin Grove,
QLD, Australia, 2001.
8. Litvinov, P.; Hasekamp, O.; Dubovik, O.; Cairns, B. Model for land surface reflectance treatment:
Physical derivation, application for bare soil and evaluation on airborne and satellite
measurements. J. Quant. Spectrosc. Radiat. 2012, 113, 2023–2039.
9. Chew, C.C.; Small, E.E.; Larson, K.M.; Zavorotny, V.U. Effects of near-surface soil moisture on
GPS SNR data: Development of a retrieval algorithm for soil moisture. IEEE Trans. Geosci.
Remote Sens. 2013, 9, 1–7.
10. Elosegui, P.; Davis, J.L.; Jaldehag, R.K.; Johansson, J.M.; Niell, A.E.; Shapiro, B. Geodesy
using the global positioning system: The effects of signal scattering. J. Geophys. Res. 1995, 100,
9921–9934.
11. Ray, J.K.; Cannon, M.E. Mitigation of static carrier-phase multipath effects using multiple closely
spaced antennas. Navigation 1999, 46, 193–201.
12. Bakshi, U.A.; Bakshi, A.V. Unit 3: Electric and Magnetic Fields in Materials. In Electromagnetic
Fields; Technical Publications Pune: Pune, India, 2010; pp. 3–70.
13. Mott, H. Representation of Wave Polarization. In Polarization in Antennas and Radar, 1st ed.;
Wiley-Interscience: New York, NY, USA, 1986; pp. 54–280.
14. Lakhtakia, A. General schema for the Brewster conditions. Optik 1992, 90, 184–186.
15. Hecht, E. Electromagnetic Properties of Light. In Optics, 4th ed.; Addison-Wesley: Boston, MA,
USA, 2002; pp. 263–520.
16. Litvinov, P.; Hasekamp, O.; Cairns, B. Models for surface reflection of radiance and polarized
radiance: Comparison with airborne multi-angle photopolarimetric measurements and implications
for modeling top-of-atmosphere measurements. Remote Sens. Environ. 2011, 115, 781–792.
17. Kopp, M. Electrical conductivity of the snow (In French). J. Appl. Math. Phys. 1962, 13,
431–444.
18. Evans, S. Dielectric properties of ice and snow—A review. J. Glaciol. 1965, 5, 773–792.
19. ITU. Electrical Characteristics of the Surface of the Earth; Recommendation (ITU-Report) P.527–3;
ITU: Geneva, Switzerland, 1992; pp. 1–5.
20. Van Nee, R.D.J. Multipath effects on GPS code phase measurements. Navigation 1992, 39, 177–190.
21. Kleusberg, A.; Teunissen, P.J.G. 3. Propagation of the GPS Signals. In GPS for Geodesy;
Springer-Verlag: Berlin/Heidelberg, Germany, 1996; pp. 103–140.
22. Balvedi, G.C.; Walter, F. Analysis of GPS Signal Propagation in Tropospheric Ducts Using
Numerical Methods. In Proceedings of 11th URSI Commission Open Symposium on Radio Wave
Propagation and Remote Sensing Proceedings, Rio De Janeiro, RJ, Brazil, 30 October–2
November 2007.

Remote Sens. 2013, 5 4030
23. Vickerman, J.C.; Gilmore, I.S. Surface Structure Determination by Interference Techniques. In
Surface Analysis—The Principal Techniques, 2nd ed.; John Wiley and Sons Ltd.: Chichester, UK,
2009; Chapter 8; pp. 391–478.
24. Leroux, C.; Deuze, J.L.; Goloub, P.; Sergent, C.; Fily, M. Ground measurements of the polarized
bidirectional reflectance of snow in the near-infrared spectral domain: Comparisons with model
results. J. Geophys. Res. 1998, 103, 19721–19731.
25. Bracewell, R. The Fourier Transform and its Applications, 2nd ed.; McGraw-Hill: New York,
NY, USA, 1986; pp. 1–474.
26. Torrance, K.E.; Sparrow, E.M. Theory for off-specular reflection from roughened surfaces.
J. Opt. Soc. Amer. 1967, 57, 1105–1112.
27. Salminena, M.; Pulliainen, J.; Metsamaki, S.; Kontu, A.; Suokanerva, H. The behavior of snow
and snow-free surface reflectance in boreal forests: Implications to the performance of snow
covered area monitoring. Remote Sens. Environ. 2009, 113, 907–918.
© 2013 by the authors; licensee MDPI, Basel, Switzerland. This article is an open access article
distributed under the terms and conditions of the Creative Commons Attribution license
(http://creativecommons.org/licenses/by/3.0/).