Physical and chemical factors controlling mercury and methylmercury concentrations in stream water...
25
Physical and chemical factors controlling mercury and methylmercury concentrations in stream water Mark E. Brigham and Dennis A. Wentz 5 th National Monitoring Conference San José, California May 7-11, 2006 U.S. Department of the Interior U.S. Geological Survey
-
Upload
michael-luke-lloyd -
Category
Documents
-
view
215 -
download
2
Transcript of Physical and chemical factors controlling mercury and methylmercury concentrations in stream water...

Physical and chemical factors controlling mercury and methylmercury concentrations in stream water
Mark E. Brigham and Dennis A. Wentz
5th National Monitoring ConferenceSan José, CaliforniaMay 7-11, 2006
U.S. Department of the InteriorU.S. Geological Survey

Willamette Basin
Georgia-Florida Coastal Plain
Western Lake Michigan
Drainages
Reference stream
Urban stream
USGS NAWQA mercury study areas

Aqueous methylmercury (MeHg) is a major control on mercury bioaccumulation.
Mean Hg in
forage fish
(μg/g wet wt.)
N ≈ 24 at each site
(2 species x 12 individuals)
R2 = 0.8418
0.00
0.05
0.10
0.15
0.20
0.0 0.1 0.2 0.3 0.4 0.5
Mean aqueous MeHg (ng/L)
N ≈ 35 at each site

What controls aqueous MeHg (and THg) concentrations in
streams?
• Weight-of-evidence approach to assess: – Atmospheric inputs– Watershed processes (methylation
and subsequent delivery to stream)– Methylation in channel sediments

Simplified mass balance
Watershed soils: storage / runoff
methylationdemethylation
fluvial transport
Wet deposition
Channel sediments: storage / resuspension
methylation demethylation
Evasion (Hg°)Dry
deposition
resuspension

Wet Hg & MeHg deposition: Mercury Deposition Network (MDN) sites
Load:
∑ (weekly [Hg] x precip volume),
expressed as μg/m2/yr

Hg in precipitation Popple River, WI site (WI09—Mercury Deposition Network)
Oct
‘02
Jan
’03
Jan
’04
Jan
’05

Methylmercury (MeHg) and total mercury (THg) in stream water
• ~35 samples per site from 2003-05
• Key measure of food-web exposure
• Key component of mass balance

Mercury in stream water: sample processing
0.7 μm QFF
Whole waterMeHgTHg
ParticulatePMeHgPTHg
FilteredFMeHgFTHg
===
+++
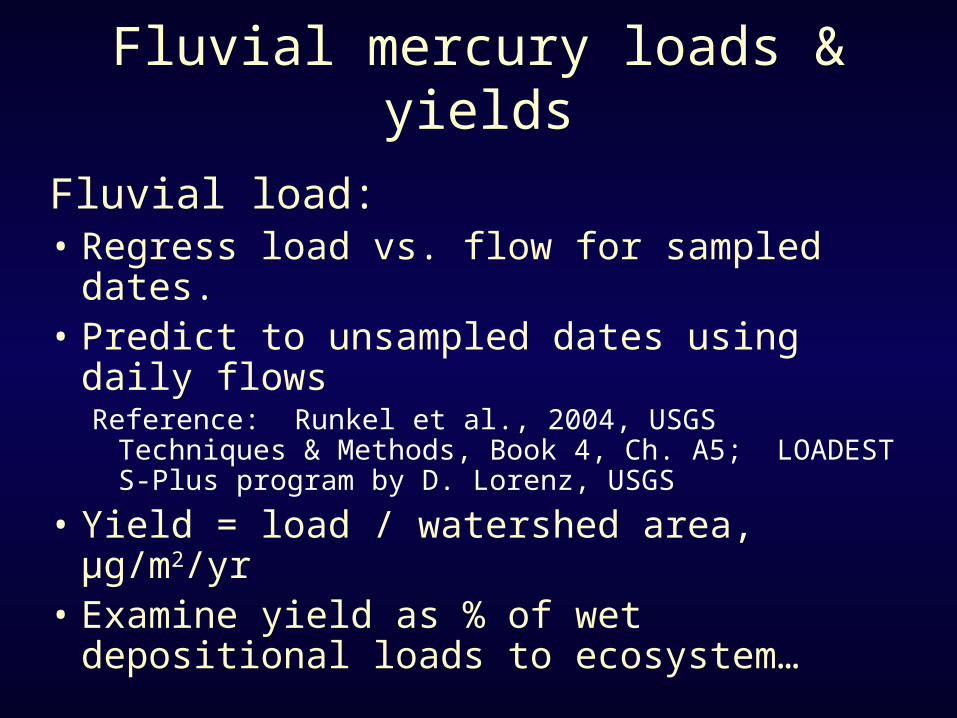
Fluvial mercury loads & yields
Fluvial load: • Regress load vs. flow for sampled dates.• Predict to unsampled dates using daily
flows Reference: Runkel et al., 2004, USGS Techniques &
Methods, Book 4, Ch. A5; LOADEST S-Plus program by D. Lorenz, USGS
• Yield = load / watershed area, μg/m2/yr• Examine yield as % of wet depositional
loads to ecosystem…

MeHg deposition unrelated to MeHg yield
0
100
200
300
400
500
600
700
800
900
1000
OR-Urb
OR-Ref
-L
WI-R
ef-H
WI-R
ef-L
WI-U
rb
FL-Ref
-H
FL-Ref
-L
FL-UrbF
luvi
al y
ield
as
% o
f w
et d
ep l
oad
200
3-04
*
THg yield: 4.4–48% of wet deposition
MeHg yield: 22–926 % of wet deposition (excludes site where MeHg < MDL*)
*

Florida
Wisconsin
Oregon
THg yield vs precip Hg deposition, 2003-2004
1:10 line
WI09Pike
OR10Lookout WI22
Oak
FL32LWekiva
GA09 StMary
FL05Santa Fe
OR01Beaverton
WI32Evergreen
0
1
2
3
4
5
6
7
0 5 10 15 20Precip THg load, micrograms/m2/yr, 2004
Flu
via
l T
Hg
yie
ld, u
g/m
2/y
rF
luvi
al T
Hg
yiel
d, μ
g/m
2 /yr
Wet THg deposition, μg/m2/yr, 2003-04
Urban
Reference

Summary of partial mass balance
• Wet MeHg deposition could account for MeHg in most streams– low [MeHg] streams.
• Caveat—Missing key components of mass balance– watershed retention– demethylation– dry deposition
• Must invoke watershed methylation to explain high [MeHg] streams.

Aqueous total Hg and methylmercury correlate strongly to dissolved organic carbon (DOC):
• among all sites (shown here)• within a site (most sites)
Log 1
0 [
FM
eHg]
(ng
/L)
Log 1
0 [
FT
Hg]
(ng
/L)
Log10 [DOC] (mg/L) Log10 [DOC] (mg/L)Log10 [DOC] (mg/L)

Runoff-mobilized Hg-DOC complexes controls: -- THg in most streams -- MeHg in half the study streams.
Evidence for watershed inputs of MeHg
Evidence against in-channel methylation as dominant source
Santa Fe River, Florida
Log10 [Q] (cfs)
Log 1
0 [
FT
Hg]
(ng
/L)
Log 1
0 [
FM
eHg]
(ng
/L)

Negative relation between MeHg and flow?
Evidence for in-channel methylation?
Or, high [MeHg] in wetlands during low-flow periods?
St Mary’s River, Florida
Log10 [Q] (cfs)
Log 1
0 [
FT
Hg]
(ng
/L)
Log 1
0 [
FM
eHg]
(ng
/L)

Aqueous methylmercury strongly linked to wetland density (mean methylmercury; all study sites)
R2 = 0.9224
0.00
0.05
0.10
0.15
0.20
0.25
0.30
0.35
0.40
0.45
0 10 20 30 40 50 60
Wetland density (% of total land cover in basin)
FMH
g (
ng/L
)
Log 1
0 T
Hg
conc
entr
atio
n (n
g/L)
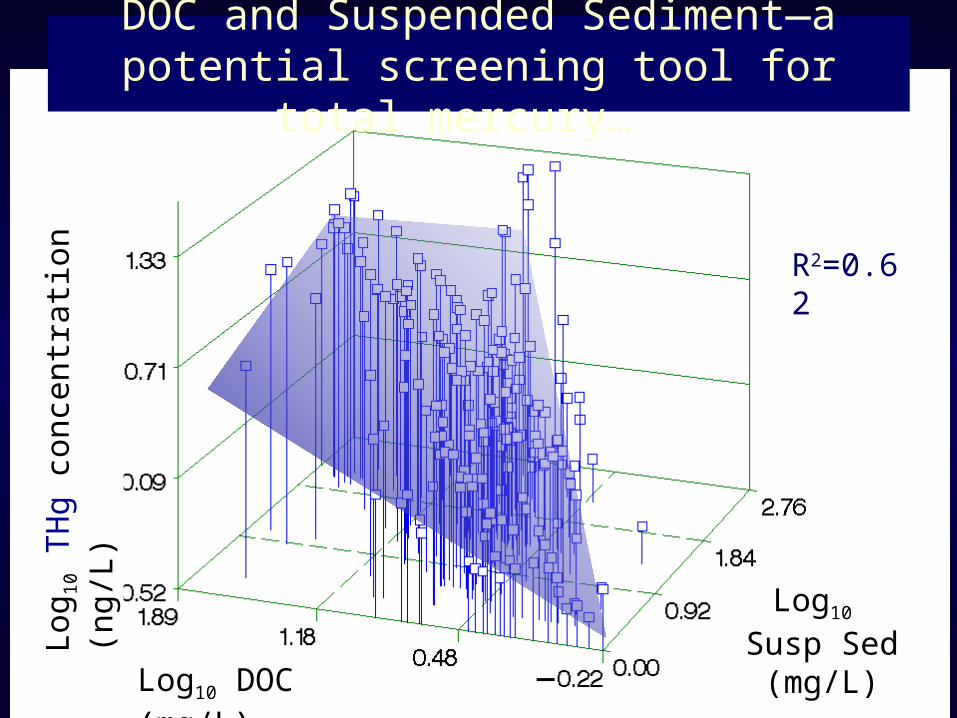
DOC and Suspended Sediment—a potential screening tool for total mercury…
R2=0.62
Log10 DOC (mg/L)
Log10 Susp Sed
(mg/L)

…and methylmercury.Lo
g 10 M
eHg
conc
entr
atio
n (n
g/L)
Log10 DOC (mg/L)
Log10 Susp Sed
(mg/L)

What have we learned about THg and MeHg in streams?

Summary
Precipitation and watershed influences
• Precipitation inputs– main source of THg to ecosystem– Could account for all MeHg in
some streams• Watershed inputs
– major vector for MeHg and THg delivery to streams, particularly in wetland-rich basins

Summary
Concentration relationships
• DOC and suspended sediment– Control THg & MeHg in streams
(MeHg picture is noisier)– key explanatory variables– perhaps a useful screening tool– Erosion control—useful to reduce
particulate Hg, and hence THg

Summary
Role of channel sediments
• MeHg source? – At most, a minor source of MeHg to
stream water– Low MeHg at low flow (evidence
against substantial inputs from sediments)…
– …except at one site (either sediment methylation or seasonally high MeHg from wetlands)
• MeHg sink? – Fast demethylation rates in sand, a
dominant substrate in some streams

Implications for monitoring THg & MeHg in streams
• Sample size (N)—depends on objectives…– BAF’s: Perhaps as few as N ≈ 6, well
spaced seasonally (see: Paller and others, 2004, Archives of Environ. Contam. & Toxicology)
– Concentration relationships & fluvial loads: N ≥ 35, well spaced seasonally and hydrologically

Acknowledgements
USGS: Dennis Wentz, Barb Scudder, Lia Chasar, Amanda Bell, Michelle Lutz, Dave Krabbenhoft, Mark Marvin-DiPasquale, George Aiken, Robin Stewart, Carol Kendall, Bill Orem, Rod DeWeese, Jeff Isely, and many others…
USGS: NAWQA and several other USGS programs
MDN site support: USGS, Wisconsin DNR, Oregen DEQ, Forest Service, US Fish & Wildlife Service, St. John’s River Water Management District (FL)
Menomonie Indian Tribe of Wisconsin