Phylogeography of Pinus subsection Australes in the ...
13
Phylogeography of Pinus subsection Australes in the Caribbean Basin Lev Jardo ´n-Barbolla 1, *, Patricia Delgado-Valerio 2 , Gretel Geada-Lo ´pez 3 , Alejandra Va ´zquez-Lobo 1 and Daniel Pin ˜ ero 1 1 Departamento de Ecologı ´a Evolutiva, Instituto de Ecologı ´a, Universidad Nacional Auto ´noma de Me ´xico (UNAM), Apartado Postal 70-275, Mexico D.F. 04510, Mexico, 2 Facultad de Agrobiologı ´a ‘Presidente Jua ´rez’, Universidad Michoacana de San Nicola ´s de Hidalgo, Av. Revolucio ´n esquina con Berlı ´n S/N, CP 60091, Uruapan, Michoaca ´n, Me ´xico and 3 Departamento de Biologı ´a, Universidad de Pinar del Rı ´o, Martı ´ 270 esquina con 27 de Noviembre, CP 20100, Ciudad de Pinar del Rı ´o, Pinar del Rı ´o, Cuba * For correspondence. E-mail [email protected] or [email protected] Received: 19 April 2010 Returned for revision: 26 July 2010 Accepted: 27 October 2010 Published electronically: 29 November 2010 † Background and Aims Four species of Pinus subsection Australes occur in the Caribbean Basin: P. caribaea, P. cubensis, P. maestrensis and P. occidentalis. This study analyses the phylogeography of these species to assess possible colonization events from Central America to the islands and subsequent population expansions during glacial periods driven by both drier climate and larger emerged land areas. † Methods Allele size data were obtained for plastid microsatellites for 314 individuals from 24 populations, cov- ering the distribution range of subsection Australes in the Caribbean Basin. † Key Results In total, 113 plastid haplotypes were identified. The highest genetic diversity was found in popu- lations of P. caribaea. Overall, Caribbean Basin populations fit the isolation by distance model. Significant phylogeographical structure was found (R ST ¼ 0 . 671 . permuted R ST ¼ 0 . 101; P , 0 . 0001). The haplotype network and a Bayesian analysis of population structure (BAPS) indicated different Central American origins for P. caribaea var. bahamensis and P. caribaea var. caribaea plastids, with Central America populations in north- ern and south-eastern groups. Sudden expansion times for BAPS clusters were close to three glacial maxima. † Conclusions Central America contains ancestral plastid haplotypes. Population expansion has played a major role in the distribution of genetic diversity in P. caribaea var. hondurensis. Two colonization events gave rise to the P. caribaea var. bahamensis and P. caribaea var. caribaea lineages. Plastid variation in the eastern species (P. cubensis, P. maestrensis and P. occidentalis) evolved independently from that in P. caribaea var. caribaea. Incomplete lineage sorting between P. cubensis and P. maestrensis is apparent. Inferred expansion times for P. caribaea var. bahamensis and for the eastern lineages correspond to glacial maxima, whereas those for P. caribaea var. hondurensis correspond to the beginning of the temperature decrease that led to Marine Isotope Stage 8. Key words: Caribbean Basin, historical demography, phylogeography, Pinus, plastid microsatellites, population genetics, subsection Australes. INTRODUCTION Pinus subsection Australes (Pinaceae) is a monophyletic group of pines (Gernandt et al., 2005, 2008) occurring in North America, Mexico, Central America and the western Caribbean islands. Four taxa of subsection Australes are found from low savannah to mountain regions in the Caribbean Basin (Farjon and Styles, 1997): P. caribaea, P. cubensis, P. maestrensis and P. occidentalis. The savannah lowlands in the west of the Caribbean Basin are dominated by the three varieties of Pinus caribaea: var. hondurensis (Central America), var. caribaea (western Cuba and Isla de la Juventud) and var. bahamensis (Bahamas and Turks & Caicos Islands). Among the three varieties, mature trees exhibit only slight morphological differences (Barrett and Golfari, 1962; Farjon and Styles, 1997). Although the population genetics and distribution of P. caribaea have been well studied (Dvorak et al., 2000, 2005), there are no studies using molecular markers that include all three varieties throughout their natural range. Two allopatric taxa, P. cubensis and P. maestrensis, are found in the eastern mountains of Cuba. Some authors (Farjon and Styles, 1997) have treated P. maestrensis as a synonym of P. cubensis, whereas others (Lo ´pez-Almirall, 1982) have con- sidered them to be separate species. An analysis of ovulate cone morphology characters by Adams and Jackson (1997) retrieved P. cubensis and P. caribaea as sister groups but a pos- terior phylogenetic analysis of plastid DNA (Geada-Lo ´pez et al., 2002) recovered P. cubensis and P. maestrensis as sister groups. According to Gernandt et al. (2005), P. cubensis is closely related to P. occidentalis, an endemic species from the mountains of Hispaniola. In Cuba, P. cubensis is distributed throughout the Sierra Nipe-Cristal and P. maestrensis inhabits the Sierra Maestra. P. occidentalis is found in the mountains of Hispaniola. Slight morphological differences among the three varieties of P. caribaea suggest that they diverged recently (estimated divergence time for subsection Australes is 6 Myr BP; Gernandt et al., 2008) and/or suggest gene flow between the continent and the islands. In contrast, morphological # The Author 2010. Published by Oxford University Press on behalf of the Annals of Botany Company. All rights reserved. For Permissions, please email: [email protected] Annals of Botany 107: 229–241, 2011 doi:10.1093/aob/mcq232, available online at www.aob.oxfordjournals.org at University of Wisconsin Madison - General Library System on November 17, 2011 http://aob.oxfordjournals.org/ Downloaded from
Transcript of Phylogeography of Pinus subsection Australes in the ...
Phylogeography of Pinus subsection Australes in the Caribbean Basin
Lev Jardon-Barbolla1,*, Patricia Delgado-Valerio2, Gretel Geada-Lopez3, Alejandra Vazquez-Lobo1
and Daniel Pinero1
1Departamento de Ecologıa Evolutiva, Instituto de Ecologıa, Universidad Nacional Autonoma de Mexico (UNAM), ApartadoPostal 70-275, Mexico D.F. 04510, Mexico, 2Facultad de Agrobiologıa ‘Presidente Juarez’, Universidad Michoacana de San
Nicolas de Hidalgo, Av. Revolucion esquina con Berlın S/N, CP 60091, Uruapan, Michoacan, Mexico and 3Departamentode Biologıa, Universidad de Pinar del Rıo, Martı 270 esquina con 27 de Noviembre, CP 20100, Ciudad de Pinar del Rıo,
Pinar del Rıo, Cuba* For correspondence. E-mail [email protected] or [email protected]
Received: 19 April 2010 Returned for revision: 26 July 2010 Accepted: 27 October 2010 Published electronically: 29 November 2010
† Background and Aims Four species of Pinus subsection Australes occur in the Caribbean Basin: P. caribaea,P. cubensis, P. maestrensis and P. occidentalis. This study analyses the phylogeography of these species to assesspossible colonization events from Central America to the islands and subsequent population expansions duringglacial periods driven by both drier climate and larger emerged land areas.† Methods Allele size data were obtained for plastid microsatellites for 314 individuals from 24 populations, cov-ering the distribution range of subsection Australes in the Caribbean Basin.† Key Results In total, 113 plastid haplotypes were identified. The highest genetic diversity was found in popu-lations of P. caribaea. Overall, Caribbean Basin populations fit the isolation by distance model. Significantphylogeographical structure was found (RST¼ 0.671 . permuted RST¼ 0.101; P , 0.0001). The haplotypenetwork and a Bayesian analysis of population structure (BAPS) indicated different Central American originsfor P. caribaea var. bahamensis and P. caribaea var. caribaea plastids, with Central America populations in north-ern and south-eastern groups. Sudden expansion times for BAPS clusters were close to three glacial maxima.† Conclusions Central America contains ancestral plastid haplotypes. Population expansion has played a majorrole in the distribution of genetic diversity in P. caribaea var. hondurensis. Two colonization events gave riseto the P. caribaea var. bahamensis and P. caribaea var. caribaea lineages. Plastid variation in the easternspecies (P. cubensis, P. maestrensis and P. occidentalis) evolved independently from that in P. caribaea var.caribaea. Incomplete lineage sorting between P. cubensis and P. maestrensis is apparent. Inferred expansiontimes for P. caribaea var. bahamensis and for the eastern lineages correspond to glacial maxima, whereasthose for P. caribaea var. hondurensis correspond to the beginning of the temperature decrease that led toMarine Isotope Stage 8.
Key words: Caribbean Basin, historical demography, phylogeography, Pinus, plastid microsatellites, populationgenetics, subsection Australes.
INTRODUCTION
Pinus subsection Australes (Pinaceae) is a monophyletic groupof pines (Gernandt et al., 2005, 2008) occurring in NorthAmerica, Mexico, Central America and the westernCaribbean islands. Four taxa of subsection Australes arefound from low savannah to mountain regions in theCaribbean Basin (Farjon and Styles, 1997): P. caribaea,P. cubensis, P. maestrensis and P. occidentalis.
The savannah lowlands in the west of the Caribbean Basinare dominated by the three varieties of Pinus caribaea: var.hondurensis (Central America), var. caribaea (western Cubaand Isla de la Juventud) and var. bahamensis (Bahamas andTurks & Caicos Islands). Among the three varieties, maturetrees exhibit only slight morphological differences (Barrettand Golfari, 1962; Farjon and Styles, 1997). Although thepopulation genetics and distribution of P. caribaea havebeen well studied (Dvorak et al., 2000, 2005), there are nostudies using molecular markers that include all three varietiesthroughout their natural range.
Two allopatric taxa, P. cubensis and P. maestrensis, are foundin the eastern mountains of Cuba. Some authors (Farjon andStyles, 1997) have treated P. maestrensis as a synonym ofP. cubensis, whereas others (Lopez-Almirall, 1982) have con-sidered them to be separate species. An analysis of ovulatecone morphology characters by Adams and Jackson (1997)retrieved P. cubensis and P. caribaea as sister groups but a pos-terior phylogenetic analysis of plastid DNA (Geada-Lopezet al., 2002) recovered P. cubensis and P. maestrensis as sistergroups. According to Gernandt et al. (2005), P. cubensis isclosely related to P. occidentalis, an endemic species from themountains of Hispaniola. In Cuba, P. cubensis is distributedthroughout the Sierra Nipe-Cristal and P. maestrensis inhabitsthe Sierra Maestra. P. occidentalis is found in the mountainsof Hispaniola.
Slight morphological differences among the three varietiesof P. caribaea suggest that they diverged recently (estimateddivergence time for subsection Australes is 6 Myr BP;Gernandt et al., 2008) and/or suggest gene flow between thecontinent and the islands. In contrast, morphological
# The Author 2010. Published by Oxford University Press on behalf of the Annals of Botany Company. All rights reserved.
For Permissions, please email: [email protected]
Annals of Botany 107: 229–241, 2011
doi:10.1093/aob/mcq232, available online at www.aob.oxfordjournals.org
at University of W
isconsin Madison - G
eneral Library System
on Novem
ber 17, 2011http://aob.oxfordjournals.org/
Dow
nloaded from
differences have permitted the distinction of three species(P. cubensis, P. maestrensis and P. occidentalis) in easternCuba and Hispaniola. These eastern species share ecologicalaffinities, such as higher altitude distributions, more humidhabitats and less invasive capability, differing in these charac-teristics from P. caribaea (Lopez-Almirall, 1982). Thissuggests that eastern species have evolved separately fromP. caribaea and that gene flow between the eastern andwestern areas of the basin has been restricted.
The present distribution of genetic variation in natural popu-lations of a species or a set of recently diverged species is theresult of current and past processes, including gene flow andintrogression, population expansion, fragmentation, bottle-necks, changes in distribution ranges and common ancestryrelationships (Cruzan and Templeton, 2000; Templeton,2004; Avise, 2009). Plastids are paternally inherited in pines(Chen et al., 2002) and are more sensitive to genetic driftdue to lower effective population size. The high degree ofpolymorphism of plastid simple sequence repeats (plastidSSRs; Vendramin et al., 1996) has proved useful in elucidatingthe genetic structure and recent phylogeographical historyof populations (Cuenca et al., 2003; Afzal-Rafii andDodd, 2007; Bucci et al., 2007; Delgado et al., 2007;Rodrıguez-Banderas et al., 2009). These markers are also suit-able for studies of past demographic expansions, such as thoseoccurring after colonization events (Navascues et al., 2006).High mutation rates like those found in plastid SSRs (Provanet al., 1999) also permit the analysis of more recent populationprocesses such as recent divergence and gene flow (Kuhner,2009). Plastid markers have also been used to reveal cryptichybridization in pines (Jasinska et al., 2010).
The interaction of four tectonic plates formed the CaribbeanBasin during the Tertiary (Pindell et al., 2006). At approxi-mately 35 Mya the Greater Antilles and the Bahamasbecame completely separated from Central and NorthAmerica (Iturralde-Vinent, 2006; Pindell et al., 2006). Thisgeological event probably preceded the arrival of the genusPinus in southern Mexico (21 Mya; Graham, 1999). In therecent palaeogeography of the region, major changes in sealevel have been important processes, particularly duringglacial periods when a larger area of the main islands wasabove sea level, but there was no connection among them orwith the continent (Iturralde-Vinent, 2006).
The position of Cuba and Hispaniola with respect to thenearby continental masses has remained almost unchangedfor the past 10 Myr (Iturralde-Vinent, 2006). The Bahamasemerged more recently, during the Pleistocene (1.9 Mya)(Pindell et al., 2006) and the low level of endemism therehas been explained as a result of the recent arrival of mostof its flora and fauna (Trejo-Torres and Ackerman, 2001;Ricklefs and Bermingham, 2008).
Meanwhile there has been continuous land between Hondurasand North America since the Miocene (23 Mya; Iturralde-Vinent,2006; Pindell et al., 2006). The floristic composition of theCaribbean Basin, particularly the Great Antilles, suggests animportant contribution from Central America (Lavin et al.,2003; Negron-Ortiz and Watson, 2003; Santiago-Valentın andOlmstead, 2003; Ricklefs and Bermingham, 2008). This is alsotrue for some animal species, for example the vertebrate genusIcterus (Omland et al., 1999).
Given that: (1) no land connection has existed between theislands and the continent for the last 30 Myr (Iturralde-Vinent,2006), (2) the Greater Antilles and the Bahamas are geologi-cally younger than Central America, (3) Central America hascontributed to the Greater Antilles biota and (4) the origin ofsubsection Australes is relatively recent (6 Mya; Gernandtet al., 2008), we would expect to find a pattern of colonizationof islands by pines from Central America via long-distancedispersal. Thus, we predict ancestral haplotypes and higherlevels of genetic diversity within populations of P. caribaeavar. hondurensis and that ancestors of the present Caribbeanpines arrived to the islands from Central America.
Here we analyse the distribution of genetic variation to inferthe main processes that have affected the distribution of plastidDNA lineages of pines of subsection Australes in theCaribbean Basin. We use information from seven polymorphicplastid SSRs to study the genetic structure of populations ofpines in subsection Australes in the Caribbean Basin. Theaims of our study were: (1) to infer patterns of colonizationof the Caribbean islands by pines of subsection Australesand to investigate whether genetic evidence suggests CentralAmerica as the origin of present island lineages; (2) to deter-mine the role of past fragmentation among populations; and(3) to characterize historical demographic patterns based ongenetic evidence collected across the entire distributionalrange of the different pine species in the Caribbean. We usethis information to test the hypothesis that Caribbean pinesarrived in the islands from Central America.
MATERIALS AND METHODS
Population sampling
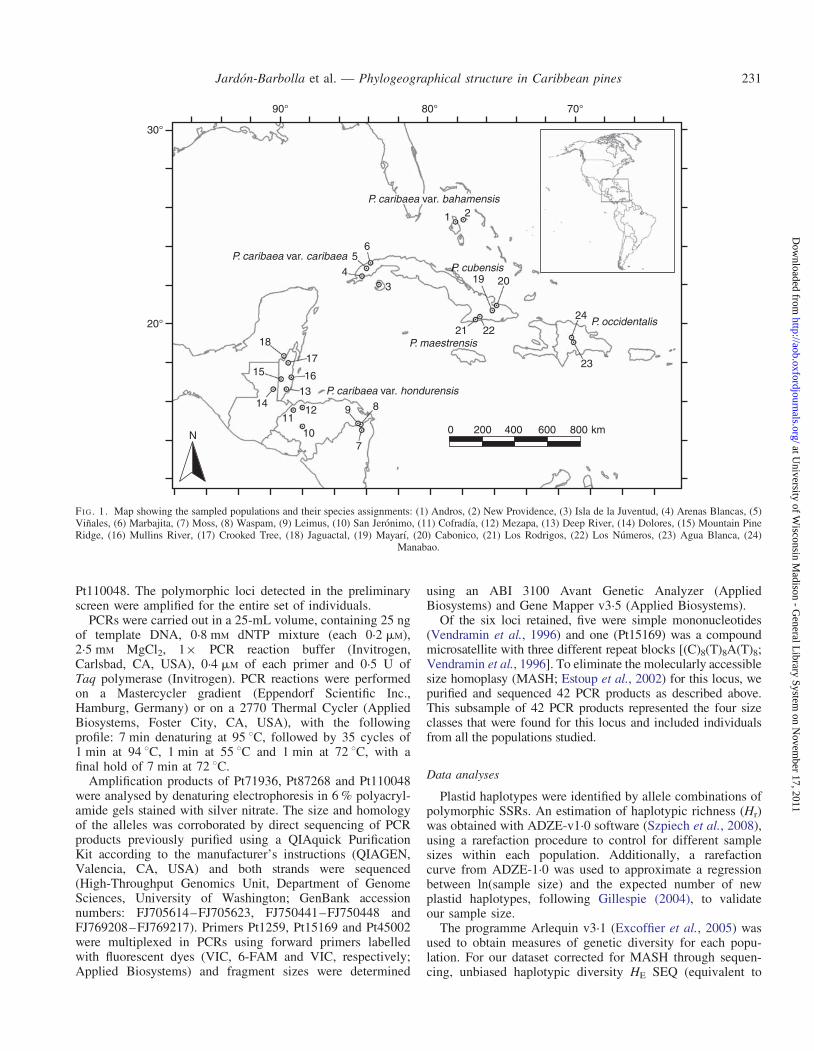
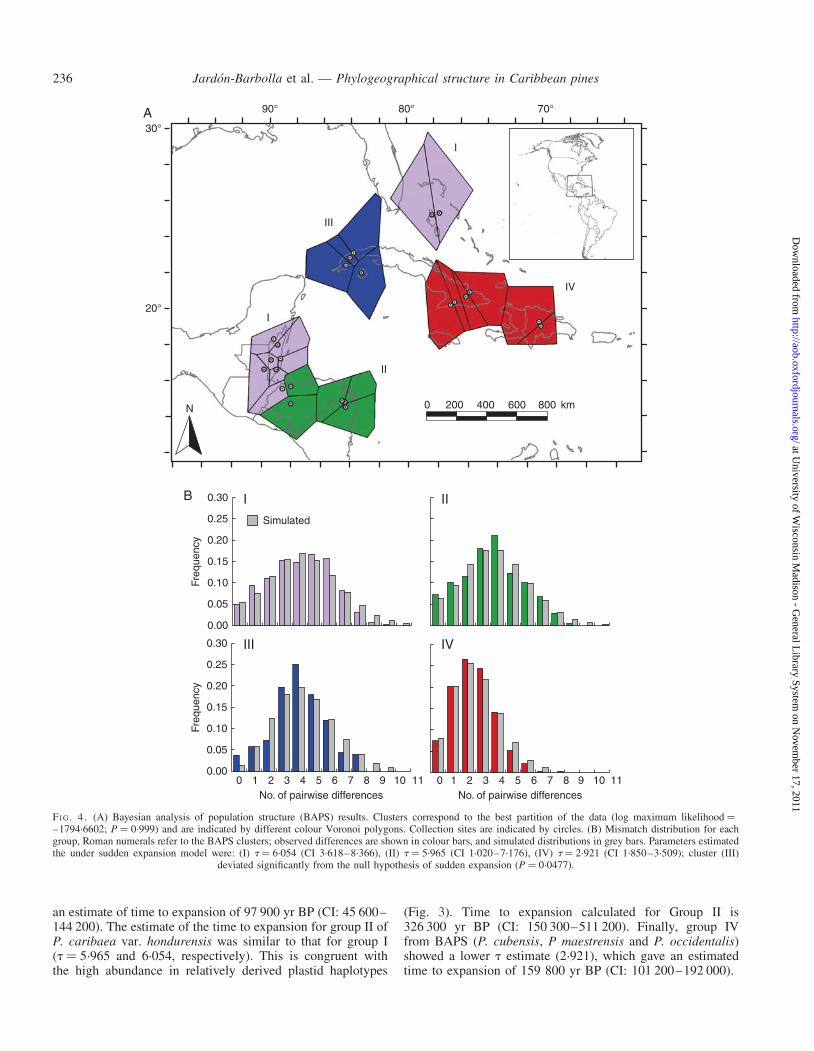
Leaf needles of the four different species of pines weresampled from Central America and the Caribbean islands.Needles were collected from six to 24 trees per populationin each of 24 sampled locations (shown in Fig. 1 andTable 1). Total sample size was 314 individuals. Treessampled within populations were separated by .50 m.National forest inventories were used to avoid sampling plan-tations. All locations corresponded to monospecific popu-lations, with the exception of that of Vinales, Cuba, whereP. caribaea var. caribaea and P. tropicalis, two distantlyrelated species, are sympatric. Geoposition and altitudes ateach collection site were measured using an eTrex Vistaglobal positioning system (Garmin, Taiwan).
DNA isolation, microsatellite amplification and size estimation
DNA was isolated using a modified cetyl trimethylammonium bromide (CTAB) protocol (Doyle and Doyle,1987) from 0.2–0.4 g of tissue. A preliminary screen for poly-morphic loci was carried out for 35 individuals using tenmicrosatellite primers (Vendramin et al., 1996), widely usedin phylogeographical and population genetics studies(Cuenca et al., 2003; Afzal-Rafii and Dodd, 2007; Bucciet al., 2007; Delgado et al., 2007; Rodrıguez-Banderaset al., 2009). Loci tested were Pt1254, Pt9383, Pt15169,Pt26081, Pt30204, Pt45002, Pt63718, Pt71936, Pt87268 and
Jardon-Barbolla et al. — Phylogeographical structure in Caribbean pines230
at University of W
isconsin Madison - G
eneral Library System
on Novem
ber 17, 2011http://aob.oxfordjournals.org/
Dow
nloaded from
Pt110048. The polymorphic loci detected in the preliminaryscreen were amplified for the entire set of individuals.
PCRs were carried out in a 25-mL volume, containing 25 ngof template DNA, 0.8 mM dNTP mixture (each 0.2 mM),2.5 mM MgCl2, 1× PCR reaction buffer (Invitrogen,Carlsbad, CA, USA), 0.4 mM of each primer and 0.5 U ofTaq polymerase (Invitrogen). PCR reactions were performedon a Mastercycler gradient (Eppendorf Scientific Inc.,Hamburg, Germany) or on a 2770 Thermal Cycler (AppliedBiosystems, Foster City, CA, USA), with the followingprofile: 7 min denaturing at 95 8C, followed by 35 cycles of1 min at 94 8C, 1 min at 55 8C and 1 min at 72 8C, with afinal hold of 7 min at 72 8C.
Amplification products of Pt71936, Pt87268 and Pt110048were analysed by denaturing electrophoresis in 6 % polyacryl-amide gels stained with silver nitrate. The size and homologyof the alleles was corroborated by direct sequencing of PCRproducts previously purified using a QIAquick PurificationKit according to the manufacturer’s instructions (QIAGEN,Valencia, CA, USA) and both strands were sequenced(High-Throughput Genomics Unit, Department of GenomeSciences, University of Washington; GenBank accessionnumbers: FJ705614–FJ705623, FJ750441–FJ750448 andFJ769208–FJ769217). Primers Pt1259, Pt15169 and Pt45002were multiplexed in PCRs using forward primers labelledwith fluorescent dyes (VIC, 6-FAM and VIC, respectively;Applied Biosystems) and fragment sizes were determined
using an ABI 3100 Avant Genetic Analyzer (AppliedBiosystems) and Gene Mapper v3.5 (Applied Biosystems).
Of the six loci retained, five were simple mononucleotides(Vendramin et al., 1996) and one (Pt15169) was a compoundmicrosatellite with three different repeat blocks [(C)8(T)8A(T)8;Vendramin et al., 1996]. To eliminate the molecularly accessiblesize homoplasy (MASH; Estoup et al., 2002) for this locus, wepurified and sequenced 42 PCR products as described above.This subsample of 42 PCR products represented the four sizeclasses that were found for this locus and included individualsfrom all the populations studied.
Data analyses
Plastid haplotypes were identified by allele combinations ofpolymorphic SSRs. An estimation of haplotypic richness (Hr)was obtained with ADZE-v1.0 software (Szpiech et al., 2008),using a rarefaction procedure to control for different samplesizes within each population. Additionally, a rarefactioncurve from ADZE-1.0 was used to approximate a regressionbetween ln(sample size) and the expected number of newplastid haplotypes, following Gillespie (2004), to validateour sample size.
The programme Arlequin v3.1 (Excoffier et al., 2005) wasused to obtain measures of genetic diversity for each popu-lation. For our dataset corrected for MASH through sequen-cing, unbiased haplotypic diversity HE SEQ (equivalent to
N
P. caribaea var. caribaea
P. caribaea var. bahamensis
P. caribaea var. hondurensis
P. maestrensis
P. cubensis
P. occidentalis
6
1 2
5
43
18
20°
30°
90° 80° 70°
17
21 22
19
24
23
20
16
13
15
1411
12
10
9 8
0 200 400 600 800 km
7
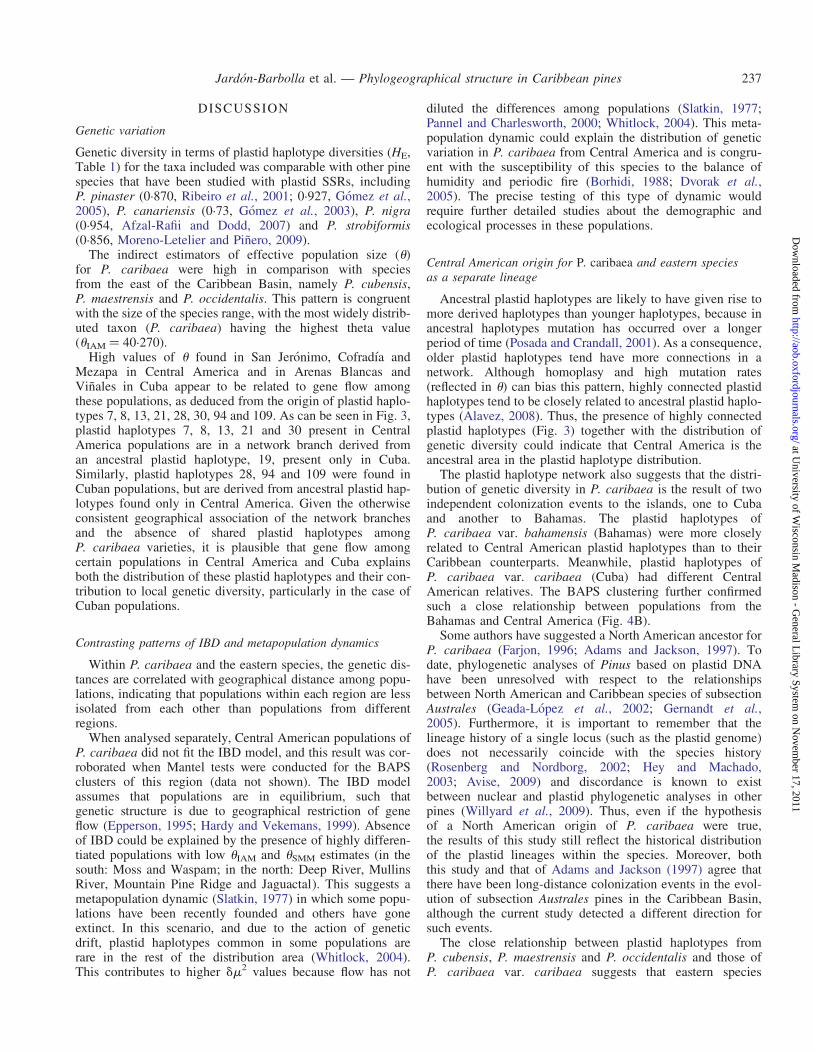
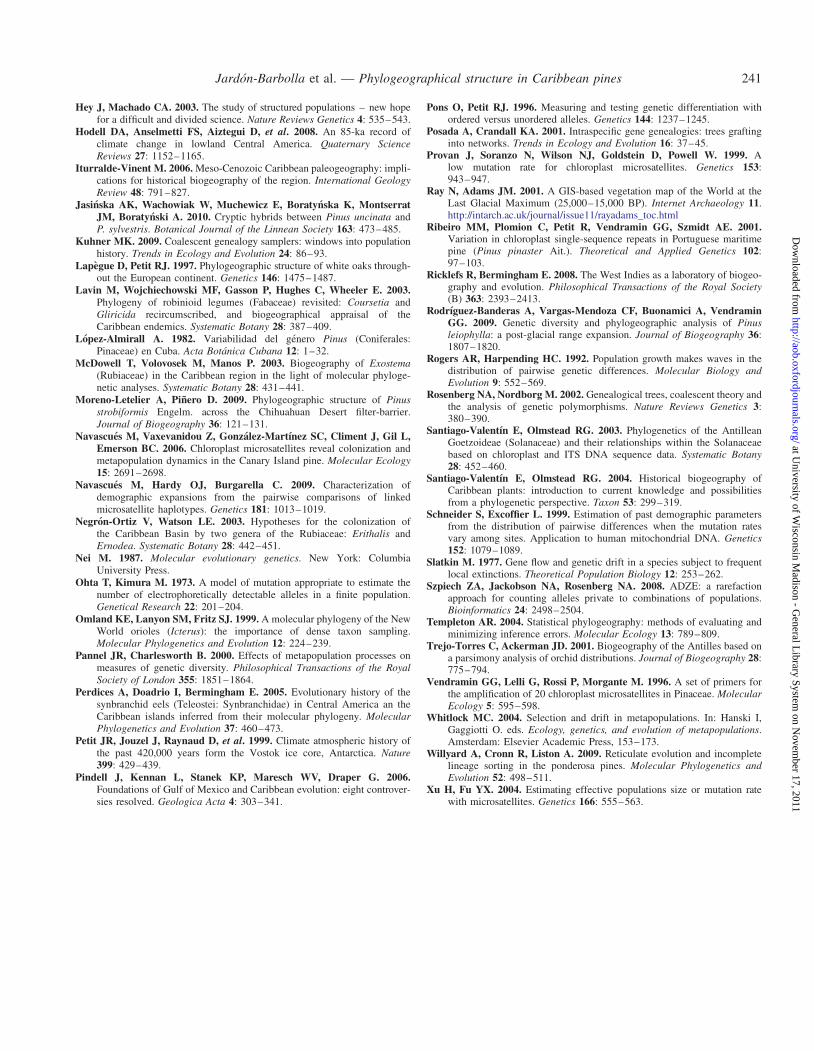
FI G. 1. Map showing the sampled populations and their species assignments: (1) Andros, (2) New Providence, (3) Isla de la Juventud, (4) Arenas Blancas, (5)Vinales, (6) Marbajita, (7) Moss, (8) Waspam, (9) Leimus, (10) San Jeronimo, (11) Cofradıa, (12) Mezapa, (13) Deep River, (14) Dolores, (15) Mountain PineRidge, (16) Mullins River, (17) Crooked Tree, (18) Jaguactal, (19) Mayarı, (20) Cabonico, (21) Los Rodrigos, (22) Los Numeros, (23) Agua Blanca, (24)
Manabao.
Jardon-Barbolla et al. — Phylogeographical structure in Caribbean pines 231
at University of W
isconsin Madison - G
eneral Library System
on Novem
ber 17, 2011http://aob.oxfordjournals.org/
Dow
nloaded from
HE for diploid data; Nei, 1987) was calculated. In addition, uwas estimated under the infinite allele model (IAM) and step-wise mutation model (SMM; Ohta and Kimura, 1973; Xu andFu, 2004) using Arlequin v3.1 (Excoffier et al., 2005) for ourdata corrected for MASH.
To discern whether data fitted the isolation by distancemodel (IBD) among populations, a Mantel test (10 000 permu-tations) was computed between the geographical distancematrix and the genetic matrix using Goldstein’s distance,dm2 (Goldstein et al., 1995) with XLSTAT.
A minimum spanning network for plastid haplotypes wascomputed using TCS v.1.21 (Clement et al., 2000) allowingup to four steps of missing haplotypes. Ambiguities in thenetwork were resolved using criteria and procedures delineatedby Crandall and Templeton (1993).
The RST statistic (Estoup et al., 1998), which takes intoaccount frequency and similarity in plastid haplotype size,was computed to contrast the effect of ordered versus unor-dered alleles on genetic differentiation. An RST value largerthan expected by chance pRST (equivalent to FST and esti-mated based on 100 000 permutations of allele sizes; Hardy
et al., 2003) indicates a phylogeographical structure in whichclosely related plastid haplotypes are located in nearby popu-lations (Pons and Petit, 1996; Lapegue and Petit, 1997;Afzal-Rafi and Dodd, 2007). Both Goldstein’s distanceand RST were computed using SPAGeDi v1.2 (Hardy andVekemans, 2002).
The geographical structure of the genetic variation wasexamined through Bayesian analysis of population structure(BAPS) using BAPS 5.0 software based on linked loci(Corander et al., 2008). This analysis considered only identityinformation of the plastid haplotypes because BAPS optionsfor spatial clustering do not consider a stepwise mutationmodel. Although there could be information loss through codi-fication in a single locus, Corander et al. (2008) have reportedthat the inclusion of spatial data is useful to avoid overestimat-ing the number of genetic classes. This analysis was used topartition the populations in a number of K groups usingspatial information to detect the most likely genetic structureamong the 24 populations. The search was conducted usingfrom two to 25 groups (K ), with ten replicates for each Kvalue. Another search with 100 initial partitions for the K
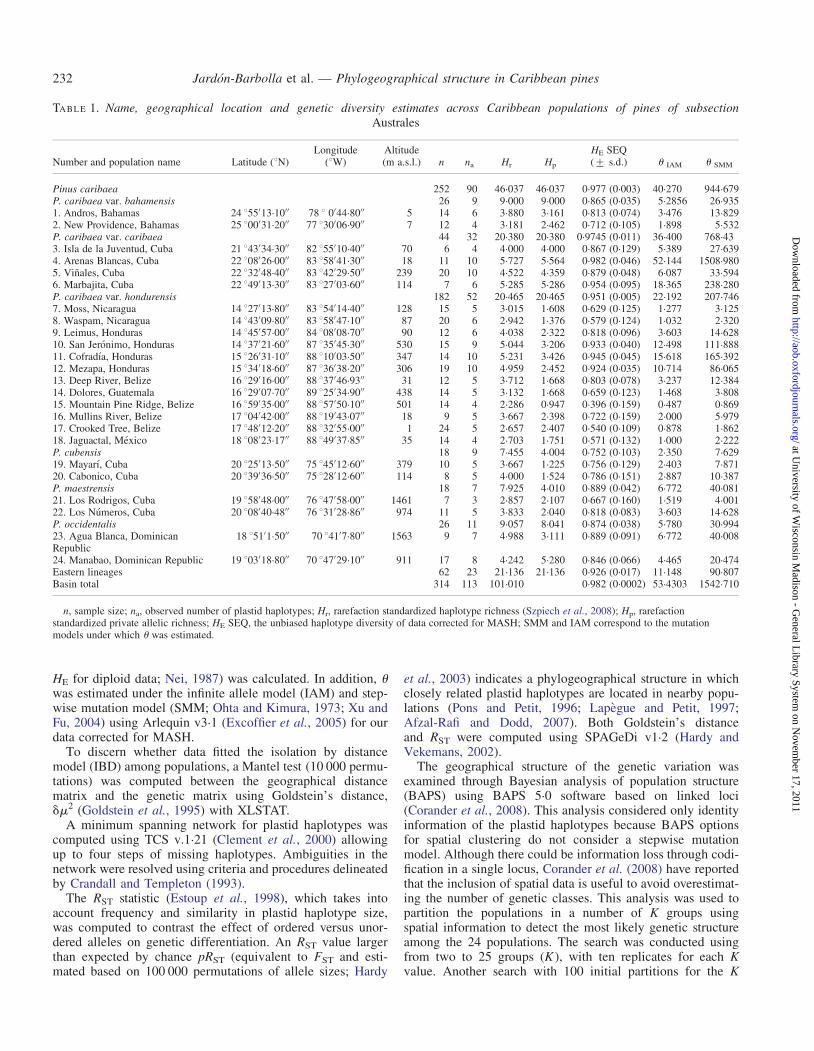
TABLE 1. Name, geographical location and genetic diversity estimates across Caribbean populations of pines of subsectionAustrales
Number and population name Latitude (8N)Longitude
(8W)Altitude(m a.s.l.) n na Hr Hp
HE SEQ(+ s.d.) u IAM u SMM
Pinus caribaea 252 90 46.037 46.037 0.977 (0.003) 40.270 944.679P. caribaea var. bahamensis 26 9 9.000 9.000 0.865 (0.035) 5.2856 26.9351. Andros, Bahamas 24 855′13.10′′ 78 8 0′44.80′′ 5 14 6 3.880 3.161 0.813 (0.074) 3.476 13.8292. New Providence, Bahamas 25 800′31.20′′ 77 830′06.90′′ 7 12 4 3.181 2.462 0.712 (0.105) 1.898 5.532P. caribaea var. caribaea 44 32 20.380 20.380 0.9745 (0.011) 36.400 768.433. Isla de la Juventud, Cuba 21 843′34.30′′ 82 855′10.40′′ 70 6 4 4.000 4.000 0.867 (0.129) 5.389 27.6394. Arenas Blancas, Cuba 22 808′26.00′′ 83 858′41.30′′ 18 11 10 5.727 5.564 0.982 (0.046) 52.144 1508.9805. Vinales, Cuba 22 832′48.40′′ 83 842′29.50′′ 239 20 10 4.522 4.359 0.879 (0.048) 6.087 33.5946. Marbajita, Cuba 22 849′13.30′′ 83 827′03.60′′ 114 7 6 5.285 5.286 0.954 (0.095) 18.365 238.280P. caribaea var. hondurensis 182 52 20.465 20.465 0.951 (0.005) 22.192 207.7467. Moss, Nicaragua 14 827′13.80′′ 83 854′14.40′′ 128 15 5 3.015 1.608 0.629 (0.125) 1.277 3.1258. Waspam, Nicaragua 14 843′09.80′′ 83 858′47.10′′ 87 20 6 2.942 1.376 0.579 (0.124) 1.032 2.3209. Leimus, Honduras 14 845′57.00′′ 84 808′08.70′′ 90 12 6 4.038 2.322 0.818 (0.096) 3.603 14.62810. San Jeronimo, Honduras 14 837′21.60′′ 87 835′45.30′′ 530 15 9 5.044 3.206 0.933 (0.040) 12.498 111.88811. Cofradıa, Honduras 15 826′31.10′′ 88 810′03.50′′ 347 14 10 5.231 3.426 0.945 (0.045) 15.618 165.39212. Mezapa, Honduras 15 834′18.60′′ 87 836′38.20′′ 306 19 10 4.959 2.452 0.924 (0.035) 10.714 86.06513. Deep River, Belize 16 829′16.00′′ 88 837′46.93′′ 31 12 5 3.712 1.668 0.803 (0.078) 3.237 12.38414. Dolores, Guatemala 16 829′07.70′′ 89 825′34.90′′ 438 14 5 3.132 1.668 0.659 (0.123) 1.468 3.80815. Mountain Pine Ridge, Belize 16 859′35.00′′ 88 857′50.10′′ 501 14 4 2.286 0.947 0.396 (0.159) 0.487 0.86916. Mullins River, Belize 17 804′42.00′′ 88 819′43.07′′ 18 9 5 3.667 2.398 0.722 (0.159) 2.000 5.97917. Crooked Tree, Belize 17 848′12.20′′ 88 832′55.00′′ 1 24 5 2.657 2.407 0.540 (0.109) 0.878 1.86218. Jaguactal, Mexico 18 808′23.17′′ 88 849′37.85′′ 35 14 4 2.703 1.751 0.571 (0.132) 1.000 2.222P. cubensis 18 9 7.455 4.004 0.752 (0.103) 2.350 7.62919. Mayarı, Cuba 20 825′13.50′′ 75 845′12.60′′ 379 10 5 3.667 1.225 0.756 (0.129) 2.403 7.87120. Cabonico, Cuba 20 839′36.50′′ 75 828′12.60′′ 114 8 5 4.000 1.524 0.786 (0.151) 2.887 10.387P. maestrensis 18 7 7.925 4.010 0.889 (0.042) 6.772 40.08121. Los Rodrigos, Cuba 19 858′48.00′′ 76 847′58.00′′ 1461 7 3 2.857 2.107 0.667 (0.160) 1.519 4.00122. Los Numeros, Cuba 20 808′40.48′′ 76 831′28.86′′ 974 11 5 3.833 2.040 0.818 (0.083) 3.603 14.628P. occidentalis 26 11 9.057 8.041 0.874 (0.038) 5.780 30.99423. Agua Blanca, DominicanRepublic
18 851′1.50′′ 70 841′7.80′′ 1563 9 7 4.988 3.111 0.889 (0.091) 6.772 40.008
24. Manabao, Dominican Republic 19 803′18.80′′ 70 847′29.10′′ 911 17 8 4.242 5.280 0.846 (0.066) 4.465 20.474Eastern lineages 62 23 21.136 21.136 0.926 (0.017) 11.148 90.807Basin total 314 113 101.010 0.982 (0.0002) 53.4303 1542.710
n, sample size; na, observed number of plastid haplotypes; Hr, rarefaction standardized haplotype richness (Szpiech et al., 2008); Hp, rarefactionstandardized private allelic richness; HE SEQ, the unbiased haplotype diversity of data corrected for MASH; SMM and IAM correspond to the mutationmodels under which u was estimated.
Jardon-Barbolla et al. — Phylogeographical structure in Caribbean pines232
at University of W
isconsin Madison - G
eneral Library System
on Novem
ber 17, 2011http://aob.oxfordjournals.org/
Dow
nloaded from
with the best likelihood was performed as delineated byGodbout et al. (2008).
To examine evidence of demographic expansion, mismatchdistribution tests were used (Rogers and Harpending, 1992;Schneider and Excoffier, 1999) for different clades (based onBAPS) using Arlequin v3.1 (Excoffier et al., 2005), and withmicrosatellite data binary coded (Navascues et al., 2006).Estimation of t (time to expansion in mutational units) wasmade by a maximum-pseudolikelihood method developed byNavascues et al. (2009), which uses a homoplasy correctionmodel and has been demonstrated to provide a t estimatecloser to the true value than moment-based estimates. Timeto expansion was calculated using a per-locus mutation rateestimate of 5.5 × 1025 per generation (Provan et al., 1999)and 42.5 years as the generation time; this generation time isthe mean between the age at which maximum fecundity isreached in these species (15 years) and the approximate lifespan (70 years; A. Lopez-Almirall, Museo Nacional deHistoria Natural, Cuba, pers. comm.).
RESULTS
Genetic variation
Of the ten loci analysed, six were polymorphic in our data set(Pt1254, Pt15169, Pt 45002, Pt71936, Pt87268 and Pt110048).Sequencing of the locus Pt15169 (GenBank accessionnumbers: FJ687622–FJ687664) revealed that the first tworepeat blocks were polymorphic. Each species had a distinctrange of nucleotide composition in these repeat blockswithin the subsample. We therefore treated them as separateloci, designated as Pt15169C (ranging from nine to ten C’s)and Pt15169T (ranging from nine to 11 T’s), respectively,assigning to the individuals of each species the nucleotidecomposition found in the subsample for its population. Thiseliminated the MASH in our data set. A total of 113 plastid hap-lotypes was identified with different combinations of alleles forthe seven loci. Only haplotypes 60 and 73 had frequencies.0.05 (Supplementary Data Table S1, available online).
Rarefaction analysis showed that observed differences inhaplotypic richness among populations and lineages were con-sistent with the standardized estimators obtained (Table 1).Moreover, regression analysis demonstrated that even ifwe double the total sample size (to 628 individuals), weshould expect to find only nine new plastid haplotypes(Supplementary Data Table S2). This indicates that oursample size was adequate to provide a reasonable estimate ofgenetic diversity.
The genetic diversity for P. caribaea populations was HE
SEQ ¼ 0.977 [confidence interval (CI)+ 0.006] (uIAM ¼40.270, uSMM ¼ 944.679). For the eastern species this estimatewas significantly smaller [HE ¼ 0.926 (CI+ 0.033); seeTable 1]. As shown, the highest values for the indirect estima-tor of the effective population size revealed larger values forthe species with a wider distribution. This finding is supportedby rarefaction analysis, which shows that when controlling forsample size, the haplotypic richness of P. caribaea is stilllarger than that of the eastern lineages (Table 1).
Within P. caribaea var. hondurensis the most variable popu-lations were in Honduras in the middle portion of the
distribution range in Central America (San Jeronimo,Cofradıa and Mezapa, populations 10, 11 and 12, Fig. 1,Table 1). The presence in the Arenas Blancas and Vinalespopulations of P. caribaea var. caribaea plastid haplotypes28, 94 and 109, probably of Central American origin (seebelow), increased estimates of theta considerably.
Isolation by distance
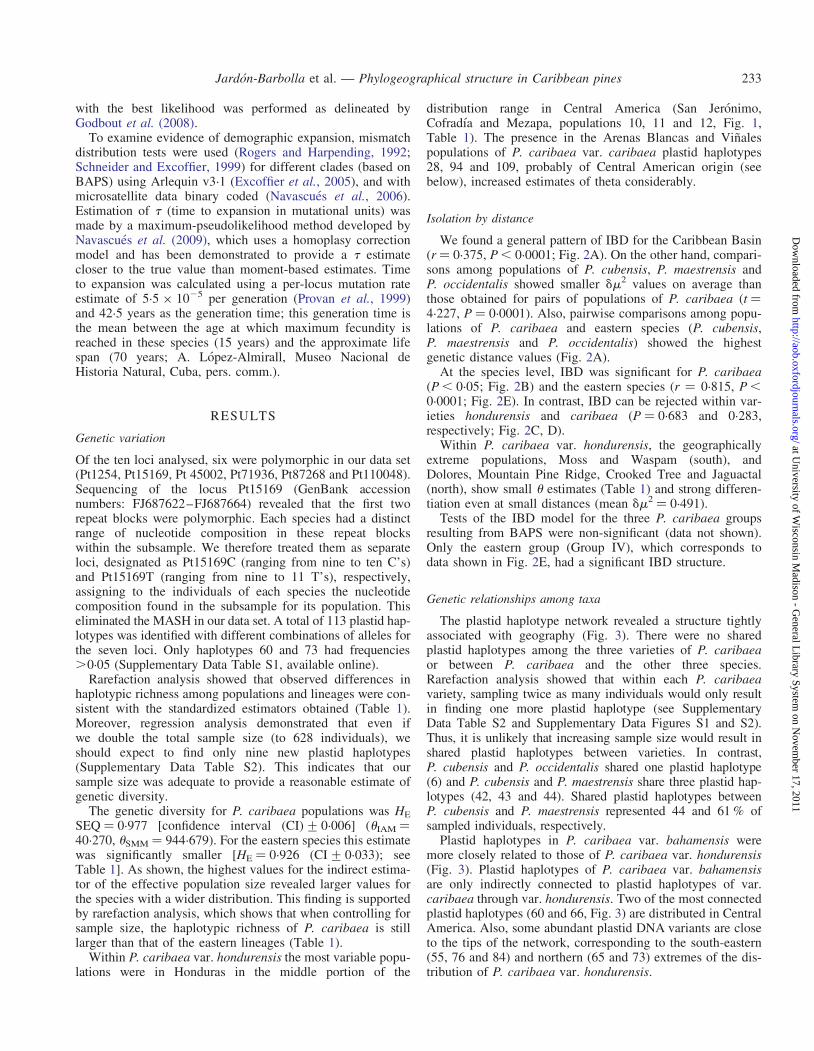
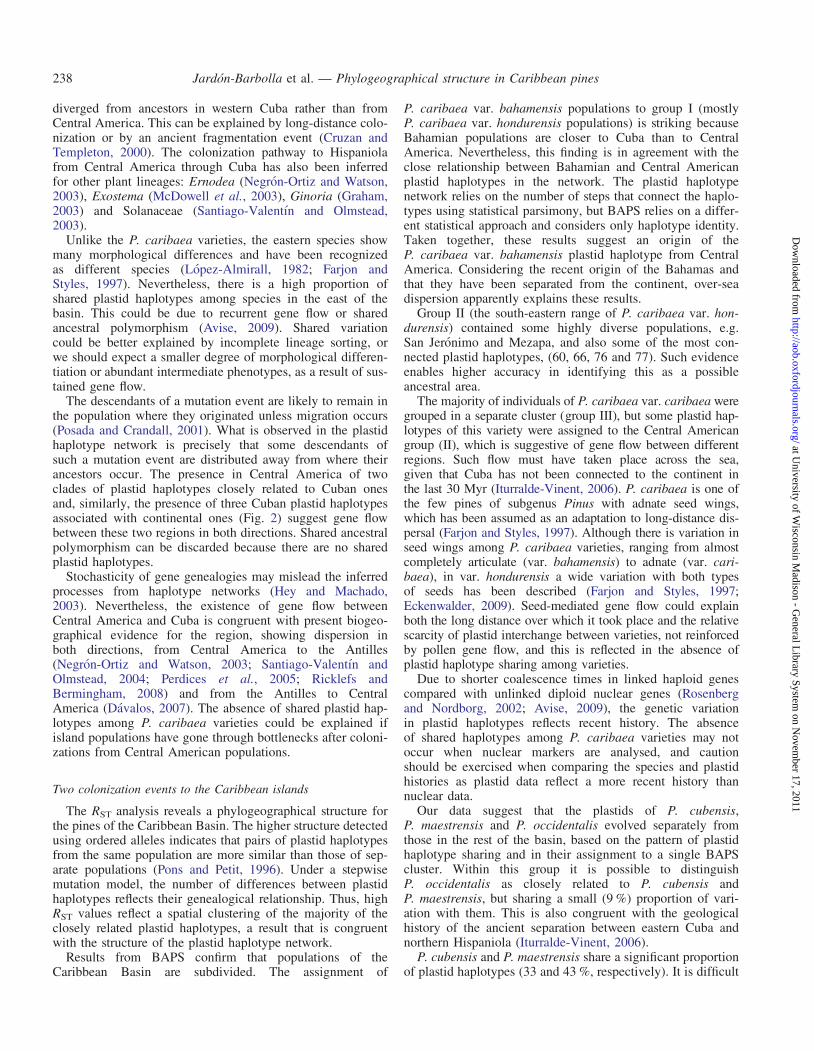
We found a general pattern of IBD for the Caribbean Basin(r ¼ 0.375, P , 0.0001; Fig. 2A). On the other hand, compari-sons among populations of P. cubensis, P. maestrensis andP. occidentalis showed smaller dm2 values on average thanthose obtained for pairs of populations of P. caribaea (t ¼4.227, P ¼ 0.0001). Also, pairwise comparisons among popu-lations of P. caribaea and eastern species (P. cubensis,P. maestrensis and P. occidentalis) showed the highestgenetic distance values (Fig. 2A).
At the species level, IBD was significant for P. caribaea(P , 0.05; Fig. 2B) and the eastern species (r ¼ 0.815, P ,0.0001; Fig. 2E). In contrast, IBD can be rejected within var-ieties hondurensis and caribaea (P ¼ 0.683 and 0.283,respectively; Fig. 2C, D).
Within P. caribaea var. hondurensis, the geographicallyextreme populations, Moss and Waspam (south), andDolores, Mountain Pine Ridge, Crooked Tree and Jaguactal(north), show small u estimates (Table 1) and strong differen-tiation even at small distances (mean dm2 ¼ 0.491).
Tests of the IBD model for the three P. caribaea groupsresulting from BAPS were non-significant (data not shown).Only the eastern group (Group IV), which corresponds todata shown in Fig. 2E, had a significant IBD structure.
Genetic relationships among taxa
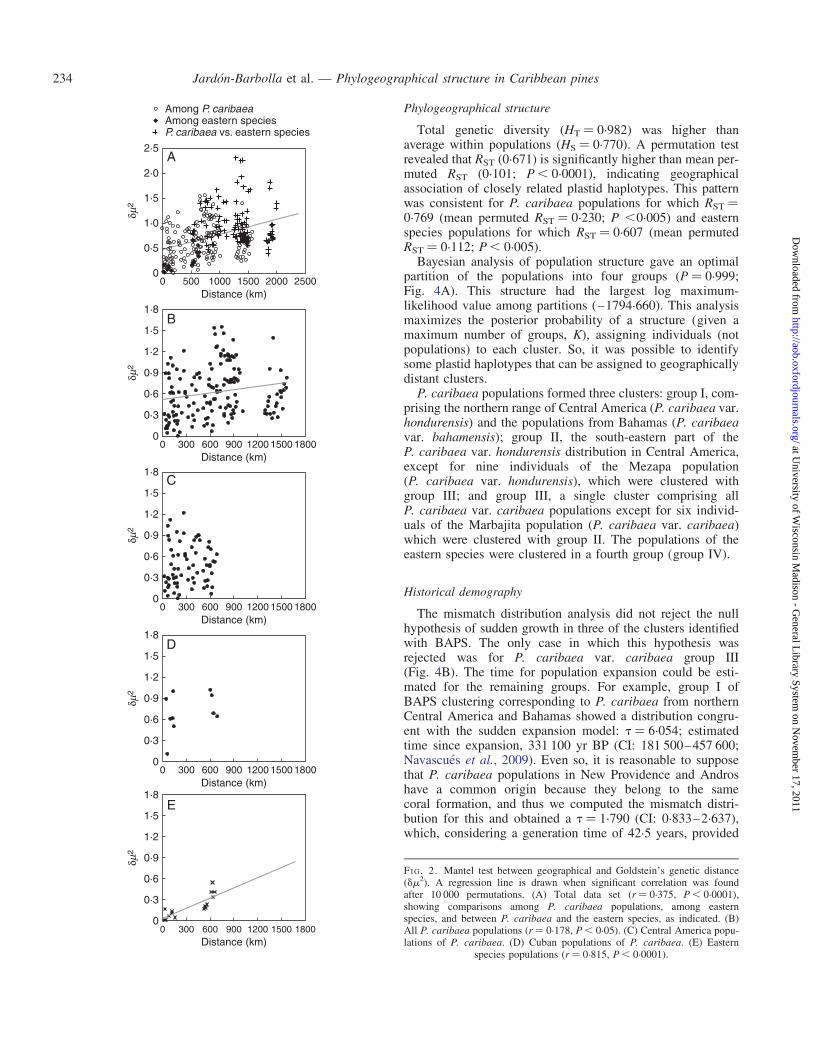
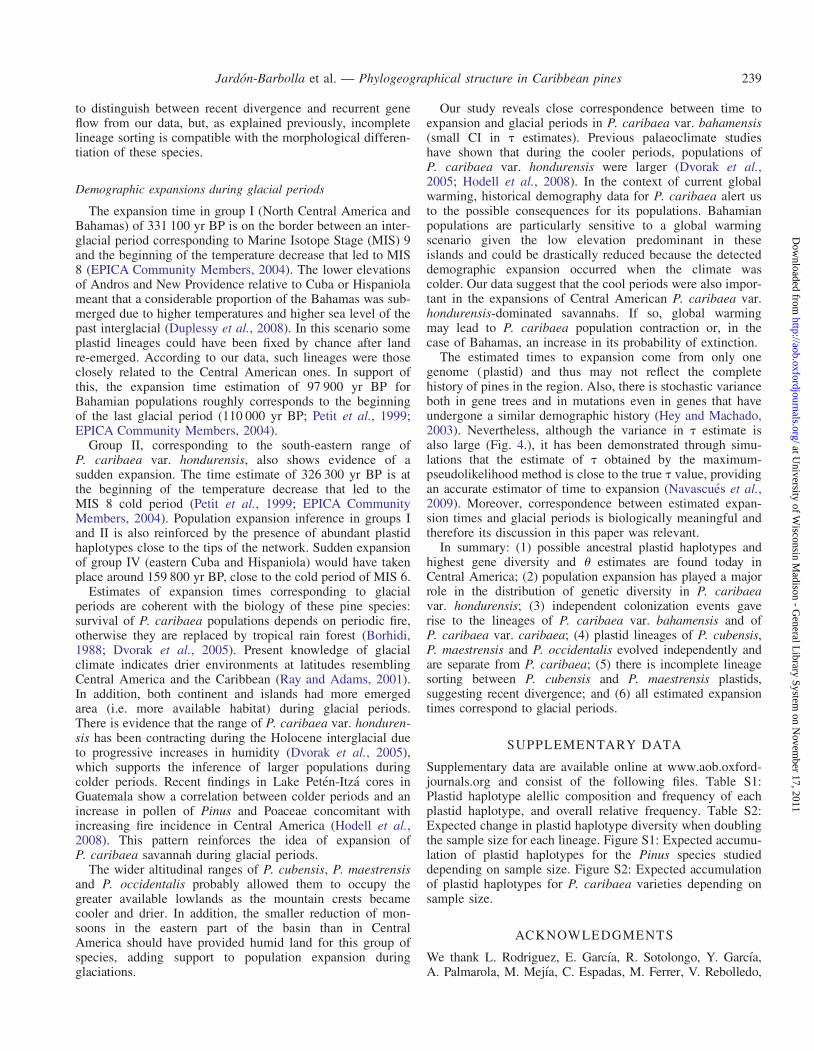
The plastid haplotype network revealed a structure tightlyassociated with geography (Fig. 3). There were no sharedplastid haplotypes among the three varieties of P. caribaeaor between P. caribaea and the other three species.Rarefaction analysis showed that within each P. caribaeavariety, sampling twice as many individuals would only resultin finding one more plastid haplotype (see SupplementaryData Table S2 and Supplementary Data Figures S1 and S2).Thus, it is unlikely that increasing sample size would result inshared plastid haplotypes between varieties. In contrast,P. cubensis and P. occidentalis shared one plastid haplotype(6) and P. cubensis and P. maestrensis share three plastid hap-lotypes (42, 43 and 44). Shared plastid haplotypes betweenP. cubensis and P. maestrensis represented 44 and 61 % ofsampled individuals, respectively.
Plastid haplotypes in P. caribaea var. bahamensis weremore closely related to those of P. caribaea var. hondurensis(Fig. 3). Plastid haplotypes of P. caribaea var. bahamensisare only indirectly connected to plastid haplotypes of var.caribaea through var. hondurensis. Two of the most connectedplastid haplotypes (60 and 66, Fig. 3) are distributed in CentralAmerica. Also, some abundant plastid DNA variants are closeto the tips of the network, corresponding to the south-eastern(55, 76 and 84) and northern (65 and 73) extremes of the dis-tribution of P. caribaea var. hondurensis.
Jardon-Barbolla et al. — Phylogeographical structure in Caribbean pines 233
at University of W
isconsin Madison - G
eneral Library System
on Novem
ber 17, 2011http://aob.oxfordjournals.org/
Dow
nloaded from
Phylogeographical structure
Total genetic diversity (HT ¼ 0.982) was higher thanaverage within populations (HS ¼ 0.770). A permutation testrevealed that RST (0.671) is significantly higher than mean per-muted RST (0.101; P , 0.0001), indicating geographicalassociation of closely related plastid haplotypes. This patternwas consistent for P. caribaea populations for which RST ¼0.769 (mean permuted RST ¼ 0.230; P ,0.005) and easternspecies populations for which RST ¼ 0.607 (mean permutedRST ¼ 0.112; P , 0.005).
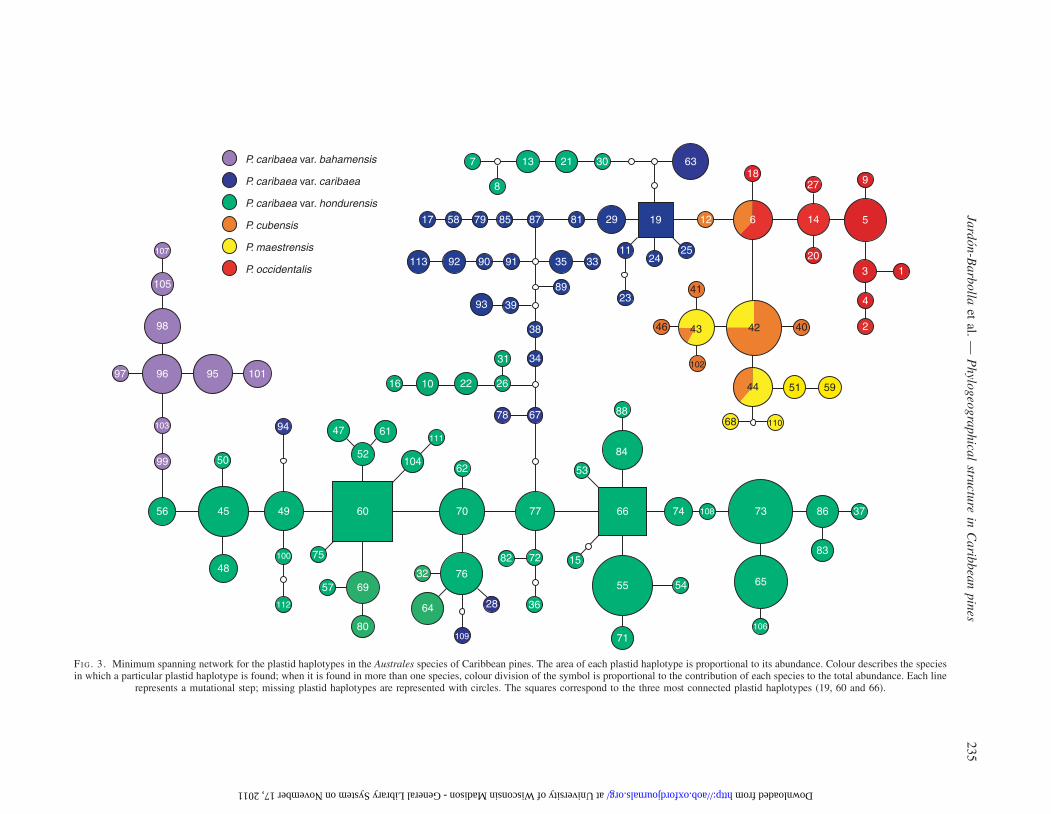
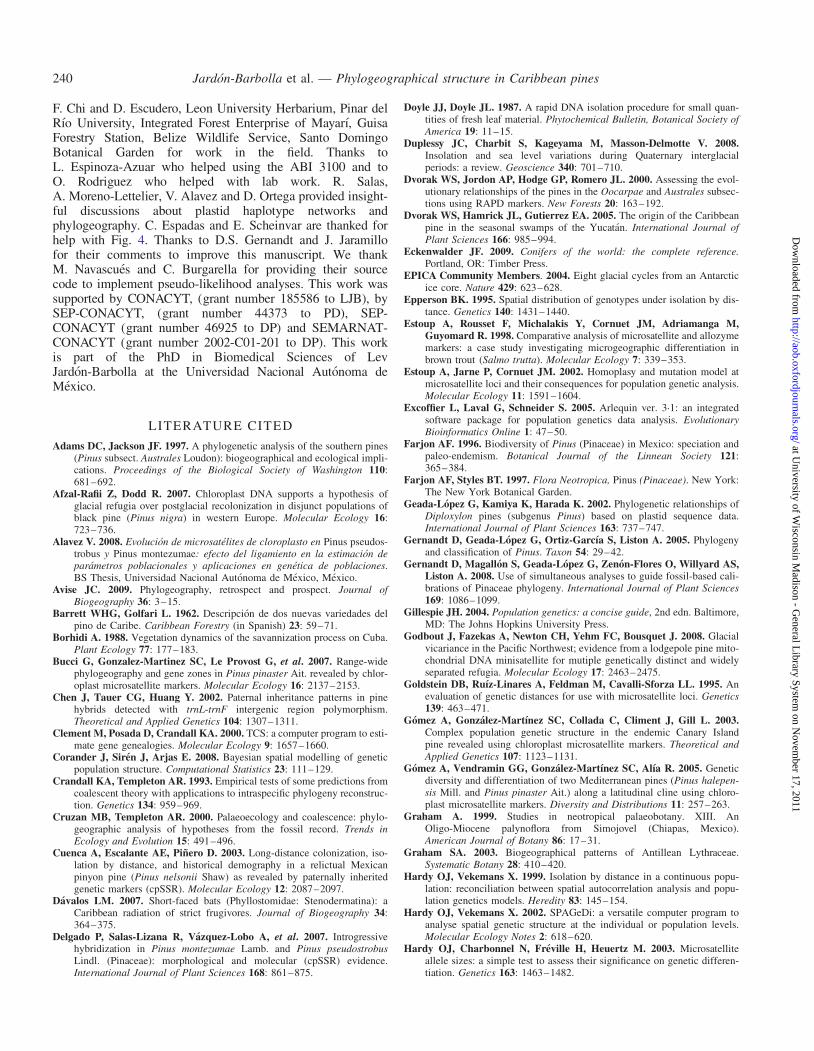
Bayesian analysis of population structure gave an optimalpartition of the populations into four groups (P ¼ 0.999;Fig. 4A). This structure had the largest log maximum-likelihood value among partitions (–1794.660). This analysismaximizes the posterior probability of a structure (given amaximum number of groups, K), assigning individuals (notpopulations) to each cluster. So, it was possible to identifysome plastid haplotypes that can be assigned to geographicallydistant clusters.
P. caribaea populations formed three clusters: group I, com-prising the northern range of Central America (P. caribaea var.hondurensis) and the populations from Bahamas (P. caribaeavar. bahamensis); group II, the south-eastern part of theP. caribaea var. hondurensis distribution in Central America,except for nine individuals of the Mezapa population(P. caribaea var. hondurensis), which were clustered withgroup III; and group III, a single cluster comprising allP. caribaea var. caribaea populations except for six individ-uals of the Marbajita population (P. caribaea var. caribaea)which were clustered with group II. The populations of theeastern species were clustered in a fourth group (group IV).
Historical demography
The mismatch distribution analysis did not reject the nullhypothesis of sudden growth in three of the clusters identifiedwith BAPS. The only case in which this hypothesis wasrejected was for P. caribaea var. caribaea group III(Fig. 4B). The time for population expansion could be esti-mated for the remaining groups. For example, group I ofBAPS clustering corresponding to P. caribaea from northernCentral America and Bahamas showed a distribution congru-ent with the sudden expansion model: t ¼ 6.054; estimatedtime since expansion, 331 100 yr BP (CI: 181 500–457 600;Navascues et al., 2009). Even so, it is reasonable to supposethat P. caribaea populations in New Providence and Androshave a common origin because they belong to the samecoral formation, and thus we computed the mismatch distri-bution for this and obtained a t ¼ 1.790 (CI: 0.833–2.637),which, considering a generation time of 42.5 years, provided
00
0·5
1·0
dm2
2·0
1·5
2·5A
B
C
D
E
Among P. caribaeaAmong eastern speciesP. caribaea vs. eastern species
500 1000Distance (km)
1500 2000 2500
00
0·3
0·6
0·9dm2
1·5
1·2
1·8
300 600Distance (km)
900 1200 1500 1800
00
0·3
0·6
0·9dm2
1·5
1·2
1·8
300 600Distance (km)
900 1200 1500 1800
00
0·3
0·6
0·9dm2
1·5
1·2
1·8
300 600Distance (km)
900 1200 1500 1800
00
0·3
0·6
0·9dm2
1·5
1·2
1·8
300 600Distance (km)
900 1200 1500 1800
FI G. 2. Mantel test between geographical and Goldstein’s genetic distance(dm2). A regression line is drawn when significant correlation was foundafter 10 000 permutations. (A) Total data set (r ¼ 0.375, P , 0.0001),showing comparisons among P. caribaea populations, among easternspecies, and between P. caribaea and the eastern species, as indicated. (B)All P. caribaea populations (r ¼ 0.178, P , 0.05). (C) Central America popu-lations of P. caribaea. (D) Cuban populations of P. caribaea. (E) Eastern
species populations (r ¼ 0.815, P , 0.0001).
Jardon-Barbolla et al. — Phylogeographical structure in Caribbean pines234
at University of W
isconsin Madison - G
eneral Library System
on Novem
ber 17, 2011http://aob.oxfordjournals.org/
Dow
nloaded from
7
8
13 21 30 63
1929
11
23
2425
12 6
2718
9
5
203 1
4
2404243
41
46
102
44
68 110
51 59
818785795817
113 92 90 91 35 33
89
38
3993
P. caribaea var. bahamensis
P. caribaea var. caribaea
P. caribaea var. hondurensis
P. cubensis
P. maestrensis
P. occidentalis
31 34
26221016
78
70
62
111
10452
4794103
97 96 95 101
98
105
107
61
60494556
99 50
48
112
100 75
57 69
80
67 88
84
53
6677
7282 15
55
3628
7632
64
109 71
54
74 108 73
65
106
83
86 37
14
FI G. 3. Minimum spanning network for the plastid haplotypes in the Australes species of Caribbean pines. The area of each plastid haplotype is proportional to its abundance. Colour describes the speciesin which a particular plastid haplotype is found; when it is found in more than one species, colour division of the symbol is proportional to the contribution of each species to the total abundance. Each line
represents a mutational step; missing plastid haplotypes are represented with circles. The squares correspond to the three most connected plastid haplotypes (19, 60 and 66).
Jard
on
-Ba
rbo
llaet
al.—
Ph
ylog
eog
rap
hica
lstru
cture
inC
arib
bea
np
ines
23
5
at University of Wisconsin Madison - General Library System on November 17, 2011 http://aob.oxfordjournals.org/ Downloaded from
an estimate of time to expansion of 97 900 yr BP (CI: 45 600–144 200). The estimate of the time to expansion for group II ofP. caribaea var. hondurensis was similar to that for group I(t ¼ 5.965 and 6.054, respectively). This is congruent withthe high abundance in relatively derived plastid haplotypes
(Fig. 3). Time to expansion calculated for Group II is326 300 yr BP (CI: 150 300–511 200). Finally, group IVfrom BAPS (P. cubensis, P maestrensis and P. occidentalis)showed a lower t estimate (2.921), which gave an estimatedtime to expansion of 159 800 yr BP (CI: 101 200–192 000).
20°
30°
90°A
B
80° 70°
II
IV
I
I
III
N 0 200 400 600 800 km
0.30 I II
III IV
0.25 Simulated
0.20
0.15
0.10Freq
uenc
y
0.05
0.00
0 1 2No. of pairwise differences
3 4 5 6 7 8 9 10 11 0 1 2No. of pairwise differences
3 4 5 6 7 8 9 10 11
0.30
0.25
0.20
0.15
0.10Freq
uenc
y
0.05
0.00
FI G. 4. (A) Bayesian analysis of population structure (BAPS) results. Clusters correspond to the best partition of the data (log maximum likelihood ¼–1794.6602; P ¼ 0.999) and are indicated by different colour Voronoi polygons. Collection sites are indicated by circles. (B) Mismatch distribution for eachgroup, Roman numerals refer to the BAPS clusters; observed differences are shown in colour bars, and simulated distributions in grey bars. Parameters estimatedthe under sudden expansion model were: (I) t ¼ 6.054 (CI 3.618–8.366), (II) t ¼ 5.965 (CI 1.020–7.176), (IV) t ¼ 2.921 (CI 1.850–3.509); cluster (III)
deviated significantly from the null hypothesis of sudden expansion (P ¼ 0.0477).
Jardon-Barbolla et al. — Phylogeographical structure in Caribbean pines236
at University of W
isconsin Madison - G
eneral Library System
on Novem
ber 17, 2011http://aob.oxfordjournals.org/
Dow
nloaded from
DISCUSSION
Genetic variation
Genetic diversity in terms of plastid haplotype diversities (HE,Table 1) for the taxa included was comparable with other pinespecies that have been studied with plastid SSRs, includingP. pinaster (0.870, Ribeiro et al., 2001; 0.927, Gomez et al.,2005), P. canariensis (0.73, Gomez et al., 2003), P. nigra(0.954, Afzal-Rafii and Dodd, 2007) and P. strobiformis(0.856, Moreno-Letelier and Pinero, 2009).
The indirect estimators of effective population size (u)for P. caribaea were high in comparison with speciesfrom the east of the Caribbean Basin, namely P. cubensis,P. maestrensis and P. occidentalis. This pattern is congruentwith the size of the species range, with the most widely distrib-uted taxon (P. caribaea) having the highest theta value(uIAM ¼ 40.270).
High values of u found in San Jeronimo, Cofradıa andMezapa in Central America and in Arenas Blancas andVinales in Cuba appear to be related to gene flow amongthese populations, as deduced from the origin of plastid haplo-types 7, 8, 13, 21, 28, 30, 94 and 109. As can be seen in Fig. 3,plastid haplotypes 7, 8, 13, 21 and 30 present in CentralAmerica populations are in a network branch derived froman ancestral plastid haplotype, 19, present only in Cuba.Similarly, plastid haplotypes 28, 94 and 109 were found inCuban populations, but are derived from ancestral plastid hap-lotypes found only in Central America. Given the otherwiseconsistent geographical association of the network branchesand the absence of shared plastid haplotypes amongP. caribaea varieties, it is plausible that gene flow amongcertain populations in Central America and Cuba explainsboth the distribution of these plastid haplotypes and their con-tribution to local genetic diversity, particularly in the case ofCuban populations.
Contrasting patterns of IBD and metapopulation dynamics
Within P. caribaea and the eastern species, the genetic dis-tances are correlated with geographical distance among popu-lations, indicating that populations within each region are lessisolated from each other than populations from differentregions.
When analysed separately, Central American populations ofP. caribaea did not fit the IBD model, and this result was cor-roborated when Mantel tests were conducted for the BAPSclusters of this region (data not shown). The IBD modelassumes that populations are in equilibrium, such thatgenetic structure is due to geographical restriction of geneflow (Epperson, 1995; Hardy and Vekemans, 1999). Absenceof IBD could be explained by the presence of highly differen-tiated populations with low uIAM and uSMM estimates (in thesouth: Moss and Waspam; in the north: Deep River, MullinsRiver, Mountain Pine Ridge and Jaguactal). This suggests ametapopulation dynamic (Slatkin, 1977) in which some popu-lations have been recently founded and others have goneextinct. In this scenario, and due to the action of geneticdrift, plastid haplotypes common in some populations arerare in the rest of the distribution area (Whitlock, 2004).This contributes to higher dm2 values because flow has not
diluted the differences among populations (Slatkin, 1977;Pannel and Charlesworth, 2000; Whitlock, 2004). This meta-population dynamic could explain the distribution of geneticvariation in P. caribaea from Central America and is congru-ent with the susceptibility of this species to the balance ofhumidity and periodic fire (Borhidi, 1988; Dvorak et al.,2005). The precise testing of this type of dynamic wouldrequire further detailed studies about the demographic andecological processes in these populations.
Central American origin for P. caribaea and eastern speciesas a separate lineage
Ancestral plastid haplotypes are likely to have given rise tomore derived haplotypes than younger haplotypes, because inancestral haplotypes mutation has occurred over a longerperiod of time (Posada and Crandall, 2001). As a consequence,older plastid haplotypes tend have more connections in anetwork. Although homoplasy and high mutation rates(reflected in u) can bias this pattern, highly connected plastidhaplotypes tend to be closely related to ancestral plastid haplo-types (Alavez, 2008). Thus, the presence of highly connectedplastid haplotypes (Fig. 3) together with the distribution ofgenetic diversity could indicate that Central America is theancestral area in the plastid haplotype distribution.
The plastid haplotype network also suggests that the distri-bution of genetic diversity in P. caribaea is the result of twoindependent colonization events to the islands, one to Cubaand another to Bahamas. The plastid haplotypes ofP. caribaea var. bahamensis (Bahamas) were more closelyrelated to Central American plastid haplotypes than to theirCaribbean counterparts. Meanwhile, plastid haplotypes ofP. caribaea var. caribaea (Cuba) had different CentralAmerican relatives. The BAPS clustering further confirmedsuch a close relationship between populations from theBahamas and Central America (Fig. 4B).
Some authors have suggested a North American ancestor forP. caribaea (Farjon, 1996; Adams and Jackson, 1997). Todate, phylogenetic analyses of Pinus based on plastid DNAhave been unresolved with respect to the relationshipsbetween North American and Caribbean species of subsectionAustrales (Geada-Lopez et al., 2002; Gernandt et al.,2005). Furthermore, it is important to remember that thelineage history of a single locus (such as the plastid genome)does not necessarily coincide with the species history(Rosenberg and Nordborg, 2002; Hey and Machado,2003; Avise, 2009) and discordance is known to existbetween nuclear and plastid phylogenetic analyses in otherpines (Willyard et al., 2009). Thus, even if the hypothesisof a North American origin of P. caribaea were true,the results of this study still reflect the historical distributionof the plastid lineages within the species. Moreover, boththis study and that of Adams and Jackson (1997) agree thatthere have been long-distance colonization events in the evol-ution of subsection Australes pines in the Caribbean Basin,although the current study detected a different direction forsuch events.
The close relationship between plastid haplotypes fromP. cubensis, P. maestrensis and P. occidentalis and those ofP. caribaea var. caribaea suggests that eastern species
Jardon-Barbolla et al. — Phylogeographical structure in Caribbean pines 237
at University of W
isconsin Madison - G
eneral Library System
on Novem
ber 17, 2011http://aob.oxfordjournals.org/
Dow
nloaded from
diverged from ancestors in western Cuba rather than fromCentral America. This can be explained by long-distance colo-nization or by an ancient fragmentation event (Cruzan andTempleton, 2000). The colonization pathway to Hispaniolafrom Central America through Cuba has also been inferredfor other plant lineages: Ernodea (Negron-Ortiz and Watson,2003), Exostema (McDowell et al., 2003), Ginoria (Graham,2003) and Solanaceae (Santiago-Valentın and Olmstead,2003).
Unlike the P. caribaea varieties, the eastern species showmany morphological differences and have been recognizedas different species (Lopez-Almirall, 1982; Farjon andStyles, 1997). Nevertheless, there is a high proportion ofshared plastid haplotypes among species in the east of thebasin. This could be due to recurrent gene flow or sharedancestral polymorphism (Avise, 2009). Shared variationcould be better explained by incomplete lineage sorting, orwe should expect a smaller degree of morphological differen-tiation or abundant intermediate phenotypes, as a result of sus-tained gene flow.
The descendants of a mutation event are likely to remain inthe population where they originated unless migration occurs(Posada and Crandall, 2001). What is observed in the plastidhaplotype network is precisely that some descendants ofsuch a mutation event are distributed away from where theirancestors occur. The presence in Central America of twoclades of plastid haplotypes closely related to Cuban onesand, similarly, the presence of three Cuban plastid haplotypesassociated with continental ones (Fig. 2) suggest gene flowbetween these two regions in both directions. Shared ancestralpolymorphism can be discarded because there are no sharedplastid haplotypes.
Stochasticity of gene genealogies may mislead the inferredprocesses from haplotype networks (Hey and Machado,2003). Nevertheless, the existence of gene flow betweenCentral America and Cuba is congruent with present biogeo-graphical evidence for the region, showing dispersion inboth directions, from Central America to the Antilles(Negron-Ortiz and Watson, 2003; Santiago-Valentın andOlmstead, 2004; Perdices et al., 2005; Ricklefs andBermingham, 2008) and from the Antilles to CentralAmerica (Davalos, 2007). The absence of shared plastid hap-lotypes among P. caribaea varieties could be explained ifisland populations have gone through bottlenecks after coloni-zations from Central American populations.
Two colonization events to the Caribbean islands
The RST analysis reveals a phylogeographical structure forthe pines of the Caribbean Basin. The higher structure detectedusing ordered alleles indicates that pairs of plastid haplotypesfrom the same population are more similar than those of sep-arate populations (Pons and Petit, 1996). Under a stepwisemutation model, the number of differences between plastidhaplotypes reflects their genealogical relationship. Thus, highRST values reflect a spatial clustering of the majority of theclosely related plastid haplotypes, a result that is congruentwith the structure of the plastid haplotype network.
Results from BAPS confirm that populations of theCaribbean Basin are subdivided. The assignment of
P. caribaea var. bahamensis populations to group I (mostlyP. caribaea var. hondurensis populations) is striking becauseBahamian populations are closer to Cuba than to CentralAmerica. Nevertheless, this finding is in agreement with theclose relationship between Bahamian and Central Americanplastid haplotypes in the network. The plastid haplotypenetwork relies on the number of steps that connect the haplo-types using statistical parsimony, but BAPS relies on a differ-ent statistical approach and considers only haplotype identity.Taken together, these results suggest an origin of theP. caribaea var. bahamensis plastid haplotype from CentralAmerica. Considering the recent origin of the Bahamas andthat they have been separated from the continent, over-seadispersion apparently explains these results.
Group II (the south-eastern range of P. caribaea var. hon-durensis) contained some highly diverse populations, e.g.San Jeronimo and Mezapa, and also some of the most con-nected plastid haplotypes, (60, 66, 76 and 77). Such evidenceenables higher accuracy in identifying this as a possibleancestral area.
The majority of individuals of P. caribaea var. caribaea weregrouped in a separate cluster (group III), but some plastid hap-lotypes of this variety were assigned to the Central Americangroup (II), which is suggestive of gene flow between differentregions. Such flow must have taken place across the sea,given that Cuba has not been connected to the continent inthe last 30 Myr (Iturralde-Vinent, 2006). P. caribaea is one ofthe few pines of subgenus Pinus with adnate seed wings,which has been assumed as an adaptation to long-distance dis-persal (Farjon and Styles, 1997). Although there is variation inseed wings among P. caribaea varieties, ranging from almostcompletely articulate (var. bahamensis) to adnate (var. cari-baea), in var. hondurensis a wide variation with both typesof seeds has been described (Farjon and Styles, 1997;Eckenwalder, 2009). Seed-mediated gene flow could explainboth the long distance over which it took place and the relativescarcity of plastid interchange between varieties, not reinforcedby pollen gene flow, and this is reflected in the absence ofplastid haplotype sharing among varieties.
Due to shorter coalescence times in linked haploid genescompared with unlinked diploid nuclear genes (Rosenbergand Nordborg, 2002; Avise, 2009), the genetic variationin plastid haplotypes reflects recent history. The absenceof shared haplotypes among P. caribaea varieties may notoccur when nuclear markers are analysed, and cautionshould be exercised when comparing the species and plastidhistories as plastid data reflect a more recent history thannuclear data.
Our data suggest that the plastids of P. cubensis,P. maestrensis and P. occidentalis evolved separately fromthose in the rest of the basin, based on the pattern of plastidhaplotype sharing and in their assignment to a single BAPScluster. Within this group it is possible to distinguishP. occidentalis as closely related to P. cubensis andP. maestrensis, but sharing a small (9 %) proportion of vari-ation with them. This is also congruent with the geologicalhistory of the ancient separation between eastern Cuba andnorthern Hispaniola (Iturralde-Vinent, 2006).
P. cubensis and P. maestrensis share a significant proportionof plastid haplotypes (33 and 43 %, respectively). It is difficult
Jardon-Barbolla et al. — Phylogeographical structure in Caribbean pines238
at University of W
isconsin Madison - G
eneral Library System
on Novem
ber 17, 2011http://aob.oxfordjournals.org/
Dow
nloaded from
to distinguish between recent divergence and recurrent geneflow from our data, but, as explained previously, incompletelineage sorting is compatible with the morphological differen-tiation of these species.
Demographic expansions during glacial periods
The expansion time in group I (North Central America andBahamas) of 331 100 yr BP is on the border between an inter-glacial period corresponding to Marine Isotope Stage (MIS) 9and the beginning of the temperature decrease that led to MIS8 (EPICA Community Members, 2004). The lower elevationsof Andros and New Providence relative to Cuba or Hispaniolameant that a considerable proportion of the Bahamas was sub-merged due to higher temperatures and higher sea level of thepast interglacial (Duplessy et al., 2008). In this scenario someplastid lineages could have been fixed by chance after landre-emerged. According to our data, such lineages were thoseclosely related to the Central American ones. In support ofthis, the expansion time estimation of 97 900 yr BP forBahamian populations roughly corresponds to the beginningof the last glacial period (110 000 yr BP; Petit et al., 1999;EPICA Community Members, 2004).
Group II, corresponding to the south-eastern range ofP. caribaea var. hondurensis, also shows evidence of asudden expansion. The time estimate of 326 300 yr BP is atthe beginning of the temperature decrease that led to theMIS 8 cold period (Petit et al., 1999; EPICA CommunityMembers, 2004). Population expansion inference in groups Iand II is also reinforced by the presence of abundant plastidhaplotypes close to the tips of the network. Sudden expansionof group IV (eastern Cuba and Hispaniola) would have takenplace around 159 800 yr BP, close to the cold period of MIS 6.
Estimates of expansion times corresponding to glacialperiods are coherent with the biology of these pine species:survival of P. caribaea populations depends on periodic fire,otherwise they are replaced by tropical rain forest (Borhidi,1988; Dvorak et al., 2005). Present knowledge of glacialclimate indicates drier environments at latitudes resemblingCentral America and the Caribbean (Ray and Adams, 2001).In addition, both continent and islands had more emergedarea (i.e. more available habitat) during glacial periods.There is evidence that the range of P. caribaea var. honduren-sis has been contracting during the Holocene interglacial dueto progressive increases in humidity (Dvorak et al., 2005),which supports the inference of larger populations duringcolder periods. Recent findings in Lake Peten-Itza cores inGuatemala show a correlation between colder periods and anincrease in pollen of Pinus and Poaceae concomitant withincreasing fire incidence in Central America (Hodell et al.,2008). This pattern reinforces the idea of expansion ofP. caribaea savannah during glacial periods.
The wider altitudinal ranges of P. cubensis, P. maestrensisand P. occidentalis probably allowed them to occupy thegreater available lowlands as the mountain crests becamecooler and drier. In addition, the smaller reduction of mon-soons in the eastern part of the basin than in CentralAmerica should have provided humid land for this group ofspecies, adding support to population expansion duringglaciations.
Our study reveals close correspondence between time toexpansion and glacial periods in P. caribaea var. bahamensis(small CI in t estimates). Previous palaeoclimate studieshave shown that during the cooler periods, populations ofP. caribaea var. hondurensis were larger (Dvorak et al.,2005; Hodell et al., 2008). In the context of current globalwarming, historical demography data for P. caribaea alert usto the possible consequences for its populations. Bahamianpopulations are particularly sensitive to a global warmingscenario given the low elevation predominant in theseislands and could be drastically reduced because the detecteddemographic expansion occurred when the climate wascolder. Our data suggest that the cool periods were also impor-tant in the expansions of Central American P. caribaea var.hondurensis-dominated savannahs. If so, global warmingmay lead to P. caribaea population contraction or, in thecase of Bahamas, an increase in its probability of extinction.
The estimated times to expansion come from only onegenome (plastid) and thus may not reflect the completehistory of pines in the region. Also, there is stochastic varianceboth in gene trees and in mutations even in genes that haveundergone a similar demographic history (Hey and Machado,2003). Nevertheless, although the variance in t estimate isalso large (Fig. 4.), it has been demonstrated through simu-lations that the estimate of t obtained by the maximum-pseudolikelihood method is close to the true t value, providingan accurate estimator of time to expansion (Navascues et al.,2009). Moreover, correspondence between estimated expan-sion times and glacial periods is biologically meaningful andtherefore its discussion in this paper was relevant.
In summary: (1) possible ancestral plastid haplotypes andhighest gene diversity and u estimates are found today inCentral America; (2) population expansion has played a majorrole in the distribution of genetic diversity in P. caribaeavar. hondurensis; (3) independent colonization events gaverise to the lineages of P. caribaea var. bahamensis and ofP. caribaea var. caribaea; (4) plastid lineages of P. cubensis,P. maestrensis and P. occidentalis evolved independently andare separate from P. caribaea; (5) there is incomplete lineagesorting between P. cubensis and P. maestrensis plastids,suggesting recent divergence; and (6) all estimated expansiontimes correspond to glacial periods.
SUPPLEMENTARY DATA
Supplementary data are available online at www.aob.oxford-journals.org and consist of the following files. Table S1:Plastid haplotype alellic composition and frequency of eachplastid haplotype, and overall relative frequency. Table S2:Expected change in plastid haplotype diversity when doublingthe sample size for each lineage. Figure S1: Expected accumu-lation of plastid haplotypes for the Pinus species studieddepending on sample size. Figure S2: Expected accumulationof plastid haplotypes for P. caribaea varieties depending onsample size.
ACKNOWLEDGMENTS
We thank L. Rodriguez, E. Garcıa, R. Sotolongo, Y. Garcıa,A. Palmarola, M. Mejıa, C. Espadas, M. Ferrer, V. Rebolledo,
Jardon-Barbolla et al. — Phylogeographical structure in Caribbean pines 239
at University of W
isconsin Madison - G
eneral Library System
on Novem
ber 17, 2011http://aob.oxfordjournals.org/
Dow
nloaded from
F. Chi and D. Escudero, Leon University Herbarium, Pinar delRıo University, Integrated Forest Enterprise of Mayarı, GuisaForestry Station, Belize Wildlife Service, Santo DomingoBotanical Garden for work in the field. Thanks toL. Espinoza-Azuar who helped using the ABI 3100 and toO. Rodriguez who helped with lab work. R. Salas,A. Moreno-Lettelier, V. Alavez and D. Ortega provided insight-ful discussions about plastid haplotype networks andphylogeography. C. Espadas and E. Scheinvar are thanked forhelp with Fig. 4. Thanks to D.S. Gernandt and J. Jaramillofor their comments to improve this manuscript. We thankM. Navascues and C. Burgarella for providing their sourcecode to implement pseudo-likelihood analyses. This work wassupported by CONACYT, (grant number 185586 to LJB), bySEP-CONACYT, (grant number 44373 to PD), SEP-CONACYT (grant number 46925 to DP) and SEMARNAT-CONACYT (grant number 2002-C01-201 to DP). This workis part of the PhD in Biomedical Sciences of LevJardon-Barbolla at the Universidad Nacional Autonoma deMexico.
LITERATURE CITED
Adams DC, Jackson JF. 1997. A phylogenetic analysis of the southern pines(Pinus subsect. Australes Loudon): biogeographical and ecological impli-cations. Proceedings of the Biological Society of Washington 110:681–692.
Afzal-Rafii Z, Dodd R. 2007. Chloroplast DNA supports a hypothesis ofglacial refugia over postglacial recolonization in disjunct populations ofblack pine (Pinus nigra) in western Europe. Molecular Ecology 16:723–736.
Alavez V. 2008. Evolucion de microsatelites de cloroplasto en Pinus pseudos-trobus y Pinus montezumae: efecto del ligamiento en la estimacion deparametros poblacionales y aplicaciones en genetica de poblaciones.BS Thesis, Universidad Nacional Autonoma de Mexico, Mexico.
Avise JC. 2009. Phylogeography, retrospect and prospect. Journal ofBiogeography 36: 3–15.
Barrett WHG, Golfari L. 1962. Descripcion de dos nuevas variedades delpino de Caribe. Caribbean Forestry (in Spanish) 23: 59–71.
Borhidi A. 1988. Vegetation dynamics of the savannization process on Cuba.Plant Ecology 77: 177–183.
Bucci G, Gonzalez-Martinez SC, Le Provost G, et al. 2007. Range-widephylogeography and gene zones in Pinus pinaster Ait. revealed by chlor-oplast microsatellite markers. Molecular Ecology 16: 2137–2153.
Chen J, Tauer CG, Huang Y. 2002. Paternal inheritance patterns in pinehybrids detected with trnL-trnF intergenic region polymorphism.Theoretical and Applied Genetics 104: 1307–1311.
Clement M, Posada D, Crandall KA. 2000. TCS: a computer program to esti-mate gene genealogies. Molecular Ecology 9: 1657–1660.
Corander J, Siren J, Arjas E. 2008. Bayesian spatial modelling of geneticpopulation structure. Computational Statistics 23: 111–129.
Crandall KA, Templeton AR. 1993. Empirical tests of some predictions fromcoalescent theory with applications to intraspecific phylogeny reconstruc-tion. Genetics 134: 959–969.
Cruzan MB, Templeton AR. 2000. Palaeoecology and coalescence: phylo-geographic analysis of hypotheses from the fossil record. Trends inEcology and Evolution 15: 491–496.
Cuenca A, Escalante AE, Pinero D. 2003. Long-distance colonization, iso-lation by distance, and historical demography in a relictual Mexicanpinyon pine (Pinus nelsonii Shaw) as revealed by paternally inheritedgenetic markers (cpSSR). Molecular Ecology 12: 2087–2097.
Davalos LM. 2007. Short-faced bats (Phyllostomidae: Stenodermatina): aCaribbean radiation of strict frugivores. Journal of Biogeography 34:364–375.
Delgado P, Salas-Lizana R, Vazquez-Lobo A, et al. 2007. Introgressivehybridization in Pinus montezumae Lamb. and Pinus pseudostrobusLindl. (Pinaceae): morphological and molecular (cpSSR) evidence.International Journal of Plant Sciences 168: 861–875.
Doyle JJ, Doyle JL. 1987. A rapid DNA isolation procedure for small quan-tities of fresh leaf material. Phytochemical Bulletin, Botanical Society ofAmerica 19: 11–15.
Duplessy JC, Charbit S, Kageyama M, Masson-Delmotte V. 2008.Insolation and sea level variations during Quaternary interglacialperiods: a review. Geoscience 340: 701–710.
Dvorak WS, Jordon AP, Hodge GP, Romero JL. 2000. Assessing the evol-utionary relationships of the pines in the Oocarpae and Australes subsec-tions using RAPD markers. New Forests 20: 163–192.
Dvorak WS, Hamrick JL, Gutierrez EA. 2005. The origin of the Caribbeanpine in the seasonal swamps of the Yucatan. International Journal ofPlant Sciences 166: 985–994.
Eckenwalder JF. 2009. Conifers of the world: the complete reference.Portland, OR: Timber Press.
EPICA Community Members. 2004. Eight glacial cycles from an Antarcticice core. Nature 429: 623–628.
Epperson BK. 1995. Spatial distribution of genotypes under isolation by dis-tance. Genetics 140: 1431–1440.
Estoup A, Rousset F, Michalakis Y, Cornuet JM, Adriamanga M,Guyomard R. 1998. Comparative analysis of microsatellite and allozymemarkers: a case study investigating microgeographic differentiation inbrown trout (Salmo trutta). Molecular Ecology 7: 339–353.
Estoup A, Jarne P, Cornuet JM. 2002. Homoplasy and mutation model atmicrosatellite loci and their consequences for population genetic analysis.Molecular Ecology 11: 1591–1604.
Excoffier L, Laval G, Schneider S. 2005. Arlequin ver. 3.1: an integratedsoftware package for population genetics data analysis. EvolutionaryBioinformatics Online 1: 47–50.
Farjon AF. 1996. Biodiversity of Pinus (Pinaceae) in Mexico: speciation andpaleo-endemism. Botanical Journal of the Linnean Society 121:365–384.
Farjon AF, Styles BT. 1997. Flora Neotropica, Pinus (Pinaceae). New York:The New York Botanical Garden.
Geada-Lopez G, Kamiya K, Harada K. 2002. Phylogenetic relationships ofDiploxylon pines (subgenus Pinus) based on plastid sequence data.International Journal of Plant Sciences 163: 737–747.
Gernandt D, Geada-Lopez G, Ortiz-Garcıa S, Liston A. 2005. Phylogenyand classification of Pinus. Taxon 54: 29–42.
Gernandt D, Magallon S, Geada-Lopez G, Zenon-Flores O, Willyard AS,Liston A. 2008. Use of simultaneous analyses to guide fossil-based cali-brations of Pinaceae phylogeny. International Journal of Plant Sciences169: 1086–1099.
Gillespie JH. 2004. Population genetics: a concise guide, 2nd edn. Baltimore,MD: The Johns Hopkins University Press.
Godbout J, Fazekas A, Newton CH, Yehm FC, Bousquet J. 2008. Glacialvicariance in the Pacific Northwest; evidence from a lodgepole pine mito-chondrial DNA minisatellite for mutiple genetically distinct and widelyseparated refugia. Molecular Ecology 17: 2463–2475.
Goldstein DB, Ruız-Linares A, Feldman M, Cavalli-Sforza LL. 1995. Anevaluation of genetic distances for use with microsatellite loci. Genetics139: 463–471.
Gomez A, Gonzalez-Martınez SC, Collada C, Climent J, Gill L. 2003.Complex population genetic structure in the endemic Canary Islandpine revealed using chloroplast microsatellite markers. Theoretical andApplied Genetics 107: 1123–1131.
Gomez A, Vendramin GG, Gonzalez-Martınez SC, Alıa R. 2005. Geneticdiversity and differentiation of two Mediterranean pines (Pinus halepen-sis Mill. and Pinus pinaster Ait.) along a latitudinal cline using chloro-plast microsatellite markers. Diversity and Distributions 11: 257–263.
Graham A. 1999. Studies in neotropical palaeobotany. XIII. AnOligo-Miocene palynoflora from Simojovel (Chiapas, Mexico).American Journal of Botany 86: 17–31.
Graham SA. 2003. Biogeographical patterns of Antillean Lythraceae.Systematic Botany 28: 410–420.
Hardy OJ, Vekemans X. 1999. Isolation by distance in a continuous popu-lation: reconciliation between spatial autocorrelation analysis and popu-lation genetics models. Heredity 83: 145–154.
Hardy OJ, Vekemans X. 2002. SPAGeDi: a versatile computer program toanalyse spatial genetic structure at the individual or population levels.Molecular Ecology Notes 2: 618–620.
Hardy OJ, Charbonnel N, Freville H, Heuertz M. 2003. Microsatelliteallele sizes: a simple test to assess their significance on genetic differen-tiation. Genetics 163: 1463–1482.
Jardon-Barbolla et al. — Phylogeographical structure in Caribbean pines240
at University of W
isconsin Madison - G
eneral Library System
on Novem
ber 17, 2011http://aob.oxfordjournals.org/
Dow
nloaded from
Hey J, Machado CA. 2003. The study of structured populations – new hopefor a difficult and divided science. Nature Reviews Genetics 4: 535–543.
Hodell DA, Anselmetti FS, Aiztegui D, et al. 2008. An 85-ka record ofclimate change in lowland Central America. Quaternary ScienceReviews 27: 1152–1165.
Iturralde-Vinent M. 2006. Meso-Cenozoic Caribbean paleogeography: impli-cations for historical biogeography of the region. International GeologyReview 48: 791–827.
Jasinska AK, Wachowiak W, Muchewicz E, Boratynska K, MontserratJM, Boratynski A. 2010. Cryptic hybrids between Pinus uncinata andP. sylvestris. Botanical Journal of the Linnean Society 163: 473–485.
Kuhner MK. 2009. Coalescent genealogy samplers: windows into populationhistory. Trends in Ecology and Evolution 24: 86–93.
Lapegue D, Petit RJ. 1997. Phylogeographic structure of white oaks through-out the European continent. Genetics 146: 1475–1487.
Lavin M, Wojchiechowski MF, Gasson P, Hughes C, Wheeler E. 2003.Phylogeny of robinioid legumes (Fabaceae) revisited: Coursetia andGliricida recircumscribed, and biogeographical appraisal of theCaribbean endemics. Systematic Botany 28: 387–409.
Lopez-Almirall A. 1982. Variabilidad del genero Pinus (Coniferales:Pinaceae) en Cuba. Acta Botanica Cubana 12: 1–32.
McDowell T, Volovosek M, Manos P. 2003. Biogeography of Exostema(Rubiaceae) in the Caribbean region in the light of molecular phyloge-netic analyses. Systematic Botany 28: 431–441.
Moreno-Letelier A, Pinero D. 2009. Phylogeographic structure of Pinusstrobiformis Engelm. across the Chihuahuan Desert filter-barrier.Journal of Biogeography 36: 121–131.
Navascues M, Vaxevanidou Z, Gonzalez-Martınez SC, Climent J, Gil L,Emerson BC. 2006. Chloroplast microsatellites reveal colonization andmetapopulation dynamics in the Canary Island pine. Molecular Ecology15: 2691–2698.
Navascues M, Hardy OJ, Burgarella C. 2009. Characterization ofdemographic expansions from the pairwise comparisons of linkedmicrosatellite haplotypes. Genetics 181: 1013–1019.
Negron-Ortiz V, Watson LE. 2003. Hypotheses for the colonization ofthe Caribbean Basin by two genera of the Rubiaceae: Erithalis andErnodea. Systematic Botany 28: 442–451.
Nei M. 1987. Molecular evolutionary genetics. New York: ColumbiaUniversity Press.
Ohta T, Kimura M. 1973. A model of mutation appropriate to estimate thenumber of electrophoretically detectable alleles in a finite population.Genetical Research 22: 201–204.
Omland KE, Lanyon SM, Fritz SJ. 1999. A molecular phylogeny of the NewWorld orioles (Icterus): the importance of dense taxon sampling.Molecular Phylogenetics and Evolution 12: 224–239.
Pannel JR, Charlesworth B. 2000. Effects of metapopulation processes onmeasures of genetic diversity. Philosophical Transactions of the RoyalSociety of London 355: 1851–1864.
Perdices A, Doadrio I, Bermingham E. 2005. Evolutionary history of thesynbranchid eels (Teleostei: Synbranchidae) in Central America an theCaribbean islands inferred from their molecular phylogeny. MolecularPhylogenetics and Evolution 37: 460–473.
Petit JR, Jouzel J, Raynaud D, et al. 1999. Climate atmospheric history ofthe past 420,000 years form the Vostok ice core, Antarctica. Nature399: 429–439.
Pindell J, Kennan L, Stanek KP, Maresch WV, Draper G. 2006.Foundations of Gulf of Mexico and Caribbean evolution: eight controver-sies resolved. Geologica Acta 4: 303–341.
Pons O, Petit RJ. 1996. Measuring and testing genetic differentiation withordered versus unordered alleles. Genetics 144: 1237–1245.
Posada A, Crandall KA. 2001. Intraspecific gene genealogies: trees graftinginto networks. Trends in Ecology and Evolution 16: 37–45.
Provan J, Soranzo N, Wilson NJ, Goldstein D, Powell W. 1999. Alow mutation rate for chloroplast microsatellites. Genetics 153:943–947.
Ray N, Adams JM. 2001. A GIS-based vegetation map of the World at theLast Glacial Maximum (25,000–15,000 BP). Internet Archaeology 11.http://intarch.ac.uk/journal/issue11/rayadams_toc.html
Ribeiro MM, Plomion C, Petit R, Vendramin GG, Szmidt AE. 2001.Variation in chloroplast single-sequence repeats in Portuguese maritimepine (Pinus pinaster Ait.). Theoretical and Applied Genetics 102:97–103.
Ricklefs R, Bermingham E. 2008. The West Indies as a laboratory of biogeo-graphy and evolution. Philosophical Transactions of the Royal Society(B) 363: 2393–2413.
Rodrıguez-Banderas A, Vargas-Mendoza CF, Buonamici A, VendraminGG. 2009. Genetic diversity and phylogeographic analysis of Pinusleiophylla: a post-glacial range expansion. Journal of Biogeography 36:1807–1820.
Rogers AR, Harpending HC. 1992. Population growth makes waves in thedistribution of pairwise genetic differences. Molecular Biology andEvolution 9: 552–569.
Rosenberg NA, Nordborg M. 2002. Genealogical trees, coalescent theory andthe analysis of genetic polymorphisms. Nature Reviews Genetics 3:380–390.
Santiago-Valentın E, Olmstead RG. 2003. Phylogenetics of the AntilleanGoetzoideae (Solanaceae) and their relationships within the Solanaceaebased on chloroplast and ITS DNA sequence data. Systematic Botany28: 452–460.
Santiago-Valentın E, Olmstead RG. 2004. Historical biogeography ofCaribbean plants: introduction to current knowledge and possibilitiesfrom a phylogenetic perspective. Taxon 53: 299–319.
Schneider S, Excoffier L. 1999. Estimation of past demographic parametersfrom the distribution of pairwise differences when the mutation ratesvary among sites. Application to human mitochondrial DNA. Genetics152: 1079–1089.
Slatkin M. 1977. Gene flow and genetic drift in a species subject to frequentlocal extinctions. Theoretical Population Biology 12: 253–262.
Szpiech ZA, Jackobson NA, Rosenberg NA. 2008. ADZE: a rarefactionapproach for counting alleles private to combinations of populations.Bioinformatics 24: 2498–2504.
Templeton AR. 2004. Statistical phylogeography: methods of evaluating andminimizing inference errors. Molecular Ecology 13: 789–809.
Trejo-Torres C, Ackerman JD. 2001. Biogeography of the Antilles based ona parsimony analysis of orchid distributions. Journal of Biogeography 28:775–794.
Vendramin GG, Lelli G, Rossi P, Morgante M. 1996. A set of primers forthe amplification of 20 chloroplast microsatellites in Pinaceae. MolecularEcology 5: 595–598.
Whitlock MC. 2004. Selection and drift in metapopulations. In: Hanski I,Gaggiotti O. eds. Ecology, genetics, and evolution of metapopulations.Amsterdam: Elsevier Academic Press, 153–173.
Willyard A, Cronn R, Liston A. 2009. Reticulate evolution and incompletelineage sorting in the ponderosa pines. Molecular Phylogenetics andEvolution 52: 498–511.
Xu H, Fu YX. 2004. Estimating effective populations size or mutation ratewith microsatellites. Genetics 166: 555–563.
Jardon-Barbolla et al. — Phylogeographical structure in Caribbean pines 241
at University of W
isconsin Madison - G
eneral Library System
on Novem
ber 17, 2011http://aob.oxfordjournals.org/
Dow
nloaded from