Phylogenetics of Kingsnakes, Lampropeltis getula Complex ... · getula Complex (Serpentes:...
13
© The American Genetic Association. 2017. All rights reserved. For permissions, please e-mail: [email protected] 1 Journal of Heredity, 2017, 1–13 doi:10.1093/jhered/esw086 Original Article Original Article Phylogenetics of Kingsnakes, Lampropeltis getula Complex (Serpentes: Colubridae), in Eastern North America Kenneth L. Krysko, Leroy P. Nuñez, Catherine E. Newman, and Brian W. Bowen From the Division of Herpetology, Florida Museum of Natural History, University of Florida, 1659 Museum Road, Gainesville, FL 32611 (Krysko and Nuñez); School of Natural Resources and Environment, University of Florida, Gainesville, FL (Nuñez); Museum of Natural Science, Louisiana State University, Baton Rouge, LA (Newman); Department of Biological Sciences, Louisiana State University, Baton Rouge, LA (Newman); and Hawaii Institute of Marine Biology, University of Hawaii, Kaneohe, Hawaii (Bowen). Address correpondence to K. L. Krysko at the address above, or e-mail: kenneyk@ufl.edu Received July 21, 2016; First decision September 29, 2016; Accepted December 8, 2016. Corresponding Editor: Stephen Karl Abstract Kingsnakes of the Lampropeltis getula complex range throughout much of temperate and subtropical North America. Studies over the last century have used morphology and color pattern to describe numerous subspecies. More recently, DNA analyses have made invaluable contributions to our understanding of their evolution and taxonomy. We use genetic and ecological methods to test previous hypotheses of distinct evolutionary lineages by examining 66 total snakes and 1) analyzing phylogeographic structure using 2 mtDNA loci and 1 nuclear locus, 2) estimating divergence dates and historical demography among lineages in a Bayesian coalescent framework, and 3) applying ecological niche modeling (ENM). Our molecular data and ENMs illustrate that 3 previously recognized subspecies in the eastern United States comprise well-supported monophyletic lineages that diverged during the Pleistocene. The geographic boundaries of these 3 lineages correspond closely to known biogeographic barriers (Florida peninsula, Appalachian Mountains, and Apalachicola River) previously identified for other plants and animals, indicating shared geographic influences on evolutionary history. We conclude that genetic, ecological, and morphological data support recognition of these 3 lineages as distinct species (Lampropeltis floridana, Lampropeltis getula, and Lampropeltis meansi). Subject areas: Molecular systematics and phylogenetics, Conservation genetics and phylogenetics Key words: biogeography, divergence dating, mtDNA, speciation Historical biogeography and ancient barriers to gene flow are major factors in structuring genetic divergences within and between spe- cies (Avise et al. 1987). In many cases, multiple organisms share the same phylogeographic partitions, indicating similar evolution- ary responses to shared biogeographic history (Soltis et al. 2006; Bowen et al. 2016; Krysko et al. 2016). In other cases, a single wide-ranging species actually comprises multiple evolutionary lin- eages or, conversely, multiple recognized species comprise a single genetic lineage (Pfenninger and Schwenk 2007; Puebla et al. 2014). With the increasing knowledge of how ancient barriers to gene flow
Transcript of Phylogenetics of Kingsnakes, Lampropeltis getula Complex ... · getula Complex (Serpentes:...

© The American Genetic Association. 2017. All rights reserved. For permissions, please e-mail: [email protected] 1
Journal of Heredity, 2017, 1–13doi:10.1093/jhered/esw086
Original Article
Original Article
Phylogenetics of Kingsnakes, Lampropeltis getula Complex (Serpentes: Colubridae), in Eastern North AmericaKenneth L. Krysko, Leroy P. Nuñez, Catherine E. Newman, and Brian W. Bowen
From the Division of Herpetology, Florida Museum of Natural History, University of Florida, 1659 Museum Road, Gainesville, FL 32611 (Krysko and Nuñez); School of Natural Resources and Environment, University of Florida, Gainesville, FL (Nuñez); Museum of Natural Science, Louisiana State University, Baton Rouge, LA (Newman); Department of Biological Sciences, Louisiana State University, Baton Rouge, LA (Newman); and Hawaii Institute of Marine Biology, University of Hawaii, Kaneohe, Hawaii (Bowen).
Address correpondence to K. L. Krysko at the address above, or e-mail: [email protected]
Received July 21, 2016; First decision September 29, 2016; Accepted December 8, 2016.
Corresponding Editor: Stephen Karl
Abstract
Kingsnakes of the Lampropeltis getula complex range throughout much of temperate and subtropical North America. Studies over the last century have used morphology and color pattern to describe numerous subspecies. More recently, DNA analyses have made invaluable contributions to our understanding of their evolution and taxonomy. We use genetic and ecological methods to test previous hypotheses of distinct evolutionary lineages by examining 66 total snakes and 1) analyzing phylogeographic structure using 2 mtDNA loci and 1 nuclear locus, 2) estimating divergence dates and historical demography among lineages in a Bayesian coalescent framework, and 3) applying ecological niche modeling (ENM). Our molecular data and ENMs illustrate that 3 previously recognized subspecies in the eastern United States comprise well-supported monophyletic lineages that diverged during the Pleistocene. The geographic boundaries of these 3 lineages correspond closely to known biogeographic barriers (Florida peninsula, Appalachian Mountains, and Apalachicola River) previously identified for other plants and animals, indicating shared geographic influences on evolutionary history. We conclude that genetic, ecological, and morphological data support recognition of these 3 lineages as distinct species (Lampropeltis floridana, Lampropeltis getula, and Lampropeltis meansi).
Subject areas: Molecular systematics and phylogenetics, Conservation genetics and phylogeneticsKey words: biogeography, divergence dating, mtDNA, speciation
Historical biogeography and ancient barriers to gene flow are major factors in structuring genetic divergences within and between spe-cies (Avise et al. 1987). In many cases, multiple organisms share the same phylogeographic partitions, indicating similar evolution-ary responses to shared biogeographic history (Soltis et al. 2006;
Bowen et al. 2016; Krysko et al. 2016). In other cases, a single wide-ranging species actually comprises multiple evolutionary lin-eages or, conversely, multiple recognized species comprise a single genetic lineage (Pfenninger and Schwenk 2007; Puebla et al. 2014). With the increasing knowledge of how ancient barriers to gene flow
have partitioned regional biodiversity, Burbrink et al. (2008, p. 286) raised the question for North American reptiles, “… are there really any single transcontinental squamate species?”
The increased availability of species distribution data combined with fine-scale climate information allow researchers to use predic-tive modeling to test hypotheses about lineage divergence and iden-tify potential areas of sympatry or hybridization (Wiens and Graham 2005; Raxworthy et al. 2007; Kozak et al. 2008). Ecological niche modeling (ENM) combines occurrence data and a set of current cli-mate layers to generate a probability surface of species occurrence. When ENMs are generated for each taxon in question and visualized on a map, low model overlap between taxa may indicate some degree of ecological divergence (Wiens and Graham 2005; Raxworthy et al. 2007; Rissler and Apodaca 2007), facilitating the identification of cryptic species.
Kingsnakes of the Lampropeltis getula complex (Linnaeus) range throughout much of temperate and subtropical North America; along the Pacific coast from Oregon southward to the Mexican Plateau, and eastward to New Jersey and southward to Florida (Figure 1; Krysko 2001). Kingsnakes of this species complex are extremely variable in color pattern, and therefore, along with their mostly docile disposition, are easily recognizable and very popular in the pet trade (Enge 1994; Krysko 2002).
There have been at least 18 subspecies described in this species complex, 12 of which occur west of the Appalachian Mountains,
and 6 in states along the Atlantic seaboard in eastern North America. Blaney (1977) revised the Lampropeltis getula complex using both morphology and color pattern, and recognized only 7 subspe-cies (Figure 1): Lampropeltis getula californiae (Blainville 1835), Lampropeltis getula holbrooki Stejneger 1902, Lampropeltis getula nigra (Yarrow 1882), Lampropeltis getula nigrita Zweifel and Norris 1955, and Lampropeltis getula splendida (Baird and Girard 1853) west of the Appalachian Mountains; and Lampropeltis getula flori-dana Blanchard 1919 and Lampropeltis getula getula (Linnaeus 1766) in eastern North America. Two other taxa in eastern North America are either controversial or recently named. Barbour and Engles (1942) described Lampropeltis getula sticticeps from the Outer Banks of North Carolina based on color pattern and head morphology. Lazell and Musick (1973) supported these findings while other authors remained skeptical (Hillestad et al. 1975; Blaney 1977, 1979; Gibbons and Coker 1978; Palmer and Braswell 1995). Means (1977) hypoth-esized that an unnamed taxon occurred in the Eastern Apalachicola Lowlands in the Florida panhandle, and Krysko (2001) and Krysko and Judd (2006) described this form as Lampropeltis getula meansi based on analyses of mtDNA and morphology. Blaney (1977), Krysko (2001), and Means and Krysko (2001) noted the occurrence of morphological intermediates (i.e., intergrades or hybrids) in zones between these named taxa in eastern North America. Morphological intermediates were defined as commonly found individuals that pos-sess intermediate phenotypic characters between adjacent taxa.
Figure 1. Distribution of kingsnakes in the Lampropeltis getula complex in North America: (A) Lampropeltis californiae (banded); (B) Lampropeltis holbrooki; (C) Lampropeltis nigra; (D) Lampropeltis getula getula; (E) Lampropeltis getula “sticticeps”; (F) Lampropeltis getula floridana; (G–I) Lampropeltis getula meansi (patternless, striped, and wide-banded, respectively); (J) Lampropeltis splendida; (K) Lampropeltis getula nigrita; (L) Lampropeltis californiae (striped). Distributions are modified after Conant and Collins (1998), Krysko (2001), Stebbins (2003), Krysko and Judd (2006), and Pyron and Burbrink (2009a, 2009b). See online color version.
2 Journal of Heredity, 2017, Vol. 00, No. 00

Krysko (2001) analyzed the 2 mitochondrial loci cytochrome b (cyt b) and the nicotinamide adenine dinucleotide dehydrogenase subunit 4 (ND4) region; cyt b alone resulted in all samples in eastern North America yielding one large polytomy, the ND4 region alone revealed some population genetic structure, but the concatenated sequences revealed three shallow genetic lineages that correspond to L. g. floridana, L. g. getula, and L. g. meansi. Subsequently, Pyron and Burbrink (2009a, 2009b) provided a much greater sampling regime west of the Appalachian Mountains, and elevated 5 subspe-cies (L. g. californiae, Lampropeltis getula spendida, L. g. holbrooki, L. g. nigra, and L. g. getula) to species status; however, based solely on analysis of cyt b they recognized a single lineage (L. getula) east of the Appalachian Mountains, and they did not examine samples for L. g. nigrita from Mexico.
The distinct morphology and color patterns found in the Lampropeltis getula complex, along with its transcontinental geo-graphic distribution and occasional disjunct populations across the North American landscape make a fascinating subject for phyloge-ography. Herein, we increase our sampling effort in eastern North America and add a nuclear DNA locus to our data set to test previ-ous hypotheses of distinct genetic lineages by 1) reanalyzing phylo-geographic structure, 2) estimating divergence dates and historical demography among lineages in a Bayesian coalescent framework, and 3) analyzing niche differentiation and overlap using ENMs. For clarity and historic purposes, we treat named taxa in eastern North America (L. g. floridana, L. g. getula, and L. g. meansi) and L. g. nigrita from Mexico as subspecies prior to our species recogni-tion in this current study.
Materials and Methods
Laboratory TechniquesWe used DNA sequence data from a total of 66 snakes (Table 1, Figures 1 and 2); including 56 individuals from the Lampropeltis getula complex in eastern North America and outgroups consisting of 8 individuals from subspecies (1 L. g. nigrita) and recently elevated taxa (2 L. holbrooki, 3 L. nigra, 1 L. spendida, 1 L. californiae) west of the Appalachian Mountains; one of the sister taxon, short-tailed Kingsnake, L. extenuata; and one from the closely related Scarlet Snake, Cemophora coccinea. In addition to the new DNA data provided herein, this study utilizes sequences from Krysko (2001) and GenBank: L. spendida: spectrin beta nonerythrocytic intron 1 (SPTBN1; Ruane et al. 2014); L. californiae: SPTBN1 (Burbrink et al. 2012); Lampropeltis extenuata: cyt b (Burbrink and Lawson 2007), ND4 region (Rodríguez-Robles and de Jesús-Escobar 1999), SPTBN1 (Ruane et al. 2014); and C. coccinea: cyt b (Lawson et al. 2005), SPTBN1 (Burbrink and Lawson 2007). To facilitate compari-son between phylogeographic findings and previous morphological results, 46 of 66 (69.7%) of the individuals were used in both molec-ular and morphological analyses, including those that are considered morphological intermediates (i.e., intergrades or hybrids, depending on taxonomic nomenclature used; Krysko and Judd 2006).
DNA sequence data were obtained from blood, muscle tissue, shed skins, and bone. Between 0.5 and 1.0 mL of blood was taken from the caudal vein of live specimens and stored in lysis buffer (100 mM Tris–HCl, pH 8; 100 mM EDTA, pH 8; 10 mM NaCl; 1.0% sodium dodecyl sulfate) in approximately 1:10 blood to buffer ratio (White and Densmore 1992). Muscle tissue was taken from salvaged dead-on-road (DOR) specimens and stored in SED buffer (saturated NaCl; 250 mM EDTA, pH 7.5; 20% DMSO; Amos and Hoelzel 1991, Proebstel et al. 1993) or 95% ethanol. DNA isolations
were conducted following Hillis et al. (1990) for blood and mus-cle tissue, Clark (1998) for air-dried shed skins, Iudica et al. (2001) for bone, or QIAquick PCR Purification Kit and DNeasy Blood and Tissue Kit (Qiagen Sciences, LLC) and ZR Genomic DNA™ Tissue Microprep Kit (Zymo Research, LLC) for muscle tissue and shed skins, following manufacturers recommendations.
We amplified, sequenced, and analyzed a total of 2679 bp from mtDNA cyt b; (1083 bp), mtDNA ND4 region (781 bp), and nuclear locus SPTBN1 (815 bp). Cytochrome b was amplified using the primers CYB 2 (Kessing et al. 1989), LGL765 (Bickham et al. 1995), H15919 (Fetzner 1999), L14910 and H16064 (Burbrink et al. 2000), and CYB 1L, CYB 2L, CYB 1H, CYB 2H (Krysko 2001). The ND4 region consisted of the ND4 gene and subsequent transfer ribonu-cleic acids tRNAHis and tRNASer, and was amplified using the primers ND4 and Leu (Arevalo et al. 1994; Rodríguez-Robles and de Jesús-Escobar 1999), and ND4-L1 and ND4-H1 (Krysko et al. 2016). Because mtDNA is inherited as a single linkage unit, we expect that phylogenies from cyt b and ND4 region would yield convergent gene trees. SPTBN1 was amplified using the primers SPTBN1_F_APR and SPTBN1_R_APR (Ruane et al. 2014), and was chosen because it represents an informative, single-copy locus that is likely evolving at a different rate than mtDNA loci (Townsend et al. 2008; Ruane et al. 2014). All 66 samples were sequenced for both mtDNA mark-ers, and a subset (n = 19) of individuals were sequenced for SPTBN1 (Table 1).
PCR was conducted in 25 μL reactions: 12.5 μL H2O, 9.5 μL Apex™ Taq Red Master Mix 2.0X (2× buffer, 200 μM dNTPs, 1.5 mM MgCl2), 1 μL each primer (10 μM), and 1 μL template DNA. PCR parameters for mtDNA included initial denaturing at 94 °C for 3 min, followed by 35 cycles of amplification: denaturing at 94 °C for 1 min, annealing at 52 °C for 1 min, and extension at 72 °C for 1 min, followed by a final extension at 72 °C for 7 min. PCR parameters for SPTBN1 included initial denaturing at 94 °C for 1.5 min, followed by 1) 5 cycles of amplification: denaturing at 94 °C for 30 s, annealing at 51 °C for 30 s, and extension at 72 °C for 1.5 min; 2) 10 cycles of amplification: denaturing at 94 °C for 30 s, annealing at 49 °C for 30 s, and extension at 72 °C for 1.5 min; and 3) 30 cycles of amplification: denaturing at 94 °C for 30 s, annealing at 48 °C for 30 s, and extension at 72 °C for 1.5 min, followed by a final extension at 72 °C for 7 min (Sheehy 2012). PCR products were electrophoresed on 1% agarose gels, visualized with GelRed™ staining (Biotium, Inc., Hayward, CA), and compared with a DNA size standard. DNA sequences were resolved on various automated sequencers (Genomics Division, Interdisciplinary Center for Biotechnology Research, University of Florida) and assembled and edited with Geneious ver. 6.1 (http://www.geneious.com).
Phylogenetic AnalysesFor the combined mtDNA and nDNA analyses, a mixed-model approach was performed to infer trees and assess node support using models specific to each gene. The Bayesian information crite-rion (BIC) in MEGA determined the best-fit nucleotide substitution models to be HKY (Hasegawa et al. 1985) with gamma distributed rate heterogeneity (HKY + Γ) for cyt b and ND4 region, and HKY for SPTBN1.
Bayesian inference analyses were conducted using BEAST ver. 1.8 (Drummond and Rambaut 2007) on the UF-HPC Galaxy instance (http://hpc.ufl.edu; Giardine et al. 2005; Blankenberg et al. 2010; Goecks et al. 2010). A relaxed clock method was used to infer line-age relationships without having to rely on a potentially arbitrary molecular clock (Drummond et al. 2006). An uncorrelated lognormal
Journal of Heredity, 2017, Vol. 00, No. 00 3
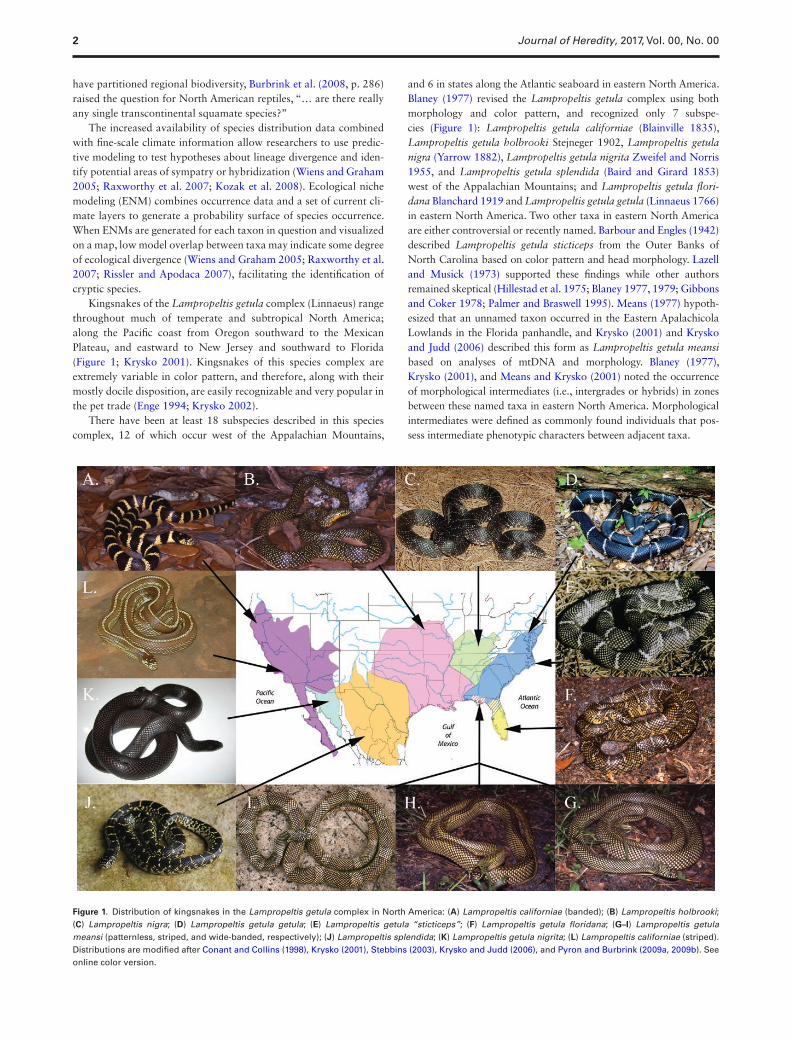
Table 1. Lineage; mitochondrial haplotype; sample; locality, voucher (Lab [Lg] No.); and GenBank accession numbers (cytochrome b, ND4 region, and SPTBN1, respectively) for Kingsnakes (Lampropeltis) and outgroup taxa used in molecular analyses
Lineage Haplotype Sample Locality Voucher GenBank
Atlantic coast A GA, Banks Co.* U.S.A.: Georgia, Banks County, Yonah Church Rd, 9.8 km NW Homer
UF 128267 (Lg 117, KLK 350)
DQ360333, DQ360466, KU664812
Atlantic coast B GA, Walton Co.* U.S.A.: Georgia, Walton County, Loganville
UF 121162 (Lg 119)
DQ360336, DQ360469, —
Atlantic coast C SC, Charleston Co.* U.S.A.: South Carolina, Charleston County, Edisto Island
UF 128282 (Lg 120, KLK 528)
DQ360337, DQ360470, —
Atlantic coast D SC, Greenwood Co.* U.S.A.: South Carolina, Greenwood County, US 221, 2.6 km W Hwy 10
UF 128284 (Lg 129, KLK 522)
DQ360338, DQ360471, —
Atlantic coast E SC, McCormick Co. U.S.A.:South Carolina, McCormick County, Long Cane Creek, SR 81 and SR 28
(Lg 24, KLK 531)
DQ360339, DQ360472, —
Atlantic coast F SC, Jasper Co.* U.S.A.: South Carolina, Jasper County UF 128280 (Lg 99, KLK 526)
DQ360340, DQ360473, —
Atlantic coast G GA, Mitchell Co.* U.S.A.: Georgia, Mitchell County, Cotton
(Lg 17, KME m27)
DQ360342, DQ360475, —
Atlantic coast G GA, Randolph Co.* U.S.A.: Georgia, Randolph County UF 128285 (Lg 133, KLK 523)
DQ360343, DQ360476, —
Atlantic coast G *NC, Dare Co.* U.S.A.: North Carolina, Dare County, Hatteras Island
UF 128281 (Lg 111, KLK 525)
DQ360341, DQ360474, —
Atlantic coast H *NC, Dare Co.* U.S.A.: North Carolina, Dare County, Hatteras Island
UF 128283 (Lg 121, KLK 530)
DQ360346, DQ360479, —
Atlantic coast H *NC, Dare Co.* U.S.A.: North Carolina, Dare County, Hatteras Island
(Lg 104, KLK 532)
DQ360347, DQ360480, —
Atlantic coast H NC, Watauga Co.* U.S.A.: North Carolina, Watauga County, Triplett
UF 128275 (Lg 29, KLK 520)
DQ360344, DQ360477, —
Atlantic coast H SC, Charleston Co.* U.S.A.: South Carolina, Charleston County, Adams Run
UF 128278 (Lg 37, KLK 521)
DQ360345, DQ360478, —
Atlantic coast I NJ, Monmouth Co. U.S.A.: New Jersey, Monmouth County
UF 175393 (Lg 141, KLK 3181
KU727166, KU727165, KU664825
Apalachicola J FL, Liberty Co.* U.S.A.: Florida, Liberty County, SR 67, 3.7 km S SR 20
UF 105383 (Lg 10, KLK 211)
DQ360325, DQ360458, —
Apalachicola K FL, Liberty Co.* U.S.A.: Florida, Liberty County, SR 67, N Franklin County line
UF 128266 (Lg 26, KLK 213)
DQ360326, DQ36045, KU664824
Apalachicola L FL, Liberty Co.* U.S.A.: Florida, Liberty County, NFR 103 and NFR 116
UF 114323 (Lg 27, LEK 239)
DQ360327, DQ360460, —
Apalachicola L FL, Liberty Co.* U.S.A.: Florida, Liberty County, NFR 103 and NFR 116
UF 114322 (Lg 28, KLK 240)
DQ360328, DQ360461, —
Apalachicola M FL, Liberty Co.* U.S.A.: Florida, Liberty County UF 128276 (Lg 30, DBM 104)
DQ360329, DQ360462, —
Apalachicola N FL, Liberty Co.* U.S.A.: Florida, Liberty County, NFR 110, 2.9 km S NFR 111
(Lg 32, DBM 50) DQ360330, DQ360463, KU664823
Apalachicola O FL, Liberty Co.* U.S.A.: Florida, Liberty County, NFR 139
(Lg 58, KLK 247)
DQ360331, DQ360464, KU664822
Apalachicola P FL, Liberty Co. U.S.A.: Florida, Liberty County (Lg 31, KLK 537)
DQ360332, DQ360465, KU664821
Apalachicola Q FL, Franklin Co.* U.S.A.: Florida, Franklin County, US 98, 7 km E CR 30E
UF 128263 (Lg 45, KLK 220)
DQ360323, DQ360456, —
Apalachicola R FL, Franklin Co.* U.S.A.: Florida, Franklin County, Tates Hell Swamp, New River
UF 128262 (Lg 55, KLK 231)
DQ360324, DQ360457, —
Apalachicola S FL, Bay Co.* U.S.A.: Florida, Bay County, SR 22, 32.1 km W Wewahitchka
UF 109826 (Lg 52, KLK 227)
DQ360310, DQ360443, —
Apalachicola S *FL, Calhoun Co.* U.S.A.: Florida, Calhoun County, Blountstown
UF 114321 (Lg 5, KLK 31)
DQ360308, DQ360441, —
Apalachicola S *FL, Calhoun Co. U.S.A.: Florida, Calhoun County, Blountstown
(Lg 6, KLK 32) DQ360309, DQ360442, —
Apalachicola S FL, Franklin Co.* U.S.A.: Florida, Franklin County, US 98, 9.5 km W Carrabelle
UF 128273 (Lg 46, KLK 221)
DQ360312, DQ360445, —
Apalachicola S *FL, Leon Co.* U.S.A.: Florida, Leon County, Bloxham cutoff
(Lg 13, KME m3)
DQ360311, DQ360444, —
Apalachicola T *FL, Gadsden Co.* U.S.A.: Florida, Gadsden County, US 90 5.7 km W Quincy
UF 128271 (Lg 47, KLK 222)
DQ360313, DQ360446, —
4 Journal of Heredity, 2017, Vol. 00, No. 00
Lineage Haplotype Sample Locality Voucher GenBank
Apalachicola U *FL, Gulf Co.* U.S.A.: Florida, Gulf County, Port St. Joe
(Lg 11, KME m25)
DQ360314, DQ360447, —
Apalachicola V * FL, Gulf Co.* U.S.A.: Florida, Gulf County, Port St. Joe
(Lg 15, KME m26)
DQ360315, DQ360448, —
Apalachicola W FL, Holmes Co.* U.S.A.: Florida, Holmes County, Rt 179A, 3.8 km SW SR 2
UF 128261 (Lg 65, KLK 257)
DQ360316, DQ360449, —
Apalachicola X *FL, Jackson Co.* U.S.A.: Florida, Jackson County, CR 271
(Lg 107, KLK 491)
DQ360317, DQ360450, —
Apalachicola Y FL, Jefferson Co.* U.S.A.: Florida, Jefferson County, Goosepasture Rd, 1.9 km S Tram Rd
UF 128270 (Lg 50, KLK 225)
DQ360318, DQ360451, —
Apalachicola Z FL, Jefferson Co. U.S.A.: Florida, Jefferson County (Lg 105, KLK 538)
DQ360319, DQ360452, —
Apalachicola aa *FL, Leon Co.* U.S.A.: Florida, Leon County, Meridian Rd, 0.2 km S Meridian Hills Rd
UF 128272 (Lg 51, KLK 226)
DQ360320, DQ360453, —
Apalachicola bb *FL, Wakulla Co.* U.S.A.: Florida, Wakulla County, NFR 312 and 313
(Lg 12, KME m13)
DQ360321, DQ360454, —
Apalachicola bb *FL, Wakulla Co.* U.S.A.: Florida, Wakulla County, Arran
(Lg 14, KME f3) DQ360322, DQ360455, —
Apalachicola cc GA, Echols Co.* U.S.A.: Georgia, Echols County, Statenville
UF 128274 (Lg 18, KME m10)
DQ360334, DQ360467, —
Apalachicola dd GA, Thomas Co.* U.S.A.: Georgia, Thomas County, Ochlockonee River
UF 128286 (Lg 134, KLK 524)
DQ360335, DQ360468, —
Florida peninsula ee FL, Charlotte Co. U.S.A.: Florida, Charlotte County, SR 776, S Englewood
(Lg 34, KLK 533)
DQ360293, DQ360426, KU664820
Florida peninsula ff FL, Miami-Dade Co. U.S.A.: Florida, Miami-Dade County, C-110 canal
(Lg 3, KLK 94021)
DQ360294, DQ360427, KU664819
Florida peninsula gg FL, Miami-Dade Co. U.S.A.: Florida, Miami-Dade County, Miami, 0.2 mi E SR 997
(Lg 7, KLK 161) DQ360295, DQ360428, —
Florida peninsula hh FL, Hendry Co. U.S.A.: Florida, Hendry County, Hwy 80A, 18 km SE Clewiston
(Lg 19, KLK 534)
DQ360300, DQ360433, KU664818
Florida peninsula hh FL, Palm Beach Co. U.S.A.: Florida, Palm Beach County, King Ranch S South Bay
(Lg 20, KLK 535)
DQ360299, DQ360432, —
Florida peninsula ii FL, Lee Co.* U.S.A.: Florida, Lee County, Gasparilla Island, Boca Grande
UF 128277 (Lg 35, KLK 527)
DQ360296, DQ360429, —
Florida peninsula ii *FL, Pinellas Co.* U.S.A.: Florida, Pinellas County, Pinellas Park
UF 121121 (Lg 4, KLK 30)
DQ360297, DQ360430, —
Florida peninsula jj FL, Monroe Co.* U.S.A.: Florida, Monroe County, Key Largo
UF 123777 (Lg 36, KLK 490)
DQ360298, DQ360431, KU664817
Florida peninsula kk *FL, Dixie Co.* U.S.A.: Florida, Dixie County, CR 361, 5.7 km S Rocky Creek
UF 128269 (Lg 115, KLK 316)
DQ360301, DQ360434, —
Florida peninsula ll *FL, Duval Co.* U.S.A.: Florida, Duval County, Jacksonville
(Lg 16, KME f11)
DQ360302, DQ360435, —
Florida peninsula mm *FL, Hernando Co.* U.S.A.: Florida, Hernando County, Hernando Beach
UF 111101 (Lg 23, KLK 230)
DQ360303, DQ360436, —
Florida peninsula nn FL, Hillsborough Co. U.S.A.: Florida, Hillsborough County, Gibsonton
(Lg 8, KLK 195) DQ360304, DQ360437, —
Florida peninsula oo *FL, Levy Co. U.S.A.: Florida, Levy County, N Cedar Key
(Lg 22, KLK 536)
DQ360305, DQ360438, KU664816
Florida peninsula pp *FL, Levy Co. U.S.A.: Florida, Levy County, Cedar Key
(Lg 116, KLK 539)
DQ360336, DQ360469, —
Florida peninsula qq *FL, Pinellas Co. U.S.A.: Florida, Pinellas County, Gandy Blvd
(Lg 2, KLK 160) DQ360337, DQ360470, KU664815
rr Lampropeltis holbrooki*
U.S.A.: Louisiana, Terrebonne Parish, Houma
(Lg 59, KLK 519)
DQ360348, DQ360481,KU664813
ss L. holbrooki* U.S.A.: Mississippi, Perry County UF 128260 (Lg 90, KLK 259)
DQ360349, DQ360482, KU664814
tt Lampropeltis nigra* U.S.A.: Kentucky, Trigg County UF 128264 (Lg 93, KLK 262)
DQ360350, DQ360483, —
uu L. nigra U.S.A.: Tennessee, Stewart County (Lg 96 KLK 529) DQ360351, DQ360484, KU664811
uu L. nigra* U.S.A.: Kentucky, Calloway County UF 128259 (Lg 56, KLK 232)
DQ360352, DQ360485, —
Table 1. Continued
Journal of Heredity, 2017, Vol. 00, No. 00 5
relaxed clock with constant population size, estimated base frequen-cies, randomly generated starting tree, and exponential uncorrelated lognormal relaxed clock mean (ucld.mean) priors were used. Two independent runs were performed consisting of three heated and one cold Markov chain Monte Carlo (MCMC) run for 30 million gen-erations with every 3000 sample being retained. Both MCMC runs were analyzed independently (to confirm chains were converging
and not sampling local optima) using Tracer ver. 1.6 (http://beast.bio.ed.ac.uk/Tracer) for ESS values >200, as well as for a split stand-ard deviation less than 0.005 for −lnL tree values among chains that indicate parameter stationarity was achieved. Trees sampled prior to stationarity were discarded as burn-in, which occurred prior to 3 million generations. Trees from both independent MCMC runs were combined and burn-in was removed using LogCombiner ver. 1.8. The best statistically supported tree (i.e., maximum clade credibility tree) with mean heights was obtained using TreeAnnotator ver. 1.8 in BEAST. A phylogenetic hypothesis with posterior probabilities and estimated divergence dates was created using FigTree ver. 1.4 (http://tree.bio.ed.ac.uk/software/figtree/). The most credible infer-ences of phylogenetic relationships were confined to nodes where posterior probability was ≥95% (Felsenstein 2004).
Divergence DatingFossil data in the form of parametric distributions offer a high degree of flexibility in integrating a time scale into a phylogenetic analysis (Morrison 2008; Ho and Phillips 2009). For the combined mtDNA and nDNA analyses, we used two fossil calibrations with BEAST, mostly following Ruane et al. (2014). We used a minimum age of 12.35 million years ago (Ma) for the most recent common ances-tor (MRCA) between the genera Cemophora and Lampropeltis (ln mean = 2.514) ± 0.23 lognormal standard deviation (Morrison 2008; Ho and Phillips 2009) yielding a 95% prior credible interval (PCI) of 8.4–18.0 Ma, which incorporates the oldest known Lampropeltis (Lampropeltis similis; see Holman 2000). We provided a sec-ond calibration point for the MRCA between the 2 closely related L. extenuata and L. getula complex with a minimum age of 7.6 Ma (ln mean = 2.028) ± 0.22 lognormal standard deviation yielding a 95% prior credible interval (PCI) of 5.2–10.9 Ma based on the old-est known L. getula and Stilosoma vetustum (=Lampropeltis vetusta) (Auffenberg 1963; Holman 2000; Hulbert 2001) from the Miocene.
Historical DemographyWe used Bayesian skyline plots (BSPs) in BEAST to evaluate his-torical population demography, particularly to determine if Lampropeltis lineages in eastern North America had undergone population declines, expansions, or remained stable during the most recent glacial advances and retreats. BSPs evaluate the coa-lescent history of each locus and allows tracing of Ne over time without requiring a specified demographic model (i.e., constant size, exponential growth, etc.). We used a mixed-model analysis using the same substitution models as above, and partitioned cyt b,
Lineage Haplotype Sample Locality Voucher GenBank
vv Lampropeltis splen-dida
(JF25sY), FTB 1554
AF337081, —, KF215128
ww Lampropeltis nigrita Mexico: Sonora (JF14sY) AF337070, KU727164, —xx Lampropeltis cali-
forniae(JF23sY), FTB 1530
AF337079, KU727163, JX648606
yy Lampropeltis ex-tenuata
LSUMZ 40624, UF 150109
DQ902131, AF138776, KF215118
zz Cemophora coccinea U.S.A.: Florida, Liberty County, Apalachicola National Forest
CAS 203080 AF471091, DQ902282, KU727167
An asterisk before and after sample name indicates identified morphological intermediate (i.e., putative hybrid) and/or identical sample was used in morphological analyses, respectively (Krysko and Judd 2006).
Table 1. Continued
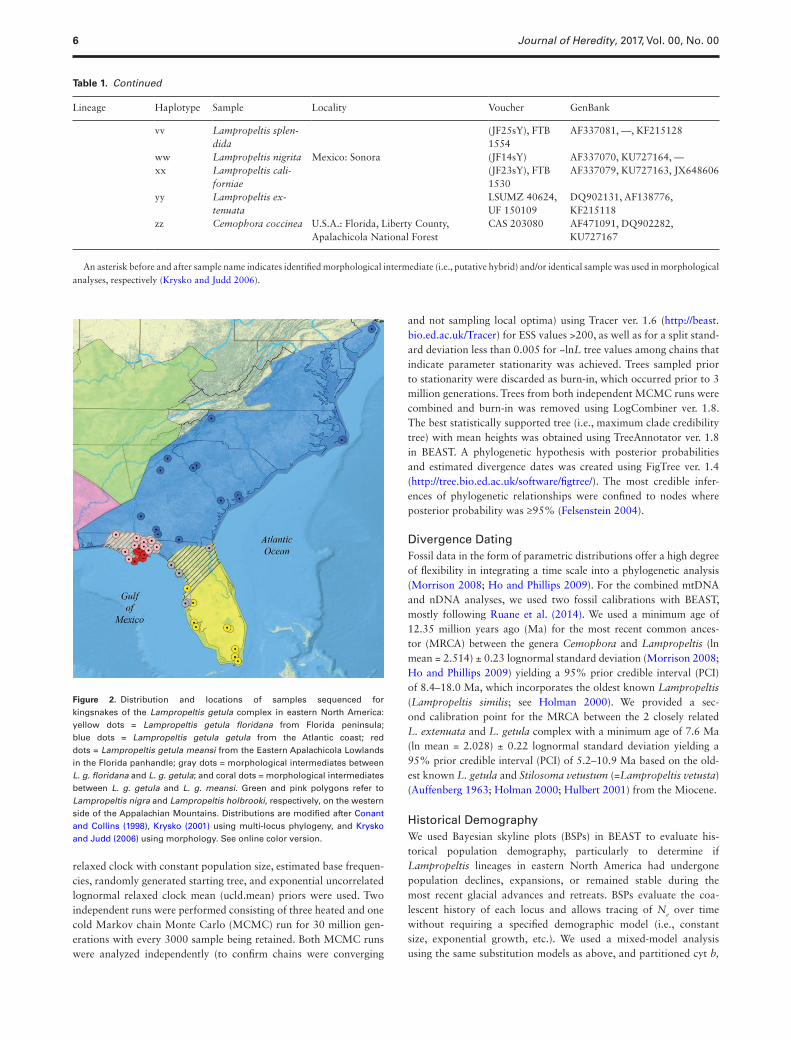
Figure 2. Distribution and locations of samples sequenced for kingsnakes of the Lampropeltis getula complex in eastern North America: yellow dots = Lampropeltis getula floridana from Florida peninsula; blue dots = Lampropeltis getula getula from the Atlantic coast; red dots = Lampropeltis getula meansi from the Eastern Apalachicola Lowlands in the Florida panhandle; gray dots = morphological intermediates between L. g. floridana and L. g. getula; and coral dots = morphological intermediates between L. g. getula and L. g. meansi. Green and pink polygons refer to Lampropeltis nigra and Lampropeltis holbrooki, respectively, on the western side of the Appalachian Mountains. Distributions are modified after Conant and Collins (1998), Krysko (2001) using multi-locus phylogeny, and Krysko and Judd (2006) using morphology. See online color version.
6 Journal of Heredity, 2017, Vol. 00, No. 00
ND4 region, and SPTBN1 into three linked codon positions. We used a strict clock with lineage-specific substitution rates (e.g., 4.3E-3 for Atlantic Coast, 5E-3 for Eastern Apalachicola Lowlands + surround-ing region, and 5E-3 for Florida Peninsula lineages) obtained from our phylogeny, along with Bayesian Skyline Coalescent, 10 grouped coalescent intervals, and randomly generated starting tree priors. BSPs were estimated for 100 million generations with every 1 mil-lion sample being retained. Using Tracer, we confirmed ESS values >200, discarded 10 million generations as burn-in, and conducted Bayesian Skyline Reconstructions. For comparisons of tracing of Ne over time with BSPs, we also calculated the nongenealogical coa-lescent methods of Ramos-Onsins and Rozas’s R2 (Ramos-Onsins and Rozas 2002), Fu and Li’s D* (Fu and Li 1993), and Tajima’s D* (Tajima 1989) to determine the stability of population growth in each lineage using DnaSP (ver. 5.10.01; Rozas 2009). Our null hypothesis assumes a stable population size. According to Fu and Li’s D* and Tajima’s D*, a stable population size would be close to zero, whereas a significant negative value would suggest a recent population expansion and a significant positive value would sug-gest a recent population decline or bottleneck (Burbrink and Castoe 2009; Shepard and Burbrink 2009). A significant positive value of R2 indicates a recent population expansion and a significant negative value indicates a recent population decline or bottleneck (Ramos-Onsins and Rozas 2002). BSPs may be more sensitive at tracing Ne over time than nongenealogical methods that do not consider phy-logenetic structure (Felsenstein 1992; Pybus et al. 2000; Pilkington et al. 2008; Shepard and Burbrink 2009).
Summary statistics were calculated using DnaSP. Sequence comparisons for the number of informative characters and unique haplotypes were obtained. Using haploid data, we estimated within lineage and overall genetic variation with differentiation (χ2) and levels of population genetic divergence and migration rate (FST and Nm, respectively; Hudson et al. 1992) with 10 000 permutation test replicates (Librado and Rozas 2009).
Ecological Niche ModelingBased on the mtDNA phylogeny (see Results), tissue sample localities were classified into 3 clades (L. g. getula, L. g. floridana, L. g. meansi) and plotted on a map in ArcGIS ver. 10.1 (Environmental Systems Research Institute, Redlands, CA). We generated a minimum con-vex polygon (MCP) around the points for each lineage and used these MCPs as a conservative estimate of lineage distributions. All collection localities (latitude, longitude) were downloaded from the online databases VertNET (vertnet.org) and GBIF (gbif.org). Only those collection localities falling within one of the MCPs were used to create the models. Because there is no evidence that hybrid zones are inhabited exclusively by hybrids, identified morphological inter-mediate specimens used in the genetic analyses were included when generating the MCPs, but to be conservative, all designated morpho-logical intermediates were excluded from the ENMs.
To generate the ENMs, we used the 19 WorldClim bioclimatic layers (http://www.worldclim.org) representing various trends in precipitation and temperature from 1950–2000 (Hijmans et al. 2005). Spatial resolution of the layers was 1 km2. ENMs were gener-ated in Maxent vers. 3.2.19 (Phillips et al. 2006) using default set-tings, the 19 climate layers, and the NHC species occurrence data. ENMs were converted from ASCII format to raster in ArcGIS and visualized on a map.
To analyze niche overlap, each ENM was converted from a con-tinuous distribution to binary (presence/absence), with presence cells coded as 1 and absence cells coded as 0. Presence threshold
was arbitrarily set at the lowest probability value for an occurrence point (Pearson et al. 2007; Raxworthy et al. 2007). The ENMs for L. g. getula, L. g. floridana, and L. g. meansi were then overlaid on a map, and the Weighted Sum (Spatial Analyst) tool was used to sum the 3 rasters. In the resulting sum raster, cells with a value of 2 represented areas of overlap between 2 ENMs; there was no overlap between all 3 ENMs. Once the ENMs were mapped and areas of overlap were highlighted, hybrid specimens were plotted on the map, and concordance between location of hybrids and predicted hybrid zones based on ENMs was analyzed by determining the number of hybrid specimens that were located in a cell where 2 ENMs overlap (i.e., predicted hybrid zones).
Because the entire ENM for L. g. meansi was within the range of L. g. getula (see Results), we further investigated whether L. g. meansi is restricted to a subset of climatic conditions occu-pied by L. g. getula. To examine variation in climatic suitability for each subspecies in environmental space, we extracted bioclim data for each L. g. meansi and L. g. getula locality point in DIVA vers. 5.4 (Hijmans et al. 2001), from the same set of bioclim layers used to build the ENMs, and ran a principle components analysis (PCA).
Results
Sequence comparisons including outgroup taxa from the 66 speci-mens revealed 369 polymorphic sites, and 171 parsimony-inform-ative characters within the analyzed 2679 bp of combined mtDNA and nDNA. The full coverage among all samples for only the mtDNA loci revealed 52 unique haplotypes with haplotype diversity h = 0.988 (A–zz; Table 1). Genbank accession numbers are listed in Table 1.
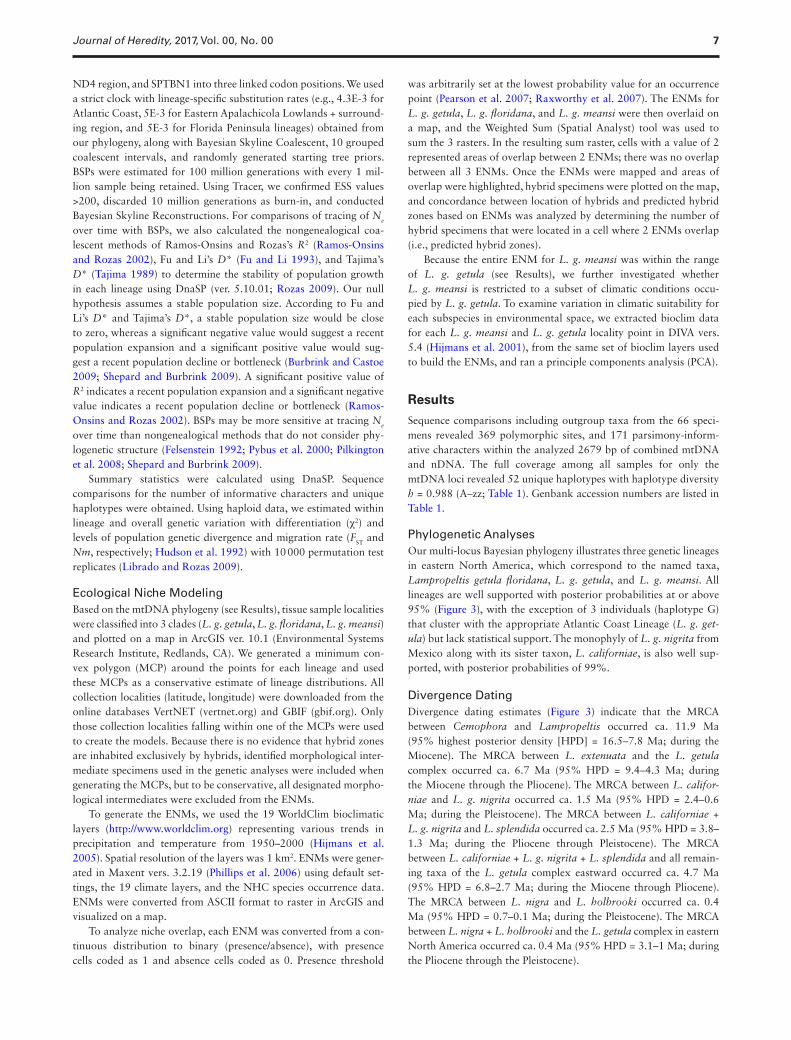
Phylogenetic AnalysesOur multi-locus Bayesian phylogeny illustrates three genetic lineages in eastern North America, which correspond to the named taxa, Lampropeltis getula floridana, L. g. getula, and L. g. meansi. All lineages are well supported with posterior probabilities at or above 95% (Figure 3), with the exception of 3 individuals (haplotype G) that cluster with the appropriate Atlantic Coast Lineage (L. g. get-ula) but lack statistical support. The monophyly of L. g. nigrita from Mexico along with its sister taxon, L. californiae, is also well sup-ported, with posterior probabilities of 99%.
Divergence DatingDivergence dating estimates (Figure 3) indicate that the MRCA between Cemophora and Lampropeltis occurred ca. 11.9 Ma (95% highest posterior density [HPD] = 16.5–7.8 Ma; during the Miocene). The MRCA between L. extenuata and the L. getula complex occurred ca. 6.7 Ma (95% HPD = 9.4–4.3 Ma; during the Miocene through the Pliocene). The MRCA between L. califor-niae and L. g. nigrita occurred ca. 1.5 Ma (95% HPD = 2.4–0.6 Ma; during the Pleistocene). The MRCA between L. californiae + L. g. nigrita and L. splendida occurred ca. 2.5 Ma (95% HPD = 3.8–1.3 Ma; during the Pliocene through Pleistocene). The MRCA between L. californiae + L. g. nigrita + L. splendida and all remain-ing taxa of the L. getula complex eastward occurred ca. 4.7 Ma (95% HPD = 6.8–2.7 Ma; during the Miocene through Pliocene). The MRCA between L. nigra and L. holbrooki occurred ca. 0.4 Ma (95% HPD = 0.7–0.1 Ma; during the Pleistocene). The MRCA between L. nigra + L. holbrooki and the L. getula complex in eastern North America occurred ca. 0.4 Ma (95% HPD = 3.1–1 Ma; during the Pliocene through the Pleistocene).
Journal of Heredity, 2017, Vol. 00, No. 00 7
In eastern North America, the MRCA between cohorts in the Florida peninsula (L. g. floridana) and Atlantic coast (L. g. getula) + Eastern Apalachicola Lowlands (L. g. meansi) occurred ca. 0.54 Ma (95% HPD = 0.8–0.2 Ma; during the Pleistocene), and the MRCA between L. g. getula and L. g. meansi occurred ca. 0.45 Ma (95% HPD = 0.7–0.2 Ma; during the Pleistocene). Extant hap-lotypes within the Florida peninsula, Atlantic coast, and Eastern Apalachicola Lowlands + surrounding region lineages, each coalesce to a MRCA ca. 0.3 Ma (95% HPD = 0.5–0.1 Ma).
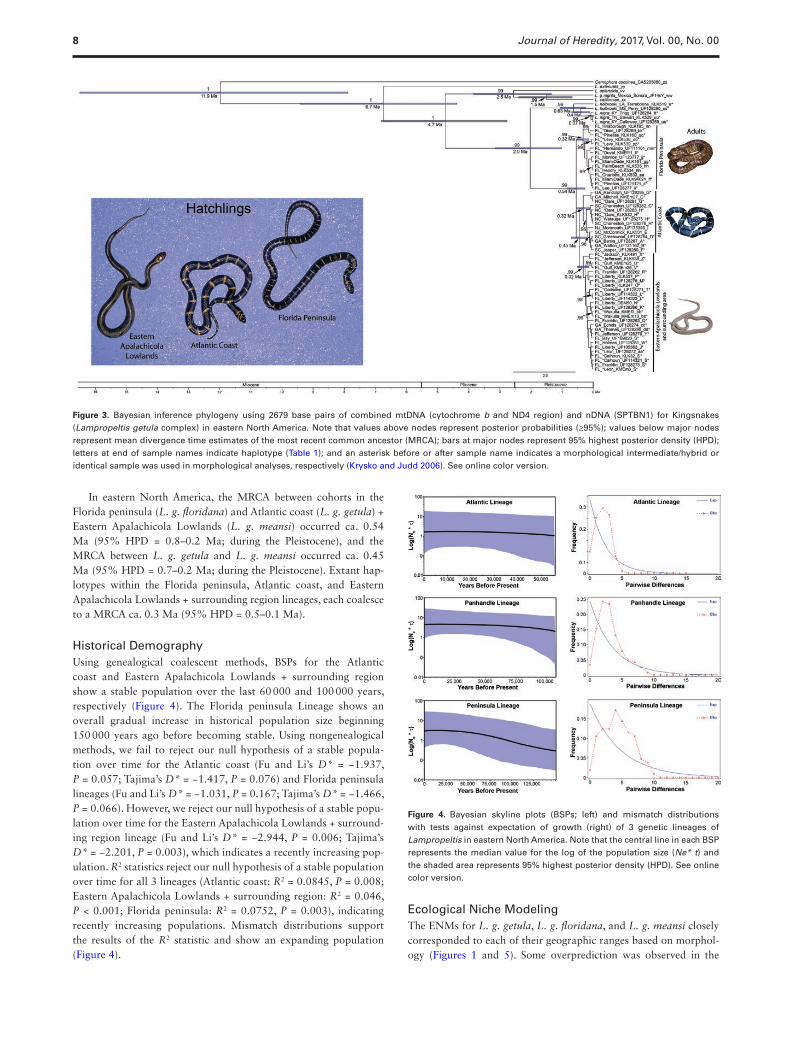
Historical DemographyUsing genealogical coalescent methods, BSPs for the Atlantic coast and Eastern Apalachicola Lowlands + surrounding region show a stable population over the last 60 000 and 100 000 years, respectively (Figure 4). The Florida peninsula Lineage shows an overall gradual increase in historical population size beginning 150 000 years ago before becoming stable. Using nongenealogical methods, we fail to reject our null hypothesis of a stable popula-tion over time for the Atlantic coast (Fu and Li’s D* = −1.937, P = 0.057; Tajima’s D* = −1.417, P = 0.076) and Florida peninsula lineages (Fu and Li’s D* = −1.031, P = 0.167; Tajima’s D* = −1.466, P = 0.066). However, we reject our null hypothesis of a stable popu-lation over time for the Eastern Apalachicola Lowlands + surround-ing region lineage (Fu and Li’s D* = −2.944, P = 0.006; Tajima’s D* = −2.201, P = 0.003), which indicates a recently increasing pop-ulation. R2 statistics reject our null hypothesis of a stable population over time for all 3 lineages (Atlantic coast: R2 = 0.0845, P = 0.008; Eastern Apalachicola Lowlands + surrounding region: R2 = 0.046, P < 0.001; Florida peninsula: R2 = 0.0752, P = 0.003), indicating recently increasing populations. Mismatch distributions support the results of the R2 statistic and show an expanding population (Figure 4).
Ecological Niche ModelingThe ENMs for L. g. getula, L. g. floridana, and L. g. meansi closely corresponded to each of their geographic ranges based on morphol-ogy (Figures 1 and 5). Some overprediction was observed in the
Figure 4. Bayesian skyline plots (BSPs; left) and mismatch distributions with tests against expectation of growth (right) of 3 genetic lineages of Lampropeltis in eastern North America. Note that the central line in each BSP represents the median value for the log of the population size (Ne* t) and the shaded area represents 95% highest posterior density (HPD). See online color version.
Figure 3. Bayesian inference phylogeny using 2679 base pairs of combined mtDNA (cytochrome b and ND4 region) and nDNA (SPTBN1) for Kingsnakes (Lampropeltis getula complex) in eastern North America. Note that values above nodes represent posterior probabilities (≥95%); values below major nodes represent mean divergence time estimates of the most recent common ancestor (MRCA); bars at major nodes represent 95% highest posterior density (HPD); letters at end of sample names indicate haplotype (Table 1); and an asterisk before or after sample name indicates a morphological intermediate/hybrid or identical sample was used in morphological analyses, respectively (Krysko and Judd 2006). See online color version.
8 Journal of Heredity, 2017, Vol. 00, No. 00
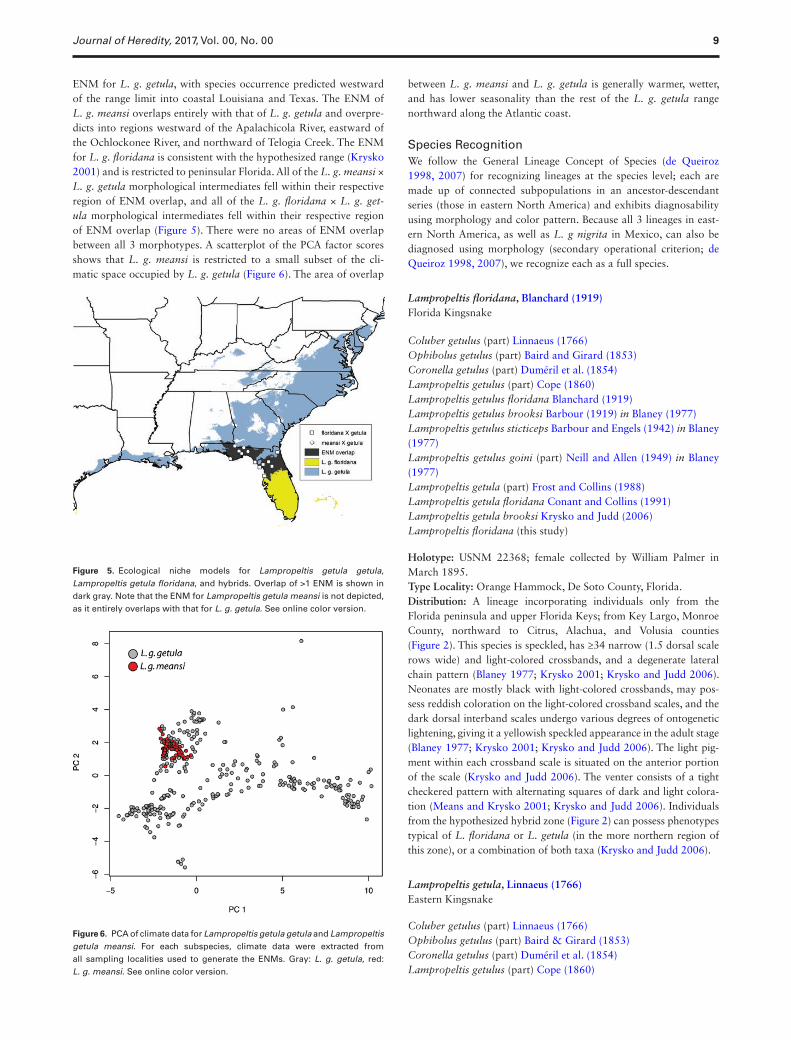
ENM for L. g. getula, with species occurrence predicted westward of the range limit into coastal Louisiana and Texas. The ENM of L. g. meansi overlaps entirely with that of L. g. getula and overpre-dicts into regions westward of the Apalachicola River, eastward of the Ochlockonee River, and northward of Telogia Creek. The ENM for L. g. floridana is consistent with the hypothesized range (Krysko 2001) and is restricted to peninsular Florida. All of the L. g. meansi × L. g. getula morphological intermediates fell within their respective region of ENM overlap, and all of the L. g. floridana × L. g. get-ula morphological intermediates fell within their respective region of ENM overlap (Figure 5). There were no areas of ENM overlap between all 3 morphotypes. A scatterplot of the PCA factor scores shows that L. g. meansi is restricted to a small subset of the cli-matic space occupied by L. g. getula (Figure 6). The area of overlap
between L. g. meansi and L. g. getula is generally warmer, wetter, and has lower seasonality than the rest of the L. g. getula range northward along the Atlantic coast.
Species RecognitionWe follow the General Lineage Concept of Species (de Queiroz 1998, 2007) for recognizing lineages at the species level; each are made up of connected subpopulations in an ancestor-descendant series (those in eastern North America) and exhibits diagnosability using morphology and color pattern. Because all 3 lineages in east-ern North America, as well as L. g nigrita in Mexico, can also be diagnosed using morphology (secondary operational criterion; de Queiroz 1998, 2007), we recognize each as a full species.
Lampropeltis floridana, Blanchard (1919)Florida Kingsnake
Coluber getulus (part) Linnaeus (1766)Ophibolus getulus (part) Baird and Girard (1853)Coronella getulus (part) Duméril et al. (1854)Lampropeltis getulus (part) Cope (1860)Lampropeltis getulus floridana Blanchard (1919)Lampropeltis getulus brooksi Barbour (1919) in Blaney (1977)Lampropeltis getulus sticticeps Barbour and Engels (1942) in Blaney (1977)Lampropeltis getulus goini (part) Neill and Allen (1949) in Blaney (1977)Lampropeltis getula (part) Frost and Collins (1988)Lampropeltis getula floridana Conant and Collins (1991)Lampropeltis getula brooksi Krysko and Judd (2006)Lampropeltis floridana (this study)
Holotype: USNM 22368; female collected by William Palmer in March 1895.Type Locality: Orange Hammock, De Soto County, Florida.Distribution: A lineage incorporating individuals only from the Florida peninsula and upper Florida Keys; from Key Largo, Monroe County, northward to Citrus, Alachua, and Volusia counties (Figure 2). This species is speckled, has ≥34 narrow (1.5 dorsal scale rows wide) and light-colored crossbands, and a degenerate lateral chain pattern (Blaney 1977; Krysko 2001; Krysko and Judd 2006). Neonates are mostly black with light-colored crossbands, may pos-sess reddish coloration on the light-colored crossband scales, and the dark dorsal interband scales undergo various degrees of ontogenetic lightening, giving it a yellowish speckled appearance in the adult stage (Blaney 1977; Krysko 2001; Krysko and Judd 2006). The light pig-ment within each crossband scale is situated on the anterior portion of the scale (Krysko and Judd 2006). The venter consists of a tight checkered pattern with alternating squares of dark and light colora-tion (Means and Krysko 2001; Krysko and Judd 2006). Individuals from the hypothesized hybrid zone (Figure 2) can possess phenotypes typical of L. floridana or L. getula (in the more northern region of this zone), or a combination of both taxa (Krysko and Judd 2006).
Lampropeltis getula, Linnaeus (1766)Eastern Kingsnake
Coluber getulus (part) Linnaeus (1766)Ophibolus getulus (part) Baird & Girard (1853)Coronella getulus (part) Duméril et al. (1854)Lampropeltis getulus (part) Cope (1860)
Figure 5. Ecological niche models for Lampropeltis getula getula, Lampropeltis getula floridana, and hybrids. Overlap of >1 ENM is shown in dark gray. Note that the ENM for Lampropeltis getula meansi is not depicted, as it entirely overlaps with that for L. g. getula. See online color version.
Figure 6. PCA of climate data for Lampropeltis getula getula and Lampropeltis getula meansi. For each subspecies, climate data were extracted from all sampling localities used to generate the ENMs. Gray: L. g. getula, red: L. g. meansi. See online color version.
Journal of Heredity, 2017, Vol. 00, No. 00 9
Lampropeltis getulus sticticeps (part) Barbour & Engels (1942) in Blaney (1977)Lampropeltis getulus goini (part) Neill & Allen (1949) in Blaney (1977)Lampropeltis getula (part) Frost & Collins (1988)Lampropeltis getula getula (part) Conant & Collins (1991)Lampropeltis getula sticticeps (part) Conant & Collins (1991)Lampropeltis getula goini (part) Krysko & Judd (2006)
Holotype: N/A, collected by D. Garden.Type Locality: “Carolina” (Linnaeus (1766:382), but later desig-nated as Charleston, South Carolina (Klauber 1948).Distribution: A lineage incorporating individuals from the northern Florida peninsula and panhandle, east of the Appalachian Mountains to southern New Jersey (Figure 2). This species is typically solid black to chocolate brown with 19–32 narrow (1.5–2.5 dorsal scale rows wide) and light-colored crossbands that widen or divide laterally giving it a chain-like pattern (Krysko and Judd 2006; Jensen et al. 2008). Neonates may possess reddish coloration on the light-colored crossband scales, and the dark dorsal interband scales do not typi-cally lighten with age (Jensen et al. 2008). However, interband scales may lighten ontogenetically in some adult specimens from south-eastern Georgia and the Outer Banks of North Carolina (Barbour and Engels 1942; Lazell and Musick 1973; Krysko and Judd 2006; Jensen et al. 2008). The light pigment within each crossband scale is situated on the anterior portion of the scale. The venter consists of a checkered pattern with alternating squares of dark and light coloration (Means and Krysko 2001; Jensen et al. 2008). Individuals from the hypothesized hybrid zone (Figure 2) in the Florida panhan-dle can possess phenotypes typical of L. getula (in the far peripher-ies of this zone), or a combination of both L. getula and L. meansi (Means and Krysko 2001; Krysko and Judd 2006). Individuals from the hypothesized hybrid zone in the Florida peninsula can possess phenotypes typical of L. floridana, or L. getula (in the more northern region of this zone), or a combination of both taxa (Krysko and Judd 2006). Another hybrid zone between L. getula and L. nigra is known from northwestern Georgia on the southern edge of the Appalachian Mountains (Jensen et al. 2008).
Lampropeltis meansi, Krysko and Judd (2006)Eastern Apalachicola Lowlands Kingsnake
Lampropeltis getulus goini (part) Neill & Allen (1949) in Blaney (1977)Lampropeltis getula (part) Frost & Collins (1988)Lampropeltis getula goini (part) Krysko & Judd (2006)Lampropeltis getula meansi Krysko & Judd (2006)Lampropeltis meansi (this study)
Holotype: UF-Herpetology 73433, male collected by D. Bruce Means on 9 June 1970.Type Locality: Apalachicola National Forest, FH-13 ca. 3.2 km W SR 67, Liberty County, Florida.Etymology: Named for Dr D. Bruce Means in recognition of his dis-covery of the first known Eastern Apalachicola Lowlands kingsnake, as well as his contributions to our knowledge of the flora and fauna of the Coastal Plains.Distribution: A lineage incorporating individuals mostly from Franklin and Liberty counties, between the Apalachicola and Ochlockonee riv-ers and south of Telogia Creek in the Florida panhandle (Figure 2). We note that some individuals are found in Franklin County on the southwestern side of the Apalachicola River (Means and Krysko
2001), and 2 individuals (UF-herpetology 55450 and 115959) from Wakulla County on the eastern side of the Ochlockonee River also possess the phenotype of L. meansi. This species is speckled and has ≤25 wide (>2.5 dorsal scale rows wide) and light-colored crossbands; some individuals are striped or completely patternless (i.e., non-banded) (Means and Krysko 2001; Krysko and Judd 2006). Neonates are mostly black (banded individuals) with light-colored crossbands, may possess reddish coloration on their light colored crossband scales, and the dark dorsal interband scales undergo a high degree of ontogenetic lightening, giving it a yellowish speckled appearance in the adult stage (Means and Krysko 2001; Krysko and Judd 2006). Nonbanded striped and patternless neonates do not necessarily have light-colored crossbands, but rather are made up mostly of already lightened interband scales that continue to undergo ontogenetic lightening (Means and Krysko 2001; Krysko and Judd 2006). The light pigment within each crossband scale is situated on the anterior portion of the scale (Krysko and Judd 2006). The venter consists of either a loose checkered pattern with alternating squares of dark and light coloration with interspersed bicolor scales, or entirely bicolored scales (Means and Krysko 2001; Krysko and Judd 2006). Individuals from the hypothesized hybrid zone (Figure 2) in the Florida panhan-dle can possess phenotypes typical of L. getula (in the far peripheries of this zone) or a combination of L. getula and L. meansi (Means and Krysko 2001; Krysko and Judd 2006).
Lampropeltis nigrita, Zweifel and Norris (1955)Mexican Black Kingsnake
Coluber californiae (part) Blainville (1835)Coronella californiae (part) Duméril et al. (1854)Lampropeltis getulus yumensis (part) Blanchard (1919)Lampropeltis getula yumensis (part) Klauber (1938)Lampropeltis getulus californiae (part) Stebbins (1954)Lampropeltis getulus nigritus Zweifel and Norris (1955)Lampropeltis getulus nigrita (part) Smith and Taylor (1966)Lampropeltis getulus splendida (part) Hardy and McDiarmid (1969)Lampropeltis getula nigrita (part) Crother (2000)Lampropeltis californiae (part) Pyron and Burbrink (2009)Lampropeltis nigrita (this study)
Holotype: MVZ 50814, male collected by Kenneth S. Norris and Richard G. Zweifel on 3 August 1950.Type Locality: 49.2 km south of Hermosillo, Sonora, Mexico.Distribution: A lineage incorporating individuals from northern Sinaloa northward to Sonora, Mexico, and extreme southeastern Arizona, USA. This species is solid black or brown in the adult stage (Zweifel and Norris 1955; Blaney 1977; Stebbins 2003; Krysko and Judd 2006). There may be considerable variation within a single clutch of eggs, where some neonates might exhibit a nearly solid dark dorsum and venter, while other siblings might exhibit a narrow banded dorsum and tight checkerboard ventral pattern with alternat-ing squares of dark and light coloration like those of adjacent popu-lations of L. splendida (Krysko and Judd 2006). It might hybridize where it comes into contact with adjacent species (i.e., L. californiae and L. splendida) (Blanchard 1921; Blaney 1977; Stebbins 2003).
Discussion
Nearly all of the subspecies within the Lampropeltis getula complex were named solely using morphology and color pattern characters. More recently, DNA analyses have improved our understanding of evolutionary relationships and corresponding taxonomy.
10 Journal of Heredity, 2017, Vol. 00, No. 00
Although Barbour and Engels (1942) and Lazell and Musick (1973) believed that L. g. sticticeps from the Outer Banks of North Carolina deserved taxonomic recognition, this name was rejected by Blaney (1977, 1979) and Krysko (2001), and our molecular results herein support this conclusion. Additionally, ontogenetically light-ened interbands occur in Florida populations, as well as individu-als from the Outer Banks and coastal Georgia, and therefore is not a diagnosable character (Lazell and Musick 1973; Blaney 1977; Palmer and Braswell 1995; Krysko 2001).
Our mtDNA and nDNA sequence data illustrate that previously described subspecies in eastern North America represent natural groups corresponding to L. floridana, L. getula, and L. meansi, distinct lineages as proposed by Blaney (1977), Krysko (2001), and Krysko and Judd (2006). The elevation of these forms to full taxonomic rec-ognition follows a trend established for western kingsnakes based on a fuller knowledge of morphology, genetics, and distributions (Pyron and Burbrink 2009a). The presence of morphological intermediates at the fringes of each species range indicates suture (hybridization) zones, and to a lesser extent (regarding to L. getula) incomplete line-age sorting because of a recent evolutionary divergence.
ENM results show that Lampropeltis meansi overlaps entirely with L. getula but is restricted to a small subset of the climatic environment occupied by L. getula. This is not surprising, given the very short tree branch between these 2 lineages (Figure 3). Taken together, the short branch length and lack of ENM differentiation suggest very recent divergence between these taxa, as sufficient time may not have passed for complete ecological divergence (de Queiroz 2007). These results also indicate that L. meansi has a more restricted set of environmental requirements than L. getula, which is predicted to occur across a much broader range. In con-trast, ENMs for L. getula and L. floridana were distinct with a clear area of overlap in northern peninsular Florida (Figure 5), support-ing recognition of the 2 lineages as parapatric species separated by a hybrid zone.
The distributions of these genetic lineages are concordant with recognized biogeographic breaks (Appalachian Mountains, pen-insular Florida, and Apalachicola) previously identified for many other plants and animals (see Neill 1957; Blaney 1977; Clark et al. 2003; Soltis et al. 2006; Krysko et al. 2016). The MRCA between eastern North America individuals of the Lampropeltis getula complex and congeners to the west occurred between 3.1 and 1 Ma, during the late Pliocene through mid-Pleistocene. This inter-val includes Milankovitch cycles of approximately 100 000 years, resulting in glacial events and corresponding changes in sea level and climate (Hays et al. 1976; Hine 2013; Krysko et al. 2016). During intervals when sea levels were lower, a Gulf Coast corridor was available for ancestral L. getula to disperse from west to east. Subsequently, populations in eastern North America became iso-lated and evolved independently during the Pleistocene, resulting in the three current lineages in the Florida peninsula (L. floridana), Atlantic coast (L. getula), and Eastern Apalachicola Lowlands (L. meansi). We view these three genetic lineages (and L. nigrita from Mexico) as distinct species because they are diagnosable using morphology (Blaney 1977; Krysko 2001; Means and Krysko 2001; Krysko and Judd 2006), have low rates of introgression (Krysko and Franz 2003), show genetic differentiation, occupy distinct eco-logical space (present study), and inhabit ranges that correspond to well known biogeographic provinces (Soltis et al. 2006). There might be additional evolutionary partitions within the L. getula complex west of the Appalachian Mountains, mandating further investigation.
AcknowledgmentsWe thank Frank T. Burbrink, David L. Reed, and Julie Allen for suggestions on analyses; Richard C. Hulbert for information on geological names and fos-sil taxonomy; Chris McMartin for photographs; and Stephen A. Karl and 2 reviewers for constructive comments. This study was conducted under the fol-lowing permits and grants: Florida Fish and Wildlife Conservation Commission (Project NG00-002), Everglades National Park (Permit 940015), South Florida Water Management District (Permit 1069), United States Forest Service (Permit 2670), UF Institutional Animal Care and Use Committee (IACUC) (Permit A187), Central Florida, Volusia County, and Suncoast herpetological societies.
Data AvailabilityWe have deposited the primary data underlying these analyses as followsDNA sequences: for Genbank accessions see Table 1.
ReferencesAmos B, Hoelzel AR. 1991. Long-term preservation of whale skin for DNA
analysis. Rep Int Whal Comm. 13:99–103.Arevalo E, Davis SK, Sites JW Jr. 1994. Mitochondrial DNA sequence diver-
gence and phylogenetic relationships among eight chromosome races of the Sceloporus grammicus complex (Phrynosomatidae) in central Mexico. Syst Biol. 43:387–418.
Auffenberg W. 1963. The fossil snakes of Florida. Tulane Stud Zool. 10:131–216.
Avise JC, Arnold J, Ball RM, Bermingham E, Lamb T, Neigel JE, Reeb CA, Saunders NC. 1987. Intraspecific phylogeography: the mitochondrial DNA bridge between population genetics and systematics. Ann Rev Ecol Syst. 18:489–522.
Baird SF, Girard C. 1853. Catalogue of North American reptiles in the museum of the Smithsonian Institution. Part 1. Serpents. Washington, DC: Smithso-nian Institute. p. 172.
Barbour T. 1919. Another new race of the kingsnake. Proc New Engl ZoClub. 7:1–3.
Barbour T, Engels WL. 1942. Two interesting new snakes. Proc New Engl ZoClub. 20:101–104.
Bickham JW, Wood CC, Patton JC. 1995. Biogeographic implications of cytochrome-b sequences and allozymes in sockeye (Oncorhynchus nerka). J Hered. 80:140–144.
Blainville HD de. 1835. Description dequelques especes de reptiles de la Cali-fornie. Nouv Ann Mus d’Hist Paris. 4:233–296.
Blanchard FN. 1919. Two new snakes of the genus Lampropeltis. Occasional Papers of the Museum of Zoology, University of Michigan. 70:1–11.
Blanchard FN. 1921. A revision of the king snakes: genus Lampropeltis. Bull US Nat Mus. 114:1–260.
Blaney RM. 1977. Systematics of the common kingsnake, Lampropeltis getu-lus (Linnaeus). Tulane Stud Zool Bot. 19:47–103.
Blaney RM. 1979. The status of the Outer Banks Kingsnake, Lampropeltis get-ulus sticticeps (Reptilia: Serpentes: Colubridae). Brimleyana. 1:125–128.
Blankenberg D, Von Kuster G, Coraor N, Ananda G, Lazarus R, Mangan M, Nekrutenko A, Taylor J. 2010. Galaxy: a web-based genome analysis tool for experimentalists. Curr Protoc Mol Biol. 10:1–21.
Bowen BW, Gaither MR, DiBattista JD, Iacchei M, Andrews KR, Grant WS, Toonen RJ, Briggs JC. 2016. Comparative phylogeography of the ocean planet. Proc Natl Acad Sci USA. 113:7962–7969.
Burbrink FT, Castoe TA. 2009. Molecular phylogeography of snakes. In Mul-lin SJ and Seigel RA, editors. Snakes: ecology and conservation. Ithaca (NY): Comstock Publishing Associates. p. 38–77.
Burbink FT, Chen X, Myers EA, Brandley MC, Pyron RA. 2012. Evidence for determinism in species diversification and contingency in phenotypic evo-lution during adaptive radiation. Proc Biol Sci. 279:4817–4826.
Burbrink FT, Fontanella F, Pyron RA, Guiher TJ, Jimenez C. 2008. Phylogeog-raphy across a continent: the evolutionary and demographic history of the North American racer (Serpentes: Colubridae: Coluber constrictor). Mol Phylogenet Evol. 47:274–288.
Journal of Heredity, 2017, Vol. 00, No. 00 11

Burbrink FT, Lawson R. 2007. How and when did Old World rat snakes dis-perse into the New World? Mol Phylogenet Evol. 43:173–189.
Burbrink FT, Lawson R, Slowinski JB. 2000. Mitochondrial DNA phyloge-ography of the polytypic North American rat snake (Elaphe obsoleta): a critique of the subspecies concept. Evolution. 54:2107–2118.
Clark A. 1998. Reptile sheds yield high quality DNA. Herpetol Rev. 29:17–18.
Clark A, Moler PE, Possardt E, Savitsky AH, Brown WS, Bowen BW. 2003. Phylogeography of the timber rattlesnake Crotalus horridus, based on mtDNA sequences. J Herpetol. 37:145–154.
Conant R, Collins JT. 1991. A field guide to reptiles and amphibians: east-ern and central North America. 3rd ed. Boston (MA): Houghton Mifflin Company. p. 592.
Conant R, Collins JT. 1998. A field guide to reptiles and amphibians: eastern and central North America. 3rd ed. expanded. New York (NY): Houghton Mifflin Company. p. 620.
Cope ED. 1860. Catalogue of the Colubridae in the Museum of the Academy of Natural Sciences of Philadelphia, with notes and descriptions of new species. Part II. Proc Acad Nat Sci Philadelphia. 12:241–266.
Crother BI. 2000. Scientific and standard English names of amphibians and reptiles of North America north of Mexico, with comments regarding con-fidence in our understanding. Herpetol Circ. 29:1–82.
de Queiroz K. 2007. Species concepts and species delimitation. Syst Biol. 56:879–886.
de Queiroz K, Good DA. 1997. Phenetic clustering in biology: a critique. Q Rev Biol. 72:3–31.
Drummond AJ, Ho SYW, Phillips MJ, Rambaut A. 2006. Relaxed phylogenet-ics and dating with confidence. PLoS Biol. 4:e88.
Drummond AJ, Rambaut A. 2007. BEAST: Bayesian evolutionary analysis by sampling trees. BMC Evol Biol. 7:214
Duméril AMC, Bibron G, Duméril AHA. 1854. Erpétologie Genérale ou His-toire Naturelle Compléte des Reptiles. Vol. 9. Paris. Librarie Encyclope-dique de Roret.
Enge KM. 1994. Herptile use and trade in Florida. Florida Game and Fresh Water Fish Commission, Nongame Wildlife Program Final Performance Report, Tallahassee. p.102.
Felsenstein J. 1985. Confidence limits on phylogenies: an approach using the bootstrap. Evolution. 39:783–791.
Felsenstein J. 1992. Estimating effective population size from samples of sequences: inefficiency of pairwise and segregating sites as compared to phylogenetic estimates. Genet Res. 59:139–147.
Felsenstein J. 2004. Inferring phylogenies. 2nd ed. Sunderland (MA): Sinauer Associates, Inc. p. 664.
Fetzner JW Jr. 1999. Extracting high-quality DNA from shed reptile skins: a simplified method. BioTechniques. 26:1052–1054.
Frost DR, Collins JT. 1988. Nomenclature notes on reptiles of the United States. Herpetol Rev. 19:73–74.
Fu YX, Li WH. 1993. Statistical tests of neutrality of mutations. Genetics. 133:693–709.
Giardine B, Reimer C, Hardison RC, Burhans R, Elnitski L, Shah P, Zhang Y, Blankenberg D, Albert I, Taylor J, et al. 2005. Galaxy: a platform for inter-active large-scale genome analysis. Genome Res. 15:1451–1455.
Gibbons JW, Coker JW. 1978. Herpetological colonization patterns of Atlantic Coast Barrier Islands. Am Midl Nat. 99:219–233.
Goecks J, Nekrutenko A, Taylor J; The Galaxy Team. 2010. Galaxy: a compre-hensive approach for supporting accessible, reproducible, and transparent computational research in the life sciences. Genome Biol. 11:R86.
Hardy LM, McDiarmid RW. 1969. The amphibians and reptiles of Sinaloa, Mexico. Univ Kans Publ Mus Nat Hist. 18:39–252.
Hasegawa M, Kishino H, Yano T. 1985. Dating of the human-ape splitting by a molecular clock of mitochondrial DNA. J Mol Evol. 22:160–174.
Hays JD, Imbrie J, Shackleton NJ. 1976. Variation in the earth’s orbit: pace-maker of the ice ages. Science. 194:1121–1132.
Hijmans RJ, Cameron SE, Parra JL, Jones PG, Jarvis A. 2005. Very high reso-lution interpolated climate surfaces for global land areas. Int J Climatol. 25:1965–1978.
Hijmans RJ, Guarino L, Cruz M, Rojas E. 2001. Computer tools for spatial analysis of plant genetic resources data: 1. DIVA-GIS. Plant Genet Resour Newsl. 127:15–19.
Hillestad HO, Bozeman JR, Johnson AS, Berisford CW, Richardson JI. 1975. The ecology of the Cumberland Island National Seashore, Camden County, Georgia. Georgia Marine Science Center Technical Report Series No. 75-5. Skidaway Island. p.299.
Hillis DM, Larson A, Davis SK and Zimmer EA. 1990. Nucleic acids III: sequencing. In: Hillis DM, Moritz S, editors. Molecular systematics. Sun-derland (MA): Sinauer Associates. p. 318–370.
Hine AC. 2013. Geologic history of Florida: major events that formed the sunshine state. Gainesville (FL): University Press of Florida. p. 256.
Ho SYW, Phillips MJ. 2009. Accounting for calibration uncertainty in phylo-genetic estimate on of evolutionary divergence times. Syst Biol. 58:367–380.
Holman JA. 2000. Fossil snakes of North America: origin, evolution, distribu-tion, paleoecology. Bloomington (IN): Indiana University Press. p. 376.
Hudson RR, Slatkin M, Maddison WP. 1992. Estimation of levels of gene flow from DNA sequence data. Genetics. 132:583–589.
Hulbert RC Jr. 2001. The fossil vertebrates of Florida. Gainesville (FL): Uni-versity Press of Florida. p. 384.
Iudica CA, Whitten WM, Williams NH. 2001. Small bones from dried mam-mal museum specimens as a reliable source of DNA. BioTechniques. 30:732–736.
Jensen JB, Camp CD, Gibbons JW, Elliott MJ. 2008. Amphibians and reptiles of Georgia., Athens (GA): University of Georgia Press. p. 600.
Kessing B, Croom H, Martin A, McIntosh C, McMillan WO, Palumbi S. 1989. The simple fool’s guide to PCR. Ver. 1.0. Honolulu: Department of Zool-ogy, University of Hawaii.
Klauber LM. 1938. Notes from a herpetological diary, I. Copeia 4:191–197.Klauber LM. 1948. Some misapplications of the Linnaean names applied to
American snakes. Copeia 1:1–14.Kozak KH, Graham CH, Wiens JJ. 2008. Integrating GIS-based environmental
data into evolutionary biology. Trends Ecol Evol. 23:141–148.Krysko KL. 2001. Ecology, conservation, and morphological and molecular
systematics of the kingsnake, Lampropeltis getula (Serpentes: Colubridae) [PhD dissertation]. [Gainesville (FL)]: University of Florida. p. 159.
Krysko KL. 2002. Seasonal activity of the Florida kingsnake, Lampropeltis getula floridana (Serpentes: Colubridae), in southern Florida. Am Midl Nat. 148:102–114.
Krysko KL, Franz R. 2003. Systematics and conservation of the kingsnake (Lampropeltis getula) in Florida. Tallahassee (FL): Florida Fish and Wild-life Conservation Commission Final Report. p. 49.
Krysko KL, Judd WS. 2006. Morphological systematics of kingsnakes, Lam-propeltis getula complex (Serpentes: Colubridae), in the eastern United States. Zootaxa. 1193:1–39.
Krysko KL, Nuñez LP, Lippi CA, Smith DJ, Granatosky MC. 2016. Pliocene-Pleistocene lineage diversifications in the Eastern Indigo Snake (Drymar-chon couperi) in the southeastern United States. Mol Phylogent Evol. 98:111–122.
Lawson R, Slowinski JB, Crother BI, Burbrink FT. 2005. Phylogeny of the Colubroidea (Serpentes): new evidence from mitochondrial and nuclear genes. Mol Phylogent Evol. 37:581–601.
Lazell JD, Musick JA. 1973. The kingsnake, Lampropeltis getulus sticticeps, and the ecology of the Outer Banks of North Carolina. Copeia. 1973:497–503.
Librado P, Rozas J. 2009. DnaSP v5: a software for comprehensive analysis of DNA polymorphism data. Bioinformatics. 25:1451–1452.
Linnaeus C. 1766. Systema natur per regna tria natur, secundum classes, ordines, genera, species, cum characteribus, differentiis, synonymis, locis. Tomus I. Editio duodecima, reformata. Laurentii Salvii. [Stockholm]: Hol-miae. p. 532.
Means DB. 1977. Aspects of the significance to terrestrial vertebrates of the Apalachicola River drainage basin, Florida. In: Livingston RJ, Joyce EA, editors. Proceedings of the Conference on the Apalachicola Drainage Sys-tem. Tallahassee (FL): Florida Marine Research Publication, 26. p. 37–67.
12 Journal of Heredity, 2017, Vol. 00, No. 00
Means DB, Krysko KL. 2001. Biogeography and pattern variation of king-snakes, Lampropeltis getula, in the Apalachicola region of Florida. Con-temp Herpetol. 5:1–9.
Morrison DA. 2008. How to summarize estimates of ancestral divergence times. Evol Bioinform. 4:75–95.
Neill WT. 1957. Historical biogeography of present-day Florida. Bull Florida State Mus Biol Sci. 2:175–220.
Neill WT, Allen ER. 1949. A new kingsnake (genus Lampropeltis) from Flor-ida. Herpetologica. 5:1–12.
Palmer WM, Broswell AL. 1995. Reptiles of North America. 1st ed. Chapel Hill (NC): The University of North Carolina Press. p. 412.
Pearson RG, Raxworthy CJ, Nakamura M, Peterson AT. 2007. Predicting spe-cies’ distributions from small numbers of occurrence records: a test case using cryptic geckos in Madagascar. J Biogeogr. 34:102–117.
Pfenninger M, Schwenk K. 2007. Cryptic animal species are homogenously distributed among taxa and biogeographic regions. BMC Evol Biol. 7:121.
Phillips SJ, Anderson RP, Schapire RE. 2006. Maximum entropy modeling of species geographic distributions. Ecol Modell. 190:231–259.
Pilkington MM, Wilder JA, Mendez FL, Cox MP, Woerner A, Angui T, Kingan S, Mobasher Z, Batini C, Destro-Bisol G, et al. 2008. Contrasting signa-tures of population growth for mitochondrial DNA and Y chromosomes among human populations in Africa. Mol Biol Evol. 25:517–525.
Powell R, Conant R, Collins JT. 2016. Field guide to reptiles and amphib-ians of Eastern and Central North America. 4th ed. New York: Houghton Mifflin Harcourt Publishing Company. p. 494.
Proebstel DS, Evans RP, Shiozawa DK, Williams RN. 1993. Preservation of nonfrozen tissue samples from a salmonine fish Brachymystax lenok (Pal-las) for DNA analysis. J Ichthyol. 9:9–17.
Puebla O, Bermingham E, McMillan WO. 2014. Genomic atolls of differ-entiation in coral reef fishes (Hypoplectrus spp., Serranidae). Mol Ecol. 23:5291–5303.
Pybus OG, Rambaut A, Harvey PH. 2000. An integrated framework for the inference of viral population history from reconstructed genealogies. Genetics. 155:1429–1437.
Pyron RA, Burbrink FT. 2009a. Systematics of the Common Kingsnake (Lam-propeltis getula; Serpentes: Colubridae) and the burden of heritage in tax-onomy. Zootaxa. 2241:22–32.
Pyron RA, Burbrink FT. 2009b. Lineage diversification in a widespread spe-cies: roles for niche divergence and conservatism in the common king-snake, Lampropeltis getula. Mol Ecol. 18:3443–3457.
Ramos-Onsins SE, Rozas J. 2002. Statistical properties of new neutrality tests against population growth. Mol Biol Evol. 19:2092–2100.
Raxworthy CJ, Ingram CM, Rabibisoa N, Pearson RG. 2007. Applications of ecological niche modeling for species delimitation: a review and empiri-cal evaluation using day geckos (Phelsuma) from Madagascar. Syst Biol. 56:907–923.
Rissler LJ and Apodaca JJ. 2007. Adding more ecology into species delimi-tation: ecological niche models and phylogeography help define cryp-tic species in the black salamander (Aneides flavipunctatus). Syst Biol. 56:924–942.
Rodríguez-Robles JA, de Jesús-Escobar JM. 1999. Molecular systematics of New World lampropeltinine snakes (Colubridae): implications for bioge-ography and evolution of food habits. Biol J Linn Soc. 68:355–385.
Rozas J. 2009. DNA sequence polymorphism analysis using DnaSP. In: Posada D, editor. Bioinformatics for DNA sequence analysis: methods, molecular biology series. Vol. 537. Totowa (NJ): Humana Press. p. 337–350.
Ruane S, Bryson RW Jr, Pyron RA, Burbrink FT. 2014. Coalescent species delimitation in Milksnakes (genus Lampropeltis) and impacts on phyloge-netic comparative analyses. Syst Biol. 63:231–250.
Shepard DB, Burbrink FT. 2009. Phylogeographic and demographic effects of Pleistocene climatic fluctuations in a montane salamander, Plethodon fourchensis. Mol Ecol. 18:2243–2262.
Sheehy CM III. 2012. Phylogenetic relationships and feeding behavior of neo-tropical snail-eating snakes (Dipsadinae, Dipsadini) [PhD dissertation]. [Arlington (TX)]: University of Texas. p. 126.
Smith HM, Taylor EH. 1966. Herpetology of Mexico. Annotated checklists and keys to the amphibians and reptiles. A reprint of Bulletins 187, 194, and 199 of the U.S. National Museum with a list of subsequent taxonomic innovations. Ashton (MD): Eric Lundberg. p. 27.
Soltis DE, Morris AB, McLachlan JS, Manos PS, Soltis PS. 2006. Compara-tive phylogeography of unglaciated eastern North America. Mol Ecol. 15:4261–4293.
Stebbins RC. 1954. Amphibians and reptiles of western North America. New York (NY): McGraw-Hill Book Company, Inc.. p. 528.
Stebbins RC. 2003. Amphibians and reptiles of western North America. 3rd ed. New York (NY): Houghton Mifflin Co. p. 533.
Tajima F. 1989. Statistical method for testing the neutral mutation hypothesis by DNA polymorphism. Genetics. 123:585–595.
Townsend TM, Alegre RE, Kelley ST, Wiens JJ, Reeder TW. 2008. Rapid devel-opment of multiple nuclear loci for phylogenetic analysis using genomic resources: an example from squamate reptiles. Mol Phylogenet Evol. 47:129–142.
White PS, Densmore LD. 1992. Mitochondrial DNA isolation. In: Hoezel AR, edior. Molecular genetic analysis of populations: a practical approach. New York (NY): IRL Press/Oxford University Press. p. 29–58.
Wiens JJ, Graham CH. 2005. Niche conservatism: integrating evolution, ecol-ogy, and conservation biology. Ann Rev Ecol Evol Syst. 36:519–539.
Yarrow HC. 1882. Description of new species of reptiles and amphibians in the US National Museum. Proc US Natl Mus. 5:438–443.
Zweifel RG, Norris KS. 1955. Contributions to the herpetology of Sonora, Mexico: descriptions of new subspecies of snakes (Micruroides euryxan-thus and Lampropeltis getulus) and miscellaneous collecting notes. Am Midl Nat. 54:230–249.
Journal of Heredity, 2017, Vol. 00, No. 00 13