PHOTOVOLTAIC INDUSTRY - Aranca Research · Aranca 2015 All rights reserved infoarancacom 3 Aranca...
14
1 © Aranca 2015. All rights reserved. | [email protected] | www.aranca.com Aranca is an ISO 27001:2013 certified company PHOTOVOLTAIC INDUSTRY WITNESSING A PARADIGM SHIFT PHOTOVOLTAIC INDUSTRY WITNESSING A PARADIGM SHIFT Thematic Report by Ankit Kedia, Senior Analyst, Investment Research
-
Upload
nguyenminh -
Category
Documents
-
view
219 -
download
0
Transcript of PHOTOVOLTAIC INDUSTRY - Aranca Research · Aranca 2015 All rights reserved infoarancacom 3 Aranca...
1© Aranca 2015. All rights reserved. | [email protected] | www.aranca.com Aranca is an ISO 27001:2013 certified company
PHOTOVOLTAIC INDUSTRYWITNESSING A PARADIGM SHIFT
PHOTOVOLTAICINDUSTRYWITNESSING A PARADIGM SHIFT
Thematic Report by
Ankit Kedia, Senior Analyst, Investment Research

2© Aranca 2015. All rights reserved. | [email protected] | www.aranca.com Aranca is an ISO 27001:2013 certified company
PHOTOVOLTAIC INDUSTRYWITNESSING A PARADIGM SHIFT
he global photovoltaic (PV) industry has evolved substantially during the last decade. Europe’s dominance in
the global PV industry has ended sooner than anticipated, as new ‘power’ centers emerged. Europe accounted for 74% of the world’s new PV installations in 2011, but constituted just 29% in 2013. Although global data indicates momentum in the PV industry, it needs to be rationally analyzed to understand the fundamental changes occurring in the industry.
In today’s fast-changing business environment, decision as well as timing earns dividend. Therefore, company strategists and investors in the PV industry need to re-calibrate their strategy in sync with the paradigm shift in the industry. The analysis of Europe’s PV industry vis-à-vis the global PV industry may help the companies to devise their expansion/consolidation strategies; moreover, it may help investors rationalize their corpus to fetch better returns.
T
Image Source: NELLIS AIR FORCE BASE website

3© Aranca 2015. All rights reserved. | [email protected] | www.aranca.com Aranca is an ISO 27001:2013 certified company
PHOTOVOLTAIC INDUSTRYWITNESSING A PARADIGM SHIFT
he global PV industry is en route some fundamental changes, which would have profound implications in the near future. After over a decade of clear dominance,
Europe is no longer the topmost regional PV market in the world since 2013. According to European Photovoltaic Industry Association (EPIA), Asia overtook Europe to become the largest PV market in 2013, accounting for around 56% of the global PV industry. Asia’s dominance in the global PV industry occurred in parallel with Europe’s decline in 2012. Despite slowdown in Europe, strong growth in non-European markets led to expansion in the global PV industry.
In most countries, solar PV remains a policy-driven industry. Due to substantial initial investment involved in PV installations, the demand is highly correlated with the corresponding policies of the state, which plays a critical role in driving the market over the medium to long term. To achieve their CO2 emission reduction targets, developed and developing countries have started providing various incentives, including subsidies, tax benefits, preferential purchase, and cost sharing, to promote PV/renewable installations. Nonetheless, declining political support and gradual phasing out of some PV policies have led to reduced demand in several European countries, particularly Germany, Italy, Belgium, France, and Spain. However, the implementation of new and encouraging policies (such as feed-in tariff) has boosted the demand in other countries, such as China, Japan, and the US.
As enumerated in Table 1, major policies for the PV industry in key European PV markets (Germany & UK for illustration) are impacting negatively as the subsidy support is now gradually phasing out with the shift in sovereign focus. Earlier, the same policies led the high growth phase in these markets due to more favorable policy terms.
CHANGE IN SOVEREIGNPOLICIES RESHAPINGGLOBAL PV INDUSTRY
T

4© Aranca 2015. All rights reserved. | [email protected] | www.aranca.com Aranca is an ISO 27001:2013 certified company
PHOTOVOLTAIC INDUSTRYWITNESSING A PARADIGM SHIFT
Country Policy Impact on PV System Suppliers
UK
Renewable Obligation Certificate (Roc) Scheme
The scheme requires licensed electricity
suppliers in the UK to source a specified
proportion of electricity from eligible renewable
sources.
Eligible renewable electricity producers report
the amount of electricity generated to the
Office of the Gas and Electricity Markets
(Ofgem) and receive the ROC. To comply with
the policy, suppliers buy these ROCs from
producers in exchange for money. ROCs are
tradable commodities with no fixed price.
As the government intends to end this scheme by March 31, 2017, all eligible installations only until this date would continue to receive full governmental support for 20 years. Thus, we expect increased number of PV installations only over the next two years, as the producers plan to avail these benefits. Once the scheme is over, we expect the demand to slow down.
Feed-In Tariff (Fit) Scheme
The FIT scheme supports small-scale (5
megawatts (MW) or less total installed
capacity) systems.
The eligible producer registers the installation
with a licensed electricity supplier or Ofgem.
The supplier pays the producer a generation
tariff for any amount of electricity generated
and an export tariff if any surplus electricity
is exported to the grid. The suppliers recover
these payments through the electricity bills of
their customers.
The tariffs are revised on a quarterly basis and have been declining since 2012, as the government reduced the subsidy citing that the tariffs were providing returns higher than those originally intended (due to faster than anticipated decline in component costs). Therefore, this is expected to have a negative impact on the demand for PV systems.
Germany
Renewable Energy Act (Eeg)
This act was designed to encourage cost
reductions based on improved energy
efficiency from economies of scale over time.
It provided a significant boost to Germany’s
renewable energy sector. The act is similar to
the FIT scheme in the UK.
FITs in Germany decline at regular intervals to exert cost pressure on energy producers and technology manufacturers. The decrease in FITs generally applies to new plants.
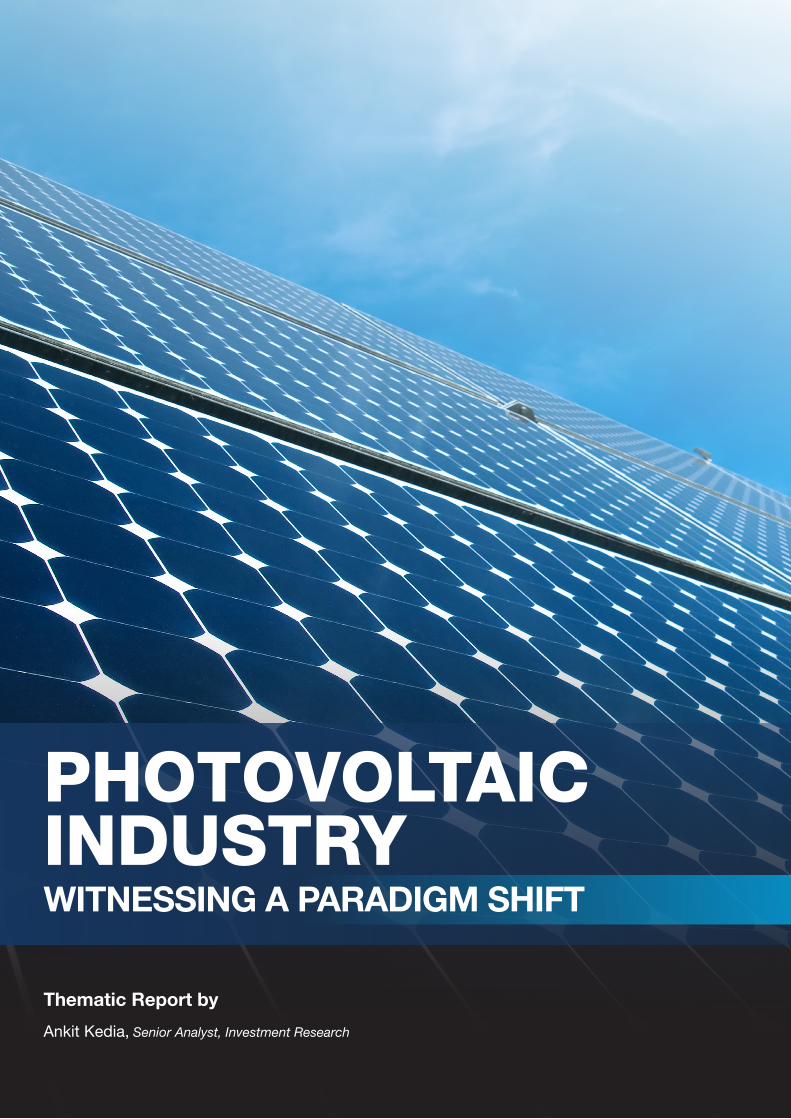
However, as you will see in Table 2, similar policies for the PV industry in key Non-European PV markets (China, USA and Japan) are positively impacting due to wide subsidy support as result of sovereign focus in these countries. We expect the increasing support to result in high growth of the industry for the next couple of years.
Source: Ofgem UK, IEA, Aranca research
Table 1: Major Policies for the PV Industry in Key European PV Markets
5© Aranca 2015. All rights reserved. | [email protected] | www.aranca.com Aranca is an ISO 27001:2013 certified company
PHOTOVOLTAIC INDUSTRYWITNESSING A PARADIGM SHIFT
Country Policy Impact on PV System Suppliers
China
Golden Roof Program
Under this program, the government provides
a subsidy of $2.93 per Watt for roof-mounted
solar PV systems over 50 kW, which covers
over 50% of a system’s installation cost.
This program is expected to encourage more PV installations in China at the individual level, resulting in high demand for PV systems.
Golden Sun Program
This program is applicable to projects with a
capacity of 300 MW or more. It covers up to
50% of project costs (including transmission
or distribution lines to connect to the grid) and
up to 70% of such costs for projects in remote
areas (such as the Western region).
This program would encourage increased PV installations in China at the supplier level, resulting in high demand for PV systems in the country.
Fit Scheme
In China, FIT was initiated in 2011 for ground-
based and utility type systems, which was later
extended to distributed generation systems,
including rooftop systems. The installations
receive subsidies of $0.14–0.16 per kWh based
on the type.
Although the tariffs have been reduced a few times, the eligibility base has also been widened to offset the negative impact of lower tariffs.
Others
Government offers several other incentives
such as preferential loans, subsidized
interest rates, mandatory grid connection,
and mandatory purchase of electricity from
licensed renewable energy producers.
China is one of the fastest growing markets for PV installations. The government’s supportive policy has resulted in strong growth in PV installations.
USA
Investment Tax Credit (Itc) Scheme
This scheme allows businesses to invest in PV
projects and receive a tax credit for up to 30%
of the expense until 2016 and removed the
prohibition against a utility company’s use of
the ITC, thereby allowing these companies to
take advantage of the credit.
As the extension is about to end in 2 years and a status quo is not certain, the US PV industry has started to witness rapid growth in installations to become the fastest growing market after China.
Japan
FIT scheme
The scheme provides a fixed amount of tariff for
PV-based electricity generated by household/
non-household customers in Japan. The projects
receive benefits under this scheme for a period of
20 years. The electricity suppliers collect FIT as a
surcharge from their customers.
Although the tariffs have been reduced a few times, it has limited impact, as Japan still offers the highest prices (nearly double the global average) for PV systems.
Source: Congressional Research Services, METI Japan, Aranca research
Table 2: Major Policies for the PV Industry in Key Non-European PV Markets
6© Aranca 2015. All rights reserved. | [email protected] | www.aranca.com Aranca is an ISO 27001:2013 certified company
PHOTOVOLTAIC INDUSTRYWITNESSING A PARADIGM SHIFT
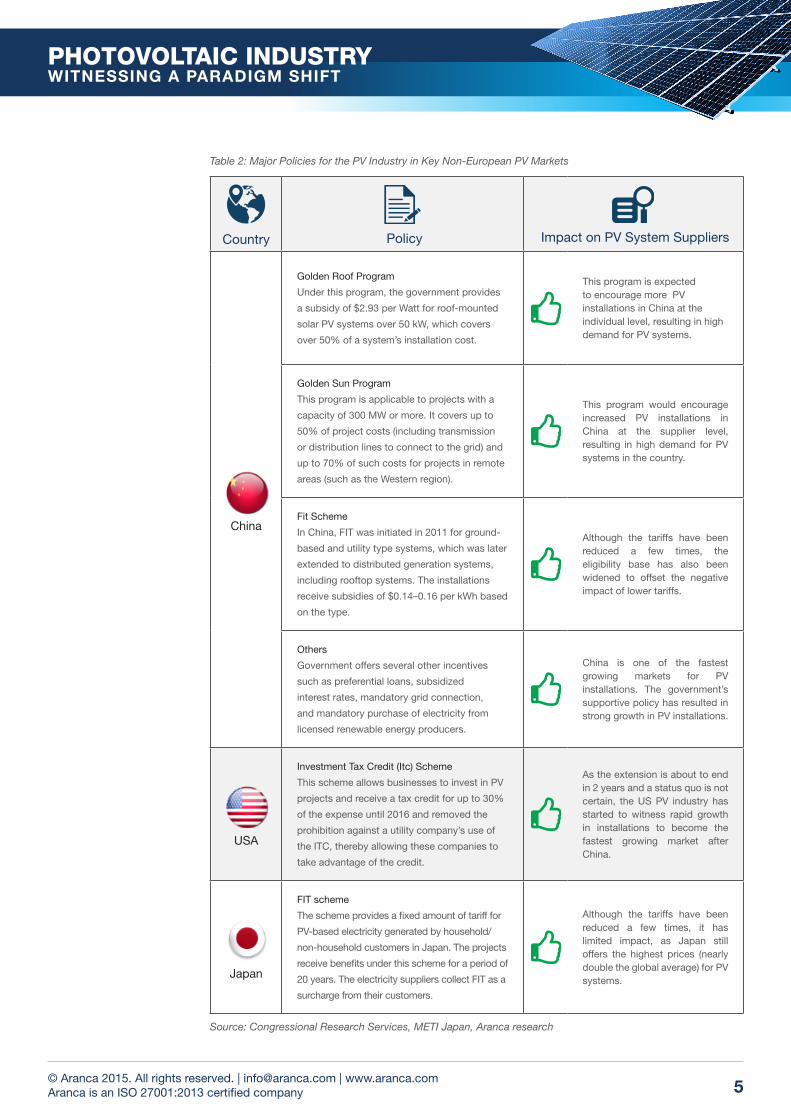
With the PV industry under transition, the demand pattern is shifting from European countries to non-European countries. China, Japan, and the US are together expected to account for over 60% of the global demand for PV installations in 2015, led by government incentives and declining cost of systems. However, gradual reduction in subsidies and state incentives in European countries is expected to result in lower demand, excluding the UK.
In 2013-2014, growth in the global PV industry was largely driven by Asian countries, particularly China and Japan, which are currently the largest and second-largest PV markets, respectively. The markets in the Americas expanded at a lower rate as compared with China/Japan, but significant growth was observed in the US. In other regions such as the Middle-East and Africa, interest in PV installations is yet to translate into a meaningful market.
RISING DOMINANCE OF CHINA, JAPAN, AND THE US IN GLOBALPV INDUSTRY

7© Aranca 2015. All rights reserved. | [email protected] | www.aranca.com Aranca is an ISO 27001:2013 certified company
PHOTOVOLTAIC INDUSTRYWITNESSING A PARADIGM SHIFT
Source: IHS, Aranca research
14.4
9.0
8.4
3.2
2.51.91.0 0.8
0.80.8
PV installations in 2015E (GW)
China Japan USA UK GermanyIndia Canada France Chile Italy
Trend Expected to Continue in 2015
Non-European Countries Accounted ForMost New PV Installations
13.1
9.4
6.9
2.8
2.01.1
0.90.9 0.8 0.8PV installations in 2014 (GW)
China Japan USA UKGermany India South Africa ItalyCanada Australia
Source: IHS, Aranca research
China, Japan, and USA Drove
Demand in 2014

8© Aranca 2015. All rights reserved. | [email protected] | www.aranca.com Aranca is an ISO 27001:2013 certified company
PHOTOVOLTAIC INDUSTRYWITNESSING A PARADIGM SHIFT
Source: US DoE, Aranca research
For the third consecutive year, according to EPIA, PV was one of the two most installed
sources of electricity in the European Union (EU) in 2013. The PV industry in Europe and
globally continued to improve its competitiveness vis-à-vis other industries in the electricity
sector, led by a significant decline in the cost of PV systems and rising electricity prices.
The savings in electricity cost and/or revenues generated by selling PV electricity are
converging with (or even higher in some cases) the long-term cost of installing and financing
a PV system.
Prices of residential and commercial PV systems in USA have declined by more than 60% over the last 15 years
GROWING COMPETITIVENESS OF PV IN ELECTRICITY SECTOR
$4
$6
$8
$10
$12
1998 1999 2000 2001 2002 2003 2004 2005 2006 2007 2008 2009 2010 2011
Inst
alle
d Sy
stem
Pric
e $/
W (2
011
DC)
Installation Year
Installed Price of Residential and Commercial PV Systems (US) (Median values)
≤10kW 10-100kW >100kW

9© Aranca 2015. All rights reserved. | [email protected] | www.aranca.com Aranca is an ISO 27001:2013 certified company
PHOTOVOLTAIC INDUSTRYWITNESSING A PARADIGM SHIFT
The levelized cost of electricity (LCoE) is an industry matrix that is widely used to assess
the relative viability of different electricity generation methods.
The LCoE for PV systems is nearing the LCoE for coal and natural gas, the two most
popular sources of producing electricity.
With a declining LCoE, the demand for PV systems could be partially driven by self-
consumption rather than just FITs or similar support schemes.
The decline in LCoE for solar power is essentially due to intense competition, technological
improvement, economies of scale, and state subsidies in various forms.
Moreover, the LCoE for dispatchable fuel-based systems, such as coal and gas, depends
on prevailing fuel prices and exhibits an increasing long-term trend, unlike non-dispatchable
fuel-based systems such as solar.
In general, solar systems exhibit a declining long-term trend with advancement in technology
and scale of production.
Power Plant Type Cost ($/kWh) Power Plant Type Cost ($/kWh)
Coal 0.10–0.14 Solar PV 0.13
Natural Gas 0.07–0.13 Solar Thermal 0.24
Nuclear 0.10 Geothermal 0.05
Wind 0.08–0.20 Biomass 0.10
Hydro 0.08
Table 3: Comparison of LCoE for Different Types of Power Plants
Source: US DoE, Aranca research

10© Aranca 2015. All rights reserved. | [email protected] | www.aranca.com Aranca is an ISO 27001:2013 certified company
PHOTOVOLTAIC INDUSTRYWITNESSING A PARADIGM SHIFT
0
10,000
20,000
30,000
40,000
50,000
60,000
70,000
2013 2014 2015E 2016E 2017E 2018E
Ship
men
ts (M
Wac
)
Asia-Pacific North America Europe Latin America Middle East-Africa
Demand to Shift from Europe to USA and APAC
PV Inverter Market Value to Stabilize with Demand
Source: GTM research, Aranca research
Source: GTM research, Aranca research
The global PV industry is becoming more geographically diverse; this offers demand
opportunities in emerging PV markets to offset weak demand in matured markets. We
expect the US, China, and Japan to fuel demand growth over the next two to three years,
which would compensate for the declining demand in European markets. Global PV
shipments are estimated to reach about 50 GW in 2015 compared with 40G W in 2014. The
industry is expected to witness high growth in demand in the near term, as the need for
a wide scope of services increases and rising demand from new markets with weak grids
creates the need for more flexible architectures.
Demand Expected to Rise After Weak 2014
11© Aranca 2015. All rights reserved. | [email protected] | www.aranca.com Aranca is an ISO 27001:2013 certified company
PHOTOVOLTAIC INDUSTRYWITNESSING A PARADIGM SHIFT
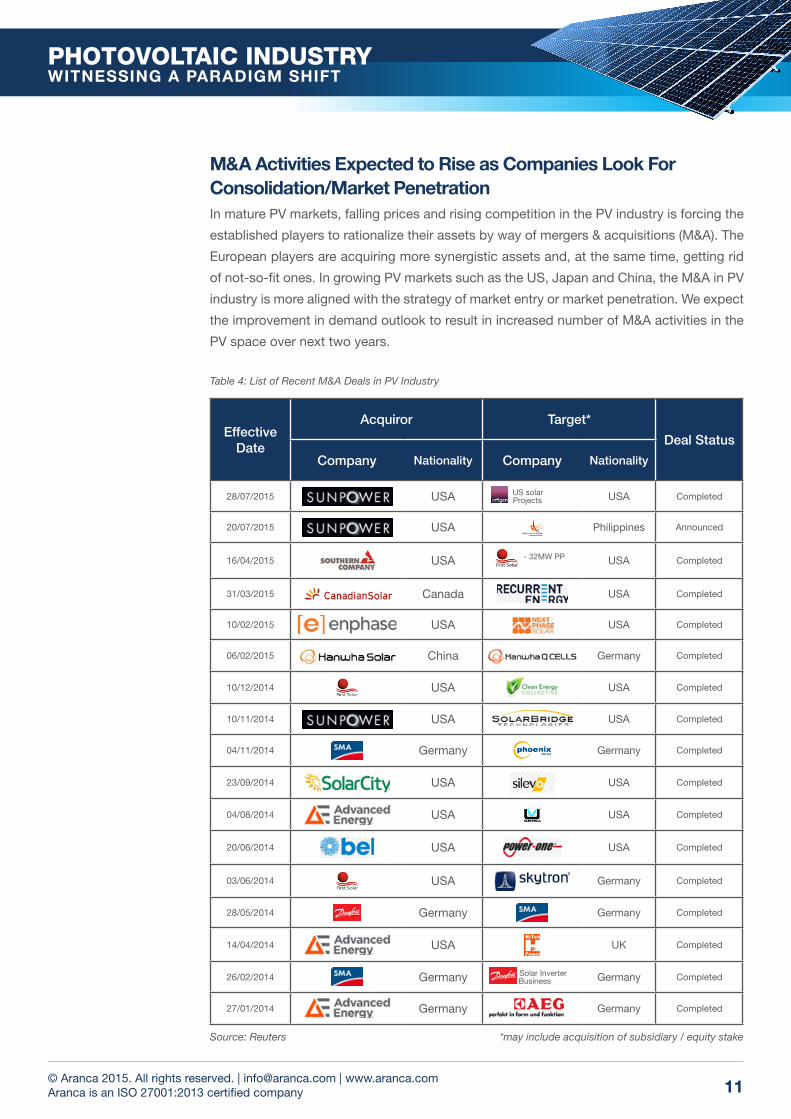
M&A Activities Expected to Rise as Companies Look For Consolidation/Market Penetration
Table 4: List of Recent M&A Deals in PV Industry
*may include acquisition of subsidiary / equity stakeSource: Reuters
In mature PV markets, falling prices and rising competition in the PV industry is forcing the
established players to rationalize their assets by way of mergers & acquisitions (M&A). The
European players are acquiring more synergistic assets and, at the same time, getting rid
of not-so-fit ones. In growing PV markets such as the US, Japan and China, the M&A in PV
industry is more aligned with the strategy of market entry or market penetration. We expect
the improvement in demand outlook to result in increased number of M&A activities in the
PV space over next two years.
Effective Date
Acquiror Target*
Deal Status
Company Nationality Company Nationality
28/07/2015 USA US solar Projects USA Completed
20/07/2015 USA Philippines Announced
16/04/2015 USA - 32MW PP USA Completed
31/03/2015 Canada USA Completed
10/02/2015 USA USA Completed
06/02/2015 China Germany Completed
10/12/2014 USA USA Completed
10/11/2014 USA USA Completed
04/11/2014 Germany Germany Completed
23/09/2014 USA USA Completed
04/08/2014 USA USA Completed
20/06/2014 USA USA Completed
03/06/2014 USA Germany Completed
28/05/2014 Germany Germany Completed
14/04/2014 USA UK Completed
26/02/2014 Germany Solar Inverter Business Germany Completed
27/01/2014 Germany Germany Completed
12© Aranca 2015. All rights reserved. | [email protected] | www.aranca.com Aranca is an ISO 27001:2013 certified company
PHOTOVOLTAIC INDUSTRYWITNESSING A PARADIGM SHIFT
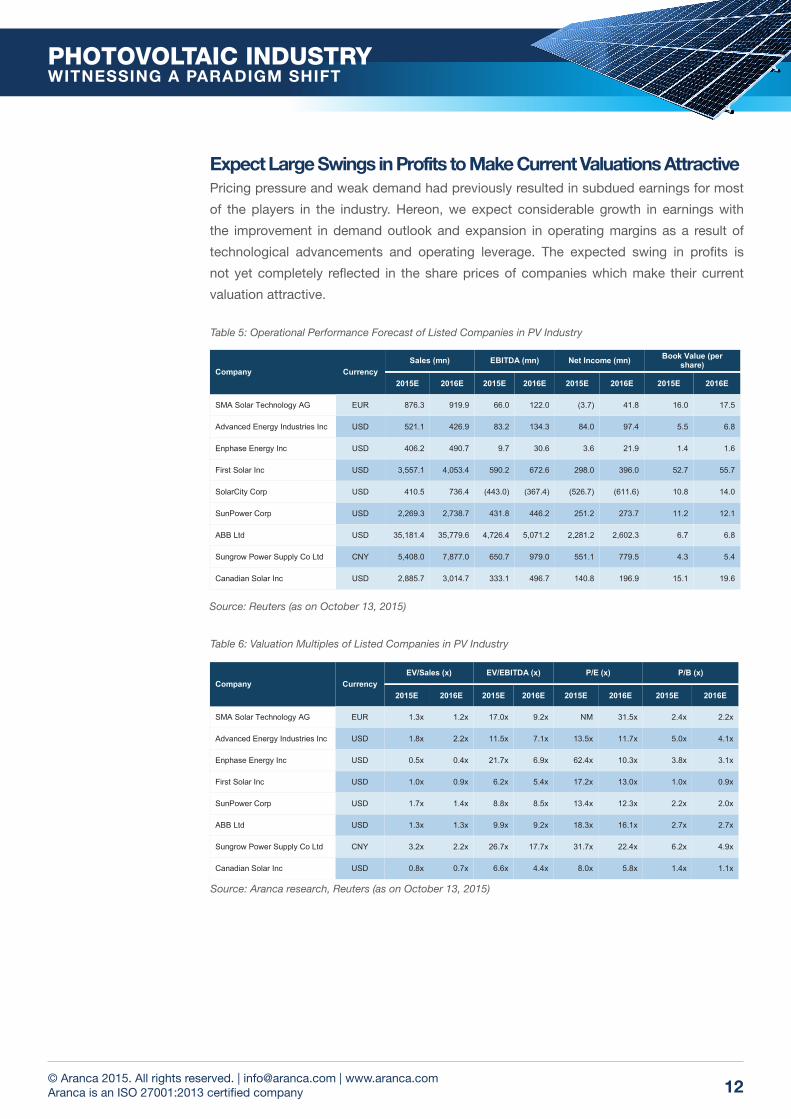
Expect Large Swings in Profits to Make Current Valuations Attractive Pricing pressure and weak demand had previously resulted in subdued earnings for most
of the players in the industry. Hereon, we expect considerable growth in earnings with
the improvement in demand outlook and expansion in operating margins as a result of
technological advancements and operating leverage. The expected swing in profits is
not yet completely reflected in the share prices of companies which make their current
valuation attractive.
Table 5: Operational Performance Forecast of Listed Companies in PV Industry
Table 6: Valuation Multiples of Listed Companies in PV Industry
Company Currency Sales (mn) EBITDA (mn) Net Income (mn) Book Value (per
share)
2015E 2016E 2015E 2016E 2015E 2016E 2015E 2016E
SMA Solar Technology AG EUR 876.3 919.9 66.0 122.0 (3.7) 41.8 16.0 17.5
Advanced Energy Industries Inc USD 521.1 426.9 83.2 134.3 84.0 97.4 5.5 6.8
Enphase Energy Inc USD 406.2 490.7 9.7 30.6 3.6 21.9 1.4 1.6
First Solar Inc USD 3,557.1 4,053.4 590.2 672.6 298.0 396.0 52.7 55.7
SolarCity Corp USD 410.5 736.4 (443.0) (367.4) (526.7) (611.6) 10.8 14.0
SunPower Corp USD 2,269.3 2,738.7 431.8 446.2 251.2 273.7 11.2 12.1
ABB Ltd USD 35,181.4 35,779.6 4,726.4 5,071.2 2,281.2 2,602.3 6.7 6.8
Sungrow Power Supply Co Ltd CNY 5,408.0 7,877.0 650.7 979.0 551.1 779.5 4.3 5.4
Canadian Solar Inc USD 2,885.7 3,014.7 333.1 496.7 140.8 196.9 15.1 19.6
Source: Reuters (as on October 13, 2015)
Source: Aranca research, Reuters (as on October 13, 2015)
Company Currency EV/Sales (x) EV/EBITDA (x) P/E (x) P/B (x)
2015E 2016E 2015E 2016E 2015E 2016E 2015E 2016E
SMA Solar Technology AG EUR 1.3x 1.2x 17.0x 9.2x NM 31.5x 2.4x 2.2x
Advanced Energy Industries Inc USD 1.8x 2.2x 11.5x 7.1x 13.5x 11.7x 5.0x 4.1x
Enphase Energy Inc USD 0.5x 0.4x 21.7x 6.9x 62.4x 10.3x 3.8x 3.1x
First Solar Inc USD 1.0x 0.9x 6.2x 5.4x 17.2x 13.0x 1.0x 0.9x
SunPower Corp USD 1.7x 1.4x 8.8x 8.5x 13.4x 12.3x 2.2x 2.0x
ABB Ltd USD 1.3x 1.3x 9.9x 9.2x 18.3x 16.1x 2.7x 2.7x
Sungrow Power Supply Co Ltd CNY 3.2x 2.2x 26.7x 17.7x 31.7x 22.4x 6.2x 4.9x
Canadian Solar Inc USD 0.8x 0.7x 6.6x 4.4x 8.0x 5.8x 1.4x 1.1x

13© Aranca 2015. All rights reserved. | [email protected] | www.aranca.com Aranca is an ISO 27001:2013 certified company
PHOTOVOLTAIC INDUSTRYWITNESSING A PARADIGM SHIFT
CONCLUSIONAfter several years of policy-driven high growth, the global PV industry is witnessing a shift in
market dynamics and geographical focus. Declining political support in Europe has created
uncertainty regarding the policies related to the PV industry, hampering its re-development.
However, outside Europe, the growth potential seems promising, as increasing demand in
several countries could convert into high growth for the industry.
As the potential of PV based power and its benefits for the world are becoming more
relevant and feasible than ever, PV systems are being increasingly used within the electricity
generation system. Undoubtedly, PV’s share in the global energy mix would continue to
increase. We can infer the following points:
Europe’s PV industry is converging toward a more fundamentally sustainable demand environment from an initial phase of high growth, propelled by sovereign support.
Due to the substantial price declines in recent years, PV systems are now broadly recognized as a reliable, cost competitive and sustainable energy source. Therefore, the PV industry should be considered and looked upon as a low-risk investment for the financial community.
Though, the PV industry is gradually moving towards a self-sustainable demand, its fortunes are still significantly hinged on political support and regulatory framework.
As the PV industry’s focus shifted to China, Japan, and the US from the EU, we could witness increased M&A activities in the EU, as companies try to explore new markets and consolidate their market share. Moreover, companies in these growing markets are better placed due to their local advantage to gain from the rise in demand compared with their European counterparts.
Key issues expected to play an important role in determining further market evolution include state policies, competitiveness of PV in the power sector, and industry consolidation.
14© Aranca 2015. All rights reserved. | [email protected] | www.aranca.com Aranca is an ISO 27001:2013 certified company
PHOTOVOLTAIC INDUSTRYWITNESSING A PARADIGM SHIFT
This report is published by Aranca, a customized research and analytics services provider to global clients.
The information contained in this document is confidential and is solely for use of those persons to whom it is addressed and may not be reproduced,
further distributed to any other person or published, in whole or in part, for any purpose.
This document is based on data sources that are publicly available and are thought to be reliable. Aranca may not have verified all of this information
with third parties. Neither Aranca nor its advisors, directors or employees can guarantee the accuracy, reasonableness or completeness of the
information received from any sources consulted for this publication, and neither Aranca nor its advisors, directors or employees accepts any
liability whatsoever (in negligence or otherwise) for any loss howsoever arising from any use of this document or its contents or otherwise arising in
connection with this document.
Further, this document is not an offer to buy or sell any security, commodity or currency. This document does not provide individually tailored
investment advice. It has been prepared without regard to the individual financial circumstances and objectives of persons who receive it. The
appropriateness of a particular investment or currency will depend on an investor’s individual circumstances and objectives. The investments
referred to in this document may not be suitable for all investors. This document is not to be relied upon and should not be used in substitution for
the exercise of independent judgment.
This document may contain certain statements, estimates, and projections with respect to the anticipated future performance of securities,
commodities or currencies suggested. Such statements, estimates, and projections are based on information that we consider reliable and may
reflect various assumptions made concerning anticipated economic developments, which have not been independently verified and may or may not
prove correct. No representation or warranty is made as to the accuracy of such statements, estimates, and projections or as to its fitness for the
purpose intended and it should not be relied upon as such. Opinions expressed are our current opinions as of the date appearing on this material
only and may change without notice.
© 2015, Aranca. All rights reserved.
DISCLAIMER
INVESTMENT RESEARCH | BUSINESS RESEARCH | IP RESEARCH | BUSINESS VALUATION