Planning Commission, Aranca Research · BSNL, MTNL, and Bharti together account for 89 per cent of...
55
Transcript of Planning Commission, Aranca Research · BSNL, MTNL, and Bharti together account for 89 per cent of...


Second-largest
subscriber base
• With a subscriber base of nearly 964 million by the end of November 2014, India has the
second-largest telecom network in the world
Third-highest number of
internet users
• With 164.81 million internet subscriptions, India stood third-highest in terms of total
internet users in 2013
Most of the Internet
accessed through
mobile phones
• Mobile based Internet is a key component of Indian Internet usage, with seven out of eight
users accessing Internet from their mobile phones
Rising penetration rate • Urban teledensity stood at 147.38 per cent and rural teledensity at 45.76 per cent as of
November 2014, up from 87.1 per cent and 23 per cent, respectively, in March 2009
Source: Telecom Regulatory Authority of India,
Planning Commission, Aranca Research
Affordability and lower
rates • Availability of affordable smartphones and lower rates are expected to drive growth in the
Indian telecom industry


Growing demand
Source: BMI (Business Monitor International) Report, Aranca Research, Internet Mobile Association of India (IAMAI)
Notes: * figure for 2014 is up to November 2014, MNP - Mobile Number Portability, E - Estimates (2016E - Estimates for 2016)
Robust demand
• India is the world‟s second-largest telecommunications market, with 964 million subscribers as of November 2014
• With 70 per cent of the population staying in rural areas, the rural market would be a key growth driver in the coming years
Attractive opportunities
• Telecom penetration in the nation‟s rural market is expected to increase to 70 per cent by 2017 from 41.0 per cent as of March 2013
• India is expected to become the second-largest internet market in 2014
Policy support
• The government has been proactive in its efforts to transform India into a global telecommunication hub; prudent regulatory support has also helped
• National Telecom Policy 2012 proposes unified licensing, full MNP and free roaming
High ratings
• The country has a strong telecommunication infrastructure
• In terms of telecommunication ratings, India ranks ahead of its peers in the West and Asia
2014*
Number of
subscribers:
964 million
FY16E
Number of
subscribers:
1.2 billion
Advantage
India


Source: Aranca Research
• Comprises establishments operating and maintaining switching and transmission facilities to provide direct communications via airwaves
• Consists of companies that operate and maintain switching and transmission facilities to provide direct communications through landlines, microwave or a combination of landlines and satellite link-ups
• Includes Internet Service Providers (ISPs) that offer broadband internet connections through consumer and corporate channels
Mobile
(wireless)
Fixed-line
(wireline)
Internet
services
Telecom

India is currently the second-largest telecommunication
market and has the third highest number of internet users in
the world
India‟s telephone subscriber base expanded at a CAGR of
24.1 per cent to 933 million over FY07–14
Teledensity (defined as the number of telephone
connections for every hundred individuals) increased from
18.3 in FY07 to 75.2 in FY14
In November 2014, total telephone subscription stood at
964 million, while teledensity was at 77.2
Growth in total subscribers
Source: Telecom Regulatory Authority of India, Aranca Research
Notes: CAGR - Compound Annual Growth Rate,
FY15*- Till November 2014
18.3
26.2
37.0
52.7
70.9
78.7
73.3
75.2 77.2
10
30
50
70
90
180
380
580
780
980
FY07 FY08 FY09 FY10 FY11 FY12 FY13 FY14 FY15*
Telephone subscribers (Millions) Teledensity- (RHS)

19.6
23.3
32.1 33.2
33.3 37.7
40.8 39.1
FY06 FY07 FY08 FY09 FY10 FY11 FY12 FY13
Wireless and wireline revenues (USD billion) Indian telecom sector‟s revenue grew 13.4 per cent to
USD64.1 billion in FY12
Wireless and wireline revenue increased at a CAGR of 10.4
per cent to USD39.1 billion over FY06–13
Revenues from the telecom equipment segment stood at
USD23.5 billion in FY12 compared to USD23.4 billion in
FY11
Source: Telecom Regulatory Authority of India, Aranca Research
Note: CAGR - Compound Annual Growth Rate
CAGR: 10.4%

Composition of telephone subscribers (2014*) India‟s telephone subscriber base reached 964 million in
November 2014
The wireless segment (97 per cent of total telephone
subscriptions) dominates the market, while the wireline
segment accounts for the rest
Urban regions account for 59 per cent of telecom
subscriptions, while rural areas constitute the remaining
Source: Telecom Regulatory Authority of India, Aranca Research
Note: 2014* - Data as of November 2014
57%
40%
2%
1%
Urban Wireless
Rural Wireless
Urban Wireline
Rural Wireline

Wireless subscriptions (in million) During FY07-14, wireless subscriptions increased at a
CAGR of 27.5 per cent to 904.51 million
In FY15*, while urban wireless teledensity stood at 141.75,
rural wireless teledensity stood at 45.13
Source: Telecom Regulatory Authority of India, Aranca Research
Notes: CAGR - Compound Annual Growth Rate,
FY15* - As of November 2014
165 261
392
584
812 919
868
905 937
FY07 FY08 FY09 FY10 FY11 FY12 FY13 FY14 FY15*
CAGR: 27.5%
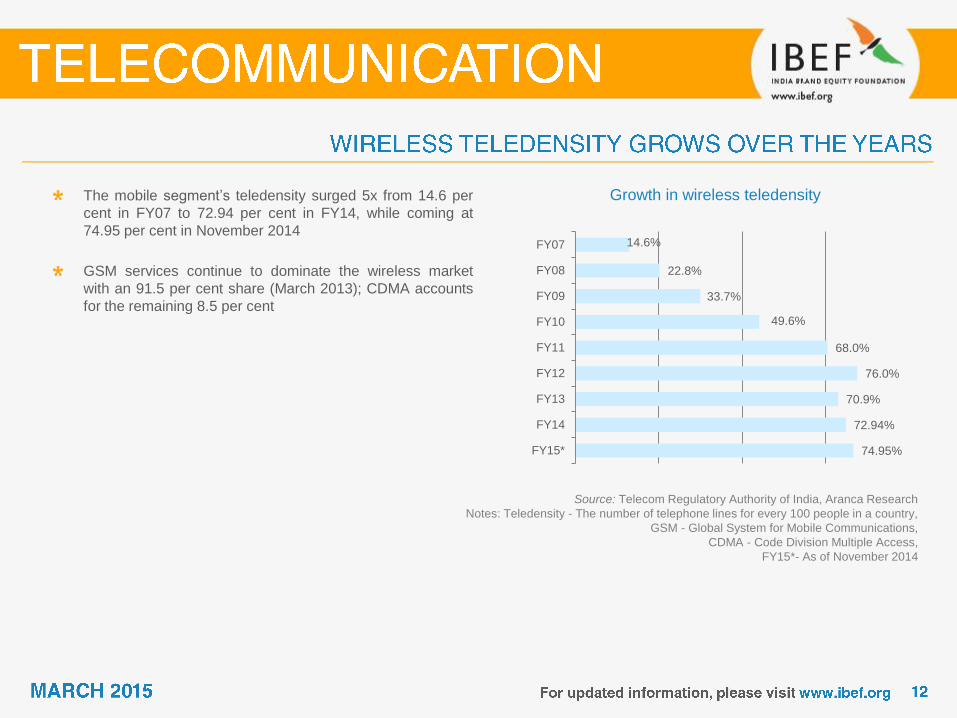
Growth in wireless teledensity The mobile segment‟s teledensity surged 5x from 14.6 per
cent in FY07 to 72.94 per cent in FY14, while coming at
74.95 per cent in November 2014
GSM services continue to dominate the wireless market
with an 91.5 per cent share (March 2013); CDMA accounts
for the remaining 8.5 per cent
Source: Telecom Regulatory Authority of India, Aranca Research
Notes: Teledensity - The number of telephone lines for every 100 people in a country,
GSM - Global System for Mobile Communications,
CDMA - Code Division Multiple Access,
FY15*- As of November 2014
74.95%
72.94%
70.9%
76.0%
68.0%
49.6%
33.7%
22.8%
14.6%
FY15*
FY14
FY13
FY12
FY11
FY10
FY09
FY08
FY07

Wireless market share in terms of total subscribers
(FY15*)
Bharti Airtel is the market leader, with a 23 per cent share of
total subscription, followed by Vodafone (18.9 per cent
share)
The top five players – Bharti Airtel, Vodafone, Idea,
Reliance, and BSNL – account for over 79 per cent of the
total subscribers
Source: Telecom Regulatory Authority of India, Aranca Research
Notes: BSNL - Bharat Sanchar Nigam Limited,
FY15* - As of November 2014
23.0%
18.9%
15.8%
11.3%
8.8%
8.3%
7.0%
4.5%
1.0%
1.4%
Bharti Airtel
Vodafone
Idea
Reliance
BSNL
Aircel
Tata
Telewings
Sistema
Others

Fixed-line segment subscription and teledensity
(FY15*)
Total fixed-line subscription stood at 27.1 million, while teledensity reached 2.17 per cent due to wide usability of the
wireless segment in FY15*
BSNL is the market leader with a 63 per cent share, followed by MTNL (13 per cent)
BSNL, MTNL, and Bharti together account for 89 per cent of the total fixed-line market
Fixed-line market share (FY15*)
Source: Telecom Regulatory Authority of India, Aranca Research
Notes: BSNL - Bharat Sanchar Nigam Limited,
FY15* - As of November 2014
0.0%
0.9%
1.8%
2.7%
3.6%
4.5%
0
9
18
27
36
45
FY07 FY08 FY09 FY10 FY11 FY12 FY13 FY14 FY15*
Wireline subscription (Millions) Wireline teledensity-RHS
63.0% 13.0%
12.5%
5.9%
4.4%
1.3%
BSNL
MTNL
Bharti
Tata
Reliance
Others

8.6 10.4 12.9 15.2 18.7 22.4 25.3
239.0 243.0
2006 2007 2008 2009 2010 2011 2012 2013* 2014*
Internet subscriptions (in million) The number of Internet subscribers increased at a CAGR of
52 per cent to 243 million in 2014 from 8.6 million in 2006
Source: Telecom Regulatory Authority of India, Business Monitor International,
Aranca Research
Notes: * - Including Internet Access by Wireless Phone Subscribers,
CAGR - Compound Annual Growth Rate;
BSNL - Bharat Sanchar Nigam Ltd,
Internet live stats
CAGR: 52%

Total internet service providers revenues in
USD billion
Total internet service providers‟ revenues expanded at a
CAGR* of 12.2 per cent to USD2.2 billion over 2009–12
1.8
2.1 1.9 2.2
2009 2010 2011 2012
Source: Telecom Regulatory Authority of India, Aranca Research
Notes: CAGR - Compound Annual Growth Rate,
*CAGR has been calculated in Indian Rupee Terms
CAGR*: 12.2%

Wired broadband subscriptions (in million) Broadband subscription increased at a CAGR of 27.7 per
cent during FY06–14
Source: Telecom Regulatory Authority of India, Aranca Research
Notes: CAGR - Compound Annual Growth Rate
FY15* - Data as of November 2014
2.1
3.1
5.5
7.8
10.9
13.4
15.0 15.1 14.9 15.2
FY06 FY07 FY08 FY09 FY10 FY11 FY12 FY13 FY14 FY15*
CAGR: 27.7%
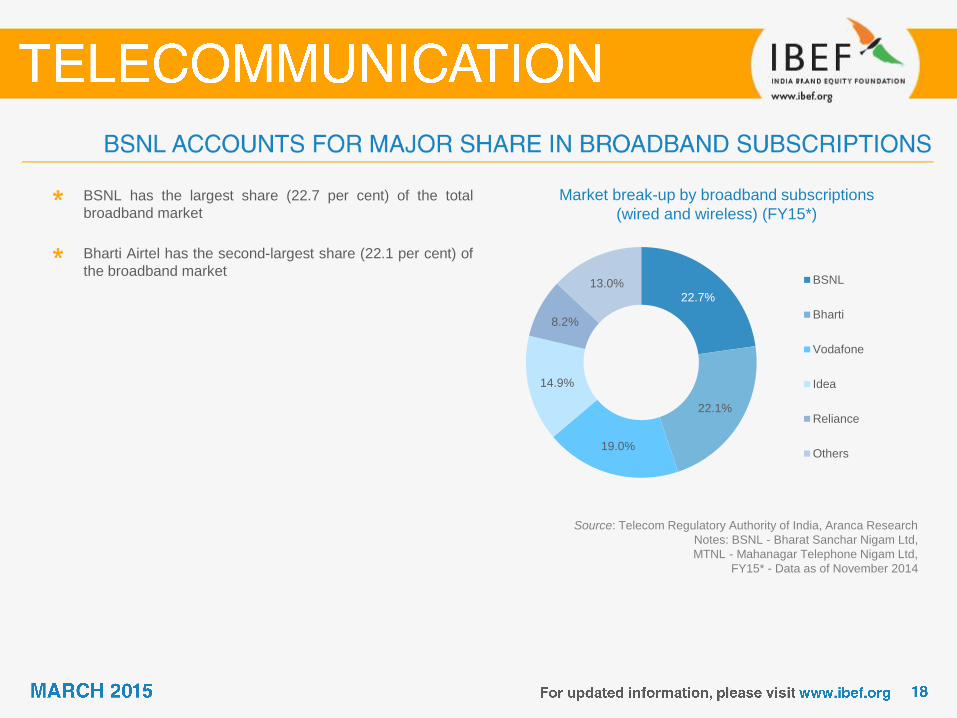
Market break-up by broadband subscriptions
(wired and wireless) (FY15*)
BSNL has the largest share (22.7 per cent) of the total
broadband market
Bharti Airtel has the second-largest share (22.1 per cent) of
the broadband market
Source: Telecom Regulatory Authority of India, Aranca Research
Notes: BSNL - Bharat Sanchar Nigam Ltd,
MTNL - Mahanagar Telephone Nigam Ltd,
FY15* - Data as of November 2014
22.7%
22.1%
19.0%
14.9%
8.2%
13.0% BSNL
Bharti
Vodafone
Idea
Reliance
Others

Company Ownership Presence
Mahanagar Telephone
Nigam Ltd (MTNL)
Government (56.3 per cent),
Life Insurance Corporation
(18.8 per cent)
Fixed-line and mobile telephony (in
Delhi and Mumbai), data and Internet
Bharat Sanchar Nigam
Ltd (BSNL) Government (100 per cent)
Fixed-line and mobile telephony (GSM
– outside Delhi and Mumbai), data and
Internet in 22 circles
Reliance
Communications
ADAG Group (approximately
67.9 per cent) Mobile (CDMA) and broadband
Bharti Airtel
Bharti Group (43.6 per cent),
Pastel Ltd (14.8 per cent),
Indian Continent Investment
(6.7 per cent)
Broadband and mobile (GSM) in 22
circles
Vodafone India
Vodafone (84.5 per cent),
Piramal Enterprises
(11.0 per cent)
Broadband and mobile (GSM) in 22
circles
Source: Companies‟ websites, Bloomberg, Aranca Research

Green telecom
• The green telecom concept is aimed at reducing carbon footprint of the telecom industry
through lower energy consumption
• TRAI initiated a consultation process in May 2010, requesting inputs from firms across the
telecom value chain to provide recommendations on green telecom‟s framework and
implementation
Expansion to rural
markets
• There are over 62,443 uncovered villages in India; these would be provided with village
telephone facility with subsidy support from the government‟s Universal Service Obligation
Fund (thereby increasing rural teledensity)
• In November 2014, the rural subscriber base accounted for 41 per cent of the total
subscriber base, thereby fuelling the sector‟s growth
Emergence of BWA
technologies
• The most significant recent developments in wireless communication include BWA
technologies such as WiMAX and LTE
• WiMAX is expected to have attracted around 8 to 10 million subscribers
• Reliance Jio, the only operator which bagged 4G spectrum in all 22 circles, is planning to
roll out its 4G LTE services in 800 Indian cities between April and June 2015
Source: Aranca Research
Notes: BWA - Broadband Wireless Access, TRAI - Telecom Regulatory Authority of India
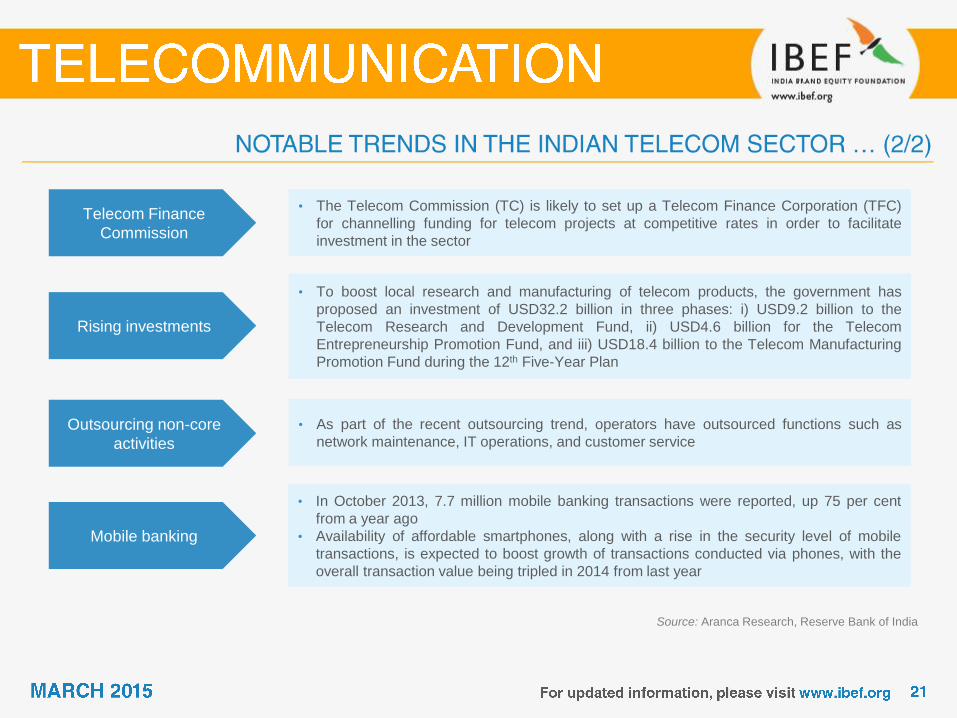
Telecom Finance
Commission
• The Telecom Commission (TC) is likely to set up a Telecom Finance Corporation (TFC)
for channelling funding for telecom projects at competitive rates in order to facilitate
investment in the sector
Rising investments
• To boost local research and manufacturing of telecom products, the government has
proposed an investment of USD32.2 billion in three phases: i) USD9.2 billion to the
Telecom Research and Development Fund, ii) USD4.6 billion for the Telecom
Entrepreneurship Promotion Fund, and iii) USD18.4 billion to the Telecom Manufacturing
Promotion Fund during the 12th Five-Year Plan
Outsourcing non-core
activities
• As part of the recent outsourcing trend, operators have outsourced functions such as
network maintenance, IT operations, and customer service
Mobile banking
• In October 2013, 7.7 million mobile banking transactions were reported, up 75 per cent
from a year ago
• Availability of affordable smartphones, along with a rise in the security level of mobile
transactions, is expected to boost growth of transactions conducted via phones, with the
overall transaction value being tripled in 2014 from last year
Source: Aranca Research, Reserve Bank of India

A surge in the subscriber base has necessitated network expansion covering a wider area, thereby creating a need for
significant investment in telecom infrastructure
To curb costs and focus on core operations, telecom companies have been segregating their tower assets into separate
companies
Creating separate tower companies has helped telecom companies lower operating cost and improve capital structure; this
has also provided an additional revenue stream
Inspired by the success seen by Indian players in towers business, most of the operators around the world are replicating
the model
Emergence of tower industry
Rising
competition
Higher
operating
cost and
debt burden
Focus on
tower
sharing to
reduce
costs
Segregation
of towers
into
separate
companies
Source: Aranca Research


Source: Aranca Research
Note: VoIP – Voice Over Internet Protocol
Competitive Rivalry
• Customers‟ low switching cost and price sensitivity are increasing
competition among players
• High exit barriers are also intensifying competition
• There are around 6 to 7 players in each region, leading to intense
competition
Threat of New Entrants Substitute Products
Bargaining Power of Suppliers Bargaining Power of Customers
• Strict government regulations
• Extremely high infrastructure
setup cost
• Difficulty in achieving
economies of scale
• High bargaining power of
suppliers as there are just a few
suppliers in the sector
• High cost of switching suppliers
• Low switching cost and mobile
number portability give
customers high bargaining
power
• Customers are price sensitive
• Hardly any threat of substitute
products as there is no
substitute available in the
market
Competitive
Rivalry
(High)
Threat of New
Entrants
(Low)
Threat of
Substitute
Products
(Low)
Bargaining
Power of
Customers
(High)
Bargaining
Power of
Suppliers
(High)


Source: Company websites, Aranca Research
Notes: CDMA – Code Division Multiple Access,
GSM - Global System for Mobile Communication
• Players are using innovative marketing strategies to succeed in this sector. For example,
• Vodafone launched a very successful ZooZoo ad campaign
• Bharti Airtel is using celebrity power for endorsements
• Players differentiate themselves by providing different services to customers. For example,
• Reliance Communication offers both CDMA and GSM mobile services and has
launched „All Share Post-paid Plan‟ which offers group or family members free
sharing of voice and data on a single bill
• Bharti Airtel launched HD gaming for smartphones, and introduced a rural portal –
the first ever portal to cater to the rural segment
• Players price their products very carefully due to the price sensitive nature of customers
and high competition in the sector. Players generally go for price war. For example,
• Reliance offered 3G services at 2G price and others followed suit
• Tata Docomo introduced „one paisa per second‟ plan, which was followed by other
players in the sector
Marketing strategy
Differentiation
Pricing strategy


Growing demand
Inviting Resulting in
Growing demand Increasing
investments Policy support
Higher real
income and
changing lifestyles
Growing young
population
Increasing
MOU and data
usage
Reduction in license fee
Relaxed FDI Norms
Encourages
firms to expand
to rural areas
Higher FDI inflows
Increasing M&A
activity
Notes: FDI - Foreign Direct Investment,
MOU - Minutes of Use per month and per subscriber, M&A - Mergers and Acquisitions

Rising per capita income in India (USD) Increasing income has been a key determinant of demand
growth in the telecommunication sector in India
The IMF estimates nominal per capita income to expand at
a CAGR of 9.6 per cent over 2001–13 (USD1,414.1)
Source: IMF, Aranca Research
Notes: CAGR - Compound Annual Growth Rate,
F - Forecast
-9%
1%
11%
21%
31%
41%
300
600
900
1,200
1,500
1,800
2,100
2,400
199
8
199
9
200
0
200
1
200
2
200
3
200
4
200
5
200
6
200
7
200
8
200
9
201
0
201
1
201
2
201
3
201
4F
201
5F
201
6F
201
7F
201
8F
Per capita income, USD, LHS Annual growth rate, RHS

–
Indian residents shifting from low to high
income groups (%)
The emergence of an affluent middle class is triggering
demand for the mobile and internet segments
A young, growing population is aiding this trend (especially
demand for smart phones)
India to boast 519 million mobile internet users by 2018,
according to a Morgan Stanley survey#
1 3
7 2 6
17 12
25
29 35
40
32 50
26 15
2008 2020 2030
Globals (>18412.8) Strivers (9206.4-18412.8)
Seekers (3682.5 - 9206.4) Aspirers (1657-3682.5)
Deprived (<1657)
Source: McKinsey Quarterly Report, Aranca Research
Note: # A report named „Tablet Demand and Disruption,
Mobile Users Come of Age‟ February 2011
Million Household, 100%
222 273 322

1.1 1.7 1.9
3.2
4.2 4.9
6.2
7.8
9.5
2007 2008 2009 2010 2011 2012E 2013F 2014F 2015F
MVAS revenues (in USD billion) The Mobile Value Added Services (MVAS) industry is
forecasted to expand at a CAGR of 30.9 per cent to USD9.5
billion by 2015 from USD1.1 billion in 2007
The share of non-voice revenues, which currently stands at
around 10 per cent of telecom operators‟ revenues, is
estimated to rise to more than 30 per cent in the next five to
seven years
A decline in the prices of smartphones and data
subscription rates is likely to drive demand for MVAS
Source: Wipro Technologies,
The Internet and Mobile Association of India, Aranca Research
Notes: CAGR - Compound Annual Growth Rate,
MVAS - Mobile Value-Added Services,
E - Estimate, F - Forecast
CAGR: 30.9%

Reduction in license
fees
• The Government of India plans to cut license fees by up to 33 per cent for operators that
cover services for more than 95 per cent of the residential areas in a calling circle
• The issuance of several international and national long-distance licenses has created
opportunities and attracted new companies into the market
• TRAI has recommended reducing the license fee of telecom operators from 8 to 6 per cent
Abolishment of roaming
charges
• In May 2012, the Union Cabinet declared to abolish roaming charges and allow mobile
number portability even outside designated circles (without having to pay extra charges)
• Two GSM operators already announced free roaming packs in July 2013, whereas some
are in the process of offering free roaming services to customers
Relaxed
FDI norms
• FDI cap in the telecom sector has been increased to 100 per cent from 74 per cent; out of
100 per cent, 49 per cent will be done through automatic route and the rest will be done
through the FIPB approval route
• FDI of up to 100 per cent is permitted for infrastructure providers offering dark fibre,
electronic mail and voice mail
Notes: FDI - Foreign Direct Investment,
FIPB - Foreign Investment Promotion Board, Aranca Research

Allowed the use of
WiMAX
• In August 2008, the Department of Telecommunication (DoT) allowed operators to use
WiMAX networks as an alternative to cable and DSL to offer voice services
• This would enable faster delivery of wireless broadband services
Set up internet
connections
• The Department of Information Technology intends to set up over 1 million internet-
enabled common service centres across India as per the National e-Governance Plan
Expansion to rural
areas
• The USOF identified 5,000 villages, and is in the process of developing a scheme to
connect them through wireless broadband
• It also intends to provide 888,832 broadband connections in rural areas by 2014
• The USOF plans to strengthen the OFC network in rural and remote areas
• Rural Solar Mobile Charging Facilities (SMCFs) in 5000 villages through Lighting a Billion
Lives (LaBL) project
• The SMCFs shall be run by village entrepreneurs who shall recover nominal fees from the
rural public towards charging of mobile phones
Notes: USOF - Universal Service Obligation Fund; OFC - Optical Fibre Cable,
WiMAX - Worldwide Interoperability for Microwave Access Telecommunications

Financial support
• The USOF is expected to extend financial support to operators providing services in rural
areas and encourage active infrastructure sharing among operators
• TRAI has recommended that USO levy component to be reduced from 5 per cent to 3 per
cent of annual revenues for all the licenses from April 2015
Enhanced spectrum
limit
• The prescribed limit on spectrum would be increased from 6.2MHz to 2x8 MHz (paired
spectrum) for GSM technology in all areas other than Delhi and Mumbai, where it will be
2x10MHz (paired spectrum)
• Telecom players can, however, obtain additional frequency; there will be an auction of
spectrum subject to the limits prescribed for the merger of licenses
Relaxing M&A norms
• The government revised the M&A guidelines for the telecom sector in 2013; it raised the
limit on the market share of a merged entity in a circle to 50 per cent from 35 per cent
earlier
• The final draft guidelines stated that it would allow companies to trade spectrum and
retained the clause that would make the companies pay for spectrum beyond a prescribed
limit if it was acquired after paying the entry fee and not through auction
• In December 2013, the Empowered Group of Ministers (EGoM) approved the „mergers
and acquisitions‟ guidelines
Source: Aranca Research
Notes: USOF - Universal Service Obligation Fund; OFC - Optical Fibre Cable

Source: Digital Dawn,
KPMG Report 2013, Aranca Research
„Broadband for all‟ with a minimum download
speed of 2Mbps
Unified licensing, delinking of spectrum from license, online
real-time submission and processing
Aims at a „One Nation-One license‟ regime
with no roaming charges and nation
wide number portability
Increase rural teledensity from 39 to 70 per cent by 2017, and 100 per cent by
2020
Liberalisation of spectrum, and convergence of
network, services and devices
National Telecom
Policy - 2012

Cumulative FDI inflows into telecommunication (USD million)
Cumulative FDI inflows into the telecom sector over April 2000–November 2014 amounted to USD16.6 billion
During this period, FDI into the sector accounted for 7 per cent share of total FDI inflows into the country
Source: Department of Industrial Policy & Promotion, Aranca Research
Note: FY15* - Data mentioned is from April 2000 – November 2014
624 1,102
2,363
4,921
7,475
9,140
11,137 11,441
14,136 16,634
FY06 FY07 FY08 FY09 FY10 FY11 FY12 FY13 FY14 FY15*
Source: Thomson Banker, Deal Tracker, Aranca Research
Notes: M&A - Merger and Acquisition, PE - Private Equity
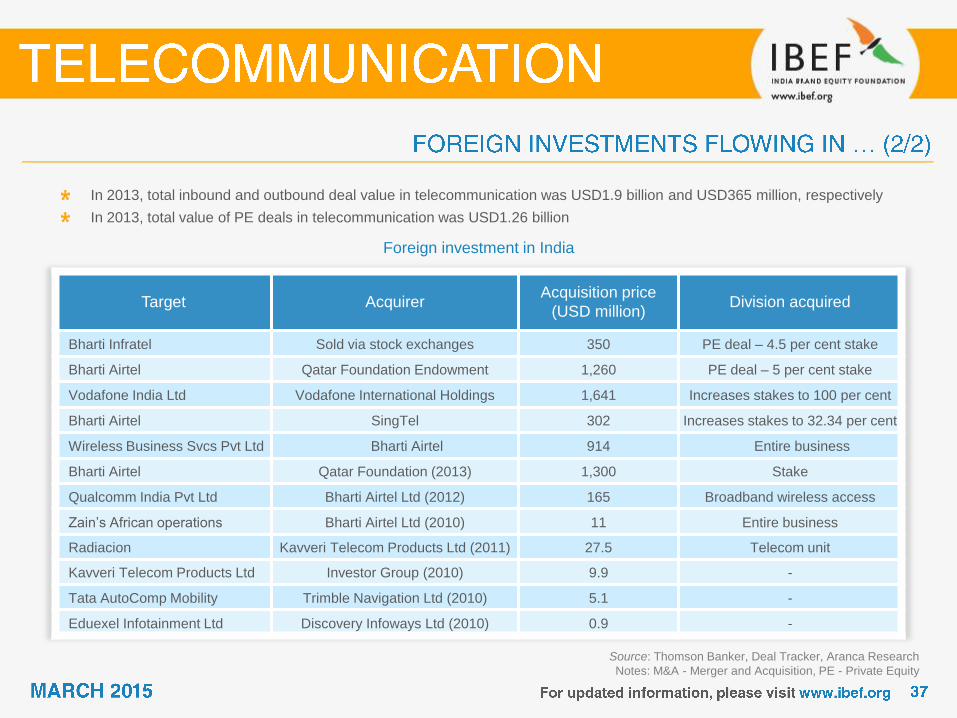
Target Acquirer Acquisition price
(USD million) Division acquired
Bharti Infratel Sold via stock exchanges 350 PE deal – 4.5 per cent stake
Bharti Airtel Qatar Foundation Endowment 1,260 PE deal – 5 per cent stake
Vodafone India Ltd Vodafone International Holdings 1,641 Increases stakes to 100 per cent
Bharti Airtel SingTel 302 Increases stakes to 32.34 per cent
Wireless Business Svcs Pvt Ltd Bharti Airtel 914 Entire business
Bharti Airtel Qatar Foundation (2013) 1,300 Stake
Qualcomm India Pvt Ltd Bharti Airtel Ltd (2012) 165 Broadband wireless access
Zain‟s African operations Bharti Airtel Ltd (2010) 11 Entire business
Radiacion Kavveri Telecom Products Ltd (2011) 27.5 Telecom unit
Kavveri Telecom Products Ltd Investor Group (2010) 9.9 -
Tata AutoComp Mobility Trimble Navigation Ltd (2010) 5.1 -
Eduexel Infotainment Ltd Discovery Infoways Ltd (2010) 0.9 -
In 2013, total inbound and outbound deal value in telecommunication was USD1.9 billion and USD365 million, respectively
In 2013, total value of PE deals in telecommunication was USD1.26 billion
Foreign investment in India

ZTE enters into
agreement with Calyx
• ZTE Telecom India, the wholly owned subsidiary of China‟s ZTE Corp, entered into an
exclusive agreement with Pune-based Calyx Group to market and distribute products
across India
• ZTE plans to enter the Indian smartphone market with five models priced at USD107–275
• It also plans to introduce tablet PCs in the Indian market after the smartphone launch
Reliance Jio Infocomm
and Vodafone
• To tap growth in broadband technologies and infrastructure expansion, Reliance Jio
Infocomm and Vodafone entered into an agreement to build and maintain an 8,000 km
submarine telecom and data cable system
• The system is expected to be operational by 2014 and would connect six countries
through landing points in Oman, the UAE, India (Mumbai and Chennai), Sri Lanka,
Malaysia and Singapore
Mobile wallet by
Vodafone
• Vodafone India and ICICI Bank launched M-Pesa, a service for mobile money transfer and
payment
• The service would allow customers to transfer money to any mobile phone in India, debit
and deposit funds, withdraw cash from designated outlets, pay bills, and shop at select
merchant establishments. M-Pesa would be available across India in the next 12–18
months
Source: Thomson Banker, Deal Tracker, Aranca Research
Note: M&A - Merger and Acquisition


• The number of wireless
subscribers is expected to
reach approximately 1.2
billion by 2016
• Of the total subscribers,
around 55 per cent are likely
to be from urban areas and
the rest from rural areas (45
per cent)
• The rural teledensity is
expected to reach 70 per cent
by 2017 and 100 per cent by
2020 from 45.76 per cent as
of November 2014
• Internet penetration is
expected to grow steadily and
is likely to be bolstered by
government policy
• The current broadband
penetration rate is 1.5 per
cent and is likely to be 9.4 per
cent by 2015
Increasing mobile subscribers Untapped rural markets Rising internet penetration
Source: KPMG Report 2013, Aranca Research

• Telecom infrastructure is
expected to increase at a
CAGR of 20 per cent to
571,000 towers during 2008–
15
• TRAI has made several
recommendations for the
development of telecom
infrastructure, including tax
benefits and recognising
telecom infrastructure as
essential infrastructure
• The Indian Mobile Value-
Added Services (MVAS)
industry is expected to reach
USD9.5 billion by 2015 from
USD4.9 billion in 2012
• The Indian cloud computing
market is expected to reach
USD1.08 billion by 2015
• The production of electronic
and related equipment
totalled USD19.8 billion in
FY12
• It is anticipated to reach
USD52.0 billion by 2020
• NTP 2012 is likely to fuel
further growth with its
„Broadband for all‟ schemes
and policies to increase rural
penetration
Development of telecom
infrastructure
Growth in MVAS and cloud
computing Telecom equipment market
Source: Press information bureau, Government of India, Aranca Research
Notes: VAS - Value-Added Services, NTP - National Telecom Policy
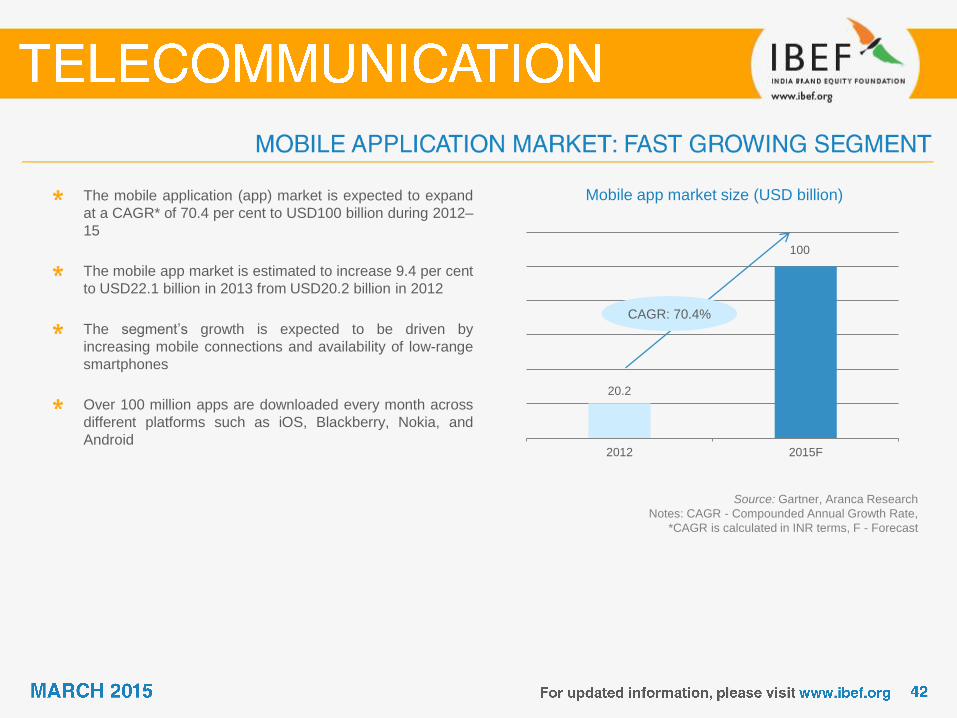
Mobile app market size (USD billion) The mobile application (app) market is expected to expand
at a CAGR* of 70.4 per cent to USD100 billion during 2012–
15
The mobile app market is estimated to increase 9.4 per cent
to USD22.1 billion in 2013 from USD20.2 billion in 2012
The segment‟s growth is expected to be driven by
increasing mobile connections and availability of low-range
smartphones
Over 100 million apps are downloaded every month across
different platforms such as iOS, Blackberry, Nokia, and
Android
20.2
100
2012 2015F
Source: Gartner, Aranca Research
Notes: CAGR - Compounded Annual Growth Rate,
*CAGR is calculated in INR terms, F - Forecast
CAGR: 70.4%

3.8
6.3
7.6 8.3
12.3
14.3 14.2
14.2
7.6
FY07 FY08 FY09 FY10 FY11 FY12 FY13 FY14 H1FY15
Set up in 1995, Bharti Airtel is India‟s largest mobile operator with presence in all of India‟s 22 circles
It is the country‟s leading mobile operator, with a customer base of more than 295.9 million as of March 2013, and the
world‟s fourth-largest telecom operator
Revenues increased at a CAGR of 25.9* per cent from USD4 billion in FY07 to USD14.2 billion in FY14
Major segments (FY14) Revenues (in USD billion)
CAGR: 25.9*%
Source: Company website, Aranca Research
Notes: CAGR - Compound Annual Growth Rate, *- CAGR is calculated in INR terms
50.0%
29.2%
6.8%
5.5% 4.2%
2.2%
1.9% 0.3% Mobile service India
Mobile service Africa
Airtel Business
Tower Infrastructure
Telemedia
Digital TV
Mobile service SouthAsia
Others
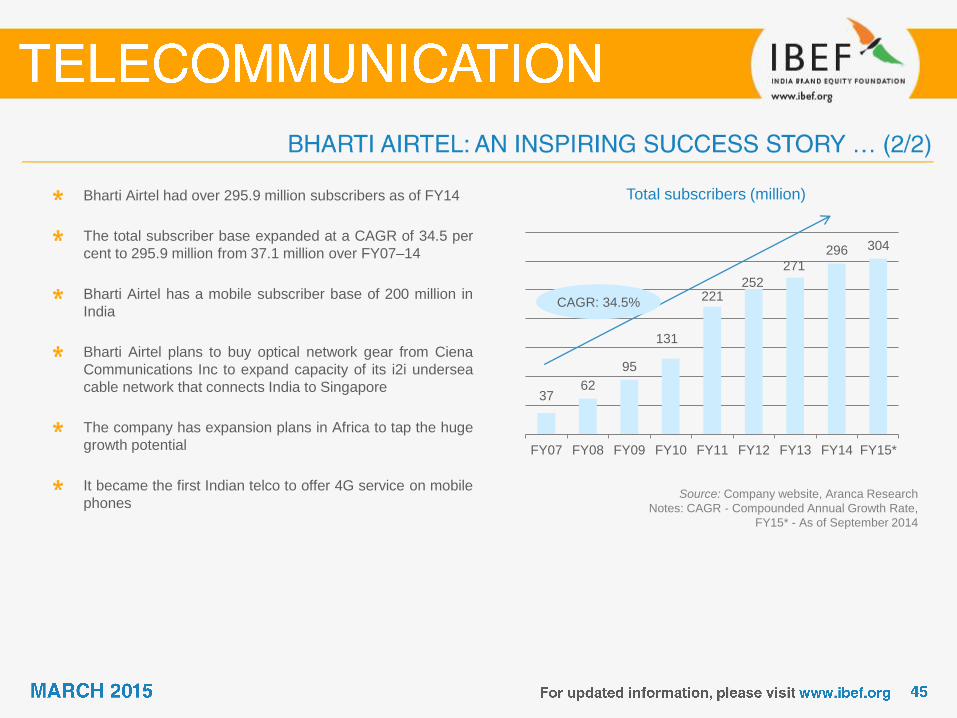
Total subscribers (million) Bharti Airtel had over 295.9 million subscribers as of FY14
The total subscriber base expanded at a CAGR of 34.5 per
cent to 295.9 million from 37.1 million over FY07–14
Bharti Airtel has a mobile subscriber base of 200 million in
India
Bharti Airtel plans to buy optical network gear from Ciena
Communications Inc to expand capacity of its i2i undersea
cable network that connects India to Singapore
The company has expansion plans in Africa to tap the huge
growth potential
It became the first Indian telco to offer 4G service on mobile
phones Source: Company website, Aranca Research
Notes: CAGR - Compounded Annual Growth Rate,
FY15* - As of September 2014
37 62
95
131
221 252
271
296 304
FY07 FY08 FY09 FY10 FY11 FY12 FY13 FY14 FY15*
CAGR: 34.5%

Revenues (USD billion) Established in 1994, Vodafone is one of India‟s leading
mobile operators, with more than 167 million customers as
of March 2014
In August 2008, Vodafone introduced Apple‟s iPhone to the
Indian market
Vodafone's revenues from India increased at a CAGR* of
16.6 per cent to USD6.2 billion over FY07–14
Source: Company website, Aranca Research
Notes: CAGR - Compounded Annual Growth Rate,
* - CAGR is calculated in Indian Rupee term
2.1
3.9 4.4
4.9
5.9 6.7
7.4
6.2
3.4
FY07 FY08 FY09 FY10 FY11 FY12 FY13 FY14 H1FY15
CAGR: 16.6%

Total subscribers (million) Vodafone‟s customer subscription increased at a CAGR of
22.7 per cent to 167 million during 2007–14
In March 2014, Vodafone‟s subscriber base stood at 167
million
Gujarat, Uttar Pradesh, Maharashtra, and West Bengal
together account for over 45 per cent of the total customer
base
Vodafone Group plans to invest heavily in the establishment
of a fibre-optic network in India
Vodafone plans to invest USD400–500 million by 2015 to
purchase 3G equipment
Source: Company website, Aranca Research
Notes: 2014* represents data till March 2014,
**CAGR - Compounded Annual Growth Rate
40 61
91
124
148 147 153 167
2007 2008 2009 2010 2011 2012 2013 2014*
CAGR: 22.7%

Number of MNP requests (in millions) Mobile Number Portability (MNP) in India was introduced in
November 2010
MNP allows subscribers to change their mobile service
provider while retaining their old mobile number
The portability service was made available for both postpaid
and prepaid customers as well as on both GSM and CDMA
platforms
The implementation of MNP has brought a slew of benefits
for customers in terms of better plans and offers
Source: TRAI Report, Aranca Research
37 42
114
Jan-12 Jan-13 Jan-14


Association of Unified Telecom Service Providers of India (AUSPI) B-601, Gauri Sadan 5, Hailey Road, New Delhi – 110 001, India
Tel: 91 11 23358585
Fax: 91 11 23327397
Website: http://www.auspi.in/
Association of Competitive Telecom Operators (ACTO) 601, Nirmal Tower, 26, Barakhamba Road, Connaught Place, New Delhi – 110 001, India
Tel.: 91 11 43565353 / 43575353
Fax: 91 11 43515353
E-mail: [email protected]
Website: www.acto.in
Internet & Mobile Association of India (IAMAI) F-36, Basement, East of Kailash, New Delhi – 110 065, India
Tel: 91 11 46570328
E-mail: [email protected]
Website: www.iwww.iamai.in

BMI telecoms business environment ratings
Industry rewards: it considers average revenue per users, number of subscribers, subscriber growth, and number of
operators
Country rewards: it considers urban/rural split, age range, GDP per capita, USD
Industry risks: it considers regulatory independence
Country risk: it rates the country on short-term external risk, policy continuity, legal framework corruption
Telecom ratings: overall rating of the above indicators

BWA: Broadband Wireless Access
CAGR: Compound Annual growth rate
DoT: Department of Telecommunication
FDI: Foreign Direct Investment
FTTH: Fibre To The Home
FY: Indian Financial Year (April to March)
IMF: International Monetary Fund
INR: Indian Rupee
IPTV: Internet Protocol Television
M&A: Mergers and Acquisitions
MoU: Minutes of Use per month and per subscriber
MPEG: Moving Picture Experts Group

OFC: Optical Fibre Cable
TRAI: Telecom Regulatory Authority of India
USOF: Universal Service Obligation Fund
USD: US Dollar
VAS: Value-Added Services
WiMAX: Worldwide Interoperability for Microwave access telecommunications
Wherever applicable, numbers have been rounded off to the nearest whole number
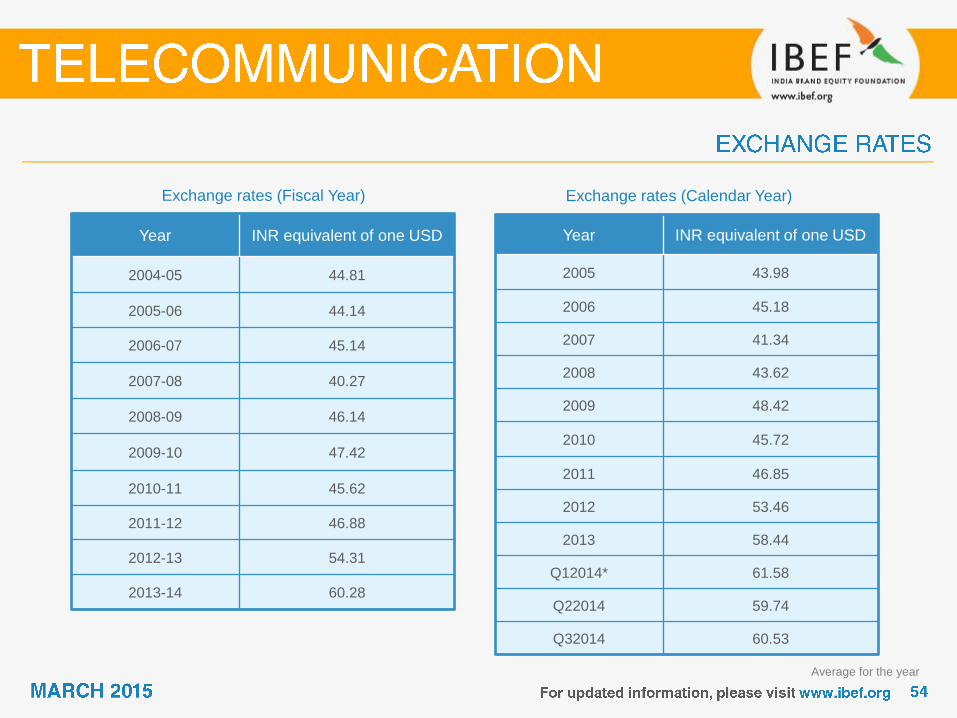
Year INR equivalent of one USD
2004-05 44.81
2005-06 44.14
2006-07 45.14
2007-08 40.27
2008-09 46.14
2009-10 47.42
2010-11 45.62
2011-12 46.88
2012-13 54.31
2013-14 60.28
Exchange rates (Fiscal Year)
Year INR equivalent of one USD
2005 43.98
2006 45.18
2007 41.34
2008 43.62
2009 48.42
2010 45.72
2011 46.85
2012 53.46
2013 58.44
Q12014* 61.58
Q22014 59.74
Q32014 60.53
Exchange rates (Calendar Year)
Average for the year

India Brand Equity Foundation (“IBEF”) engaged Aranca to prepare this presentation and the same has been prepared
by Aranca in consultation with IBEF.
All rights reserved. All copyright in this presentation and related works is solely and exclusively owned by IBEF. The
same may not be reproduced, wholly or in part in any material form (including photocopying or storing it in any
medium by electronic means and whether or not transiently or incidentally to some other use of this presentation),
modified or in any manner communicated to any third party except with the written approval of IBEF.
This presentation is for information purposes only. While due care has been taken during the compilation of this
presentation to ensure that the information is accurate to the best of Aranca and IBEF‟s knowledge and belief, the
content is not to be construed in any manner whatsoever as a substitute for professional advice.
Aranca and IBEF neither recommend nor endorse any specific products or services that may have been mentioned in
this presentation and nor do they assume any liability or responsibility for the outcome of decisions taken as a result of
any reliance placed on this presentation.
Neither Aranca nor IBEF shall be liable for any direct or indirect damages that may arise due to any act or omission on
the part of the user due to any reliance placed or guidance taken from any portion of this presentation.