Photo by John McMillan Spawning habitat Winter rearing Summer rearing Smolt Carrying Capacity.
12
Photo by John McMillan Spawning habitat Winter rearing Summer rearing Smolt Carrying Capacity
-
Upload
jessica-bruce -
Category
Documents
-
view
219 -
download
0
Transcript of Photo by John McMillan Spawning habitat Winter rearing Summer rearing Smolt Carrying Capacity.

Photo by John McMillan
Spawninghabitat
Winterrearing
Summerrearing Smolt
Carrying Capacity
Definition
Carrying Capacity = Number of individuals (K) the resources of a given area can support usually through the most unfavorable period of the year.
– Tied to Limiting Factors
2

Population Regulation
• Density Independent Regulation = Population growth is not affected by population density; population persistence is explained by unpredictable environmental variability (Andrewartha and Birch).
• Density Dependent Regulation = Population growth is affected by mechanisms whose effectiveness increases as population size increases (Nicholson, Lack, and Elton).
3

Evidence of Density Dependence
• Plot of population size and population growth rate (or surrogates such as mortality, natality, productivity, recruits, individual growth rates, movement).
• There is a negative relationship between population size and growth rate, which means that carrying capacity may be estimated.
4
0.00000
0.02000
0.04000
0.06000
0.08000
0.10000
0.12000
0.14000
0.16000
0 1,000,000 2,000,000 3,000,000 4,000,000 5,000,000 6,000,000
Year
ling
Smol
ts/E
ggs
Number of Eggs
Chiwawa Spring Chinook

Methods for Estimating Carrying Capacity
• Time series of population growth over time (logistic function)
• Habitat modeling (maximum number of fish within each habitat type; PHS)
• Stock-recruitment modeling (Ricker, Beverton-Holt, or Smooth Hockey Stick)
5

Assumptions
• Assume we can define a population unambiguously.
• Assume that we can measure population size accurately.
• Assume that we have a biologically relevant time-step over which to measure the population growth rate.
• Assume a uniformity of nature.6

Habitat Models
7
• Habitat capacity can be estimated as the product of habitat area and fish/habitat relationships.
• Percent Habitat Saturation Model (PHS)
• Estimate the number of fish at maximum spawning escapement.
Stock-Recruitment Modeling
8
0
50000
100000
150000
200000
250000
300000
0 200 400 600 800 1000
Re
cru
its
Stock
Ricker Model
Recruits 1Recruits 2Recruits 3Recruits 4
0
500
1000
1500
2000
2500
0 200 400 600 800 1000
Re
cru
its
Stock
Smooth Hockey Stick Model
Recruits 1Recruits 2Recruits 3Recruits 4
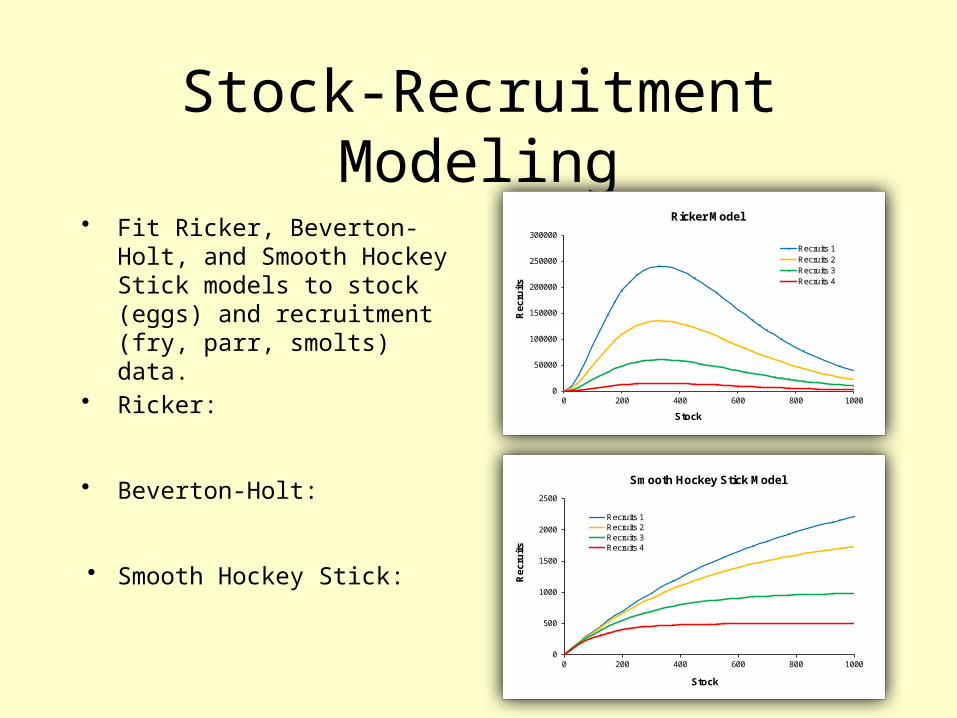
• Fit Ricker, Beverton-Holt, and Smooth Hockey Stick models to stock (eggs) and recruitment (fry, parr, smolts) data.
• Ricker:
• Beverton-Holt:
• Smooth Hockey Stick:

Chiwawa Spring ChinookHabitat Model
• No habitat modeling has been completed in the Chiwawa River basin.
• No estimates of PHS have been calculated.
• Maximum parr and yearling smolt production likely occurred in 2002 when 1,725 spawners escaped in 2001.
• One can also select the maximum number of parr and smolts.
9
BY Eggs Resident ParrNumber of Yearlings (Smolts)
1991 478,400 45,483 42,5251992 1,570,098 79,113 39,7231993 556,394 55,056 8,6621994 485,686 55,240 16,4721995 66,248 5,815 3,8301996 106,835 16,066 15,4751997 374,740 68,415 28,3341998 218,325 41,629 23,0681999 166,090 10,6612000 642,944 114,617 40,8312001 4,984,672 134,874 86,4822002 1,605,630 91,278 90,9482003 648,684 45,177 16,7552004 1,156,559 49,631 72,0802005 1,436,564 79,902 69,0642006 1,284,228 60,752 45,0502007 1,256,803 82,351 25,8092008 3,163,888 106,705 35,0232009 1,925,233 128,220 30,9592010 2,165,628 141,510 47,5112011 2,157,420 103,940 37,1852012 3,716,240 158,407

Chiwawa Spring ChinookStock-Recruitment Model
• Stock-recruitment functions were fit successfully to parr and yearling smolt data.
10
0
20,000
40,000
60,000
80,000
100,000
120,000
140,000
160,000
180,000
0 1,000,000 2,000,000 3,000,000 4,000,000 5,000,000 6,000,000
Num
ber o
f Res
iden
t Par
r
Number of Eggs
Chiwawa Spring ChinookB-H ModelRicker ModelHockey Stick
0
10,000
20,000
30,000
40,000
50,000
60,000
70,000
80,000
90,000
100,000
0 1,000,000 2,000,000 3,000,000 4,000,000 5,000,000 6,000,000
Num
ber o
f Sm
olts
Number of Eggs
Chiwawa Spring ChinookB-H ModelRicker ModelHockey Stick

Chiwawa Spring ChinookStock-Recruitment Model
Parr:
Smolt:
11
ModelParameter
Carrying capacity
ProductivityMaximum
stockA B
Ricker 0.1190490 0.0000004 109,489 0.1190 2,500,000 Hockey Stick 11.6628 0.1418 116,167 0.1418 2,455,000 Beverton-Holt 155,585.92 989,480.74 155,586 0.1572 ∞
ModelParameter
Carrying capacity
ProductivityMaximum
stockA B
Ricker 0.0625650 0.0000004 57,541 0.0626 2,500,000 Hockey Stick 10.7999 0.0804 49,016 0.0804 1,825,000 Beverton-Holt 63,292.40 691,129.47 63,292 0.0916 ∞

12