Philippines' 1 First National Communication
107
Transcript of Philippines' 1 First National Communication


i
iii
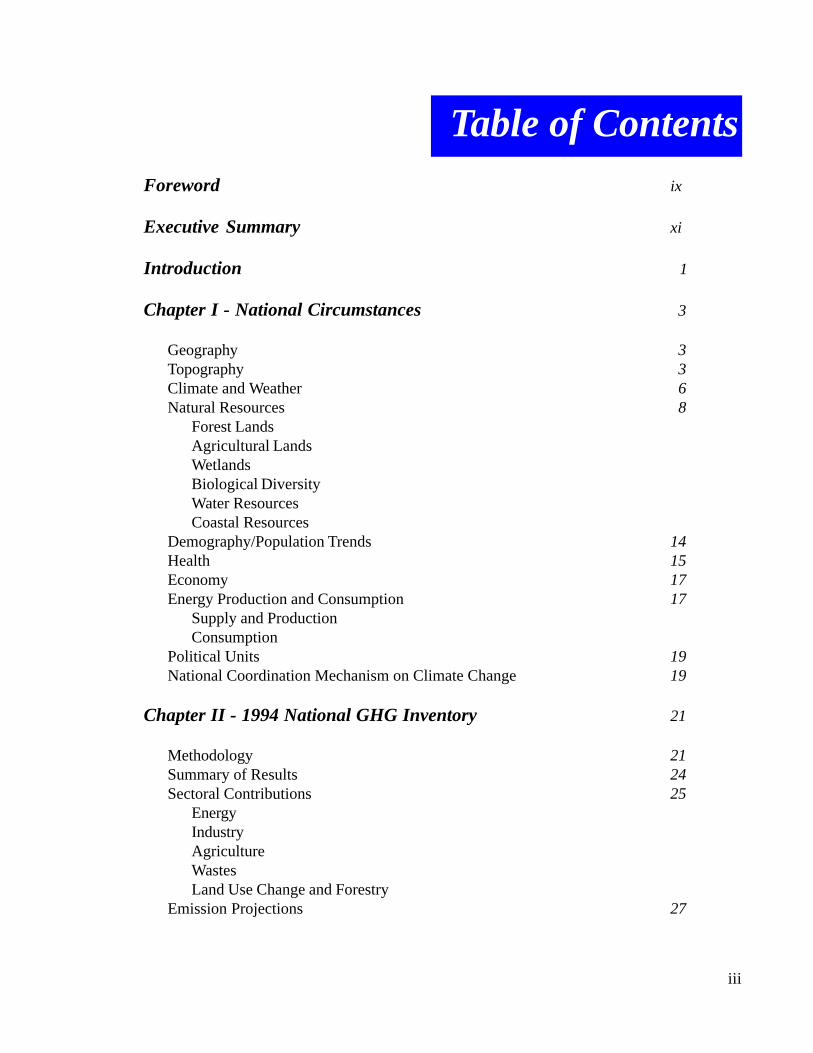
Foreword ix
Executive Summary xi
Introduction 1
Chapter I - National Circumstances 3
Geography 3Topography 3Climate and Weather 6Natural Resources 8
Forest LandsAgricultural LandsWetlandsBiological DiversityWater ResourcesCoastal Resources
Demography/Population Trends 14Health 15Economy 17Energy Production and Consumption 17
Supply and ProductionConsumption
Political Units 19National Coordination Mechanism on Climate Change 19
Chapter II - 1994 National GHG Inventory 21
Methodology 21Summary of Results 24Sectoral Contributions 25
EnergyIndustryAgricultureWastesLand Use Change and Forestry
Emission Projections 27
Table of Contents
iv
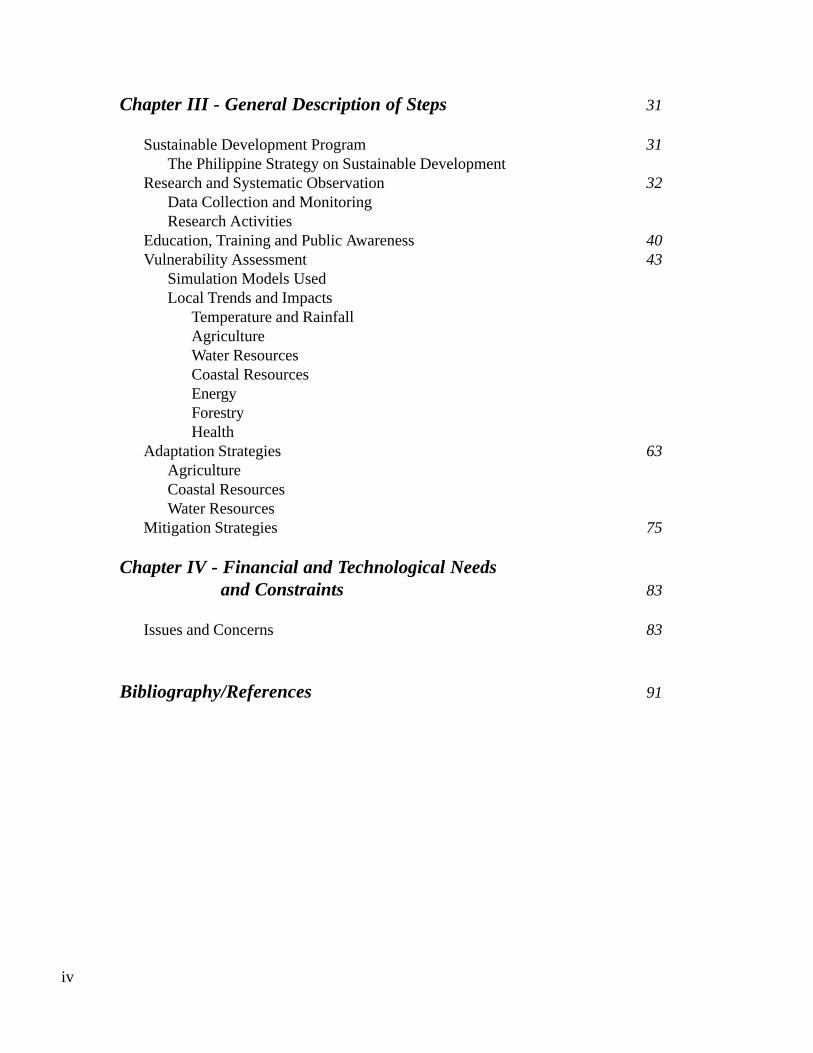
Chapter III - General Description of Steps 31
Sustainable Development Program 31The Philippine Strategy on Sustainable Development
Research and Systematic Observation 32Data Collection and MonitoringResearch Activities
Education, Training and Public Awareness 40Vulnerability Assessment 43
Simulation Models UsedLocal Trends and Impacts
Temperature and RainfallAgricultureWater ResourcesCoastal ResourcesEnergyForestryHealth
Adaptation Strategies 63AgricultureCoastal ResourcesWater Resources
Mitigation Strategies 75
Chapter IV - Financial and Technological Needs and Constraints 83
Issues and Concerns 83
Bibliography/References 91

v
LIST OF FIGURES
Figure 1.1 Map of the PhilippinesFigure 1.2 Frequency of Tropical Cyclone Passage Over Each of the
Geographical Zones in the PhilippinesFigure 1.3 1996 Agricultural ResourcesFigure 1.4 IACCC Organizational Structure
Figure 2.1 1994 GHG Emissions from the Four Non-LUCF Sectorsof Energy, Agriculture, Industry and Waste
Figure 2.2 Net GHG Emissions with the LUCF SectorFigure 2.3 GHG Emissions from the Energy SectorFigure 2.4 GHG Emissions from the Industry SectorFigure 2.5 GHG Emissions from the Agriculture SectorFigure 2.6 GHG Emissions from the Waste SectorFigure 2.7 GHG Emissions and Sinks in the LUCF SectorFigure 2.8 Philippine GHG Emissions for 1994 and 2008
Figure 3.1 Organizational Structure of the PCSDFigure 3.2 Location of PAGASA Synoptic StationsFigure 3.3 Location of PAGASA Upper Air Observation StationsFigure 3.4 Location of Storm Surge Monitoring Stations and Ocean BuoysFigure 3.5 Location of PAGASA Agro-Meteorological StationsFigure 3.6 Areas Inventoried for Physical and Natural Systems ResponsesFigure 3.7 Location of Tide Gauge Stations in the PhilippinesFigure 3.8 Annual Mean Sea Level for Five Primary StationsFigure 3.9 Average of Sample Coefficients of Multiple Determination
LIST OF TABLES
Table 1.1 Drought Events – Areas Affected and Degree of Severity in thePhilippines During the Last Three (3) Decades
Table 1.2 Morbidity: Ten Leading Causes, Number and Rate/100,000 Population,1989 –1993 Average and 1994
Table 1.3 Mortality: Ten Leading Causes, Number and Rate/ 100,000 Population,1989 – 1993 Average and 1994
Table 2.1 IPCC Equivalent of Local Fuel TypesTable 2.2 IRRI Default Parameter Values and Methane Emission Factor
for Rice Paddy CultivationTable 2.3 Local Values for Methane Emissions from Domestic/Commercial Wastewater
Based on the IEPC/EMS StudyTable 2.4 1994 Philippine GHG Inventory ResultsTable 2.5 Projected Consumption of Coal, Oil and Natural Gas and the

vi
Corresponding CO2 Emissions by the Year 2008
Table 2.6 Projected CO2 Emissions from Cement and Steel Industries by the Year 2008Table 2.7 Baseline and Projected Waste Emissions
Table 3.1 Temperature Change and Rainfall Ratio by Water Resource RegionBased on the Canadian Climate Center Model (2 x CO
2 Scenario)
Table 3.2 List of Sites Used in Simulations for the Vulnerability Assessmentfor Rice and Corn Production (Philippine Country Study Project)
Table 3.3 Change in Yield and Maturity Period for Selected Climate Scenarios(V and A Assessment for Rice and Corn Production)
Table 3.4 Estimated Changes in Rice Production for the PhilippinesTable 3.5 CO
2 Concentration Values at Different Growth Stages
Table 3.6 Response of Rice to Elevated CO2 and TemperatureTable 3.7 Changes in Precipitation, Temperature, and Runoff for Angat Water
Reservoir Based on the Three GCMs (2 x CO2 Scenario)
Table 3.8 Trend in Annual Mean Sea LevelTable 3.9 Areas Endangered by Sea Level Rise (For a Projected SLR of 100 cm)Table 3.10 Summary of Identified Adaptation Measures for Angat Dam and Lake LanaoTable 3.11 Summary of National Least Cost Abatement Strategy InitiativesTable 3.12 Methane Mitigation Options in Rice Production
Table 4.1 GHG Inventory Sectoral Issues and ConcernsTable 4.2 Coastal Zone Information Needs for Adaptation
ABBREVIATIONS OF AGENCIES AND ENTITIES
ADB - Asian Development BankAHAM - Association of Home Appliances ManufacturersANEC - Affiliated Non-Conventional Energy CentersBEAP - Biomass Energy Association of the PhilippinesBFAR - Bureau of Fisheries and Aquatic ResourcesBPS - Bureau of Product StandardsCGSD - Coast and Geodetic Survey DepartmentCOP - Conference of the PartiesDA - Department of AgricultureDAR - Department of Agrarian ReformDENR - Department of Environment and Natural ResourcesDOE - Department of EnergyDOH - Department of HealthEMB - Environmental Management BureauFMB - Forest Management BureauGEF - Global Environment Facility

vii
HIS - Health Intelligence ServiceIACCC - Inter-Agency Committee on Climate ChangeIPCC - Inter-Governmental Panel on Climate ChangeIRRI - International Rice Research InstituteJICA - Japan International Cooperation AgencyNAMRIA - National Mapping Resources and Information AdministrationNDRB - National Disaster Reduction BranchPAGASA - Philippine Atmospheric, Geophysical and Astronomical
Services AdmistrationPSES - Philippinje Solar Energy SocietyUNDP - United Nations Development ProgrammeUNEP - United Nations Environment ProgrammeUNFCCC - United nations Framework Convention on Climate ChangeUSAID - United States Agency for International DevelopmentWEAP - Wind Energy Association of the PhilippinesWMO - World Meteorological Organization
OTHER ACRONYMS/ABBREVIATIONS USED
ALGAS - Asia Least-Cost Greenhouse Gas Abatement StrategyASLR - Accelerated Sea Level RiseBCF - Billion Cubic FeetBFOE - Barrel of Fuel Oil EquivalentBOD - Biochemical Oxygen DemandoC - Degree Centigrade
CCCM - Canadian Climate Center ModelCERES - Crop-Environment Resource SynthesisCH
4- Methane
CO2
- Carbon DioxideDES - Decentralized Energy SystemsDSM - Deman Side ManagementDSSAT - Decision Support System for AgrotechnologyEEZ - Exclusive Economic ZoneENSO - El Niño-Southern OscillationE.O. - Executive OrderGCM - Global Circulation ModelGDP - Gross Domestic ProductGFDL - Geophysical Fluid Dynamic Laboratory ModelGg - GigagramGHG - Greenhouse GasGISS - Goddard Institute for Space StudiesGNP - Gross National ProductGWH - Gigawatt-hourGWP - Global Warming Potential

viii
Ha - HectaresHFC - HydrofluorocarbonsHRIP - Heat Rate Improvement of Power PlantsIBSNAT - International Benchmark Sites Network for AgrotechnologyIEPC/EMS- Industrial Efficiency and Pollution Control/
Environmental Management StrategyKtons - KilotonsKPA - Key Production AreaM - MeterMCM - Million Cubic MetersMha - Million HectaresMMBFOE - Million Barrels of Fuel Oil EquivalentMMBO - Million Barrels of OilMMT - Million Metric TonsMPFD - Master Plan for Forestry DevelopmentMTADP - Medium Term Agriculatural Development PlanMW - MegawattNAP - National Action PlanNCR - National Capital RegionNMVOC - Non-Methane Volatile Organic CompoundN
2O - Nitrous Oxide
NOx - Nitrogen OxidesNRE - New and Renewable EnergyPEP - Philippine Energy PlanPHP - Philippine PesosPRCS - Philippine Road Classification StudyRA - Republic ActRH - Relative HumiditySIMRIW - Simulation Model for Rice-Weather RelationsSLR - Sea Level RiseSLRP - System Loss Reduction ProgramSO
2- Sulfur Dioxide
sq.km. - Square KilometerTLA - Timber License AgreementTTED-DLF- Technology Transfer for Energy Development - Demonstration Loan FundUKMO - United Kingdom Meteorological OfficeV & A - Vulnerability and Adaptation
ix
limate change is a very emotional subject for the Philippines because the issue is viewed notonly as causing additional economic burdens, but as a critical factor that would determine its survivalas a nation. Many of its people are in the coastal areas and at risk from the impacts of extreme climaticevents, sea level rise and degradation of marine ecosystems. The effects of climate change on agricul-ture, forestry and water resources will further encumber a country already reeling from a host of socio-economic and environmental problems.
As a country Party to the United Nations Framework Convention on Climate Change (UNFCCC),however, the Philippines stands ready to comply with its obligations, foremost of which is the submis-sion of its Initial National Communication. We are, therefore, very pleased to share the document withthe international community, because it represents the collective efforts of the government and theprivate sector.
The report documents not only compliance to our main commitments, particularly the nationalgreenhouse gas inventory, but also voluntary efforts on greenhouse gas abatement. The rest of thereport gives a sampling of how vulnerable the Philippines is to the impacts of climate change based oninitial studies, including the resource needs to adapt to these impending ecological changes.
We would like to underscore the fact that while significant gains have been made in terms ofdeveloping and strengthening the processes and institutions involved in producing the country’s na-tional communication, a lot of work still needs to be done. These would include: institutionalization ofthe greenhouse gas inventory process in the various concerned government agencies, harnessing thecontribution of the academe, development and refinement of activity data and emission factors, as wellas, conduct of more vulnerability and adaptation studies.
Obtaining a comprehensive picture on how the climate change problem is evolving, requiresfull disclosure of vital information from all parties of the Convention. For most, particularly the devel-oping ones, this would mean a long and painstaking process, needing the establishment of mechanismsand utilization of precious resources.
But as the adage goes, a journey of a thousand miles starts with the first step. And the Philip-pines has taken the critical and most important one. Along with other committed country Parties of theUNFCCC, it stands ready to complete the process
DENR Secretary Chair, Inter-Agency Committee on Climate Change
ForewordC

x
xi
Climate and Weather
The Philippines has a humid equatorialclimate marked by high temperatures and heavyannual rainfall. It is located within the region ofascending air and widespread equatorial cloudi-ness. Annual rainfall measures as much as 5,000millimeters in the mountainous parts of the coun-try, but less than 1,000 millimeters in some of thesheltered valleys. The mean annual temperatureis about 27oC. The hottest months are April, Mayand June while the coldest months are December,January and February. In general, the highest tem-peratures are observed in valleys and plains. The
National Circumstances
Geography and Topography
The Philippines, as an archipelago, ishighly vulnerable to the potential impacts of cli-mate change. Geographically, the country is con-sidered a medium-size nation with a total area of299,404 square kilometers. The Philippines liesbetween 5o to 20o north of the equator. It has 7,107islands and rocks, 1,000 of which are inhabitable.There are three (3) major island groups in the coun-try, namely: Luzon, Visayas and Mindanao. Thecountry’s topography is characterized by largemountainous terrain with narrow coastal plains andinterior valleys and plains.
Executive Summary
s a country Party to the United Nations Framework Convention on ClimateChange (UNFCCC), the Philippines is bound by its commitment to prepare and submitits National Communication on Climate Change. The preparation was made possibleunder the project PHI/97/G31 entitled “Enabling the Philippines to Prepare Its FirstNational Communication in Response to Its Commitment to the UNFCCC,” with fi-nancial assistance from the Global Environment Facility (GEF) through the UnitedNations Development Programme (UNDP). The Initial National Communication con-tains a national inventory of anthropogenic emissions by sources and removals by sinksof greenhouse gases, a description of steps taken or envisaged by the country to imple-ment its commitment, and other information relevant to the achievement of the objec-tive of the Convention.
A

xii
highest temperature recorded in the Philippineswas 42.2 oC while the absolute minimum tempera-ture was 3.0oC. On the average, the prevailing windin the Philippines from October to February isnortheasterly (coming from the northeast, oramihan), easterly from March to May due to thePacific trade winds, and southwesterly (habagat)from June to September. In terms of tropical cy-clones, the Philippines experiences about 20 tropi-cal cyclones annually.
Natural Resources
Forest Lands
The country has a total of about 15 mil-lion hectares of forest lands and 14.12 millionhectares of alienable and disposal lands. Unfortu-nately, the Philippine forests, considered amongthe most diverse in the world, are also among themost endangered. The country’s forest cover hasbeen steadily dwindling, at an average rate of 2percent per annum. As of 1997, the Philippineshas only about 5.4 million hectares of remainingforests left, a mere 18 percent of the country’s to-tal land area. Of these, about 804,900 hectares ofold growth forest remain, from the 27.5 millionhectares in 1575.
Agricultural Lands
Agriculture is the country’s economic life-line, but agricultural production in the Philippineshas been traditionally concentrated on only a fewmain crops, particularly, rice and corn. Coconutand sugar cane constitute important export com-modities. Almost ninety percent (90%) of thealienable and disposable lands are devoted to ag-ricultural production. An estimated 45% of theseagricultural lands are located in the lowlands and33 percent in the uplands. In 1996, of the 12.94million hectares of agricultural lands, 30.5% are
planted to rice; 21.1 % percent to corn; 23.9 % tococonut; and 25.5 % to sugar cane, cassava, ba-nana, and others.
Wetlands
Philippine wetlands of international impor-tance cover about 14,100 sq. km. consisting of 61coastal wetlands, 22 lakes, and 8 freshwaterswamps and marshes. Sixty-nine percent of theseare in the moderately to highly threatened status.
Biological Diversity
The complex history of sedimentation,submergence, folding, metamorphism, igneousactivity, uplift, and erosion has influenced the com-position and distribution of present-day flora andfauna. There are at least 14,500 plant species, rep-resenting about five percent of the world’s flora.The research conducted by various scientists be-tween 1950 and 1995 show that there are about185 species of mammals, 558 species of birds, 252species of reptiles, 95 species of amphibians, 54species of millipedes, 44 species of centipedes,341 species of spiders, 2,782 species of mollusks,and more than 20,000 species of insects. Marinespecies include 488 species of corals, about 2,400species of protozoans, and 6 species of seagrasses.As of 1991, 89 species of birds, 44 species ofmammals, and 8 species of reptiles are interna-tionally recognized as threatened. These speciesinclude the Philippine Eagle (Pithecophagajefferyi) and the Tamaraw (Bubalus mindorensis).
Water Resources
The country is classified into 12 water re-sources regions, which are defined by hydrologi-cal boundaries, physiographic features and climatehomogeneity. There are 343 independent princi-pal river basins with areas of at least 40 sq. km.
xiii
Philippines, still being predominantly rural, hasmore than half of its population residing in therural areas. However, the proportion of the urbanpopulation increased from 37.44 percent in 1980to 48.5 percent in 1990. In 1996, the total urbanpopulation constituted 55% of the total nationalpopulation.
Health
During the period 1992-1997, life expect-ancy increased from 66.5 years to 68.0 years. Thebasic health indicators also improved over the spanof (6) years. The morbidity and mortality trendsof communicable diseases, in particular, acute res-piratory infections such as pneumonia, bronchitisand influenza decreased in the past six (6) years.The incidence of sanitation-related diseases asso-ciated with unsafe water supply, poor sanitationcoupled with improper food handling, i.e., diar-rhea, cholera, typhoid and intestinal parasitism wasalso reduced. The incidence of measles, pertus-sis, neonatal tetanus and diphtheria likewisemarked improvement. Chronic communicable dis-eases are also on the decline. Although there wasan improvement in the incidence and prevalenceof tuberculosis in the Philippines, it remains a se-rious public health problem. Leprosy also declined,its prevalence rate decreased from 2.39 to 1.2 per10,000 population in 1997.
Economy
The gross national product and gross do-mestic product have recovered from the stagna-tion in 1991 and have been on an upward trenduntil 1996. GNP grew to 6.9% and GDP, 5.7% in1996. Despite the Asian currency turmoil that sur-faced in July 1997, the country still managed tohave a 5.8% and 5.1% annual growth rate for GNPand GDP, respectively. In 1994, gross nationalproduct (GNP) was pegged at US$65.661 billionand gross domestic product (GDP) at US$ 64.018
each, covering a total of 199,637 sq. km. or 66.5percent of the country’s total land area. Of these,20 are major river basins each covering at least990 sq. km. These are sources of municipal anddomestic water supply, irrigation, and power gen-eration. Likewise, the Philippines has 61 lakestotaling more than 2,000 sq. km., 23 of which haveareas more than 100 hectares. The country alsohas extensive groundwater resources estimated tocover an aggregate area of 50,000-sq. km. and stor-age of about 251,158 MCM.
Coastal Resources
Philippine marine territorial waters coverabout 2.2 million sq. km., of which 267,000 sq.km. (12 percent) are coastal waters and 1.934 mil-lion sq. km. (88 percent) are oceanic waters withinthe exclusive economic zone (EEZ). There areabout 185,000 sq. km. of shelf area within a 200-m depth. The country’s total discontinuous coast-line is approximately 32,400 kilometers witheighty percent of the provinces and 65 percent ofthe cities and municipalities sharing the coast.There are 20 landlocked straits and 61 natural har-bors. The Philippine coral reefs cover about 27,000sq. km. within a 15- to 30-m depth. These reefsyield 10-15 percent of the total annual fish pro-duction. Unfortunately, the Philippine coral reefscontinue to be degraded and destroyed.
Demography/Population Trends
The national population was declared at68,616,536 in 1995 and was estimated to be73,527,000 in 1997. The country’s population isprojected to reach 126 million by 2020. The Phil-ippines is considered the 9th most populous coun-try in Asia and the 14th largest country in the world.Population density increased from 160 persons persquare kilometer in 1980 to 228 in 1995. Thereare 28 provinces with 102 municipalities locatedin coastal areas occupying 129,114 hectares. The

xiv
National Coordination Mechanismon Climate Change
The Philippines was among the first coun-tries to respond to the challenge of the climatechange phenomenon. As early as May 8, 1991the Philippine government created the Inter-agencyCommittee on Climate Change (IACCC) by vir-tue of Administrative Order No. 220. The IACCCis composed of 15 government agencies and NGOrepresentatives. The IACCC was established tocoordinate various climate change related activi-ties, propose climate change policies and preparethe Philippine positions to the UNFCCC negotia-tions. The IACCC is co-chaired by the Secretaryof the Department of Environment and NaturalResources with the Secretary of the Departmentof Science and Technology.
1994 National GHG Inventory
In 1994, the Philippines released a totalequivalent amount of 100,738 ktons of CO
2 into
the atmosphere. This is due to the combined ef-fect of GHG emissions from the four sectors ofEnergy, Industry, Agriculture, and Wastes, and thenet uptake (sink) of GHGs from the LUCF sector.In the global context, this national amount is stillminimal relative to the GHG emissions of othernations, especially those of developed countryparties to the UNFCCC.
Without the contribution of the still con-troversial LUCF sector, the national GHG totalamounts to 100,864 ktons of equivalent CO
2. Of
the four non-LUCF sectors responsible for thecountry’s sources of GHGs, the Energy sector isthe most significant, accounting for about 49% ofthe national total. This is trailed closely by theAgriculture sector’s contribution of about 33%.Industry and Wastes follow with respective con-
billion. The GDP per capita was pegged atUS$954.92. Exports reached a total of US$ 21.650billion while imports were at US$ 25.688 billion.
Energy Production and Consumption
Imported coal and crude oil, accountingfor 73.60% of the total energy supply in 1995 pro-vide a bulk of the country’s energy supply. Con-ventional (oil, coal, hydro, geothermal) and non-conventional indigenous sources (bagasse, agri-waste, others) comprise the remaining 26.40% ofthe total national energy supply. The Philippineshas a number of indigenous resource options, butmost of these remain largely unexplored andunderexploited. The country has estimated re-serves of about 400 million barrels of oil and 4.5trillion standard cubic feet of natural gas. Geo-thermal energy is one indigenous resource thatabounds in the country with potential reservesconservatively estimated at 4,000 MW. In termsof energy consumption, there was an upward trendfrom 1990 to 1995. Moderate growth was postedfor the period, with a steep increase in energy con-sumption from 1993 to 1995. A total of 138.32million barrels of fuel oil equivalent (MMBFOE)was consumed in 1993, 146.85 MMBFOE in 1994,and 159.85 MMBFOE in 1995. The energy to GDPratio grew steadily from 0.17 BFOE/000 GDP in1990 to 0.20 BFOE/000 GDP in 1995. Duringthe same period, the country posted an averageenergy intensity of 0.18 BFOE per thousand GDP.
Political Units
Administratively, the country is dividedinto 16 political regions. As of April 1998, theCommission on Elections listed 78 provinces, 85cities and 1,525 municipalities. The smallest po-litical unit is the barangay, of which there are41,925.
xv
tributions of 11% and 7% of the total. In contrastwith these four sectors which act as GHG sources,activities and processes associated with the LUCFsector are estimated to sequester about 126 ktonsof CO
2, which is seemingly insignificant (0.1%),
compared to the national total.
GHG Emissions Projections For 2008
The country’s future GHG emissions for2008 were calculated by projecting only thosesubsectors that had significant contributions to thesectoral subtotals. With all other emissions fromthe other subsectors pegged conservatively at their1994 values, the national GHG emissions totalfrom all five sectors is projected to increase to195,091 ktons of equivalent CO
2. This constitutes
a rise of 94% relative to the 1994 total of 100,738ktons in a matter of 14 years, or an annual growthrate of 4.8%. Baseline and projected GHG emis-sions are shown in Figure 3.1. Because varioussubsectors were held constant at 1994 levels, this2008 projection may be a conservative estimate.
General Description of Steps
The Philippines has adopted the PhilippineStrategy for Sustainable Development (PSSD)which serves as the blueprint for the country’ssustainable development efforts, as well as, thePhilippine Agenda 21 (PA 21). The PA 21 “envi-sions a better quality of life for all, the develop-ment of a just, moral, creative, spiritual, economi-cally vibrant, caring, diverse yet cohesive societycharacterized by appropriate productivity, partici-patory and democratic processes and living in har-mony within the limits of the carrying capacity ofnature and the integrity of creation.”
For systematic observation on climate andweather, the Philippines has a number of network
observation stations operated and maintained byPhilippine Atmospheric, Geophysical and Astro-nomical Services Administration (PAGASA).These networks include synoptic weather stations,upper-air stations, hydrometeorological/flood fore-casting/storm surge stations, agrometeorological/climatological stations, marine observing systemsand special observation stations for air quality in-cluding ozone monitoring. Completed climate re-lated researches include: Epidemiological Studyfor Metro Manila Using Climate Variability; Coun-try Study to Address Climate Change Issues andConcerns; and Investigation on Systems Re-sponses to Sea Level Changes of Some SelectedLocations in the Philippines. On-going researchesare the Development of a Climate InformationMonitoring and Prediction System, and Climato-logical Study on the Changes in the Tropical Cy-clone Intensity in the Philippine Area of Respon-sibility. About six (6) research studies are envi-sioned to be undertaken in the future.
Many activities are likewise being under-taken for the education, training and awarenessraising of the public on climate change issues. Thegovernment, industry and non-government orga-nizations, with assistance from various interna-tional organizations, extending efforts to informand educate the general public on the possibleadverse impacts of climate change.
The Philippines, being an archipelagiccountry with a prevailing tropical climate, wouldbe highly vulnerable to the impacts of climatechange. Based on this premise, vulnerabilityassessment(s) on some sectors have been under-taken. At least four Global Circulation Models(GCMs) at double CO
2 concentration scenario
were used for these studies. In agriculture, thesimulation results showed that while a generalincrease in yield for rice was noted, maturity pe-riod decreased. For corn, the simulation showed adecrease in yield. In the water resources sector,vulnerability studies were done on two major wa-ter resources, namely: the Angat reservoir and

xvi
Lanao Lake. Results showed that Angat reservoiris projected to be seriously affected. Similar re-sults have been predicted for the Lanao Lake.Vulnerability assessment for coastal resourcesgenerally showed that given the existing situation,anthropogenic global warming due to increasingGHG emissions which may lead to accelerated sealevel rise (ASLR) will exacerbate the vulnerabil-ity of the coastal ecosystems. Likewise, many ar-eas along the coast will succumb to a one-metersea level rise. In the forestry sector, prediction(s)indicate that changes in rainfall pattern may in-crease rate of conversion of forest(s) to agricul-tural lands due to human migration from areasdegraded by drought and erosion to more produc-tive forest lands. A decrease in soil moisture indrier areas may accelerate forest loss while an in-crease in precipitation beyond evaporation demandcould increase runoff resulting in soil erosion andflood occurrences. The local biodiversity will alsodecrease through extinction and inhibition ofreimmigration from adjacent areas. Preliminaryresults of the health study conducted showed that,indeed, there is an indicative trend of about 10%to 58% association between climate change (us-ing crude measurement) and health (as indicatedby disease incidence). However, the results needto be validated and, therefore, more studies mustbe undertaken.
Adaptation measures and strategies wereinitially identified based on the vulnerability as-sessments made in the various sectors to cope withthe impending impacts of climate change in thecountry. The measures were derived from varioussectoral consultations, as well as, a review of ex-isting policies and measures within the respectivesector.
Under the UNFCCC, although it is thedeveloped country Parties which have the primaryresponsibility to adopt policies and measures tolimit their anthropogenic emissions of greenhousegases and report these to the Conference of theParties for its review, the Philippine governmenthas formulated and has started to implement miti-
gation measures to limit its GHG emissions. Thesemeasures are reflected in the various sectoral plans,particularly those of the Energy, Transport andAgriculture sectors, and the National Action Planon Climate Change which is still to be adopted.
Financial, Technological Needsand Constraints
The Philippines is faced with many con-straints in implementing its commitments underthe Convention. On the national inventory of GHGemissions, among the main issues and concernsare the availability, reliability and variability ofactivity data and local emission factors, and insti-tutionalization and linkages among governmentagencies of the inventory process.
Among the main issues confronting thePhilippines involving mitigation of greenhousegases is the affordability of the technologies it pre-fers to use, e.g. utilization of renewables in powerproduction. In view of this, interventions in termsof overcoming market barriers for the widespreaduse of renewables need to be undertaken. Also,more applications should be implemented to gainfield experience and additional operating data.
For vulnerability assessment and adapta-tion, the studies conducted were limited and, there-fore, more in-depth studies must be undertaken toenable the country to prepare and develop appro-priate measures and actions with regards to thepossible impacts of climate change. Consideringthe current economic condition of the country,outside or international assistance is highly im-perative to conduct these activities.
1
Chapter I - National Circumstances
ursuant to Article 4 of the United Nations Framework Convention on ClimateChange (UNFCCC), parties are to “communicate to the Conference of the Parties (COP)information related to the implementation of commitments, in accordance with Article12.” Article 12.5 of the UNFCCC specifies that developing country Parties shall submittheir initial communication “within three years of entry into force of the Convention” orupon availability of financial resources in accordance with Article 4.3. The said provi-sion cites that Annex II country Parties shall provide new and additional financial re-sources to meet the agreed full costs incurred by developing country Parties in preparingtheir national communications. The Philippines formally availed of such resources onApril 1, 1998 from the Global Environment Facility (GEF) through the United NationsDevelopment Programme (UNDP) under the project PHI/97/G31 entitled “Enabling thePhilippines to Prepare Its First National Communication Programme in Response to ItsCommitment to the UNFCCC.”
According to Article 12.1 of the Convention, the following general informationare to be contained in the National Communications of non-Annex I country Parties tobe submitted to the COP:
a.) a national inventory of anthropogenic emissions by sources and removalsby sinks of all greenhouse gases not controlled by the Montreal Protocol;
b.) a general description of steps taken or envisaged by the Party to implementthe Convention; and
c.) any other information that the Party considers relevant to the achievementof the objective of the Convention.
The Conference of Parties elucidated on this further through Decision 10/CP.2on “Guidelines, Facilitation and Process for Consideration of Communications fromParties not included in Annex I to the Convention.”
It must be underscored that this initial national communication, while drawingheavily on the results of PHI/97/G31, also took into consideration the outcomes of someearlier initiatives like the Country Studies Program, the National Action Plan on Cli-mate Change, the Asia Least Cost Greenhouse Gas Abatement Strategy and the sectoralplans & programs, as well as, the Medium Term Development Plan and the PhilippineAgenda 21.
Introduction
P

2
Chapter I - National Circumstances
3
Chapter I - National Circumstances
Geography
Considered as a medium-size country, thePhilippines ranks 57th in the world, with its299,404 square kilometers constituting approxi-mately 2 percent of the world’s total land area.
The Philippine archipelago stretches 1,840km north-south between 4°9’ and 21°7’ north ofthe equator. Its westernmost boundary is at longi-tude 116°4’ E while the eastern territorial limit isalong the 127° E meridian. The archipelago com-prises a total of 7,107 islands spread over the 2.2million sq. km. of water within its exclusive eco-nomic zone. Its long discontinuous coastline is ap-proximately 32,400 km, second only to Indonesiawith its more than 16,000 islands. Three seasbound the Philippines: the South China Sea onthe west and north, the Pacific Ocean on the East,and the Celebes Sea and the coastal waters ofBorneo on the south (See Figure 1.1).
Of the Philippines’ 7,107 islands androcks, only 2,803 are named and nearly 1,000 is-
lands are inhabited. The 16 largest islands areLuzon, Mindanao, Palawan, Mindoro, Panay,Samar, Negros, Leyte, Cebu, Masbate, Bohol,Catanduanes, Basilan, Marinduque, Busuanga,and Sulu.
Topography
The Philippines has not always been whereit is and not all of its islands belong to one dis-tinctly linked system. This archipelago has variedgeologic origins and possesses unique biologicalattributes. By combining paleomagnetic and ra-diometric data, scientists are slowly piecing to-gether the genesis of the Philippines. The emerg-ing picture is not one of slow static accretion ofmaterial but rather of dynamic shifting and colli-sion of plates, welded together in an island arcand punctuated by episodic and extensive mag-matic activity.
Most of the archipelago belongs to thePhilippine mobile belt, a composite strip of dif-ferent lithospheric blocks that grew during the Ter-
NATIONAL CIRCUMSTANCES
Chapter I
he Philippines, as an archipelago, is highly vulnerable to the potential impacts ofclimate change. At the same time, the country’s tropical climate, regional differences,land use patterns, high rate of population growth, poor economic conditions, politicalenvironment, and lifestyles all serve to create a high demand of energy, with its associ-ated greenhouse gas (GHG) emissions.
T

4
Chapter I - National Circumstances
Figure 1.1 Map of the Philippines

5
Chapter I - National Circumstances
The Philippine Fault is an active left-lat-eral strike-slip fault that stretches more than 1,200km from northern Luzon to southern Mindanao,and it has splays, or branches that connect to sev-eral other faults. The presence of a major faultalong the entire length of the archipelago accountsfor dramatic features of the country’s physical en-vironment. The Philippine Fault is always in mo-tion, moving at an average rate of 2 to 2.5 cm peryear. This movement, however, is not smooth. Itnormally occurs as sudden episodes, or slips.
The recent explosive awakening of MountPinatubo in the province of Zambales suggestswhat sudden changes in global constitution cantake place if the earth bursts into a volcanic aria.This particular volcanic activity injected hugeamounts of particulates as high as 25 km up intothe stratosphere. Pinatubo’s eruption blanketedmost of Southeast Asia with ash, creating a dustcloud that slightly cooled the earth. Particulateshave long residence times in the stratosphere,hence, reduce the amount of solar radiation reach-ing the earth’s surface, thereby causing global cool-ing.
tiary period, about 65 million years ago. Otherparts of the Philippine archipelago, including thePalawan Micro-continental block (Palawan andMindoro) and Zamboanga, are marginal continen-tal blocks of the Eurasian plate, which are collid-ing eastward with the Philippine mobile belt.
The Philippine mobile belt is mainly a re-sult of the oblique convergence of the Eurasianand Philippine Sea plates. This convergence pro-ceeds at a rate of about 8 cm per year.
Many islands were once situated elsewhereor came from diverse tectonic origins and scien-tists are still studying their geologic births. Thesefindings may explain the differences in the island’sphysical features and endemic flora and fauna.They may also explain why the Philippines hasfeatures in common with its Southeast Asianneighbors. The geologic and tectonic evolution ofthe Philippines resulted from convergence and in-teraction among four major tectonic plates: theContinental Eurasian and Indian-Australian plates,and the Oceanic Pacific and Philippine Sea plates.The convergence of these plates destroys crusts,creates volcanic chains, causesearthquakes, produces trenchesand troughs, and develops thegeological stresses and distinc-tive character of the Philippinearchipelago.
A largely mountainousterrain, with narrow coastalplains and interior valleys andplains mark the country’s to-pography. The northern Luzonhighlands, or Cordillera Cen-tral, rise to between 2,500 and2,750 meters, and, togetherwith the Sierra Madre in thenortheastern portion of Luzonand the mountains ofMindanao, boast rain foreststhat provide refuge for numer-ous upland tribal groups.
Mt. Pinatubo eruption in 1991 which produced huge amount of ash.

6
Chapter I - National Circumstances
Climate and Weather
Under the Koppen-Geiger regionalizationof world climates, the Philippines has a humidequatorial climate, which is marked by high tem-peratures and heavy annual average rainfall. Mostareas close to the equator belong to this type ofclimatic classification. The Philippines is locatedbetween 5o to 20o north of the equator.
The Philippines is located within the re-gion of ascending air and widespread equatorialcloudiness. Annual rainfall measures as much as5,000 millimeters in the mountainous parts of thecountry, but less than 1,000 millimeters in someof the sheltered valleys. The different rainfall-caus-ing weather patterns are tropical cyclones, mon-soon, the Inter-Tropical Convergence Zone, fronts;easterly waves, air stream, local convection, etc.
The Philippines generally has high tem-perature because of its tropical maritime settingand the warm air currents flowing over its landmasses. The mean annual temperature is about 27oC. The hottest months are April, May and Junewhile the coldest months are December, Januaryand February. In general, the highest temperaturesare observed in valleys and plains. The highesttemperature recorded in the Philippines was 42.2oC in Tuguegarao, Cagayan Valley on April 29,1912 and on May 11, 1969. The absolute mini-mum temperature of 3.0oC was recorded in Janu-ary of 1903 in Baguio, which has an elevation of1,482 m.
Bodies of water are sources of humidity,and, as a result, maritime regions have a morehumid atmosphere. Because of the warm moistair streams flowing through the archipelago, itssurrounding seas, rich vegetation and abundantrainfall, the humidity of the air throughout thecountry is high. The average annual relative hu-midity for the whole country is about 82 % andalmost all weather stations record monthly aver-
ages higher than 70 % relative humidity. Highvalues of relative humidity are usually observedat night and early morning; and low values, dur-ing the day and early evening except when it israining.
On the average, the prevailing wind in thePhilippines from October to February is northeast-erly (coming from the northeast, or amihan), east-erly from March to May due to Pacific trade winds,and southwesterly (habagat) from June to Sep-tember. Changes in large-scale wind direction aredue to the Asia monsoon, which is the change inair circulation over Asia due to differential heat-ing between the Asian mainland centered over theTibetan plateau and the surrounding oceans. How-ever, local topography and diurnal effects mayproduce prevailing winds, which deviate some-what from the winds that might be expected.
The northwest Pacific basin, where thePhilippines is located, has the highest percentageof cyclone development, estimated to account forabout 40 % of all cyclones globally. Tropical cy-clones that affect the Philippines usually originatefrom low pressure areas over the Pacific Ocean.They can also form in the South China Sea. ThePhilippines experiences about 20 tropical cyclonesannually. The tropical cyclone season is from Juneto December, with an average monthly frequencyof more than one tropical cyclone. The months ofJuly, August and September have the most fre-quent tropical cyclone occurrence with an aver-age of more than three cyclones each month.
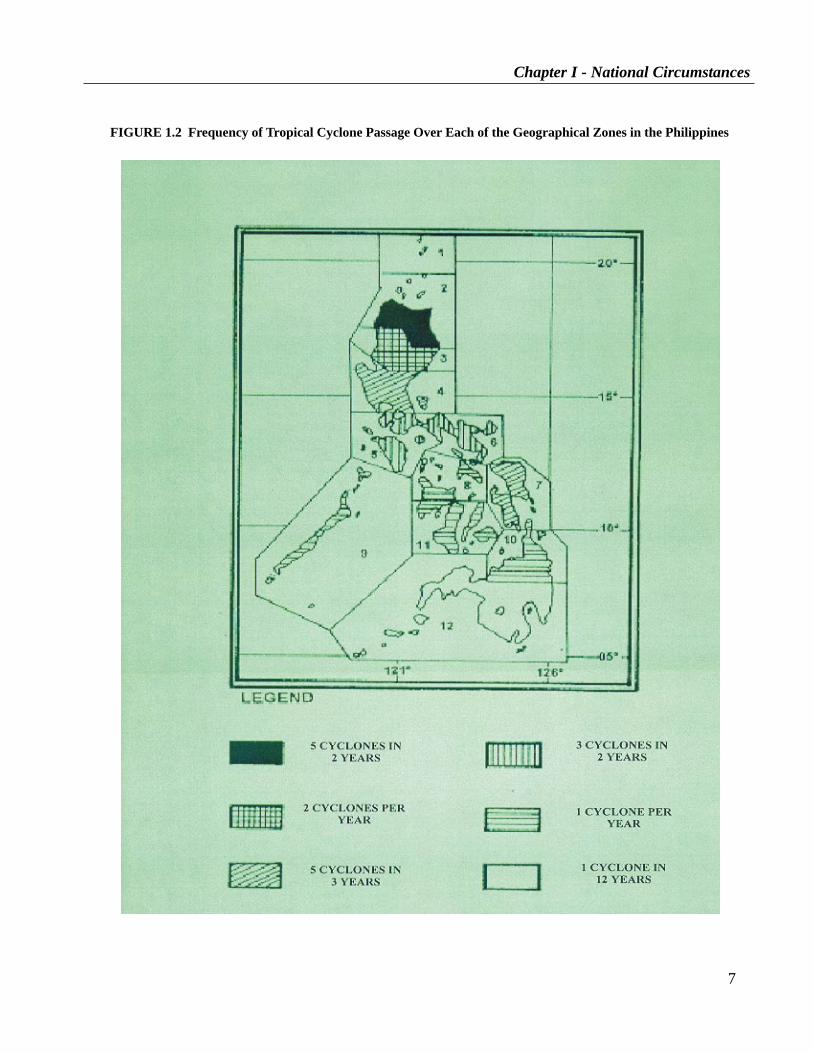
The geographical zones of the countryhave different frequencies of tropical cyclone pas-sage as shown in Figure 1.2. Zone 2 which is lo-cated in extreme northern Luzon, has the most fre-quent passage of 5 tropical cyclones in 2 years.Zone 12 (Southern, Central and WesternMindanao regions) has the least number of tropi-cal cyclone passage, with an occurrence of 1 cy-clone in 12 years.
7
Chapter I - National Circumstances
FIGURE 1.2 Frequency of Tropical Cyclone Passage Over Each of the Geographical Zones in the Philippines
8
Chapter I - National Circumstances
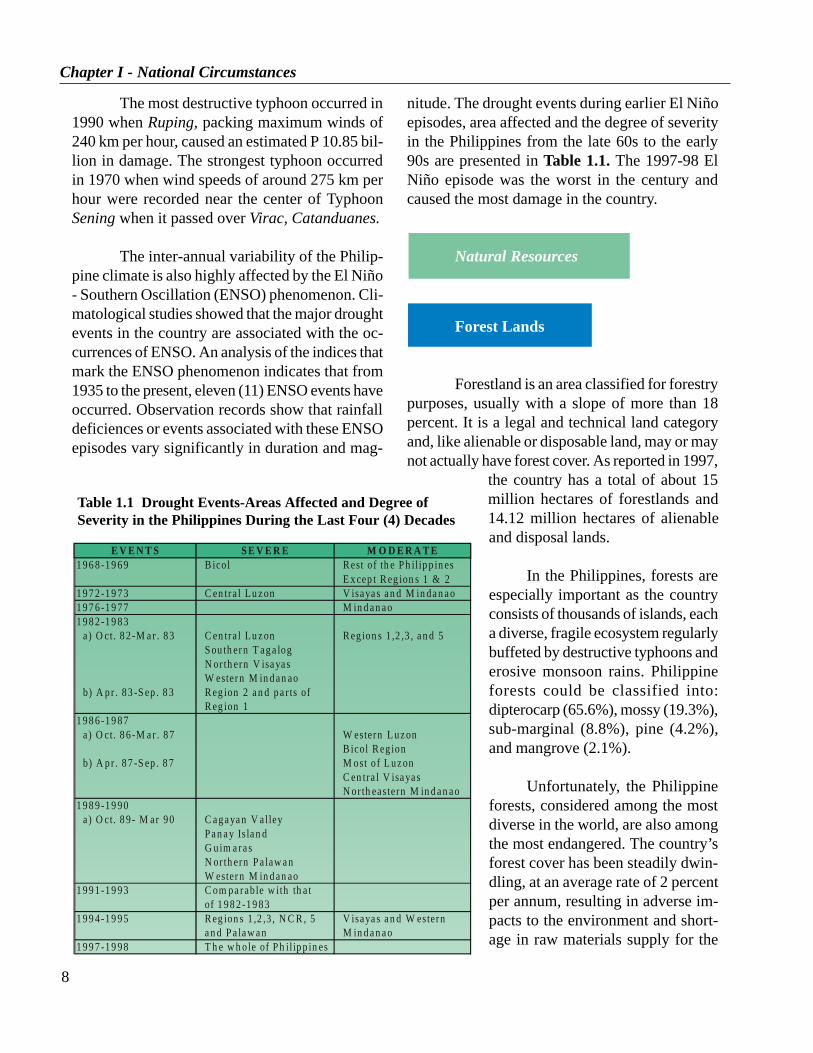
nitude. The drought events during earlier El Niñoepisodes, area affected and the degree of severityin the Philippines from the late 60s to the early90s are presented in Table 1.1. The 1997-98 ElNiño episode was the worst in the century andcaused the most damage in the country.
Natural Resources
Forest Lands
Forestland is an area classified for forestrypurposes, usually with a slope of more than 18percent. It is a legal and technical land categoryand, like alienable or disposable land, may or maynot actually have forest cover. As reported in 1997,
the country has a total of about 15million hectares of forestlands and14.12 million hectares of alienableand disposal lands.
In the Philippines, forests areespecially important as the countryconsists of thousands of islands, eacha diverse, fragile ecosystem regularlybuffeted by destructive typhoons anderosive monsoon rains. Philippineforests could be classified into:dipterocarp (65.6%), mossy (19.3%),sub-marginal (8.8%), pine (4.2%),and mangrove (2.1%).
Unfortunately, the Philippineforests, considered among the mostdiverse in the world, are also amongthe most endangered. The country’sforest cover has been steadily dwin-dling, at an average rate of 2 percentper annum, resulting in adverse im-pacts to the environment and short-age in raw materials supply for theG
The most destructive typhoon occurred in1990 when Ruping, packing maximum winds of240 km per hour, caused an estimated P 10.85 bil-lion in damage. The strongest typhoon occurredin 1970 when wind speeds of around 275 km perhour were recorded near the center of TyphoonSening when it passed over Virac, Catanduanes.
The inter-annual variability of the Philip-pine climate is also highly affected by the El Niño- Southern Oscillation (ENSO) phenomenon. Cli-matological studies showed that the major droughtevents in the country are associated with the oc-currences of ENSO. An analysis of the indices thatmark the ENSO phenomenon indicates that from1935 to the present, eleven (11) ENSO events haveoccurred. Observation records show that rainfalldeficiences or events associated with these ENSOepisodes vary significantly in duration and mag-
E V E N T S SE V E R E M O D E R A T E1 96 8-19 69 B icol Rest of th e Ph il ip p in es
E x cep t Reg ion s 1 & 21 97 2-19 73 C en tra l Lu zon V isayas an d M in dan ao1 97 6-19 77 M in d an ao1 98 2-19 83
a) O ct. 8 2-M ar . 83 C en tra l Lu zon Reg ion s 1 ,2 ,3 , an d 5Sou th ern T ag a logN or th ern V isayasW estern M in d an ao
b) A pr . 83 -S ep. 8 3 Reg ion 2 an d par ts ofReg ion 1
1 98 6-19 87a) O ct. 8 6-M ar . 87 W estern L uzon
B icol Reg ionb) A pr . 87 -S ep. 8 7 M ost of L uzon
C en tra l V isayasN or th eastern M in d an ao
1 98 9-19 90a) O ct. 8 9- M ar 90 C agayan V a lley
Pan ay Is lan dG uim arasN or th ern Pa law anW estern M in d an ao
1 99 1-19 93 C om parable w ith th a tof 1 98 2-19 83
1994-1995 Reg ion s 1 ,2 ,3 , N C R, 5 V isayas an d W esternan d Pa law an M in d an ao
1 99 7-19 98 T h e w h ole of Ph il ip p in es
Table 1.1 Drought Events-Areas Affected and Degree ofSeverity in the Philippines During the Last Four (4) Decades

9
Chapter I - National Circumstances
wood-based industries. The principal causes havebeen illegal logging, shifting cultivation orkaingin, forest fires, natural calamities, as well as,conversion to agricultural lands, human settle-ments, and other land uses brought about by ur-banization and increasing population pressure.
As of 1997, the Philippines has only about5.4 million hectares of remaining forests, a mere18 percent of the country’s total land area. Of these,about 804,900 hectares are old growth forests fromthe 27.5 million hectares (virgin forests) in year1575.
The remaining forest cover are as follows:Mangrove – 112,400 hectares; Old growth diptero-carp forests – 804,900 hectares; Residual diptero-carp forests - 2.73 million hectares; Pine forests –227,900 hectares; Mossy forests - 1.04 millionhectares; Sub-marginal lands – 475,100 hectares.For the other forestland classifications; Brush-lands - 2.23 million hectares; Grasslands - 9.01million hectares; and Lands suitable for planta-tion establishment - 7.05 million hectares. Theseforests sustain the watersheds, which contain thecountry’s freshwater supply. There are 120 pro-claimed watersheds within the country’s forest-lands with an aggregate area of more than 1.4 mil-lion hectares.
Only about 1.8 million hectares of secondgrowth forest can remain in the timber productionsystem for long-term sustained production. Aboutone million hectares of this can be placed imme-diately under community forest management.Some 200,000 hectares are so degraded that theyare best converted into forest plantations of rub-ber, rattan, and bamboo. About 400,000 hectaresof second growth forests and the remaining804,900 hectares of old growth forests are bestset aside for biological diversity conservation andenvironmental protection.
Philippine forestry has gone through twostages of change and is now in a third stage. In the
first stage, from the late Spanish period to the late1950s, large expanses of forests were cleared tomake way for the farms and settlements of thecountry’s rapidly growing population. During thesecond stage, from the early 1960s to the mid1970s, large-scale commercial logging and min-ing accelerated as the country attempted to developits economy, based mainly on the export of natu-ral resources, as well as, on agriculture.
From 1991 to 1995, the annual average rateof deforestation was 130,000 hectares. With thedepletion of forest resources, local economies builton forest wealth were forced to shift to othersources of livelihood or else endure poverty. For-est protection, species conservation, and refores-tation characterize the third stage. The governmentreversed its former policy of free market forestexploitation when it realized the acute impact ofmassive forest depletion and denudation of the up-lands on the environment.
The country has only 804,900 hectares of old growthforests remaining.
10
Chapter I - National Circumstances
The conversion of forest lands into farm-lands and the extraction of forest resources weremajor economic policies of the Philippine gov-ernment for quite sometime. During the third quar-ter of the century, the Philippines became knownas the world’s largest exporter of timber. Its fame,however, did not result in fortune for most Filipi-nos. Deforestation is the permanent scar left bybadly managed forestry programs.
In the 1990s, the DENR completelybanned logging in old growth forests. It is phas-ing out logging concessions under the timber li-cense agreement (TLA) system while makingmore equitable the access and use of forest re-sources. Environmentally sustainable develop-ment of forest lands has become the government’sguiding policy.
Agricultural Lands
Agriculture is the country’s economic life-line, but agricultural production in the Philippineshas been traditionally concentrated on only a fewmain crops, particularly, rice and corn. Only co-conut and sugar cane constitute important exportcommodities.
From 1960 – 1990, data showed that al-most ninety percent (90%) of the alienable anddisposable lands were devoted to agricultural pro-duction. Currently, a total of approximately 10.3million hectares are devoted to agriculture. Anestimated 45% of these agricultural lands are lo-cated in the lowlands and 33 percent in the up-lands.
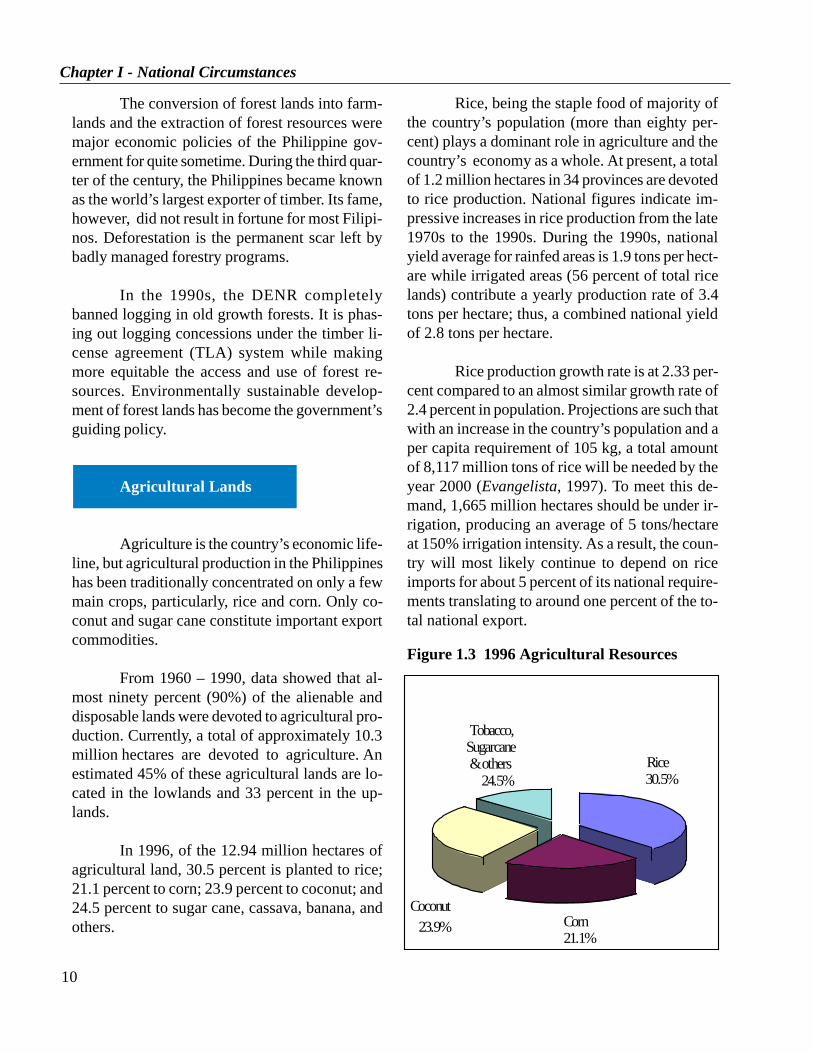
In 1996, of the 12.94 million hectares ofagricultural land, 30.5 percent is planted to rice;21.1 percent to corn; 23.9 percent to coconut; and24.5 percent to sugar cane, cassava, banana, andothers.
Rice, being the staple food of majority ofthe country’s population (more than eighty per-cent) plays a dominant role in agriculture and thecountry’s economy as a whole. At present, a totalof 1.2 million hectares in 34 provinces are devotedto rice production. National figures indicate im-pressive increases in rice production from the late1970s to the 1990s. During the 1990s, nationalyield average for rainfed areas is 1.9 tons per hect-are while irrigated areas (56 percent of total ricelands) contribute a yearly production rate of 3.4tons per hectare; thus, a combined national yieldof 2.8 tons per hectare.
Rice production growth rate is at 2.33 per-cent compared to an almost similar growth rate of2.4 percent in population. Projections are such thatwith an increase in the country’s population and aper capita requirement of 105 kg, a total amountof 8,117 million tons of rice will be needed by theyear 2000 (Evangelista, 1997). To meet this de-mand, 1,665 million hectares should be under ir-rigation, producing an average of 5 tons/hectareat 150% irrigation intensity. As a result, the coun-try will most likely continue to depend on riceimports for about 5 percent of its national require-ments translating to around one percent of the to-tal national export.
Corn21.1%
Rice30.5%
Tobacco,Sugarcane& others
24.5%
Coconut23.9%
Figure 1.3 1996 Agricultural Resources
11
Chapter I - National Circumstances
Corn is the secondmost important crop. A to-tal of 700,000 hectares in17 provinces have beenidentified for corn. Corn isthe staple food of about 12million Filipinos, and italso accounts for about 70percent of the ingredientsof the mixed feeds for live-stock. Moreover, corn pro-duction provides liveli-hood to about 600,000farm households and totransport services, traders,processors and agriculturalinput suppliers. For the pe-riod 1995-2004, the com-posite demand of corn forfood, feed and other industrial uses is projected togrow annually by 3.94 percent. On the other hand,average growth in corn production is expected todecrease annually by as much as 1.54 percent. Ifpresent productivity levels are not improved sub-stantially, the country faces a shortage of about3.26 MMT. The Department of Agriculture (DA)traces this to low/inadequate production levels,slow adoption rate of modern technologies, lossof land planted to corn by as much as 2.3% annu-ally to growing demand for non-agricultural usesand other competing cash crops, inequitable poli-cies that create price and supply imbalances, in-adequate infrastructure support and other relatedcauses.
Rapid urbanization has resulted in the in-discriminate conversion of agricultural land to resi-dential, industrial, and commercial uses and mayundermine food security. Present statistics of le-gal land conversion show that from 1990 to 1997,some 50,720 hectares have been allowed for con-version from agricultural to other uses with 18,657hectares of these having been approved by the De-partment of Agrarian Reform (DAR). In a 1991nationwide study conducted by the Bureau of Soils
and Water Management and the Department of Ag-riculture, it was found out that conversion of agri-cultural land was taking place very rapidly. Thestudy estimated that irrigated rice lands were con-verted at an average rate of 2,267 hectares perannum. The estimation done by Concepcion(1993) postulates that a hectare of irrigated landis at least equivalent to 3 hectares of rainfed landsand 5 hectares of ecologically fragile rolling up-land in terms of their capacity to produce the ba-sic staples, feeds and other farm supplies. In 1991,therefore, around 33,000-5,500 hectares of rainfed/rolling uplands have to be placed under cultiva-tion to replace losses due to conversion of irri-gated rice lands.
Wetlands
Philippine wetlands of international impor-tance cover about 14,100 sq. km. consisting of 61coastal wetlands, 22 lakes, and 8 freshwaterswamps and marshes. Sixty-nine percent (69%)of these are in the moderately to highly threatenedstatus.
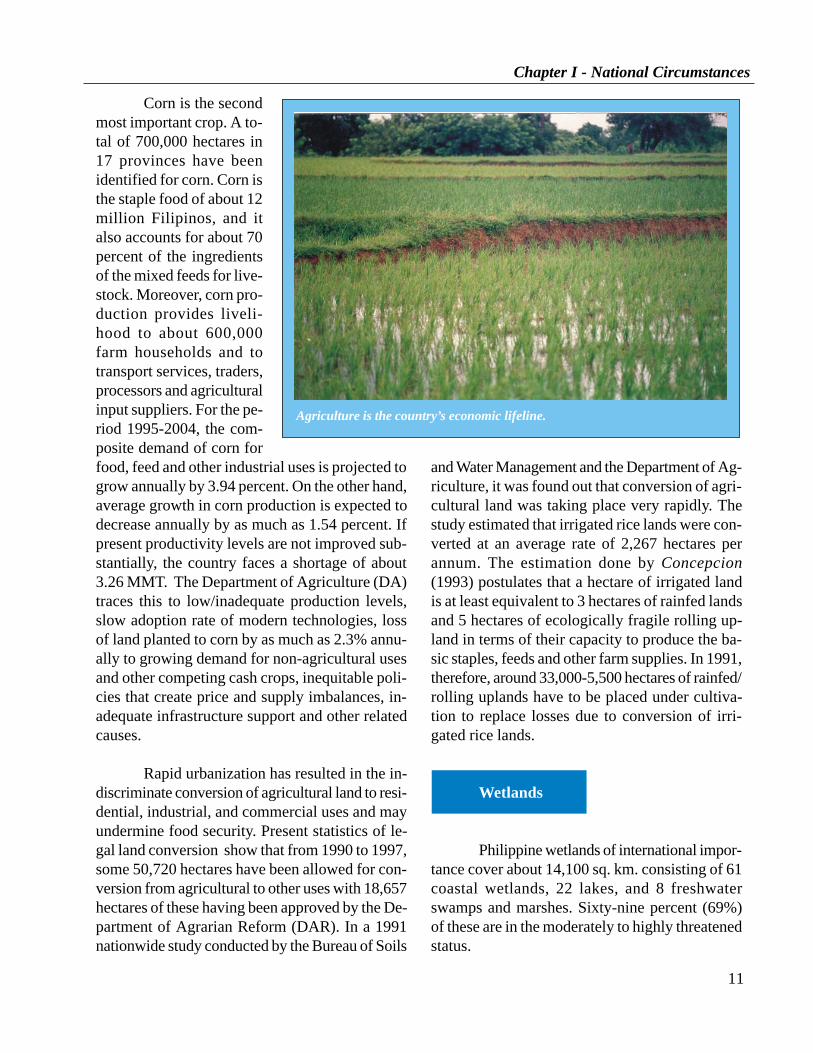
Agriculture is the country’s economic lifeline.

12
Chapter I - National Circumstances
Biological Diversity
The biological diversity of the Philippinesis the product of millions of years of gradual evo-lution. It traces its beginnings to the period whenthe earth’s geophysical, climatological, and otherconditions became conducive to the existence oflife. Natural selection processes took place in re-sponse to environmental disturbances. The com-plex history of sedimentation, submergence, fold-ing, metamorphism, igneous activity, uplift, anderosion is reflected in many parts of the presentarchipelago and has influenced the compositionand distribution of present-day flora and fauna.
It is difficult to estimate how many species ofPhilippine flora and fauna there are because thereis no comprehensive or current inventory of eventhe major biological niches and ecosystems of thecountry. However, based on available records,(many dating back to the early 1900s), at least35,000 species of plants and animals are found inthe archipelago.
There are at least 14,500 plant species, rep-resenting about five percent of the world’s flora:more than 8,000 flowering plants, 33 species ofgymnosperms, 1,011 fernsand fern allies, 625 mosses,790 lichens, 3,000 fungi,and 1,145 algae. The re-search conducted by variousscientists between 1950 and1995 show that there areabout 185 species of mam-mals, 558 species of birds,252 species of reptiles, 95species of amphibians, 54species of millipedes, 44species of centipedes, 341species of spiders, 2,782species of mollusks, andmore than 20,000 species of
insects. Marine species include 488 species of cor-als, about 2,400 species of protozoans, and 6 spe-cies of seagrasses.
In terms of endemicity, the Philippines hasone of the highest numbers of endemic species ofplants and animals. In fact, there are endemic spe-cies found only in certain parts of the same island.About 30 percent to 40 percent of the more than8,000 species of flowering plants are endemic tothe archipelago and are mostly found in primaryforests. However, only 28 of the more than 1,500genera of flowering plants are considered endemic.
Animal species, mostly insects, total about170,000, about half of which are endemic. Terres-trial vertebrate species number about 960 speciesof which 43 percent are endemic. There are nineendemic bird areas in the Philippines identifiedby the Birdlife International: the Luzon mountains,the Luzon lowlands and foothills, Mindoro, Negrosand Panay, Cebu, Palawan, Samar, Leyte, Boholand Mindanao lowlands, Mindanao mountains,and the Sulu archipelago. An endemic bird area isone where two or more restricted range species ofland birds are confined.
As of 1991, 89 species of birds, 44 spe-cies of mammals, and 8 species of reptiles are in-
The Philippines has one of the highest numbers of endemic species of plantsand animals, many of which are endangered. Among these are: the Tamarawand the Philippine Eagle.

13
Chapter I - National Circumstances
The dependable yield of the total water re-sources of the country add up to an aggregate of975 MCM per day (MCM/day) coming from sur-face runoff (833 MCM/day) and groundwater safeyield (142 MCM/day). However, due to unevendistribution of rainfall and differences in climaticpatterns, some regions in the country do not pos-sess adequate water resources as compared withother regions.
Water demand is divided among threemajor water users: the agricultural sector, the com-mercial and industrial sectors, and domestic us-ers. In 1997, the agricultural sector was the larg-est water user with demand amounting to 84 per-cent of the total demand or 23, 652 MCM per an-num. The next largest user of water is the com-mercial and industrial sector representing 8.2 per-cent of total water demand or 2,234 MCM per year.However, this is a modest estimate as industriesusually tap groundwater for their processing andcleaning operations. Domestic demand accountsfor only 7.8 percent or 2, 187 MCM per annum.Given the rapid pace of development and the ever-increasing population, total demand is expectedto increase by almost 8 percent per year to 35, 364MCM per annum by the year 2000.
Coastal Resources
Coastal zones tend to be the most heavilyused and abused part of the earth’s geography. Thisis due to the numerous benefits and opportunitiesoffered by coastal zones and the near-shore areas.The natural system in the coastal zone supportsmajor economic activities, such as farming in thecoastal lowlands, fishing and tourism, and pro-vides human settlement with essential life supportand development opportunities.
The Philippines’ coastal resources are var-ied and diverse, providing food and employmentfor a majority of the populace. About one million
ternationally recognized as threatened. These spe-cies include the Philippine Eagle (Pithecophagajefferyi) and the Tamaraw (Bubalus mindorensis).
Water Resources
The country is classified into 12 water re-source regions, which are defined by hydrologi-cal boundaries, physiographic features and climatehomogeneity.
There are 343 independent principal riverbasins with areas of at least 40 sq. km. each, cov-ering a total of 199,637 sq. km. or 66.5 percent ofthe country’s total land area. Of these, 20 are ma-jor river basins each covering at least 990 sq. km.These are sources of municipal and domestic wa-ter supply, irrigation, and power generation. Thecountry’s most extensive river systems are thePulangi (Rio Grande), which flows into theMindanao River; the Agusan, in Mindanao whichflows north into the Mindanao Sea; the Cagayanin northern Luzon; and the Pampanga, whichflows south from east Central Luzon into ManilaBay. Only two rivers in the country, the Cagayan(Luzon) and Mindanao rivers, have drainage ar-eas of more than 20,000-sq. km.
The Philippines has 61 lakes totaling morethan 2,000 sq. km., 23 of which have areas morethan 100 hectares. Laguna de Bay, located south-east of Manila Bay, is the largest freshwater lakein the Philippines and the second largest in South-east Asia. It covers an approximate area of 90,000hectares and is fed by 23 tributaries.
The country also has an extensive ground-water resource estimated to cover an aggregatearea of 50,000-sq. km. and storage of about251,158 MCM. The safe yield or the amount ofgroundwater available for abstraction without re-sorting to groundwater mining is estimated at31,554 MCM per annum.

14
Chapter I - National Circumstances
Unfortunately, the Philippine coral reefscontinue to be degraded and destroyed. Only about5.3 percent of the country’s coral cover are con-sidered in excellent condition (75-100% live coralcover), 25.2 percent in good condition (50-74%live coral cover), 39 percent in fair condition (25-49.9% live coral cover), and 30.5 percent are inpoor condition (0-24% live coral cover).
The most important factors that negativelyaffect these ecosystems are siltation, deforestation,agricultural activities, and mine tailings, whichproduce high sediment load.
Demography/Population Trends
As in many developing countries, a highbirth rate and gradually declining mortality ratecharacterize the Philippine population. Therefore,the growth in population is highly attributed tothe natural increase or the excess of births overdeaths.
At the beginning of the 19th century, thePhilippines had a population of slightly over 1.5million. At the turn of the century, the populationballooned to 7 million, and by the middle of the
1900s, it had reached 20 mil-lion. With an average annualgrowth rate of 2.52 percentfor the period 1990-1995, thenational population was de-clared at 68,616,536 in 1995and was estimated to be73,527,000 in 1997. Accord-ing to the computer modelsdeveloped by the Commis-sion on Population, the Uni-versity of the PhilippinesPopulation Institute and theFutures Group, the country’spopulation is estimated toreach 126 million by 2020.
people or 5 percent of the country’s labor forceearn their living from fisheries. In 1994 alone, thefishing industry generated approximately 81.2 bil-lion pesos, making the country the 12th largest fishproducer in the world for that year.
Philippine marine territorial waters coverabout 2.2 million sq. km.; 267,000 sq. km. (12percent) of these are coastal waters and 1.934 mil-lion sq. km. (88 percent) are oceanic waters withinthe exclusive economic zone (EEZ). There areabout 185,000 sq. km. of shelf area within a 200-m depth.
The country’s total discontinuous coastlineis approximately 32,400 kilometers, one of thelongest in the world. Eighty percent of the prov-inces and 65 percent of cities and municipalitiesshare the coast. There are 20 landlocked straitsand 61 natural harbors (30 of which are devel-oped and fully operational).
The Philippine coral reefs cover about27,000 sq. km. within a 15- to 30-m depth, one ofthe largest in the world. These reefs yield 10-15percent of the total annual fish production. Theannual fish yield (excluding invertebrates) of Phil-ippine reefs ranges from 5 to 24 metric tons persq. km.
Philippine marine territorial waters cover about 2.2 million sq. km.

15
Chapter I - National Circumstances
age growth rate of 3.5 percent followed by NCRat 3.3 percent, Central Mindanao (2.8 percent) andSouthern Mindanao (2.6 percent). On the otherhand, the Ilocos Region and Western Visayas havethe lowest annual average growth rate, both at 1.3percent. Southern Tagalog has the highest shareof the national population at 28.3 percent or anequivalent of 19.3 million Filipinos (NCR in-cluded). Other highly populated water resourcesregions are Central Luzon, Western Visayas, andSouthern Mindanao.
Health
Major improvements in the health of thecountry’s population have been scored during thelast thirty years. However, their pace and scopeare now at risk of being overwhelmed by a grow-ing population, rapid urbanization, a constrainedeconomy and the various challenges to servicedelivery.
During the period 1992-1997, life expect-ancy increased from 66.5 years to 68.0 years. Thebasic health indicators also improved over the spanof (6) years. The crude birth rate declined to 28.4per 1000 population from 31.12 in 1992 while thecrude death rate decreased to 6.1 per 1000 popu-lation in 1997. Infant mortality rate also declinedfrom 53.6 in 1992 to 45.8 per 1000 live births in1997. Maternal mortality rate likewise decreasedfrom 1.97 to 1.68 within the same period. Totalfertility rate also declined from 4.08 to 3.61 birthsper woman.
The morbidity and mortality trends of com-municable diseases, in particular, acute respira-tory infections such as pneumonia, bronchitis andinfluenza decreased in the past six (6) years. Theincidence of sanitation-related diseases associatedwith unsafe water supply, poor sanitation coupledwith improper food handling, i.e., diarrhea, chol-era, typhoid and intestinal parasitism was also re-
The Philippines is considered the 9th most popu-lous country in Asia and the 14th in the world.
Only approximately 1,000 of its islands arepopulated, and less than one-half of these are largerthan 2.5 square kilometers. Population density in-creased from 160 persons per square kilometer in1980 to 228 in 1995. There are 28 provinces with102 municipalities located in coastal areas occu-pying 129,114 hectares. In 1990, an estimated 2million people were living in coastal communi-ties and more than 9 million people are estimatedto inhabit the country’s forests.
The Philippines, still being predominantlyrural, has more than half of its population resid-ing in the rural areas. However, the proportion ofthe urban population increased from 37.44 per-cent in 1980 to 48.5 percent in 1990. In 1996, thetotal urban population constituted 55% of the to-tal national population.
Though unsure of what lies ahead of them,rural migrants take their chances in the cities wherewages are relatively higher, more educational op-portunities exist for their children and utilities andbasic services are readily available. This signifi-cant trend in migration from village to city affectedpopulation figures in the 1970s and the 1980s,which put extra stress on urban areas. In the early1980s, thirty cities had 100,000 or more residents,up from twenty-one in 1970. For Metro Manilaalone, its population was 5,924,563, up from4,970,006 in 1975, marking an annual growth rateof 3.6 percent, which was far above the nationalaverage of 2.5 percent. Metro Manila’s rate of mi-gration steadily increased from 4.53 percent in1981 to 5.7 percent in 1988. Metro Manila, whichalways posted the highest urban population in thecountry, was assessed by the United Nations asthe 23rd largest city in the world and is expected tobe the 16th largest by the year 2000.
During the last five years, Region IV(Southern Tagalog) has the highest annual aver-

16
Chapter I - National Circumstances
Table 1.2 MORBIDITY: Ten Leading Causes, Number and Rate/ 100,000 Population, 1989-1993 Average and 1994
duced. The incidence of measles, pertussis, neo-natal tetanus and diphtheria likewise marked im-provement.
Chronic communicable diseases are alsogenerally on the decline. However, although therewas an improvement in theincidence and prevalenceof tuberculosis in the Phil-ippines, it remains a seri-ous public health problem.Leprosy also declined, itsprevalence rate decreasedfrom 2.39 to 1.2 per10,000 population in 1997.
Some insect-bornediseases though, such asdengue, have increased insome areas of the countrybut have been controlledbecause of the preventivehealth activities conductedby the DOH with the Lo-cal Government Units andthe private sector. Malariawas eliminated in ten (10)provinces but is still en-demic in sixty four (64)provinces. Control mea-sures such as environmen-tal sanitation, spraying anduse of insecticide-impreg-nated mosquito nets havereduced the incidence ofMalaria. The Malaria mor-bidity rate registered a de-cline from 147 in 1992 to60 per 100,000 populationin 1997. Schistosomiasisis endemic in twenty-fourprovinces. Its prevalencerate was reduced to 4.52%in 1997.
Tables 1.2 and 1.3 provide the 1994 tenleading causes of morbidity and mortality figuresper 100,000 population in the Philippines com-pared with the 5-Year Average during the period1989-1993.
L ead ing C auses of 5 -year A verageM orbid ity (1989-1993) 1994
N um ber Rate N um ber R ate1 . D ia r rh eal D iseases 1 ,011 ,922 1 ,590 .6 1 ,376 .669 2006 .12 . B ron ch itis 887 ,935 1 ,395 .7 1 ,140 ,366 1661 .83 . In fluen za 440 ,229 692 .0 839 ,683 1223 .64 . P n uem on ia 281 ,263 442 .1 614 ,353 895 .25 . A cciden ts 128 ,866 202 .6 211 ,092 307 .66 . T ubercu losis, a ll form s 156 ,456 245 .9 167 ,763 244 .57 . D iseases of th e H ear t 87 ,789 138 .0 141 ,295 205 .98 . V ar icella 35 ,305 55 .5 76 ,526 111 .59 . M a la r ia 67 ,612 106 .3 58 ,627 85 .410 . M a lign an t 33 ,740 53 .0 49 ,531 72 .2
Lead in g C auses of 1994M orta lity % of % of
N um ber Rate T ota l N um ber Rate T ota lD eath D eath
1. D iseases of th e Hear t 47 ,023 73.9 14 .9 50 ,307 73.3 15 .72. D iseases of th e V ascu la r
System 34,635 54.4 11 .0 39 ,191 57.1 12 .23. P n eum on ias 40 ,374 63.5 12 .8 28 ,132 41.0 8 .84. M a lign an t N eop lasm s 23,168 36.4 7 .4 28 ,110 41.0 8 .75. T uberculosis 24 ,271 38.2 7 .7 27 ,292 39.8 8 .56. A cciden ts 10 ,295 16.2 3 .2 14 ,752 21.5 4 .67. C h ron ic O bstructive
Pu lm on ary an d A lliedC on d ition s 7 ,725 12.1 2 .5 11 ,405 16.6 3 .5
8. O th er D iseases of th eResp ira tory System 6,723 10.6 2 .1 8 ,382 12.2 2 .6
9. D ia r rh ea l D iseases 6 ,939 10.9 2 .2 6 ,383 9.3 2 .010 . D iabetes M ellitus 3 ,195 5.0 1 .0 6 ,105 8.9 1 .9
5-Y ear A verage(1989-1993)
Table 1.3 MORTALITY: Ten Leading Causes, Number and Rate/ 100,000 Population, 1989-1993 Average and 1994
17
Chapter I - National Circumstances
industries are dominated by the production of ce-ment, glass industrial chemicals, fertilizers, ironand steel, and refined petroleum products.
The industrial sector is concentrated in theurban areas, especially in the metropolitan Ma-nila region and has only weak linkages to the ru-ral economy. Inadequate infrastructure, transpor-tation, communication, and electric power short-ages have so far inhibited faster industrial growth.
Likewise, in 1994, agriculture, forestry,and fishing accounted for 22.02 percent orUS$14.11 billion of the gross domestic productwith agriculture and fishery totaling US$ 13.9 bil-lion against the US$ 180 million of the forestrysector.
Energy Production and Consumption
Supply and Production
Imported coal and crude oil, accountingfor 56.0% of the total primary energy supply in1995 provide the bulk of the country’s energy sup-ply. Indigenous conventional (oil, coal, hydro, geo-thermal) and non-conventional sources comprisethe remaining 44.0% of the total national energysupply.
The Philippines has a number of indig-enous resource options, but most of these remainlargely unexplored and underexploited. The coun-try has estimated reserves of about 400 millionbarrels of oil and 4.5 trillion standard cubic feetof natural gas. Geothermal energy is one indig-enous resource that abounds in the country withpotential reserves conservatively estimated at4,000 MW.
Since the start of production of thecountry’s first oil field (El Nido) in 1979, about
Economy
Composition and Growth
In 1994, gross national product (GNP) waspegged at US$65.661 billion and gross domesticproduct (GDP) at US$ 64.018 billion. The GDPper capita was pegged at US $954.92. Exportsreached a total of US$ 21.650 billion while im-ports were at US$ 25.688 billion.
The gross national product and gross do-mestic product have recovered from stagnation in1991 and have been on an upward trend until 1996.GNP grew to 6.9% in 1996 and GDP, 5.7%. De-spite the Asian currency turmoil in July 1997, thecountry still managed to have a 5.8% and 5.1%annual growth rate for GNP and GDP, respectively.
The 45.46% or US$ 29.1 billion of theGDP is credited to the services sector with tradesharing US$ 8.72 billion; private services, US$5.56 billion; government services, US$ 4.81bil-lion; ownership of dwellings and real estate, US$4.32billion; transportation, communication, andstorage, US$ 3.13 billion; and finance US$ 2.55billion.
The industrial sector shares US$ 20.82 bil-lion or 32.52% of the GDP. Manufacturing hasthe greatest contribution in the sector (US$ 14.88billion), followed by construction (US$ 3.61 bil-lion), electricity, gas, and water (US$ 1.7 billion),and mining and quarrying (US$ 0.62 billion).
Industrial production is centered on pro-cessing and assembly operations of the following:food, beverages, tobacco, and rubber products; tex-tiles, clothing and footwear; pharmaceuticals;paints; plywood and veneer; paper and paper prod-ucts; small appliances; and electronics. Heavier

18
Chapter I - National Circumstances
GWH in 1994 to 6,135 GWH in 1995. TheMakban geothermal field, the country’s leadingproducer, decreased its production due to theplant’s load curtailment from September to De-cember of 1995. The Tiwi geothermal field like-wise posted a decrease due to the damage broughtby typhoon “Rosing.” The Makban geothermalfield, the country’s leading producer, recordedlower production levels to stabilize reserves andensure the sustainability of the resource in thelong-term. Plant rehabilitation likewise affectedits operations considering the age of the facili-ties
Affordability and accesibility of NRESfor households drove the steady utilization of non-conventional energy resources between 1990-1995. The non-conventional sector contributedroughly 11.47% of the total national energy re-quirements. Agri-wastes consistently contributeda large part of the non-conventional energy sup-ply.
Consumption
There was an upward trend in the con-sumption of energy from 1990 to 1995. Moder-ate growth was posted for the period, with a steepincrease in energy consumption from 1993 to1995. A total of 131.10 million barrels of fuel oilequivalent (MMBFOE) was consumed in 1993,146.54 MMBFOE in 1994, and 209.75MMBFOE in 1995. For the period 1990-1995,the country’s average commercial energy con-sumption per capita stood at 2.48 barrels of fueloil equivalent (BFOE). The energy-to-GDP ratioor energy intensity grew steadily from 0.17BFOE/’000 GDP in 1990 to 0.26 BFOE/’000GDP in 1995. During the same period, the coun-try posted an average energy intensity of 0.19BFOE/’000 GDP.
The consumption of petroleum products,mainly fuel oil and diesel, steadily increased from
40 million barrels of oil have been produced. Theoil production considerably increased from a low1.73 million barrels in 1990 to 3.32 million bar-rels in 1993. This trend was made possible by thediscovery of major oil fields from 1990 to thepresent. These include West Linapacan, with es-timated recoverable reserves of 90 million barrelsof oil (MMBO), the Octon structure with recov-erable reserves initially placed at 10 to 15 MMBO,and Malampaya with 2.5 to 4.5 trillion cubic feetof recoverable gas reserves. However, in 1994 and1995, there was a sharp decline in the country’soil production, which amounted to 1.66 millionbarrels and 0.95 million barrels, respectively. Thedecline was largely due to the continuous, unar-rested water intrusion problem in the WestLinapacan oil field.
Coal used by the country’s power plants,meanwhile, mostly come from outside sources. Atotal of 2,010,305 metric tons of coal were im-ported from countries like Australia, Indonesia,Vietnam, China, and Russia. Domestic coal pro-duction showed a steady increase from 1,243,013metric tons in 1990 to 1,660,660 metric tons in1992. However, from 1993 to 1995, coal produc-tion decreased, dropping by 8.4% in 1994 and 10.1percent in 1995. The bulk of local coal supplycomes from the Semirara Coal Mine, which is thebiggest coal producer in the country, yielding 749.7MMT in 1995.
In 1990, the hydroelectric power installedcapacity was placed at 2,153 MW, displacing about10.45 million barrels of fuel oil equivalent. In-stalled capacity slightly increased from 1991 to1995. An additional 103 MW capacity was in-stalled between 1990 and 1995 as part of the policyto develop energy resources with minimal envi-ronmental impact. Thus, development was focusedon the installation of small hydro facilities.
Power generated by geothermal powerplants totaled 35,044 gigawatt-hours (GWH) dur-ing the period 1990-1995. The total geothermalproduction slipped by 2.9 percent from 6,320

19
Chapter I - National Circumstances
1990 to 1995. In 1995, about 15,942 thousandbarrels of premium and regular gasoline, 38,602million barrels of diesel, and 45,733 million bar-rels of fuel oil were consumed. Among the indus-trial consumers of petroleum products, the powergeneration sector was consistently the highest, av-eraging 25.9 million barrels annually. Unleadedgasoline was introduced in the market in Febru-ary, 1994 and registered a total sale of 1,047 thou-sand barrels at the end of the year. In 1995, 1,799thousand barrels were consumed, equivalent to a71.82% increase in the consumption of unleadedgasoline.
Electricity sales showed an upward trendfrom 1990 to 1992. However, in 1993, electricitysales slightly dropped by 1.13 percent. In 1994and 1995, due to a stabilized power situation, therewas a substantial increase in the electricity con-sumption by the industrial (13.72% in 1994, 4.78%in 1995) and commercial (24.13% in 1994, 8.66%in 1995) sectors. Over all, the biggest consumerof electricity was the industrial sector at 11,195GWH in 1995, followed by the residential sector,which consumed a total of 8,308 GWH for thesame year.
Political Units
Administratively, the country is dividedinto 16 political regions. As of April 1998, theCommission on Elections listed 78 provinces, 85cities, and 1,525 municipalities. The smallest po-litical unit is the barangay, of which there are41,925.
National Coordination Mechanismon Climate Change
The Philippines was among the first coun-tries to respond to the challenge of the climate
change phenomenon. As early as May 8, 1991 thePhilippine government created the Inter-agencyCommittee on Climate Change (IACCC) by vir-tue of Administrative Order No. 220. The IACCCis composed of 15 government agencies and NGOrepresentatives. The IACCC was established tocoordinate various climate change related activi-ties, propose climate change policies and preparethe Philippine positions to the UNFCCC negotia-tions.
The IACCC is chaired by the Secretary ofthe Department of Environment and Natural Re-sources and co-chaired by the Secretary of theDepartment of Science and Technology. Amongits members are the representatives of the Philip-pine Atmospheric, Geo-Physical, and Astronomi-cal Services Administration, the Department ofForeign Affairs, the Environment Committees ofthe two houses of the Philippine Congress, the De-partment of Energy, the Department of Transpor-tation and Communication, the Department of Ag-riculture, the National Economic and Develop-ment Authority, and the Philippine Network onClimate Change, representing the non-governmentorganizations. The Environmental ManagementBureau acts as the Secretariat to the IACCC. Fig-ure 1.4 shows the IACCC organizational struc-ture.

20
Chapter I - National Circumstances
FIGURE 1.4 IACCC ORGANIZATIONAL STRUCTURE
Member(PHIL. SENATE)
Co-Chairman(DOST)
Secretariat(EMB-DENR)
Member(DFA)
Member(DPWH)
Member(NEDA)
Chairman(DENR)
Member(PNCC)
Member(DOE)
Member(PAGASA)
Member(FMB)
Member(NAMRIA)
Member(DOTC)

21
Chapter II - 1994 National GHG Inventory
Chapter II
Methodology
The 1994 GHG inventory of the Philippinesis a result of the application of inventory proce-dures stipulated by the Revised 1996 IPCC Guide-lines. While these guidelines provide activity dataand emission factors for the various sectors of con-cern, local values were used in place of these datawhenever possible. The following discussion enu-merates these non-IPCC procedures and data thatwere adopted per sector in the process of prepar-ing an inventory of the country’s GHG emissions.
Energy
The Energy sector applied most of the rec-ommended procedures and default data providedby the IPCC. Emission factors supplied by theIPCC were used all throughout the inventory al-
Table 2.1 IPCC Equivalent of Local Fuel Types
1994 NATIONAL GHG INVENTORY
he Philippines has conducted two national greenhouse gas inventories, onefor 1990 and the other, for 1994. The 1990 GHG Inventory was initially undertakenunder the U.S. Country Studies Program, where the Philippines was a participatingcountry.
Pursuant to decision 10 CP/2, however, non-Annex I countries are required toreport their 1994 National GHG Inventory as contained in their Initial National Com-munication. Hence, the Philippines generated this inventory through the Enabling Ac-tivity Project funded by the GEF through the UNDP.
T
though further refinement of the data is now pos-sible with the availability of local emission factorsespecially from the transport sector.
The other local modification was in theclassification of fuel used in the Philippines. Table2.1 lists these local fuel types and the correspond-ing IPCC equivalent.
Calculations in the Energy sector also in-dicate an expected difference between the results
Local Fuel Type IPCC EquivalentCoal Sub Bituminous CoalCrude Oil Crude OilPremium Gasoline GasolineRegular Gasoline GasolineUnleaded Gasoline GasolineKerosene Other KeroseneDiesel Gas/Diesel OilFuel Oil Residual Fuel Oil

22
Chapter II - 1994 National GHG Inventory
Water Management Season Length Methane EmissionRegime (days) Factor (kg/ha/day)
Irrigated 114 2.3Rainfed 113 0.4
based on the IRRI-conducted local experimentson methane emissions from rice fields. IRRI’smethod for approximating methane emissions fromrice paddy cultivation is a straightforward calcu-lation which needs readily available input data. Thismethod requires (for each type of water manage-ment regime) statistics on the harvested area ofrice, season length, and emission factor. The wa-ter management regime describes the degree offlooding and is classified as either irrigated orrainfed.
The IRRI study used the following equa-tion for determining methane emissions from ricepaddy cultivation:
MW = (AW x SW x EFW)/1000
where:
W = Water management (either irri-gated or rainfed)
MW = Methane emissions from watermanagement regime “w” (Gg/yr
AW = Harvested area of rice underwatermanagement regime “w” (‘000hectares)
SW = Season length for water manage-ment regime “w” (days)
EFW = Emission factor for water manage-ment regime “w” (kg/ha/day)
Data for these various parameters are givenin Table 2.2. The estimated total methane emis-sions is calculated by adding the methane emis-sions from the two water management regimes.
of the top-down and bottom-up (or sectoral) ap-proaches:
Top-down Approach: 50,010 ktons CO2Bottom-up Approach: 47,335 ktons CO2.
The difference is attributed to the varia-tions in data reporting by the fuel end-users andorganizational units designed to manage the flowof data within the DOE.
Industry
GHG emissions from the Industry sectorare largely based on production and the transfor-mation of raw materials. The methods that wereused to estimate GHG emissions from these pro-cesses were based on the Revised 1996 IPCCGuidelines. Because the IPCC guidelines are ge-neric, there were some cases when they could notbe directly applied. In these cases, the industrialinventory used methods that involved appliedchemistry. For example, in the determination ofNMVOC emissions from the food and beveragesub-sector, physical chemistry was applied to ap-proximate the quantities of beverages. The calcu-lations for NMVOC were then based on these ap-proximations.
Agriculture
Owing to the lack of thenecessary input data, the IPCC-based methodology for Agriculturecan not be fully adopted. Some ex-isting data, moreover, are not avail-able in the format required by theIPCC (1996) methodology.
The method for estimatingmethane emissions, for example, is
Table 2.2 IRRI Default Parameter Values and Methane Emission Factor for Rice Paddy Cultivation
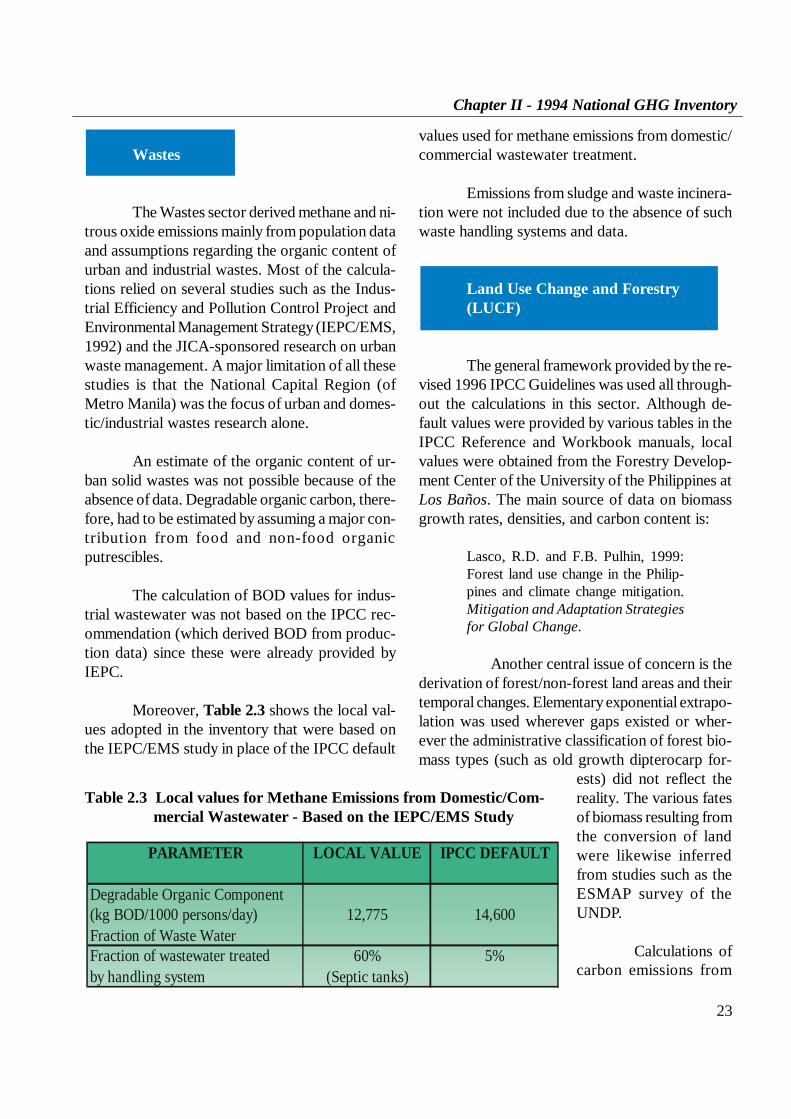
23
Chapter II - 1994 National GHG Inventory
values used for methane emissions from domestic/commercial wastewater treatment.
Emissions from sludge and waste incinera-tion were not included due to the absence of suchwaste handling systems and data.
Land Use Change and Forestry(LUCF)
The general framework provided by the re-vised 1996 IPCC Guidelines was used all through-out the calculations in this sector. Although de-fault values were provided by various tables in theIPCC Reference and Workbook manuals, localvalues were obtained from the Forestry Develop-ment Center of the University of the Philippines atLos Baños. The main source of data on biomassgrowth rates, densities, and carbon content is:
Lasco, R.D. and F.B. Pulhin, 1999:Forest land use change in the Philip-pines and climate change mitigation.Mitigation and Adaptation Strategiesfor Global Change.
Another central issue of concern is thederivation of forest/non-forest land areas and theirtemporal changes. Elementary exponential extrapo-lation was used wherever gaps existed or wher-ever the administrative classification of forest bio-mass types (such as old growth dipterocarp for-
ests) did not reflect thereality. The various fatesof biomass resulting fromthe conversion of landwere likewise inferredfrom studies such as theESMAP survey of theUNDP.
Calculations ofcarbon emissions from
Wastes
The Wastes sector derived methane and ni-trous oxide emissions mainly from population dataand assumptions regarding the organic content ofurban and industrial wastes. Most of the calcula-tions relied on several studies such as the Indus-trial Efficiency and Pollution Control Project andEnvironmental Management Strategy (IEPC/EMS,1992) and the JICA-sponsored research on urbanwaste management. A major limitation of all thesestudies is that the National Capital Region (ofMetro Manila) was the focus of urban and domes-tic/industrial wastes research alone.
An estimate of the organic content of ur-ban solid wastes was not possible because of theabsence of data. Degradable organic carbon, there-fore, had to be estimated by assuming a major con-tribution from food and non-food organicputrescibles.
The calculation of BOD values for indus-trial wastewater was not based on the IPCC rec-ommendation (which derived BOD from produc-tion data) since these were already provided byIEPC.
Moreover, Table 2.3 shows the local val-ues adopted in the inventory that were based onthe IEPC/EMS study in place of the IPCC default
PARAMETER LOCAL VALUE IPCC DEFAULT
Degradable Organic Component(kg BOD/1000 persons/day) 12,775 14,600Fraction of Waste WaterFraction of wastewater treated 60% 5%by handling system (Septic tanks)
Table 2.3 Local values for Methane Emissions from Domestic/Com- mercial Wastewater - Based on the IEPC/EMS Study
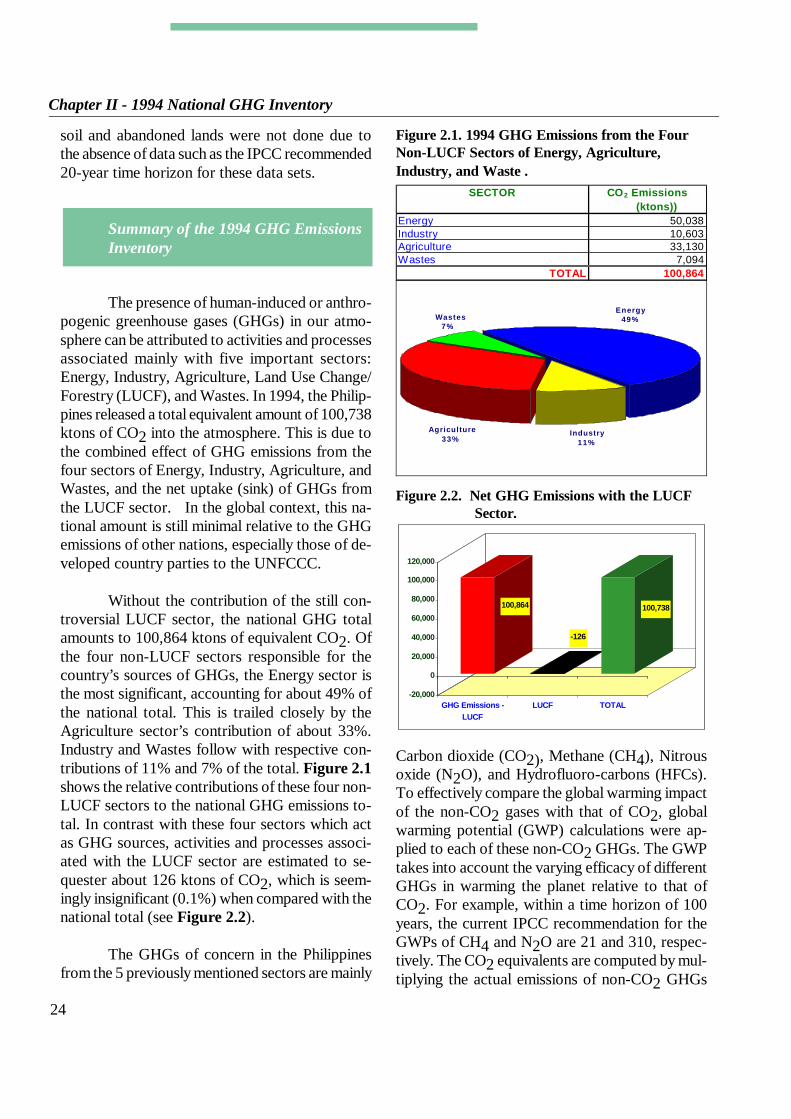
24
Chapter II - 1994 National GHG Inventory
soil and abandoned lands were not done due tothe absence of data such as the IPCC recommended20-year time horizon for these data sets.
Summary of the 1994 GHG EmissionsInventory
The presence of human-induced or anthro-pogenic greenhouse gases (GHGs) in our atmo-sphere can be attributed to activities and processesassociated mainly with five important sectors:Energy, Industry, Agriculture, Land Use Change/Forestry (LUCF), and Wastes. In 1994, the Philip-pines released a total equivalent amount of 100,738ktons of CO2 into the atmosphere. This is due tothe combined effect of GHG emissions from thefour sectors of Energy, Industry, Agriculture, andWastes, and the net uptake (sink) of GHGs fromthe LUCF sector. In the global context, this na-tional amount is still minimal relative to the GHGemissions of other nations, especially those of de-veloped country parties to the UNFCCC.
Without the contribution of the still con-troversial LUCF sector, the national GHG totalamounts to 100,864 ktons of equivalent CO2. Ofthe four non-LUCF sectors responsible for thecountry’s sources of GHGs, the Energy sector isthe most significant, accounting for about 49% ofthe national total. This is trailed closely by theAgriculture sector’s contribution of about 33%.Industry and Wastes follow with respective con-tributions of 11% and 7% of the total. Figure 2.1shows the relative contributions of these four non-LUCF sectors to the national GHG emissions to-tal. In contrast with these four sectors which actas GHG sources, activities and processes associ-ated with the LUCF sector are estimated to se-quester about 126 ktons of CO2, which is seem-ingly insignificant (0.1%) when compared with thenational total (see Figure 2.2).
The GHGs of concern in the Philippinesfrom the 5 previously mentioned sectors are mainly
Figure 2.1. 1994 GHG Emissions from the FourNon-LUCF Sectors of Energy, Agriculture,Industry, and Waste .
Figure 2.2. Net GHG Emissions with the LUCF Sector.
SECTOR CO2 Emissions(ktons))
Energy 50,038Industry 10,603Agriculture 33,130Wastes 7,094
TOTAL 100,864
Wastes7%
Agriculture33%
Industry11%
Energy49%
100,864
-126
100,738
-20,000
0
20,000
40,000
60,000
80,000
100,000
120,000
GHG Emissions -LUCF
LUCF TOTAL
Carbon dioxide (CO2), Methane (CH4), Nitrousoxide (N2O), and Hydrofluoro-carbons (HFCs).To effectively compare the global warming impactof the non-CO2 gases with that of CO2, globalwarming potential (GWP) calculations were ap-plied to each of these non-CO2 GHGs. The GWPtakes into account the varying efficacy of differentGHGs in warming the planet relative to that ofCO2. For example, within a time horizon of 100years, the current IPCC recommendation for theGWPs of CH4 and N2O are 21 and 310, respec-tively. The CO2 equivalents are computed by mul-tiplying the actual emissions of non-CO2 GHGs

25
Chapter II - 1994 National GHG Inventory
conventional fuel types continue to dominate thecurrent and projected energy mix of the country:76% in 1994 and 67.5% by the year 2008. Newand renewable energy sources (NREs) such as hy-droelectric power, geothermal, bio-mass, wind, andsolar systems are projected to comprise 32.5% ofthe energy mix in 2008 [Philippine Energy Plan,Dept. of Energy, 1999]. Biomass contributes thegreater share among these NREs. GHG emissionsfrom these NREs are assumed to be insignificant.
Industry
In the Industry sector, 10,603 ktons of CO2were released in 1994. A major fraction (86%) ofthe industrial CO2 emissions comes from the ce-ment and metal industries (see Figure 2.4). Theseemissions arise directly from industrial processesassociated with manufacturing cement and met-als, and are not due to the power generation ac-tivities of these industries which are already ac-counted for in the Energy sector. In 1994, thePhilippines produced around 239 million bags ofcement and 2.669 million tons of steel correspond-ing to CO2 emissions of 4,771 and 4,318 ktons,respectively.
(e.g. of CH4 and N2O) with their respective GWPs.Hence, for example, the potential global warmingimpact of 100 ktons of CH4 is equivalent to thatof 2,100 ktons of CO2. The total of GHG emis-sions cited above is in terms of equivalent CO2 (totake into account the contribution of non-CO2GHGs).
GHG emissions from the Energy sector aredominated by power generation and transport whilein Agriculture, rice paddy cultivation and domes-tic livestock are the primary sources of GHG re-lease. Industry’s GHG sources are found mainlyin the cement and metal processing industries whileCH4 emissions are largely from solid wastes. Theapparently low net emissions from the LUCF sec-tor is due to the combined effect of large values inbiomass growth and forest land use change/con-version. A more complete breakdown of thesevarious subsectoral contributions is explained inthe following section.
Sectoral Contributions
The individual contributions of the five sec-tors to the national GHG emissions total may befurther resolved into more specific subsectors ofGHG sources and sinks per sector.
Energy
The GHG emissions in the energy sector(which is largely CO2) come mainly from fuel com-bustion. This sector alone emitted 50,038 ktons ofequivalent CO2 in 1994. The subsector contribu-tions to this total are tabulated and illustrated inFigure 2.3. A significant portion of these emis-sions (about 82%) is from three major end usersof fuel: the power generating industries, transpor-tation, and the manufacturing industries. The mainfuel types used in these subsectors are conventionalfossil fuels such as oil and coal which are found tocontribute substantially to GHG emissions. These
Fugitive Emissions
0%
Others7%
Energy Industries
27%
Commercial1%Transport
30%
Agriculture1%
Residential10%Industries
24%
Figure 2.3. GHG Emissions from the Energy Sector.
Sub Sector CO2 Emissions(ktons)
Power Generation 15,508Residential 4,359Industries 9,497Agriculture 1,189Transport 15,888Commercial 3,370Fugitive Emissions 227
TOTAL 50,038
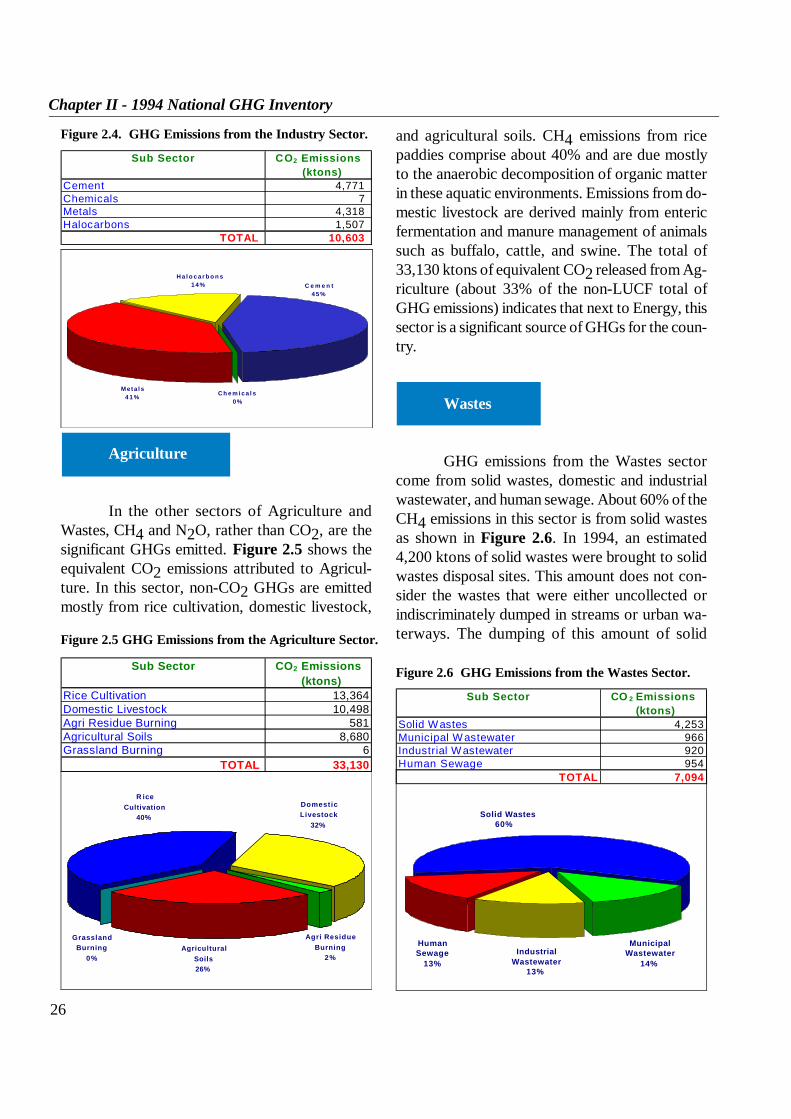
26
Chapter II - 1994 National GHG Inventory
and agricultural soils. CH4 emissions from ricepaddies comprise about 40% and are due mostlyto the anaerobic decomposition of organic matterin these aquatic environments. Emissions from do-mestic livestock are derived mainly from entericfermentation and manure management of animalssuch as buffalo, cattle, and swine. The total of33,130 ktons of equivalent CO2 released from Ag-riculture (about 33% of the non-LUCF total ofGHG emissions) indicates that next to Energy, thissector is a significant source of GHGs for the coun-try.
Wastes
GHG emissions from the Wastes sectorcome from solid wastes, domestic and industrialwastewater, and human sewage. About 60% of theCH4 emissions in this sector is from solid wastesas shown in Figure 2.6. In 1994, an estimated4,200 ktons of solid wastes were brought to solidwastes disposal sites. This amount does not con-sider the wastes that were either uncollected orindiscriminately dumped in streams or urban wa-terways. The dumping of this amount of solid
Agriculture
In the other sectors of Agriculture andWastes, CH4 and N2O, rather than CO2, are thesignificant GHGs emitted. Figure 2.5 shows theequivalent CO2 emissions attributed to Agricul-ture. In this sector, non-CO2 GHGs are emittedmostly from rice cultivation, domestic livestock,
Figure 2.4. GHG Emissions from the Industry Sector.
Sub Sector CO2 Emissions(ktons)
Cement 4,771Chemicals 7Metals 4,318Halocarbons 1,507
TOTAL 10,603
M e t a l s4 1 % C h e m i c a l s
0%
C e m e n t4 5 %
H a l o c a r b o n s1 4 %
Sub Sector CO2 Emissions(ktons)
Rice Cultivation 13,364Domestic Livestock 10,498Agri Residue Burning 581Agricultural Soils 8,680Grassland Burning 6
TOTAL 33,130
Domestic Livestock
32%
Agri Residue Burning
2%
Grassland Burning
0%Agricultural
Soils26%
R ice Cultivation
40%
Figure 2.5 GHG Emissions from the Agriculture Sector.
Solid Wastes60%
HumanSewage
13%
MunicipalWastewater
14%Industrial
Wastewater13%
Figure 2.6 GHG Emissions from the Wastes Sector.
Sub Sector CO 2 Emissions(ktons)
Solid Wastes 4,253Municipal Wastewater 966Industrial Wastewater 920Human Sewage 954
TOTAL 7,094

27
Chapter II - 1994 National GHG Inventory
mosphere back into the biosphere. This sink, how-ever, is offset by biomass loss associated with for-est harvest and deforestation. In 1994, the totalland use area was about 16 Mha and the biomassgrowth of these land areas resulted in an estimatedcumulative uptake of 110,704 ktons CO2. How-ever, carbon sequestered by the annual growth ofthese different vegetative types is offset by theyearly removal of biomass via harvest and defor-estation. Roundwood/Fuelwood harvests in 1994account for 42,381 ktons of CO2 emitted. Addi-tionally, forest loss and land use conversion re-leased a total of 68,197 ktons CO2. This includesemissions from activities such as on site burning(for clearing purposes), off site burning (for do-mestic/industrial fuelwood), and biomass decay.
The net LUCF contribution is still not com-plete since biomass growth and loss are not theonly determining components of this total. The stillunknown impact of Philippine soil carbon and bio-mass growth in abandoned lands, together withuncertainties in local biomass densities and growthrates make it difficult to obtain a more completevalue for the contribution of the LUCF sector tothe national GHG emissions total. Despite the un-certainties, present calculations suggest that for thePhilippines in 1994, LUCF is an insignificant sinkrather than a source of GHGs in the atmosphere.
Table 2.4 shows a summary table of the1994 Philippine GHG Emissions Inventory for thefive sectors of Energy, Agriculture, Industry, LandUse Change/Forestry, and Wastes.
GHG Emission Projections for 2008
Energy
The energy sector plays a dominant role indetermining the GHG emissions of the country. In
Figure 2.7 GHG Emissions and Sinks in the LUCF Sector.
Sub SectorCO2 Emissions(+)
and Uptake(-)
(ktons)
Change in Forest/Woody Biomass -68,323 Biomass Growth -110,704
Roundwood/Fuelwood Harvests 42,381Forest/Land Use Change 68,197 On Site Burning 28,868 Off Site Burning 6,555 Decay 32,774
TOTAL -126
Biomass Growth
-68,323 Gg
Forest Conversion
68197 Gg
TOTAL
-126 Gg
-80,000
-60,000
-40,000
-20,000
0
20,000
40,000
60,000
80,000
wastes released about 203 ktons of CH4, equiva-lent to emitting around 4,253 ktons of CO2 intothe atmosphere (using current GWP assumptions).Industrial wastewater, municipal wastewater, andhuman sewage share almost equally the other 40%of GHG emissions from this sector.
Land Use Change and Forestry
The 126 ktons of CO2 estimated to besequestered by the LUCF sector is attributed tothe net impact of non-negligible changes in biom-ass growth and land use/forest conversion. This isshown in Figure 2.7.
Biomass growth alone from the country’sforested lands and other land use categories is citedas a major factor in bringing GHGs from the at-

28
Chapter II - 1994 National GHG Inventory
SECTOR and SOURCE CATEGORIES CO2 CH4 N2O NOx CO NMVOC SO2
I. ENERGYA. Fuel Combustion Activities 433.36
1. Energy Industries 15,458 0.51 0.13 38.47 2.83 0.912. Manufacturing Industries 8,980 8.08 1.12 60.93 986.71 13.813. Transport 15,801 2.15 0.14 167.37 719.44 136.774. Commercial/Institutional 3,368 0.06 0.00 0.63 0.13 0.035. Residential 2,544 72.83 0.92 29.22 1,356.21 133.026. Agriculture 1,185 0.11 0.01 1.08 0.22 0.05
B. Fugitive Emissions from Fuels1. Coal Mining 10.322. Oil 0.47 0.62 16.83 7.61 8.94
C. Biomass Emissions* 48,490TOTAL EMISSIONS FROM ENERGY 47,335 94.53 2.31 298.00 3,082.00 292.00 442.00
CO2 EQUIVALENT 47,335 1,985.22 717.16TOTAL CO2 EQUIVALENT 50,038
II. INDUSTRYA. Cement 4,771 2.87B. Chemicals 0.33 0.01 0.22 1.46 9.81C. Asphalt 0.00 0.00 0.00 0.00D. Food and Beverages 16.35E. Pulp and Paper 0.12 0.44 0.29 0.56F. Metals 4,318 0.11 0.00 0.08 2.99G. Halocarbons 1,507
TOTAL EMISSIONS FROM INDUSTRY 10,596 0.33 0.00 0.24 0.66 18.18 16.22CO2 EQUIVALENT 10,596 6.95 0.00
TOTAL CO2 EQUIVALENT 10,603
III. AGRICULTUREA. Domestic Livestock 333.47 11.27B. Rice Cultivation 636.40C. Grassland Burning 0.30 0.00 0.14 7.94D. Agriculture Residue Burning 20.30 0.50 18.10 427.30E. Agricultural Soils 28.00
TOTAL EMISSIONS FROM AGRICULTURE 990.47 39.77 18.24 435.24CO2 EQUIVALENT 20,799.89 12,329.63
TOTAL CO2 EQUIVALENT 33,130
IV. WASTESA. Solid Wastes 202.53B. Domestic/Commercial Wastewater 46.02C. Industrial Wastewater 43.83D. Human Sewage 3.08
TOTAL EMISSIONS FROM WASTES 292.38 3.08CO2 EQUIVALENT 6,140.06 953.94
TOTAL CO2 EQUIVALENT 7,094
V. LAND USE CHANGE AND FORESTRYA. Change in Forest/Woody Biomass -68,323B. Forest/Land Use Change 65,549 114.41 0.79 28.43 1,001.11
TOTAL EMISSIONS FROM LUCF -2,774 114.41 0.79CO2 EQUIVALENT -2,774 2,403.00 245.00
TOTAL CO2 EQUIVALENT -126
TOTAL NAT'L GHG EMISSIONS 55,157 1,492.00 46.00 317.00 3,518.00 310.00 459.00EQUIVALENT CO2 55,581 31,335.00 14,246.00
TOTAL NAT'L EQUIVALENT CO2 EMISSIONS 100,738
Table 2.4 1994 Philippine GHG Inventory Results

29
Chapter II - 1994 National GHG Inventory
Industry
Greenhouse gas emissions for 2008 fromthe industry sector are calculated using produc-tion data from 1991 to 1995 as the baseline andextrapolated using regression methods. For eachdata set, linear trends were evaluated against an-nual production trends and the gross domesticproduct (GDP) values. The averages of these twotrending mechanisms are taken as the forecast val-ues for this sector. Table 2.6 summarizes the re-sults of the GHG projections to 2008 for cementand steel.
1994, Philippine energy activities alone emittedabout 50,038 ktons of CO2, approximately half ofthe national GHG total from the four non-LUCFsectors. The amount of CO2 that is forecast for2008 is based on the projected energy mix reportedin the Department of Energy’s Philippine EnergyPlan (PEP, 1999). On the basis of this energy mix,future national consumption of coal, oil, and natu-ral gas will emit 122,344 ktons of CO2 by 2008(Table 2.5). This is more than double the 1994CO2 emissions associated with energy.
Projections to 2008Based on Annual Based on GDP Average
Trends TrendsCement 7,665 7,399 7,532Iron and Steel 12,877 12,902 12,890Ferro-Alloys 65 92 78
Coal Oil Natural Gas TotalConsumption 56.99 195.3 28.74 281.03(MMBFOE)
CO2 Emissions 31,055 80,840 9,699 122,344(ktons)
Table 2.5 Projected Consumption of Coal, Oil and Natural Gas and the Corresponding CO2 Emissions by the Year 2000
Table 2.6 Projected CO2 Emissions From Cement and Steel Industries by the Year 2008 (in ktons).
Agriculture
For the year 2008, the Philippines is pre-dicted to have 3,451,933 hectares of irrigated ricefields and 1,232,676 hectares of rainfed rice fields.The statistics for the two types of rice ecosystemsare estimated using linear regression on existingBAS statistics on the harvested area of rice (1981-1997). Applying IRRI’s method for approximat-ing CH4 emissions from rice paddy cultivation, theprojected values correspond to a net emission of960.8 ktons of CH4 (905.1 and 55.7 ktons for ir-rigated and rain-fed, respectively). This corre-sponds to an equivalent amount of 20,177 ktonsCO2 in 2008 which is a 51% increase relative tothe 1994 value of 13,364 ktons of equivalent CO2from rice cultivation.
Land Use Change and Forestry
The LUCF sector is projected to be a netsource of 4,492 ktons CO2 by the year 2008. Thisis a noticeable increase of emissions from the –126 ktons of CO2 sequestered in 1994. The pro-jection is based on an exponential extrapolationprocedure applied to estimate land use areas forvarious years beyond the 1987-1996 range that isofficially available from the Forest ManagementBureau (FMB) statistics book. In the procedure,the progressive decrease in total forest land areasuggests a depletion rate of 2.02% per year thatagrees well with a previous study carried out bythe Asian Development Bank (ADB).
Wastes
Urban population in 1994 was estimatedby the Food and Agriculture Organization (FAO)to be 53.29% of the national population. By 2008,this fraction is estimated to increase to 68.82%.Using the projections of the National Statistics Of-fice (NSO) of 88.72 million people by 2008, [1995
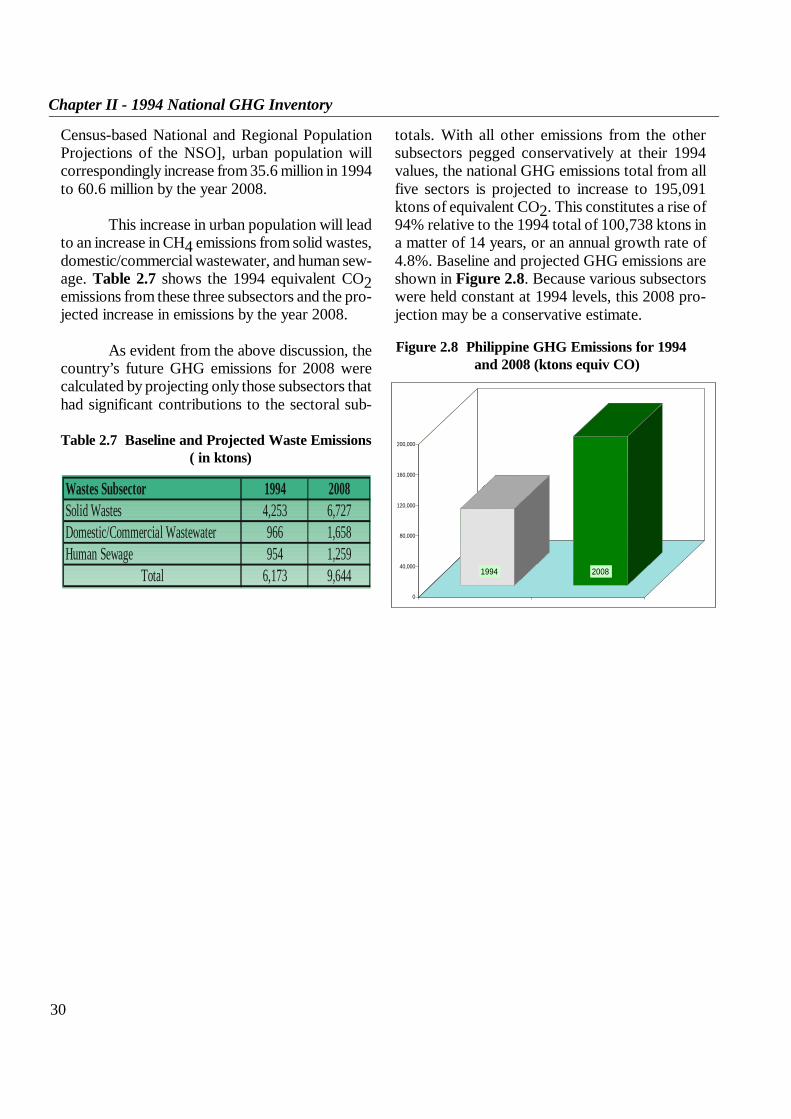
30
Chapter II - 1994 National GHG Inventory
Census-based National and Regional PopulationProjections of the NSO], urban population willcorrespondingly increase from 35.6 million in 1994to 60.6 million by the year 2008.
This increase in urban population will leadto an increase in CH4 emissions from solid wastes,domestic/commercial wastewater, and human sew-age. Table 2.7 shows the 1994 equivalent CO2emissions from these three subsectors and the pro-jected increase in emissions by the year 2008.
As evident from the above discussion, thecountry’s future GHG emissions for 2008 werecalculated by projecting only those subsectors thathad significant contributions to the sectoral sub-
Figure 2.8 Philippine GHG Emissions for 1994 and 2008 (ktons equiv CO)
0
40,000
80,000
120,000
160,000
200,000
1994 2008
Wastes Subsector 1994 2008Solid Wastes 4,253 6,727Domestic/Commercial Wastewater 966 1,658Human Sewage 954 1,259
Total 6,173 9,644
Table 2.7 Baseline and Projected Waste Emissions ( in ktons)
totals. With all other emissions from the othersubsectors pegged conservatively at their 1994values, the national GHG emissions total from allfive sectors is projected to increase to 195,091ktons of equivalent CO2. This constitutes a rise of94% relative to the 1994 total of 100,738 ktons ina matter of 14 years, or an annual growth rate of4.8%. Baseline and projected GHG emissions areshown in Figure 2.8. Because various subsectorswere held constant at 1994 levels, this 2008 pro-jection may be a conservative estimate.

31
Chapter III - General Description of Steps
The Philippine Strategy for SustainableDevelopment (PSSD) and PA 21
The Philippines was among the firstcountries to embrace the sustainable develop-ment paradigm, adopting the Philippine Strat-egy for Sustainable Development (PSSD) in1989. The PSSD comprises of a ten-prongedstrategy, as follows:
a. Integration of environmental consider-ation in decision-making;
b. Proper pricing of natural resourcesc. Property rights reformd. Conservation of biodiversitye. Rehabilitation of degraded ecosystem(s)f. Strengthening of residuals managementg. Control of population growth and human
resources developmenth. Inducing growth in rural areasi. Promotion of environmental educationj. Strengthening citizens’ participation
Chapter III
he Philippines has started to undertake and is planning to implement a numberof measures to fulfill its commitments as a country Party to the Convention. Theseinclude undertakings related to its pursuit of sustainable development, research andsystematic observation, awareness raising, education and training, adaptation measuresand capacity building, among others.
Pursuant to the PSSD, the PhilippineAgenda 21, which serves as the blueprint for thecountry’s sustainable development efforts, wascompleted in September, 1996. It “envisions abetter quality of life for all, the development of ajust, moral, creative, spiritual, economically vi-brant, caring, diverse yet cohesive society charac-terized by appropriate productivity, participatoryand democratic processes and living in harmonywithin the limits of the carrying capacity of na-ture and the integrity of creation.”
The PA 21 is anchored on the following prin-ciples:
1. Primacy of developing the full human po-tential, which puts people at the center ofthe development focus.
2. Holistic science and appropriate technol-ogy, which promotes the use of holisticrather than reductionist science in findingsolutions to development problems.
T
Sustainable Development Programs
GENERAL DESCRIPTION OF STEPS

32
Chapter III - General Description of Steps
3. Cultural, moral and spiritual sensitivitywhich encourages the nurturing of localand indigenous knowledge and respect forthe diversity of culture, moral standardsand spiritual nature of the Filipino soci-ety.
4. Self determination, which advocates re-spect for the rights and capability of peopleto decide on their development course.
5. National sovereignty.
6. Gender sensitivity.
7. Peace, order, and national unity.
8. Social justice, inter- and intra-generational,as well as, spatial equity.
9. Participatory democracy.10. Institutional viability.
11. Viable, sound and broad-based economicdevelopment.
12. Sustainable population.
13. Ecological soundness.
14. Bio-geographical equity and community-based resource management.
The PA 21 likewise details the initiativesneeded to shift to sustainable development. Theseinclude creating the enabling conditions for sus-tainable development, implementing actions forthe country’s various ecosystems, and actions forcritical resources.
The entity which coordinated the prepara-tion of the PA 21 and will oversee its implemen-tation is the Philippine Council for Sustainable De-velopment (PCSD) which embodies the partner-ship of government with the non-government or-ganizations.
The PCSD is chaired by the Director-Gen-eral of the National Economic and DevelopmentAuthority (NEDA), and vice-chaired by the Sec-retary of the Department of Environment andNatural Resources (DENR). Some 14 governmentdepartments and seven (7) non-government/people’s organizations are members of the Coun-cil. A composite secretariat serves the PCSD, com-prising of the NEDA, DENR, and the NGO group.For the last, the Civil Society Counterpart on Sus-tainable Development (CSCSD) serves as theNGO counterpart secretariat to the PCSD.
The PCSD operates through its four com-mittees, and their respective sub-committees. TheCommittees correspond to the major chapter con-cerns of the Global Agenda 21. Figure 3.1 de-picts the structure of the Council.
Systematic Observation andResearch
Data Collection and SystematicObservations
The Philippines has a number of networkobservation stations currently operated and main-tained by the Philippine Atmospheric, Geophysi-cal and Astronomical Services Administration(PAGASA). These are:
Synoptic Stations Network
Synoptic stations are the basic stations ob-serving the weather elements at the surface. Fig-ure 3.2 shows the location(s) of the present syn-optic stations (44), the proposed automatic weatherstations (AWSs) and data collection platforms(DCPs) (5) throughout the country. While this syn-optic network of stations seem adequate for large-scale weather systems, around fifteen (15) moreAWSs and DCPs are expected to be commissioned

33
Chapter III - General Description of Steps
FIGURE 3.1 ORGANIZATIONAL STRUCTURE OF THE PCSD
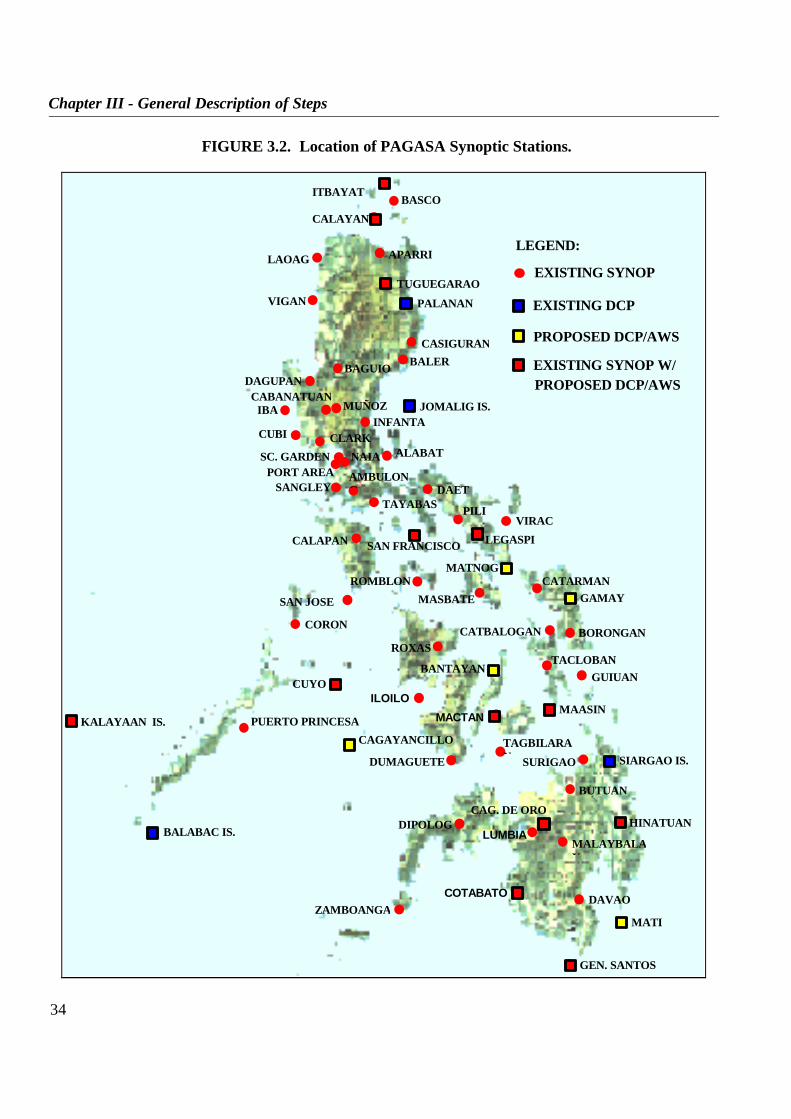
34
Chapter III - General Description of Steps
ITBAYATBASCO
CALAYAN
LAOAG APARRI
TUGUEGARAOVIGAN
CASIGURAN
INFANTA
BAGUIODAGUPAN
IBA
CLARK
CABANATUAN
CUBI
ALABATNAIASC. GARDENPORT AREA
SANGLEY DAET
VIRACPILI
LEGASPI
CATARMAN
BORONGAN
GUIUANTACLOBAN
MAASINMACTAN
DUMAGUETE
TAGBILARAN SURIGAO
HINATUAN
DAVAO
GEN. SANTOS
ZAMBOANGACOTABATO
DIPOLOGCAG. DE ORO
LUMBIAMALAYBALAY
BUTUAN
PUERTO PRINCESA
CUYO
CORON
SAN JOSE MASBATEROMBLON
SAN FRANCISCOCALAPAN
BALABAC IS.
AMBULONG
TAYABAS
MUÑOZ
BALER
ROXAS
ILOILO
CATBALOGAN
JOMALIG IS.
SIARGAO IS.
EXISTING DCP
EXISTING SYNOP
LEGEND:
MATI
CAGAYANCILLO
BANTAYAN
GAMAY
PALANAN
KALAYAAN IS.
PROPOSED DCP/AWS
MATNOG
EXISTING SYNOP W/PROPOSED DCP/AWS
FIGURE 3.2. Location of PAGASA Synoptic Stations.

35
Chapter III - General Description of Steps
to fill data gaps in very remote areas and as aninitial step towards the automation of weatherobservations, eventually leading to the reductionof manpower services.
Upper-Air Stations Network
Upper-air stations observe basic weatherelements aloft and those to define the verticalstructure of the atmosphere, normally advanta-geous for aviation safety and economy, as well as,for the improvement of weather analyses, fore-casting and warning capabilities. Upper-air obser-vation data on pressure, temperature, humidity andwind are also essential inputs for ocean-atmo-sphere interaction studies and research activities.Figure 3.3 depicts the present upper-air stations(4) and the proposed rawinsonde (3) and radiowind(5) stations. The rawinsonde station will use a dis-posable weather sensor with electronic transmit-ter brought up by a meteorological balloon, send-ing weather information at different levels of theatmosphere to a ground receiver facility. The data
generated will give a 3-dimensional descriptionof the weather conditions of the upper atmosphereand are essential in the analysis and forecastingof the present and future development and move-
ment of weather systems. This will replace the oldpilot balloon method, wherein an optical theodo-lite (telescope) is used to determine positions of ameteorological balloon as it rises to the atmo-sphere. However, this method obviously has a bigdisadvantage in a cloudy/hazy environment andis non-functional during typhoons and other se-vere weather conditions, when upper-air data areneeded most.
Hydrometeorological/FloodForecasting/Storm Surge Stations
Flood forecasting is only currently beingdone in four major river basins in Luzon, namelyAgno, Bicol, Cagayan and Pampanga. The goal,however, is to reach-out to all people living in orclose to flood plain areas. Fifteen to twenty (15-20) additional automatic stations are projected tobe put on-line, strategically located in three (3)major rivers in Mindanao, namely: Agusan,Mindanao (Cotabato) and Davao; and in PanayIsland and Samar.
In addition, while a fewstorm surge-monitoring stationsare in-place, most of them are stillin the research mode. Stormsurge forecasting is relativelynew in the PAGASA. To shiftthese into full operational mode,automatic-gauging stations willhave to be established (Figure3.4).
Agrometeorological/Climatological StationsNetwork
In agrometeorological(AGROMET) stations,
observations are made of the various weatherelements essential to crop-weather relationshipstudies that aim to help farmers and farm operatorsdetermine the best crops suited to the locality and
Meteorological balloon with electronic transmitter that sends weatherinformation at different levels of the atmosphere.

36
Chapter III - General Description of Steps
TANAY
MACTAN
RAWINSONDE STATION(S)(PROPOSED)
PUERTO PRINCESA
RAWINSONDE STATION(S)(OPERATIONAL)
DAVAO
RADIOWIND STATION(S)(PROPOSED)
BAGUIO
LAOAG
BASCOLEGEND:
LEGASPI
BORONGANCORON
SURIGAO
ZAMBOANGA
FIGURE 3.3. Location of PAGASA Upper-Air Observation Stations

37
Chapter III - General Description of Steps
FIGURE 3.4 Location of Storm Surge Monitoring Stations (SSMS) and Ocean Buoys.
BASCO
BALER
SAN VICENTE
PROPOSED SSMS
TINAMBAC
ORANI
INFANTA
BASEY
SOGOD
TANDAG
LEGEND:
EXISTING
HERNANI
PARACALE
CATARMAN
PROPOSED OCEANBUOY(S)
ABUYOG
SURIGAO
TABLAS STRAIT
BOHOL SEA
CARMEN
CURRIMAO
DAGUPAN
MASBATE
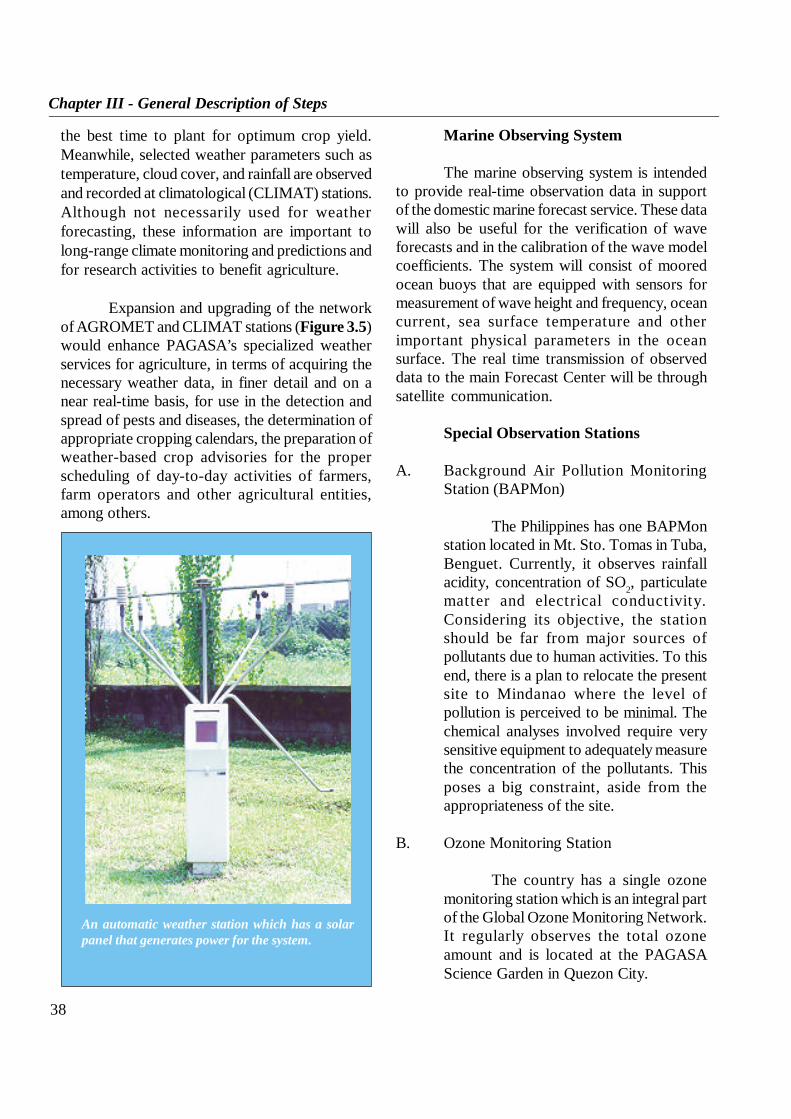
38
Chapter III - General Description of Steps
Marine Observing System
The marine observing system is intendedto provide real-time observation data in supportof the domestic marine forecast service. These datawill also be useful for the verification of waveforecasts and in the calibration of the wave modelcoefficients. The system will consist of mooredocean buoys that are equipped with sensors formeasurement of wave height and frequency, oceancurrent, sea surface temperature and otherimportant physical parameters in the oceansurface. The real time transmission of observeddata to the main Forecast Center will be throughsatellite communication.
Special Observation Stations
A. Background Air Pollution MonitoringStation (BAPMon)
The Philippines has one BAPMonstation located in Mt. Sto. Tomas in Tuba,Benguet. Currently, it observes rainfallacidity, concentration of SO2, particulatematter and electrical conductivity.Considering its objective, the stationshould be far from major sources ofpollutants due to human activities. To thisend, there is a plan to relocate the presentsite to Mindanao where the level ofpollution is perceived to be minimal. Thechemical analyses involved require verysensitive equipment to adequately measurethe concentration of the pollutants. Thisposes a big constraint, aside from theappropriateness of the site.
B. Ozone Monitoring Station
The country has a single ozonemonitoring station which is an integral partof the Global Ozone Monitoring Network.It regularly observes the total ozoneamount and is located at the PAGASAScience Garden in Quezon City.
the best time to plant for optimum crop yield.Meanwhile, selected weather parameters such astemperature, cloud cover, and rainfall are observedand recorded at climatological (CLIMAT) stations.Although not necessarily used for weatherforecasting, these information are important tolong-range climate monitoring and predictions andfor research activities to benefit agriculture.
Expansion and upgrading of the networkof AGROMET and CLIMAT stations (Figure 3.5)would enhance PAGASA’s specialized weatherservices for agriculture, in terms of acquiring thenecessary weather data, in finer detail and on anear real-time basis, for use in the detection andspread of pests and diseases, the determination ofappropriate cropping calendars, the preparation ofweather-based crop advisories for the properscheduling of day-to-day activities of farmers,farm operators and other agricultural entities,among others.
An automatic weather station which has a solarpanel that generates power for the system.

39
Chapter III - General Description of Steps
BASCO
MMSU BATACTUGUEGARAO
NVSIT BAYOMBONG
TCA TARLAC
SCIENCE GARDENQUEZON CITY
CSSAC PILI
UEP, CATARMAN
VISCA BAYBAY
LA GRANJA
BAGO OSHIRO
GEN. SANTOS
COTABATO
BUTUAN
PNAC ABORLAN
UP LOS BAÑOS
TAGAYTAY
PSPC, MAMBUSAO
PROPOSED
EXISTING
LEGEND:
ISU ECHAGUE
DMMMSU BACNOTAN
CLSU MUÑOZ
BUCA GUINOBATAN
USM KBACAN
TRRC TAGUM
CMU MUSUANMSU MARAWI
BAGUIO (LA TRINIDAD)
BASEY
NAUJAN
Figure 3.5 Location of PAGASA Agro-meteorological Stations
40
Chapter III - General Description of Steps
2. Crop Yield Information in Selected Areas3. Development of an Operational Agrometeoro-
logical Crop Monitoring and Weather-basedCrop Production Forecasting
4. Feasibility Study on the Use of PassiveSamplers for Background Monitoring of Gases
5. Vegetation and Soil Moisture Index Mappingusing AATSR, ASAR and MWR Data fromENVISAT
6. Bio-climatic Mapping of the Philippines
Education, Trainingand Public Awareness
Pursuant to Article 6 of the UNFCCC,country Parties have the responsibility to informtheir people about climate change and its impacts.
Even prior to the adoption of the UNFCCCat the Earth Summit in Rio, in 1992, thePhilippines has already been undertakinginformation dissemination on the climate changeissue.
The results of the ADB funded RegionalStudy on Global Environmental Issues whichgenerated a rapid assessment of the Philippines’vulnerability to climate change initially served asthe basis for alerting the general population to thepossible impacts of climate change in the country.
The Philippine Network on ClimateChange (PNCC), as a member of the ClimateAction Network of Southeast Asia (CANSEA) andthe Earth Savers’ Movement, were among the firstgroups to actively undertake informationcampaign(s) about the climate change issue andthe climate negotiations.
The executive branch of government, aspart of its mandate to continually inform andeducate the public about environmental issues likeclimate change, has come up with a National
Researches
The Philippines has many researcheswhich could be considered climate-related. Amongthe main ones are:
Finished Researches
1. Epidemiological Study for Metro ManilaUsing Climatic Variability
2. Country Study to Address Climate ChangeIssues and Concernsl GHG emissions inventoryl Vulnerability assessments and adaptation
analysis on water resources, coastalresources and agriculture
l Mitigation activities to reduce GHGemissions
3. An Investigation on Systems Responses to SeaLevel Changes of Some Selected Locations inthe Philippines
On-Going Researches
1. Development of a Climate Information,Monitoring and Prediction System (CLIMPS),being undertaken by PAGASA incollaboration with the Department ofAgriculture (DA) and the Department ofEnvironmental and Natural Resources(DENR). It will have the capability to predictand issue with sufficient lead-time, advisorieson extreme climate events such as duringepisodes of El Niño and La Niña, as well as,seasonal to inter-annual climate forecasts.
2. Climatological Study on the Changes in theTropical Cyclone Intensity in the PhilippineArea of Responsibility
Future Researches
1. Forecasting of the UV Index in Four RegionalStations of the Philippines
41
Chapter III - General Description of Steps
in-depth discussions among stakeholders onclimate mitigation and adaptation. Several regionaland national consultations were conducted. Also,focused sectoral group discussions and meetingswere conducted to further level off on theunderstanding of and generate consensus on thecountry’s response to the challenge of theUNFCCC.
The NAP process was also a means ofraising awareness on climate change at the locallevel, especially among the local governmentexecutives and non-government organizations.
Training/Workshops on LocalAction Planning on Climate Change
Under the Enabling Activity Project,public consultations continued and even expanded.These consultations were intended to raise theawareness level of various sectors on the threatsof climate change impacts and the differentmitigation and adaptation strategies.
A number of training/workshops on “LocalAction Planning on Climate Change” werelikewise organized by the Institute for Climate,Energy and the Environment (ICEE) still underthe Enabling Activity Project in selected provincesin the country with the local government units andother stakeholders as participants. Areas coveredwere those at high risk from climate change likesea level rise and its subsequent coastaldegradation/inundation. The activity aimed notonly to create awareness among the variousstakeholders in the area but also to provide thenecessary guidance in the formulation of localaction plans on climate change. Most of theparticipants were planning officers from theprovincial, city, and municipal governments,environment and natural resources officers andrepresentatives from the NGOs, academe and thebusiness sectors.
Strategy for Environmental Education (NSEE)which later evolved into the NationalEnvironmental Education Action Plan (NEEAP).Through the Environmental Management Bureauof the DENR and guided by the Strategy and theNEEAP, information dissemination and educationactivities were undertaken such as:
· Publication and dissemination of postercalendar(s) on climate change and globalwarming.
· Organization and conduct of symposia,focused group consultation andworkshops. These were attended byrepresentatives from the government andnon-government organizations, privatesector and the academe.
· Conduct of exhibits on climate change.
Even the legislative branch was active inraising awareness on the climate change issue. TheSenate Committee on Environment, chaired bythen Senator Heherson T. Alvarez, who alsofounded the EarthSavers Movement in 1989, co-sponsored a series of Asia Pacific and nationalconferences to popularize and place ClimateChange and its adverse impacts on the nationalagenda. These are: the 1st Asia Pacific Conferenceon Climate Change in the House ofRepresentatives with UNESCO and UNDP in1992; the Global Youth EarthSaving Summit withthe House of Representatives in 1993; the AsiaPacific Leaders Ministerial Conference withMalacañang and East Asia PacificParliamentarians Committee on Environment andDevelopment in 1995; and, the NationalConference on El Niño and La Niña in the NationalLibrary with the Presidential Task Force on ElNiño and La Niña in 1997.
The preparation of the National ActionPlan (NAP) on Climate Change likewise servedas an opportunity for awareness raising and more

42
Chapter III - General Description of Steps
its operations in June 1999 and is housed in theManila Observatory at the Ateneo de ManilaUniversity. The CCIC is symbolic of thegovernment, academe, NGOs and international(USAID) partnership and is a testament of theacademe’s commitment to the climate changeissues.
The CCIC has a collection of books onclimate change, as well as, atmospheric scienceand pollution. Access to compact discs and variousmulti-media including videotapes on the varioustopics of climate change is possible. It also carriesthe current contents on CD. The CCIC is accessible24 hours through the internet, e-mail, fax, and anelectronic bulletin board.
The Buhay Recognition Awardsfor Greenhouse Gases Abatement
The Buhay Awards is part of the country’sinitiatives to promote and recognize voluntaryefforts on GHG mitigation. The Buhay Awards forgreenhouse gases abatement were presented forthe first time in 1998. The Awards process intendsto recognize individuals, companies, otherinstitutions and groups that have undertaken
Promotion of Energy Efficiencyand Conservation
To promote energy efficiency andconservation, the Department of Energy hasundertaken a number of information campaigns,as follows:
· The Power Patrol Program is an energyinformation awareness and educationprogram covering the residential,industrial, commercial and educationsectors. It promotes efficiency in theelectricity and gasoline fuel use of thesesectors through the tri-media. Thecampaign has reached approximately 1million households so far.
· The Road Transport Patrol Program waslaunched on 17 April 1998 focusing oninformation dissemination regardingproper operation and maintenancepractices to reduce fuel consumption. Theprogram is expected to contribute to thereduction in oil importation andenvironmental emissions as a result of thereduction in fuel consumption in thetransport sector.
Climate ChangeInformation Center
In a bid to better positionitself to receive internationalinformation on climate change andclimate friendly technologies andto disseminate these system-atically to local stakeholders, theClimate Change InformationCenter (CCIC) was established.
The Philippine ClimateChange Information Center began
President Joseph E. Estrada poses with the Buhay Awardees. At thebackground (from left to right) are: DENR Sec. Antonio Cerilles, DOESec. Mario Tiaoqui and Executive Sec. Ronaldo Zamora
43
Chapter III - General Description of Steps
and is raising awareness, as well as, training localgovernment units and other stakeholders on localaction planning on climate change.
Climate Awareness Survey
The Philippines, in April 1998, through theInter-Agency Committee on Climate ChangeSecretariat, conducted a survey on climateawareness in the various sectors. The survey wasdone in collaboration with and with support fromthe United Nations Environment Programme(UNEP). The main aim of the survey is to assessthe levels of awareness of leaders/representativesof various sectors of society which include thebusiness sector, government, media, NGOs andthe academe. The results of the survey will beused to develop a country program that wouldaddress the gaps and constraints in raising theawareness of the populace on climate change.
Vulnerability Assessment
Climate is expected to continue to changein the future. Warmer temperatures will lead to anumber of impacts both on man and environment,including agricultural resources. A more vigoroushydrological cycle will translate to prospects ofmore severe droughts/floods in some places andless severe climatic events in others. On the onehand, the increase in rainfall intensity suggest pos-sibilities for more extreme rainfall events. On theother hand, changes in rainfall distribution and in-creases in evapotranspiration could increase theprobability, intensity and duration of drought incurrently drought-prone areas. And, more impor-tantly, frequent occurrence of drought episodescould damage drainage and irrigation systemswhich will certainly affect agricultural productionin terms of reduced yield. The Philippines, beingan archipelagic country with a prevailing tropical
significant voluntary efforts to reduce generationof greenhouse gases in the Philippines. The awardsseek to promote the concept of voluntary energyefficiency and other greenhouse gas abatementmeasures that are beneficial both to business andthe environment. Such also aim to promoteincreased investments in greenhouse gasabatement technologies such as energy efficiency,clean technologies, renewable energy and demand-side management. There were about fifteen (15)recipients of the Buhay awards in 1998. Thesewere companies from various industrial sectorsthat have initiated successful efforts to achieveenergy efficiency, which is recognized as aneffective means of reducing greenhouse gases.
Contributions from Non-GovernmentOrganizations (NGOs)
The non-government organizations play animportant role in raising public awareness. Aspreviously cited, they were among the first onesto raise public awareness on the global warmingproblem. They continue to play an active andpivotal role not only in increasing the generalpublic’s knowledge about this issue but in shapinggovernment policies and positions.
The Philippine Network on ClimateChange, an umbrella organization of some eight(8) national environmental NGOs, is involved inseveral information dissemination activities inschools, regularly organizing workshops to raiseawareness on climate change issues amongstudents and teachers. It is also continuouslyproducing multimedia materials like brochures, t-shirts and documentary films on climate change.
Under the Philippine Climate ChangeProgram Development, the Foundation for thePhilippine Environment (FPE), in coordinationwith the Institute for Climate, Energy andEnvironment (ICEE), has produced IEC materials

44
Chapter III - General Description of Steps
Projected Impacts
Temperature and Rainfall
For a 2 x CO2 scenario, the general circu-lation models predict an average increase of 2 to3°C in annual temperature. Major impact areasinclude eastern Mindanao, portions of Samar,Quezon, western Luzon, Metro Manila, and otherhighly urbanized areas.
Based on the outputs of the GCMs, rain-fall is likewise expected to increase in many ar-eas of the country. A 60 to 100 percent increasein annual rainfall is projected in the CentralVisayas and Southern Tagalog provinces, includ-ing Metro Manila. An increase of 50 percent orless is predicted in the other areas of Luzon,Samar, and the central and western parts ofMindanao. However, for other sections of thecountry such as northern and eastern Mindanaoand parts of western Luzon, a decrease in annualrainfall is expected. These predictions imply dra-matic changes in spatial and temporal distribu-tion of rainfall, which could have significant im-pacts on the country’s water resources.
Temperature change and rainfall ratios ofthe water resources regions of the Philippinesbased on the Canadian model are given in Table3.1.
Based on this table, a 2 to 3°C increase inannual temperature in most water resources re-gions of the country is to be expected. Regions Iand II will have an increase of less than 2°C whilea significant change in the annual temperature willbe expected in Eastern Mindanao. The expectedincrease in temperature will surely have an effecton the expected domestic consumption althougha quantitative analysis has yet to be undertaken.The water requirement of the agricultural sector
climate, would be highly vulnerable to the impactsof climate change.
To prepare the country for the onset of cli-mate change, the Philippines started to prepare aNational Action Plan (NAP) on Climate Changein 1997. Consolidation of vulnerability studies ear-lier conducted was done under the NAP process.The results of some of the studies used for pur-poses of producing the NAP are presented here toprovide a picture of the vulnerability of some sec-tors and ecosystems to climate change.
Simulation Models Used
To assess the potential impacts of climatechange on the country, predictive models of theclimate system were employed.
Spatial and temporal variations in tempera-ture and rainfall due to the doubling of carbon di-oxide were derived using the simulation resultsof four general circulation models (GCMs)namely; the Canadian Climate Center Model(CCCM), the United Kingdom MeteorologicalOffice Model (UKMO), the Geophysical FluidsDynamic Laboratory Model (GFDL). TheGoddard Institute for Space Studies (GISS) Modelwas also used as an additional model for the agri-culture sector.
In selecting the appropriate GCMs, esti-mates of precipitation and temperature under 1 xCO2 (present condition) from these models werecompared with existing climatic normals. Com-parisons were based on large-scale temporal andspatial distribution of precipitation and tempera-ture. Results of comparisons show that the UKMO,GFDL, and CCC models all provide good esti-mates of the present condition of the region. How-ever, only the outputs from the Canadian ClimateCenter Model were used as the basis for climatechange scenarios.

45
Chapter III - General Description of Steps
Agriculture
Vulnerability of selected crops (rice andcorn) to the impacts of climate change were com-paratively assessed using the results from four glo-bal circulation models (GCM), in tandem with thefollowing crop models: the Crop-Environment Re-source Synthesis (CERES)-Rice and Corn Mod-els of the Decision Support System forAgrotechnology Transfer (DSSAT) version 3, themodified version of the CERES-Rice InternationalBenchmark Sites Network for AgrotechnologyTransfer (IBSNAT Crop Model), the ORYZA 1rice model and the Simulation Model for Rice-Weather relations (SIMRIW) model. The list ofthe six study sites, the four GCM models used inthe crop-growth simulations, change in yield andmaturity period of crops in all six sites are shownin Tables 3.2 and 3.3.
A. The Philippine Country Study on Six Ma-jor Rice and Corn Growing Areas of thePhilippines.
will likewise be impacted due to increased cropactivity brought about by enhanced solar radia-tion. Global warming will also have an impact onthe industrial use of water. Soil degradation, pol-lution and other environmental degradation areprojected to be enhanced by the expected tempera-ture increase. Increase in temperature will also af-fect water quality in some of the reservoirs andlakes due to enhanced growth of algae which coulddegrade water quality.
Rainfall analysis showed that annual rain-fall total is expected to double in some water re-sources regions such as Central Luzon, SouthernTagalog, and all regions in the Visayas. For otherregions like northern and eastern Mindanao, a de-crease in the annual rainfall can be expected. Thesechanges in rainfall patterns will likewise affect theavailability of water resources in the country. Oc-currence of intense rainfall, particularly over de-nuded watersheds, will aggravate the soil erosionproblem. Flooding due to the passage of tropicalcyclones is a likely scene due to the inability ofexisting reservoirs, that serve as flood controls, tocontain water from the accumulated rains.
Name of Water Resource Temperature Rainfall RatioRegions Change (oC)
I Ilocos <2 1.0-1.5II Cagayan Valley <2 1.0-1.5III Central Luzon 2-3 1.0-2.0IV Southern Tagalog 2-3 1.6-2.0V Bicol 2-3 1.0-1.5VI Western Visayas 2-3 1.6-2.0VII Central Visayas 2-3 1.6-2.0VIII Eastern Visayas 2-3 1.0-2.0IX Western Mindanao 2-3 1.0-1.5X Northern Mindanao 2-3 <1.0-1.5XI Eastern Mindanao >3 <1.0XII Southern Mindanao 2-3 1.0-1.5
Table 3.1 Temperature Change and Rainfall Ratio by Water Resource Region Based on the Canadian Climate Center Model (2 x CO2 Scenario)
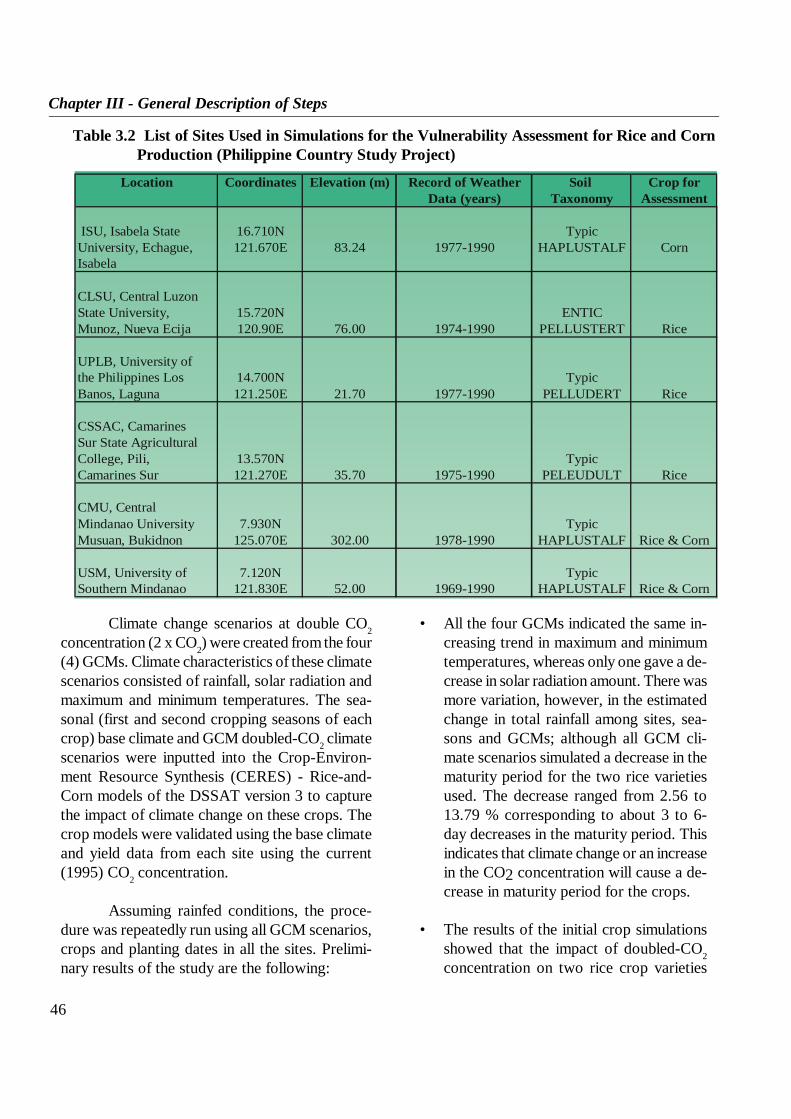
46
Chapter III - General Description of Steps
Climate change scenarios at double CO2concentration (2 x CO2) were created from the four(4) GCMs. Climate characteristics of these climatescenarios consisted of rainfall, solar radiation andmaximum and minimum temperatures. The sea-sonal (first and second cropping seasons of eachcrop) base climate and GCM doubled-CO2 climatescenarios were inputted into the Crop-Environ-ment Resource Synthesis (CERES) - Rice-and-Corn models of the DSSAT version 3 to capturethe impact of climate change on these crops. Thecrop models were validated using the base climateand yield data from each site using the current(1995) CO2 concentration.
Assuming rainfed conditions, the proce-dure was repeatedly run using all GCM scenarios,crops and planting dates in all the sites. Prelimi-nary results of the study are the following:
• All the four GCMs indicated the same in-creasing trend in maximum and minimumtemperatures, whereas only one gave a de-crease in solar radiation amount. There wasmore variation, however, in the estimatedchange in total rainfall among sites, sea-sons and GCMs; although all GCM cli-mate scenarios simulated a decrease in thematurity period for the two rice varietiesused. The decrease ranged from 2.56 to13.79 % corresponding to about 3 to 6-day decreases in the maturity period. Thisindicates that climate change or an increasein the CO2 concentration will cause a de-crease in maturity period for the crops.
• The results of the initial crop simulationsshowed that the impact of doubled-CO2concentration on two rice crop varieties
Location Coordinates Elevation (m) Record of Weather Soil Crop forData (years) Taxonomy Assessment
ISU, Isabela State 16.710N TypicUniversity, Echague, 121.670E 83.24 1977-1990 HAPLUSTALF CornIsabela
CLSU, Central LuzonState University, 15.720N ENTICMunoz, Nueva Ecija 120.90E 76.00 1974-1990 PELLUSTERT Rice
UPLB, University ofthe Philippines Los 14.700N TypicBanos, Laguna 121.250E 21.70 1977-1990 PELLUDERT Rice
CSSAC, CamarinesSur State AgriculturalCollege, Pili, 13.570N TypicCamarines Sur 121.270E 35.70 1975-1990 PELEUDULT Rice
CMU, CentralMindanao University 7.930N TypicMusuan, Bukidnon 125.070E 302.00 1978-1990 HAPLUSTALF Rice & Corn
USM, University of 7.120N TypicSouthern Mindanao 121.830E 52.00 1969-1990 HAPLUSTALF Rice & Corn
Table 3.2 List of Sites Used in Simulations for the Vulnerability Assessment for Rice and Corn Production (Philippine Country Study Project)

47
Chapter III - General Description of Steps
varied. For rice, the simulations showedgenerally positive increases in yield, ex-cept in the case where the GISS scenarioswere used. Under the Canadian ClimateCenter Model (CCCM) climate scenarios,simulated yield at 2 x CO2 show average
increases of 3.15 % and 5.38 % for the firstand second crops, respectively, of the IR64 variety; and average increases of 2.02% and 3.18 % for the first and second cropsof IR 72. The results for the sweet and PS3228 corn crops showed a decrease in yield
Study Sites Yield Change in yield (%)Rice Cropping Base
Varieties Season (1 ha-1) CCCM GFDL GISS UKMOA. RiceCLSU IR 64 First 4.76 3.78 6.09 2.73 4.2
Second 3.02 7.28 1.99 7.28 -5.63IR 72 First 3.86 1.55 3.63 -6.73 0.26
Second 2.82 0 -2.84 4.26 -10.28
UPLB IR 64 First 4.71 7.64 11.46 9.13 -12.1Second 4.42 3.85 8.6 -13.12 -6.56
IR 72 First 3.51 6.27 11.4 9.67 -21.65Second 4.61 1.95 6.72 -13.67 -7.38
CSSAC IR 64 First 5.14 3.89 8.37 -22.37 4.47Second 4.23 4.49 8.51 -13.95 -9.46
IR 72 First 3.46 1.73 7.8 -27.17 -0.058Second 4.3 3.02 6.51 -14.19 -9.77
CMU IR 64 First 5.22 1.92 1.53 1.92 -6.51Second 3.81 11.29 18.11 7.61 5.25
IR 72 First 4.5 7.56 6.89 2.44 -4.44Second 3.63 12.95 16.53 6.34 3.03
USM IR 64 First 4 -1.5 10.5 -84 10.25Second 5.2 0 23.27 -12.31 16.73
IR 72 First 3.28 -7.01 14.02 -85.06 10.37Second 4.97 -2.01 20.72 -16.5 15.29
B. ComISU P3228 First 6.73 -11.41 -8.62 -13.08 -5.79
Second 5.71 -3.68 0.35 -11.21 -2.98SWEET First 5.63 -10.48 -8.88 -11.37 -6.75
Second 4.91 -7.94 -4.68 -17.72 -9.16
CMU P3228 First 9.54 -11.43 -8.39 -13.1 -12.68Second 7.96 -1.38 4.65 -7.16 2.67
SWEET First 8.49 -11.66 -8.95 -12.25 -12.37Second 7.42 -8.36 -1.75 -15.09 -2.02
USM P3228 First 7.14 -15.27 -17.93 -17.79 -14.57Second 6.94 -16.14 -16.14 -17.29 -8.07
SWEET First 5.99 -15.86 -22.87 -18.36 -15.86Second 5.61 -18.18 -18.72 -18.18 -6.6
Table 3.3 Change in Yield and Maturity Period for Selected Climate Scenarios (IV and A Assessment for Rice and Corn Production)

48
Chapter III - General Description of Steps
under all climate change scenarios. For theCCCM scenarios, average decreases of12.64 % and 7.07 % for the first and sec-ond crops for the PS 3228 variety, respec-tively, were indicated. Average decreasesof 19.0 % and 11.49 % for the first andsecond crops of sweet corn, were alsonoted.
The differences in responses between riceand corn in the simulations could be accountedby the fact that:
a) rice, being a C3 plant would respond tothe direct effects of CO2 both in photo-synthetic carbon assimilation and in regu-lating the gaseous exchange of CO2 andwater vapor through the stomata, therebycontributing to the estimate of mixed im-pacts on rice yields since it is possible thatthe crop would grow more leaves but won’tincrease grain yield; and
b) corn, being a C4 plant would not respondpositively to the direct effects of CO2 butwould be more affected by the increase inair temperature which would enhance res-piration and shorten the maturity period,thereby decreasing the yield (WMO Tech-nical Note No. 196, Buan 1995).
B. Parallel Studies on Potential Impacts of Cli-mate Change on Rice and Corn Production.
1. An earlier parallel study done by L.V. Buendiaat the International Rice Research Instituteusing the GCM climate change scenarios anda modified version of the CERES-Rice Inter-national Benchmark Sites Network forAgrotechnology Transfer or IBSNAT CropModel gave interesting results. Under a sce-nario of climate change (increase in tempera-ture) alone, there is an average reduction of22% in rice baseline yield. However, under thesame climate change with physiological effects
(or greenhouse gas-driven), an increase inbaseline yield of 1% was obtained.
2. On the other hand, results of studies done byCenteno et. al. (published in 1995) to simu-late effects of climate change on rice produc-tion in the country making use of two process-based rice production models namely, theORYZA 1 and the Simulation Model for Rice-Weather Relations (SIMRIW), indicate thatoverall, the national rice production in the Phil-ippines would change by +6.6 %, -14.0 % and+1.1 % for the GFDL, GISS, and UKMOdoubled – CO2 scenarios, respectively. Table3.4 shows the details of the estimated changesin rice production for the whole country. Mostof the changes reflect the effect of the scenarioson the wet-season rice production which pres-ently contributes an average of 80 % in theannual production. Results of the simulationsfor the production during the dry and transi-tion seasons, however, showed some dramaticincreases in yield.
The decline in yield under the GISS scenarioare due to higher temperatures predicted bythe model which would significantly reducespikelet fertility. The modelers further indi-cated that a warmer climate might allow a thirdrice crop in relatively cooler regions of thecountry.
3. To consider the impacts of projected increasein mean temperature and CO2 concentration,the results of a comprehensive study done bya team of experts at IRRI (Ingram et al, 1995)on effects of high temperatures and increasedCO2 concentrations on crop production indi-cate that overall rice production could still re-spond positively to the projected changes bothin temperature and CO2 concentrations, al-though corn may be adversely affected.
4. Studies on responses to high temperatures in-dicate that once threshold values are exceeded,rice crops will be adversely affected.
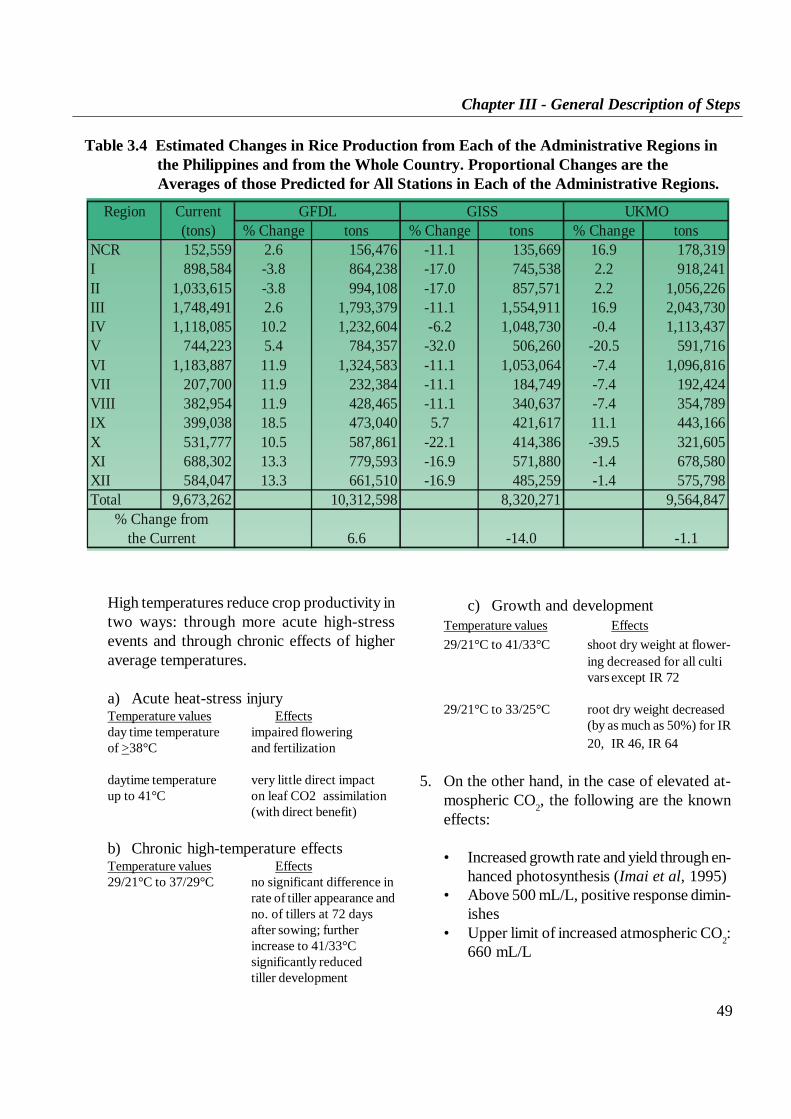
49
Chapter III - General Description of Steps
High temperatures reduce crop productivity intwo ways: through more acute high-stressevents and through chronic effects of higheraverage temperatures.
a) Acute heat-stress injuryTemperature values Effectsday time temperature impaired floweringof >38°C and fertilization
daytime temperature very little direct impactup to 41°C on leaf CO2 assimilation
(with direct benefit)
b) Chronic high-temperature effectsTemperature values Effects29/21°C to 37/29°C no significant difference in
rate of tiller appearance andno. of tillers at 72 daysafter sowing; furtherincrease to 41/33°Csignificantly reducedtiller development
c) Growth and developmentTemperature values Effects29/21°C to 41/33°C shoot dry weight at flower-
ing decreased for all cultivars except IR 72
29/21°C to 33/25°C root dry weight decreased(by as much as 50%) for IR20, IR 46, IR 64
5. On the other hand, in the case of elevated at-mospheric CO2, the following are the knowneffects:
• Increased growth rate and yield through en-hanced photosynthesis (Imai et al, 1995)
• Above 500 mL/L, positive response dimin-ishes
• Upper limit of increased atmospheric CO2:660 mL/L
Region Current GFDL GISS UKMO(tons) % Change tons % Change tons % Change tons
NCR 152,559 2.6 156,476 -11.1 135,669 16.9 178,319I 898,584 -3.8 864,238 -17.0 745,538 2.2 918,241II 1,033,615 -3.8 994,108 -17.0 857,571 2.2 1,056,226III 1,748,491 2.6 1,793,379 -11.1 1,554,911 16.9 2,043,730IV 1,118,085 10.2 1,232,604 -6.2 1,048,730 -0.4 1,113,437V 744,223 5.4 784,357 -32.0 506,260 -20.5 591,716VI 1,183,887 11.9 1,324,583 -11.1 1,053,064 -7.4 1,096,816VII 207,700 11.9 232,384 -11.1 184,749 -7.4 192,424VIII 382,954 11.9 428,465 -11.1 340,637 -7.4 354,789IX 399,038 18.5 473,040 5.7 421,617 11.1 443,166X 531,777 10.5 587,861 -22.1 414,386 -39.5 321,605XI 688,302 13.3 779,593 -16.9 571,880 -1.4 678,580XII 584,047 13.3 661,510 -16.9 485,259 -1.4 575,798Total 9,673,262 10,312,598 8,320,271 9,564,847
% Change fromthe Current 6.6 -14.0 -1.1
Table 3.4 Estimated Changes in Rice Production from Each of the Administrative Regions in the Philippines and from the Whole Country. Proportional Changes are the Averages of those Predicted for All Stations in Each of the Administrative Regions.
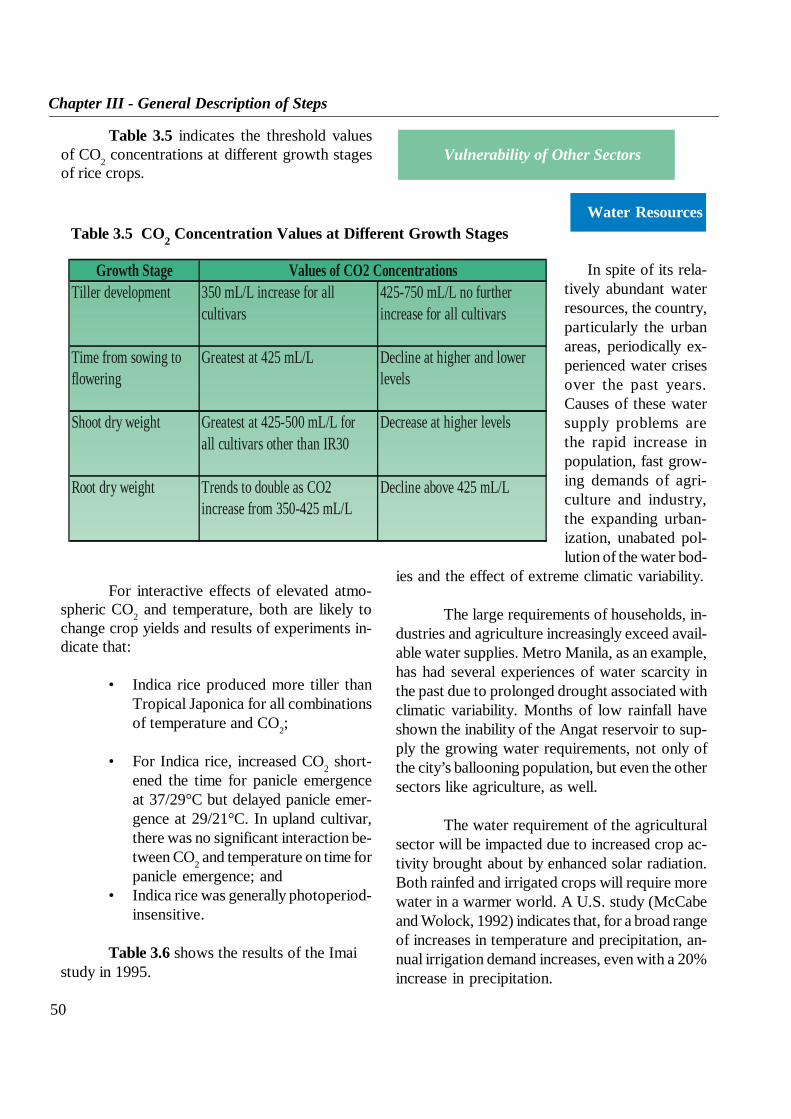
50
Chapter III - General Description of Steps
Vulnerability of Other Sectors
Water Resources
In spite of its rela-tively abundant waterresources, the country,particularly the urbanareas, periodically ex-perienced water crisesover the past years.Causes of these watersupply problems arethe rapid increase inpopulation, fast grow-ing demands of agri-culture and industry,the expanding urban-ization, unabated pol-lution of the water bod-
ies and the effect of extreme climatic variability.
The large requirements of households, in-dustries and agriculture increasingly exceed avail-able water supplies. Metro Manila, as an example,has had several experiences of water scarcity inthe past due to prolonged drought associated withclimatic variability. Months of low rainfall haveshown the inability of the Angat reservoir to sup-ply the growing water requirements, not only ofthe city’s ballooning population, but even the othersectors like agriculture, as well.
The water requirement of the agriculturalsector will be impacted due to increased crop ac-tivity brought about by enhanced solar radiation.Both rainfed and irrigated crops will require morewater in a warmer world. A U.S. study (McCabeand Wolock, 1992) indicates that, for a broad rangeof increases in temperature and precipitation, an-nual irrigation demand increases, even with a 20%increase in precipitation.
Table 3.5 indicates the threshold valuesof CO2 concentrations at different growth stagesof rice crops.
Growth Stage Values of CO2 ConcentrationsTiller development 350 mL/L increase for all 425-750 mL/L no further
cultivars increase for all cultivars
Time from sowing to Greatest at 425 mL/L Decline at higher and lowerflowering levels
Shoot dry weight Greatest at 425-500 mL/L for Decrease at higher levelsall cultivars other than IR30
Root dry weight Trends to double as CO2 Decline above 425 mL/Lincrease from 350-425 mL/L
Table 3.5 CO2 Concentration Values at Different Growth Stages
For interactive effects of elevated atmo-spheric CO2 and temperature, both are likely tochange crop yields and results of experiments in-dicate that:
• Indica rice produced more tiller thanTropical Japonica for all combinationsof temperature and CO2;
• For Indica rice, increased CO2 short-ened the time for panicle emergenceat 37/29°C but delayed panicle emer-gence at 29/21°C. In upland cultivar,there was no significant interaction be-tween CO2 and temperature on time forpanicle emergence; and
• Indica rice was generally photoperiod-insensitive.
Table 3.6 shows the results of the Imaistudy in 1995.
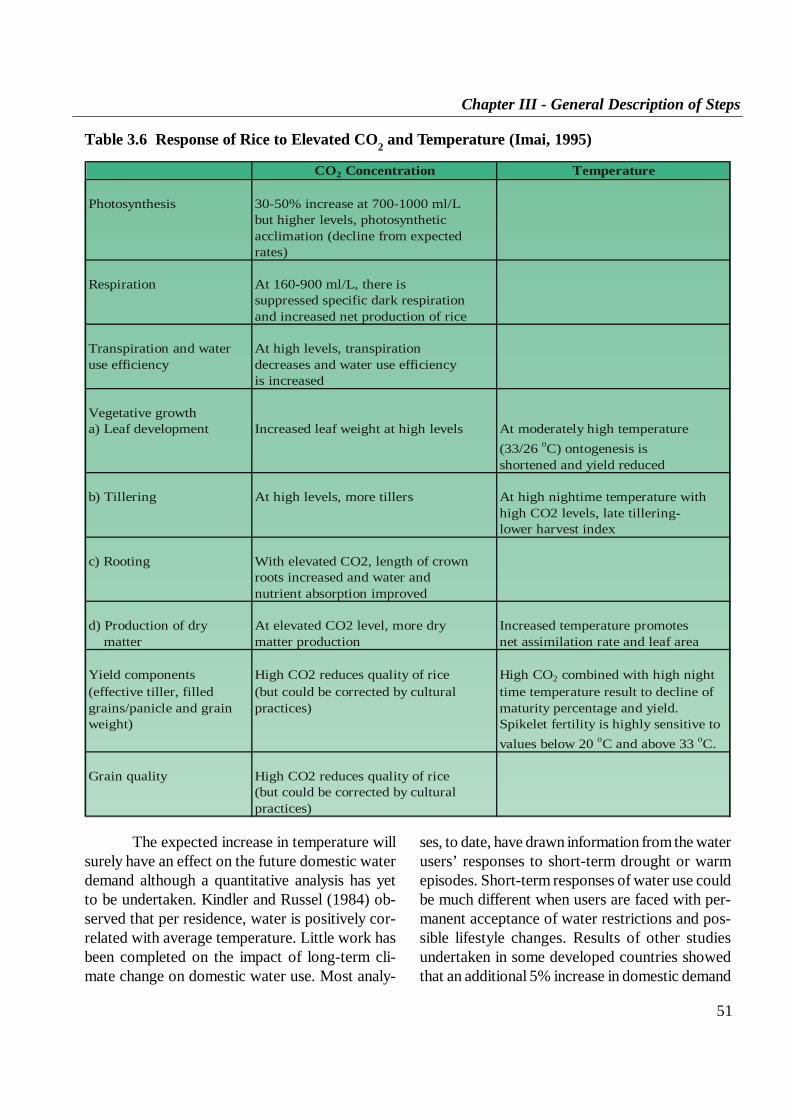
51
Chapter III - General Description of Steps
CO2 Concentration Temperature
Photosynthesis 30-50% increase at 700-1000 ml/Lbut higher levels, photosyntheticacclimation (decline from expectedrates)
Respiration At 160-900 ml/L, there issuppressed specific dark respirationand increased net production of rice
Transpiration and water At high levels, transpirationuse efficiency decreases and water use efficiency
is increased
Vegetative growtha) Leaf development Increased leaf weight at high levels At moderately high temperature
(33/26 oC) ontogenesis isshortened and yield reduced
b) Tillering At high levels, more tillers At high nightime temperature withhigh CO2 levels, late tillering-lower harvest index
c) Rooting With elevated CO2, length of crownroots increased and water andnutrient absorption improved
d) Production of dry At elevated CO2 level, more dry Increased temperature promotesmatter matter production net assimilation rate and leaf area
Yield components High CO2 reduces quality of rice High CO2 combined with high night(effective tiller, filled (but could be corrected by cultural time temperature result to decline ofgrains/panicle and grain practices) maturity percentage and yield.weight) Spikelet fertility is highly sensitive to
values below 20 oC and above 33 oC.
Grain quality High CO2 reduces quality of rice(but could be corrected by culturalpractices)
Table 3.6 Response of Rice to Elevated CO2 and Temperature (Imai, 1995)
The expected increase in temperature willsurely have an effect on the future domestic waterdemand although a quantitative analysis has yetto be undertaken. Kindler and Russel (1984) ob-served that per residence, water is positively cor-related with average temperature. Little work hasbeen completed on the impact of long-term cli-mate change on domestic water use. Most analy-
ses, to date, have drawn information from the waterusers’ responses to short-term drought or warmepisodes. Short-term responses of water use couldbe much different when users are faced with per-manent acceptance of water restrictions and pos-sible lifestyle changes. Results of other studiesundertaken in some developed countries showedthat an additional 5% increase in domestic demand

52
Chapter III - General Description of Steps
could be expected due to global warming(Kaczmarek and Kindler, 1989; Hanaki, 1993). Fordeveloping countries like the Philippines, little isknown about the impact of climate change on do-mestic water use.
Initial efforts were undertaken to under-stand the impact of climate change/variability andother human activities on the country’s water re-sources. Jose, et al (1993) examined long termtrends of atmospheric data such as rainfall andtemperature which are known to be affected byclimate change. Year-to-year variations of annualand seasonal inflows at various major water res-ervoirs in the Philippines were examined. Resultsindicated decreasing inflows in all of the reser-voirs. Minimal and maximal inflows were foundto be associated with the activity of the El Nino-Southern Oscillation (ENSO). This extreme vari-ability and the decreasing trend of inflows havesignificant socio-economic impacts and possibleadverse implications on the water resource man-agement of the country.
One of the studies made was the vulner-ability analysis of the Angat reservoir to the ex-pected climate change. The Angat Reservoir is oneof the main sources of drinking water for MetroManila. As part of the Philippine Country Studyto Address Climate Change, Angat’s vulnerabil-ity to climate change was assessed and possibleadaptation measures identified. Based on histori-cal hydrologic data, Angat’s inflow is very muchdependent on rainfall. Periods of low rainfall overthe watershed areas resulted inlow inflows (translated to lowwater level for the reservoir) whileyears of high rainfall yielded highwater levels for Angat dam. Basedon this relationship and with theexpected changes in rainfall dis-tribution under the doubling ofCO2 scenario, the Angat reservoiris projected to be seriously af-fected. Results showed that
changes in precipitation rather than changes intemperature would directly affect changes inAngat’s runoff. The changes in precipitation andtemperature and the corresponding changes in run-off based on the climate change scenarios gener-ated by three General Circulation Models (GCMs);the Canadian Climate Center (CCC), the UnitedKingdom Meteorological Office (UKMO) and theGeophysical Fluid Dynamics Laboratory (GFDL)are shown in Table 3.7. The UKMO and GFDLmodels showed an increase in runoff by 5 and 32%,respectively. The increase in runoff is attributableto an increase in precipitation predicted by the twomodels. The GFDL has the highest percent changein runoff; it has 15% increase in precipitationcoupled with a 2.4°C increase in temperature. TheUKMO model predicted only a small increase inprecipitation but predicted a higher increase intemperature than the other models. Under theCCCM scenario, a 12% annual runoff reductionis estimated based on the estimated decrease inannual rainfall and increase in temperature.
Runoff simulation results indicate that theexpected rise in temperature in the future will notbe a significant factor in Angat’s runoff variabil-ity, although the impacts of temperature increasecould be manifested in water demand. The greatvariability in rainfall with respect to time, as sug-gested by the model results, will likewise havesignificant implications particularly on water avail-ability. Very high rainfall estimates during the rainyseason (May to September) could result to theoverflowing of reservoirs (floods) while lower
GCM Change in Change in Change inPrecipitation Temperature (oC) Runoff
CCCM -6% +2.0 -12%UKMO 3% +3.1 5%GFDL 15% +2.4 32%
Table 3.7 Changes in Precipitation, Temperature, and Runoff for Angat Water Reservoir Based on the Three GCMs (2xCO2Scenario)
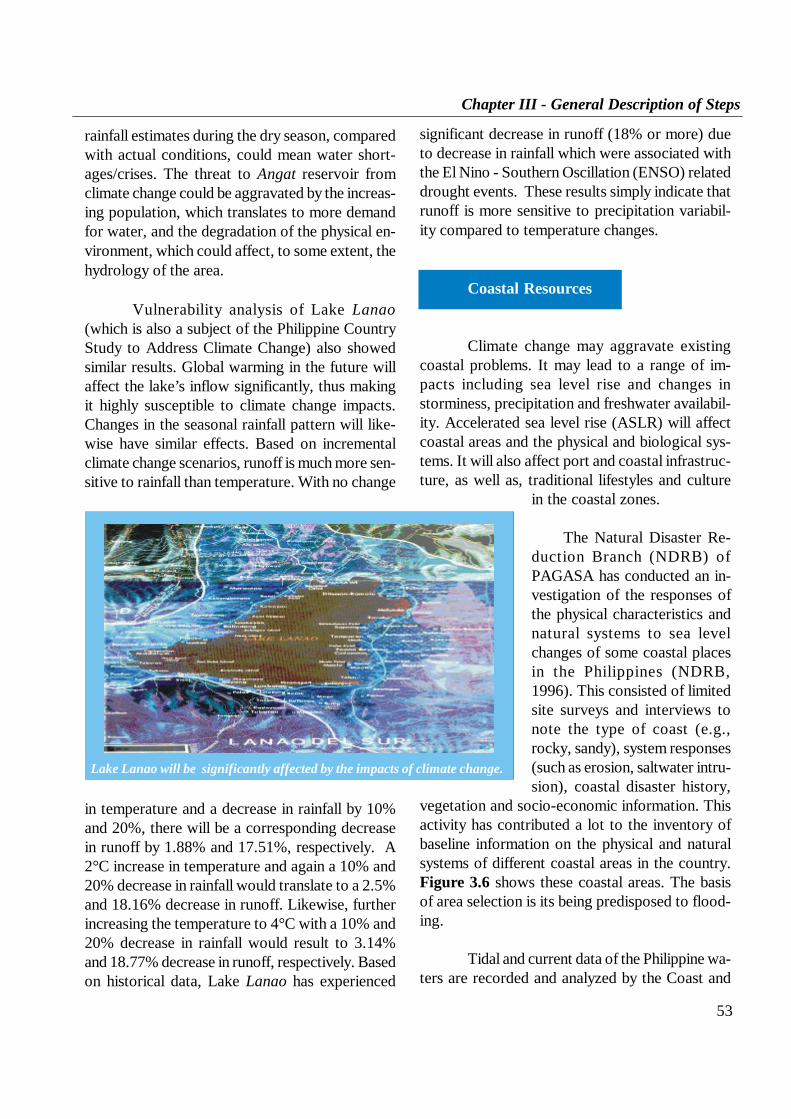
53
Chapter III - General Description of Steps
significant decrease in runoff (18% or more) dueto decrease in rainfall which were associated withthe El Nino - Southern Oscillation (ENSO) relateddrought events. These results simply indicate thatrunoff is more sensitive to precipitation variabil-ity compared to temperature changes.
Coastal Resources
Climate change may aggravate existingcoastal problems. It may lead to a range of im-pacts including sea level rise and changes instorminess, precipitation and freshwater availabil-ity. Accelerated sea level rise (ASLR) will affectcoastal areas and the physical and biological sys-tems. It will also affect port and coastal infrastruc-ture, as well as, traditional lifestyles and culture
in the coastal zones.
The Natural Disaster Re-duction Branch (NDRB) ofPAGASA has conducted an in-vestigation of the responses ofthe physical characteristics andnatural systems to sea levelchanges of some coastal placesin the Philippines (NDRB,1996). This consisted of limitedsite surveys and interviews tonote the type of coast (e.g.,rocky, sandy), system responses(such as erosion, saltwater intru-sion), coastal disaster history,
vegetation and socio-economic information. Thisactivity has contributed a lot to the inventory ofbaseline information on the physical and naturalsystems of different coastal areas in the country.Figure 3.6 shows these coastal areas. The basisof area selection is its being predisposed to flood-ing.
Tidal and current data of the Philippine wa-ters are recorded and analyzed by the Coast and
rainfall estimates during the dry season, comparedwith actual conditions, could mean water short-ages/crises. The threat to Angat reservoir fromclimate change could be aggravated by the increas-ing population, which translates to more demandfor water, and the degradation of the physical en-vironment, which could affect, to some extent, thehydrology of the area.
Vulnerability analysis of Lake Lanao(which is also a subject of the Philippine CountryStudy to Address Climate Change) also showedsimilar results. Global warming in the future willaffect the lake’s inflow significantly, thus makingit highly susceptible to climate change impacts.Changes in the seasonal rainfall pattern will like-wise have similar effects. Based on incrementalclimate change scenarios, runoff is much more sen-sitive to rainfall than temperature. With no change
in temperature and a decrease in rainfall by 10%and 20%, there will be a corresponding decreasein runoff by 1.88% and 17.51%, respectively. A2°C increase in temperature and again a 10% and20% decrease in rainfall would translate to a 2.5%and 18.16% decrease in runoff. Likewise, furtherincreasing the temperature to 4°C with a 10% and20% decrease in rainfall would result to 3.14%and 18.77% decrease in runoff, respectively. Basedon historical data, Lake Lanao has experienced
Lake Lanao will be significantly affected by the impacts of climate change.
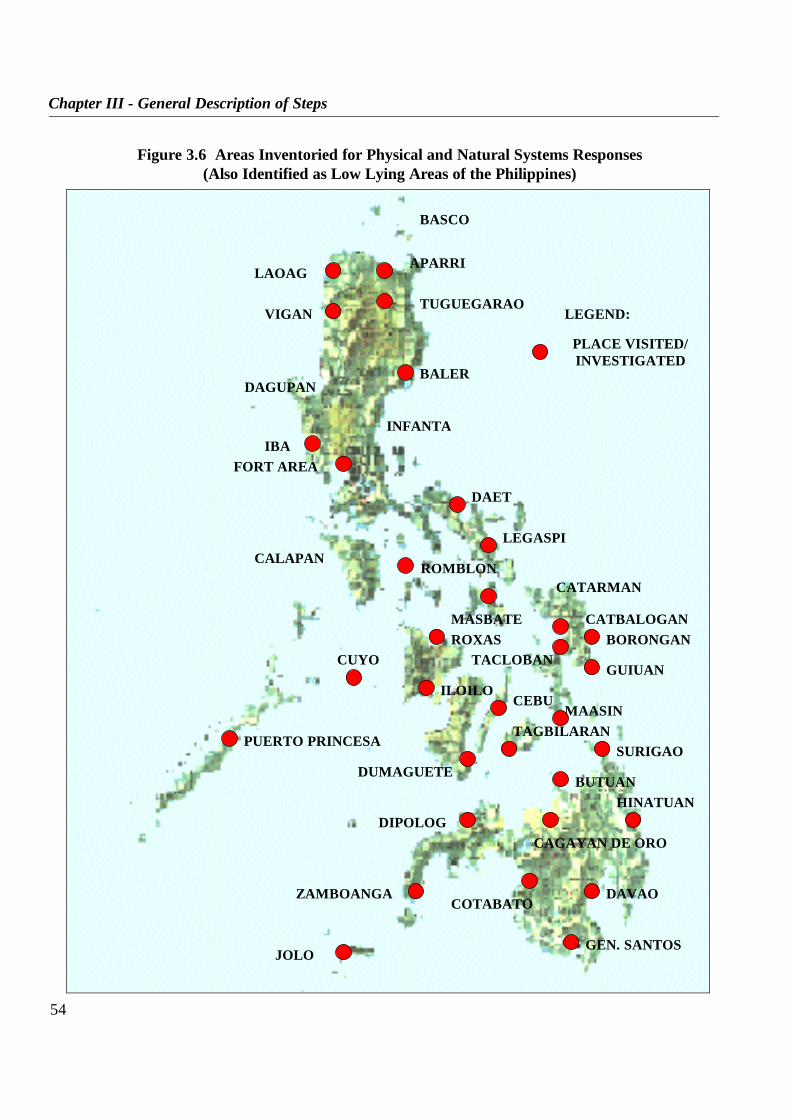
54
Chapter III - General Description of Steps
BASCO
BALER
LAOAG
INFANTA
CATBALOGAN
GUIUAN
HINATUAN
LEGEND:
CATARMAN
BORONGAN
SURIGAOPUERTO PRINCESA
CEBUILOILO
DAGUPAN
ROMBLON
PLACE VISITED/INVESTIGATED
APARRI
TUGUEGARAOVIGAN
MASBATEROXAS
IBA
DAET
LEGASPI
TACLOBAN
FORT AREA
DAVAO
GEN. SANTOS
COTABATO
CAGAYAN DE ORO
BUTUAN
DIPOLOG
ZAMBOANGA
JOLO
DUMAGUETE
TAGBILARAN
CUYO
CALAPAN
MAASIN
Figure 3.6 Areas Inventoried for Physical and Natural Systems Responses(Also Identified as Low Lying Areas of the Philippines)
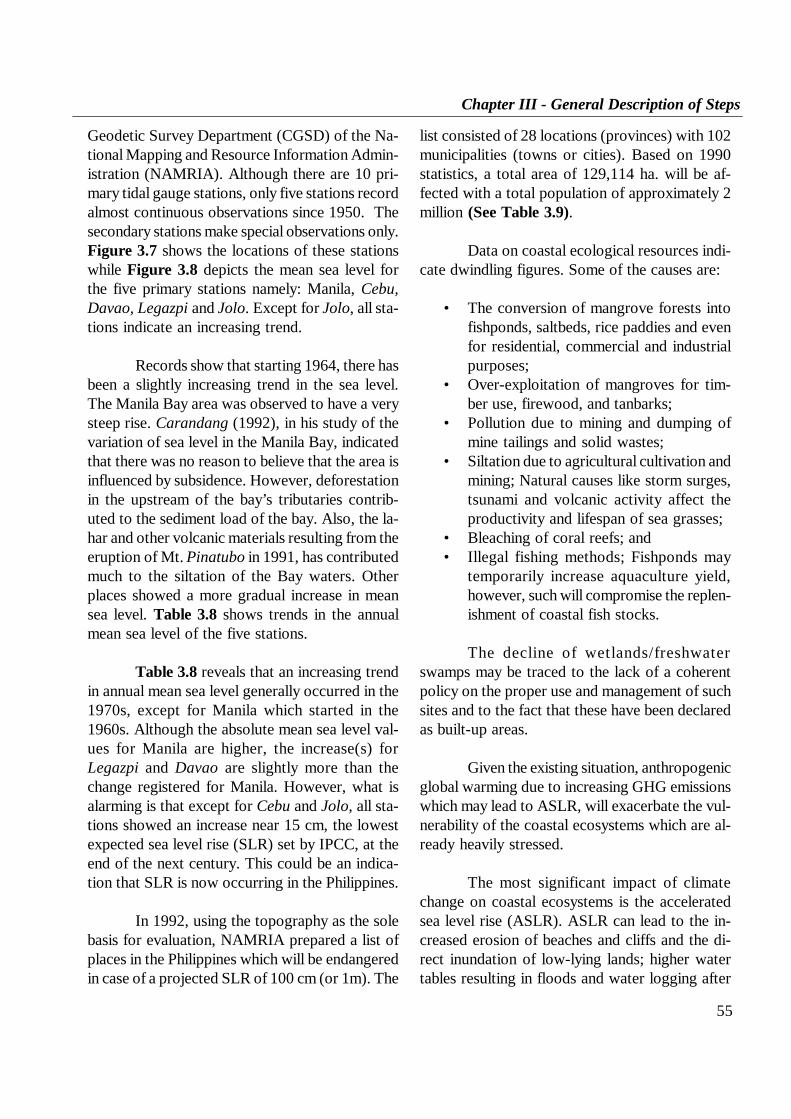
55
Chapter III - General Description of Steps
Geodetic Survey Department (CGSD) of the Na-tional Mapping and Resource Information Admin-istration (NAMRIA). Although there are 10 pri-mary tidal gauge stations, only five stations recordalmost continuous observations since 1950. Thesecondary stations make special observations only.Figure 3.7 shows the locations of these stationswhile Figure 3.8 depicts the mean sea level forthe five primary stations namely: Manila, Cebu,Davao, Legazpi and Jolo. Except for Jolo, all sta-tions indicate an increasing trend.
Records show that starting 1964, there hasbeen a slightly increasing trend in the sea level.The Manila Bay area was observed to have a verysteep rise. Carandang (1992), in his study of thevariation of sea level in the Manila Bay, indicatedthat there was no reason to believe that the area isinfluenced by subsidence. However, deforestationin the upstream of the bay’s tributaries contrib-uted to the sediment load of the bay. Also, the la-har and other volcanic materials resulting from theeruption of Mt. Pinatubo in 1991, has contributedmuch to the siltation of the Bay waters. Otherplaces showed a more gradual increase in meansea level. Table 3.8 shows trends in the annualmean sea level of the five stations.
Table 3.8 reveals that an increasing trendin annual mean sea level generally occurred in the1970s, except for Manila which started in the1960s. Although the absolute mean sea level val-ues for Manila are higher, the increase(s) forLegazpi and Davao are slightly more than thechange registered for Manila. However, what isalarming is that except for Cebu and Jolo, all sta-tions showed an increase near 15 cm, the lowestexpected sea level rise (SLR) set by IPCC, at theend of the next century. This could be an indica-tion that SLR is now occurring in the Philippines.
In 1992, using the topography as the solebasis for evaluation, NAMRIA prepared a list ofplaces in the Philippines which will be endangeredin case of a projected SLR of 100 cm (or 1m). The
list consisted of 28 locations (provinces) with 102municipalities (towns or cities). Based on 1990statistics, a total area of 129,114 ha. will be af-fected with a total population of approximately 2million (See Table 3.9).
Data on coastal ecological resources indi-cate dwindling figures. Some of the causes are:
• The conversion of mangrove forests intofishponds, saltbeds, rice paddies and evenfor residential, commercial and industrialpurposes;
• Over-exploitation of mangroves for tim-ber use, firewood, and tanbarks;
• Pollution due to mining and dumping ofmine tailings and solid wastes;
• Siltation due to agricultural cultivation andmining; Natural causes like storm surges,tsunami and volcanic activity affect theproductivity and lifespan of sea grasses;
• Bleaching of coral reefs; and• Illegal fishing methods; Fishponds may
temporarily increase aquaculture yield,however, such will compromise the replen-ishment of coastal fish stocks.
The decline of wetlands/freshwaterswamps may be traced to the lack of a coherentpolicy on the proper use and management of suchsites and to the fact that these have been declaredas built-up areas.
Given the existing situation, anthropogenicglobal warming due to increasing GHG emissionswhich may lead to ASLR, will exacerbate the vul-nerability of the coastal ecosystems which are al-ready heavily stressed.
The most significant impact of climatechange on coastal ecosystems is the acceleratedsea level rise (ASLR). ASLR can lead to the in-creased erosion of beaches and cliffs and the di-rect inundation of low-lying lands; higher watertables resulting in floods and water logging after

56
Chapter III - General Description of Steps
BASCO
BATANGAS
SAN VICENTEPort Irene
LEGASPI
MANILA
OZAMIZ
ILIGANBISLIG
LEGEND:
PRIMARY TIDESTATION
DAVAO
VIRAC
LAOAN
SECONDARY TIDESTATION
CAGAYAN DE ORO
SURIGAO
TABLAS STRAIT
BOHOL SEA
ILOILO
CURRIMAO
SAN FERNANDO
SAN JOSE
SULU SEA
MINDANAO SEA
LUZON SEAPHILIPPINE SEA
DUMAGUETE
BASILAN
TAGBILARAN
CEBUBANAGO
BALABAC
PENASCOSA
PORT BATAN
FIGURE 3.7 Location of Tide Gauge Stations in the Philippines

57
Chapter III - General Description of Steps
1.300
1.500
1.700
1.900
2.100
2.300
2.500
2.700
2.900
485052545658606264666870727476788082848688909294 Year
Me
an
Se
aL
ev
el,
m
Manila Legazpi Davao Jolo Cebu
Figure 3.8 Annual Mean Sea Level for Five Primary Stations
STATION 1950 To 1959 1950 to 1969 1970 to 1979 1980 to 1989Change Change Change Change
Manila -0.7 +0.083 +0.183 +0.142Legaspi +0.044 -0.071 +0.074 +0.165Davao -0.099 -0.024 +0.069 +0.165Cebu -0.09 -0.085 +0.027 +0.009Jolo -0.08 -0.078 -0.020 +0.069
Table 3.8 Trend in Annual Mean Sea Level (in meters)
heavy rains; increased risk of flood and storm dam-age; changes in tides of rivers and bays; andchanges in sediment deposition affecting tidal flatsand wetlands.
Most areas along the coast will succumbto a one-meter sea level rise and densely popu-lated coastal areas will be very vulnerable to stormsurges. Coral reefs and wetlands that are alreadyheavily stressed may not be able to keep pace withchanges in sea level and mangroves may not sur-vive changes in sediments and salinity.
The Philippine Country Study to addressclimate change issues and concerns under the
sponsorship of the US government conducted a V& A study on coastal resources with respect toASLR, with particular emphasis on the Manila Baycoastal area. The basis of selection is the avail-ability of pertinent data and the highly vulnerablestate of the place. Sea level scenarios used were0.3 m and 1.0 m to represent the low and highscenarios of IPCC, and a 2 m ASLR as a worstcase scenario. Among the preliminary findings(Perez, et. al., 1996) include:
• Manila Bay Area is vulnerable to sea levelrise from both physical and socioeconomicstandpoints
• Most areas along thecoast will succumb to a one-meter sea level rise, speciallyNavotas, Malabon, Paraña-que, Las Piñas, Manila andPasay in Metro Manila; andthe provinces of Bulacan[Hagonoy, Paombong, Ma-

58
Chapter III - General Description of Steps
lolos, Bulacan, Marilao, Bocaue, Obando,Meycauayan, Guiguinto] and Cavite[Kawit, Noveleta, Rosario, Bacoor, CaviteCity].
• Densely populated areas along the coast,especially the squatter areas of Navotasand Malabon, may survive ASLR but willbe very vulnerable to severe storm surge(s)
• Saltwater intrusion will adversely affectagricultural productivity and water qual-ity.
No. of Municipalities/Location Cities Area, in ha. Population
1. Ilocos Norte 6 2,169 9,1702. Ilocos Sur 5 2,849 6,5803. Cagayan 5 9,516 18,1754. La Union 2 204 2,4205. Pangasinan 5 24,018 246,0006. Zambales 5 3,478 48,4937. Aurora 2 1,060 5,0368. Quezon 5 3,017 23,5509. Cavite 3 5,512 230,50610. Metro Manila 5 1,508 429,60011. Bulacan 2 1,240 130,00012. Leyte 4 1,683 27,59613. Samar 4 20,596 80,71014. Bohol 6 11,934 74,91215. Negros Occidental 6 9,061 204,97216. Mindoro Oriental 3 2,954 3,16917. Davao del Sur 5 1,683 5,02018. Davao Oriental 2 864 7,91019. Surigao del Norte 3 6,412 23,58520. Capiz 1 2,714 103,17121. Iloilo 2 1,728 64,66122. Cebu 2 1,497 146,19423. Agusan del Norte 2 3,494 26,21124. Misamis Oriental 5 1,939 19,35025. Misamis Occidental 4 3,536 19,58226. Camarines Sur 4 1,893 13,00527. Negros Occidental 3 1,498 23,33728. Maguindanao 1 1,057 2,500
Total 129,114 1,995,415Source: NAMRIA 1992
Table 3.9 Areas Endangered by Sea Level Rise (for a projected SLR of 100 cm)
• Considering present costs (1995), coastalprotection will be a very costly solution.For example, a concrete sea-wall 3 m highand 1 m thick with an underwater base thatis 1.5 high and 3 m thick will cost US $0.6million per kilometer.
Forestry
Changes in rainfall pattern may increasethe rate of conversion of forest(s) to agricultural

59
Chapter III - General Description of Steps
relationship though is characterized by a time lagas observations by the Bureau of Fisheries andAquatic Resources (BFAR) indicate. The bloomwas found to appear at the onset of the rainy sea-son, immediately after a prolonged, warm dry pe-riod with peaks towards the heavy rainfall months(BFAR, 1993). It appears then that the warm, dryepisode triggers the spawning of red tide, whilehumid conditions at the start of the rainy seasonprovide nourishment for its further growth.
Mangrove for-ests are a unique fea-ture of protectedcoastal shorelines ofthe tropics and sub-tropics; their rootsystems stabilizesediment, dampenwave energy, pro-vide habitat shelterfor numerous organ-isms and provide thebasis for thenearshore marinefood web (Vicente,et. al., 1992). Thebest developed man-grove forests are as-sociated with the ar-eas of high rainfalland upstream runoff.
Thus, in terms of global climate change, futurechanges in rainfall pattern and runoff will havesevere impacts on mangroves. Mangroves growbest in moderately saline environments and couldkeep up with sea level rise of up to 12 cm/100years.
The IPCC Assessment (1990) also ex-pressed concern that the rise in sea level may ag-gravate leaching of contaminants from coastalsewerage and toxic waste disposal in nearby hu-man population centers and agricultural regions.Bacterial and viral agents present in such sites and
lands due to human migration from areas degradedby drought and erosion to more productive forest-lands. In drier areas, increase in CO2 will likelyincrease productivity of vegetation by increasingwater-use efficiency. A decrease in soil moisturein drier areas may accelerate forest loss while anincrease in precipitation beyond evaporation de-mand could increase runoff resulting in soil ero-sion and flood occurrences. The local biodiversitywill also decrease through extinction and inhibi-tion of reimmigration from adjacent areas.
In the tropics, marine organisms live closerto their maximum thermal tolerance than those inmore temperate climates (Vicente et. al. 1992). Al-though the 1.5°C temperature rise scenario wouldraise the summertime mean temperature to 30.5°Cover much of the tropical/subtropical region, mostmigratory species are expected to be able to toler-ate such changes.
The occurrence of red tide or pyrodiniumblooms which have become health and fisheryproblems in the Philippines since 1983 is also re-lated to increased sea surface temperature. This
The rate of forestland conversion may increase due to drought and erosion.

60
Chapter III - General Description of Steps
in coastal septic sewerage systems could be in-creasingly released to coastal waters. While thereare potential impacts on coastal resources includ-ing nutrient loading of confined waters (Valielaand Costa, 1991) the primary concern is for thehuman populations who consume the resourcesand the loss of commerce caused by the closureof fish and shellfish areas by health authorities.
Health
Consideration of climate change effects isrelatively new to public health sector workers inthe Philippines. However, such are currently be-ing factored into the discussions in the health sec-tor. Assessments indicate that the health situationis aggravated by poverty and inequity, the emer-gence of new challenges in the midst of unresolvedproblems, a very low government budget forhealth, and poor-allocation of limited resources.Compounded by the effects of climate change, thiscalls for a combination of immediate vertical andlonger-term horizontal approaches.
The assessment of potential impacts of cli-mate change on human health is a new area ofinquiry. Researchers are still in the process ofdeveloping methodologies, techniques, and pa-rameters for study (McMichael AJ et.al. 1996).According to McMichael et.al., these studies haveto take into account the evaluation of climatolo-gists of when, where, and to what extent the on-going greenhouse gas accumulation will translateinto changes in climate. Secondly, they have todetermine how those climate changes could af-fect the world’s biogeophysical system.
In the Philippines, a study was undertakenunder the Enabling Activity for the Preparation ofthe Initial National Communication. For this study,the following approach to correlate climate changeand human health was utilized:
· Developing some estimate of climate changebased on mean monthly weather data (mini-mum and maximum temperatures; rainfalland humidity; and, mean sea-level pres-sure).
These were drawn from reports of thePAGASA Synoptic Stations in areas representingeach of the four climate types determined using aModified Coronas classification -
Ø Station 324 in Iba, Zambales as an areawith Type I climate;
Ø Station 440 in Daet, Camarines Norteas an area with Type II climate andStation 444 in Legaspi, Albay with amix of Type II, III, and IV climates;
Ø Station 618 in Puerto Princessa,Palawan as an area with Type IIIclimate; and
Ø Station 753 in Davao City and Station748 in Cagayan de Oro, MisamisOriental as areas with Type IV climate.
The following formula for measuring an“estimate of climate change” in any year was used:
The sum of the differences between themonthly observed value of a climate elementminus the monthly mean of that element during agiven base period, i.e., monthly weather data for aparticular year (from 1961 to 1993) minus meanof the monthly weather data for the period from1951 to 1960. For example, the “climate change”measure for 1999 would correspond to:
The sum of [monthly weathervalues (1999 January toDecember) minus the mean of eachcorresponding monthly (January toDecember) weather data for theperiod from 1951 to 1960].

61
Chapter III - General Description of Steps
Using the above estimation, 5 “measuresof climate change” for each year from 1961 to 1993were generated: a “climate change measure” forminimum temperatures, a “climate changemeasure” for maximum temperature, a “climatechange measure” for rainfall, a “climate changemeasure” for humidity, and a “climate changemeasure” for mean sea level pressure. This processwas applied to the five provinces and one citystudied.
· Determining health impact using theincidence of selected diseases.
For this study, existing central office dataof the Department of Health (DOH) from itsHealth Intelligence Service was utilized. Data onfile include the yearly incidence of notifiablediseases consolidated at the provincial and citylevels from 1961 to 1993. The incidence andpopulation weighted per 100,000 was chosen.Reports from the following areas were used –
Ø The province of Zambales;Ø The province of Camarines Norte;Ø The province of Albay;Ø The province of Palawan;Ø The province of Misamis Oriental; andØ The City of Davao.
Data on the following diseases werecollected:
Viral infections that are spread by dropletsfrom coughs/colds – 1 Influenzae (Flu), 2Varicella (Chicken Pox), 3 Measles, 4Mumps, 5 Viral Encephalitis
General respiratory diseases – 6Bronchitis, 7 Pneumonia
Bacterial infections that are spread bydroplets from coughs/colds – 8Tuberculosis, 9 Diphtheria, 10 WhoopingCough, 11 Meningococcemia, 12 LeprosyInfections that are spread from feces to
contaminated food or water – 13 Diarrhea,14 Cholera, 15 Typhoid, 16 Hepatitis, 17Polio
Diseases coming through the skin – 18Tetanus, 19 Schistosomiasis
Sexually transmitted diseases – 20Syphilis, 21 Gonorrhea
Mosquito-vector borne diseases – 22Malaria, 23 Dengue or H-Fever, 24Filariasis
Animal borne diseases – 25 Rabies, 26Anthrax
Other diseases – 27 Cancers, 28 NutritionalDeficiencies
Disorders of the heart and AIDS wereexcluded because of the absence of datafor most of the study and baseline period.TB meningitis, pulmonary Tuberculosisand other forms of TB were all groupedunder Tuberculosis. In the same manner;Amebiasis, food poisoning, and Enteritiswere all classified as Diarrhea.
Correlating the yearly (1961 to 1963) “measuresof climate change” with the incidence ofnotifiable diseases.
The disease incidence from each provinceor city was treated as a dependent variable, andall the “measures of climate change” asindependent variables. Then the sample coefficientof multiple determination (R2) was computed fromregression analysis.
i.e. Y = incidence of one notifiable disease reported,and
X1 as Climate Change measure of MinimumTemperature,
X2 as Climate Change measure of MaximumTemperature,
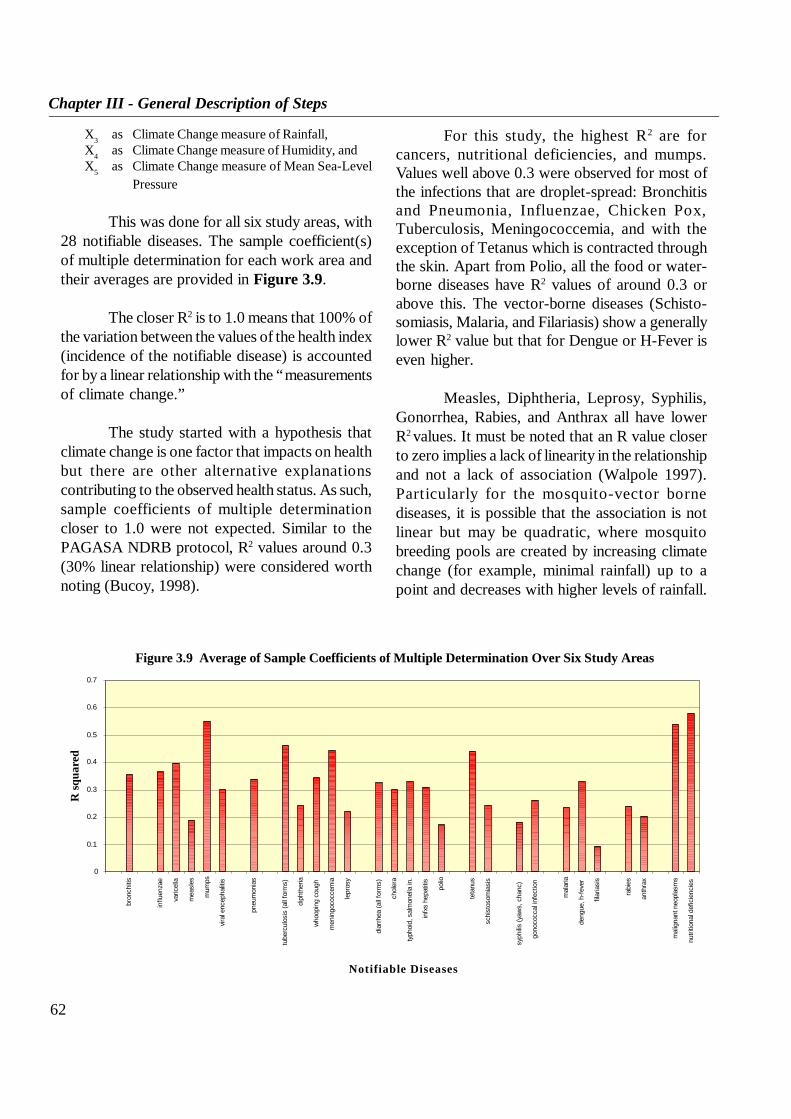
62
Chapter III - General Description of Steps
FIGURE 3.9 AVERAGE OF SAMPLE COEFFICIENTS OF MULTIPLE DETERMINATION OVER SIX STUDY AREAS
0
0.1
0.2
0.3
0.4
0.5
0.6
0.7
bron
chiti
s
influ
enza
e
varic
ella
mea
sles
mum
ps
vira
l enc
epha
litis
pneu
mon
ias
tube
rcul
osis
(all
form
s)
diph
ther
ia
who
opin
g co
ugh
men
ingo
cocc
emia
lepr
osy
diar
rhea
(all
form
s)
chol
era
typh
oid,
sal
mon
ella
in.
infx
s he
patit
is
polio
teta
nus
schi
stos
omia
sis
syph
ilis (y
aws,
cha
nc)
gono
cocc
al in
fect
ion
mal
aria
deng
ue, h
-feve
r
filar
iasi
s
rabi
es
anth
rax
mal
igna
nt n
eopl
asm
s
nutri
tiona
l def
icie
ncie
s
Notifiable Diseases
R s
quar
ed
X3 as Climate Change measure of Rainfall,X4 as Climate Change measure of Humidity, andX5 as Climate Change measure of Mean Sea-Level
Pressure
This was done for all six study areas, with28 notifiable diseases. The sample coefficient(s)of multiple determination for each work area andtheir averages are provided in Figure 3.9.
The closer R2 is to 1.0 means that 100% ofthe variation between the values of the health index(incidence of the notifiable disease) is accountedfor by a linear relationship with the “measurementsof climate change.”
The study started with a hypothesis thatclimate change is one factor that impacts on healthbut there are other alternative explanationscontributing to the observed health status. As such,sample coefficients of multiple determinationcloser to 1.0 were not expected. Similar to thePAGASA NDRB protocol, R2 values around 0.3(30% linear relationship) were considered worthnoting (Bucoy, 1998).
For this study, the highest R2 are forcancers, nutritional deficiencies, and mumps.Values well above 0.3 were observed for most ofthe infections that are droplet-spread: Bronchitisand Pneumonia, Influenzae, Chicken Pox,Tuberculosis, Meningococcemia, and with theexception of Tetanus which is contracted throughthe skin. Apart from Polio, all the food or water-borne diseases have R2 values of around 0.3 orabove this. The vector-borne diseases (Schisto-somiasis, Malaria, and Filariasis) show a generallylower R2 value but that for Dengue or H-Fever iseven higher.
Measles, Diphtheria, Leprosy, Syphilis,Gonorrhea, Rabies, and Anthrax all have lowerR2 values. It must be noted that an R value closerto zero implies a lack of linearity in the relationshipand not a lack of association (Walpole 1997).Particularly for the mosquito-vector bornediseases, it is possible that the association is notlinear but may be quadratic, where mosquitobreeding pools are created by increasing climatechange (for example, minimal rainfall) up to apoint and decreases with higher levels of rainfall.
Figure 3.9 Average of Sample Coefficients of Multiple Determination Over Six Study Areas

63
Chapter III - General Description of Steps
These results exhibit association rangingfrom 10% to 58% between climate change (usingthe crude measurement proposed) and health (asindicated by disease incidence).
While there are indicative trends, thesehave to be validated and, therefore, more studiesneed to be undertaken.
Adaptation Strategies
Agriculture
The preliminary results of the variousvulnerability studies indicate varied results. Whatis certain, however, is that global warming ortemperature increases would cause theenhancement of activity of weeds and pests, andplant diseases; the reduced effectiveness ofinsecticides, pesticides and herbicides; and theacceleration of soil degradation. These areprojected to weaken the positive effects ofenhanced photosynthesis and a warmer climate oncrop production.
Increased research on these areas andplanning for adaptive measures should, therefore,be undertaken. There are three aspects that arehighly vulnerable to climate change: the loss ofarable lands due to sea level rise; decreased soilfertility due to increased soil erosion; anddecreased crop productivity. Consequences ofdecreased crop yield would be a loss of food supplyand a loss of jobs, especially for subsistencefarmers. Therefore, it is essential that there areplans for mitigating the projected adverse impactsof climate change through a careful and exhaustivechoice of adaptation strategies.
The mix of identified possible strategiesfor adaptation and mitigation were assessedfollowing the decision matrix described in the
IPCC methodologies. The result of the assessmentmade in a series of focused and consultativeworkshops held with major stakeholders is a mixof economic, technological, institutional andresearch strategies which are listed below:
Economic
1. Liberalization of agricultural trade barriers2. Changes in existing subsidies3. Extensive review/analysis of and
appropriate action on economic incentives,subsidies, taxes, pricing and trade barriers
Technological
1. Changes in agricultural managementpractices
2. Natural rainfall management includingwater impounding dams and evaporationcontrol
3. Cropping pattern adjustment according tothe onset of the rainy season and observedfrequency of tropical cyclones, includinginformation dissemination to farmers andtimely provision of farm weather services/advisories, early warning systems(PAGASA - DA)
4. Access to available data on soil fertilityfrom BSWM, particularly on
• Improved water management• Developing heat-resistant varieties/genetic
breeding• Improved farm management• Organic farming• Diversified farming• Safe and judicious use of fertilizers/
chemicals• Optimum/efficient use of fertilizers/
chemicals• Increasing effectivity/flexibility of
irrigation• Introduction of new least-cost technologies
such as hydroponics• Improvement of post - harvest and bulk
64
Chapter III - General Description of Steps
irrigation system development. Some of them willnot even cost the government additional funding(i.e., collaboration between managers of weatherdata, water resources, farmers and policy makersand strengthening of extension services). All thatis needed is improved coordination of basicservices being provided by the various agenciesin government. However, the recommendedstrategies entailing research and development ofnew systems (i.e., upgrading food storagesystem(s), improved water management,developing new heat-resistant varieties, geneticbreeding and others) will need some funding . Therest of the recommended options will depend onstrong advocacy and political will (i.e., legislativemeasures on land-use conversion and irrigationsystem development).
Coastal Resources
There are currently no existing policies ormeasures which directly address climate changeand its impacts on the population, natural resourcesand infrastructures in the coastal zone. However,there are a number of laws and regulationsregarding the use, protection, rehabilitation andexploitation of resources along the coast. Theseare as follows:
Policies
Development
• RA 1899 - Reclamation of foreshore landsby chartered cities and municipalities
• RA 2056 - Prohibits removal and/ordemolition of dams and dikes or otherworks in public navigable waters andwaterways and in communal fishinggrounds.
• DENR AO 76 (1987) - Establishment ofbuffer zones in coastal, estuarine andmangrove areas.
handling facilities (i.e. installation of grain-drying facilities in strategic areas).
Institutional
Institutionalizing agricultural droughtmanagement through:
1. Collaboration between managers ofweather data, water resources, farmers,policy makers
2. Passage of legislative measures includingthose on land use conversion
3. Strengthening of extension services at thelocal government unit level
• Upgrade food storage distributionsystem
• Promote and implement judicious landuse planning
Research
Study/review of and improvement ofexisting policies associated with production,processing, storage, transport and marketing toderive optimum effectiveness from research,technological developments and land usepractices.
The adaptation strategies being recom-mended were chosen primarily because most ofthem will be least cost when implemented (i.e.,natural rainfall management, cropping patternadjustment, access to available information likesoil fertility, soil taxonomy, etc.). A number ofthese measures are already being done by theDepartment of Agriculture. These are: safe andjudicious and optimum/efficient use of fertilizersor the so-called Balanced Fertilization Strategy,implementation of strategies to address the ENSOepisodes, and the introduction of new least-costtechnologies such as hydroponics and evaporationcontrol. These measures are viewed to entail littleinvestment costs compared to the planned

65
Chapter III - General Description of Steps
fees on foreshore, marshy, reclaimed andother government lands occupied by anyperson or entity without authority orpermit.
There are no clear-cut policies on the useand management of wetlands, mangroves, coralreefs and other precious coastal ecosystems.Among the recurrent coastal management issuesthat need to be addressed are the over-exploitationof fishing grounds; conversion of mangroves toother uses; the destruction of coral reefs and seagrass beds; and the red tide phenomenon. Somebarriers to effective implementation that have beenidentified include institutional weakness(es) atdifferent levels of government and the lack ofresources to enforce existing rules and regulations.
Plans/Programs
There are currently plans and programswhich are either being implemented or still to beundertaken to address the problems and issues ofthe country’s coastal zones. Among these are thefollowing:
Philippine Master Plan for Marine andCoastal Environment
On April 22, 1993, the Department ofEnvironment and Natural Resources establishedthe Coastal Environment Program (CEP) throughAdministrative Order No. 19, to implementprograms and projects on the conservation andmanagement of coastal and marine ecosystem. TheCEP encompasses all concerns over the habitatand ecological support systems of coastalcommunities and fisheries specifically pertainingto their productivity, biodiversity, integrity,sustainability and equitability of access and use.The program includes activities related to theprotection, conservation and rejuvenation of thepopulation of endangered species, and researchactivities to mediate, ameliorate or mitigate threatsto coastal resource systems.
Coastal Resources Exploitation andProtection
• PD 600/ PD 979 - Marine Pollution Law• PD 604 - Revising and consolidating all
laws affecting fishing and fisheries• RA 5173 - Creating the Philippine Coast
Guard• PD 1998 - Restoration and rehabilitation
of areas subject to development,exploration and exploitation, to theiroriginal conditions.
• Coastal Resources Management in theLocal Government Code (RA 7160)
National Marine Policy
• Extent of national territory• Protection of marine ecology• Management of the marine economy and
technology• Maritime security
Habitation
• Act No. 3038 Authorizing the Secretaryof Agriculture to sell or lease lands ofprivate domain.
• Commonwealth Act No 141 - Public LandAct
• Lands Office Circular No. 29 - Precautionsto be observed in the disposition of landsadjoining rivers, streams, creeks, lakes andother bodies of water.
• PD 1585 - Prescribing certain standardsfor government contracts, concessions,licenses, permits, leases or similarprivileges involving the exploration,development or utilization of naturalresources.
• Lands General Circular No. 51 -Additional conditions for lease contractsinvolving foreshore areas.
• Lands General Circular No. 58 - Directingdistrict land officers to collect occupation

66
Chapter III - General Description of Steps
The following summarizes thecontents of the Coastal Environmental Program’sMaster Plan:
1. Fundamental principles for marine and coastalresources and environment management.
a) Healthy environment;b) Equity and social justice;c) Sustainable development;d) Community-based Resource Management;e) Integrated coastal zone management.
2. Specific Policies on:
a) Environmentb) Public Participationc) Development projects/Activitiesd) Pollutione) Resource Use and tenure
3. Support Policies on:
• Capability building• Research Monitoring and Evaluation• Coordination• Legislation
4. Management Options in Different Bio-geographic Sectors of the Philippines.
At present, the government is imple-menting the Fisheries Sector Program (FSP) thatseeks to put into place the coastal resourcemanagement schemes in twelve priority bays.Mangrove reforestation is also part of this programand is being undertaken through contracts withprivate corporations. The Coastal EnvironmentalProgram seeks to develop coastal communities asresource and environmental managers. The taskof mangrove reforestation was transferred to them.
The Lingayen Gulf Coastal AreaManagement Plan/Program(s)
The Coastal Resources ManagementProject (CRMP) was started in 1986, using the
160 km long coastline of the Lingayen Gulf as apilot testing area of resource managementinitiatives that can be adopted by other coastalplaces in the country. Lingayen Gulf is the majorfishing ground of Northwestern Luzon. Themajority of the populace depend on coastalresources for food, income and employment. Thecapture fisheries, aquaculture and tourism sectorsof the gulf are important to the region’s economy.
The management plan is an attempt to laythe foundation for sustainable development of theLingayen Gulf coastal area. It contains a briefreview of the more important resourcemanagement issues, programs and projects toassess these issues, and institutional arrangementsfor plan implementation. These have been groupedinto eight essential programs whose adoption iscritical to the survival of the gulf. These programsare:
Fisheries Management
• Organizing municipal fishermen towardsestablishing common propertymanagement
• Creating a monitoring system for fisheriesmanagement.
• Upgrading expertise in fisheriesmanagement.
Environmental Quality management
• Development of institutional capabilitiesfor monitoring water quality.
• Information, education and commu-nication campaign against water pollution
• Establishment of pilot waste disposalsystems for urban and urbanizing centers.
Coastal Zonation
• Coastal information system for coastal areamanagement and planning.
• Codification of environmental laws andregulations for coastal area management.

67
Chapter III - General Description of Steps
• Rehabilitation of linked habitats*Rehabilitation of Upper Agno Riversystem watershed
• Alternative livelihood for fishing families*Maguey production*Peanut production*Saltmaking*Environmentally sound aquarium fishing
• Rehabilitation and enhancement of criticalhabitats*Rehabilitation of mangroves*Establishment of the Santiago islandcommunity-based marine reserve
• Aquaculture development*Feasibility study for a saltwater canalsystem in Binmaley, Pangasinan*Seaweed culture*Seafarming in cages*Oyster culture
• Institutional Development
Department of Tourism (DOT) MasterPlanning Project (1991)
Under this initiative, a master plan fortourism was formulated, incorporating pertinenttourism development guidelines for the coastalzones. Specifically, these guidelines includemeasures for site planning such as siting, gradingand clearing, beach improvements, buffer zones,
setbacks, landscaping and protection of trees, solidwastes disposal, sewage treatment, water supply,drainage and marine habitat protection amongothers.
Adaptation Measures for CoastalResources
The following are the proposed policymeasures for adaptation to climate change of thecoastal resources sector.
• Assessment of current practices on crisismanagement (floods, droughts, storms).
• Information dissemination/educationcampaign on climate variability andchange and its impacts for decision makersand the public.
• Formulation of guidelines and legislationfor the implementation of IntegratedCoastal Zone Management (ICZM) for allcoastal zones of the Philippines,particularly on land-use planning.
• Mangrove resources development shouldbe institutionalized highlighting themassive reforestation of degradedmangrove systems through a community-based approach.
• Public easements and buffer strips shouldbe treated as separate lots during land
surveys; i.e., exclusion from tilling orprivate ownership.• LGUs should be required toreserve foreshore areas which arecritical areas for recreation/tourismpurposes and other public use and beexcluded from disposition.• Inclusion of wetlands, swamps,marshes in the NIPAS under acategory of wildlife sanctuary orunique ecosystem.• A multi-hazard mitigation andprotection plan for natural coastalareas must be developed with priorityon the maximum reduction in threatto life, structures and economic
Presently, coastal management measures do not directly address theimpacts of climate change.

68
Chapter III - General Description of Steps
To address the problems of the sector, thegovernment has initiated several measures whichinclude: the establishment of managementcommittees in water crisis, droughts, and watersupply; reforms in the water supply sector; andstudies on the privatization of the MWSS andsome water districts. Other studies have been doneon the institutional aspects of water resourcesdevelopment and management over the past 20years along with the proposed institutionalreforms; the environmental sustainability of waterresources development; and the financialsustainability of water development projects. Asituational study on water resources, supply anddevelopment identified certain issues and concernsinvolving the present status of the country’s waterresources.
Other government policies include thePhilippine Water Code of 1976 which providesthe legislative basis for the management of thecountry’s water resources; the National Economicand Development Authority (NEDA) BoardResolution No. 4 of March 1994 which strengthens
production.• Formulation and strict implementation of
mining laws, reforestation of denudedwatersheds to reduce river/coastal erosion.
• Requirement of geological, hydro-meteorological and structural engineeringevaluation as part of the environmentalimpact assessment prior to coastaldevelopment.
• Limitation of government subsidies ortax incentives to develop land sensitiveto sea-level rise, such as barrier islands,coastal wetlands, estuarine shorelinesand critical wildlife habitats.
Under the Philippine Country Study, theidentified adaptive measures for coastal resourcesto ASLR are as follows:
• Selective protection after thorough cost-benefit studies.
• Long-term planning in the perspective ofcoastal zone management to includeproper resources exploitation and usage.
• Disaster mitigation and preparedness tie-up with climate change issues.
• Passage/implementation of policies andregulations on habitation and construction.
• Inclusion of measures to address climatechange in the ICZM program.
• Information and education campaign toinclude government and the general public.
Water Resources
Thirty two (32) agencies under 12Departments of the government are involved, inone way or another, in the management of thecountry’s water resources. The lead agencydesignated as coordinating body of all the activitiesin the sector is the National Water Resources Board(NWRB).

69
Chapter III - General Description of Steps
the NWRB staff; Executive Order No. 222 of 1995which establishes the Committee on WaterConservation and Demand Management; theWater Crisis Act which empowers the Presidentto implement measures to address a wateremergency; Executive Order No. 374 of 1996which created the Presidential Task Force on WaterResource Development and Management; and therecent privatization of the MWSS.
The Philippine Water Code of 1976(PD2067) provides the legislative basis for themanagement of the country’s water resources. Thecurrent water resources management frameworkconsists of the following elements:
• A basic law (Water Code)• A planning and coordination mechanism• Assessment and basin framework plans• A water use/waterworks regulatory system• A water management agency - the NWRB
that administers the Code
The Water Crisis Management Committeewas formed in 1987 to basically address theproblem of allocating water from the Angatreservoir for water supply, irrigation andhydropower during periods of drought. Membersof the committee include the MWSS RegulatoryOffice (formerly Metropolitan Waterworks andSewerage System), the National PowerCorporation (NPC), the National IrrigationAdministration (NIA), the Local Waterworks andSewerage System (LWUA), the National WaterResources Board (NWRB), the Bureau of Soilsand Water Management (BSWM), the Departmentof Public Works and Highways (DPWH) and thePhilippine Atmospheric, Geophysical andAstronomical Services Administration(PAGASA).
The government’s desire to resolve thewater crisis at the soonest possible time gave riseto the National Water Summit of 1994. At the endof its deliberations, the Summit pointed to the
“...urgent need to properly manage the nation’swater in a sustainable manner, and ...the need foran integration and coordination of all water relatedefforts towards a more focused approach to waterresources management.”
As a result of the Summit, the Presidentemphasized the nationwide concern for the watersector by involving his Cabinet. Cluster G (aCabinet working group of departmentfunctionaries in charge of specific issues andconcerns) was reconstituted into a WaterManagement Cluster. This Cluster now serves asthe advisory committee to the President and theCabinet on all matters relating to the waterresources sector.
The National Economic DevelopmentAuthority (NEDA) Board Resolution No. 4 inMarch 1994, strengthened the staff of the NWRB,the key regulatory and coordinating agency, inorder to effectively cope with the planning,monitoring and implementation activities of thewater resources sector.
Executive Order No. 222 of 1995established the Committee on Water Conservationand Demand Management.
Pursuant to the National Water Summit of1994, Congress enacted in 1995, Republic Act No.8041 otherwise known as the “National WaterCrisis Act of 1995”. The law was meant to addressthe problems and ill effects spawned by the watercrisis then prevailing.
The Water Crisis Act of 1995 provides,among others, the following:
a) Emergency powers for the President torestructure government agencies chargedwith the provision of water supply andsanitation services;
b) Powers for the President to enter intonegotiated contracts for the financing,construction, repair and rehabilitation ofwater facilities;

70
Chapter III - General Description of Steps
c) Creation of the Joint Executive-LegislativeWater Crisis Commission (JELWCC)chaired by the Executive Secretary, whichis tasked to conduct a detailed study andreview of the country’s entire water supplyand distribution structure.
Executive Order No. 374, issued in 1996created the Presidential Task Force on WaterResources Development and Management. Thetask force is composed of the Secretary of theDepartment of Environment and NaturalResources as Chairman and the National WaterResources Board’s Chairman as the ViceChairman. The task force will serve as an oversightbody to ensure the efficient sourcing and use ofwater resources, in particular, the provision ofpolicy and program recommendations on watersupply planning and coordination; prioritizationof programs and projects critical for ensuringsustainable, adequate, safe and affordable watersupply; coordination and monitoring of waterpolicies and programs; and pricing policies onwater resources.
Watershed Management
The most important policy on watershedmanagement in the Philippines is PresidentialDecree 705, as amended, otherwise known as the“Revised Forestry Code of the Philippines”. PD705 embodies the general mandate of thePhilippine Constitution to conserve and utilizeproperly the country’s natural resources. The majorpolicies enunciated in the said Decree, as appliedto the watersheds are as follows:
a. all watersheds in the country shall be underthe ownership and jurisdiction of thePhilippine Government;
b. the watersheds shall be managed under theconcept of multiple-use and sustainedyield;
c. the watershed shall be managed to achieveand maintain a sound level ofenvironmental quality; and
d. the natural resources of the Philippines,including watershed resources shall bemanaged with the participation of localpopulations and communities.
The Master Plan for Forestry Development(MPFD) provides for the integrated and holisticmanagement of the country’s watersheds andproposes a set of strategies essential to themanagement of the denuded watershed(s), lawenforcement, resettlement, improved incentive(s),improvement of the monitoring of land uses andan integrated protection program. The MPFD wasalso instrumental in the DENR policy shifts oflogging from the virgin forests to the residualforests, and the imposition of the logging ban incritical areas.
The National Integrated Protected AreasSystem (NIPAS) Act or Republic Act No. 7586
Watershed protection is a major measure to enablethe country to respond to the impacts of climatechange.

71
Chapter III - General Description of Steps
states that “it is the policy of the State to serve theFilipino people of the present and futuregenerations.” It also provides for the perpetualexistence of all native plants and animals throughthe establishment of a comprehensive system ofintegrated protected areas.
By virtue of a Presidential instruction, theDENR is to facilitate the creation of a WatershedManagement Council in a watershed prior to itsproclamation as a watershed reservation. TheCouncil comprises of representatives fromdifferent concerned government agencies (i.e.,National Irrigation Administration, LocalGovernment Units, Local Water Districts,Department of Agriculture, etc.) including non-government organizations and the private sector.
Under the Environmental ImpactStatement System (PD 1586) and specificallyProclamation No. 2146 which defines thecoverage of the system, watershed reservations aredesignated as Environmentally Critical Areas(ECAs). All activities/projects within these areasare subject to the requirements of the System,particularly obtaining the EnvironmentalCompliance Certificate (ECC).
National and Regional Water Master Plans
Basin and regional framework plans for thetwelve water resources regions have been preparedby the National Water Resources Board in themiddle seventies containing an inventory ofexisting resources, facilities, managementframework and indications of the country’s needsup to 2000. The objective of this exercise is toprovide agencies in the water resources sector anoverview of the basin issues and problems outsidetheir sector, as well as, identifying opportunitiesfor joint projects. It was, however, realized thatthese framework plans are not adequate for the
integrated sustainable development andmanagement of water resources.
Adaptation Measures
Many water resource adaptation measuresare potentially available to the country to enableit to respond to climate change impacts on watersupply and demand. However, many factors willconstrain it from adopting most of them. Theseinclude financial and socio-cultural factors. Thelatter involves social and cultural behavior ortraditions that may inhibit adoption of somemeasures. In the preparation of the National ActionPlan on Climate Change, a screening processinvolving a set of criteria was used to draw up aninitial set of adaptation measures for the sector.The criteria are as follows:
• The adaptation measure should addresshigh priority issues which involveirreversible or catastrophic consequencesof climate change, long term decisions andunfavorable trends.
• The adaptation measure is likely to beeffective.
• The measure should be inexpensive toimplement.
• The measure should be feasible and mustnot have significant barriers to overcomesuch as institutional/legal, social andcultural, market and technological.
One of the major impacts of climatechange is the change in the temporal and spatialdistribution of precipitation and temperature. Theresulting runoff or hydrological resource may beshifted in time and space. A change in thedistribution with respect to time and space ofrunoff could greatly affect the effectiveness ofexisting system(s). Adaptation measures in thewater resources sector, in this context, could bedivided into two major classes:
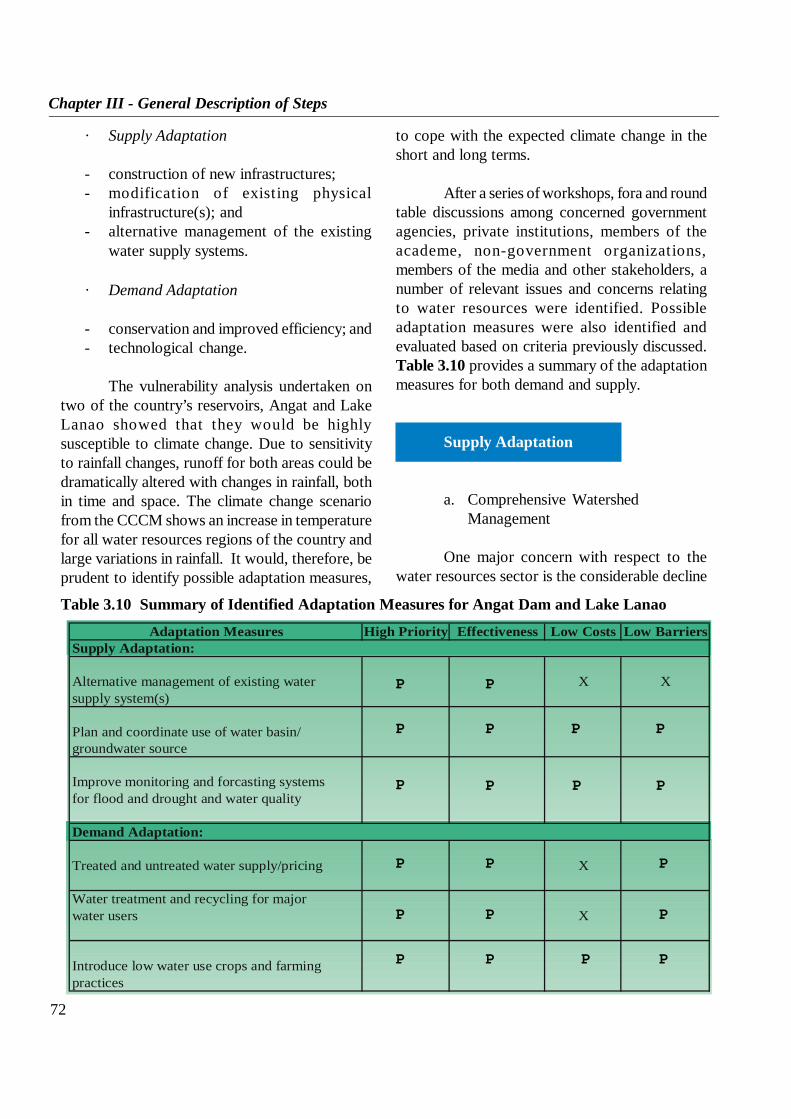
72
Chapter III - General Description of Steps
to cope with the expected climate change in theshort and long terms.
After a series of workshops, fora and roundtable discussions among concerned governmentagencies, private institutions, members of theacademe, non-government organizations,members of the media and other stakeholders, anumber of relevant issues and concerns relatingto water resources were identified. Possibleadaptation measures were also identified andevaluated based on criteria previously discussed.Table 3.10 provides a summary of the adaptationmeasures for both demand and supply.
Supply Adaptation
a. Comprehensive WatershedManagement
One major concern with respect to thewater resources sector is the considerable decline
Table 3.10 Summary of Identified Adaptation Measures for Angat Dam and Lake Lanao
Adaptation Measures High Priority Effectiveness Low Costs Low BarriersSupply Adaptation:
Alternative management of existing water X Xsupply system(s)
Plan and coordinate use of water basin/groundwater source
Improve monitoring and forcasting systemsfor flood and drought and water quality
Demand Adaptation:
Treated and untreated water supply/pricing X
Water treatment and recycling for majorwater users X
Introduce low water use crops and farmingpractices
P P
P P P P
P P P P
P P P
P P P
P P P P
· Supply Adaptation
- construction of new infrastructures;- modification of existing physical
infrastructure(s); and- alternative management of the existing
water supply systems.
· Demand Adaptation
- conservation and improved efficiency; and- technological change.
The vulnerability analysis undertaken ontwo of the country’s reservoirs, Angat and LakeLanao showed that they would be highlysusceptible to climate change. Due to sensitivityto rainfall changes, runoff for both areas could bedramatically altered with changes in rainfall, bothin time and space. The climate change scenariofrom the CCCM shows an increase in temperaturefor all water resources regions of the country andlarge variations in rainfall. It would, therefore, beprudent to identify possible adaptation measures,

73
Chapter III - General Description of Steps
of watersheds. Excessive logging and shiftingcultivation in the watersheds triggered widespreaddegradation and consequent erosion and siltationof rivers, lakes and reservoirs (Santos, 1997). TheAngat and Lake Lanao watershed areas face thiskind of problem in the future.
The watershed management programs ofthe government aimed at rehabilitating watershedareas are key steps in preventing degradation ofthe country’s existing watershed areas. Strictimplementation of existing forestry rules andregulations should also be undertaken by bothconcerned government and private entities.
b. Water Allocation System andProcedures
Water allocation is a powerful tool formanaging the demand for water. In the Angatreservoir, irrigation and hydropower are prioritizedover domestic water supply. However, in times ofdrought or emergency, domestic water supply getspriority over all the others within the limits of theusers’ water rights as determined by the NWRB.Conflicts arise when the MWSS withdraws waterfrom the reservoir over and above its existing waterrights, in the process, expropriating a portion ofNIA’s (in charge of irrigation) water rights. Severalstudies are now being conducted that wouldprovide recommendations on water reallocationand compensation schemes to meet the demandof the sectors drawing from the Angat reservoir,particularly in the event of drought/floods in thefuture.
Demand Adaptation
a. Enhancement of irrigation efficiency
As the greatest consumer of water, theagricultural sector needs to increase its efficiencyin water use such that water saved could be used
for other purposes. The problem in the irrigationsubsector is low water use efficiency due totechnical and institutional deficiencies, i.e.,flooding in the wet season and inadequate wateravailability during the dry season. The dilapidatedstate of canal structures in the irrigation systemsand the low water use efficiencies result in waterloss. Some of the possible responses to enhanceirrigation efficiency in the NIA systems are:changing the cropping schedule to reduce thedemand for irrigation at the end of the dry season;use of canal lining to reduce water losses;maximizing the use of available water through theconstruction of reservoir-type projects andredesign of irrigation facilities to reuse returnflows.
b. Introduction of low water use cropsand efficient farming practices
Majority of the farm areas that rely on thereservoirs like Angat for irrigation are planted torice. And, since the crop needs substantial amountsof water from land preparation to its reproductivestage, most of the water from reservoirs,particularly of Angat, is used by the agriculturalsector. During times of drought, the supply ofwater from the Angat reservoir has not beensufficient to irrigate a substantial portion of theconcerned farmlands. The need to look foralternative crops that use less water would thenbe imperative. With the necessary support andassistance from the Department of Agriculture,introduction of such crops can be started.
Use of drip irrigation, mulching, improvedirrigation practices and the use of windbreaks toreduce windspeed and evapotranspiration are somefarming practices that could be adopted (Baradas,1996).
c. Recycling (Reuse) of water
Due to the recurrent shortages of water,the policy of the government is to encourage reuse

74
Chapter III - General Description of Steps
of the drought/flood monitoring and forecastingcapability of the concerned entities. It has beenshown that droughts and floods have tremendouseffects on water resources, and climate change islikely to affect the frequency of droughts andfloods. Improvement of the present system ofknowing in advance future occurrences of suchevents could be translated to improved watermanagement. Monitoring systems will help incoping with these changes and would still bebeneficial even without climate change.
e. Use of water pricing policies and structures
Water has traditionally been treated as apublic good and the government is expected tobear the cost of making this commodity accessible
to the population. With thegrowing scarcity of water,especially in Metro Manila,and the constraints onfinancial resources, there isnow an increasing tendencyto shift to a commodityfocus wherein users bear thefull cost of being suppliedwith water.
f. Promotingawareness ofclimate variabilityand change
The public and somedecision makers frequentlydo not understand climaticvariability and the potential
risks of climate change. Because climaticadaptation will affect the individual,organizational, and policy levels, awareness on theimpact of climate variability on every member ofthe community is important. Increasing sensitivityto climate issues will facilitate adoption ofmeasures to prepare for climate variability andchange.
of effluent in agriculture and industry. Industriesare encouraged to save water and adopt measuresto reuse their effluents for other secondarypurposes. In the case of irrigation systems,drainage water reuse is another possibility forextending the supply of water. Installation ofdrainage reuse systems are now being undertakenby the NIA and the farmers to supply water to areaswhich cannot be reached through the normalirrigation channels.
Water used for power generation, as inmultipurpose dams like the Angat Reservoir andLanao Lake, is rechanneled for domestic use andirrigation. Households, during serious watershortages, are likewise encouraged to reuselaundry water for flushing and cleaning toilets anddriveways.
d. Improvement of monitoring andforecasting systems for floods anddroughts
One adaptation measure that would entaillesser cost and encounter less constraints relativeto other adaptation measures is the improvement
Lanao Lake, used for power generation, is rechanneled for domestic use andirrigation.
75
Chapter III - General Description of Steps
b.) Affordable and reasonable prices whichmeans ensuring energy supply at lowestcost; and
c.) Socially and environmentally compatibleenergy infrastructures and projects, whichis the provision of cleaner energy, takinginto consideration benefits for the hostcommunities.
New and Renewable Energy
Under the Plan, new and renewable energysources are envisioned to contribute significantlyto the country’s electricity requirements. Totalinstalled capacity from NRE over the next ten (10)years is projected to be around 410 MW.
Biomass fuel supply potential which iscurrently estimated to be 247.9 MMBFOE, isexpected to grow annually by 2.2%, reaching 301.5MMBFOE by 2008.
Of this total, municipal wastes willcontribute 133.1 MMBFOE, wood/wood wastes,97.7 MMBFOE, coconut residues, 26.2MMBFOE, bagasse, 21.6 MMBFOE, animalwastes, 13.4 MMBFOE and rice residues, 9.6MMBFOE.
For the period 1999-2008, solar PVsystems, totaling about 19 MW, are likewiseprojected to be installed. Wind, meanwhile, isexpected to contribute a maximum of about 145MW to the grid by 2008. Off-grid wind turbinegenerators are projected to contribute 36.9 MWwhile micro-hydro installations, 8.52 MW at theend of the period. Ocean energy is hoped tocontribute around 30 MW to the grid also at thistime.
The incremental contribution of the NREsector is expected to be brought about by the
Mitigation Strategies
Under the UNFCCC, the developedcountry Parties have the primary responsibility toadopt policies and measures to limit theiranthropogenic emissions of greenhouse gases andto report these to the Conference of the Parties forits review. Developing country Parties have nosuch obligation to reduce greenhouse gasemissions.
However, the adoption of GHG abatementmeasures, particularly renewable energyproduction systems which likewise avoidgeneration of other pollutant emissions like sulfurdioxide (SO 2) and nitrous oxides (NOx),contribute to the country’s pursuit of sustainabledevelopment objectives. Hence, it is to the interestof the Philippines and its people, that thesemeasures are undertaken. These measures arereflected in the various sectoral plans, particularlythose of the Energy, Transport and Agriculturesectors.
They have likewise fed into the assessmentprocesses in initiatives like the Asia Least CostGreenhouse Gas Abatement Strategy (ALGAS)and the National Action Plan (NAP) on ClimateChange. The ALGAS drew up the least costmitigation options for the Philippines while theNAP identified the gaps and recommendedstrategic thrusts.
As Contained in the Philippine Energy Plan
Some of the Philippines’ policies andstrategies on the abatement of its greenhouse gasemissions, in the context of the above, arecontained in the most recent update of thePhilippine Energy Plan (PEP), 1999 – 2008. Theplan’s objectives are laid down as:
a.) Security of energy supply, which aims toavoid energy supply disruptions;

76
Chapter III - General Description of Steps
Overall, the capital investments for thepromotion, development and commercializationof new and renewable energy is estimated to costPHP49.3 billion. Of this, 88.6% is expected to beput up by the private sector while the governmentwill provide the remaining 11.4%.
Energy Efficiency and Demand-SideManagement
Twelve (12) energy efficiency programswill be pursued for the period 1999-2008. Theseprograms are projected to achieve around 70,600MBFOE of energy savings by 2008, translating toaround US$1,129.2 M in foreign exchange savingsand an average reduction in electricity demand of491 MW.
These programs focus on energymanagement trainings, energy efficiencyinformation campaigns, development of linkagesamong energy research and development entities,energy efficiency measures for industrialequipment and facilities and household appliances.Some of these programs likewise focus ondemand-side management of power generationand distribution utilities.
The program(s) targeted at the industrialsector are expected to generate about 28,400MBFOE energy savings by 2008 (equivalent to40.2% of the total savings). Transport sectorprograms will result in 16,300 MBFOE savingsor 23% of the total, while those for the residentialand commercial sectors will account for 15.5 and3.6%, respectively.
Specifically, some of these programs areas follows:
1. Energy Efficiency InformationCampaign
passage of policies and legislation like the Non-Conventional Energy Bill, which will try to addresssome of the barriers in the promotion andimplementation of NRE measures and projects.
The Department of Energy will continueto promote the commercialization of renewableenergy technologies through such initiatives as theDecentralized Energy System (DES) which hasestablished lending mechanisms to support theestablishment of NRE networks like the PhilippineSolar Energy Society (PSES), Biomass EnergyAssociation of the Philippines (BEAP) and theWind Energy Association of the Philippines(WEAP). Also, it will continue to providetechnical support to the rural NRE clientelethrough the Affiliated Non-Conventional EnergyCenters (ANECs). There are currently 20 ANECsin all the regions. In some regions, they are presentat the provincial level.
PAGASA’s windmill in Tagaytay City.

77
Chapter III - General Description of Steps
4. Vehicle Efficiency Standards andTesting Program
The program aims to establish fueleconomy standards and passenger carlabelling which are envisioned to achieve830 MBFOE energy savings by 2008.Activities of the program include testingand certification.
5. Systems Loss Reduction Programfor Utilities (SLRP)
The SLRP, which is an on-goingprogram, is expected to continue through2008, resulting in 870 MBFOE savings.Systems loss reduction of private utilitiesand rural electric cooperatives will beeffected through various measures.
6. Heat Rate Improvement of PowerPlants (HRIP)
The HRIP is an on-goingundertaking aimed at enhancing theoperational efficiency of around 380 powerplants over the planning period. This isprojected to result in accumulated energysavings of 4,100 MBFOE.
7. Demand-Side Management(DSM) Program
The DSM Program aims toinfluence end use electricity consumptionthrough the various activities of the electricutilities. Cumulative energy savings by2008 is projected to be 5,900 MBFOEfrom this program.
8. Financing Energy ConservationProjects
For this initiative, the government,through the DOE and with USAID
The Department of Energy, incooperation with the concerned sectors,has launched the Power Patrol and RoadTransport Patrol Programs. Theseprograms promote efficiency in electricityand gasoline fuel use in the industrial,commercial, residential and transportsectors. The Transport Patrol Program ,particularly, involves a tri-media campaignfor drivers, operators, vehicle and fleetowners, among others, on fuelconservation. Energy savings is estimatedto be 23,800 MBFOE at the end of the planperiod.
2. Energy Audit
To determine energy use patternsand energy efficiency opportunities, theDepartment of Energy provides advisoryservices, particularly on energy audits, forindustries and other establishments.Through the energy service companies, anaverage of 50 establishments are targettedfor audit annually. Potential savings fromthis exercise is estimated at 24,000MBFOE by 2008.
3. Energy Labeling and EfficiencyStandards
Through the Bureau of ProductStandards (BPS) and the Association ofHome Appliance Manufacturers (AHAM),energy efficiency standards for roomairconditioners, refrigerators, freezers andlamp ballasts will be imposed. Around7,800 MBFOE is expected to be saved bythe end of the planning period. To improveperformance of industrial fans andblowers, a National Fans and BlowerCertification Program will be developed.The Program is expected to result inapproximately 270 MBFOE energysavings.

78
Chapter III - General Description of Steps
assistance, established the TechnologyTransfer for Energy ManagementDemonstration Loan Fund (TTEM-DLF).For the planning period, the fund isprojected to provide funding for around134 projects representing about 1,070MBFOE of energy savings.
Development and Use of OtherClimate Friendly/Cleaner Fuels
The Philippines is intent on developingcleaner indigenous energy sources like natural gas,hydro and geothermal. By 2008, the Philippinedomestic gas production is expected to reach 146BCF. This is projected to be utilized for powerplants like the Iligan and Sta. Rita, which will havea total installed capacity of 2,220 MW. From analmost nil percentage share in the total energy mix,natural gas is projected to comprise 6.9% of thetotal which is 416.5 MMBFOE.
Total installed hydro capacity is expectedto double from 2,304 MW in 1998 to 4,025 MWin 2008. Hydro’s share in the total energy mix willincrease slightly from 3.7% in 1999 to 4% in 2008.Hydro projects in the pipeline and those beingcontemplated are a mix of 8 large, 2 small and 14minihydro projects over the ten-year planningperiod.
Approximately 558 MW is projected to becontributed by geothermal power to the capacitymix for the period under consideration. Totalcumulative installed generating capacity by 2008is estimated at 2,450 MW. The country’s totalresource potential was estimated at 5,000 MW in1995.
The Transport Agenda
The Transport Agenda under the 1999-2004 Medium Term Philippine Development Plan
was developed through the Philippine TransportStrategy Study, funded by the Asian DevelopmentBank.
At the core of this agenda is therevitalization of the transport sector so that it couldoperate transport services. The Agenda primarilyfocuses on the road system because it serves amajority of passengers and freight transport in thecountry. Under the scheme, the national roadnetwork is to be maintained and developed. ThePhilippine Road Classification Study (PRCS)under the ADB 6th Road Improvement Project hasmade recommendations, which, if implemented,would improve the national network.
The elements of the Road TransportStrategy/Agenda are as follows:
a.) Maintenance;b.) Rehabilitation, which would involve
reconstruction of the road structure;c.) Improvement, which would include
upgrading pavement design and bridges forheavier traffic, road widening orrealignment and junction improvements;
d.) Development of penetrator roads, whichare new roads meant to stimulatedevelopment; and
e.) Missing Links which are essentially newroads, especially port and airport accessroads.
Rail is also considered essential to thecountry’s transport system. In fact, it is envisionedto be its backbone. Within 100 kilometers of MetroManila, particularly, rail has a strategic long termrole because of the congested road networks.However, it must overcome a lot of hurdles, mainlyinstitutional. Among the other issues to beexamined are:
a.) future availability of rail route(s) throughMetro Manila;
b.) possibility of running a cross city expressservice; and

79
Chapter III - General Description of Steps
and resources. Programs to be implemented underthe Plan are:
a. Program on Man and the Environment;b. Program on Forests and Forest Products
Development; andc. Program on Institutional Development.
GHG mitigation measures are containedin the following sub-programs:
1. Soil and Watershed Conservation2. People-Oriented Forestry3. Forest Protection4. Forest Plantation Establishment
The ALGAS Proposed MitigationInitiatives
The Asia Least Cost Greenhouse GasAbatement Strategy (ALGAS) is the analysis ofthe mitigation options of 12 Asian countries,including the Philippines, under the guidance ofthe Asian Development Bank, with funding fromthe Global Environment Facility (GEF), throughthe United Nations Development Programme(UNDP).
Based on the greenhouse gas emissionsinventory of 1990 and projections of GHGs to2020, mitigation measures were drawn up for threesectors: energy, forestry and agriculture. Theprojected emissions for these sectors weregenerated utilizing a number of tools. For theEnergy Sector, the baseline scenario wasdeveloped using the Market Allocation(MARKAL) model. For the Forestry andAgriculture sectors, the Business-as-usualScenarios utilized inputs from the sectoral masterdevelopment plans but not based on any specificGHG abatement objectives.
Baseline and mitigation scenarios wereprojected to the year 2020. Mitigation scenariosfor the Energy Sector were generated for both the
c.) adoption of common technical standardsto ensure contained operation of therailway as a system.
Multi-modal transport is consideredappropriate to the country’s topography. TheAgenda, therefore, targets the development of“multi-modal corridors and establishment ofmulti-modal chains.”
The Medium Term AgriculturalDevelopment Plan (MTADP),1993-1998
The MTADP utilized the Key ProductionArea (KPA) approach for this plan period. Underthis scheme, government support was focused onareas where land and water resources could be putto best use.
Under the Plan, the main mitigationmeasures include:
a. The Balanced Fertilization Program, whichprovides location specific recommend-ation for organic and inorganic fertilizersaimed at sustaining high crop yields overlong cropping seasons without depletingthe natural resource base. It also providesguidelines for strategic distribution ofappropriate fertilizers.
b. Reduction of programmed area forirrigated rice fields;
c. Judicious use of pesticides throughIntegrated Pest Management; and
d.) Utilization of low-water use crops.
The Master Plan for ForestryDevelopment (MPFD), 1990
The MPFD serves as the government’sblueprint for managing the country’s forest lands
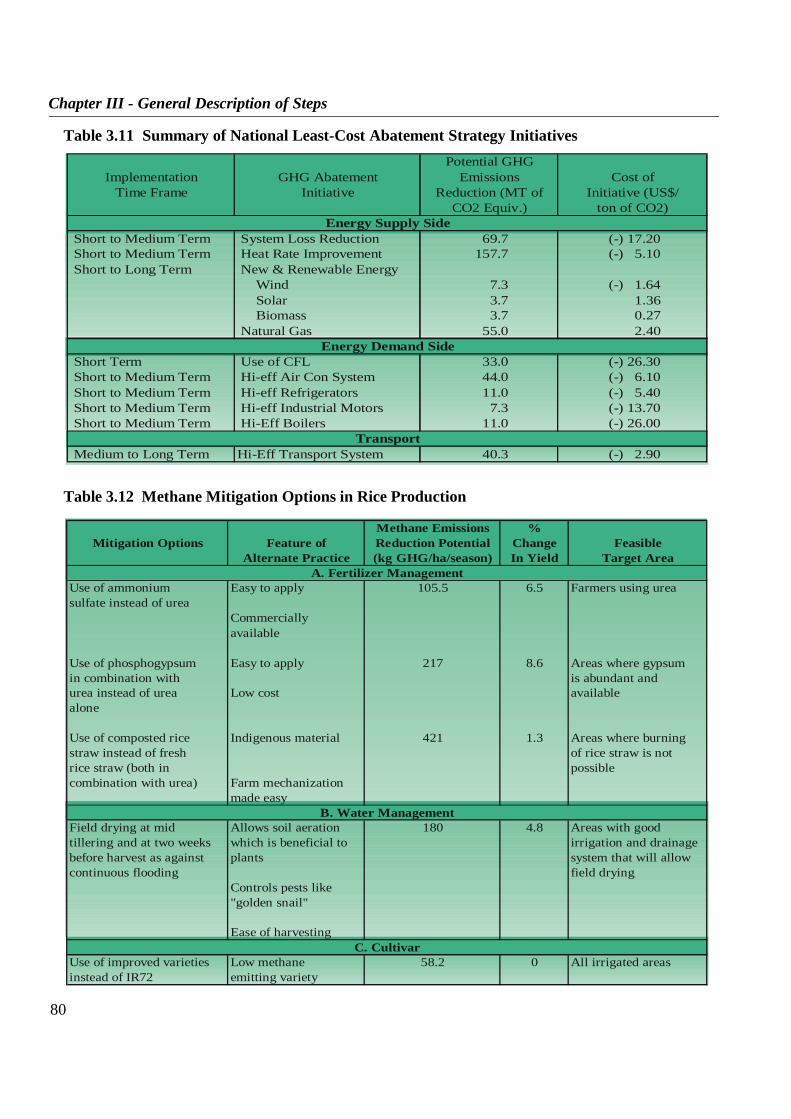
80
Chapter III - General Description of Steps
Potential GHGImplementation GHG Abatement Emissions Cost of
Time Frame Initiative Reduction (MT of Initiative (US$/CO2 Equiv.) ton of CO2)
Energy Supply SideShort to Medium Term System Loss Reduction 69.7 (-) 17.20Short to Medium Term Heat Rate Improvement 157.7 (-) 5.10Short to Long Term New & Renewable Energy
Wind 7.3 (-) 1.64Solar 3.7 1.36Biomass 3.7 0.27
Natural Gas 55.0 2.40Energy Demand Side
Short Term Use of CFL 33.0 (-) 26.30Short to Medium Term Hi-eff Air Con System 44.0 (-) 6.10Short to Medium Term Hi-eff Refrigerators 11.0 (-) 5.40Short to Medium Term Hi-eff Industrial Motors 7.3 (-) 13.70Short to Medium Term Hi-Eff Boilers 11.0 (-) 26.00
TransportMedium to Long Term Hi-Eff Transport System 40.3 (-) 2.90
Table 3.11 Summary of National Least-Cost Abatement Strategy Initiatives
Methane Emissions %Mitigation Options Feature of Reduction Potential Change Feasible
Alternate Practice (kg GHG/ha/season) In Yield Target Area
Use of ammonium Easy to apply 105.5 6.5 Farmers using ureasulfate instead of urea
Commerciallyavailable
Use of phosphogypsum Easy to apply 217 8.6 Areas where gypsumin combination with is abundant andurea instead of urea Low cost availablealone
Use of composted rice Indigenous material 421 1.3 Areas where burningstraw instead of fresh of rice straw is notrice straw (both in possiblecombination with urea) Farm mechanization
made easy
Field drying at mid Allows soil aeration 180 4.8 Areas with goodtillering and at two weeks which is beneficial to irrigation and drainagebefore harvest as against plants system that will allowcontinuous flooding field drying
Controls pests like"golden snail"
Ease of harvesting
Use of improved varieties Low methane 58.2 0 All irrigated areasinstead of IR72 emitting variety
C. Cultivar
B. Water Management
A. Fertilizer Management
Table 3.12 Methane Mitigation Options in Rice Production

81
Chapter III - General Description of Steps
Supply and Demand sides. Using the MARKALmodel, twelve least cost options were generated.These are contained in Table 3.11. Factors utilizedinclude availability of resources, marketpenetration and readiness of technology.
In the agriculture sector, use of lowmethane (CH4) emitting rice cultivators had thehighest abatement potential, while use of sulfatefertilizers had the lowest. Mitigation optionsconsidered for rice cultivation are given in Table3.12.
The Forestry and Land Use SectorMitigation Assessment under ALGAS generateda number of options such as forests plantation,urban forestry and sustainable forest management,among others.
GHG Mitigation in the Context of theNational Action Plan (NAP) onClimate Change
It must be stressed that the NAP is aframework plan which aims to identify the generalthrusts to be focused on by the stakeholders,particularly the government, to address the issueof climate change. The prescribed mitigationmeasures are, therefore, largely directional, meantto provide guidance to sectoral agencies like theDepartments of Energy, Agriculture and Trade andIndustry, among others.
For the energy, transport and industrysectors, the following actions are proposed underthe NAP:
1. Energy and Transformation
A. Shift the energy mix towards renewableenergy
- Building of commercial proto-types toaccumulate operating data
- Least cost planning and full costaccounting
- Research and technology cost trendsof renewables (solar, wind, biomass,hydro)
B. Revise efficiency targets- Supply-side efficiency improvements;
power plants efficiency improvement;transmission loss reduction; replace-ment of coal plants with natural gascombined cycle plants
- Demand side efficiency improve-ments; energy conservation, use ofenergy efficient technologies
- Energy-efficient designs for new build-ings
2. Transportation
A. Traffic improvement scheme
- Development and use of efficient masstransport systems
- Use/promotion of non-motorizedtransport modes
- Emission control schemes focusing onimproved fuel and vehicle efficiency
- Parking facilities development bypublic and private sector
- Improvement of road markings andsignages, as well as, intersectioncontrol
B. Travel demand management
- Traffic volume reduction measure suchas the Unified Vehicular VolumeReduction Program (UVVRP)
- Road pricing or area licensing schemefor urban railway corridors (i.e. MRTand LRT)
- Staggered commuting scheme- Fuel and vehicle tax policy- Land use control and growth
management

82
Chapter III - General Description of Steps
3. Industry
- Implementation of energy efficiencymeasures
- Promotion of energy conservation- Use of alternative non-CO2 emitting
industrial processes
For the agriculture sector, the NAPproposes the following:
- Use of tubular polyethylene bio-digesters and urea-molasses mineralblock as nutrient supplement in animalproduction
- Use of sulfate fertilizers to reducemethane emissions
- Use of rice straw, water managementand low-emitting cultivars
- Upgrading of food storage anddistribution systems
- Promotion and implementation ofjudicious land-use planning
Over-all, it can be seen that although thePhilippines does not have any legally bindingcommitment to reduce greenhouse gas emissions,it is undertaking a considerable number ofmeasures to abate the generation of such.
Total and sectoral mitigation potential(s)have been estimated and specific projectsidentified to realize these potential(s). At themoment, however, further analysis of theseproposed options are being undertaken to ensurethat those to be undertaken, in addition to measuresalready being implemented as contemplated underthe various sectoral plans and the MTPDP, are inconsonance with the country’s sustainabledevelopment objectives.
The avowed policies, to promote thewidespread use of renewables, maximization ofenergy efficiency opportunities, promotion ofclimate-friendly technologies and practices and
protection/enhancement of the country’s forestresources are expected to shape and guide thedevelopment of these mitigation activities andundertakings. These policies are enshrined inExecutive Order (E.O.) No. 462 (on renewables,in particular, ocean, solar and wind) Republic Act(RA) 8749 or the Clean Air Act and the variouslaws on forest protection, among others.
83
Chapter IV - Financial, Technological Needs and Constraints
Issues And Concerns
1. National Greenhouse Gas Inventory
Despite the fact that the Philippines hasundertaken two greenhouse gas inventories andin the process, presumably built considerable ca-pacity in preparing its national greenhouse gas in-ventory on a regular basis, it is plagued by a num-ber of problems threatening sustainability of theexercise. These problems and issues are as fol-lows:
he Philippines, like other developing countries, is faced with a number of con-straints in its efforts to continue communicating information under the Climate ChangeConvention. These constraints include financial, as well as, technological ones. It islikewise severely ill-prepared for the onslaught of the impacts of climate change.
Below is a documentation of these contraints, primarily the problem onsustainability of the inventory process, capacity to undertake vulnerability, adaptationand mitigation assessments, as well as, capacity to draw up and implement strategies asa result of these assessments.
Chapter IV
FINANCIAL, TECHNOLOGICAL NEEDSAND CONSTRAINTS
T
· Availability, Reliability and Variability ofActivity Data and Emission Factors
For activity data, problems includedata gaps, prohibiting more accurate com-pilation of greenhouse gas emissions.Some are highly variable because of con-tinuous updates, compromising their reli-ability. In some cases, these data are out-right unreliable. More and more, there is agrowing consensus that the default factorsutilized for the inventory are not represen-tative of the country’s actual situation.
84
Chapter IV - Financial, Technological Needs and Constraints
There is, therefore, a need to generate lo-cal statistics through researches and fieldstudies to be participated in by concernedagencies and entities.
· Institutionalization and Linkages
In some agencies, while data areavailable, there is a dearth of manpowerto regularly produce the inventory. This isbecause the inventory is not included intheir regular functions and mandates.There is, therefore, a need to institutional-ize the inventory process within the vari-ous participating agencies. Specifically, astatistical framework and database infor-mation system for the inventory should beestablished. A linkage mechanism to en-able academe to continuously feed into thisdatabase information system should like-wise be established. Table 4.1 lists in de-tail the issues attending the inventory pro-cess by sector.
Overall, to lower uncertainties in the in-ventory process, sensitivity analysis should be un-dertaken, while addressing the above issues ofcountry specific data and emission factors needs.
2. Mitigation
Among the main issues confronting thePhilippines involving mitigation of greenhousegases is the affordability of the technologies itwould like to use, e.g. utilization of renewables inpower production. In view of this, interventionsin terms of overcoming market barriers for thewidespread use of renewables need to be under-taken. Also, more applications need to be imple-mented to gain field experience and additionaloperating data.
While an initial assessment of the country’smitigation potential has been undertaken with
projects like the ALGAS, additional assessmentinitiatives and subsequent identification of green-house gas abatement projects should be carriedout. For example, the wastes sector representsconsiderable abatement opportunities but its fullpotential has not yet been determined.
Moreover, a single mitigation strategyneeds to be agreed upon. To this end, an integra-tion should be made of the various GHG abate-ment efforts being proposed and contemplatedunder the various sectoral plans and the MTPDP,as well as those proposed by such project as AL-GAS and the NAP. This should be done in thecontext of the developments in the climate changenegotiations.
The capacity of implementing institutionsand entities is another issue which must be ad-dressed. Mechanisms, structures and entitiesneeded to implement the integrated abatementstrategy should either be established or strength-ened. A policy and institutional framework shouldbe drawn up. Training of critical sectors and groupsshould be undertaken, particularly in the fields ofrenewable energy and energy efficiency, amongothers. Specifically, training in the use of plan-ning models like the MARKAL is needed.
Information and data management shouldbe strengthened and enhanced. To this end, net-works of information centers should be establishedto facilitate the flow of information from the in-formation source(s)/provider(s) to the users.
3. Vulnerability and Adaptation
The following issues and concerns havebeen identified in the conduct of vulnerability andadaptation assessment under the various studiesmade for the three (3) major sectors (agriculture,water resources and coastal resources) in the coun-try:
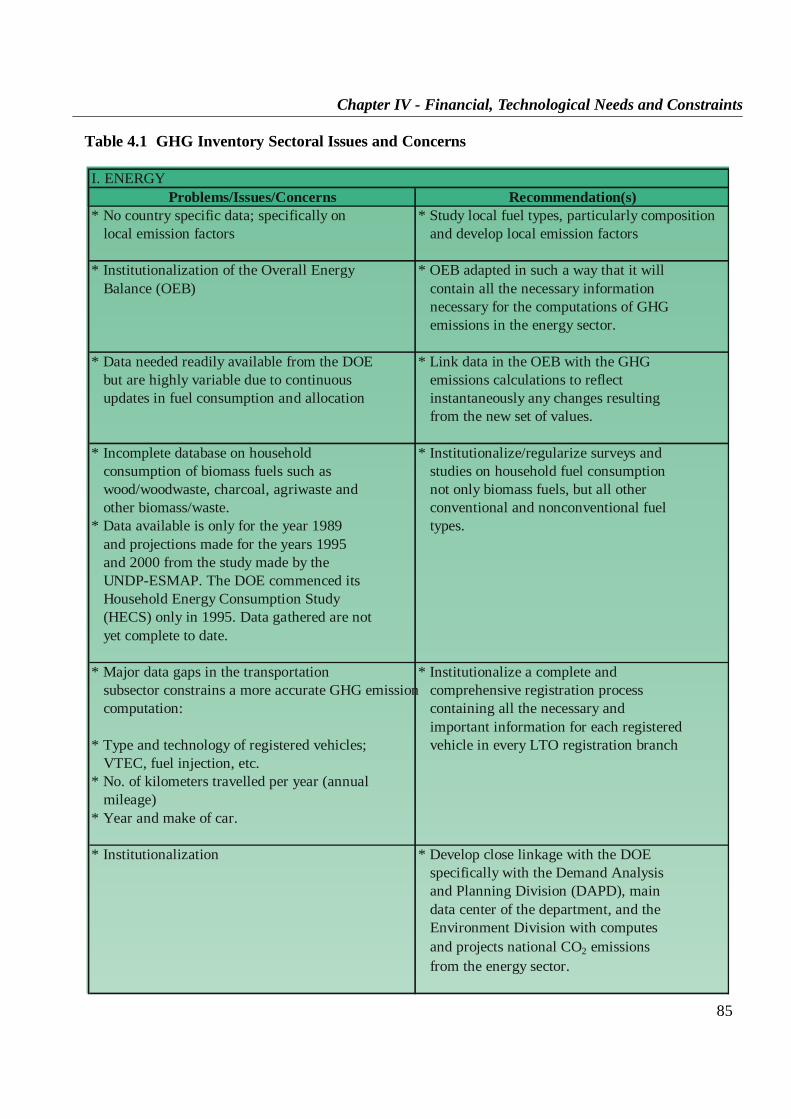
85
Chapter IV - Financial, Technological Needs and Constraints
I. ENERGYProblems/Issues/Concerns Recommendation(s)
* No country specific data; specifically on * Study local fuel types, particularly compositionlocal emission factors and develop local emission factors
* Institutionalization of the Overall Energy * OEB adapted in such a way that it willBalance (OEB) contain all the necessary information
necessary for the computations of GHGemissions in the energy sector.
* Data needed readily available from the DOE * Link data in the OEB with the GHGbut are highly variable due to continuous emissions calculations to reflectupdates in fuel consumption and allocation instantaneously any changes resulting
from the new set of values.
* Incomplete database on household * Institutionalize/regularize surveys andconsumption of biomass fuels such as studies on household fuel consumptionwood/woodwaste, charcoal, agriwaste and not only biomass fuels, but all otherother biomass/waste. conventional and nonconventional fuel
* Data available is only for the year 1989 types.and projections made for the years 1995and 2000 from the study made by theUNDP-ESMAP. The DOE commenced itsHousehold Energy Consumption Study(HECS) only in 1995. Data gathered are notyet complete to date.
* Major data gaps in the transportation * Institutionalize a complete andsubsector constrains a more accurate GHG emission comprehensive registration processcomputation: containing all the necessary and
important information for each registered* Type and technology of registered vehicles; vehicle in every LTO registration branch
VTEC, fuel injection, etc.* No. of kilometers travelled per year (annual
mileage)* Year and make of car.
* Institutionalization * Develop close linkage with the DOEspecifically with the Demand Analysisand Planning Division (DAPD), maindata center of the department, and theEnvironment Division with computesand projects national CO2 emissionsfrom the energy sector.
Table 4.1 GHG Inventory Sectoral Issues and Concerns

86
Chapter IV - Financial, Technological Needs and Constraints
II. INDUSTRYProblems/Issues/Concerns Recommendation(s)
* Availability of data, this being highly * Draw in other data sources like DTI anddependent on what industrial firms, estates, PEZA which also issue annual permitsor associations choose to provide forregulatory purposes (especially to the DENRor EMB or any such regulatory body as wellas any indirectly related purpose)
* Reliability of data * Involve NGOs like the Philippine Businessfor the Environment (PBE) which are pro-active in the environment awarenesscircles
* Involve industrial associations, e.g. PISI,SPIK, PHILCEMCOR, PHINMA, etc. toincrease cooperation within sectors.
* Institutionalize inventory methodologieswithin DTI, NSCB, and EMB all of whichalready have most of the requisite dataavailable. Possibly develop local emissionfactors for highly emissive sectors likecement and iron and steel.
III. AGRICULTUREProblems/Issues/Concerns Recommendation(s)
* Deficiency on country-specific factors and * Generate local statistics by conductingdata. Default factors not representative of researches and surveys to be participatedcountry's actual situation in by concerned agencies such as BAS,
BAI, IRRI, PhilRice, etc.
* Institutionalization * Establish a statistical framework and adatabase information system for theinventory
Domestic Livestock* Present data on distribution of animal manure * Ascertain actual distribution of animal
among animal wastes management systems manure among the animal wastesare estimations only. management systems
Prescribed Burning of Savanna* Lack of country-specific statistics (biomass * Undertake research studies, with the DA/FMB
density of savanna, fraction of exposed as lead agenciesbiomass that is burned, etc.) necessary forthe estimation of emission
Burning of Agricultural Residues * Conduct research/survey on culturalpractices of local farmers to generate dataon crop residue
Agricultural Soils Management* No country-specific factors
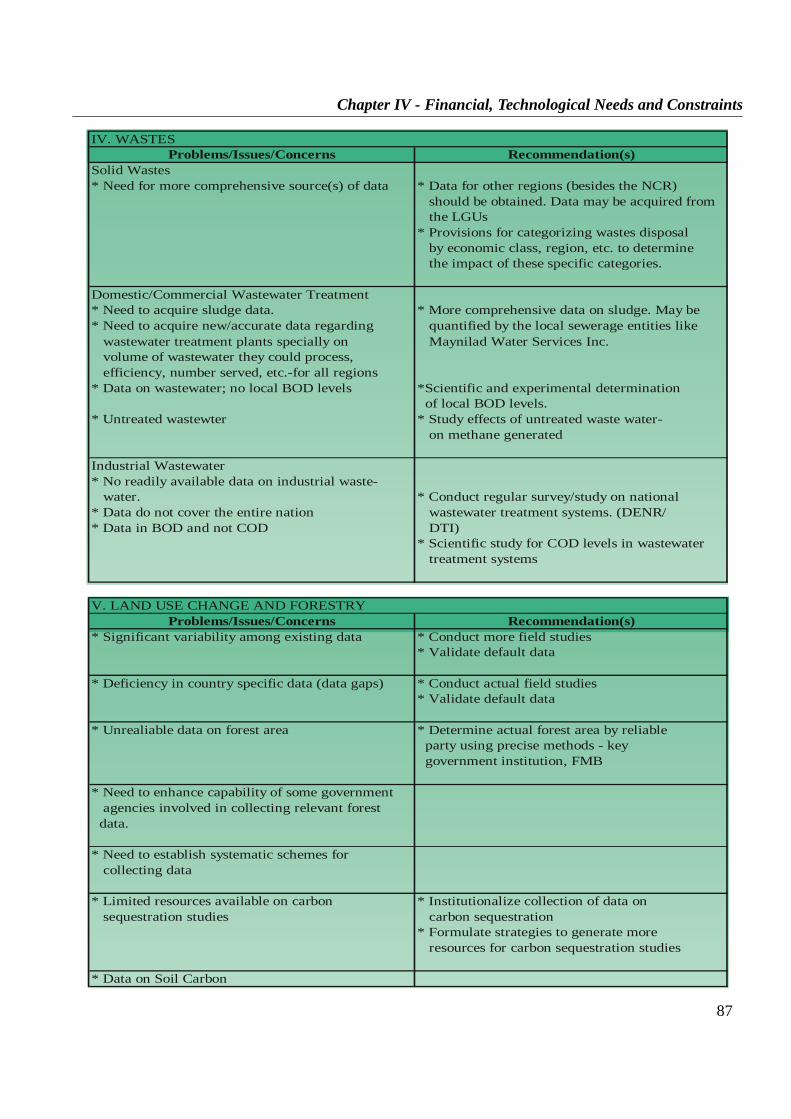
87
Chapter IV - Financial, Technological Needs and Constraints
IV. WASTESProblems/Issues/Concerns Recommendation(s)
Solid Wastes* Need for more comprehensive source(s) of data * Data for other regions (besides the NCR)
should be obtained. Data may be acquired fromthe LGUs
* Provisions for categorizing wastes disposalby economic class, region, etc. to determinethe impact of these specific categories.
Domestic/Commercial Wastewater Treatment* Need to acquire sludge data. * More comprehensive data on sludge. May be* Need to acquire new/accurate data regarding quantified by the local sewerage entities like
wastewater treatment plants specially on Maynilad Water Services Inc.volume of wastewater they could process,efficiency, number served, etc.-for all regions
* Data on wastewater; no local BOD levels *Scientific and experimental determinationof local BOD levels.
* Untreated wastewter * Study effects of untreated waste water-on methane generated
Industrial Wastewater* No readily available data on industrial waste-
water. * Conduct regular survey/study on national* Data do not cover the entire nation wastewater treatment systems. (DENR/* Data in BOD and not COD DTI)
* Scientific study for COD levels in wastewatertreatment systems
V. LAND USE CHANGE AND FORESTRYProblems/Issues/Concerns Recommendation(s)
* Significant variability among existing data * Conduct more field studies* Validate default data
* Deficiency in country specific data (data gaps) * Conduct actual field studies* Validate default data
* Unrealiable data on forest area * Determine actual forest area by reliableparty using precise methods - keygovernment institution, FMB
* Need to enhance capability of some governmentagencies involved in collecting relevant forestdata.
* Need to establish systematic schemes forcollecting data
* Limited resources available on carbon * Institutionalize collection of data onsequestration studies carbon sequestration
* Formulate strategies to generate moreresources for carbon sequestration studies
* Data on Soil Carbon

88
Chapter IV - Financial, Technological Needs and Constraints
On the use of simulation models (GCMs)in predicting various climate change scenarios, anumber of uncertainties associated with their usehave been cited which must be dealt with, suchas:
· The models have weaknesses in couplingthe land surface and atmospheric hydro-logical cycles simulations of regional cli-mate and extremes, particularly with re-gard to precipitation;
· The spatial resolution of current GCMsis too coarse to capture local changes inprecipitation and temperature;
· There are uncertainties in the projected cli-mate scenarios in terms of changes in tem-peratures, rainfall amounts, solar radiation,etc. The GCMs used are run at fairly coarseresolution (grid points are at 5° longitudeby 5° latitude or roughly 555 kms by 555kms.), so that discrepancies exist betweensimulations and observed climate becauseeven variability in the climate are also, asyet, not well simulated. There is muchmore natural variation in local climate thanin climate averaged over larger scales.
· For the vulnerability and adaptation assess-ments done under the Philippine CountryStudy, only the GCM equilibrium (2 xCO2) temperature, rainfall and radiation areused as inputs. Effects of extreme climaticevents including that of strong winds dueto tropical cyclones were not consideredin the scenarios.
Agriculture
Currently, a number of policies and mea-sures are critically needed in order to develop thecountry’s capability to address climate change is-sues. Foremost are a national land use policy, togenerate more support for farmers and those that
would increase the adoption of modern technolo-gies.
Considering that the national studies (e.g.The Philippine Country Study) have been mainlyfocused on vulnerability and adaptation (V & A)assessment of rice and corn production to projectedimpacts of climate change, a number of gaps needto be addressed. These are:
· V & A of production of other importantcrops (i.e. sugar cane, coconut, cash crops,etc.) and of livestock;
· assessment of the changes in geographi-cal and seasonal distribution of thermaland water resources important to crop andlivestock production;
· assessment of reduction in GHG emissionswith the implementation of the BalancedFertilization Program;
· assessment of reduction in GHG emissionfrom different mixes of adaptation strate-gies;
· development of management methodsfrom adaptation of agriculture systems tothe predicted increased CO2 concentrationsand associated climate change;
· assessment of impacts of intensive farm-ing systems, especially because rice pro-duction needs to meet demands of increas-ing population; and,
· assessment of long-term effects of climatechange on soil fertility and effectivenessof fertilizers and chemicals.
Water Resources
The assessment of the effects of climatechange on the country’s water resources has been
89
Chapter IV - Financial, Technological Needs and Constraints
limited to surface water. One of the constraints isthe lack of direct studies on the effect of globalwarming on groundwater recharge.
Another limitation is that only changes inrainfall and temperature were considered in stud-ies on future water supply and demand. There areother climatic variables that could influence wa-ter supply and demand such as relative humidity,evapotranspiration and wind speed which need tobe factored in future studies. These climatic vari-ables will likewise have significant changes withrespect to time and space as a result of changes inthe global climate system. Other external or non-climatic factors such as land use changes, increasein population, pollution and watershed degrada-tion will affect the supply-demand condition inthe future.
On information gaps, there are several ar-eas in the sector that need to be studied. Theseare:
· vulnerability assessment of other existingmajor reservoirs and river basins in thecountry. A more comprehensive vulner-ability analysis of the country’s reservoirsand river basins would provide a wider per-spective in the identification of appropri-ate adaptation measures.
· comprehensive data base for the variouswater resources regions of the country.This would in turn be of valuable impor-tance in the conduct of vulnerability analy-sis as well as adaptation assessment.
· impacts of climate change (temperature/rainfall increase) on major water users suchas the domestic, industrial and agriculturalsectors. As mentioned previously, infor-mation on the impacts of climate changeon domestic consumption, particularly ofdeveloping countries, is still vague.
· impacts of variations in temperature on the
quality of surface and ground water.· impacts of climate change on underground
water resources.
· development of proper methodologies forlong-term data projection.
A sustainable water resources managementplan that is consistent with socio-economic de-velopment goals is necessary to address the prob-lems of water use efficiency, especially in waterutilities. It is also needed to facilitate the coordi-nation and effective linkages among concernedgovernment agencies; to address the inadequatebalance of water supply and demand; and, to mo-bilize public funds and private investments to sup-port relevant projects.
Coastal Resources
The need for baseline data and monitor-ing cannot be over emphasized. There is an exi-gency for improving and extending the existingknowledge and information on long-term hydro-logic and meteorological conditions and changes(sea level, storm surge and tsunami wave heights),morphological processes, salinity intrusion, re-sponse of ecological systems (such as coral reefsto warm temperature), and availability of highresolution topographic information. This will in-volve increasing the quality and quantity of ob-serving platforms. Aside from these physical data,other information needed for all coastal zones areprovided in Table 4.2 .
The availability of the above informationin the context of a Geographical Information Sys-tem (GIS) will be beneficial in the early monitor-ing of the impending impacts of climate changeon the vulnerability and sustainability of coastalresources.
The Philippine coastal zones are alreadyexperiencing multiple problems. Among these aredeclining ecosystems (coral reefs, sea grasses,

90
Chapter IV - Financial, Technological Needs and Constraints
mangroves), low yield fish stocks, fast growingpopulations, human settlements (squatting) andconflict in use of the coastal zones/resources,among others. An integrated coastal zone man-agement is proposed to address the short and longterm problems. The short term-problems are usu-ally demand driven while climate change and itsimpacts fall in the long term time realm.
The issues and concerns involving both theshort and long term needs should be brought tothe attention of the concerned communities whoare the direct targets of the impacts, and of thepolicy makers who will direct the changes towardsadapting to these impacts. Hence, information,education and communication is essential alongwith the technical and scientific efforts to achievea well balanced adaptation plan.
Coastal Resource Social Organization Existing Environment Institutional, Legal &Base in the Coastal Zone and Resource- Related Financial Capacity
ProgramsInventory of:* Existing coastal * Existence & character * Environmental regulatory * Relevant national
resources of human settlements programs level institutions* Present use of (villages, towns) * Fisheries management * Relevant regional/
coastal resources * Economic basis for programs provincial-level* Present status of human settlements * Protected areas institutions
coastal resources * Existence of indigenous programs * Relevant local* Potential for present peoples & their tradi- * Beach/erosion mgt. institutions
and future use tional coastal activities programs * Survey of legal* Pollution control authorities relative to
programs coastal and ocean* Other environmental activities
management programs * Existing capacitybuilding efforts, inclu-ding those funded byexternal forces
Table 4.2 Coastal Zone Information Needs for Adaptation

91
Chapter IV - Financial, Technological Needs and Constraints
BIBLIOGRAPHY/REFERENCES
1. “Environment and Natural Resources Atlas of the Philippines,” Depart-ment of Environment and Natural Resources, and the Environmental Cen-ter of the Philippines Foundation, 1998.
2. “National Framework for Physical Planning, 1998-2028”, Final Draft,National Land Use Committee, National Economic and DevelopmentAuthority, February, 1999.
3. “Philippine Environmental Quality Report, 1990-1995”, EnvironmentalManagement Bureau, November, 1996
4. “Revised Guidelines for National Greenhouse Gas Inventories”, IPCC,Geneva, Switzerland, 1996.
5. “The Study on Solid Waste Management for Metro Manila in the Repub-lic of the Philippines”, Japan International Cooperation Agency, MetroManila Development Authority, 1998.
6. “Industrial Efficiency and Pollution Control and Environmental Man-agement Strategy”, Montgomery, et. al., 1992.
7. “National Action Plan on Climate Change”, unpublished, Inter-AgencyCommittee on Climate Change, 1998.
8. “Philippine Energy Plan, 1999 - 2008,” Energy Planning and MonitoringBureau, Department of Energy, 1999.
9. “Medium Term Philippine Development Plan (MTPDP), 1999 - 2004,”National Economic and Development Authority (NEDA), 1998.
10. “Asia Least-cost Greenhouse Gas Abatement Strategy - Philippines,”Asian Development Bank, Global Environment Facility, and UnitedNations Development Programme, October, 1998.
11. “Philippine Transport Strategy Study,” for the Transport Agenda of theMTPDP (1999-2004), Asian Development Bank, the Inter-Agency Tech-nical Committee for Transport Planning and National Economic andDevelopment Authority, 1996.
12. “Medium Term Agricultural Development Plan (MTADP),” through theKey Production Area (KPA) Approach: Review and Recommendations.Center for Policy and Development Studies/Center for Integrative andDevelopment Studies and NEDA, 1996.