Philippine Statistical 2011-2017... · 2017-10-26 · The Philippine Statistical Development...
142
Transcript of Philippine Statistical 2011-2017... · 2017-10-26 · The Philippine Statistical Development...


Philippine Statistical
Development Program 2011 – 2017 Update
Republic of the Philippines
Philippine Statistics Authority

The Philippine Statistical Development Program 2011 – 2017 Update
is a publication prepared by the Philippine Statistics Authority
in coordination with various agencies and stakeholders in the Philippine Statistical System
TERMS OF USE AND DISCLAIMER The PSA reserves its exclusive right to reproduce all its publications in whatever form. Any part of this
publication cannot be reproduced, recopied, lent or repackaged for any commercial purposes without written permission from the PSA. Any part of this publication may only be reproduced for personal or
internal use. Should any portion, data or information in this publication be included in a report, paper,
article or statement, the title of the publication and the PSA as publisher should be cited as the source. Any information derived from the processing of data contained in this publication shall not be the
responsibility of PSA.
ISSN 2507-9255
Published by the Philippine Statistics Authority
PSA-CVEA Building East Avenue, Diliman,
Quezon City 1101 Philippines
September 2016
The Philippine Statistical Development Program 2011 – 2017 Update is
available in print and CD ROM (pdf) formats and on the PSA website at
www.psa.gov.ph.
For inquiries, please contact us at: (632) 376-1928,
or e-mail us at [email protected].

Foreword
“A good decision is based on knowledge and not on numbers.”
-Plato
But knowledge cannot be gained without data. The numbers and statistics that we process lead to greater
insights about the true state of the nation, which lead us and the people we serve to make better decisions for national development. The Philippine Statistical Development Program (PSDP) was formulated precisely
to turn all these numbers into meaningful knowledge.
It is the blueprint in setting medium term strategic directions, thrusts and priorities of the Philippine
Statistical System (PSS) and ensures the continuous provision of vital information support to national, sectoral and local development plans, as well as international commitments. The PSDP has contributed in
providing new perspectives to policy making such as the policies and recommendations in the updated Philippine Development Plan (PDP).
But things are moving forward, which means that the PSDP needs to be updated. The System has
undergone several developments in recent years such as the establishment of the Philippine Statistics
Authority (PSA) and the Philippine Statistical Research and Training Institute (PSRTI); and the release of the Philippine Development Plan (PDP) 2010-2016 Midterm Update and its resulting Revalidated Results
Matrix (RRM). There are also recent developments and emerging concerns at the local and global statistical community – data revolution, big data, use of administrative-based data systems, the Sustainable
Development Goals (SDGs), disaster preparedness, rehabilitation and security – that bring to fore the
importance of a more responsive and timely PSDP.
This PSDP 2011-2017 Update, released by the PSA, contains an assessment of the statistical programs for the period 2011-2015 and the major statistical activities programmed for 2016 and 2017. It also includes
two new chapters: Civil Registration and Vital Statistics; and Sustainable Development Goals. The Update underwent a series of bilateral interagency meetings and consultative workshops with data producers and
users to ensure the relevance and responsiveness of the statistical programs.
No meaningful national development can take place without empowering the national statistical system.
The Updated PSDP, taking into account recent developments in the system, will help us attain sustainable development with the implementation of relevant statistical activities. With all the collaborative effort within
the PSS and the dedicated service of our people, we believe that the nation will continue its path to national
development by creating a world that is just and equitable with our people as the center of development.
EMMANUEL F. ESGUERRA
Secretary of Socioeconomic Planning and PSA Board Chairperson
April 2016
ii
Acknowledgments
Since 1976, the Philippine Statistical Development Plan (PSDP) has become a comprehensive guide in setting the directions, thrusts and priorities of the Philippine Statistical System (PSS) in the medium term. It is a strong
mechanism in addressing the major statistical challenges and concerns in the PSS and is essential in providing
the data requirements of the national and sectoral development plans.
Due to recent developments in the statistical community such as the reorganization of the PSS, the establishment of the Philippine Statistics Authority (PSA), and the release of the Philippine Development Plan (PDP) 2010-2016
Midterm Update with the Revalidated Results Matrices (RRM), it is imperative that the PSDP 2011-2017 should be updated. Moreover, the emergence of new statistical developments in the areas of data revolution, big data,
use of administrative-based data systems, climate change, disaster preparedness and the Sustainable Development Goals call for a more relevant and responsive PSDP that will address these challenges.
The PSDP Update monitors the accomplishments of the PSS for the period 2011-2015 vis-à-vis the statistical programs and activities underscored in the PSDP 2011-2017 Strategic Plan released in October 2012. Moreover,
it enunciates the initial priority and key developmental programs for 2016-2017 in line with achieving the recent information needs facing the statistical community.
The PSDP 2011-2017 Update is a product of collaborative efforts of the members of the PSS, spearheaded by
the PSA and has benefited from consultations among government and private sectors, as well as from deliberations with inter-agency committees and technical working groups, in order to enhance the relevance and
the use of PSDP across all sectors. With this, the PSA would like to acknowledge and give recognition to all
institutions and individuals who dedicated their unwavering support to ensure the successful preparation of the PSDP.
We are grateful to the respected members of the PSA Board, chaired by Socioeconomic Planning Secretary
Arsenio M. Balisacan, for their active involvement in the series of discussions and for providing guidance and advice in the formulation of the PSDP Update. Truly, the insights and recommendations they have imparted led
in the finalization and approval of the PSDP for its endorsement to the Office of the President.
We would like to especially thank the experts in official statistics, Ms. Lina V. Castro and Mr. Tomas P. Africa,
who served as advisers and consultants to further improve the various PSDP chapters and for sharing their expertise with the PSA Technical Staff.
To the members and secretariat of the various Technical Committees (TCs), Inter-agency Committees (IACs),
Task Forces (TFs), and Regional Statistical Committees (RSCs), we acknowledge the sound responsiveness and coordination as well as the views and suggestions raised through a series of meetings. Special thanks are also
extended to the chair and co-chairs of these interagency bodies and their staff for the proactive management of the entire preparation process. We are also thankful for the presence, constructive outlook and propositions of
all the institutions and individuals, data producers and users, research institutions, academe- both from the
government and private sectors- and local government, especially the distinguished resource persons who participated during the consultative workshops and meetings.
Through the PSDP, the PSA and its partners can rationalize, harmonize and mobilize resources necessary for
strengthening the institutions in the PSS, thus delivering the required investment support for the implementation of the programs that upgrade the quality as well as appreciation for statistics. We hope that through our
commitment and common vision we can better assist the government and the public in pursuing projects that count for every Filipino.
LISA GRACE S. BERSALES, Ph.D. National Statistician and Civil Registrar General
Philippine Statistics Authority

iii

iv

v

vi
About the publication / guide to users Executive Order 121, signed on 30 January 1987, mandates the Philippine Statistical System (PSS) to
formulate a comprehensive statistical program that will address the information requirements of the
country’s national development plan as well as provide for activities that will promote the development of an efficient statistical system to ensure reliability, relevance, quality, and accessibility of information
generated. The Philippine Statistical Development Program (PSDP) 2011-2017 Update outlines the key statistical developments from 2011 – 2015 and the statistical programs of the PSS from 2016 – 2017. It
embodies the statistical thrusts and strategies towards strengthening and improving the operations of the
PSS and in developing sectoral statistics in the country.
The chapters in the PSDP 2011-2017 Update were prepared by the various interagency sectoral and subject-matter committees and working groups under the overall guidance of the interagency PSDP Steering
Committee that was created by the former National Statistical Coordination Board (NSCB) through
Resolution No. 1, series of 2010, with technical and secretariat support from the PSA technical staff.
PSDP 2011-2017 Update presents the objectives, strategic thrusts and priorities of the PSS, a timeline of some key developments in the PSS from 2011 to 2015, key issues and concerns, and 25 chapters grouped
in 7 clusters that loosely parallel those of the PDP, namely: Cluster 1 – PSS-wide concerns; Cluster 2 – Macroeconomy and finance; Cluster 3 – Agriculture, industry and services;
Cluster 4 – Infrastructure development; Cluster 5 – Social development; Cluster 6 – Environment and
technology; and Cluster 7 – Governance, peace and security.
Each chapter has four sections – an introduction, two-part situational analysis (includes key developments and issues and concerns), statistical development programs, and policy uses. The introduction briefly
describes the sector, its role in the overall development agenda, and the policy framework that needs to be
measured or monitored. The situational analysis gives an idea of the current data system – the institutions, their respective statistical responsibilities, and statistics currently being produced. It also looks back at the
key or significant statistical developments in the sector during the Plan period 2011-2015 and discusses the issues and concerns that need to be addressed by the PSS. The section on statistical programs identifies
the general strategies and programs that are meant to address the key issues and concerns in the sector in 2016 and 2017. The policy uses highlight the purpose/s and/or uses of statistics in various activities
relative to development planning.
The PSDP 2011-2017 Update is available in print and on CD. It is also accessible on the internet through
the PSA website: www.psa.gov.ph. The print version can be availed at the PSA Central Office located at the PSA-CVEA Building, East Avenue, Diliman, Quezon City, Philippines.
For inquiries about this publication, please contact:
Mr. Candido J. Astrologo, Jr.
Assistant National Statistician, Standards Service Email: [email protected]
or
Ms. Lotis I. Ira Chief, Statistical Policies and Programs Division
Telefax:+632 376-1928 Email: [email protected]

vii
Executive summary
Priorities for the Development of Statistics in the Philippines: 2016-2017
The PSDP 2011-2017 envisions a responsive, effective and efficient PSS that provides quality statistics for
evidence-based decisions towards the attainment of the development goals of the nation. It serves as a
roadmap with strategic guideposts and pegs of desired outcomes that characterize the changes and reforms needed to realize the vision. With strong political support and adequate resources, the PSDP shall facilitate
and ensure the production of statistics in aid of good governance towards inclusive growth, reduced poverty, and sustainable progress in the country.
With the reorganization of the Philippine Statistical System (PSS) and the establishment of the Philippine Statistics Authority (PSA) by virtue of Republic Act 10625 otherwise known as the Philippine Statistical Act
of 2013, a new central authority for statistics arises with the renewed aspiration of building a solid and more responsive statistical system for the Philippines. In 2014, the National Economic and Development
Authority (NEDA) also released the Philippine Development Plan (PDP) 2010-2016 Midterm Update, calling for new and more up-to-date statistics to monitor the achievements of the government’s flagship programs
geared towards a better quality of life for the Filipinos.
Developments in the recent past have likewise escalated along with the growing consciousness on the value
of statistics. Data revolution calls for a reform in the way data is produced, shared, assessed, analyzed and consumed. It espouses the optimal use of administrative-based data and open data as well as third party
data sources such as big data and other non-official data to complement survey-based data and official
statistics. The most recent development framework – the 2030 Agenda or the Post-2015 Development Agenda – emphasizes the role of quality data in monitoring progress of nations, vis-à-vis the 17 Sustainable
Development Goals (SDGs) and the need to mobilize resources to support such. Given these and the emerging information demands, the PSA deemed it imperative to update the PSDP 2011-2017 Strategic
Plan.
Objectives and Strategic Thrusts of the PSDP
The PSDP 2011-2017 Update aims to continually respond to the existing and emerging requirements of development planning and policy formulation considering major institutional/structural changes, information
demands, recent events involving natural hazards and threats to national security, and adherence to
international commitments. It builds on the achievements of the PSS for the period 2011-2015 and discusses perennial issues and areas for improvement. Key programs of the PSS for the period 2016-2017 – including
the financing required, potential outputs and policy uses of statistics generated from these statistical ventures – are also identified in the document.
The strategic thrusts of the PSDP 2011-2017 Update are as follows:
1. Enhancement of the management and coordination of the PSS to ensure progressive and sustained improvement of statistics for development planning, decision-making and effective governance;
2. Improvement of data production in the PSS aimed at addressing current, new and emerging
concerns such as the Sustainable Development Goals (SDGs), data revolution, and other
sectors/areas of concern that may affect national development;
3. Enhancement of data dissemination and advocacy on the use of statistics through maximized use of information technology in statistical processes, and conduct of forums/workshops to promote
the effective use of statistics;
4. Advancement of statistical research and upgrading of systems and skills towards increased technical
capacity of human resources, as well as improvement of current methodologies which must adhere

viii
to internationally recommended standards and methods for the generation of statistics and indicators and to respond to the current and emerging needs and demands;
5. Strengthening of the local statistical system in support of countryside development;
6. Increasing investment in statistics to enable the PSS to meet the growing demand for statistics in support of evidence-based governance;
7. Promotion of international cooperation in statistics through: (a) sharing of experiences, practices
and expertise on statistics as well as adherence to international commitments and adoption of internationally-recognized statistical principles, declarations and best practices; (b) enhanced
cooperation between the PSS and the ASEAN Community Statistical System (ACSS); and (c) support
to the EU-ASEAN COMPASS Project on Capacity Building for Monitoring Integration Progress and Statistics.
Each of the chapters in the PSDP Update features a situational analysis and assessment of the
achievements, innovations, and perennial and new issues and challenges faced by the various sectors in
terms of management, coordination, production, and dissemination of statistics. Through consultations with the various interagency, technical and regional committees on statistics as well as conduct of meetings and
workshops with the stakeholders, various priority statistical programs are slated for years 2016 and 2017.
Management and Coordination of the PSS
To strengthen statistical governance and coordination, the PSS will maximize the use of information technology, implement the Data Quality Assurance Framework (DQAF), as well as establish institutional
mechanisms on the monitoring of SDGs and aid in the evaluation of the Philippine performance in the Millennium Development Goals (MDGs). Relatedly, policy studies and an action plan will be formulated to
explore the use of big data and non-official data from the private sector as complement to official statistics.
Greater attention will also be put into the System of Designated Statistics (SDS) to improve its relevance and comprehensiveness to include new indicators and activities critical to adequately measure
socioeconomic development.
Besides addressing the information needs in the monitoring of the indicators in the PDP revalidated results
matrices and SDGs, there are other commitments and framework systems in which response and action from the PSS is called for; these include among others, the Core Sets of Indicators in Agriculture and
Gender, the International Conference on Population and Development (ICPD), the Civil Registration and Vital Statistics Decade 2015-2024 and the ASEAN Framework of Cooperation in Statistics (AFCS).
Statistical Capacity Development
To ensure the preparedness of and empower the PSA and other data producers at the national and local
levels to respond effectively to increasing information demands, capacity building activities will be conducted by the PSA and the Philippine Statistical Research and Training Institute (PSRTI). The PSRTI is
envisioned to be at the forefront in improving organizations’ technical capability on statistics, efforts in
exploring new methods and further extending expertise to other members of the PSS. A PSS human resource development plan will be created to direct and maximize the PSS human capital. Moreover,
following a training needs assessment, training for the staff involved in data collection, processing and analysis will be held to enrich their skills in using new techniques and software technologies. Support to
research on new statistical methodologies and studies geared towards improving statistical survey instruments will also continue to be provided and encouraged across the PSS.

ix
Statistical Information Management and Dissemination
To bring statistics closer to its users and to strengthen cooperation of respondents and data providers, the PSS shall increase its reach to government executives, business leaders, civil society, and the media
through more frequent conduct of statistical appreciation seminars. These stakeholders shall be invited to
the various consultative meetings, dissemination fora and conferences. Statistical reports/articles will also be tailored to the needs of the public, business sector, policymakers, program implementers and
researchers.
Economic Statistics
Among the priority programs in the production of more timely, accessible, coherent, comparable, comprehensive, and relevant statistics, the PSA will undertake an earlier release of the quarterly national
accounts (i.e., from 60 days after the reference quarter to 55 days); an overall revision and rebasing of the Philippine System of National Accounts (PSNA) with 2012 as base year; as well as the generation of the
2012 Benchmark Input-Output Table. In partnership with the Bangko Sentral ng Pilipinas (BSP), the
Securities and Exchange Commission (SEC) and the Commission on Audit (COA), the initial work on the compilation of corporate statistics will be institutionalized in 2016.
The PSA in collaboration with the Department of Tourism (DOT), aims to update the Philippine Tourism
Statistical Classification System (PTSCS) in view of the updating of the Philippine Tourism Satellite Accounts (PTSA) and to better illustrate the variety of tourism activities and products in the country. Monitoring of
the country’s research and development (R&D) expenditures will also be strengthened through the
compilation of data on Government Budget Allocation for R&D (GBOARD) based on DBM’s Unified Accounts Code Structure (UACS). The sampling frame for crops, livestock, poultry, and fisheries surveys will also be
updated using the findings of the 2012 Census of Agriculture and Fisheries (CAF).
To facilitate the encoding and processing of responses, phone tablets are programmed to be used in the
various price surveys of the PSA as well as in other socioeconomic surveys of other survey proponent agencies.
Monitoring the Environment, Peace, and Security
Other data producing agencies will also lead in the conduct of key statistical programs for the period
2016-2017. The Department of Environment and Natural Resources (DENR), particularly the Land Management Bureau (LMB), will verify and publish the results of its cadastral survey. On the other hand,
the Department of Justice (DOJ) and its partner agencies will start the establishment of the National Justice Information System (NJIS) to facilitate data sharing/collaboration mechanism among justice sector agencies
towards enhancing government capacity to deter crimes, track down criminals, monitor criminality, and,
ultimately, administer justice.
Statistics on Social Development
While PSA will focus on the compilation of population and housing estimates in 2016, it will also lead in several activities towards the development of other areas of social statistics. The PSA will generate provincial
labor and employment statistics based on the Labor Force Survey (LFS) starting 2017 using the 2013 Master Sample, and develop the multidimensional poverty index (MPI). The Technical Education and Skills
Development Authority (TESDA) and the PSA will continue working towards the designation of statistics on school-based and non-school-based technical vocational education and training (TVET). Meanwhile, the
Department of Health (DOH) and the PSA will move for the adoption of the System of Health Accounts
(SHA) 2011 as the framework for the Philippine National Health Accounts (PNHA). Preparatory activities will be undertaken by the PSA in 2017 in line with the conduct of the National Demographic and Health Survey

x
(NDHS) in 2018. To guide compilation of data at the local level, the PSA shall also spearhead the formulation of Core Regional Indicators System (CRIS), which is targeted to be institutionalized in 2016.
Investments for Statistical Development
Generating quality statistics also necessitates adequate and accessible financing. To increase investment
and institutionalize a sustainable resource mobilization strategy for statistics, the PSA, in collaboration with the Department of Budget and Management (DBM) and through the PSA Board, will move for the
implementation of PSA Resolution No. 10, s. 2015, “Enjoining Agencies to Provide Separate Line Items for Statistical Activities”. Specifically, an Object Code for “statistical activities” in the UACS will be included to
enable agencies and local government units to explicitly indicate budget appropriations for statistical
activities. The “generation of quality and timely data" category will also be advocated for integration in the Organizational Outcomes/Programs in the Program Expenditure Classification (PREXC) of government
agencies producing administrative data. Preparatory work for the medium-term expenditure framework (MTEF) of the PSA is also targeted to be undertaken in 2016 so that statistics will be integrated into the
government’s expenditure planning and management.
Through the PSDP 2011-2017 Update, everyone is called upon to take part in the various efforts of the
PSA, the PSRTI and other data producing agencies to reach out to users and data providers. After all, the respectable reputation of the PSS in the international statistical community was built through years of active
interaction between statisticians in both public and private sectors, as well as with data users and providers who openly speak their needs and supply much-needed information. It is thus the aspiration of the PSS to
witness and feel the statistics that they produce, ultimately result in uplifting the standards of life in the
country and reaching the deprived sectors of the society.

xi
Table of contents Foreword …………………………………………………………………………………………………………………………………….…………… i Acknowledgments ………………………………………………………………………………………………………………………..…………… ii PSA Resolution No. 8, s. 2015 ……………………………………………………………………………………………………….………….. iii About the publication/Guide to users …………………………………………………………………………………………….…………… vi Executive summary …………………………………………………………………………………………………………………………..……… vii Acronyms and abbreviations ………………………………………………………………………………………………………….…………. xii Strategic planning framework ………………………………………………………………………………………………………….………… xiv Cluster 1: Philippine Statistical System (PSS)-wide concerns …………………………………………………………….……..…. 1 Chapter 1 – Management and coordination of the PSS ……………………………………………………..…..… 2 Chapter 2 – Statistical capacity development ………………………………………………………………….…...… 5 Human resource development …………………………………………………………………….…...… 5 Statistical research and development ………………………………………………………….…...…. 9 Chapter 3 – Statistical information management and dissemination ……………………………….…...…… 12 Chapter 4 – Millennium and Sustainable Development Goals ……………………………………………………. 16
Chapter 5 – Local Statistics Development ………………………………………………………………..………..…….. 20 Cluster 2: Macroeconomy and finance ……………………………………………………………………………………….……….…… 25 Chapter 6 – Macroeconomic accounts and statistics …………………………………………………..…..………. 26 Chapter 7 – Monetary and financial statistics ………………………………………………………..………..……… 30 Cluster 3: Agriculture, industry, and services ……………………………………………………………………………..…..………… 33 Chapter 8 – Agriculture and fisheries statistics ………………………………………………………..……..………. 34 Chapter 9 – Industry, trade, and investment statistics ……………………………………………..……..……… 40
Industry statistics ……………………………………………………………………………………..…… 40 Trade statistics ……………………………………………………………………………….………..…… 42 Investment statistics ………………………………………………………………………………….…… 44
Chapter 10 – Tourism statistics ……………………………………………………………………………..………..……… 46 Cluster 4: Infrastructure development ……………………………………………………………………………………………..….….. 49 Chapter 11 – Transport statistics ………………………………………………………………………..………………..… 50 Chapter 12 – Energy statistics ……………………………………………………………………………..……………….… 52 Chapter 13 – Information society statistics …………………………………………………………..……………..…… 54 Cluster 5: Social development …………………………………………………………………………………………….…………….……. 57 Chapter 14 – Population and housing statistics …………………………………………………….………………..…. 58 Chapter 15 – Income, poverty, and hunger statistics ………………………………………….………………..…… 63 Chapter 16 – Labor and employment statistics ………………………………………………….………………..……. 68 Chapter 17 – Education and culture statistics ……………………………………………………………………..……. 71 Chapter 18 – Health and nutrition statistics ………………………………………………………………….…..……… 75 Chapter 19 – Social protection statistics ………………………………………………………………………….……….. 82 Chapter 20 – Statistics on children and gender and development …………………………………..…..……… 87 Chapter 21 – Civil registration and vital statistics …………………………………………………………..………….. 92 Cluster 6: Environment and technology ……………………………………………………………………………………….………..… 97 Chapter 22 – Environment and natural resources statistics ……………………………………………….……….. 98 Chapter 23 – Science and technology and innovation statistics ………………………………………………….. 105 Cluster 7: Governance, peace and security ………………………………………………………………………………………………. 109 Chapter 24 – Governance statistics …………………………………………………………………………………………. 110 Chapter 25 – Peace and security statistics ……………………………………………………………………………….. 114 Appendix – Planning Committees …………………………………………………………………….………………………….……......... 120

xii
Acronyms and abbreviations
National government agencies and other organizations
B
Bangko Sentral ng Pilipinas BSP
Board of Pardons and Parole BPP
Bureau of Agricultural Statistics BAS
Bureau of Animal Industry BAI
Bureau of Corrections BuCor
Bureau of Immigration BI
Bureau of Jail Management and Penology
BJMP
Bureau of Labor and Employment Statistics
BLES
Bureau of Local Government Supervision
BLGS
C
Commission on Audit COA
Commission on Elections COMELEC
Commission on Filipinos Overseas CFO
Commission on Higher Education CHED
Council for the Welfare of Children CWC
Court of Appeals CA
D
Dangerous Drugs Board DDB
Department of Agriculture DA
Department of Budget and Management
DBM
Department of Education DepEd
Department of Energy DOE
Department of Environment and Natural Resources
DENR
Department of Health DOH
Department of Interior and Local Government
DILG
Department of Justice DOJ
Department of Labor and Employment
DOLE
Department of Public Works and Highways
DPWH
Department of Science and Technology
DOST
Department of Social Welfare and Development
DSWD
Department of Tourism DOT
E
Ecosystems Research and Development Bureau
ERDB
Environment Management Bureau EMB
F
Food and Nutrition Research Institute FNRI
Forest Management Bureau FMB
G
Government Service Insurance System
GSIS
H
Housing and Urban Development Coordinating Council
HUDCC
I
Intellectual Property Office of the Philippines
IPOPHL
L
Laguna Lake Development Authority LLDA
Land Management Bureau LMB
M Mines and Geosciences Bureau MGB
N
National Agricultural and Fishery Council
NAFC
National Bureau of Investigation NBI
National Center for Culture and the Arts
NCCA
National Council for Disability Affairs NCDA
National Dairy Authority NDA
National Economic and Development Authority
NEDA
National Food Authority NFA National Mapping and Resource Information Authority
NAMRIA
National Meat Inspection Service NMIS
National Nutrition Council NNC
National Police Commission NAPOLCOM
National Prosecution Service NPS
National Statistical Coordination Board
NSCB
National Statistics Office NSO
National Tobacco Administration NTA
National Wages and Productivity Commission
NWPC
P
Food and Drug Administration Philippines
PhilFDA
Parole and Probation Administration PPA
Philippine Carabao Center PCC
Philippine Coconut Authority PCA
Philippine Commission on Women PCW Philippine Council for Agriculture, Forestry and Natural Resources Research and Development
PCARRD
Philippine Drug Enforcement Agency PDEA Philippine Fisheries Development Authority
PFDA
Philippine Health Insurance Corporation
PHIC
Philippine Institute for Development Studies
PIDS
Philippine National Police PNP
xiii
International development partners/ organizations
Others
Philippine Overseas Employment Administration
POEA
Philippine Statistical Association, Incorporated
PSAI
Philippine Statistical Research and Training Institute
PSRTI
Philippine Statistics Authority PSA
Power Sector Assets and Liabilities Management Corporation
PSALM
Professional Regulation Commission PRC
Protected Areas and Wildlife Bureau PAWB
Public Attorney's Office PAO
S
Science Education Institute SEI
Securities and Exchange Commission SEC
Social Security System SSS
Statistical Research and Training Center
SRTC
Sugar Regulatory Administration SRA
Supreme Court SC
T
Technical Education and Skills Development Authority
TESDA
U
University of the Philippines UP University of the Philippines National College of Public Administration and Governance
UP NCPAG
University of the Philippines Institute of Statistics
UPLB INSTAT
University of the Philippines School of Statistics
UPSS
Autonomous Region in Muslim Mindanao
ARMM
Business intelligence BI
Cordillera Administrative Region CAR
Enumeration areas EAs
Environment and Natural Resources ENR
Geographic Information System GIS
Geospatial Information Management GIM
Global Positioning System GPS
Higher education institutions HEIs
Highly urbanized cities HUCs
Indigenous People IPs
Information and communications technology
ICT
Information, education and communication
IEC
Local Government Unit LGU
Major statistical agencies MSAs
Management Information System MIS
Master Sample MS
Memorandum of Agreement MOA
Millennium Development Goals MDGs
National government agencies NGAs
National Capital Region NCR
Negros Island Region NIR
Outside National Capital Region ONCR
Overseas Filipino Workers OFWs
Philippine Development Plan PDP
Philippine Statistical System PSS
Republic Act RA
Research and development R&D
Science and technology S&T
Small area estimation SAE
State universities and colleges SUCs
Statistical research and development SR&D
Sustainable Development Goals SDGs
Asia Pacific Economic Cooperation APEC
Asian Development Bank ADB
Association of Southeast Asian Nations
ASEAN
Australian Agency for International Development
AusAID
Food and Agriculture Organization FAO
Government of Japan GOJ
International Labor Organization ILO
International Monetary Fund IMF
Japan International Cooperation
Agency JICA
Organisation for Economic Cooperation and Development
OECD
Partnership in Statistics for Development in the 21st Century
PARIS21
Spanish Agency for International Development Cooperation
AECID
United Nations Children's Fund UNICEF
United Nations Development Programme
UNDP
United Nations Economic and Social Commission for Asia and the Pacific
UNESCAP
United Nations Educational, Scientific and Cultural Organization
UNESCO
United Nations Office on Drugs and Crime
UNODC
United Nations Population Fund UNFPA
United Nations Statistical Institute for Asia and the Pacific
UN SIAP
United Nations Statistics Commission UNSC
United Nations Statistics Division UNSD
United States Agency for International Development
USAID
World Bank WB
World Health Organization WHO

xiv
Strategic planning framework
1. Macroeconomic accounts and statistics 2. Monetary and financial statistics 3. Agriculture and fisheries statistics 4. Industry, trade and investment statistics 5. Tourism statistics
6. Transport statistics
7. Energy statistics
8. Information society statistics 9. Population and housing statistics 10. Income, poverty and hunger statistics 11. Labor and employment statistics 12. Education and cultural statistics 13. Health and nutrition statistics 14. Social protection statistics 15. Statistics on children and gender and development
16. Civil registration and vital statistics 17. Environment and natural resources statistics 18. Science and technology and innovation statistics 19. Governance statistics
20. Peace and security statistics
21. Local statistics development
22. Millennium and Sustainable Development Goals
21. Local statistics development
Statistical Information
Management and Dissemination
Statistical Capacity
Development
Statistical
Research and
Development
Financing
Statistical
Development
Management
and
Coordination
of PSS
- policies
- frameworks
PSDP 2011-2017 Update
RA 10625
- Reorganization
of the PSS
- Establishment
of the PSA
and PSRTI
P S R T I
Philippine Statistics Authority
PDP 2011-2016
Midterm Update
Revalidated Results
Matrix
Other new and
emerging statistical
demands:
-use of admin-
based data
-big data
-data revolution
1
1- PSS-wide concerns
1 - PSS-wide concerns

2
Chapter 1 – Management and Coordination of the PSS Introduction
The Philippine Statistical Development Program (PSDP) 2011-2017 Update envisions a responsive,
effective and efficient Philippine Statistical System (PSS) that provides quality statistics for evidence-
based decisions towards the attainment of the development goals of the nation.
In recent years, there have been various
developments within and around the PSS which necessitated reprogramming of statistical activities,
to wit:
(1) the enactment of Republic Act No. 10625 also known as the Philippine Statistical Act of 2013
which reorganized the PSS and established the Philippine Statistics Authority (PSA) and the
Philippine Statistical Research and Training Institute (PSRTI);
(2) the Midterm Update of the Philippine
Development Plan (PDP) 2010-2016 and the resulting Revalidated Results Matrix (RRM); and
(3) the adoption of the post 2015 development
agenda or the Sustainable Development Goals (SDGs) with 17 goals and 169 targets, and
other new and emerging concerns with demand
for statistics in the areas of administrative-based data systems, data revolution, big data,
climate change, among others.
These developments called for the revisiting and
updating of the PSDP 2011-2017 to ensure that it is
attuned with these emerging concerns. The PSDP 2011-2017 Update contains updates on
23 chapters and 2 new chapters, i.e., Civil
Registration and Vital Statistics, and Millennium and Sustainable Development Goals.
To facilitate the implementation of the sectoral statistical development programs, various statistical
coordination mechanisms and programs were also
identified in the following chapters: (1) Management and Coordination of the PSS -
involves the formulation of relevant statistical policies and resolutions and
development/updating of statistical frameworks
and indicator systems;
(2) Financing Statistical Development;
(3) Statistical Information Management and
Dissemination - includes programs that takes advantage of information technology in
statistical processes (use of tablets, GIS), data dissemination and communication (website,
social media) and statistical advocacy;
(4) Statistical Human Resource Development - involves the conduct of capacity building
programs; and
(5) Statistical Research and Development.
Situational Analysis
❖ Key Developments in 2011 – 2015
Formulation of a strategic statistical development policy agenda to guide the
following statistical operations in the PSS: ▪ Revision of the Guidelines on the Modification of
Designated Statistics;

3
▪ Institutionalization of the generation of data on Information and Communication Technology, and Business Process Outsourcing Services;
▪ Supporting the declaration of a roadmap for data revolution;
▪ Establishment of statistics committees of the PSA;
▪ Adoption of the PSS agenda in support of the Busan Action Plan for Statistics;
▪ Approval of the budgetary thrusts of the PSS; and
▪ Approval and adoption of the general policy on production, release and dissemination of
microdata in the PSS.
Application of appropriate technology in data dissemination such as data visualization
techniques, infographics, geospatial
information systems and social networking.
Establishment and convening of Regional
Statistics Committees (RSCs) in all regions.
Preparation and results dissemination of the
Country Report on Support to Statistics (CRESS) – Philippines.
❖ Issues and Concerns
Need to upgrade business processes towards
improving the timeliness and access to statistics.
Need to address emerging information needs of the SDGs, PDP RRMs and other data
frameworks.
Need to strengthen coordination mechanisms at all levels to ensure more timely delivery of
quality statistical information and services.
Need for adequate statistical human
resources and sustainable financing for the PSS activities.
Need to upgrade/adopt new technologies to facilitate collection, processing and
dissemination of statistical information.
Need to widen appreciation and utilization of
statistics.
Need for monitoring and evaluation of
identified statistical programs.
Statistical Programs for 2016 and 2017
❖ Summary
Formulation of a roadmap on automation of operations of the PSA and the PSS agencies
by using mobile tablets and web-based data collection methods for the Labor Force Survey
(LFS), Family Income and Expenditure Survey
(FIES), Consumer Price Index (CPI), Annual Survey of Philippine Business and Industry
(ASPBI) and agricultural surveys.
Enhancement of the following statistical
information systems at the national and local levels: ▪ Civil Registry System-Information Technology
Project (CRS-ITP2);
▪ Philippine Civil Registry Information System (PhilCRIS);
▪ Decentralized Vital Statistics System (DVSS);
▪ Civil Registry Information System for Barangays (CRISB);
▪ Unified Multi-Purpose ID (UMID) databases;
▪ CountryStat Philippines;
▪ Field Health Services Information System;
▪ Unified Health Management Information System;
▪ Development of the Philippine Health Information Exchange;
▪ Integrated Clinic Information System – Online Reporting Rural Health Units;
▪ Basic Education Information System (BEIS);
▪ Monitoring and Updating of Education Data through the Monitoring Network (MoNet);
▪ CHED Electronic Collection and Knowledge System (CHECKS);
▪ Tourism Statistics and Information Systems;
▪ Labor Laws Compliance System – Management Information System;
▪ Skills Registry System;
▪ GIS-based statistical information systems;
▪ Forestry Information System;
▪ Foreshore Area Management Information
System; and
▪ Land Administration and Management Information System.
Review of censuses and surveys vis-à-vis the Data Quality Assurance Framework (DQAF).

4
Formulation of an action plan on the
implementation of frameworks in the generation and quality assurance of statistics
about the Philippines relative to the Association of Southeast Asian Nations
(ASEAN) integration.
Establishment of institutional mechanisms on
the monitoring of development goals in the
Philippines: ▪ SDGs:
- Identification of source agency focal persons and designation of the PSA as the central repository of SDG indicators;
- Identification of priority indicators relevant/needed to monitor the SDGs;
- Development of estimation methodologies to generate SDG indicators not currently produced;
- Synchronization of survey conduct and results dissemination with the monitoring of SDGs and Results Matrices;
- Formulation of a statistical capacity building program to equip PSS agencies with tools and methodologies; and
- Release of the SDG Watch and maintenance of database on the SDGs.
▪ Millennium Development Goals (MDGs):
- Updating of MDG Watch; and
- Release of MDG Brochure/Infographics.
Formulation, compilation and release of the National Development Indicators (NDIs).
Implementation of the Administrative Records Review and Clearance System
(ARRCS) pursuant to National Statistical
Coordination Board (NSCB) Resolution No. 6, Series of 2004, “Review and Clearance of
Administrative Reporting Forms for Statistical Purposes.”
Conduct of policy studies on the feasibility, benefits and challenges of using: (a) Big data
in the context of official statistics and the
SDGs; and (b) Data from non-traditional sources (i.e. used by private entities, civil
society organizations or CSOs and non-government organizations or NGOs) and
development of an action plan of PSS
agencies on using such in official decision-making.
Implementation of PSA Resolution No. 10, s.
2015, “Enjoining Agencies to Provide Separate Line Items for Statistical
Activities/Projects in the Annual Agency Budget.”
Creation of an Object Code for “statistical activities” in the Unified Accounts Code
Structure (UACS) to guide agencies and local
government units in the preparation of budget appropriations for statistical activities.
Integration of the generation of quality and timely data in the organizational
outcomes/programs in the Program Expenditure Classification (PREXC) of
government agencies producing
administrative data.
Formulation and implementation of the
medium-term expenditure framework to finance statistical work on the SDGs and
NDIs, and monitoring requirements for the PDP RRMs and to rationalize statistics
resource planning and mobilization in the
PSA.
Institutionalization of the CRESS –
Philippines.
Harmonization of PSDP monitoring with the
CRESS reporting system.
Adoption of the “General Principles and
Guidelines on Revision Policy for Data Released by Agencies in the PSS”.
Dissemination of the PSDP 2011-2017 Update through conduct of workshops in the regions
and distribution of the PSDP 2011-2017 Update publication.
Preparation of the PSDP 2017-2023.
Modification of the System of Designated
Statistics to ensure the continuous generation of data needed for decision-making.
Formulation of a financial plan for the PSDP through the Medium Term Expenditure
Framework (MTEF).

5
Chapter 2 – Statistical Capacity Development Human Resource Development
Introduction
One of the essential conditions for the Philippine Statistical System (PSS) to achieve its goals is the
availability of quality human resources to undertake statistical work and contribute to the progressive
development of statistics. Although there are other
important factors that affect the ability of the PSS to manage and coordinate the government
statistical service, it is the sustained capability of the statistical workforce that ultimately delivers the
statistics needed in governance and development.
It is therefore necessary to continually build the capacity of the statistical workforce and institutions
in order to sustain effective and efficient response to the ever growing demand for statistics by
decision makers, planners, researchers, and service
providers in all sectors of society. Human resource planning, management, and development in the
PSS are at the core of essential statistical capacity development measures towards ensuring the
effectiveness and efficiency of the government
statistical service.
This section presents a general framework for
statistical capacity development of the human resources in the PSS.
Situational Analysis
❖ Key developments in 2011 – 2015
Establishment of the Philippine Statistical Research and Training Institute (PSRTI) in
2013, strengthening the statistical training and research arm of the PSS. The PSRTI was
established by virtue of Republic Act 10625, known as the “Philippine Statistical Act of 2013”, to carry out the following functions for Human Resource Development; (a) develop a comprehensive and integrated research and training program on the theories, concepts and methodologies for the promotion of the statistical system; (b) conduct non-degree training programs to upgrade the quality of statistics personnel and expand the statistics human resource base in support of the needs of the PSS; and (c) provide scholarships, financial and other forms of assistance to build statistical manpower and enhance training and statistical research and development.
Continuous conduct of regular and customized statistical training programs for
government, academe and private offices, as
well as conferences, seminars, workshops, activities, dialogues, and fora. The PSRTI
conducted a cumulative total of 244 training programs within the period, 2011-2015, upgrading the knowledge and skills of a total of 4,556 participants. The PSRTI regularly offers training programs twice a year with offerings approved by the PSRTI Governing Board. This include regular
programs on Statistical Data Management and Basic Statistics, Statistical Analysis, Statistical
Modelling, Sampling and Survey Design, Special Topics in Statistics, and Dissemination of Statistics. Aside from these regular programs, the PSRTI also conducted custom-designed training programs on specific subject matters on statistics as requested by government agencies or private institutions which comprised about 69% of the total training programs conducted by the PSRTI.

6
The Philippine Statistics Authority (PSA) has likewise conducted trainings on the following: (a) Data Processing, Review and Validation for the 2015-2016 Survey of Food Demand for Agricultural Commodities and Back-to-back Briefing on the Phil-WAVES Initiative and National Capital Accounting; and (b) First Level Training for the 2015-2016 Survey on Food Demand for Agricultural Commodities.
Enhanced international cooperation on
statistical capacity building. A number of
statistical training initiatives have been conducted jointly by the PSS with multilateral institutions. These include initiatives such as the Regional Workshop on Data Dissemination and Communication (RWDDC) held on 20-22 June
2012 as part of a global series of workshops on data dissemination and communication intended to provide a forum for sharing national practices and experiences in the dissemination of statistical data and metadata. Co-hosted by the United Nations Statistics Division (UNSD) and the former National Statistical Coordination Board (NSCB) and supported by the International Commitment Fund of the Department of Foreign Affairs, the workshop was attended by 35 participants from 23 different countries, as well as representatives from various international organizations.
The former NSCB also collaborated with the Partnership in Statistics for Development in the 21st Century (PARIS21) in conducting the First User-Producer Dialogue on Statistical Capacity
Development for Inclusive Growth held on 5 December 2012. The forum was attended by representatives from key government agencies, including major statistical agencies, legislature and local government, as well as from the private sector, media, civil society, academe, and international organizations.
Improvement of statistical education. Meanwhile, the Philippine Institute for Development Studies (PIDS), in collaboration with the PSRTI, conducted advocacy meetings with the academe on further improvement of statistical education by enhancing statistical teaching methods to make learning statistics more interesting.
Participation in national and international
cooperation programs, conventions, seminars, etc. Some PSS personnel continued to
participate in national and international cooperation programs, conventions, and seminars as the opportunity arises (discussed specifically in sectoral chapters).
Conduct of statistical appreciation seminars for government, executives, business
leaders, civil society, and media.
❖ Issues and Concerns
Inadequate human resources in the PSS to
respond to expanded and still growing user needs. ▪ Recent government rationalization policy has
adversely affected the level and capacity of the human resources in major statistical agencies (MSAs). Since 2005, there has been a continuous decline in the number of government statisticians in the MSAs. The reduction in statistical personnel has caused delays in the production of some statistical indicators and suspension of some statistical activities and outputs. Statistical capacity building activities as well as research and development were done to a limited extent at the local levels.
▪ The same policy has further marginalized statistics in national government agencies (NGAs) whose rationalization plans have either excluded or downgraded existing statistical units and positions.
▪ Only a few local government units (LGUs) have a dedicated unit or statistical personnel for collecting and compiling statistics for local development planning. There is no concrete policy and plan for expanding human resources at the local levels to include statistical personnel.
▪ There is quick turnover and hence loss of some trained government statisticians to the private sector and international community due to more competitive compensation packages and better opportunities for professional growth in these institutions. There is urgent need to review and upgrade the compensation and incentives system for statistical personnel.
▪ Meanwhile, the demand for more development indicators with greater amount of detail, local-
Table 1. Total number of training programs and beneficiaries or participants by type of training program from 2011 to 2015.
Year Training Program Beneficiaries/Participants
Regular* Customized All Regular* Customized All
2011 10 29 39 186 417 603
2012 5 39 44 135 737 872
2013 24 22 46 476 433 909
2014 19 44 63 398 921 1,319
2015 18 34 52 332 521 853
2011-2015 Total
76 168 244 1,527 3,029 4,556

7
level disaggregation, and more frequent updates has increased tremendously. The situation is especially challenging in the basic social services and less statistically developed areas such as governance, climate change, disaster, and environment.
There are no mechanisms for integrating and coordinating human resource planning,
management, and development in the PSS, specifically for the discussion of critical
human resource issues in the PSS such as
attrition and succession planning and management.
Lack of an integrated and comprehensive statistical human resource development
program for the PSS. ▪ An integrated PSS plan for human resource
development can contribute to greater focus on core competencies needed by the PSS, more rational strategies, and maximized resources for continuous development of statistical personnel at the national and local levels.
▪ There is a need to revisit and improve training designs and methods for more effective results.
Given the demand for Sustainable Development Goal (SDG) indicators, there is
a need to mobilize resources towards statistical capacity building on data
production or development of methodologies
for SDG indicators which are not yet being generated as well as address demand for
more data disaggregation.
Inadequate training staff to cope with the emerging challenges. ▪ As of 2011, the former Statistical Research and
Training Center (SRTC) had only five technical staff attending to its statistical training services which translate to a 1:13 to 1:14 ratio of training staff to training programs in a given year. Even with the existing regional training affiliates, the current staff complement is extremely insufficient to serve the increasing training needs of the PSS at the national and local levels. Three years after the passage of the 2013 Statistics Act, the new staffing pattern of the
PSRTI has yet to be approved.
▪ The lack of statistical human resources has affected staff productivity and service quality levels due to work overload. It has also prevented the development of new courses and training materials and retooling of staff for better performance. Moreover, the PSRTI still does not have regional manpower.
▪ The existing PSRTI training facilities are inadequate to accommodate growing clientele and are not at par with those of other national
statistical systems. With only one computer laboratory good for only 25 training participants and two small training rooms with limited capacity of 15 participants each, other participants are sometimes requested to bring their own computers or the PSRTI rents the necessary computers. The entire PSRTI offices sit on leased property and are not ideally fit for a training and research center.
▪ Due to resource constraints, the PSRTI still has limited statistical software, i.e., Stata and Eviews. Ideally, a statistical training center must be equipped with other systems widely used in statistical processes such as SAS and SPSS.
▪ Compensation for resource persons and experts likewise needs to be reviewed and updated to be at par with rates offered by local and international training institutions providing highly technical and specialized capacity building services. A fair and competitive scheme must be put in place commensurate to extraordinary qualifications and extensive experience of resource persons.
Need to review and enhance the current
system of statistics education to better respond to the PSS needs. ▪ It is important to ensure that enrolment and
number of graduates in statistics courses is robust and sufficient to build adequate human capital for the PSS.
▪ There has been little addition to the pool of professionally educated statisticians in the country. Previous scholarship programs to support postgraduate studies in statistics have been limited and have not created much impact for various reasons. Also, while the Department of Science and Technology (DOST) has included and promoted statistics in its existing scholarship program, the response has been low.
▪ More active career orientation and promotion and proactive recruitment process are needed to attract more statistics graduates into the PSS.
▪ Institutional coordination among stakeholders, e.g., MSAs, academe, Department of Education (DepEd), and Commission on Higher Education (CHED), needs to be strengthened to improve content and delivery of statistics courses as part
of the basic and tertiary education programs.
▪ There are calls for a review of postgraduate programs and for provision of better facilities and guidance to students.
Need to provide statistical capacity building
for data users. There is a need to improve
statistical literacy and capacity of data users, including NGAs, LGUs, the private sector and media, for more rational and wider use of statistics.

8
Statistical Programs for 2016 and 2017
❖ Summary
Formulation of an action plan to improve the
statistical human resources for the PSS given the current and emerging information
demands by various stakeholders.
Conduct of training needs assessment
covering the current statistical personnel to equip them with new skills and knowledge.
To enhance statistical capacities of data producers and providers: ▪ Continuous conduct of specialized trainings for
compilers and data providers engaged on the following priority topics: (a) Income, Poverty, and Hunger Statistics, (b) Macroeconomic Accounts and Indicators, and c) SDGs.
▪ Statistical Capacity Building of LGUs, local data producers and users of Health and Nutrition Statistics, and the implementation and use of community-based monitoring systems to support monitoring of poverty.
▪ Training on statistical software such as SPSS, STATA and other tools that will help the staff in analyzing and reporting data effectively and efficiently.
▪ Enhance capabilities of staff involved in the processing and generation of vital statistics.
▪ Philippine Statistical Research and Training Institute-Higher Education Institutions (PSRTI-HEIs) Partnership for regional coverage of training programs.
▪ Conduct of workshops on implementation of new or improved systems in generating and disseminating statistical data, such as the Advanced Data Planning Tool (ADAPT), Microdata Documentation and Dissemination, National Data Archive (NADA).
Enhancement of current efforts in developing a Master’s Degree Program on Official
Statistics to increase human capital and
strengthen professional and career development in statistics.
Conduct of appreciation seminar for government executives, business leaders,
civil society, and media.
Intensive advocacy campaign on the
importance of civil registration through
seminars, trainings or mobile registration up to the depressed areas and marginalized
populations.
Approval of the staffing pattern of the PSRTI.
Creation/increase of statistical units and positions of NGAs and LGUs.
9
Chapter 2 – Statistical capacity development Statistical research and development
Introduction
An essential element of an effective and efficient statistical system is a strong statistical research and
development (SR&D) culture. SR&D involves the development of testing and experimentation of
statistical theories, concepts, definitions, methods, and techniques. SR&D is primarily undertaken to
improve aspects of or the entire process of
statistical data production to deliver timely, relevant, and reliable statistical information in the
most cost effective and efficient ways.
This section outlines the strategic plan towards the institutionalization of the culture and system of
SR&D in the PSS.
Situational Analysis
❖ Key developments in 2011 – 2015
Establishment of the PSRTI in 2013, to
strengthen the training and research arm of the PSS. The PSRTI was established by virtue of
Republic Act 10625, known as the “Philippine Statistical Act of 2013”, to continually develop and promote research programs and to carry out the
following functions: (a) undertake research on statistical concepts, definitions and methods; (b) promote collaborative research efforts among members of the academic community, data producers and users; and (c) serve as repository of all statistical researches and studies to be generated by the PSA as well as back-up/duplicate files of data archives and other statistical
databases of the PSS.
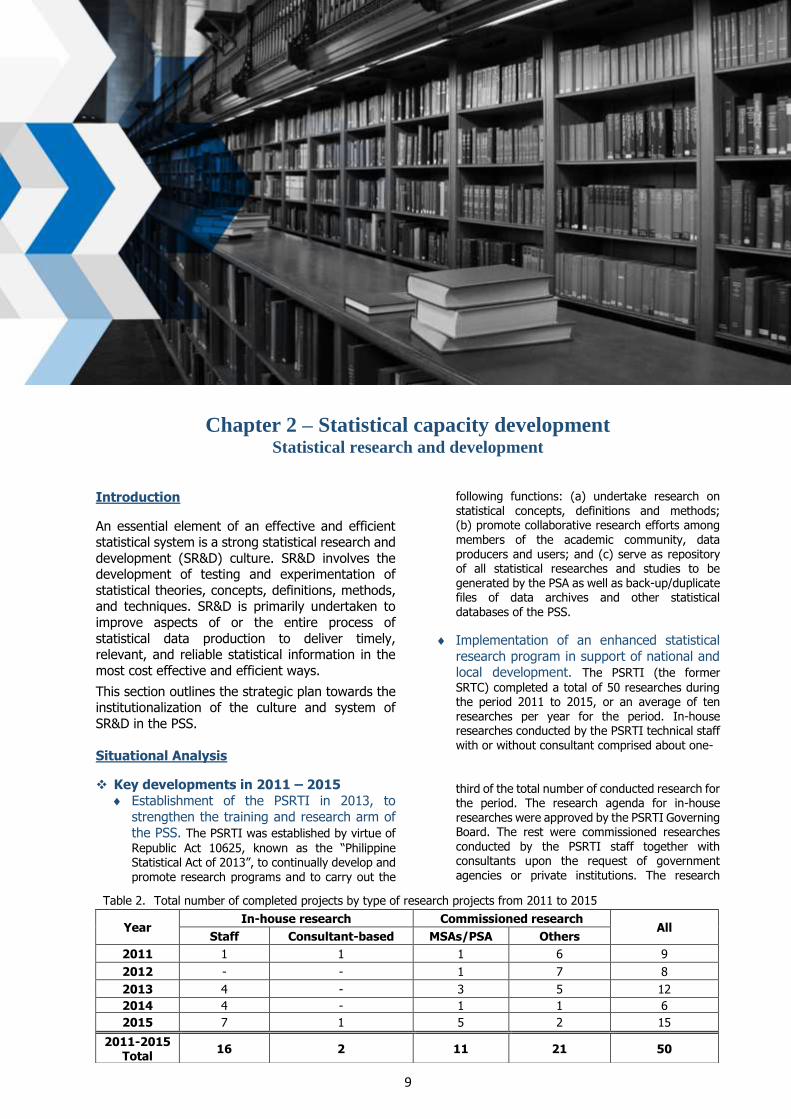
Implementation of an enhanced statistical
research program in support of national and local development. The PSRTI (the former
SRTC) completed a total of 50 researches during the period 2011 to 2015, or an average of ten researches per year for the period. In-house researches conducted by the PSRTI technical staff with or without consultant comprised about one-
third of the total number of conducted research for the period. The research agenda for in-house researches were approved by the PSRTI Governing Board. The rest were commissioned researches conducted by the PSRTI staff together with consultants upon the request of government agencies or private institutions. The research
Table 2. Total number of completed projects by type of research projects from 2011 to 2015
Year In-house research Commissioned research
All Staff Consultant-based MSAs/PSA Others
2011 1 1 1 6 9
2012 - - 1 7 8
2013 4 - 3 5 12
2014 4 - 1 1 6
2015 7 1 5 2 15
2011-2015 Total
16 2 11 21 50

10
topics pursued were selected to address issues affecting the statistical production process, dissemination and utilization of statistics, or the need for analytic study of certain development issues. During the period 2011 to 2015, 11 researches have been funded by the PSA and other MSAs, while 16 were implemented solely by the PSRTI either from its own regular fund or with the support from other NGAs, international institutions, and the private sector.
Development and update of research agenda. On a yearly basis, the former SRTC formulates a comprehensive and integrated research agenda for the PSS. The agenda is periodically updated in consultation with the MSAs and other data producers as well as data users to consider current
and emerging needs. The research agenda focused in general on improvement of methodologies, concepts, definitions and statistical techniques, rationalization of censuses and surveys to improve effectiveness and efficiency of processes and quality of statistics as well as development of relevant indicators to address emerging issues and concerns at the national and local levels.
Conduct of Statistical Research and Development (SR&D) dissemination and
utilization forums. ▪ The triennial National Convention on Statistics
(NCS) spearheaded by the former NSCB and the annual conference of the Philippine Statistical
Association, Inc. (PSAI) serve as main venues for the dissemination of SR&D studies in the PSS.
▪ The annual PSAI conference has started convening outside of the National Capital Region while regional statistical congresses have been organized in Luzon, Visayas, and Mindanao bringing SR&D closer to stakeholders based in the regions.
▪ The University of the Philippines School of Statistics (UPSS) and the University of the Philippines Los Baños Institute of Statistics (UPLB INSTAT) in partnership with the former SRTC jointly organized the annual National Student-Faculty Conference for Statistical Sciences, which showcase statistical researches dealing with both theoretical and applied statistics.
▪ The former SRTC also conducted quarterly symposiums/forums for the presentation of completed research undertakings by its thesis/dissertation fellows, scholars, research project partners, and technical staff. The MSAs and academe conduct similar forums to introduce concepts or methodologies, or present data analytic findings. Abstracts of completed SR&D conducted and coordinated by the PSRTI are posted on its website.
▪ The PSA conducted the 2nd Research Forum initiated by the former National Statistics Office (NSO) on 18 October 2013, which served as a venue for PSA employees to present research studies focusing on analysis of PSA data and document improvements in methodologies and procedures.
❖ Issues and Concerns
The PSS could have used more relevant SR&D outputs that effectively translate into
improved statistical processes and better quality of statistics in critical policy areas. ▪ There are still perceptions that previous SR&D
initiatives have not really addressed many of the most pressing information needs of governance
such as local-level data and certain sectoral statistics. There are many important policy areas that still lack appropriate indicators or reliable data support systems.
▪ While there is wide recognition of the potential of administrative systems to provide useful statistics, there has been little SR&D that dealt with the improvement of key administrative-based data or the development of new ones.
Little information on the utilization and
institutionalization of SR&D outputs in the
improvement of statistics. ▪ Mechanisms to efficiently monitor utilization of
SR&D outcomes in the improvement of statistical processes and operations are lacking. There is limited knowledge of how SR&D studies have been adopted and instituted in statistical activities of the MSAs and other data producers.
▪ Need to enhance promotion and dissemination to improve access of stakeholders to these SR&D outputs and hence increase chances of utilization and institutionalization.
More concrete directions and policies are needed to ensure that SR&D contributes to
statistical development in the PSS. ▪ While the conduct of statistical researches was
mostly demand-driven, there is still room for improvement in the process of formulation of the research agenda for the PSS. Mechanisms for coordinating the preparation of an integrated research agenda have not been widely discussed in the past. It is not clear whether the research agenda has been truly responsive to at least the needs of the MSAs or has contributed to the attainment of the strategic thrusts of the PSS.
▪ The PSRTI Governing Board may need to provide better guidance through more regular meetings and more concrete policy directions.
Due to resource constraint, there is a limited supply of statistical software in statistical
11
agencies, for statistical research and development activities.
Statistical Programs for 2016 and 2017
❖ Summary
Continuous conduct of relevant SR&D
activities.
Development of mechanisms for greater
SR&D utilization in official statistics. Mechanism should be developed to ensure greater utilization of SR&D in official statistics. Likewise, SR&D application manuals should be developed to guide implementation.
Conduct of SR&D dissemination and utilization forums such as periodic
conferences for presentation of SR&D fellows/experts outputs, project-based SR&D
output presentation, research fellowship
program presentation, research utilization workshops among stakeholders, and
presentation of SR&D outputs in relevant PSA interagency technical committees for
evaluation.
Development of an SR&D portal, e.g., online
public access catalogue of SR&D activities, e-library of SR&D outputs, e-directory of SR&D
fellows/experts and institutions, links to statistical resources, etc.
Development of a cadre of SR&D fellows/experts in the PSS through the SR&D
program. ▪ Selection/accreditation of new SR&D experts.
▪ Partnership between and among the MSAs, academe, and relevant institutions.
▪ Continuous orientation of SR&D fellows/experts on the R&D process.
▪ Rationalization of compensation scheme for professional services, in coordination with the DBM and concerned agencies.
Promotion towards increased participation of
the academe in SR&D designed for application in official statistics.

12
Chapter 3 – Statistical information management and dissemination
Introduction
The availability of timely, relevant, and reliable
statistics enables both government and the private
sector to address a wide range of policy issues amidst an ever evolving social, economic, and
political landscape in the country and the increasing global competitiveness. Making statistics available
and accessible to those who need them has however remained a challenge in the Philippine
Statistical System (PSS). Concerted efforts by
government, as primary data producers, and the private sector and the public, as users and data
providers, must be sustained to ensure the production and dissemination of quality statistics
that address key information needs of the economy
and society.
Effective information management and
dissemination are crucial to getting statistics into
the policies and decisions of government, business, and civil society to facilitate the delivery of relevant
and appropriate programs and services to the citizenry. Disclosing important information about
the state of the economy and the people and the impact of policies and programs promote
transparency and accountability in governance and
helps in institutional building and collaboration.
Dissemination of information should cover a wide
range of audience and should not discriminate
among users. Certain information may however need to be more directed to its primary
stakeholders to maximize its use. After all, the value of information is measured by its ability to be
translated into knowledge and utilized to the fullest extent by users.
This chapter provides a range of strategies for the effective and efficient management and
dissemination of statistical information towards wider and rational use of statistics. It focuses on
raising the level of user understanding, capacity, and trust to increase utilization of statistics and
indicators in evidence-based governance.
Situational Analysis
❖ Key developments in 2011 – 2015
The following are the achievements of the PSS in the Statistical Information Management and
Dissemination (SIMD) in 2011-2015:
Adoption/application of technological innovation in data collection processes in
censuses, surveys, and administrative-based data systems. To keep pace with the emerging technologies, the Philippine Statistics Authority (PSA) engaged in several technical assistance and externally-funded projects that promote the use of remote sensing technology in estimating agricultural information. One of these projects is the Agricultural Land Information System (ALIS) which utilizes technology on remote sensing in estimating agricultural land area. Another project is the Innovative Data Collection Methods for Agricultural and Rural Statistics which applies space-based technology for estimating rice area and rice production.
In addition to looking into different methodologies in generating estimates, the PSA has also started exploring the use of mobile and handheld devices in data collection. In the project National Agri-food Information System (NAIS), instead of using the

13
traditional method (paper and pen or PAPE) of gathering data, a mobile application was developed by the technical assistance provider. This application contains the questionnaire on retail prices and household stocks (rice) and enables the data collectors to save the data on the device or upload the data gathered from the device to a dedicated web server.
Upgrading of data processing systems for censuses, surveys, administrative-based data
systems, and compilation of key indicators towards reduced time lag and improved
reliability of results. The SIMD sector
maintained, enhanced, and developed different systems in order to support household-based
collection activities, such as developed integrated survey/census data processing system and establishment-based projects such as web-based data processing system or application, civil registration services, use of tablet in field supervision during the 2015 Census of Population and to enhance the internal efficiency of the PSA.
Development of an integrated statistics web
portal to facilitate consolidation, sharing, and dissemination of available data and metadata
in the PSS. The former BAS implemented the
project Improvement of Data Systems for Animal Slaughter, Movement of Live Animals and Meat in Carcass, and Meat Production at the Sub-National Level (DSASMMP), in order to improve the system of compilation, consolidation, processing, and organization of data generated from monitoring the movement of live animals and meat products. Likewise, the former Bureau of Agricultural Statistics (BAS), with funding and technical assistance from the Food and Agriculture Organization (FAO), was able to develop the Philippine Food Security Information System (PhilFSIS), a web-based information system containing statistical data/indicators and related information on food security.
Establishment of statistical information
centers at the local levels for wider
dissemination and utilization of statistics, especially in support of local governance and
development. The PSA has continued to provide
timely and quality service nationwide through its information centers at the central office and field offices.
Enhancement of statistical information dissemination and communication strategies. The consolidation of the websites of the former major statistical agencies (MSAs) started in 2014. Through this, the PSA provided a platform that will respond to most of the needs of its clients. The website contains most of the agency’s publications, statistical databases, press releases,
reports, and classification systems. The PSA has also continued to expand its reach through its social network accounts—Facebook and Twitter.
Aside from utilizing various dissemination platforms, the PSA has continued to enhance its dissemination and communication strategies through the conduct of regular media briefings, press conferences, appreciation seminars, and user-producer fora.
In 2011, the former Bureau of Labor and Employment Statistics (BLES) conducted a series of lectures called LearnStat to bureaus and attached agencies dealing with labor statistics. In 2013, it conducted the same for the Preparation of the Regional Current Labor Statistics. In addition to LearnStat, the former BLES conducted 27 presentations/briefings through its LABSTAT Link from 2011-2013.
The former NSO and the National Statistical Coordination Board (NSCB) also conducted different activities to advocate and promote statistics. In 2011, the former NSO conducted the NSO Research Forum as well as the Data Dissemination Fora in 2013. On the other hand, the former NSCB conducted the First User-Producer Dialogue on Statistical Capacity Development for Inclusive Growth. The dialogue aimed to strengthen the PSS towards the production and communication of timely, relevant, and quality statistics and indicators on inclusive growth. Aside from this, the former NSCB consistently spearheaded the National Statistics Month (NSM) celebration.
Strengthening data documentation and
metadata development in the PSS to facilitate
understanding and rational use of statistics. Through the PSS’ partnership with the International Household Survey Network-Accelerated Data Program-National Data Archive (IHSN-ADP-NADA) network, the former BAS, BLES, and NSO established their respective data archives. From 2011 onwards, the former MSAs uploaded and updated the documentation of surveys conducted.
In addition to maintaining the data archives, the PSS has likewise participated in activities that strengthened the agency’s capabilities in data documentation and metadata development. In
2013, the former BAS released the third edition of the Metadata for National Agricultural Statistics in the Philippines, a publication which contains information on the data and databases generated and compiled by the agency. In 2014, the PSA conducted the Survey Metadata Production Workshop wherein seven (7) agricultural statistics surveys were successfully documented.
Conduct of training and other capacity building programs to enhance knowledge and

14
skills of the PSS on statistical information management, dissemination and
communication. In 2012, the former NSCB
conducted the Regional Workshop on Data Dissemination and Communication in collaboration with the United Nations Statistics Division (UNSD). The workshop became an avenue for the country participants to share their respective practices and experiences in the dissemination of statistical data and metadata in Asia and the Pacific Region. Likewise, in 2012 and 2013, the former BAS conducted the National Meeting of Focal Persons for BAS Online Dissemination Systems to improve the agency’s online dissemination. The concepts of data quality dimensions and data warehouse were also brought up during these meetings.
Participation in international cooperation
programs, expert group meetings, conferences, training, and workshop on
international data exchange, database, data documentation and metadata development,
data archiving and warehousing. The PSA’s
partnership with the Accelerated Data Program (ADP) has enabled it to improve its data documentation and metadata development. In 2011, the former NSO participated in the Regional Training on Documenting and Archiving of Population and Housing Censuses conducted by the ADP. In 2013, the former BAS attended the Regional Training Workshop on NADA 4.0. In 2014, an internal workshop was conducted in the PSA to build the capacity of its staff on data
archiving of labor and employment statistics.
Strengthening of the implementation of the
Government Statistics Accessibility Program. In 2011, the former NSCB formulated the General Policy on the Dissemination of Statistics on the Internet. The PSA has also released on a regular basis, an Advance Release Calendar (ARC) which specifies the date of release of its statistical products. Through the ARC, clients and stakeholders of the PSS are able to keep track of the agency’s releases.
Enhancement/implementation of statistical coordination mechanisms to focus on
strengthening measures for improved timeliness and accessibility of data and
microdata. In 2011, the former NSCB Executive
Board approved NSCB Resolution No. 5 s. 2011 pertaining to the General Policy on the Production, Release and Dissemination of Microdata in the Philippine Statistical System, for implementation by concerned agencies in the PSS.
In 2015, the IHSN conducted the Regional Workshop on Reviewing the ADP to assess the DDI quality and NADA functionality of various statistical agencies, including the PSA. The PSA as part of the
Open Data Task Force, complied with the primary requirement of submitting its Agency Data Inventory (ADI).
Establishment of an integrated statistical
archive/data warehouse for the PSS. The
former BAS, BLES, and NSO continued to manage their respective data archives. In 2015, however, a move to consolidate the BAS Electronic Archiving Network Services (BEANS), the BLES Electronic Archived Microdata System (BEAMS), and the NSO Data Archive (NSODA) paved the way for the integrated PSA Data Archive (PSADA). The PSADA will contain PSA’s surveys, censuses, and administrative-based microdata and documentations.
Adoption of international tools, standards and
good practices in data dissemination and
documentation, metadata development, and data archiving. The PSA has continued to
collaborate with the ADP to enhance its data documentation, metadata development, and data archiving.
Strengthening of institutional coordination to
ensure sustainable funding for improvement of statistical and business processes. The PSA
has consistently been a recipient of externally-funded projects aimed at enhancing its survey methodologies and dissemination processes. From 2011-2015, the PSA collaborated with the ADB, the FAO, and the Korea Agency of Education,
Promotion and Information Service in Food, Agriculture, Forestry and Fisheries (EPIS) on various projects.
❖ Issues and Concerns
The key issues and challenges met by the Statistical Information Management and
Dissemination Sector are as follows:
As the PSA envisions to be a solid organization, the products and services of the
former MSAs need to be consolidated
following a specific set of standards: ▪ Harmonize identical publications and draft
standards on style and format as part of the PSA brand.
▪ Draft guidelines and policies on information dissemination.
The PSA cannot respond to the demand for establishment-based time series data
products in a timely and cost-effective
manner, in the absence of a standardized and linked establishment-based datasets. The
creation of analytical reports is a major concern because datasets are not organized.
15
Data holdings are distributed in various
sections and not stored in a single repository. ▪ Need to create a technical working group (TWG)
to discuss the consolidation of data holdings.
Increasing non-response rate and higher
non-sampling errors due to reliability of data. ▪ Need to conduct data appreciation forum for
respondents to encourage their participation in the surveys.
Statistical Programs for 2016 and 2017
❖ Summary
To meet its goal of providing an adequate and modern infrastructure to support the statistical
processes of the PSA and to improve the timeliness, quality, and accessibility of PSA
products and services, the following are deemed
priority activities for 2016-2017:
Regular conduct of consultative meetings and
company visits/dialogues with Cross Border Transaction Survey respondents. Consultative
meetings and company visits/dialogues need to be regularly conducted with respondents of the Cross Border Transaction Survey to discuss issues, concerns, developmental activities, and solicit feedbacks.
Data appreciation briefing/program on the
results of the survey. Data appreciation
briefing/programs are necessary in order to increase understanding and utilization of data generated by the PSA.
Enhancement of the Philippine Information
and Communications Technology (ICT) Statistics Portal. Capacity-building will be
provided to the PSA staff in order to provide them with the technical skills necessary in updating and maintaining the Philippine ICT Statistics Portal (PHICTS).
Hiring of appropriate staff. To add to its
competent workforce, the SIMD will hire personnel who meet the requirements necessary in performing the responsibilities assigned to the sector.
Use of tablets for data collection. As innovation
is one of the PSA’s corporate values, it will continue to explore the use of handheld devices in conducting surveys.
Use of e-questionnaire. The SIMD will develop
e-questionnaires to save time and resources in encoding and processing survey returns.
Review/study the use of administrative-based
data for surveys/censuses. A TWG will be
created to study and assess the use of administrative-based data to complement the surveys/censuses of PSA.
Support in the establishment of the National
ID system.
Implement data mart. Implementation of a
data mart created by a group will augment the PSA capacity in responding to the growing demand for establishment-based time series data effectively and efficiently.

16
Chapter 4 – Millennium and Sustainable Development Goals Introduction
In September 2000, member states of the United Nations (UN) gathered at the Millennium Summit to
affirm commitments towards reducing poverty and the worst forms of human deprivation. The Summit
adopted 8 goals and 18 targets of the Millennium Development Goals (MDG) with 48 MDG indicators.
The MDG monitoring framework was revised in
2007 to include new targets and indicators to monitor progress. The current official MDG
framework tracks 8 goals, 21 targets and 60 indicators which supersedes the previous version,
which had been effective since 2003.
In the Philippines, the PSA serves as official repository of data for monitoring the country’s
progress towards the attainment of the MDGs and SDGs. Periodic data updates are being disseminated
through publications and web releases such as the
MDG Watch. The MDG Watch is being consolidated by the MDG Team which consist of sector specialists
who coordinates with the data source agencies on updates on the MDG indicators. The PSS has
pioneered the development of national and local
statistical databases on the MDGs.
The PDP 2011-2016 provides strategies that are
geared towards the attainment of the MDGs and
other social development outcomes such as health, education, and social protection and justice, as well
as economic goals such as improved employment and decent work, productivity, and income.
During the 2010 High-level Plenary Meeting of the
General Assembly on the MDGs, the UN Secretary-General was requested to initiate thinking on a
post-2015 development agenda with the
consideration that the MDGs will end in 2015. As
the MDG monitoring approaches its end, the heightened discussions on the importance and
relevance of the post-2015 development agenda cannot be overemphasized.
Situational Analysis
❖ Key developments in 2011 – 2015
MDGs
▪ Hosting of the 2011 International Conference on Millennium Development Goals (MDGs) Statistics (ICMDGs). The ICDMGS originated from the initiative of the Philippine Statistical System (PSS) spearheaded by the former National Statistical Coordination Board (NSCB) to contribute to global monitoring of the MDGs and sustained improvement of relevant statistics.
The Conference, which was participated by 102 participants (29 representatives from international organizations, 30 country representatives and 43 local participants), served as venue to support initiatives to adapt the MDG process to the national situation, reiterate the importance of increased communication and better coordination between national statistical systems, and international and regional organizations, acknowledge continuing efforts to enhance data management and analytical tools, advocate increased promotion of MDG statistics, and agree to start discussion of plans beyond 2015.
▪ Hosting of the 20th Meeting of the Interagency Expert Group (IAEG) on MDG Indicators in 2011.
17
The IAEG-MDG, composed of various departments within the United Nations (UN) System and national statisticians, reviews and defines methodologies and technical issues in relation to the MDG indicators. The 20th meeting was part of the yearly consultation with national experts and international agencies and focused on identifying technical cooperation needs and defining statistical capacity development strategies to improve MDG monitoring.
The hosting of the meeting, spearheaded by the former NSCB, gave the Philippines an opportunity to participate and learn from the discussions on emerging issues on MDG monitoring.
▪ The 5th Philippine Progress Report. The Philippines, as one of the signatories in the UN Millennium Declaration, has come up with five Philippines Progress Reports on the Millennium Development Goals since 2003. The report prepared by National Economic and Development Authority (NEDA), did not only define where the country is relative to the MDGs, but also outlined the trends, best practices, emerging challenges which have to be
overcome in order to attain these goals. The fifth report was released in August 2014.
▪ MDG monitoring at the subnational level. Nine regional offices of the Philippine Statistics Authority (PSA) prepare/compile regional /
provincial/city MDG indicators data series and updates the existing local data series on the core indicators. They maintain a database of their respective regions’ MDG indicators and disseminate them thru the MDG Watch posted in the website.
▪ First Association of Southeast Asian Nations (ASEAN) Statistical Report on the MDGs. The Philippines participated in the preparation of the First ASEAN Statistical Report on the MDGs in 2011. This report is the first attempt to provide information on the progress of ASEAN as a region in the attainment of the 25 common MDG indicators and to assess its stage in narrowing the development between the ASEAN-6 and the CLMV (Cambodia, Lao PDR, Myanmar and Vietnam).
▪ Inclusion of other supplementary indicators in the MDG monitoring. Addition of supplementary indicators among the MDG indicators being monitored based on available official statistics, such as proportion of population with mean one-day energy intake less than 100% adequacy and adolescent fertility rate.
▪ Generation of poverty statistics for the employed and unemployed population. In response to the need to measure the country’s
performance towards meeting the new MDG target on achieving the full and productive employment and decent work, the former NSCB made special tables on poverty statistics for the employed population. The poverty incidence for unemployed population was also generated for comparison.
▪ Conduct of the 2015 Updating of the National Nutrition Survey (NNS) to serve as possible source of data on mortality and other health related MDG indicator. In 2015, the Department of Health (DOH) requested the Food and Nutrition Research Institute – Department of Science and Technology (FNRI-DOST) to include health related MDG indicators in the 2015 Updating of the NNS. These include indicators for MDG 4 (reduce child mortality), MDG 5 (improve maternal health), MDG 6 (combat HIV/AIDS, Malaria and Other Diseases). Results are currently being reviewed by the Technical Committee on Population Statistics and the PSA for possible adoption of these indicators in the MDG Watch.
SDGs
▪ 1st Technical Workshop on the Universal Goals and National Targets. A multi-sectoral Technical Workshop on the Universal Goals and National Targets was organized by the NEDA on 10 September 2013 to review and discuss the initial goals and targets identified in the global post-2015 development agenda.
▪ 2nd Technical Workshop on the Universal Goals
and National Targets of the Post-2015 Development Agenda. The second technical workshop organized by the NEDA was held on September 2014. This served as venue in identifying responsible agencies, committees and other actors responsible for monitoring achievements in the Sustainable Development Goals (SDGs). Output of the first workshop, as well as an outcome document of the Open Working Group (OWG) for the new 17 SDGs, served as inputs to determine what the country will hope to achieve in 2030 and what data are needed to monitor the country’s progress. The PSA provided the statistical perspective on the proposed SDGs.
Outputs of the 2nd Technical Workshop were forwarded to the Philippine Permanent mission
in New York on 3 October 2014 and served as the written submission by the Philippines for the Post-2015 Intergovernmental Negotiations on 19-21 January 2015.
▪ Accomplishment of questionnaire from the Friends of Chair (FOC), which was created by the UN Statistics Commission. The survey aimed to serve as input to the compendium of national practices on broader measures of progress (Part I) and obtain information on the availability of indicators to measure the SDGs and associated

18
107 substantive targets agreed upon by the OWG on SDGs on 19 July 2014 (Part II).
The results of the questionnaire served as a background document during the 46th UN Statistics Commission held on 3-6 March 2015. The questionnaire also served as a guide to the national statistical offices in preparation for the requirements in consolidating the proposed post-2015 indicators and to possibly consider other possible sources of data, e.g. non-official statistics and other administrative data. It may be noted that majority of the MDG indicators were also included in the initial list of SDG indicators.
▪ Multi-sectoral Workshop on the Proposed SDG indicators. On October 22, 2015, the PSA and the NEDA, with support from the United Nations Development Programme (UNDP), spearheaded a multi-sectoral workshop on the preliminary list of SDG indicators. The main objectives of the workshop include: 1) to examine the initial list of SDG indicators relevant to the Philippines, 2) identify indicators which are not included in the list but are deemed relevant and crucial, 3) assess the availability from data source agencies, and 4) prioritize from the list, the set of indicators that should be part of the core indicators to be monitored in the Philippines. The workshop was attended by 269 participants from the national government agencies, international organizations, private institutions, academia, civil societies and other possible data source agencies.
❖ Issues and Concerns The key issue and concerns in MDG monitoring,
which may also be encountered in the SDGs,
include:
Need to address data gaps;
Need for more timely data;
Need to improve quality of administrative-based data including those from the civil
registration system;
Need for the development of new methods of
estimating, analyzing and disseminating the SDGs indicators;
Need for lower level disaggregation of data;
Unclear numerical targets of some indicators;
Need for technical and financial support to be able to monitor the numerous indicators to be
monitored in SDGs; and
Need for more advocacy on the use of the
SDG indicators for evidence-based decision
making.
Statistical Programs for 2016 and 2017
❖ Summary
The following activities are programmed to address data gaps, need for disaggregated
data, improve relevance and timeliness of data production and dissemination in the PSS,
together with the conduct of consultation and
statistical research and development: ▪ Release of the 6th Philippines Progress Report in
2016.
▪ Adoption of the 2013 Master Sample which was designed to be able to generate reliable estimates at the provincial level.
▪ Conduct of studies on the estimation
methodology to be used upon the adoption of the 2013 Master Sample (MS) in the Family Income and Expenditure Survey (FIES).
▪ Development of methodology for generating Multidimensional Poverty Index (MPI).
▪ Conduct of the Pilot Survey on Evidence and Data on Gender Equality (EDGE) – Measuring Asset, and Ownership from a Gender Perspective.
▪ Exploring the possibility of generating maternal mortality rate from other data sources, e.g., Civil Registration, NNS.
▪ Exploring the possibility of using third data source for some of the SDG indicators that are not available from existing data collection systems.
▪ Exploring the possibility of using statistical techniques, e.g., small area estimation, to generate disaggregated data.
▪ Conduct of consultative fora to identify relevant indicators for national monitoring of the SDGs and discuss with possible data source agencies how to possibly address data gaps.
▪ Participation in the UN Development Account Project on Strengthening Capacity for Post-2015 Monitoring.
To improve administrative-based data to
serve as possible source of various data
requirements in the SDG framework: ▪ Conduct of consultative fora to identify relevant
indicators for national monitoring of the SDGs and discuss with possible data source agencies how to possibly address data gaps.
▪ Participation in the UN Development Account Project on Strengthening Capacity for Post-2015 Monitoring.
To modernize data collection infrastructure
and technology to address users’ demand for timely, relevant and accurate data:
19
▪ Exploring the possibility of sourcing from Big Data Technology gave way to the huge increase in the quantity of data being generated. With the overwhelming demand for data sources of the possible SDG indicators, there might be a need for the development of new data sources, methods and methodologies resulting from data requirements of the SDGs and the post 2015 development agenda.
According to the UN, “With the widespread use of mobile devices and other forms of telecommunication driven by innovations in technology, a high volume of digital information is continuously generated. However, many statistical offices around the world still need to harness this potential and explore concretely how to implement Big Data in their production work in a reliable and efficient way.”
▪ Development of webpage on SDGs lodged at the PSA website.
▪ Development and updating of an SDG Watch.
▪ Exploring the possibility of using data from third data source.
▪ Exploring the use of tablets to improve data collection, e.g., conduct of pilot test using tablets in the conduct of the Labor Force Survey (LFS).
▪ Establishment of an Interagency Committee on SDGs to be chaired by the PSA.
▪ Establishment of the Focal Person on SDGs. In March 2016, the global indicator framework will be approved by the United Nations Statistical Commission (UNSC) and to be adopted thereafter by the Economic and Social Council and the General Assembly. After the launch of the global indicator framework, a series of multi-sectoral workshops will be conducted in the Philippines to assess and finalize the indicators that are tailored to the country’s priorities. Once the SDG indicators to be monitored in the Philippines are identified, focal persons among data source agencies will
be established to facilitate the updating and monitoring of the SDG indicators.
▪ Hosting of the 2017 International Conference on SDGs. Given the success of the ICMDGs and the high relevance of the Sustainable Development Goals, it is proposed to have an International Conference on the SDGs Statistics (ICSDGS) on 4-6 October 2017 in Manila, Philippines. As in the past, the 2017 ICSDGS will coincide with the Philippines’ 26th NSM celebration.
The ICSDGS will serve as venue to 1) Assess and evaluate the readiness of participating countries in the production and monitoring of indicators of the SDGs, 2) Share/discuss knowledge on the methodologies/best practice, addressing data gaps and use of other data sources given the number of SDG indicators and demand for lower level disaggregation, 3) Identify needed resources/support to be able to respond to the requirements of monitoring the SDGs and 4) Facilitate a special session on the discussion of civil registration and vital statistics as possible data source of SDG indicators.
Policy Uses
The PSDP activities identified in this Chapter intends to prepare the PSS in the monitoring of the SDGs. However, recognizing that the achievement of the SDGs is a commitment made by the Philippines, it may be expected that the thrust of the various government agencies will be towards the achievement of the SDGs. Hence, availability of data for the SDG monitoring will be crucial to guide policy makers and program planners in designing appropriate programs/projects to achieve the SDGs. The activities enumerated in this chapter also include the proposed manner of dissemination to increase appreciation among data users and promote evidence-based decision making.
It may also be noted that some of the SDG related activities are incorporated in the statistical programs in the other chapters of the PSDP aside from this chapter, particularly in addressing data gaps.

20
Chapter 5 – Local Statistics Development
Introduction
Such growing interest in knowing more about the
local communities’ points to the need for area-specific or local-level data and information. Indeed,
in recent years, demand for local-level statistics
about the state of the people, economy, and environment has increased tremendously. Among
the most sought after statistics are those that concern governance—the delivery of basic services,
transparency of policies and processes, and
accountability of public institutions and officials, especially the local government units (LGUs).
Making available local-level statistics is now akin to
better monitoring of the social, economic, political, cultural, and environmental developments in the
local communities. Local-level statistical information is expected to facilitate better understanding by
government of the needs of the local communities as well as enable both the national and local go-
vernments make the right policies, decisions, and
actions.
This chapter provides some key strategies for the
improvement of local statistical systems towards
increased statistical capacity to ensure regular sup-ply of timely and relevant local-level statistics in
support of governance and development towards inclusive growth and reduced poverty.
Situational Analysis
❖ Key developments in 2011 – 2015
Development and improvement of administrative-based statistical information
systems to generate local-level data
▪ Generation of sex-disaggregated data (e.g., employment of Technical-Vocational graduates through a computer/web-based tracking system, enrolment and graduates)
▪ Provision of standard format for the generation of administrative-based data
▪ Utilization of MIS 03-02 as standard reporting template in generating data on training, assessment and certification and employment status of Technical-Vocational Education and
Training (TVET) beneficiaries
▪ Generation of data/indicators for Disaster Risk Reduction Management (DRRM) and Climate Change Adaptation (CCA) Monitoring
▪ Generation of data/indicators for the Reconstruction Assistance on Yolanda (RAY) 2 Results Framework Monitoring
Enhancement of local statistical information system / administrative data systems to
provide more timely and accessible local-level data
▪ Health: Field Health Services Information System; Unified Health Management Information System; Development of the Philippine Health Information Exchange; Integrated Clinic Information System - Online Reporting Rural Health Units (Department of Health or DOH)
▪ Education: Basic Education Information System (Department of Education or DepEd); Monitoring and updating of Data through the Monitoring Network (MoNet); Commission on Higher Education (CHED) Higher Education Collection and Knowledge (CHECK) System
▪ Tourism: Tourism Statistics and Information Systems (Department of Tourism or DOT)

21
▪ Environment and natural resources: GIS-based Statistical Info. System, Forestry Information System (Forest Management Bureau or FMB); Foreshore Area Management Info System (Land Management Bureau or LMB); Land Administration and Management Information System (LMB)
▪ Labor and employment: Labor Laws Compliance System-Management Information System; Skills Registry System (Department of Labor and Employment or DOLE)
▪ Trade: Philippine Business Registry System (Department of Trade and Industry or DTI)
▪ Governance: Government Manpower Information System (Department of Budget and Management or DBM)
▪ LGUs: Local Government Unit Information System
Development, maintenance and enhancement of local statistical frameworks ▪ Formulation of a Regional Development
Indicators Framework
▪ Implementation of the Framework on the Development of Environment Statistics at the local level
▪ Enhancement of the Local Governance Performance Measurement System
▪ Enhancement of the Cities and Municipalities Competitiveness Index
▪ Formulation of Provincial Development Indicator
System (PRODIS) on Health
▪ Implementation, monitoring and validation of the Statistical Reporting System (SRS) by DENR
Institutionalization of a community-based
monitoring system in all LGUs for the regular generation of local-level statistics. Implementation of the Community-Based Monitoring System (CBMS)
Compilation of socio-economic indicators through partnership between RLAs, LGUs and
the private sector (e.g., MDGs/SDGs, gender,
disaster, tourism, etc.) ▪ Introduction and application of new statistics
data gathering systems to NGOs and LGUs (e.g. validation of Tourism Related
Establishments)
▪ Enhanced compilation of indicators for the estimation of the Gross Regional Domestic Product (GRDP)
▪ Compilation of a Provincial Product Accounts
▪ Compilation of local PEENRA
▪ Compilation of MDG/SDG indicators at the local level
Conduct of surveys, censuses and studies to
generate local level data (agriculture, labor and employment, demography, poverty,
prices, trade, costs and returns, etc) ▪ Survey on the Statistics of the Migratory Sugar
Workers (Sacada) in the province
▪ Survey of OFW Situationer in the Province of Antique
▪ Updating/Maintenance of National Farmer’s Registry System (NFRS)
▪ Updating/Maintenance of Registry System for the Basic Sector in Agriculture (RSBSA)
Improvement in the design of surveys to
allow further statistical disaggregation at the local level
Provision of resources for the increase in sample sizes of survey/s
Enhancement of partnerships between RLAs, PIA, and the media for wider dissemination of
statistics ▪ Conduct of the annual press conference on the
GRDP
▪ Radio guesting on statistical products and services (e.g., during the Civil Registration Month: February)
▪ Conduct of dissemination fora on data releases
▪ Conduct of statistical appreciation seminars for
the media
▪ Conduct of the Quarterly Regional Economic Situationer Roundtable Discussions
Development of statistics web portals that include local-level statistics (e.g., websites) ▪ Enhancement of LGU websites through the
eLGU Project
▪ Enhancement/Updating/Linking of websites of regional line agencies
▪ Maintenance of regional website on environment and natural resources
▪ Institutionalizing Management Information System Office (MISO) and website posting
▪ Uploading and updating of online databases
▪ Web posting of statistical reports/data releases
▪ Establishment of e-stat by Vigan City Government
▪ Utilization of social networking/posting statistical data/info. updates on Facebook and Twitter
Establishment of statistical information
centers in provinces, cities, and municipalities (e.g. libraries, information kiosks, etc.) ▪ Establishment of Statistical Information Center
for undergraduate students of universities
22
▪ Enhancement of the regional branches of the National Statistical Information Center (NSIC)
▪ Establishment of statistical information centers in the LGUs
▪ Creation of Departmental Statistics Center/Management Information Services Offices in schools
▪ Establishment of regional central repository of statistical data
Preparation and dissemination of statistical
publications and other IECs containing local level statistics ▪ Regional Social and Economic Trends
▪ Countryside in Figures
▪ Local level versions of Women and Men in the Philippines, Statwatch, SDG Watch, Factsheet, Quickstat
▪ Regional and Provincial Facts and Figures
▪ Regional and Provincial Environment and Natural Resources Statistical Profiles
▪ Provincial / City / Municipal / Barangay Socio-Economic Profiles
▪ State of Local Government Report
▪ Press Releases, Special Releases
▪ Statistical Bulletin
▪ Quarterly Regional Economic Situationer
▪ Annual Report on Investment Data
▪ Annual Report on MDG, Provincial Development Agenda on Climate Change, Typhoon Rehabilitation Program
▪ Comparative Major Development Indicators
▪ Comprehensive Land Use Plan
▪ Comprehensive Development Program
▪ Annual Investment Plan
▪ Annual Performance Report
▪ Functionality Report
▪ Installation and maintenance of Statistical Billboards
▪ Atlas
▪ BSP Regional Situationer
Enhancement of data sharing among data
producers to facilitate policy use or the compilation of other key indicators
Sustained observance of statistical advocacy
activities including international and national statistics celebration at the regional and local ▪ Celebration of the National Statistics Month in
October
▪ Conduct of Provincial and Regional Philippine Statistics Quiz
▪ Conduct of statistical conferences/congress in the region
Conduct of capacity building programs of users at the regional and local levels (e.g.,
seminars, training, etc.) ▪ Conduct briefings / seminars / trainings on
research and statistics, information systems, data collection and reporting systems
▪ Conduct capability training on statistical research and development and administrative-based statistics
▪ Conduct of statistical training for staff ▪ Conduct training on planning, data collection,
generation and dissemination of statistics ▪ Conduct Management Information System
(MIS) workshops to registrars of higher education institutions
▪ Training of statistical personnel for web-design and maintenance capability
▪ Training on infographics and other data visualization
▪ Conduct of Training Workshop on statistical tools for faculty and students by Iloilo Science and Technology University
▪ Conduct training on planning, data collection, generation and dissemination of statistics
▪ Training of statistical personnel for web-design and maintenance capability
▪ Conduct re-mentoring of Basic Statistics and computer trainings to staff of tourism establishments
Formulation of an integrated statistical human resource development program for
local statistical personnel ▪ Formulation and implementation of a statistical
manpower development program at the local level, particularly for the LGUs
▪ Conduct of career orientation seminars
Research partnership and knowledge sharing between RLAs, LGUs and academe to
improve statistical methods and approaches ▪ Establishment of statistical clinic and statistical
consultancy assistance center
▪ Quality Assurance in Research in Teacher Education through the Establishment of CTE Statistics (and language) center
▪ Establishment of Iloilo Science and Technology University of Research and Statistics Assistance Center
Generation of indicators for newly-established administrative / local government
unit. Generation of indicators and provision of
necessary resources for the Negros Island Region per Executive Order No. 183, Series of 2015.
23
Strengthening of statistical committees at the
regional and local levels ▪ Creation/Strengthening of Regional Statistics
Committee
▪ Establishment/Maintenance of Provincial/City Statistical Committees
▪ Effective cascading of PSA Board Resolutions and Memorandum Orders to local statistical committees
Development of an integrated local statistical framework and core indicators in
support of local development planning and governance. Compilation of Regional
Development Indicators to monitor attainment of development goals and targets
Application of a data quality assurance framework in the periodic review of local-
level statistics. Implementation, monitoring and
validation of the Statistical Reporting System (SRS) by DENR.
Implementation of Statistical Survey Review and Clearance System (SSRCS) ▪ Review of survey proposals and questionnaires
under the SSRCS ▪ Conduct t of advocacy activities on the SSRCS
Creation of statistical units and positions to ensure regular production of critical local-
level statistics ▪ Creation of a Research and Statistics Division
under the Provincial Planning and Development Office
▪ Creation of Statistical Unit under the Provincial Government
▪ Creation of statistical positions in the LGUs
▪ Hiring of additional manpower in statistical offices/units
Formulation of a sustainable financing scheme for local statistics development ▪ Sponsor scholarship and in-house trainings in
statistics
▪ Provision of budget for statistical research and
development
Establishment of a pool of statisticians at the
local level
❖ Issues and Concerns The key issue and concerns in local statistics
development include:
Non-responsive partner agencies/LGUs on
data requests used in monitoring reports
Lack of lower level disaggregation of data
due to systems implemented at the national
level
Conflict on the agricultural statistics
generated and produced by two different
agencies
Need to generate statistics on indigenous
peoples (IPs)
Difficult access on geographically
disaggregated data (LGU level)
Delay on release of survey results /
censuses conducted
Unavailability of some national RRM
indicators at the regional level
Inadequate basic sectoral data and data for
HUCs
Underreporting of tourism statistics
Lack of updated population projections for
cities and municipalities
Need to sustain monitoring systems
implemented
Issue on data availability and support of
primary data sources
Duplicating/ inconsistent data across data
sources
Limited/lack of disaggregated data on
gender and development
Need to harmonize data collection activities
Need to improve the accessibility of
generated data and need to improve the
utilization and coverage of administrative-
based data
Need for increased efficiency and
timeliness of data
Non-submission/late submission of data by
some of the higher education institutions
Sampling design of some major surveys are
limited to regional domains that will not

24
allow tabulations at the provincial and city
levels.
Lack of disaggregated data on gender and
development
Need to improve the quality of some
existing data/data provided
Lack of awareness and appreciation on the
importance of statistics and need to
improve data dissemination activities of
data sources
Lack of statistical development
mechanism/system in the LGUs
Weak statistical policies
Need to increase capability of statistical
manpower to undertake statistical activities
Poor internet connectivity and accessibility
Inadequate funding support for statistical
activities
Lack of training for personnel on the use of
new systems, regular surveys, and data
management, analysis and interpretation
Inadequate resources for developing and
generating local-level statistics
Need to develop/enhance statistical
competencies of and coordination among
LGUs and NGAs and other stakeholders
Lack of statistical personnel
Statistical Programs for 2016 and 2017
❖ Summary
Website posting of updated Annual Socio-
Economic Profile of the province
Website posting of PPA port traffic statistics
Creation of Departmental Statistics
Center/Management Information Services
Offices
Establishment of central repository of
statistical data
Design of online Annual Investment Program
Monitoring and Evaluation System
Development of Integrated Clinic Information
System - Online Reporting Rural Health Units
Conduct of statistical training for staff
Establishment of statistical clinic and statistical consultancy assistance center
Development of a regional system with lower level data disaggregation
Review of national RRM indicators
Completion of the Registry System for the
basic sector in agriculture
Collection of statistics on indigenous peoples
Capacity building for personnel on the use of new systems, and on data management,
analysis and interpretation
Creation of additional statistical positions
Conduct of monthly follow-up meetings to keep track of the LGUs progress
Development of information systems and
enhancement of the existing information systems for ENR statistics
Scaling up of internet connection
Establishment of Local Statistical
Coordination Committee
Creation of statistical unit under the
provincial government
Purchase of additional computer units and
software
Conduct of seminars/trainings on research and statistics for LGU's and Academic
Institutions
Advocacy through the RDC to encourage data
source agencies/establishments to provide for the data gaps.
Update on the Implementation of CBMS in the region and sharing of best practices on CBMS
to stakeholders
Linkages with the academe and the local government units in the preparation of maps
with the use of Geographic and Information

25
System to enhance physical and development planning
2 – Macroeconomy
and finance

26
Chapter 6 – Macroeconomic accounts and statistics
Introduction
The PDP 2011-2016 states that growing output and
employment are the preconditions for progress in almost all social and economic aspects of
development. In order to achieve progress, the PDP sets out to pursue “inclusive growth through
massive infrastructure development and responsive
and transparent governance”. This will require establishing a stable macroeconomic environment,
instituting fiscal reforms, and ensuring low and stable inflation and reduced external vulnerability.
Good macroeconomic planning focuses on
providing a policy and business environment that stimulates and facilitates economic production,
consumption and investments; nurtures knowledge
and technology creation and diffusion, and creates productive employment and decent work. More
importantly, good economic governance ensures that gains from growth are equitably spread among
the people, set aside for attaining higher societal goals, or channeled into social investments that
facilitate future growth.
This chapter discusses priority strategic measures for the improvement of statistics and indicators that
are necessary in documenting and measuring the
country’s domestic economic activities, the incomes generated and the allocation of these incomes,
investments and savings of the different sectors of the economy, as well as the domestic economy’s
transactions with the rest of the world.
Situational Analysis
❖ Key developments in 2011 – 2015
Macroeconomic Accounts and Statistics provide an overarching framework for standards in the
development of economic statistics as well as facilitating the integration of the statistical
systems to achieve consistency with other
related frameworks e.g. balance of payments, government financial statistics, among others.
The major key developments of the Philippine Statistical System (PSS) in the sector during the
period 2011-2015 are as follows:
Improvement of the Quarterly and Annual
National Accounts. ▪ The old series of the Philippine System of
National Accounts (PSNA) were revised and rebased (covering the period 1998 to 2010), adopting the 2008 System of National Accounts (SNA) with 2000 as base year and presented in a dissemination forum in 12 May 2011. This was the first of the series for the annual national accounts covering the period 1998 to 2010. The quarterly series of national accounts were also first released for the period 2008 to 2012. The salient features of the revised and rebased series are: (a) the shift to a new base year from 1985 to 2000; (b) adoption of new standards and classifications systems e.g., the 1994 Philippine Standard Industrial Classification (PSIC), the 2004 Philippine Standard Commodity Classification (PSCC) and the 2009 Philippine Classification of Individual Consumption According to Purpose (PCOICOP); (c) use of revised, updated and new data; (d)

27
use of updated ratios / undercoverage/ assumptions; (e) use of updated price indices/ use of appropriate deflators; (f) updated average salary of Overseas Filipino Workers (OFWs); (g) improved estimation methodology; and (h) adoption of the 2008 SNA e.g., changes in terminology, use of Supply and Use Table (SUT) approach to address the statistical discrepancy and Chain Volume Measures (CVM).
▪ The releases of the linked series likewise ensued covering 1946 to 2012 for the annual series and 1981 to 2012 for the quarterly national accounts. These were released and disseminated through the website of the then National Statistical Coordination Board (NSCB).
▪ Compilation of the annual and quarterly CVM estimates of Gross Domestic Product (GDP) was piloted for years 1998 to 2010. In 12 May 2011, the results were presented in a dissemination forum along with the release of the revised and rebased PSNA series.
Improvement of the Regional Accounts. The
compilation of the regional accounts, the Gross Regional Domestic Product (GRDP) and the Gross Regional Domestic Expenditure (GRDE) were made consistent with the features of the revised and rebased series of national accounts released in 2011. ▪ The revised series of the GRDP with base year
2000 was released in July 2012 covering the period 2009 to 2011.
▪ The GRDE which covered the revised series from
2009 to 2011 was released in August 2012.
Improvement of the Consolidated Accounts
and the Income and Outlay Accounts. The first
revised series of the Income and Outlay Accounts adopted the recommendations of the 2008 SNA in sectoring of the accounts by institution: non-financial corporation; financial corporation; general government; and household including the non-profit institutions serving households. It covered the period 2009 to 2011 and was released in June 2012 through the website and publication.
The Consolidated Accounts covered four accounts as follows: ▪ Consolidated Account I - Gross Domestic
Product and Expenditure
▪ Consolidated Account II - National Disposable Income and its Use
▪ Consolidated Account III – Gross Accumulation
▪ Consolidated Account IV – External Transactions
Compilation of the Benchmark Input-Output for 2006. In 2013, the benchmark Input-Output
(I-O) Table for 2006 was released. This is the tenth (10th) of a series of inter-industry studies of the Philippine economy since the construction of the
first benchmark I-O table in 1961. The 2006 I-O Accounts took off from the last overall revision and rebasing of the PSNA done in 2011 which provides the migration of the PSNA to the 2008 SNA. The 2006 I-O Accounts incorporates some of the 2008 SNA recommendations and adopts new/updated standards and classification systems. As differentiated with the previous I-O Accounts, the 2006 I-O Accounts, for the first time, is integrated and consistent with the 2006 National Accounts, following the same aggregated levels of the Gross Value Added (GVA) by industry as well as the GDP.
Compilation of the SUT. For years 1998 to 2010,
the PSNA institutionalized the compilation of the SUT which was completed in 2011. The SUT is an approach adopted to address the discrepancy
between the GDP production and expenditure. A dimension of 64 by 64 industries/commodities was initially implemented for the 2000 benchmark. Another dimension of 64 by 64 was also shown and later merged into 11 by 11 industries/commodities for non-benchmark years due to unavailability of detailed information on an annual basis.
Compilation of the Balance of Payments
(BOP) and International Investment Position (IIP) based on the BPM 6th Edition. ▪ In March 2013, (starting with the Fourth Quarter
2012 date), the Balance of Payment (BOP), compiled by the Bangko Sentral ng Pilipinas (BSP) implemented the initial shift to the new
framework in compiling and reporting the country’s BOP statistics in accordance with the BOP and International Investment Position (IIP) Manual, 6th edition (BPM6). These recommendations being adopted from the BPM6 is aligned with the international best practice of standards prescribed by the IMF. Starting March 2014, a full implementation on the shift to the BPM6 was done and completed. The release of the new BOP series included a simultaneous release of the quarterly IIP data from March 2013 to June 2014.
▪ Following the revisions in the BOP series, the BSP released the backtracked BOP monthly data series from 2005 to 2010, with accompanying technical notes in the BSP website in March 2014. The IIP backtracked series was likewise
released in the BSP website in September 2014.
Establishment of the Technical Committee on
PSNA. In 2013, the Technical Committee (TC) on
PSNA was established to provide a venue to discuss and address the existing concerns, problems and issues relating to the production, generation and dissemination of national accounts.

28
Proposal on the Early Release of the Quarterly
National Accounts (QNA). ▪ The technical staff of the then NSCB conducted
bilateral meetings in 2013 and 2014 with major data source agencies such as the former National Statistics Office (NSO) and the Bureau of Agricultural Statistics (BAS), the Department of Energy (DOE), the Philippine Overseas Employment Administration (POEA) and the Power Sector Assets and Liabilities Management Corporation (PSALM). The proposal for the early release was also discussed in various Interagency (IAC) and TCs and Technical Working Groups (TWGs) of the then NSCB e.g., TC on Prices, IAC on Trade Statistics, IAC on Agriculture and Fishery Statistics, etc.
▪ Simulation exercise on the second quarter 2012 GDP was conducted by the former NSCB Technical Staff to find out the results both for GDP Production and GDP Expenditure, of the GDP release earlier at 45 days as compared to the existing timeline of 60 days. A position paper regarding the early release of the Quarterly National Accounts was endorsed by the members of the TCPSNA to the Director General of the NEDA, on 9 May 2013.
Establishing the Committee on Macroeconomic Accounts. On August 2014, the
establishment of the Committee on Macroeconomic Accounts was approved by the PSA Board per Board Resolution No. 4 Series of 2014 entitled: Establishing the Committees on Statistics of the PSA.
Computerization of the compilation of the quarterly national accounts under the former
NSCB project on Enhanced Computerization of the PSNA.
❖ Issues and Concerns
Generation of basic data for the compilation
of the informal sector for the national accounts; estimates of savings and
investment pattern of household for the Flow
of Funds as well as the data to measure performance of the corporate sector is
insufficient.
Compilation of the provincial product
accounts and/or city product accounts in partnership with the local government units
(LGUs) is necessary.
Clamor to enhance and regularly update
other macroeconomic frameworks
particularly the Total Factor Productivity (TFP), Flash Indicators of GDP, Leading
Economic Indicators (LEI) is being raised.
Divergence between the estimates of
External Accounts of the PSNA and the BOP should be identified and reconciled.
Regular compilation of the CVM of GDP, as well as the Sequence of Accounts, is yet to be
institutionalized.
Stronger advocacy for the generation of data
support for national accounts compilation is
needed for its earlier release.
❖ SDPs supporting the generation of the RRM indicators
Table 3. SDPs supporting the generation of RRM Indicators on Macroeconomic Statistics
Statistical Development Programs RRM Indicators PSDP Disaggregated Data
Implementation of the early release of quarterly national accounts from 60 days after the reference quarter to 55 days except for the 4th quarter wherein the present releases are 30 days after the reference quarter; Overall Revision and Rebasing of the Philippine System of National Accounts (PSNA) with 2012 as base year (PSA)
High real GDP growth achieved
National level, by industry
Comprehensive review and revision of designated macroeconomic statistics and other data sources for the macroeconomic accounts (e.g., national accounts, BOP, FOF, etc.) (PSA/BSP/SEC)
- Higher government revenue-to-GDP ratio achieved
- Primary expenditure-to-GDP ratio improved
- Positive primary balance-to-GDP ratio maintained
- NG fiscal deficit-to-GDP ratio maintained
National level
Enhancement of the Debt Management and Financial Analysis System (DBM)
External debt-to-GDP ratio reduced National level
Use of tablets in the recording, validating, processing and transmitting of prices collected for the consumer price index (CPI) (PSA)
Low and stable inflation rate achieved National, regional levels; NCR, AONCR; Headline/Core;
commodity group, selected commodities

29
Serious gaps in the compilation/updating of
other macroeconomic frameworks particularly the Philippine Social Accounting
Matrix (PSAM) need to be addressed.
Statistical Programs for 2016 and 2017
❖ Summary
Methodological studies to address data
problems and data gaps to improve the quality of macroeconomic statistics and
economic accounts particularly those problems encountered in the compilation of
national accounts.
Implementation of the early release of
quarterly national accounts from 60 days
after the reference quarter to 55 days except for the 4th quarter wherein the present
releases are 30 days after the reference quarter.
Regular training on macroeconomic statistics and economic accounts and indicators for
compilers and data providers particularly to
focus on the newly recruited staff of the PSA.
Comprehensive review and revision of
designated macroeconomic statistics and other data sources for the national accounts
towards improved coverage, relevance and quality statistics, frequency, timeliness and
disaggregation, and designation of new ones.
Upgrading of information and
communications technology (ICT) resources to support automation of collection,
processing and dissemination of macroeconomic statistics and basic data.
Preparatory work for the compilation of PSAM.
Institutionalization of the generation of corporate statistics.
Policy Uses
❖ More effective assessment of the economic performance of the country through GDP and
current accounts. ❖ Earlier formulation of macroeconomic
development plans/programs.
❖ Possible generation of indicators to respond to
additional statistical information such as SDGs.
❖ More effective formulation of macroeconomic
programs/policies through the utilization of
PSAM.
❖ Easier monitoring and accessibility of macroeconomic statistics/indicators.

30
Chapter 7 – Monetary and financial statistics
Introduction
Money and finance are fundamental to the country’s
economic life and overall well-being. Money affects many of the day-to-day and long-term decisions of
society and individuals while financial institutions
influence the growth and development of the country.
The PDP 2011-2016 targets a broad range of
financial sector reforms to be pursued to further deepen the financial system and enable it to
contribute to sustainable and inclusive growth.
The PDP envisions the financial sector as “a
regionally responsive, development oriented and
inclusive financial system which provides for the evolving needs of its diverse public” that is guided
by the following precepts: (a) bottom-up development; (b) top-down infrastructure support;
(c) prices that fully reflect relevant information; and
(d) enabling environment for the effective management of risks. Prudent and responsible
monetary policy helps ensure that financial markets are stable and credit conditions are appropriate to
support the continuous expansion of economy.
This chapter aims to establish a well-coordinated system for the generation and dissemination of
timely, accurate and relevant monetary and financial statistics and indicators.
Situational Analysis
❖ Key developments in 2011 – 2015 Money plays a central role in the determination
of income and employment, which is fundamental to a country’s overall well-being. It
affects many of the short and long term
decisions of individuals and the society as a whole.
Financial institutions provide a system for
individuals and the society in enabling economic transactions, and help efficiently allocate savings
into investments, thereby promoting economic growth. A well-regulated financial system is
essential for supporting economic and financial
stability.
Financial statistics is fundamental to
understanding the way the country’s financial
system work, and analyzing the impact of fiscal and monetary measures on economic growth
and financial stability. Accurate and timely statistics therefore are important in regulating
the system, especially informing about potential
problems or crisis, helping policy makers to draw up safety nets to protect the economy.
The major key developments in the financial
statistics sector are as follows:
Development and improvement of data compilation systems. ▪ Establishment of the Integrated Monetary
Database.
▪ Development of the Debt Management and Financial Analysis System (DFMAS) as it helped BSP increase its efficiency in recording, monitoring and generating external debt data while improving compliance with international reporting standards.
▪ Generation of the Other Financial Corporations Survey.

31
▪ Generation of data on insurance of migrant workers, microfinance, micro-insurance, pawnshop operations, cooperative etc.
Major monetary statistics generated in
compliance with international standards. ▪ The Monthly Monetary Authorities Survey (MAS)
is used to consolidate balance sheet of the monetary authorities (consisting of the BSP and national government) in so far as the latter’s monetary functions arising from its holdings of cash and transactions.
▪ The Depository Corporations Survey is used to compile the balance sheets of all deposit-taking financial institutions.
Provision of standard definitions. Enhancement
of the Unified Accounts Code Structure (UACS) to harmonize existing accounting, budgeting, and treasury terminologies.
Capacity building for statistical analyses. Conduct of Statistical Capacity Building on Public Expenditure Management as well as participation in the Quarterly External Debt Statistics Project initiated by the World Bank (WB) and the International Monetary Fund (IMF).
Upgrading of information and
communications technology (ICT) resources to support automation of collection,
processing and dissemination. Implementation
of Total Credit Reporting System for
universal/commercial banks and thrift banks.
❖ Issues and Concerns
Need to improve timeliness, accuracy and
quality data through linking various sources of data. ▪ Some data sources have not yet adopted the
advance release calendar/revision policy of outputs needed in the compilation of financial and fiscal statistics.
▪ There is perceived lack of appreciation among some data sources of their institutional responsibility to share critical data necessary for more reliable and accurate fiscal and financial indicators.
Insufficiency of existing statistical coordination mechanisms in addressing
issues in the compilation of monetary and financial statistics and indicators. Unlike most
statistical sectors, there is no established interagency mechanism to resolve statistical issues, and coordinate activities for the development and improvement of monetary, financial, fiscal and banking statistics.
Need for more comprehensive corporate
statistics of non-financial institutions for the compilation of monetary and financial
statistics indicators. There is limited data on
private financial and non-financial corporations.
Insufficiency of resources for the development and improvement of financial
and fiscal statistics.
Need to strengthen the statistical capacity of
institutions compiling monetary, financial,
fiscal and banking statistics. Training of staff
compiling monetary, financial, fiscal and banking statistics should be sustained.
Statistical Programs for 2016 and 2017
❖ Summary
Creation of an inter-agency committee on monetary and financial statistics to lead the
coordination of relevant statistical concerns.
Adoption of the advance release calendar to
promote transparency, timeliness, and
accessibility of statistics as to what and when financial data will become available.
Institutionalization of mechanism to support the generation of corporate sector statistics.
Strengthening of linkages and institutional
arrangements between data compilers and data sources.
Supporting Open Data Initiatives which help promote transparency, citizen empowerment,
to strengthen governance.
Enhancement of existing data compilation
systems/databases. ▪ Revision of the e-money report program.
▪ Enhancement of the Debt Management and Financial Analysis System (DMFAS).
▪ Enhancement of the Integrated Monetary Database.
▪ Development of the database of the IT profile of
all banks.
▪ Inventory of data and indicators needed by oversight and implementing agencies.
▪ Enhancement of the online submission of financial reports.
▪ Development of the Integrated Financial Management Information System.
▪ Implementation of Data Warehousing II project.
▪ Implementation of an enhanced Total Credit Reporting System for banks.

32
Creation of statistical units or positions/hiring
of additional statistical personnel in data
producing or compiling agencies.
Upgrading of ICT resources to support
automation of collection, processing and dissemination of monetary and financial
statistics, including basic data.
Conduct of regular training of data compilers
and appreciation forums for data providers of monetary and financial statistics.
Participation in and hosting of international
conferences, trainings, workshops, and expert group meetings on monetary and
financial statistics.
Policy Uses
❖ For coordination and planning.
❖ For fiscal planning.
❖ Generation of corporate sectors statistics,
improvement in the National Accounts.
❖ To serve as guide for financial services to be properly and proportionately regulated to uphold
consumer protection and financial system
integrity.
❖ Capacity development.
❖ SDPs supporting the generation of the RRM indicators
Table 4. SDPs supporting the generation of RRM Indicators on Monetary and Financial Statistics
Statistical Development Programs
RRM Indicators PSDP Disaggregated Data
Comprehensive review and revision of designated macroeconomic statistics and other data sources for the macroeconomic accounts (e.g., national accounts, BOP, FOF, etc.) (PSA/BSP/SEC)
- Tax revenue-to-Gross Domestic Product (GDP) ratio improved
- Non-tax revenue-to-GDP ratio achieved
- Percentage share of interest payments in the total disbursements declined
National level
Enhancement of the Debt Management and Financial Analysis System (DBM)
- Outstanding NG debt stock as a share of GDP reduced
- External debt-to-GDP ratio reduced
National level
Use of tablets in the recording, validating, processing and transmitting of prices collected for the consumer price index (CPI) (PSA) Rebasing the CPI to 2012 (PSA)
Low and stable inflation rate achieved
National, regional levels; NCR, AONCR; Headline/Core; commodity
group, selected commodities

33
3 – Agriculture, industry,
and services

34
Chapter 8 – Agriculture and fisheries statistics
Introduction
The agriculture and fisheries sector puts food on the
table of every Filipino. The sector supplies vital raw
materials for the production of other commodities and supports tourism and other services sector. It
provides livelihood and income to a good segment and thus contributes to economic and human
development.
As demand from increasing population and expanding industries grows amidst concerns of
resource depletion and impact of climate change, the sector needs to harness its full potentials to
achieve higher efficiency and improve productivity
to help in poverty reduction.
The PDP 2011-2016 foresees a competitive and
sustainable agriculture and fisheries sector that is
vital in achieving the country’s vision of inclusive growth and poverty reduction; and to realize this,
improving food security and increasing rural incomes, increasing sector resilience to climate
change risks, and enhancing policy environment and governance must be met.
Situational Analysis
❖ Key developments in 2011 – 2015
Enhancement of agricultural and fishery surveys in terms of coverage, data collection,
processing and data management. ▪ Frame updating for the fisheries surveys.
Updating of the lists of commercial and municipal landing centers and aquafarms were done in Regions XI and XII in 2010 and in
Region VIII in 2013. An aquafarm inventory was conducted in Region I in 2014.
▪ Development of a methodology for the Backyard Livestock & Poultry Survey (BLPS) in 2012. This research undertaking aimed to develop a survey design independent from the Palay and Corn survey design. It was proposed to utilize the 2012 Census of Agriculture as the source of frame and Principal Component Analysis (PCA) in sample selection for each animal type i.e.
Carabao, Cattle, Swine, among others. The survey questionnaires were enhanced to include parameters like the “liveweight” of animals disposed for slaughter and items on indicators of destination of animals for slaughter whether sold within the province or outside the province. These questionnaires were pre-tested in 2 provinces.
▪ Improvement in the data collection of animals’ slaughter from both slaughter establishments (Slaughterhouses or SHs and Poultry Dressing
Plants or PDPs) and outside establishments including those slaughtering in the household (slaughter in other areas). In 2012, Department of Agriculture (DA)- Administrative Order No. 27 known as the “Guidelines on Data Collection of Animal Slaughter” was approved by the Secretary of Agriculture and implemented collaboratively by four (4) partner agencies – the then Bureau of Agricultural Statistics (BAS), DA-Office of the Secretary (OSEC) / DA-Regional Field Offices (RFOs), National Meat Inspection Service (NMIS) and local government units (LGUs) (ProVets, CityVets and MAOs). The roles of each partner agencies were defined such that NMIS covers accredited SHs and PDPs, LGUs in charge of Locally Registered Meat

35
Establishments (LRMEs) while, the BAS was responsible in covering slaughter in other areas including slaughtering in the households.
▪ Updating/improvements of the processing systems. Adoption of Windows- based software in data processing system like CSPro has been done for some of the agricultural surveys. This helped reduced the processing time and release of statistics.
Development of new approaches in data
collection. ▪ Agricultural Land Information System (ALIS).
This is an Asian Development Bank (ADB) funded project using global positioning system (GPS) and remote-sensing in determining total
agricultural land area and area planted to crops. In 2013, the methodology was piloted in Nueva Ecija.
▪ Innovative Data Collection Methods for Agricultural and Rural Statistics through Remote-Sensing. This is a three-year project (2014-2016) managed by ADB and funded by Japan Fund for Poverty Reduction. It aimed to determine yield and area of palay using Remote-Sensing technology. The pilot province was Nueva Ecija. In September 2014, the project finally took off through the conduct of In-country inception workshop which included demonstration on the use of the International Asian Harvest Monitoring System for Rice (INAHOR) software for estimating rice area and production using remote sensing. A series of
training programs were conducted which covered topics on Linux, basic remote sensing concepts, and software installation, configuration, and use of original and adjusted version of INAHOR software. Other activities included determination of yield through recall survey.
Conduct of specialized surveys. ▪ Production Costs and Returns Survey. The
survey generated data on production cost structure, average use of materials and labor inputs, farmers’ practices and measures of profitability of producing agricultural commodities. Seven commodities were covered by the survey namely: tilapia in 2011; garlic, onion, palay and corn in 2013; and sweet potato and cassava in 2014.
▪ Study on Marketing Costs Structure. The study was conducted for selected commodities which aimed to collect information on the key marketing players and existing distribution system in major supply and demand areas, marketing costs and margins at different stages and identification of information needs and problems related to marketing. Marketing studies for palay and rubber were implemented in 2013 and for cassava, in 2014.
▪ Survey of Capital Formation in Agriculture. The survey was implemented to address the data gap on capital formation account. It aimed to come up with benchmark information on the level and structure of capital accumulated by the agricultural households. The survey was done in all the provinces of Ilocos Region in 2012, Cagayan Valley and Caraga in 2013, SOCCSKSARGEN and CAR in 2014.
▪ Survey of Food Demand for Agricultural Commodities. This is a nationwide survey conducted quarterly which aimed to generate data on per capita consumption of rice, corn and other agricultural food. The last survey was conducted in 2012. However, in response to the National Agricultural and Fishery Council (NAFC) Resolution No. 3 recommending the updating of food consumption data at least every two years, another survey was conducted in 2015. For this year, two survey rounds were conducted, one in August and the other in November. The succeeding two survey rounds will be undertaken in 2016.
▪ Survey on Characterizing Farmers of the Philippines. The survey was the third component of the Government of Japan (GOJ) funded project entitled “Enhancing Farmers’ Capacity to Access, Analyze and Utilize Statistical Information”. Conducted nationwide in 2012, the survey gathered information on the characteristics of Filipino farmers in terms of level and sources of income, expenditure patterns, farm investments, characteristics of the farm operators and their farm holdings, living conditions, assets and liabilities, production and marketing practices and other relevant variables.
▪ Onion Production Survey. The survey was implemented in 2012 which generated list of onion growers and the current quarter and monthly expected volume of onion production in the top five onion producing provinces, namely: Ilocos Norte, Ilocos Sur, Pangasinan, Nueva Ecija and Mindoro Occidental. Another round of survey was done in 2014 in the same provinces. The activity aimed to improve onion production statistics.
Generation of local level statistics on agriculture. ▪ Conduct of Registry System of Basic Sector in
Agriculture (RSBSA). The activity aimed to address the need for a database of farmers, fishermen and farm laborers which are inputs for use of the program implementers. With technical assistance provided by the then National Statistics Office (NSO), the activity was implemented in 2012 covering 75 provinces excluding National Capital Region (NCR) and Autonomous Region in Muslim Mindanao (ARMM). It was done in two batches: the first

36
batch covered 20 provinces and the second batch covered 55 provinces.
▪ Barangay Agricultural Profiling Survey (BAPS). This activity collected information on the basic structure of agriculture and fishery at the barangay level. The BAPS was conducted in SOCCSKSARGEN and Caraga in 2011 and Bais City of Negros Oriental in Central Visayas in 2012.
Conduct of the 2012 Census of Agriculture
and Fisheries (CAF). The CAF, conducted in
2013, was a nationwide undertaking geared towards the collection of statistics on the structure and characteristics of agriculture and fisheries sectors. The data collected were land use,
agricultural area, crops planted, number and types of aquafarms and species cultured, type of fishing operation and inventory of livestock and poultry.
Development of data systems on emerging
concerns which include indicators on climate change, organic agriculture farming, and
other emerging agricultural industries. ▪ Organic Agriculture Production Survey. As an
initial activity, an Organic Agriculture Baseline Survey was conducted in 2012 to gather benchmark information on organic farming for the third party certified producers. The Organic Agriculture Production Survey was done in 2013. This was a two-pronged activity which consisted of updating the list of organic producers, processors and exporters and production survey. The former served as the frame for the production survey. The survey gathered production-related information from the third party certified and other organic producers of crops, livestock and poultry and aquaculture products. The information collected were: total area harvested; volume of production and disposition, major market destination; and organic production practices.
▪ Generation of Greenhouse Gas (GHG) Inventory. The GHG Inventory (GHGI) is an activity by virtue of Executive Order No. 174 issued on November 24, 2014, “Institutionalizing the National Greenhouse Gas Inventory and Reporting System”. The lead agencies for the generation of GHGI for the
agriculture sector are the DA and Philippine Statistics Authority (PSA).
The generation of GHGI used the Agricultural Land Use (ALU) software which is the prescribed processing system for the Agriculture, Forestry and Other Land Uses (AFOLU) sectors. Two (2) workshops on ALU software were conducted to enhance the use of the system, identify the data requirements and conduct a dry-run to calculate the GHG Inventory.
▪ Philippine Food Security Information System (PhilFSIS). This three-year (2012-2014) Food and Agriculture Organization (FAO) funded project on "Establishment of Philippine Food Security Information System" aimed to consolidate and compile all related food security information for use by planners and policy makers. The PhilFSIS website was the major output of the project which serves as a one-stop-shop web-based information system with the functionality to retrieve, analyze and share selected statistical data/indicators and other information on food security at the national and sub-national levels. The indicators contained in the website are also compiled and packaged in a publication entitled “Selected Food Security Indicators.”
Updating of technical conversion
ratio/parameters for production estimation
through the conduct of the following activities: ▪ Survey of Rice Mills. The survey was undertaken
in two rounds to determine the milling recovery rate (MRR) of palay wet season crop in November 2008 and of the dry season crop in May 2011. The results of the two survey rounds served as the basis in addressing the need for an updated MRR to be used in converting estimates of palay production to milled rice. The May 2011 survey covered 15 regions excluding NCR and ARMM.
▪ Study on Corn Conversion from Corn Ear to
Grains. Conducted in two rounds, the study covered the wet season in 2011 and the dry season in 2012. The research study came up with a standard conversion rate from corn ears to corn grain. The two rounds were implemented in Isabela, Iloilo and Bukidnon.
▪ Adoption of the Provincial Liveweights of Livestock and Poultry. The data system of the former BAS does not incorporate liveweights as a data item in the survey questionnaire. Prior to 2005, data series on volume of production uses a national standard liveweights of animals for slaughter i.e. 400 kg for cattle, 370 kg for carabao and etc. However, geographical location, and differences in climatic conditions, as well as technology among provinces make the standard liveweight no longer applicable.
Surveys on liveweight factor of the livestock and poultry commodities were conducted from July-December 2008 to January-June 2009 as benchmark to reflect the seasonality of livestock and poultry production. The item “liveweight” was incorporated in the improved questionnaire for Commercial Livestock and Poultry Survey (CLPS) in 2011 for broiler and swine, and in 2012 for all other livestock and poultry commodities.

37
FBS/SUA Compilation using FAO Excel
software. Through the Regional Workshop held in
Bangkok in 2014, the Excel software developed by FAO was introduced for use in the compilation and updating of Supply Utilization Accounts/Food
Balance Sheet (SUA/FBS). This was under a FAO
Regional project entitled “Building Statistical Capacity for Quality Food Security and Nutrition Information in Support of Better Informed Policies”. The outputs of the project were the updated SUA/FBS for 2009 to 2013 using FAO’s Excel Software and the Food Security and Nutrition Status Report.
Strengthening of advocacy on understanding and rational use of agriculture and fishery
statistics and indicators. ▪ Production and Marketing Analysis Service
(PMAS) and Farm-Based Data System: Farm Record-Keeping, Processing, Analysis and Utilization of Data (FRKP). These are the first and second components of the GOJ funded project entitled “Enhancing Farmers Capacity to Access, Analyze and Utilize Statistical Information” launched in 2012.
PMAS is the former BAS’ attempt to reach out to farmers and to transform them as frequent users of information. This service envisions empowerment of small farmers through the use of statistics that can guide them in making plans and decisions with respect to production and marketing. This information is packaged into a technical bulletin called the StatGuide for Farmers. Its contents are site/province- specific and also reflect information from the trading partners and competing provinces. The PMAS was implemented in 15 provinces.
The FRKP was a farmer-based activity wherein a participating farmer was made to record all his transactions and expenses relative to his/her production activities and were taught on how to utilize and analyze farm level data in making decisions regarding their production, marketing and other farm enterprise-related concerns and activities. The FRK project covered five (5) PMAS provinces namely: Nueva Vizcaya, Palawan, Capiz, Leyte and Bukidnon.
▪ Establishment of the Livestock and Poultry Information - Early Warning System (LPI-EWS).
This activity started in 2006 with funding support from the Department of Agriculture’s National Livestock Program. The project focused on the improvement of data system and establishing a comprehensive information system for livestock and poultry including early warning indicators (EWI) as input variables for generating outlook through statistical models and survey-based forecasting. At the national level, the Situation and Outlook reports on the Supply and Demand of Pork and Broiler meat were published since 2007.
The project’s concepts and strategies were rolled out to all regions from 2010 to 2014. The outputs of the regions include the Regional Situation Reports on Broiler and Swine, collaboratively prepared by the PSA, the DA- RFOs and LGUs.
▪ Conduct of Livestock Appreciation Seminar. This is an activity that served as user-producers’ forum for Livestock Stakeholders at the national and sub-national levels. Participants to these regional fora were the Department of Agriculture Regional Field Officers (DA-RFOs), LGUs and Private Agri-business Sector (PABS), and funded by DA under the National Livestock Program.
❖ Issues and Concerns
Continuous enhancement of agricultural and
fishery surveys in terms of coverage and methodology/design, data collection and
processing. ▪ Need to review the existing design/methodology
and update the sampling frames of agricultural surveys to improve and increase the reliability and quality of data.
▪ Use of information and communications technology (ICT) and geographic information system (GIS) tools need to be explored to increase automation of data collection and processing.
▪ Limited coverage for other agriculture and fishery concern such as cost of production,
marketing and capital formation as resources are heavily concentrated on production surveys.
Establishment/Mainstreaming of data systems on emerging concerns/data gaps in
agriculture. There is an increasing demand for
statistics on: other livestock and poultry commodities such as sheep and quail eggs, ornamental fishes, and greenhouse gas emission.
Updating of selected parameters for the
compilation of agricultural accounts. Need for
an in-depth review and updating of the technical conversion factors (TCFs) and parameters given the advancements in technology and developments in the uses of agricultural products.
Sustainability of the AgStat system. Need for
continuous strengthening of the technical skills of human resources to sustain efficient production of timely and quality statistics on agriculture and fisheries.
Statistical Programs for 2016 and 2017
❖ Summary
The priority statistical programs to address the issues and concerns for the agriculture and

38
fisheries statistics include the following: updating of frame for crops, livestock, poultry,
and fisheries surveys; the review of the methodology and sampling design for
improvement of the agriculture and fishery
surveys including generation of fishing effort statistics, the strengthening of linkages with
agriculture and fisheries specialized agencies (such as NMIS, Bureau of Animal Industry (BAI),
National Dairy Authority (NDA), Philippine Carabao Center (PCC), LGUs, Philippine Fisheries
Development Authority (PFDA), National Food
Authority (NFA), Philippine Coconut Authority (PCA), Sugar Regulatory Administration (SRA),
National Tobacco Administration (NTA), Food and Drug Administration of the Philippines
(PhilFDA) and others) for a timely and more
accurate administrative-based statistics on agricultural commodities.
Other major statistical programs to address the issues and concerns for the agriculture statistical
system are as follows:
Enhancement of agricultural and fishery
surveys and other related statistical activities in terms of coverage and
methodology/design, data collection and processing. ▪ Study on alternative design for seaweed
production using Key Informant (KI) approach in Palawan.
▪ Review of the existing design, methodology and coverage of the Agricultural Labor Survey vs. Labor Force Survey (LFS); and the Survey of Food Demand for Agricultural Commodities vs. Family and Income Expenditure Survey (FIES).
Exploratory works on the use of ICT tools and
GPS and remote sensing in data collection and processing. ▪ Innovative data collection methods for
agricultural and rural statistics-use of satellite-based technology to estimate rice area and production.
▪ Objective yield measurement of palay through crop cutting method.
❖ SDPs supporting the generation of the RRM indicators
Table 5. SDPs supporting the generation of RRM Indicators on Agriculture and Fisheries.
Statistical Development Programs RRM Indicators PSDP
Disaggregated
Data
Improvement of the existing design/methodology and Updating of the sampling frame for palay and corn production surveys
Yield of major commodities increased (in metric ton per hectare):
- palay - white corn - yellow corn
National, regional, and provincial levels
Improvement of the existing design/methodology and Updating of the sampling frame for other crops
production surveys
Yield of major commodities increased (in metric ton per hectare):
- banana - mango - cassava - cacao - pineapple - sugarcane - coffee - rubber
National, regional, and provincial levels
Improvement of the existing design/methodology and Updating of the sampling frame for other crops
production surveys
Proportion of industrial crops to total crop production increased (in %)
- abaca - coffee - rubber - tobacco - cacao - oil palm - sugarcane
National, regional, and
provincial levels Volume of industrial crops production
increased (in ‘000 metric tons) - abaca - sugarcane - rubber - oil palm - cacao
Improvement of the existing design/methodology and Updating of the sampling frame for other crops production surveys
Yield of major commodities increased (in metric ton per hectare):
- coconut (copra)
National, regional, and provincial levels
Improvement of the existing design/methodology and Updating of the sampling frame for livestock and poultry production surveys
Volume of production increased (in ‘000 metric ton):
- hog - chicken
National, regional, and provincial levels
Updating of frame on aquafarms and fish landing centers and generation of fishing effort statistics through the conduct of monthly commercial and municipal fisheries surveys and improvement of existing design specifically for seaweed production survey
Volume of production increased (in ‘000 metric ton):
- commercial fisheries - municipal fisheries -aquaculture
National, Regional, Provincial levels; by
species

39
▪ Use of tablet on collection of palay and corn stocks through the National Agri-Food Information System (NAIS).
▪ Use of a web-based processing, compilation, data flow and exchange system for the Survey of Slaughterhouses and Poultry Dressing Plants (SSHPDP).
Establishment of a data system on emerging
concerns on agriculture. ▪ Preparation/development of survey design/
methodology for the conduct of survey for other livestock and poultry commodities (sheep, quail eggs) and for freshwater cultured ornamental fishes.
▪ Conduct of benchmark survey to address
identified data gaps in the generation of GHGI for the agriculture sector (to be part of Chapter on environment statistics).
▪ Generation of fishing effort statistics (catch by fishing ground, per gear, per boat) through the conduct of monthly commercial and municipal fisheries surveys.
▪ Conduct of surveys to address limited coverage on cost of production and marketing cost.
Conduct of study on the updating of parameters (seed usage, wastage,
processing) and technical conversion ratios
for SUA/FBS.
Capacity-building on AGStat data system,
data review/validation. Conduct of PSA wide
orientation on the various agricultural surveys both at the central and field levels.
Policy Uses
The statistical programs will benefit the agriculture
and fisheries sector by serving as inputs in
measuring food requirements of the country, as an indicator of the adequacy of food supply relative to
the nutritional requirements of the population, and as basis for planning and formulation of policies on
food security, and for decision making on
importation and domestic trade. These programs will also help in formulating policies on sustainability
and development to support food security programs. These will also help the DA in
monitoring, assessment, and identification of programs for the development of specific industries
such as quail eggs and sheep industries. Lastly,
these programs shall address the PSA's goal of providing timely and reliable information, as well as
being responsive to the information needs of its clientele.
40
Chapter 9 - Industry, Trade, and Investment Statistics Industry statistics
Introduction
Industry, trade and investments are primary growth
drivers of the economy.
Industries harness the country’s human capital, natural and economic resources and technology to
keep business running and ensure the continuous supply and diversity of products and services.
This chapter presents a strategic plan for the
improvement of industry statistics for better-informed policy and effective impact monitoring.
Situational Analysis
❖ Key developments in 2011 – 2015
Major surveys/census conducted: ▪ 2014 Annual Survey of Philippine Business and
Industry (ASPBI)
▪ 2014 Survey on Tourism Establishments in the Philippines (STEP)
▪ 2013 ASPBI
▪ 2012 Census of Philippine Business and Industry (CPBI) for Establishments and Enterprises (Main data items in totals only)
▪ 2012 Input-Output Survey of Philippine Business and Industry (IOSPBI)
▪ 2011 Survey of Enterprises in the Philippines (SEP)
▪ 2010 ASPBI
▪ 2010 Survey on Information and Communication Technology (SICT)
▪ 2010 Pilot SEP
Generation of micro, small and medium enterprises (MSME) statistics from 2012 CPBI
based on employment size and 2013 ASPBI total assets (resources including land owned
by the establishment).
Use of revised standard classification systems
such as the 2009 Philippine Standard
Industrial Classification (PSIC) and the Philippine Standard Geographic Classification
(PSGC) in the following surveys: ▪ 2012 CPBI
▪ 2012 Quarterly Survey of Philippine Business and Industry (QSPBI)
▪ 2013 ASPBI
▪ Monthly Surveys of Selected Industries
▪ Producers Price Surveys
Automation of data collection through ICT
application. ▪ Monthly Surveys of Selected Industries
▪ Producers Price Surveys
Conduct of users/regional dissemination fora
for the 2012 CPBI and 2013 ASPBI.
Preparation of metadata documentation of establishments surveys through the National
Data Archive (NADA).
Adoption of Advance Release Calendar (ARC)
for surveys conducted.

41
Establishment of data enclave for
manufacturing statistics.
❖ Issues and Concerns
Widened data gaps due to increasing demand for more detailed data disaggregation as well
as data on related indicators for local-level policy formulation in the business and
industry sectors.
Growing importance of utilizing
administrative-based data.
Lack of statistical coordination mechanisms
that address issues in the generation and
dissemination of industry statistics.
Need for more timely industry statistics in
support to demand of users (e.g. for the early release of national accounts).
Need to continue the development of the Philippine business register.
Statistical Programs for 2016 and 2017
❖ Summary The generation of provincial data from CPBI for
selected growth areas is a major activity for the industry sector. Other activities will focus on the
following:
Provision of guidance and direction for statistical development through: ▪ Creation of the Technical Working Group (TWG)
on Industry Statistics
▪ Reviving the Task Force on MSME
Improving the relevance and timeliness of
data production and dissemination in the
Philippine Statistical System (PSS) by reviewing the timeline and activities of
establishment surveys in support of the early release of national accounts estimates.
Responding to emerging statistical information needs such as the Sustainable
Development Goals (SDGs), data revolution,
etc. through: ▪ Updating of the list of establishments
Promoting the optimal utilization of information technology in statistical business
processes through the establishment enclave (1986-latest) for BPM, industry, except
manufacturing, and services sectors.
Strengthening statistical research and
capacity development through: ▪ Training on the use of financial statements (FS)
of companies.
▪ Enhancement of the administrative-based industry statistics through the conduct of statistical capacity building activities for agencies that generate statistics from administrative forms.
Dissemination of the rebased (2012=100) series for CPI and PPI for manufacturing.
Rebasing of the Quarterly Economic Indices (QEI) to base year 2012.
❖ SDPs supporting the generation of the RRM indicators
Table 6. SDPs supporting the generation of RRM Indicators on Industry Statistics
Statistical Development Programs
RRM Indicators PSDP Disaggregated Data
Generation of provincial-level labor and employment statistics based on the Labor Force Survey or LFS (including use of tablets) Compilation of the National Accounts (PSA)
Labor productivity in agriculture and fisheries sector increased (in PhP)
Labor productivity in industry and services sectors increased
National level
Policy Uses
Statistical programs for improving the quality of
industry statistics shall be undertaken for the
purpose of coordination and planning and the early release of the national accounts estimates.
42
Chapter 9 - Industry, Trade, and Investment Statistics Trade statistics
Introduction
Trade not only moves goods and services. It plays
a vital role in keeping the economy on the move. With every product that the economy produces and
with every service it provides, different opportunities are created. Trade generates
employment, empowers workers, redefines product
and service quality, improves quality of life, and provides various avenues for growth for the entire
economy.
This section presents an overall plan for the further improvement of trade statistics in support of the
PDP 2011-2016 and other policy uses.
Situational Analysis
❖ Key developments in 2011 – 2015
Adoption of the 2008 System of National
Accounts (SNA) and Balance of Payments (BOP) and International Investment Position
(IIP) Manual, 6th Edition (BPM6) recommendations on Trade in Goods and
Services (exports and imports) in the revised/rebased national accounts. ▪ Inclusion of merchandising and goods for
processing to trade in goods.
Institutionalization of the Generation of Data
on Information and Communication Technology-Business Process Outsourcing
Services (ICT-BPO) through National Statistical Coordination Board (NSCB)
Executive Board Resolution No. 2, Series of 2013.
Improvement of the Bureau of Customs’
(BOC) processes in collecting trade statistics; forging a Memorandum of Agreement (MOA)
between the BOC and the PSA on the provision of certain data for foreign trade
statistics (FTS).
Review of methodology for the revision of
import statistics.
Generation of pilot estimates on the Chained Foreign Trade Index (CFTI).
❖ Issues and Concerns
Need to provide additional Philippine
Standard Industry Classification (PSIC) codes for emerging industries identified in the ICT-
Business Process Management (ICT-BPM)
Workshop 2014.
Need to adopt the 2015 Philippines Standard
Commodity Classification (PSCC) in classifying the FTS.
Further improvement in the collection of trade statistics of the BOC which entails a full
implementation of electronic to mobile (E2M)
file for both imports and exports provided by BOC in the generation of FTS.
Need to further improve the methodology of generating FTS.

43
Need to institutionalize the generation of the
CFTI.
Need to establish consistency of trade data
with the International Trade Statistics’ (IMTS) recommendations.
Need to reconcile or identify divergence
between the estimates of trade in goods and services of the Philippine SNA (PSNA) and the
BOP. Review and refine the methodologies of
national accounts and BOP in generating the trade in goods and services.
Statistical Programs for 2016 and 2017
❖ Summary
Priority statistical programs to be undertaken for the trade sector are the implementation of the
2015 PSCC, as well as the IMTS’
recommendations in the generation of FTS and strengthening partnership between the
Philippine Statistics Authority (PSA) and the BOC on the institutionalization of data sharing needed
for the generation of FTS; to include training on
the use, interpretation and estimation of statistics from financial statements of
companies.
Other statistical programs for the period are aimed at:
Improving the relevance and timeliness of
data production and dissemination in the PSS through statistical research and development
to be done by: ▪ Provision of additional PSIC codes for emerging
industries in the services sector
▪ Institutionalization of the generation of CFTI
Provision of guidance and direction for
statistical development towards the harmonization of the macroeconomic
accounts and statistics through the refinement of the survey on ICT-BPO.
Strengthening statistical research and capacity development through the following
activities: ▪ Conduct of a comprehensive review of the
alternative methodology in generating FTS
▪ Refinement of the methodologies of national accounts and BOP in generating trade in goods and services
Promoting the optimal utilization of
information technology in statistical business processes by implementing the electronic to
mobile file for both imports and exports
provided by BOC in the generation of FTS.
❖ SDPs supporting the generation of the RRM indicators
Table 7. SDPs supporting the generation of RRM Indicators on Trade Statistics
Statistical Development Programs
RRM Indicators PSDP Disaggregated Data
Improvement of the compilation of foreign trade statistics (PSA)
Merchandise exports increased by 74.7%
National level; by commodity; by country of destination
Policy Uses
The quality of trade statistics will be improved to
facilitate effective assessment of the economic performance of emerging industries in the service
sector and provide adequate information on
imports and exports industries to better guide macroeconomic policies.

44
Chapter 9 - Industry, Trade, and Investment Statistics Investment statistics
Introduction
Investments contribute to job creation, business development, and expansion of economic activities
in the country. Investments induce economic production and raise standards and welfare in the
economy. Foreign direct investments (FDI), in
particular, bring technological innovation, labor skills and management of best practices that help
improve ways of doing business. Domestic investments, on the other hand, indicate both the
capacity and confidence of Filipino investors in
inducing business and sustaining the economy.
This chapter provides some key strategies for the
improvement of investment statistics towards better-informed policy and governance reforms.
Situational Analysis
❖ Key developments in 2011 – 2015
Improvements in the compilation of Foreign Direct Investments (FDI) by the Bangko
Sentral ng Pilipinas (BSP). ▪ Improvement of the Coordinated Direct
Investment Survey (CDIS). The annual CDIS questionnaire was revised in 2014, after a series of consultative meetings with selected respondents. The revised questionnaire was used in the 2013 survey round conducted in April 2014.
▪ Improvement of the Monthly Cross Border Transactions Survey (CBTS). The Monthly Cross Border Transactions Surveys 1, 2, & 3 were merged and revised to reduce respondents' burden and incorporate the new data
requirements for BOP compilation. The revised questionnaire was launched in April 2015 covering data for January-March 2015.
▪ Improvement of the Quarterly Survey on FDI and Related Data. The Quarterly Coordinated Direct Investment Survey replaced the Quarterly Survey on FDI and Related Data to ensure consistency of these two sets of data. The revised questionnaire was launched in April 2015 covering data for the first quarter of 2015.
▪ Collaboration with the PSA on the various surveys being conducted by the BSP in order for the companies to respond to the surveys which provide vital inputs to the compilation of the BSP’s BOP IIP and the PSA’s national accounts.
Implementation/Adoption of BPM6. Another
development pursued by the BSP is the full implementation of the shift of the BOP compilation
to BPM6 framework in March 2014 in compliance with the recommendations set out in the BOP manual. Initial shift to the new framework was done by the BSP in March 2013. This initiative is aligned with the international best practice of using the standards prescribed by the International Monetary Fund (IMF). Meanwhile, the compilation of IIP data based on BPM6 framework was completed in September 2014 with the simultaneous release of the quarterly IIP data as of end -March 2013 to end -June 2014. Backtracked IIP data series for the years 2006 to 2012 and quarterly 2013 were also released.
Disaggregation of quarterly data on approved domestic and foreign investments by region. The PSA started to generate data on approved

45
domestic and foreign investments by region in the First Quarter 2015 Report for the location of the proposed investments. This is in addition to the existing data by investment promotion agency, by country of investor and by industry, including projected employment.
Updating of the Register on FDI Enterprises in the Philippines. The Register has been
regularly updated by the Securities and Exchange Commission (SEC). Statistics that can be generated from the Registry were compiled and disseminated.
Proposed executive order on the submission of data on approved and actual investments
by the investment promotion agencies. This
involves the formulation of an executive order by the Interagency (IAC) on Investment Statistics enjoining the Investment Promotion Agencies (IPAs) to submit data on approved and actual investments in order to enhance data consolidation. It was endorsed to the Office of the President by the then NSCB. However, it has to be further evaluated vis-à-vis the proposed bill on tax incentives management and transparency requiring the IPAs to submit data.
❖ Issues and Concerns
Need to further improve the compilation
methodologies and data sources for FDI in order to address data gaps and
inconsistencies and to better capture
investment transactions.
Low participation rate of private non-bank
respondents to the surveys due to the BSP's lack of authority to collect information from
these entities.
Need to develop estimation methodology for
realized/actual investments.
Lack of automated system in the generation
of statistical reports by the SEC.
Need for more accessible data on
investments.
Statistical Programs for 2016 and 2017
❖ Summary Major activities in the sector include the
development of methodology to estimate realized/actual investments and the
development and implementation of the
Company Investments and Financial Statistics System (CIFSS). (This is further discussed in the
chapter on Financial Statistics).
Other activities are focused on:
Improvement of the generation and compilation of investment statistics and
indicators. ▪ Alignment of the International Transactions
Reporting System (ITRS) with the Financial Reporting Package (FRP).
▪ Complete coverage of the investment promotion agencies (IPAs) in the generation of data on approved foreign and domestic investments.
Development of information systems on investment statistics. ▪ Online-System (Extensible Business Reporting
Language) for the submission of financial reports.
▪ Implementation of open data initiatives, such as posting of SEC data on its website and on the government's open data portal <http://www.data.gov.ph>.
Development of standards and mechanisms in the generation of quality investment
statistics. ▪ Improvement of the statistical framework on
investment statistics and review of the terminologies.
▪ Enhancement of the provision in the BSP Charter on authority to access data and information that will allow the BSP to obtain data from non-financial corporations.
Policy Uses Statistical programs aimed at improving the quality of statistics on investments are essential in the provision of more timely and accessible data in the formulation of investment policies and programs towards the improvement of the country’s economy.
❖ SDPs supporting the generation of the RRM indicators
Table 8. SDPs supporting the generation of RRM Indicators on Investment Statistics
Statistical Development Programs RRM Indicators PSDP Disaggregated
Data
Increased/complete coverage of the investment promotion agencies (IPAs) in the generation of data on
approved foreign and domestic investments (PSA)
Total Approved investments increased by 35.8%
National level; by region; by industry; by investment
promotion agency; by country of investor
Development of methodology to estimate realized/actual domestic and foreign investments (IAC
on Investment Statistics)
Total actualized/realized investments
46
Chapter 10 – Tourism statistics
Introduction
Tourism is widely considered as a powerful driver of economic growth due to the influx of foreign
exchange from visitor receipts as well as the
employment and investments generated. Tourism is one of the key priority areas of the PDP 2011-2016.
With many attractive destinations to offer to tourists, the country enjoys a good comparative
advantage in the tourism industry. Hence, the PDP
envisions “a globally-competitive and innovative industry and service sector that contributes
significantly to inclusive growth and employment generation.”
In support of tourism development, policies and
programs need tourism statistics and indicators that are essential in designing marketing programs and
policies.
This chapter provides a strategic plan to sustain initiatives in improving tourism statistics in national
and local tourism development plans and policies.
Situational Analysis
❖ Key developments in 2011 – 2015
Enhancement of statistical surveys on
tourism through improvement of survey questionnaire and methodology: ▪ The Survey of Tourism Establishments in the
Philippines (STEP) generates data on tourism, particularly the number, types, and characteristics of tourism establishments in the country as well as the number and activities of visitors. The second round of the survey was undertaken in 2015 which was first conducted in 2010.
▪ The Visitor Sample Survey (VSS) is a monthly survey that generates information on visitor characteristics and preferences as inputs to tourism development planning and policy formulation and to derive parameter estimates for measuring foreign exchange earnings from tourist travels.
▪ The Meetings, Incentives, Conferences and Exhibitions (MICE) Survey was conducted in 2013 to determine actual usage of convention facilities, average daily expenditure of delegates
and trends of incentive travel to the Philippines.
▪ The Accommodation Capacity Survey was conducted in 2013 to determine the number of rooms available for tourists.
Enhancement of processing of
Arrival/Departure (A/D) Cards to determine the volume and percentage increase of
international visitors through the DOT Tourist Tracking System (TTS).
Improvement of the travel and transportation services account coverage of the BOP with
the implementation of the BPM6 by the BSP.
Improved methodology for the Philippine
Tourism Satellite Accounts (PTSA). The PTSA
was first released in 2011 covering the years 2000 to 2010. Continuous improvement of the methodology and the updating of the parameters are being done for the annual compilation of the PTSA by the Philippine Statistics Authority (PSA).
Review and Updating of Tourism Statistics
Manual and Tourism Planning Guidebook. This involves updating of the Manual and Guidebook prepared by the Department of

47
Tourism (DOT) in collaboration with the Japan International Cooperation Agency (JICA) in 2012 to serve as guide for data collection, generation, dissemination and accessibility of tourism statistics, as well as, to illustrate and show how statistics are used in development planning.
Implementation of the Tourism Statistical Capacity Building Program. The program
upgraded the knowledge and skills of personnel of the DOT central and regional offices including the local government units (LGUs) in the data collection, recording, and report generation, and in the analysis and use of statistics in tourism plans, policies and programs competitiveness of their respective tourism-specific areas.
Enhanced dissemination of tourism statistics
through the DOT website. The DOT has
expanded the database of tourism statistics disseminated on its website. Continuous improvements are being done to enhance the dissemination and accessibility of tourism statistics.
❖ Issues and Concerns
Need for improved data system that will provide for timely, reliable and accurate
information as input to generation, reporting and analysis of domestic tourism statistics.
Need to compile new and relevant statistics/indicators to address new/emerging
concerns and the information demands of
data users and stakeholders.
Need for continued statistical capacity
building activities. ▪ It is necessary to have further training on
methodological frameworks and standards to facilitate development and improvement of important tourism indicators.
▪ Tourism institutions and LGUs need continuous training in both statistical data collection and use.
▪ Increasing the appreciation of data providers such as households and tourism establishments is crucial in the generation of quality tourism statistics.
Need to have adequate resources, especially
human resources, for generating tourism statistics and indicators. ▪ As the tourism industry continues to expand,
demand for data also increases which requires augmentation of the existing statistical human resources in government.
▪ The DOT needs more dedicated personnel to collect, compile, and manage the growing tourism database in the country.
Statistical Programs for 2016 and 2017
❖ Summary
Major activities in the sector include the conduct of the 2016 Household Survey on Domestic
Visitors (HSDV) and the updating of the
Philippine Tourism Statistical Classification System (PTSCS).
Other activities to be undertaken:
Improvement of the statistical surveys on tourism for the generation of more quality
data. ▪ Processing of 2014 Survey of Tourism
Establishments in the Philippines (STEP).
Maximization of the use of administrative-based data systems in the generation of
official statistics. ▪ Continuous improvement of the processing of
Arrival/ Departure Cards including those in seaports.
▪ Enhancement of reporting tools in the generation of basic tourism statistics.
▪ Improvement of the Local Governance Performance Monitoring System (LGPMS).
Updating of the standards in the generation
of quality tourism statistics. ▪ Enhancement of the statistical framework for
the compilation of tourism statistics and indicators and review of the concepts on tourism statistics.
Improvement/Development of relevant
tourism statistics and indicators. ▪ Improvement of the compilation of the
Philippine Tourism Satellite Accounts.
▪ Development of Input-Output Table for Tourism Sector.
Enhancement of statistical capacities of data producers, providers and users. ▪ Standard Local Tourism Statistics System
Training for tourism agencies, LGUs and private sector.
Policy Uses
Statistical programs for the improvement of tourism
statistics are to be performed for evidence-based planning and programming in the tourism sector
toward increased contribution to the economy.

48

49
4 – Infrastructure
development
50
Chapter 11 – Transport statistics
Introduction
Transportation plays an important role in the
economy and society. It brings people to school, the
hospital, and the workplace as well as to places for sports, leisure, and cultural activities. It carries
livestock, and goods and services from production bases to markets and consumers. Transportation is
vital to tourism and business activities and thus
contributes to employment generation and economic growth.
The basic goals of transportation are mobility and
accessibility to enable people conduct their day-to-day social and economic activities. An efficient
system of transportation moves people and goods fast, safely, and efficiently, and provides access to
basic and other services. With the varied physical, social and economic topography of the country,
careful thinking and in-depth study are crucial in
determining appropriate transport infrastructure, resources, and technology, as well as the most
suitable policy to ensure that mobility and accessibility are attained with optimal use of energy
and least impact to environment.
Development initiatives place emphasis on asset preservation, provision of access to major and
strategic tourism destinations and production areas, and promotion of environmentally sustainable and
people-oriented transport systems and services.
This chapter provides a general plan for the improvement of the transport data system to
ensure availability of timely and reliable transport
statistics.
Situational Analysis
❖ Key developments in 2011 – 2015
More organized and efficient database for network level Road and Bridge related data
that serves as the department's definitive
source of road network definition.
Improvement of the system of identifying
bridges that require upgrade, replacement and maintenance for efficient budget
prioritization.
Development of a system of providing needs
analysis, multi-year programming and annual budgeting for the preservation of road
pavements on the national road network and
national bridges, customized to local conditions.
Implementation of the Integrated Road
Accident Data System (RADSYS) and establishment of a procedure for updating
road crash costs.
Implementation of a Traffic Accident Recording and Analysis System (TARAS) to
assist the Department of Public Works and Highways (DPWH) in identifying black spots
and in improving safety project planning.
Development and integration of road crash
database systems for relevant and reliable
road crash data available to government and the public.

51
Improvement of the system of collecting and
processing of data for both Traffic Counts and Axle Load Surveys.
Establishment of a system for annual updating of the cost of road crashes and
conduct of periodic review every three years.
Enhancement of the Bridge Management
System/Highway Development Management, and Road and Bridge Information Application
of the DPWH.
Establishment of databases for municipal and
barangay roads, and the enhancement of the
Road Traffic Information Application (RTIA) Traffic Volume Data.
Execution of a more strengthened dissemination of transport statistics through
public-private partnership and use of appropriate technology (i.e. data
visualization techniques, geographic
information system (GIS) / geographic information management (GIM), social
networking).
Creation of statistical units and positions in
the local government units (LGUs) to ensure continuous production and improvement of
transport statistics.
❖ Issues and Concerns
Unavailability of up-to-date, relevant and
reliable road crash data which are accessible to public and private stakeholders.
Need to improve the current system of updating bridge inventory as well as
prioritizing bridges that require upgrading, replacement and maintenance.
Need to develop a system for preservation of
road pavements on the national road network and national bridges.
Need to improve the road and bridges database.
Need to improve administrative-based
reporting and information systems and to
identify new ones to collect/generate essential transport data.
Need to improve the information system used to generate essential traffic data.
Low understanding, capacity and trust in statistics of users.
Low and limited resources for statistics.
Statistical Programs for 2016 and 2017
❖ Summary
Enhancement of existing statistical surveys
on transport and development of new ones to generate priority data to support transport
sector analysis and policy.
Development of a system for updating the
cost of road crashes annually.
Conduct of periodic review and further
enhancement of the Bridge Management System (BMS), Pavement Management
System/Highway Development Management,
and Road and Bridge Information Application.
Creation of database for municipal and
barangay roads.
Identification and validation of black spots
through TARAS and other road crash reporting systems such as RTIA Traffic
Volume Data.
Continuation of the strengthened
dissemination of transport statistics through
public-private partnership and use of appropriate technology (i.e. data visualization
techniques, GIS/GIM, social networking).

52
Chapter 12 – Energy statistics
Introduction
The energy sector is considered as one of the vital lifelines of the country. Electricity and petroleum
products, the primary commodities of the sector, are basic essentials in almost all human activities
across all sectors of society. A sufficient and stable
supply of energy is necessary to sustain development.
Recognizing the pervasive impact of energy in the national economy and considering the overarching
objective of economic growth and energy
independence in the energy sector, the Philippine Energy Plan (PEP) zeroes-in on increasing
indigenous oil and gas reserves and developing renewable energy potential such as biomass, solar,
wind, ocean and geothermal resources. With the
energy sector restructuring and ongoing privatization process, the energy sector is fast
becoming a market-based industry and is inevitably moving towards a more competitive and efficient
sector.
The energy sector’s wide range of utilization and benefit to the country’s socio-economic activities
provide for an inherently complex system for statistical coordination, data generation and
analysis.
Situational Analysis
❖ Key developments in 2011 – 2015
Conduct of the 2010 Survey of Energy
Consumption of Establishments (SECE). The
SECE was conducted through the cooperation of the then National Statistics Office (NSO) and the
Department of Energy (DOE) in September 2011 which covered about 9,440 establishments in all industries. The survey aimed to collect benchmark information on the country’s energy utilization pattern by sector and generate data required to measure demand for energy important in setting policies and implementing programs of the DOE.
Conduct of the 2011 Household Energy
Consumption Survey (HECS). Like the SECE,
the HECS was a joint activity between the former NSO and DOE. The survey was conducted to collect and update data on residential energy consumption patterns and preferences needed in policy setting and program implementation of the DOE. The results of the 2011 HECS Volume I was published in 2014.
Release of several publications on energy
research and energy statistics. ▪ 2010 Energy Supply and Demand Situationer
▪ 2010 Key Energy Statistics
▪ 2011 Key Energy Statistics (including the 2011 Philippine Energy Situationer and 2012 Philippine Key Energy Statistics)
▪ 2015 Philippine Energy Statistics Manual
Creation of an Interagency Committee (IAC) on Energy Statistics.
❖ Issues and Concerns
Need for a national framework on energy
statistics that would define concepts and set
standards relating to energy statistics and the improvement of methodologies and
exploration of new data sources for the compilation of the energy accounts.

53
Need to institutionalize the conduct of the
energy surveys such as HECS and SECE.
Need for the compilation of a complete set of Energy Accounts for the Philippines based on
the 2012 System of Environmental-Economic Accounting.
Need for enhanced coordination mechanism in hastening the generation, consolidation,
dissemination and analysis of energy and energy related statistics.
Statistical Programs for 2016 and 2017
❖ Summary
To further improve the generation and
compilation of energy statistics and
indicators, the following programs are set to be carried out:
Institutionalization of the energy surveys such as HECS and SECE.
Compilation of energy accounts.
Establishment of the IAC on Energy Statistics.
Policy Uses
Institutionalization of energy surveys such as HECS
and SECE and the compilation of energy accounts will aid in the general policy planning of the
government. Compiled energy accounts will also be used as input to the estimation of the national
accounts of the Philippines.

54
Chapter 13 – Information society statistics
Introduction
The Philippines has a high diffusion of information and communications technology (ICT) that extends
to most parts of the archipelago. The continued
expansion of ICT especially cellular mobile telephone services and broadband internet has
allowed ideas, information, and knowledge to cross over physical, economic, and social barriers.
The availability of information society (IS) statistics,
including ICT-related statistics, is key to the formulation of appropriate regulatory and policy
reforms that will harness the full potentials of the
sector towards achieving economic growth and social development.
This chapter presents general strategies and programs to further develop a dynamic yet
dependable IS statistics.
Situational Analysis
❖ Key developments in 2011 – 2015
The following are the achievements of the Philippine Statistical System (PSS) led by
information society statistics:
Institutionalization of the regular conduct of
household-based ICT surveys and surveys of ICT usage in government, including LGUs. The Philippine Statistics Authority (PSA) together with its partners conducted different surveys in order to generate data on the use of ICT in the household and in the government.
To generate ICT data on households and individual access and usage of ICT, the PSA conducted the Survey on Information and Communications
Technology (SICT) twice—one in 2011 and another in 2014.
To generate government data on ICT usage and resources, the Information and Communications Technology Office (ICTO) and the National IT Industry of the Promotion Agency (NIPA) of the Republic of Korea conducted the Survey on National
Government ICT Resources. This survey was used to assess the current state of e-Government in the Philippines and to provide direction for its future developments.
Enhancement and institutionalization of
establishment-based surveys to generate ICT
statistics on e-commerce, e-business, and m-commerce; and the survey on ICT-BPO
Services on outsourcing revenues and
employment. The PSA institutionalized the
generation of data of ICT-BPO through NSCB Resolution No. 2, series 2013. The resolution provides that data on ICT-BPO services will be generated through the Census of Philippine Business and Industry (CPBI) or the Annual Survey of the Philippine Business and Industry (ASPBI).
Development of an information society (IS)
statistics web portal to link and consolidate all ICT statistical information resources
produced by various government institutions. In order to consolidate all ICT statistical information of different government institutions, the ICTO and the International Telecommunications Union (ITU) launched the Philippine ICT Statistics Portal in 2012. ICTO and ITU conducted the ITU Regional Forum and

55
Training Workshop in 2014 to identify primary issues and challenges.
Conduct of capacity building programs on IS statistics through partnership among the
major statistical agencies and other major IS-related data producers including international
development partners. The PSA has lined up
various activities to strengthen its collaboration with its partners regarding IS statistics. Among these activities were the Workshop/Forum on the Production and Compilation of IS-Related Data, Training/ Orientation for the Use of Data Visualizations and GIS-Based Presentations, and Training/Seminar on New and Latest Internationally-Agreed Methodologies and
Standards on the Compilation of IS Statistics.
Development of a statistical framework for IS
to identify the most relevant statistical indicators for the measurement and
monitoring of IS. In order to establish a reliable
IS statistical framework, the PSA assessed priority IS statistics to be generated. Likewise, it formulated statistical concepts, definitions, and classification systems consistent with international standards and concepts.
Assessment and improvement of IS statistics
towards inclusion in the System of Designated Statistics (SDS). The SDS is a mechanism that identifies and generates the most critical and essential statistics required for social and economic planning/analysis based on approved criteria. Having a major bearing in different sectors at present, the PSA included IS statistics in the SDS.
Review and enhancement of surveys to produce IS data with local-level
disaggregation.
Participation in international programs for the
development and updating of standards and
methodological frameworks/manuals based on the World Summit on the Information
Society (WSIS) and ITU Core ICT indicators. The PSA has continued to participate in workshops/ seminars related to the production, compilation, and dissemination of IS/ICT statistics sponsored by WSIS, ITU, and the UN. In 2015, the Chair of IAC-ICTS participated in the 13th World Telecommunication/ICT Indicators Symposium in Japan.
Strengthening of institutional coordination
within the PSS and between PSS and the DMB, legislative bodies, and development
partners to ensure funding of the continuous improvement and production of critical
statistics on IS. In 2013, the rationalization plan
in government agencies paved the way for the establishment of statistical units and creation of statistician positions in agencies that generate core ICT statistics.
Institutionalization of a sustainable and
efficient financing scheme to ensure availability of funds for designated and
developmental statistical activities.
❖ Issues and Concerns
The key issues and challenges which need to be addressed in the information society sector are
as follows:
Further improvement of the Data Warehousing Project II from the Bangko
Sentral ng Pilipinas (BSP). ▪ Revision or implementation of a new system for
data capture and origination. ▪ Enhancement of the reporting process to make
report generation more efficient and effective.
Need to involve other ICT data contributors in the IAC-ICTS and have a monthly meeting
to address evolving and emerging statistical requirements of stakeholders. ▪ Involvement of the Commission on Higher
Education (CHED), Technical Education and Skills Development Authority (TESDA), and other private telecommunications companies as partners/contributors.
Need to increase frequency of data gathering
for ICT data.
Need to create/organize a Technical Working
Group (TWG) under the IAC-ICTS for the
collection of ICT statistical data for national government agencies (NGAs).
Need to craft a standard format for ICT data to streamline data submission and
consolidation for the ICT Statistics Portal.
Statistical Programs for 2016 and 2017
❖ Summary
To meet the goal of delivering more timely, accessible, coherent, comparable,
comprehensive, and relevant statistics on IS, and to increase user understanding, capacity
and trust in statistics for its wider and rational
use, the following are deemed priority activities for 2016-2017:
Redesign the master sample of household
surveys to generate ICT data with lower level
disaggregation. To ensure the relevance of IS

56
statistics, the IAC-ICTS plans to redesign the master sample of household surveys to generate ICT data with lower level disaggregation. This is part of the implementation of a data quality assessment framework for this sector.
Conduct of ICT Survey on an annual basis. The IAC-ICTS plans to conduct the ICT survey annually in order to generate data on a regular basis.
Development of the methodology on the
estimation of satellite accounts for the information economy (IE). To determine the
contribution and role of IE in the country’s economic structure and development, the IAC-
ICTS plans to develop a methodology to estimate satellite accounts for IE. The committee will start by reviewing the codes used by International Standard Industrial Classification (ISIC). In addition to this, it will review the IE framework of other countries.
Purchase of statistical software. The IAC-ICTS
plans to invest on statistical software such as Eviews and Stata as an additional tool in processing IS statistics.
Hiring of consultants, statisticians,
economists, and programmers. In line with the
institutionalization of the regular conduct of ICT-related surveys, the ICTO and NTC plans to hire personnel that will assist in the data collection, data processing, and analysis of IS statistics.
Enhancement of the Philippine ICT Statistics Portal
Advocacy programs for interagency
coordination and harmonization for periodic and systematic data collection and analysis. The IAC-ICTS plans to hold consultations regarding its broadband plan and ICT roadmap with concerned agencies/institutions. Likewise, IAC-ICTS activities such as briefings and orientations on ICT statistics will be made part of the National Statistics Month (NSM).
Statistical capacity building. As part of
enhancing data dissemination on IS statistics, the IAC-ICTS plans to conduct trainings related to GIS-based presentations and data visualizations.
Expansion of the IAC-ICTS. To strengthen the
implementation of its programmed activities, the IAC-ICTS intends to create the following technical working groups (TWGs): TWG for ICT Statistics, TWG for ICT Household Data, TWG for Business Data, and TWG for NGA ICT Data.

57
5 – Social Development

58
Chapter 14 – Population and housing statistics
Introduction
The Philippine Statistical System (PSS) continues to be responsive to the needs of government
executives, policy makers, and planner for
population and housing statistics on which to base their social and economic development plans,
policies, and programs.
Decadal and mid-decade population and housing censuses are important sources of basic population
and housing statistics. The use of population statistics is vital in the formulation of policies
concerning various segments of the population
(infants, children, youth, elderly, and women of reproductive age, voting age, and working age) at
the national and sub-national levels. Population counts based on censuses are the official sources of
data used for purposes of redistricting and apportionments of congressional seats, allocation of
resources and revenues, and creation/conversion of
political and administrative units.
Furthermore, the scope and coverage of the
population and housing statistics is broad and
interdisciplinary in nature where fertility, mortality, and migration are vital demographic processes.
Special periodic surveys supply data on these processes. These surveys capture major aspects of
health and socio-economic factors that interplay with demographic trends.
Housing statistics present information on the
available housing accommodation, patterns of living, and construction trends. These details are
essential for the preparation of programs and
policies on housing development, resettlement, infrastructure support, and financing assistance.
Situational Analysis
The leading sources of population and housing
statistics are the censuses and surveys conducted
by the Philippine Statistics Authority (PSA). Statistics on overseas Filipinos emanate from the
administrative records of the Philippine Overseas Employment Administration (POEA) and the
Commission on Filipinos Overseas (CFO) and the
PSA’s Survey on Overseas Filipinos (SOF).
During the period 2011-2015, activities and
programs that generate and enhance the quality of
population and housing statistics were undertaken by various agencies in the PSS.
❖ Key developments in 2011 – 2015
Demands of various stakeholders for population and housing statistics are met with data based
on the 2010 Census of Population and Housing
(CPH), 2010 Census-based Population Projections, 2013 National Demographic and
Health Survey (NDHS), Overseas Filipino Workers Deployment Statistics for 2005 to 2014,
and Annual Compendium of Statistics on International Migration.
2010 CPH. The population counts by barangay
from the 2010 CPH were made official with the signing by His Excellency President Benigno S. Aquino III of Proclamation No. 362 on March 30, 2012. Detailed demographic and housing characteristics based on the 2010 CPH were disseminated in various publications after this proclamation, beginning in 2012 to 2013 for data items collected from all households and in 2014 for data items collected from sample households.

59
Likewise, the corresponding census micro data files were made available to users during the same period. The 2010 CPH, which was conducted by the former National Statistics Office (NSO) in May 2010, underscores the importance of statistical information on the country’s residents and their dwelling units. The CPH is the most detailed source of data on the size, distribution, and composition of the population and its dwelling units for different geographic units, such as national, regional, city/municipal, and barangay level. The purpose of the census is to provide basic population and housing information to enable the public and the private sectors to plan for better services, and formulate programs to improve the quality of life of the people.
2010 Census-based Population Projections. The 2010 census-based population projections for the period 2010 to 2045 at the national level, which used the cohort-component method, were released in July 2014. The cohort-component method takes into account the three demographic processes namely: fertility, mortality and migration, in projecting population. The methodology, which was approved by the PSA Board in April 2014, involves projecting separately the fertility rates by age of women, 15-49 years of age, and the survival ratios and net migration rates by five-year age groups, for males and females. One important aspect of the 2010 Census-based population projections is the inclusion of an assumption on international migration. In the past population projections, international migration
was assumed to be insignificant and thus, had little or no impact on the projection. The population projection is being prepared by the PSA in collaboration with the Inter-Agency Working Group on Population Projections chaired by National Scientist Dr. Mercedes B. Concepcion.
2013 NDHS. The 2013 NDHS, which covers a
wide range of population and health topics, was conducted by the PSA from August to October 2013. This survey is a nationally representative survey of almost 16,000 households and 19,000 women, 15-49 years old. It was designed to provide information on fertility, family planning, and health in the country. Important findings of the 2013 NDHS were presented in a data
dissemination forum held in 2014. Preliminary results were presented in April 2014 while the final results were presented in September 2014. The data from the 2013 NDHS are used to monitor and evaluate the impact of population programs as well as policy development decisions.
2015 Census of Population (POPCEN 2015) in
August 2015. The 2015 POPCEN was aimed at
providing government executives, policy makers, and planners with population data, especially updated population counts of all barangays in the
country. This nationwide census-taking required some operational features intended to ensure the quality of census data. The PSA utilized technology to facilitate quality control in the data collection. Supervisors used a computer-aided field editing system to assist them in detecting errors or inconsistencies in the accomplished census forms. These supervisors also used the global positioning system (GPS) receiver to collect waypoints or coordinates of the housing unit where the household interviewed resides. Further, the POPCEN 2015 employed the E-Questionnaire in pre-selected highly urbanized cities of the National Capital Region, Cebu, and Davao del Sur. The E-Questionnaire was an electronic version of the basic census form which the household can fill out online or offline through the PSA website. The census-taking was a gigantic operation that entailed the hiring of about 90,000 enumerators and 25,000 supervisors. A study in setting uniform standards in hiring field interviewers, as well as building the capacity and capability of trainers was included in the PSA agenda.
Annual compendium of statistics on international migration. During the review
period, the POEA published a Compendium on Overseas Filipino Workers Deployment Statistics for 2005 to 2014 while the CFO, continued the production of the Annual Compendium of Statistics on International Migration.
Enhanced methodology for estimating
housing needs. The Housing and Urban
Development Coordinating Council (HUDCC) enhanced its methodology for estimating housing needs and updated its estimates using the results of the 2010 CPH.
❖ Issues and Concerns Generation of statistics on sub-population
groups and emerging concerns on population and housing is a thrust of government for a more
informed decision-making process. Inherent to data collection are some technical issues and
operational concerns that need to be addressed
as follows:
Need to review definition, operationalization, and framework of some data items for
consistency and reliability. ▪ Need to reconcile legal and various statistical
definitions of informal settlers and urban areas. The HUDCC adopts the term “homeless and underprivileged citizens” in reference to informal settlers on the basis of the Urban Development and Housing Act (UDHA) of 1992. Urban areas, based also on this Act, refer to all cities regardless of their population density and to municipalities with a population density of at least five hundred (500) persons per square kilometer.

60
▪ Need to study the operationalization of the definition of ethnicity, indigenous peoples and non-indigenous peoples in censuses and surveys, including the formulation of questions to be asked from respondents. The basis for identification of a person’s ethnicity is the R.A. No. 8371 or the Indigenous Peoples Rights Act.
▪ Need to formulate a standard definition for migration and develop a framework for counting international migrants and overseas Filipinos for adoption by all agencies concerned, notwithstanding the availability of international migration statistics at the national, regional, provincial and city/municipality levels.
Need to develop statistical measures and
estimates for some administrative-based information as complementary source of
data. ▪ The PSA will pursue studies on measuring the
level of registration completeness of births and deaths as these are inputs in preparing population projections, among other uses. There is a need to measure under-registration to come up with estimates of birth and death rates. This activity will be in conjunction with the approval of the PSA Board Resolution No. 03 Series of 2015 declaring the Years 2015 to 2024 as Civil Registration and Vital Statistics Decade.
▪ There is a perceived difficulty in administering the set of questions needed to measure maternal mortality through a census. Aside from the rarity and sensitivity of maternal deaths, the
maternal mortality ratio cannot be computed for areas with very small population sizes, that is, for those areas with less than 100,000population. Likewise, the series of questions needed to determine maternal deaths in a household will take up a significant portion of interview time during census-taking. Hence, it will add up to the response burden aside from the difficulty in field operations. The reference period for measuring maternal deaths, e.g., past five years or past three years, also needs to be studied.
▪ In using vital statistics to measure maternal mortality, the under registration of deaths remains a concern that needs to be looked into. Further, not all local civil registrars have used the revised form for Certificate of Death that includes information on maternal death.
Need to establish a well-coordinated
statistical activities and programs across
different agencies to produce quality data and better use of resources. ▪ Response burden is also attributed to the many
surveys being conducted including those conducted by agencies and organizations outside the PSA. There are also existing census-
like data collection activities being undertaken by other government agencies and local government units. There is a need for a strengthened coordination of statistical data gathering activities among the agencies concerned to help minimize respondents’ fatigue and confusion, avoid competition in the recruitment and hiring of interviewers; and confusion among data users on similar statistics and indicators derived from different undertakings of various agencies and organizations. The formulation of a statistical resolution enjoining other agencies to rationalize the timeline of their conduct of census-like activities will be studied.
Need to re-examine time lag between census
data collection and release of census data. ▪ There is a need to review the existing statistical
law, E.O. No. 352, with respect to the schedule of release of results from a mid-decade census when the conduct is maintained in the month of August or September. The current time lag prescribed in E.O. No. 352 is only 3 to 4 months after the end of census-taking. This amount of time is insufficient, given the enormity of records involved and the extended enumeration period for large provinces and cities.
Need to formulate a system of strategies and advocacies to positively influence the overall
attitude of the general public to censuses and surveys. ▪ While the statistical law (Republic Act No.
10625) mandates the PSA to conduct censuses and surveys, including the obligation of households and individuals to respond to censuses and surveys, the responsibility of providing information for decision-making is not yet ingrained among the people. Refusal and low response rate can be attributed to the people’s lack of trust and time to answer questions, security risks, privacy issue, and indifference to government undertakings, among others.
Statistical Programs for 2016 and 2017
❖ Summary
For the period 2016-2017, activities for the sector include the conduct of the 2016 National
Disability Prevalence Survey, the 2017 National Migration Survey, the 2017 NDHS, the 2016 and
2017 SOF and the generation of the 2010
Census-based population projections at the regional and provincial level.
On new and emerging statistics, the PSA will capitalize on opportunities for conducting
several studies on the following concerns:
disability statistics; maternal mortality

61
estimates; indigenous cultural community and indigenous peoples; as well as internal and
international migration.
2016 National Disability Prevalence Survey in
September 2016. In response to the growing
demand for comprehensive and accurate data on persons with disability which are essential in the formulation of plans for the rehabilitation, education, and development of persons with disability, the 2016 National Disability Prevalence Survey will be conducted by the PSA in collaboration with the Department of Health (DOH) and the National Council on Disability Affairs (NCDA). The survey aims to provide national level data on demographic, social, and economic profile of persons with disability.
2017 National Migration Survey. To address
the demand for more in-depth data on migration, the Inter-Agency Committee on Migration Statistics recommended to the PSA the conduct of a national migration survey. The main objective of the survey is to provide baseline data on migration. This is the first time that the survey will be conducted in the country.
2017 NDHS in August 2017. The 2017 NDHS
will be conducted ahead of its original schedule, August 2018, to respond to the need for baseline data in support of the Sustainable Development Goals (SDGs). Use of information, communication
and technology in data collection is being planned for this survey.
Yearly conduct of the SOF. The SOF will be
conducted every year as a rider to the October round of the Labor Force Survey. This survey aims to gather information on Filipino citizens who left for abroad during the last five years.
Population projections at sub-national levels
in 2016. Regional and provincial projected
populations by five-year age group and by sex, based on the 2010 Census of Population and Housing will be released in 2016. The methodology in generating the 2010 Census-based regional population projections was approved by the PSA Board through the PSA Board Resolution No. 06-B, s. 2015, and the methodology for provincial projections through PSA Board Resolution No. 11, s. 2015.
New estimates of housing needs in 2017. The
updating of housing needs estimates will be done by the HUDCC as soon as population and housing data from the 2015 POPCEN become available.
Definition and framework for migration in
2017. The standard definition for migration and
framework for counting international migrants and overseas Filipinos will be formulated within the plan period for adoption by the agencies concerned. This will support the institutionalization of providing the users with consistent migration data.
Policy Uses
Programs and activities identified in this Chapter aim to improve the use of statistics for evidence-
based policy making and program planning on the following aspects:
❖ Population count based on the census is one of
the criteria in the allocation of resources and revenues, and creation/conversion of political
and administrative units.
❖ Disability statistics can be the used as basis for
establishing more government-subsidized institutions that will cater to the promotion of
physical, emotional, and psycho-social well-
being of persons with disability. ❖ Information on migration is a source of statistics
for the provision of programs to assist overseas Filipinos and their families in terms of finance,
❖ SDPs supporting the generation of the RRM indicators
Table 9. SDPs supporting the generation of RRM Indicators on Population and Housing Statistics
Statistical Development Programs
RRM Indicators PSDP Disaggregated Data
New estimates of housing needs in 2017 (HUDCC)
Percentage of housing targets met (in %) National level
Share of socialized housing to housing target improved (in %)
Household access to water supply increased (in % of total number of household)
Barangays with zero open-defecation increase (in % of total number of barangays)
Percentage of households with access to improved safe water supply increased

62
education, health, rights, protection, security, and welfare, among others.
❖ Results of the NDHS can be used to measure the
SDG indicator on good health and wellbeing and as basis for improvement of health facilities and
services.
❖ Data on housing characteristics based on the
census provides statistics which can be used for estimating housing needs, especially households
living in marginal housing units.

63
Chapter 15 – Income, poverty and hunger statistics Introduction
Income, poverty and hunger are interrelated
characteristics that can help describe the state of human development in the country. Poverty stems
mainly from people’s lack of resources, income, or
means to be able to survive or live a decent life. While in reality, these concepts are much more
complex. Their interrelationship points to a simple realization that in order to address poverty and
hunger, there should be at least reasonable income
to satisfy human’s minimum basic needs. Poverty, in particular, has many dimensions and manifests in
various forms which cannot always be addressed by having income alone. It is this recognition of the
many facets of poverty that guides government and society to continuously seek and implement
solutions to reduce, if not totally, eliminate poverty.
Poverty reduction has been one of the overarching goals of the Philippine government throughout
administrations. Despite this perennial thrust to
address poverty however, the country still lags in halving absolute poverty based on the Millennium
Development Goals (MDGs). The slow rate of poverty reduction should therefore bring greater
attention to protecting the poor and the vulnerable against social, economic, and environmental risks.
In order for government and stakeholders of
poverty alleviation to better monitor outcomes of anti-poverty programs, including progress towards
the MDGs, a comprehensive poverty monitoring and
indicator system is needed to ensure the production and analysis of timely and quality statistics on
income, poverty, hunger, and other human development statistics.
This chapter outlines key strategies that are aimed
to ensure the availability of quality income, poverty and hunger statistics in support of society’s efforts
to reduce poverty and achieve human development.
Situational Analysis
❖ Key developments in 2011 – 2015
The following are the achievements of the Philippine Statistical System (PSS) in the
Income, Poverty, and Hunger Sector during the
Period 2011-2015:
Refinement of official poverty statistics. To
address issues raised on official poverty statistics, the Technical Committee on Poverty Statistics (TC PovStat) conducted an overall review of the estimation methodology from 2008 to 2011. The review led to the adoption of improvements through National Statistical Coordination Board (NSCB) Resolution No. 9, Series of 2011 - Refinements in the Official Poverty Estimation Methodology. The 2009 poverty estimates based on the refined methodology were released in February 2011 together with the revised estimates for 1991, 2003, and 2006. The release of the new/revised estimates included corresponding measures of reliability such as coefficients of
variation, confidence intervals and standard errors on pertinent indicators to promote transparency by informing the public about the limitations of the estimates. Further, cluster of provinces were released based on the confidence intervals of the provincial poverty incidence in lieu of ranking.
Regular generation of official poverty statistics. The former NSCB released the 2012 full
year official provincial poverty statistics in December 2013 together with back estimates for

64
2006 and 2009 (to reflect updated definition of urban-rural variables and adoption of 2006-based prices). The early release served as a milestone in terms of the time lag of data dissemination from two (2) years after the reference year, as per System of Designated Statistics (SDS), to less than one (1) year.
Regular generation of official poverty
statistics for the basic sectors. In view of its
continuing goal to be relevant to its stakeholders, the former NSCB generated and released the 2009 and 2012 official poverty statistics for the basic sectors in June 2012 and July 2014, respectively. The poverty estimates were computed for 9 of the 14 disadvantaged sectors of Philippine society: women; youth; children; senior citizens; individuals residing in urban areas; migrant and formal sector workers; farmers; fishermen; and self-employed and unpaid family workers.
Regular generation of poverty statistics at the
city, municipality and congressional district
levels. In 2012, the former NSCB produced the
2006 and 2009 city and municipality poverty estimates. Further, the 2006 and 2009 congressional district poverty estimates were provided to the House of Representatives’ Congressional Planning and Budget Department to aid legislative work related to poverty reduction and social development. In 2014, the Philippine Statistics Authority (PSA) generated and released the 2012 city and municipal poverty estimates. It may be noted that this was the first time that funding for this activity was solely funded by the
national government. Further, significant reduction in the time lag of release of estimates was observed from more than three years from its reference period in the past releases to two years.
Generation of first semester official poverty statistics. In response to urgent demand for more
timely and updated official poverty statistics, the TC PovStat developed and recommended the first semester provincial poverty estimation methodology based on the Family Income and Expenditure Survey (FIES), which was approved by the then NSCB Executive Board on 16 April 2013, through NSCB Resolution No. 4, Series of 2013 Approving the Official Poverty Estimation Methodology for First Semester. In line with the approval, the former NSCB Technical Staff released for the first time the 2012 official provincial poverty statistics based on the first semester of the FIES on 23 April 2015.
Further, with the National Economic and Development Authority’s (NEDA’s) recommendation, the former NSO adopted the income module in the FIES to the Annual Poverty Indicator Survey (APIS) starting 2013. This made possible the generation and release of national level 2013 and 2014 first semester official poverty statistics based on the 2013 and 2014 APIS on 29 April 2014 and 6 March 2015, respectively.
Generation of poverty statistics for the
employed and unemployed population. In
response to the need to measure the country’s performance towards meeting the new MDG target on achieving the full and productive employment and decent work, the former NSCB made special tables on the poverty statistics for the employed population. The poverty incidence for unemployed population was also generated for comparison. The 2009 poverty statistics for employed workers and unemployed population were released, together with the 2009 official poverty statistics for the basic sectors on 7 June 2012. Henceforth, the PSA, afterwards, released the 2012 poverty statistics for the employed and unemployed population on 4 July 2014.
Regular implementation of Community-
Based Monitoring System (CBMS) in various
local government units. The CBMS, which was
developed in the early 1990s under the Micro Impacts of Macroeconomic Adjustment Policies (MIMAP) Project-Philippines, is an organized process of data collection and processing at the local level and integration of data in local planning, program implementation and impact-monitoring. This is implemented by the local government units (LGUs). As of January 2015, the CBMS has been implemented in 23,410 barangays, 867 municipalities and 69 cities in 75 provinces (32 of which are province-wide). It should be noted, however, that the CBMS conducted in these areas have varying reference periods.
Preparation for the Second Round of the National Household Targeting System for
Poverty Reduction (NHTS-PR) or Listahanan.
The Listahanan is an information management
system that identifies who and where the poor are. It makes available to national government agencies and other social protection stakeholders a socio-economic database as basis for identifying beneficiaries of their programs and services. In 2009, the DSWD conducted the first assessment which resulted in the identification of 5.2 million poor households out of the 10.9 million assessed. These households have become beneficiaries of the Philhealth Indigent Program. Some 4.4 million households have also been enrolled in the Pantawid Pamilya program.
From 2011 to 2014, preparatory activities for the conduct of the Second Round of Listahanan, which was held in 2015, were undertaken by the DSWD.
Development of the conceptual and
statistical framework of the Poverty Monitoring and Indicators Systems (PMIS). Towards a common understanding and appreciation of poverty statistics in the country, the Human Development and Poverty Reduction Cabinet Cluster (HDPRCC) on 17 March 2011, established the Technical Working Group on

65
Poverty Monitoring and Indicator Systems (TWG-PMIS). The TWG-PMIS was established to achieve the following objectives: to come up with an inventory of indicator systems on poverty monitoring existing in the government; and to harmonize and standardize existing statistical frameworks/indicator systems on poverty monitoring (whenever possible) but not limited to the official poverty statistics of the former NSCB, National Household Targeting System for Poverty Reduction (NHTS-PR) of the DSWD, and the CBMS implemented by LGUs. Recognizing that an effective PMIS requires a well-defined conceptual and statistical framework for the identification of appropriate measures of poverty, the TWG-PMIS developed the conceptual and statistical frameworks on PMIS, which were endorsed to the HDPRCC on 11 June 2012. The TWG-PMIS further
prepared an initial list of corresponding indicators and metadata on PMIS.
Training of media on data interpretation and
analysis. The former NSCB, through the National
Statistical Information Center (NSIC), conducted regular statistics appreciation seminars to members of the Philippine Press on the generation, interpretation and analysis of various statistical products including official poverty statistics and related indicators.
Training in the analysis and use of income,
poverty, hunger and related statistics in poverty reduction strategies and advocacy
activities among national government
agencies, LGUs and major stakeholders. Statistical capacity building and advocacy presentation on official poverty statistics and related indicators being released by the former NSCB were provided to national and local government agencies and other major stakeholders. The refinements in the official poverty estimation methodology, which was approved in 2011, were presented to at least 21 fora/meetings conducted by the national and local government agencies, academe and other stakeholders in 2011. Trainings on official poverty statistics were also provided to some national government agencies, in collaboration with the former Statistical Research and Training Center (SRTC).
Preparation and dissemination of more user-
friendly information materials. For better
communication of statistics, more visual information materials on income, poverty and related indicators were prepared and disseminated to the public. In 2014, posters of Small Area Estimates (SAE) of Poverty highlighting GIS-based poverty maps on the 2006 and 2009 municipal and city level poverty estimates were disseminated to the public. These posters benefited from the Generation of the 2006 and 2009 Municipal and City Level Poverty Estimates
Project jointly funded by the Government of the Philippines, the World Bank and the Australian Agency for International Development (AusAID).
Dissemination of statistics through social
networking sites. The former NSCB, through the
NSIC, has adopted current / popular technology / modes to expand the reach of statistics, e.g., social networking sites like Facebook and Twitter. Dissemination of official poverty statistics and former NSCB web articles, i.e., Statistically Speaking, Sexy Statistics and Beyond the Numbers, on income, poverty, and hunger, have been widely disseminated through these new technologies.
Redesign of the MS of households. The PSA
pursued a project to develop and to design the
2013 Master Sample (MS) for household-based surveys, which features an improved frame that was developed using digitized maps of census enumeration areas (EAs) and barangays with boundaries verified and landmarks updated during the mapping activities carried out nationwide in 2012 to 2013 and continued in 2014. The new master sample, with provinces and highly urbanized cities (HUCs) as major domains, was approved in November 2014 through PSA Board Resolution No. 11 Series of 2014 Approving the 2013 Master Sample Design for Household-Based Surveys. Adoption of the 2013 MS will hopefully address the need for estimates at lower levels of disaggregation, particularly at the province level.
Re-establishment of the Technical Committee on Poverty Statistics. In view of the
establishment of the PSA in September 2013, which reorganized the PSS, the TC PovStat was also re-established through PSA Memorandum Order No. 6, Series of 2014, to resolve issues, review current techniques/methodologies, and recommend policies and workable schemes towards the improvement of poverty and other related statistics.
Participation in the meetings, conferences
and workshops organized by United Nations Statistics Division (UNSD), United Nations
Economic and Social Commission for Asia and the Pacific (UN ESCAP), United Nations
Statistical Institute for Asia and the Pacific
(UN SIAP), Association of Southeast Asian Nations (ASEAN) Working Groups on MDGs,
Asian Development Bank (ADB). The PSA
participated in various local and international meetings, conference and workshops on Income, Poverty, and Hunger Statistics organized by the UN, ADB, ASEAN and international partners.

66
❖ Issues and Concerns
The key issues and challenges in the generation and dissemination of quality Income, Poverty,
and Hunger Statistics are as follows:
Need to strengthen statistical research and
development to ensure better methodologies and statistics in view of increasing demand
for new, relevant, and better quality statistics through the following measures: ▪ Explore possibility of using SAE technique, e.g.,
to make possible the estimation of poverty statistics among the basic sectors at the provincial level.
▪ Development of methodology for measuring poverty in all dimensions, particularly through the Multidimensional Poverty Index (MPI), which
will serve as complementary indicators to the official poverty estimates that are income-based.
▪ Review of the methodology for the generation of first semester poverty statistics from the APIS vis-à-vis FIES to address the issue raised on whether the poverty estimates from the FIES are comparable with those generated from the APIS.
▪ Adoption of the 2013 master sample in the household surveys of the PSA, particularly in the FIES and APIS, and study its implication in the estimation methodology of income and poverty indicators.
Need to enhance statistical policies, standards, and coordination mechanisms for
the production and dissemination of Income, Poverty, and Hunger Statistics. ▪ There is a need to review and rationalize all
related data on income, poverty, and hunger to reduce if not eliminate the duplication of resources thereby promoting efficiency and effectiveness of data generation.
▪ The methodology for the generation of Human Development Index (HDI) need to be reviewed and approved towards the institutionalization of HDI in the PSA.
Confusion among users about the statistics being produced or used due to proliferation
of poverty monitoring and indicator systems has led to: ▪ Because poverty reduction is an overarching
goal of government, anti-poverty programs and support activities are undertaken by various agencies, each designing or using own parameters and systems for monitoring. This has caused confusion among users as to which indicators and analysis to base their decisions or policies on.
▪ There is an urgent need to integrate most, if not all, poverty monitoring and indicator systems to
standardize references, e.g., indicators, concepts, and methodologies, and to consolidate, and thus, save on resources for the collection, processing and management of data.
Reduction of time lag for the generation and release of income, poverty, and hunger data. There is a continuing clamor for addressing the timeliness of release of official sources of income data coming from the FIES and APIS, which in effect shall reduce the time lag of release of official poverty data.
Statistical Programs for 2016 and 2017
❖ Summary
To deliver more timely, accessible, coherent,
comparable, comprehensive, and relevant statistics on income, poverty, and hunger, the
following are deemed priority statistical activities in 2016 and 2017:
Development of a methodology for
estimating annual income using the 1st and
2nd survey round data that are statistically reliable down to the provincial and HUCs
level. The demand for new, relevant, and better
quality statistics on income, poverty, and hunger remains a greater challenge in the PSS. With the approval of the 2013 MS and its pending implementation in household-based surveys including the FIES, the task is to develop a methodology for estimating annual income using the 1st and 2nd survey round data that are
statistically reliable down to the provincial and HUCs level. The income estimates will serve as input in the estimation of official poverty statistics that are in effect, will be reliable at the provincial and HUCs level.
Enhancement of institutionalization of small area estimates of poverty at the municipal
and city level. The PSA, through the former NSCB
and in collaboration with the World Bank, AusAID and Philippine government, has already produced small area estimates of poverty at the municipal and city level for years 2000, 2003, 2006, 2009 and 2012. However, the estimates are considered project-based and are yet to be institutionalized in the agency. The plan is to conduct a comprehensive review of small area estimation (SAE) methodology on poverty, not limited to the Elbers, Lanjouw and Lanjouw (ELL) Methodology of the World Bank, to determine the best SAE methodology to adopt for institutionalization in the PSA.
Refinement of the methodology for Human
Development Index (HDI) towards institutionalization in the PSA. In collaboration
with the Human Development Network (HDN), the PSA will review and refine the methodology

67
for human development index towards institutionalization in the PSA. By end of 2016, it is foreseen that an official methodology on HDI will be adopted by the PSA.
Rationalization of existing data collection efforts on income, poverty, and hunger. The
establishment of the PSA is envisioned to pave way for the rationalization of existing data collection efforts on income, poverty, and hunger to reduce if not eliminate the duplication of initiatives, thereby promoting efficiency and effectiveness in data generation. The proposal is to review and improve the FIES, APIS, Labor Force Survey (LFS) and Survey on Food Demand for Agricultural Commodities (SFDAC) of the PSA along with the National Nutrition Survey (NNS) of DOST-FNRI towards harmonized indicators on income, poverty and hunger. This undertaking is expected to benefit from the results of the World Bank’s follow-up survey.
Development of methodology for generating
a measure of poverty in all dimensions. For
non-income measures of poverty, the methodology on Multidimensional Poverty Index (MPI) shall be developed. These measures will serve as complementary indicators to the official poverty estimates which are income-based.
Review of the methodology for the generation of first semester poverty statistics
from the APIS vis-à-vis FIES. This activity shall
be undertaken to address the issue raised on whether the poverty estimates from the FIES are comparable with those generated from the APIS.
The list of other statistical activities and programs identified towards improvement of income, poverty, and hunger indicators are provided in the Annex table.
❖ SDPs supporting the generation of the RRM indicators
Table 10. SDPs supporting the generation of RRM Indicators on Income, Poverty and Hunger Statistics
Statistical Development Programs RRM Indicators PSDP Disaggregated
Data Development of a methodology for estimating annual income using the 1st and 2nd survey round data that are statistically reliable down to the provincial and HUCs level. Development of methodology for generating a measure of poverty in all dimensions.
Poverty incidence
Multidimensional Poverty
Policy Uses
The PSDP activities identified in this Chapter, intends to improve the use of the statistics for
evidence–based policy making and program planning, particularly on the following aspects:
❖ For more effective assessment/monitoring of
anti-poverty reduction policies, programs and projects:
at the provincial, city and municipal level;
annually;
addressing the non-monetary dimensions of poverty particularly deprivations on health,
education and standard of living; and
❖ For formulation of policies and programs:
on hunger mitigation;
addressing the welfare/standard of living of
the low- and middle income class;
specifically addressing marginalized sectors of the Philippine society at the local level.
addressing the disparities and gaps in levels
of human development across provinces in terms of education, health and income; and
based on a harmonized monitoring system.
❖ Following are some examples of the actual policy
uses of city and municipal level poverty
estimates:
For targeting beneficiaries of programs/ projects such as the Provincial Government of
Eastern Samar in the identification of project sites of United Nations Children’s Fund
(UNICEF), United Nations Population fund (UNFPA), Early Childhood Care and
Development (ECCD), Plan Philippines,
DA/ADB InFRES Project; DA for determining top priority LGUs in Region VI as recipients of
the Philippine Rural Development Project (PRDP), etc.; and
For policy formulation and planning such as Baguio - La Trinidad – Itogon – Sablan – Tuba
- Tublay (BLISTT) master planning activity.

68
Chapter 16 – Labor and employment statistics
Introduction
In September 2007, the Millennium Development Goals (MDGs) monitoring framework was revised to
include new targets to promote “full and productive
employment and decent work for all” as part of national development strategies towards poverty
reduction.
Decent work is integral to efforts in reducing poverty and is a key mechanism for achieving
equitable, inclusive, and sustainable development. It involves opportunities for work that is productive,
delivers fair income, and provides security in the workplace and social protection for workers and
their families. It also gives people the freedom to
express their concerns, to organize themselves, and to participate in decisions that affect their lives.
The new benchmarks embody a more focused
outlook in the design and implementation of more appropriate and effective policy and program
interventions to ensure a dynamic, highly competent, and globally competitive labor market
in the country.
With a commitment to reducing poverty and the worst forms of human deprivation, the government
launched the 22-Point Platform and Policy Pronouncements on Labor and Employment with
the overarching goal “to invest in the country’s top
resource making us more competitive and employable while promoting industrial peace based
on social justice.”
This chapter provides a strategic plan for the development and improvement of statistical data
and indicators that aid in the creation,
implementation and monitoring of policies and programs to promote and ensure productive
employment and decent work in the country.
Situational Analysis
With the implementation of Republic Act 10625
otherwise known as the Philippine Statistical Act of 2013, collection and compilation of labor and
employment statistics particularly pertaining to
labor market situation done thru regular surveys are now fully-lodged with the Philippine Statistics
Authority (PSA). Related information on labor and employment through administrative data are
continuously generated by the bureaus and attached agencies of the Department of Labor and
Employment (DOLE), Social Security System (SSS),
Government Service Insurance System (GSIS), and Philippine Health Insurance Corporation (PHIC).
❖ Key developments in 2011 – 2015
Improvement of the Labor Force Survey
(LFS). A comprehensive review of LFS indicators
was conducted to better capture contemporary labor market characteristics, trends and emerging issues and to conform with international standards.
The International Labor Organization (ILO) pilot-tested the new international standards, concepts and measurement framework for LFS with the new questionnaires developed by the ILO, and using the 2003 Master Sample (MS) design.
Updating and compilation of decent work
indicators and relevant statistics. An
interactive database webpage covering more than

69
100 indicators on labor and employment was created based on ILO Decent Work Framework. This database on Decent Work Statistics – Philippines (DeWS-Philippines) was updated using 2014 data.
Inclusion of agricultural sector in the DOLE-
BLES establishment-based surveys such as the Occupational Wages Survey (OWS),
Integrated Survey on Labor and Employment (ISLE) and Labor Turnover Survey (LTS).
Approval and adoption of the official methodology for generating labor
productivity statistics per Board Resolution
No. 2, s. 2014.
❖ Issues and Concerns
Lack of disaggregated statistics at the provincial and city level from the LFS for
provincial and city planning.
No official concept, definition and
measurement on informal employment.
Need to update methodology for the
measurement of family living wage and
generation of estimates.
Overlapping field operations of establishment
surveys of the former National Statistics Office (NSO) and the Bureau of Labor and
Employment Statistics (BLES) resulting in respondents’ burden and duplication of data
on employment.
Lack of data in support of monitoring
Sustainable Development Goal (SDG) Goal 8
(Target 8.3, Indicator 1). ▪ Non-availability of statistics on job vacancies
and separations at the national level and Outside National Capital Region (ONCR).
▪ Absence of earnings data from the LFS.
Weak institutional coordination mechanism
for the generation of administrative-based
statistics on overseas workers.
Updating of LFS to conform with the new
international standards, concepts and measurement framework.
Statistical Programs for 2016 and 2017
❖ Summary
The following are the statistical programs and activities to be undertaken to address the issues
and concerns on labor and employment statistics cited above. These programs and activities
involved the generation of new indicators and
lower level of disaggregation: conduct of methodological studies and researches; and
rationalization of data collection for establishment surveys, among others.
Implementation of the 2013 Master Sample (MS) of Households. Pilot-testing in NCR using
the 2013 MS is on-going and will be implemented in the April round of the LFS for 2016.
Methodological research on the concept and measurement of informal employment. The
DOLE thru the Bureau of Workers with Special Concerns is expected to initiate this activity in the development and conceptualization including its methodology for measurement.
Review of methodology on the measurement of family living wage. An acceptable
methodology is expected to be completed by 2016.
Harmonization of establishment surveys. This
undertaking involves harmonization of labor
concepts and sampling frames used in establishment surveys by the PSA.
Annual updating of Database of Workers in
the Informal Sector.
Generation of SDG-related employment
indicators (job vacancies and separations, and earnings). Preparatory activities for the
expansion of samples for the Labor Turnover Survey (LTS) to cover both NCR and ONCR will be completed by 2016 and pilot-tested in 2017.
Review of coordination mechanism on the
generation of administrative-based statistics on overseas Filipinos.
Conduct of ILO pilot studies on the new international standards on the measurement
of work, employment, unemployment and
labor underutilization.

70
❖ SDPs supporting the generation of the RRM indicators
Table 11. SDPs supporting the generation of RRM Indicators on Labor and Employment Statistics
Statistical Development Programs RRM Indicators PSDP Disaggregated
Data Generation of provincial-level labor and employment statistics based on the LFS (including use of tablets) (PSA) Conduct of pilot studies on the new international standards on the measurement of work, employment, unemployment and labor underutilization (PSA)
Unemployment rate
National, Regional, Provincial levels,
by Industry, by Occupation Group, by Sex
Employment generated (in '000)
Underemployment rate (% of employed)
Generation of provincial-level labor and employment statistics based on the LFS (including use of tablets) (PSA)
Employment generated from the I&S
sectors increased annually
National, Regional, Provincial
levels; by Industry
Generation of provincial-level labor and employment statistics based on the LFS (including use of tablets); Compilation of the National Accounts (PSA)
Labor productivity in I&S sectors
increased National level
Policy Uses
Table 12. Policy uses of labor and employment statistical development programs.
Statistical Development Programs Policy Use
Implementation of the 2013 MS of Households Monitoring the provincial employment situation; Inputs to provincial planning, policy and programs to address local level problems on unemployment and underemployment
Methodological research on the concept and measurement of informal employment
Measurement of informal employment as basis for the conduct of the Informal Sector Survey
Review of methodology on the measurement of family living wage
Inputs to policy and program formulation by DOLE NWPC; Monitoring trends in family living wage
Harmonization of establishment surveys of the PSA Generation of timely and relevant labor and employment statistics from establishments
Generation of SDG-related employment indicators (job vacancies and separations, and earnings)
Monitoring achievements on Sustainable Development Goal 8 (Target 8.3, Indicator 1)
Review of coordination mechanism on the generation of administrative-based statistics on overseas Filipinos
Inputs to planning, policy and program formulation for overseas Filipinos
Conduct of ILO pilot studies on the new international standards on the measurement of work, employment, unemployment and labor underutilization
Basis for the formulation of the most appropriate measurement approaches to reflect the new standard in countries in different parts of the world

71
Chapter 17 – Education and culture statistics Introduction
Education and culture weave a common thread
towards learning and human development.
Education along with training, constitutes the broader concept of learning to provide important
means to make informed choices and decisions.
Productive education and training are necessary to build competently skilled and higher-level
professional workforce to support industry needs, basic services delivery, and good governance.
Culture, on the other hand, represents a timeline of
integrated human behavior patterns and societal beliefs and traits of the nation that are transmitted
through generations. Appreciating a country’s culture and one of its notable manifestations, the
arts, is key to understanding the very foundation of
the nation and where it is headed through generations.
An integrated and comprehensive set of statistics
will provide good metrics of the implementation of educational reforms such as the K to 12 program,
and help track the development of culture and sports in the country.
This chapter presents statistical development
programs that address issues and demands for education and cultural statistics.
Situational Analysis
❖ Key developments in 2011 – 2015
Enhancement in the generation of education
statistics. From 2011 to 2015, the education
agencies, namely: the Department of Education
(DepEd); Technical Education and Skills Development Authority (TESDA); Commission on Higher Education (CHED); Department of Science and Technology – Science Education Institute (DOST-SEI); Professional Regulation Commission (PRC); and the National Center for Culture and the Arts (NCCA) implemented various programs and activities to generate and provide education statistics/indicators, sourced from administrative reporting forms and surveys. ▪ Conduct of the 2013 Functional Literacy,
Education and Mass Media Survey (FLEMMS). The survey was conducted by the former National Statistics Office (NSO) to generate data on the functional literacy, educational and skills qualifications of the population, magnitude and socio-economic profile of the out-of-school youth and exposure of the population to mass media.
▪ Updating of the Impact Evaluation Study (IES) of Technical Vocational Education and Training (TVET) Programs. The IES of TVET Programs is conducted regularly by the TESDA, at least on a biennial basis to capture information on the graduates and their absorption and employability in the labor market. In 2011, the study covered 2009 TVET graduates in all delivery modes. The findings on the graduates of the Training for Work Scholarship Program (TWSP) is one of the main features of the study/report.
▪ Conduct of a Tracer Study on the DOST-SEI scholar-graduates. In 2013, the SEI conducted a tracer study on the DOST-SEI scholar-graduates under various scholarship programs being implemented by the DOST-SEI, with the ultimate objective of determining the impact of these programs to individual and/or national

72
development. Likewise, it seeks to assess the effectiveness of the scholarship programs being implemented by the DOST-SEI.
Improvement of information systems and
development of new ones. ▪ Introduction of the Learner Information System
(LIS). In 2011, the DepEd initiated the LIS, an online facility that provides for the registration of learners enrolled in public schools. Since its installation, the LIS has allowed the Department to generate the total public school enrolment based on the actual registration of learners. After four years, the DepEd eventually directed all private schools and SUCs offering elementary and secondary education, and all programs under the Alternative Learning System (ALS),
including Abot-Alam, to register all their learners’ profile in the LIS.
▪ Implementation of the Enhanced Basic Education Information System (EBEIS). The EBEIS is a web-based system that maintains a database of public and private schools’ education statistics. Pursuant to DepEd Order No. 39, s. 2011, the system was developed due to the urgent need to improve the collection of data from schools and streamline data management process to deliver timely, relevant and accurate information to effectively support planning, budgeting, formulation of policies and other decision-making activities at various levels of the education system i.e. school, division, regional and national levels.
▪ Implementation of the CHED Electronic Collection and Knowledge System (CHECKS). The CHECKS is an online system implemented in 2014 that ensures consistency and reliability of data from the CHED central and regional offices, and HEIs all over the country. It is part of the CHED’s thrust for improving efficiency and effectiveness by simplifying the collection process for all stakeholders. The system improves the availability of data for making informed decisions and efficient generation of reports and other data requirements.
▪ Conduct of the National Inventory of DepEd Public School Buildings. In 2014, the DepEd conducted the National School Building Inventory with the goal to establish accurate and comprehensive baseline data on school buildings of all public elementary and secondary schools.
Development of a web portal for education and cultural statistics. Preparatory activities
have been initiated towards the development of an education and cultural statistics portal, as follows: ▪ Development of Higher Education Knowledge
Portal which interconnects the websites of higher education stakeholders as part of the Medium-term Information and Communications
Technology (ICT) Harmonization Initiative for Higher Education (MITHI-HE) by the CHED;
▪ Establishment of backbone infrastructure by the TESDA;
▪ Development of science and technology (S&T) Databases and Information Systems by the SEI; and
▪ Enhancement of the NCCA Cultural Databank as the central repository of information and data on Philippine Culture and Arts.
Development of Information, Education and
Communication (IEC) strategies for more effective dissemination, communication and
advocacy of education and cultural statistics. Dissemination of education statistics generated by education agencies, to wit: ▪ Release of TVET statistics covering the periods
2005-2011 and 2008-2013;
▪ Accessibility of EBEIS statistics on the DepEd website and S&T statistics on the SEI website; and
▪ Learning and Competitive Labor Market statistics posted on the PSA website.
Conduct of dissemination, consultation and advocacy activities on education and
education-related outputs and activities among major stockholders, civil society
groups, academe and local government units
(LGUs). ▪ Conduct of training, seminars and workshops for
school heads and managers by DepEd.
- Training for education managers in all levels on how to appreciate, interpret, use, and disseminate information gathered from raw data;
- Appreciation seminars for school heads in elementary and secondary education levels; and
- Data Management and Information Technology Workshop for all regions, divisions and school heads.
▪ Conduct of other advocacy activities.
- Career Guidance Advocacy Program and mobile services to schools and local communities by the PRC;
- Consultation workshops for the localization of the United Nations Educational, Scientific and Cultural Organization (UNESCO) cultural statistics by the NCCA; and
- Report Card of First TESD Congress, Second TESD Congress and the set of recommendations to develop the 21st Century Skilled Workforce by TESDA.

73
Participation in international and technical
cooperation such as conferences and expert group meetings related to education and
cultural statistics.
Development of the statistical framework on
cultural statistics.
Continuing development and/or updating of
statistical standards, policies and guidelines for education and cultural statistics.
Comprehensive review and improvement of designated statistical activities relative to
education.
❖ Issues and Concerns
The key issues of the education sector in the generation and dissemination of statistics are
the following:
Need for a concerted action plan at the
national and local levels on data generation, consolidation, reporting and dissemination as
well as monitoring and evaluation mechanism to address manifold issues and concerns of
the sector.
Lack of standard policy on dissemination,
advocacy, generation, consolidation,
reporting, monitoring and evaluation of education statistics.
Need to establish mechanisms to assess and review data quality and methodologies.
Need for statistical information on culture, arts and sports.
Need to bridge data gaps to address
emerging concerns on education statistics.
Need to provide a unified data structure to be
used by agencies as well as a common portal where education statistics will be funneled for
connectivity.
Need to develop technical knowledge/
skills/competencies on statistical research and capacity building for personnel
concerned in government agencies.
Need to deliver more timely, accessible,
coherent, comparable, comprehensive and relevant education statistics;
Need for increased government investment in education statistics thru establishment of
statistical units to ensure that critical activities such as generation of education and
cultural statistics are undertaken.
Enhancement of statistical capacities of data
producers and providers.
Statistical Programs for 2016 and 2017
❖ Summary
The development of information education and communication (IEC) strategies, conduct of fora
to facilitate dissemination, communication and advocacy of education and cultural statistics for
all education-related activities and setting up of
a web portal for education and cultural statistics will be undertaken during the period.
The key programs for 2016-2017 are as follows:
(1) designation of statistics on TVET such as enrolment on and graduates of school-based
and non-school-based TVET; (2) the implementation of the framework on cultural
statistics and identification of its key indicators;
(3) development of framework and core indicators on sports statistics.
Other identified statistical programs were the following:
Preparation and monitoring of the policy on updating and dissemination of education
statistics;
Development and improvement of a web
portal for education statistics and NCCA cultural statistics;
Regular conduct of capacity building activities for staff of education and education-related
agencies; and
Enhancement of the Learner Information
System (LIS).

74
Policy Uses
❖ The education sector is continuously assessed and monitored for updating policies as well as
serve as input to national planning in the
preservation and conservation of culture and the arts.
❖ In strengthening statistical research and
capacity development, the technical knowledge/skills/competencies on statistics of
government staff is measured towards enhancing statistical capacities of education-
related agencies.
❖ The efficiency of the use of administrative-based
data systems in the generation of official statistics is increased, for example through the
LIS to facilitate tracking of student movements thru the Learner Reference Number (LRN) and
consequently, address the low compliance in data reporting in the LIS.
❖ To produce better quality education and cultural
statistics, the establishment of statistical units
and positions in government education agencies, and the provision of competitive salaries, should
be institutionalized.
❖ SDPs supporting the generation of the RRM indicators
Table 13. SDPs supporting the generation of RRM Indicators on Education and Culture Statistics
Statistical Development
Programs RRM Indicators PSDP Disaggregated Data
Continuing efforts towards further development of the EBEIS - DepEd
Adjusted net enrolment rate increased (in %):
- Elementary - Secondary
National, Regional levels; private/public schools
Improvement and maintenance of BEIS - DepEd
Classroom-to-pupil ratio improved - Primary - Secondary
National, Regional levels; private/public schools

75
Chapter 18 – Health and nutrition statistics Introduction
Kalusugan Pangkalahatan or universal health
coverage aims to contribute to total human
development, increase productivity and ultimately bring about social and economic development.
The improvement of the health status of the people hinges on the combined effects of better nutrition,
expanded basic health services, improved
sanitation, and more efficient allocation of health resources among different health and nutrition
programs.
The PDP 2011-2016 aims to achieve universal health care as the health sector’s vision in the
medium-term. In order to attain this vision, the PDP shall ensure the achievement of better health
outcomes, equitable health financing, and
responsive health systems that provide all Filipinos, especially the poor with equitable access to quality
health care.
Meanwhile, the primary objective of the nutrition
sector is to reduce disparities in nutrition by
focusing on population groups and areas highly affected by or at risk of malnutrition, specifically,
pregnant women, infants, children 1-2 years old, underweight children 0-5 years old, and local
government units (LGUs) with high levels of child
under-nutrition or at risk of under-nutrition.
Determining appropriate measures to address
health and nutrition issues and effective monitoring
of these interventions require timely and reliable statistical information. This chapter outlines key
statistical programs meant to improve the quality of existing health and nutrition statistics as well as to
develop new and more relevant critical statistics
and indicators.
Situational Analysis
❖ Key developments in 2011 – 2015
Conduct of critical periodic surveys. ▪ 2011 Updating of Nutritional Status of Filipino
Children and Other Population Groups. The Food and Nutrition Research Institute (FNRI) of the Department of Science and Technology (DOST) has undertaken the fifth of a series of Updating Surveys entitled “2011 Updating of the Nutritional Status of Filipino Children and Other Population Groups” from June to December 2011. The 2011 Updating Survey included a module on Maternal Nutrition along with the original modules on Anthropometry, Infant and Young Child Feeding Practices, Government Program Participation of Households and Children, Food Insecurity and Socio-Economics. The survey used the 2003 Master Sample (MS), a multi-stage stratified sampling design in the household selection. A total of 3,136 enumeration or survey areas, 38,894 households and 198,022 individuals from the 17 regions and 79 provinces in the country including National Capital Region (NCR) was covered.
To facilitate the release of the survey results to its various stakeholders at the national and sub-national levels, a web-based Data Entry System was developed and used where data encoding was done after field data collection and editing of accomplished survey questionnaires. The encoded data were immediately transmitted electronically from the field to the central office

76
where it was validated against the questionnaires and checked for consistency. Survey results are now readily available in PDF format from the FNRI website.
▪ Conduct of the 8th National Nutrition Survey (NNS). The 8th NNS was conducted from June 2013 to April 2014 by the FNRI-DOST, covering all 17 regions, 79 provinces, 45,047 households and 172,323 individuals of the country. The objectives of the survey are: a) to determine and evaluate the food intakes, nutrition and health status of Filipinos, and b) to provide official statistics on food, nutrition and health situations of the country. The 2013 NNS has the following components: - Anthropometry; - Biochemical; - Clinical; - Dietary intake of households and individuals; - Demographic and socio-economic profiles of
participants; - Food security; - Government program participation; - Selected health risk factors pertinent to nutrition; - Infant and young child feeding (IYCF); - Maternal and child health (MCH); and - The salt survey.
The 8th NNS likewise adopted the 2003 master sample which utilized the 2009 LFS list of households. The response rate for the different components was at least 90.1 percent for the questionnaires and 85.2 percent for the physical measurement components. The NNS survey results are now readily available in PDF format from the FNRI website.
▪ Conduct of the 2011 Family Health Survey (FHS). The FHS is a nationwide survey administered by the then National Statistics Office (NSO) to provide information on fertility, maternal and child health, family planning, maternal and child mortality, and other health-related concerns in order to assist policymakers and program managers in evaluating and designing strategies for improving health and family planning services in the country. The 2011 FHS updated findings from the series of Family Planning Surveys conducted from 1995 to 2006, and various rounds of the National Demographic and Health Survey (NDHS).
The survey involved interviewing all women who are 15 to 49 years of age in the sample households. These women were asked about their background characteristics, the children they have given birth to, their family planning methods use, antenatal and postnatal care received during pregnancy, vaccinations received by their children, and other valuable health-related information.
▪ Conduct of the 2013 NDHS. The 2013 NDHS was conducted by the then NSO from August to October 2013 to help program managers and policy makers in the early evaluation of existing
programs as well as assist in designing new strategies towards the improvement of population and health programs in the Philippines.
Improvement of administrative reporting systems. ▪ Improvement of the Field Health Services
Information System (FHSIS). A strategy for improving the data quality of FHSIS, specifically on maternal and child health and family planning, was developed through Executive Order No. 25, Series of 2014, “Establishing Data Quality Check as a System for Generating Valid and Reliable Health Data for Evidence-based Planning and Decision-making.” This self-assessment tool provides a systematic “check”
to ensure that the FHSIS indicator definition, formula for computation, as well as recording and reporting processes as contained in the DOH FHSIS Manual of Operations have been correctly applied.
Currently, the FHSIS indicator coverage of Data Quality Check (DQC) are the family planning (FP) and MCH indicators: FP current users, four (4) antenatal care coverage visits (ANC4), skilled birth attendant (SBA), facility-based delivery (FBD), fully immunized children (FIC), exclusive breast feeding (EBF) and Vitamin A supplementation. DQC provides a systematic approach for identifying and addressing these sources of inaccuracies in key FP and MCH indicators in FHSIS, and in the process of
identifying areas for improving service delivery. It should be noted that the lag time of the FHSIS improved from five years to three years.
▪ Compilation of the Philippine Health Statistics (PHS). Availability of the PHS on the Department of Health (DOH) website has improved from five to three years from the reference period. The PHS is intended to serve as one of the bases of health administrators at various levels for planning, implementation and assessment of health programs and services. These data can also be utilized to assess costs of health care and to identify needed prevention targets for health programs to serve as vital tools for planning and for monitoring and evaluation of health programs. Likewise, statistical data in this publication are beneficial to the researchers,
academicians and local government executives.
▪ National Health Insurance Program (NHIP) statistics. The updated semestral statistics and charts on NHIP are posted on the PhilHealth website. The NHIP provides health insurance coverage and ensure affordable, acceptable, available and accessible health care services for all citizens of the Philippines, in accordance with the PhilHealth policies and provisions.

77
Compilation and improvement of the
Philippine National Health Accounts (PNHA). On recommendation of the Interagency Committee on Health and Nutrition Statistics (IACHNS), the then National Statistical Coordination Board (NSCB) Executive Board through Resolution No. 8, s. 2011 approved the estimation methodology for the annual compilation of the PNHA. The revised PNHA included the following improvements: identification of additional source agencies and health-related activities in government, use of new approaches to estimate health expenditures of local government, private out-of-pocket, private insurance companies and health maintenance organizations and classification of foreign grants under the Rest of the World.
In October 2013, the then NSCB released the PNHA estimates covering the years 2005 to 2011. The 2012 PNHA estimates was released in August of the succeeding year by the PSA.
Generation and improvement of local-level
health, nutrition, and other related statistics. ▪ Compilation of local health accounts. The DOH
published the manual for the estimation of the Local Health Accounts (LHA). Out of 118, there were 50 provinces/cities which produced the 2006 LHA.
Development and improvement of an
integrated health and nutrition statistics web portal under the PHIN. The DOH has created
networks for increased collaboration on health information systems and eHealth applications. These are the Philippine Health Information Network (PHIN), Philippine Network for Injury Data Management System, and ICT4H. The networks consist of representatives from the different government agencies, private firms or organizations, local government units, non-government organizations, academe, research institutions, international organizations, and others with varying roles and responsibilities as far as the health agenda is concerned. The networks have one common goal, i.e. to create a more reliable, timely, high quality and affordable health care and useful health information systems, promote continuous medical training, education, research, and others through the use of
information and communications technology (ICT) with respect and compliance to security and protection of citizen’s right to privacy. The networks vary from the degree of engagement like PHIN for health data collection, sharing and exchange, systems harmonization and other collective actions to improve health information systems (DOH DPO No. 2006-0452 - Creation of Management Structure for the PHIN), and ICT4H for the development of the health sector enterprise architecture, HIS/HIT standards and compliance
and capacity building (DOH DPO No. 2010-5245 Technical Working Group on ICT for Health).
Development of information, education and communication (IEC) strategies and tools
for more effective dissemination, communication, and advocacy of health and
nutrition statistic. ▪ Publication of health-related documents.
Another milestone of the 2011 Updating of Nutritional Status of Filipino Children and Other Population Group Survey was the publication of the 2011 Philippine Nutrition Facts and Figures within a year after the survey, where full survey details as well as all results were documented. One of the strengths of the 2011 Nutrition Facts
and Figures was the generation of the provincial disaggregated data of major nutrition variables.
An offspring of the above-cited document is the publication of the Philippine Regional Nutrition Facts and Figures where a holistic snapshot of the region and its provinces in terms of nutrition, food and health situation were presented using the combined results of the 2011 Updating Survey and the 7th or the 2008 NNS. The survey results will be very useful to local level planning.
▪ Development of Community Health Information Tracking System (CHITS). To facilitate consolidation of voluminous health information at the local health centers/units, the DOH implemented the CHITS in selected provinces and cities with support from the WHO. The CHITS is an electronic medical record system developed by the National Telehealth Center (NTHC), which utilizes an open-source software, that aims to increase the efficiency of local health centers and aids in the decision-making by improving their health information systems. With CHITS, patient care has improved and patient visits are more efficient, having reduced the four to five minutes’ requirement in searching paper records, to just seconds.
Through the efforts of the United Nations Children’s Fund (UNICEF) and the University of the Philippines (UP) Manila - NTHC, another initiative called rCHITS was tested in three project sites from November 2011 to May 2012, which was later implemented in ten more areas
of the country. rCHITS stands for real-time monitoring of maternal and child health indicators through the CHITS. It aims to provide real time monitoring of key maternal and child health and governance indicators through the use of ICTs.
Meanwhile, rCHITS-2 was implemented in seven municipalities and three cities of the country, also with support coming from the UNICEF. The rCHITS-2 is the expansion of the field implementation of the project rCHITS, this time

78
in Geographically Isolated and Disadvantaged Areas (GIDAs) to facilitate informed decision-making process. To date, a total of 275 public health workers have been trained to use rCHITS-2.
The basis for this expansion is the development of prototype tools, such as the: (1) CHITS, an electronic medical record system for government health centers; (2) Reports or mobile ICT reports of vital health and social welfare indicators; and (3) an LGU dashboard that allows Local Chief Executives to see the health status of their respective communities, which aids in a more evidence-based decision-making process.
▪ Compilation and updating of indicators on health and nutrition to monitor the MDGs. From 2011 to 2014, as the repository of the MDGs, the PSA regularly compiled, monitored and updated the 18 health and nutrition indicators classified under MDG Goal 4: Reduce Child Mortality, Goal 5: Improve Maternal Health and Goal 6: Combat HIV/AIDS, Malaria and other Diseases. Some of the indicators are: infant mortality rate, maternal mortality, death rate associated with malaria, tuberculosis, etc.
▪ Regular conduct of statistical training and other capacity building programs.
▪ Training on the System of Health Accounts
(SHA) 2011. In June 2014, the PNHA Team of
the PSA participated in the Training on the SHA 2011 which focused on the concepts of SHA and use of Health Accounts Production Tool (HAPT), the current international standard for health accounting. This is in line with the proposed move to adopt the SHA 2011, as the framework of the PNHA in the coming years.
▪ Integrated Food Security Phase Classification (IPC) Acute Analysis Workshop. In 2012, the IPC Acute Analysis Workshop was conducted by the Food and Agriculture Organization (FAO) and the National Nutrition Council (NNC). The IPC is a set of standardized tools that aims to provide a "common currency" for classifying the severity and magnitude of food insecurity. This evidence-based approach uses international standards which allows comparability of situations across countries and over time. It is based on consensus-building processes to provide decision makers with a rigorous analysis of food insecurity along with objectives for response in both emergency and development contexts.
Participation in and hosting of national/
international conferences, training,
workshops, and expert group meetings on health and nutrition statistics. In April 2012,
three (3) months after the culmination of the 2011 Updating of the Nutritional Status of Filipino
Children and Other Population Groups, the first Nutrition Summit showcasing the nutritional status of children 0-10 years old, infant and young child feeding practices and participation of children to nutrition and related programs in the country was held. It was then followed by a series of regional dissemination fora.
Meanwhile, the former NSCB, in collaboration with the World Health Organization (WHO), conducted a dissemination forum on June 2013 which tackled the 2005-2011 revised PNHA estimates.
From 2011 to 2014, the then NSCB has been participating in the conduct of the Technical Workshop on the System of Health Accounts and the Joint Organization for Economic Cooperation and Development (OECD) Korea Policy Centre-APNHAN Meeting of Regional Health Accounts Experts held annually in Korea.
Continuing development of statistical
standards. The former NSCB Executive Board
approved the following resolutions towards the continuing development of statistical standards in the country, to wit: ▪ NSCB Resolution No. 007, Series of 2012,
Approval of Batch 4 - concepts and definitions for statistical purposes for the health and nutrition sector dated 11 December 2012; and
▪ NSCB Resolution No. 6, Series of 2012, Approval of the World Health Organization’s Child Growth Standards as a Tool for Generating Statistics on the Nutritional Status of Children 0-5 years old dated 1 June 2012.
❖ Issues and Concerns
While there have been continuing initiatives to
improve health and nutrition statistics, there are still key technical issues that need to be resolved
and important challenges to be addressed, to wit:
Need for concerted action plan at the national and local level on data generation,
consolidation, reporting and dissemination as well as monitoring and evaluation mechanism
to address the manifold issues and concerns of the sector.
Need to reinforce the framework, revitalize its
contents, standardize concepts and definitions, and strengthen the national plan
to ensure greater success in achieving the eHealth vision.
Much-increased demand for more timely, accessible, coherent, comparable,
comprehensive, relevant, reliable, more
disaggregated and better quality health statistics which are needed in the

79
implementation of health and nutrition programs.
Need to bridge data gaps to address emerging concerns on health and nutrition
statistics.
Data gaps and/or delays on key health and
nutrition concerns targeted in the PSDP 2005-2010 such as mortality indicators.
Need to adopt more advanced methodologies to ensure the availability of quality statistics.
Need to improve or strengthen the
coordination within DOH to integrate the various programs, projects, standards,
systems, and policies in the Department.
Inaccessibility of information on health
services, especially those in rural areas.
Need to develop technical knowledge/
skills/competencies on statistics/statistical research and capacity building for personnel
concerned in health and nutrition agencies.
Need to enhance statistical capacities of data
producers and providers.
Statistical Programs for 2016 and 2017
❖ Summary To address the issues and challenges in the
generation, dissemination and use of health and
nutrition statistics, key statistical programs such as the adoption of the SHA 2011 as the
framework for the PNHA; estimation of the maternal mortality rate through the use of civil
registration records and results of the 2015 Updating of the Nutritional Status of Filipino
Children and Other Population Groups; and the
conduct of the National Disability Prevalence Survey of PSA are set to be carried out in 2016.
Other statistical programs include the
improvement of relevant indicators from the Food Insecurity and Vulnerability Information
and Mapping System (FIVIMS) which will be conducted by the NNC, the continuation of the
2015 Global Adult Tobacco Survey (GATS) by the PSA in collaboration with the DOH. Moreover,
the PSA surveys on Multiple Indicator Cluster
Survey (MICS) and FHS will be conducted in 2016 until 2017 to address the demand for
timely, accessible, coherent, comparable, comprehensive and relevant statistics.
To address data gaps, a review and assessment
of the relevance and the feasibility of generating new and emerging sets of indicators will also be
implemented.
On the other hand, the DOH will lead the improvement of the Unified Health Management
Information System (UHMIS) and the development of the Philippine Health
Information Exchange (PHIE).
Formulation of concepts and definitions for statistical purposes for the health and nutrition
sector and updating of the Philippine eHealth
Strategic Framework and Plan will also be undertaken to provide guidance and direction for
statistical development.
To further strengthen statistical research and
capacity development in health and nutrition
sector, the PSA will conduct a methodological study on the estimation of Millennium
Development Goal (MDG) indicators on HIV prevalence among population group 15-24 years
and will partake in health and nutrition-related
international and technical cooperation conferences and expert group meetings.
❖ SDPs supporting the generation of the RRM indicators
Table 14. SDPs supporting the generation of RRM Indicators on Health and Nutrition Statistics
Statistical Development Programs
RRM Indicators PSDP Disaggregated
Data
Preparatory activities for the conduct of the NDHS (PSA/USAID)
Maternal mortality ratio per 100,000 live births decreased
Infant mortality rate per 1,000 live births decreased (in %)
Under-five mortality rate per 1,000 live births decreased (in %)
National, Regional levels
National, Regional levels
National, Regional levels
Updating of Nutritional Status of Filipino Children and Other Population (FNRI)
Prevalence of underweight children under five per 1,000 live births decreased
National, Regional levels

80
Policy Uses Table 15. Policy uses of health and nutrition statistical development programs.
Statistical Development Programs Policy Use
To provide guidance and direction for statistical development
Preparation of the Chapter on Health and Nutrition Statistics under the PSDP Update, 2011-2017
Assessment and monitoring of the performance of health and nutrition sector in the country
Formulation of official concepts and definition for statistical purposes for the health and nutrition sector
Contribute to the improvement in the generation and dissemination of quality health and nutrition statistics in aid of policy formulation, program planning and decision making.
Updating of the Philippine eHealth Strategic Framework and Plan
Serves as guide to national coordination and collaboration on how the eHealth vision will be achieved, and sets clear direction and guidance to the ongoing and future eHealth activities in the country.
To improve relevance and timeliness of data production and dissemination in the PSS
Improvement of relevant indicators from the Food Insecurity and Vulnerability Information and Mapping System (FIVIMS)
Serve as input in the formulation of more appropriate policies and programs to counter food insecurity and vulnerability in the country
Conduct of the 2015 Global Adult Tobacco Survey (GATS) Assist in the formulation, tracking and implementation of effective tobacco control interventions in the country
Conduct of the 2015 Updating of Nutritional Status of Filipino Children and Other Population
Aid in the appropriate formulation and modification of food and nutrition policies and intervention at the national and provincial levels
Conduct of the 2016 National Disability Prevalence Survey Serve as basis in the formulation of plans and programs which will address the needs of the disabled persons in the country
Conduct of the 2016 Multiple Indicator Cluster Survey Basis for policy decisions and programme interventions, and for the purpose of influencing public opinion on the situation of children and women around the world
Conduct of the 2017 Family Health Survey Assist policymakers and program managers in evaluating and designing strategies for improving health and family planning services in the country
To respond to emerging statistical information needs such as the SDGs, data revolution, etc.
Improvement of the Philippine National Health Accounts (PNHA) through the adoption of the System of Health Accounts (SHA) 2011
Aid policy makers and health managers in formulating better health policies and programs.
Enhancement of the FHSIS and Unified Health Management System (DOH)
Contraceptive prevalence rate (all methods) increased (in %)
Proportion of births attended by health professional increased (in %)
Proportion of births delivered in facility increased (in %)
Malaria mortality rate per 100,000 population decreased (in %)
Malaria morbidity rate per 100,000 population decreased (in %)
TB case detection rate (all forms) increased (in %)
National, Regional levels
National, Regional levels
National, Regional levels
National, Regional levels National, Regional levels
National, Regional levels
Improving quality of current data in HIV prevalence among the population aged 15-24 years (PSA)
HIV prevalence decreased National, Regional levels
Enhancement of the FHSIS and Unified Health Management System (DOH)
Proportion of population with access to safe water increased (HH in %)
National, Regional levels
Enhancement of the FHSIS and Unified Health Management System (DOH)
Proportion of population with access to sanitary toilet increased (HH in %)
National, Regional levels
Adoption of the SHA 2011, the current international standard for health accounting, as the framework for the PNHA (PSA) Conduct of administrative report of PhilHealth (PHIC)
Proportion of population with access to sanitary toilet increased (HH in %)
National level
Updating of Nutritional Status of Filipino Children and Other Population; Preparatory activities for the conduct of NNS (FNRI)
Proportion of households with per capita intake below 100% dietary energy requirement decreased
(in %) National, Regional levels

81
Review and assessment of the relevance and the feasibility of generating new and emerging sets of indicators
Serve as inputs and data support to more appropriate and effective policies, plans and programs for global goals and targets such as the post-2015 development agenda or the SDGs, specifically in the health and nutrition sector
To promote optimal utilization of information technology in statistical business processes
Improvement in the Unified Health Management Information System (UHMIS)
The outputs of UHMIS will generally assist in the management and planning of health programs. Specifically, the development of the UHMIS will put in place standards related to policy formulation, data collection and transmission, data analysis, presentation, reporting and utilization.
Development of the Philippine Health Information Exchange (PHIE)
Aid policy makers and health managers in formulating better health programs.
To strengthen statistical research and capacity development
Conduct of methodological study to estimate maternal mortality rate through the use of vital registration statistics
Serve as input in the formulation of plans and programs to appropriately and effectively address the problems of maternal mortality
Conduct of methodological study to estimate the MDG indicator on HIV prevalence among the population aged 15-24 years old
Serve as input in the formulation of plans and programs to appropriately and effectively address the problem of HIV/AIDs
Adoption of new parameters in the measurement of PNHA estimates for private schools and establishments
Better quality PNHA estimates as basis for more appropriate health policies and programs
Conduct of training relative to the adoption of SHA 2011 Measurement of the technical knowledge/ skills/competencies on statistics of staff in health and nutrition sector
To promote international cooperation in statistics
Participation in international technical cooperation, conferences, and expert group meetings relative to health and nutrition statistics
Basis in the formulation of policies and programs towards better quality health and nutrition statistics comparable internationally

82
Chapter 19 – Social protection statistics
Introduction
Social protection is vital to the well-being of society.
It empowers people who may not have benefited from economic growth and development to deal
with economic and social risks they have to face. It has important benefits that uplift human well-
being, bring social justice, and contribute to
inclusive growth and sustainable development.
The PDP 2011-2016 explicitly states that “investments in the country’s human resources,
together with physical investment, is the key to
sustained and broad-based growth, which would require equitable access to basic social services, as
well as stronger social safety nets and social protection against shocks.”
This chapter highlights the statistical programs to
improve collection and compilation of social
protection statistics and indicators towards better surveillance and monitoring.
Situational Analysis
❖ Key developments in 2011 – 2015
Improvement of the generation/updating of
critical indicators on social protection. ▪ The updating and enhancement of the Social
Protection Development Report (SPDR). The SPDR was implemented and proposed to be conducted every three (3) years. It is a tool in identifying risk and vulnerabilities encountered by individuals, families and communities. It also assists the local, regional and national level in prioritizing responses to address poverty situation and social protection concerns.
The SPDR was institutionalized at the regional and local levels through Administrative Order No. 7 s. 2011 - “Guidelines in the Preparation of Social Protection Development Report”. The approved Administrative Order pushed through despite the low compliance of cities/municipalities.
▪ The enhancement of the National Household Targeting System for Poverty Reduction (NHTS-PR). The NHTS-PR was implemented in 2014 to
minimize inclusion and exclusion errors, and improvements in the Proxy Means Test (PMT) model were done. These were based on the 2009 Family Income and Expenditure Survey (FIES) and the Labor Force Survey (LFS). The improved PMT model now considers Barangay/Community Characteristics culled from the 2007 Census of Population (PopCen) as one of the determinants of poverty. Other PMT features include a specific classification of occupation consistent with the Philippine Standard Occupation Classification (PSOC) and a second stage screener to reduce inclusion errors.
The second assessment used the Family Assessment Form (FAF) instead of the Household Assessment Form (HAF). The FAF
has new features that allow identification of more detailed information about a family’s source of income, which is needed to better identify the poor and the non-poor.
Results from the second assessment conducted in 2015 identified 5.1 million poor households among the 15.1 million assessed.
▪ The enhancement of the Social Welfare Indicators (SWI) and development of the Social Welfare and Development Indicators (SWDI). The SWDI as an enhanced version of the SWI is

83
a powerful Department of Social Welfare and Development (DSWD) management tool used for measuring/monitoring the progress of the families’ well-being, particularly the Pantawid Pamilya beneficiaries. It also serves as a reference for case management aimed at promoting the families transition out of poverty on a sustainable basis. Levels of well-being (Level 1 – Survival; Level 2 – Subsistence; Level 3 – Self-Sufficient) are computed as weighted averages of the scores of the families or family members in all seven (7) subcomponents (23 indicators). Weights are assigned to each indicator which yields to 33% of the well-being contributed to Economic Sufficiency and the remaining 67% to Social Adequacy. The year 2015 marked the conduct of the nationwide SWDI Baseline Assessment which covers registered and active Pantawid families as of 31 December 2014. The Department targeted to assess 4,097,282 active and registered Pantawid families and by end of March 2016, 3,695,885 or 90.20% of the total target beneficiaries were assessed.
▪ The inclusion of social protection in the Annual Poverty Indicators Survey (APIS) questionnaire. The Philippine Statistics Authority (PSA) included and implemented a module/section on social protection in the APIS starting 2012. For the social safety nets component, the questionnaire has included an item referring to the survivor’s benefit received by the respondent.
Development and use of effective statistical
tools for monitoring and evaluation of the impacts of social protection programs. ▪ Conduct and implementation of the Impact
Assessment Studies on the Pantawid Pamilyang Pilipino Program or “Pantawid Pamilya”, Kapitbisig Laban sa Kahirapan-Comprehensive and Integrated Delivery of Social Services (KALAHI-CIDSS) and other social protection programs of the DSWD. In 2011, the first Impact Evaluation Study under KALAHI-CIDSS was conducted using Difference-In-Difference evaluation approach.
Meantime, two (2) Impact Evaluation Studies were conducted for the Pantawid Pamilyang Pilipino Program. The First Wave Impact
Evaluation was conducted in 2011 jointly by the DSWD and the World Bank. The study used the Randomized Control Trials (RCT) evaluation approach. The Second Wave Impact Evaluation was conducted in 2014. The study evaluated the Pantawid Pamilya using regression discontinuity design.
One study on Benefits Incidence Analysis (BIA) was likewise conducted in 2013 to 2014 along the Pantawid Pamilya and the KALAHI-CIDSS. This study investigated the distributional impact
of the Pantawid Pamilya and the KALAHI-CIDSS Programs on the welfare of the poor. The DSWD applied the BIA technique on a household survey data set from the 2011 APIS and supplemented these with the DSWD administrative data.
▪ The NEDA computed the Multidimensional Poverty Index (MPI) and used it as an additional indicator for poverty in the updated PDP.
▪ The Department of Labor and Employment (DOLE) and the National Economic and Development Authority (NEDA), with technical assistance from the International Labor Organization (ILO), led the conduct of the Assessment-based National Dialogue (ABND) in Social Protection for the Philippine exercise. The dialogue aimed to assess the overall social protection policies and programs and to estimate the cost of the corresponding policy options by using ILO’s Rapid Assessment Protocol (RAP) tool.
Implementation of appropriate statistical policies and standards for the production and
dissemination of social protection statistics at
the local levels. The DSWD formulated
policies/standards on the dissemination/sharing of information from the NHTS-PR database/registry through the signing of a Memorandum of Agreement (MOA).
In 2014, the DSWD initiated a study that will serve as the foundation of a policy that will define the
near-poor and set standard criteria for identifying them.
Improvement of accessibility and dissemination of social insurance data
generated by major data source agencies
Development and implementation of a data
quality assessment framework for social protection.
Innovations in data collection, processing, management/coordination and
dissemination. ▪ The National Anti-Poverty Commission (NAPC)
addressed the cost of Community Based
Monitoring System (CBMS) by developing an android-based survey instead of the usual paper-and-pen. The Rapid CBMS, as it is called, assists the Local Government Units in capturing indicators of poverty which can then be integrated in local planning.
▪ The Social Security System (SSS) tied-up with the former National Statistics Office (NSO) on matching their pensioners and beneficiaries to efficiently verify the status of pensioners aged 80 years and above.

84
▪ The outsourcing of data conversion was initiated by the SSS to digitize and index their priority documents.
▪ The GSIS introduced the Electronic Billing and Collection System (eBCS) in July 2014. It is a web-based application that enables the pension fund to send its billing statements for premium and loan amortization to government agencies electronically, and accept payments online.
eBCS is used by government personnel in charge of approving and remitting payments to GSIS. It allows government agencies to download GSIS billing statements and upload the electronic remittance file. Remitting officers thus save time and government resources, as they now do all the work in the comfort of their offices. The system ensures the seamless and efficient posting of payments, ultimately resulting in the accurate computation of members’ benefit proceeds. To attain greater operational efficiency, GSIS forged partnership with the Philippine Statistics Authority to determine the status of GSIS pensioners. Thus, GSIS no longer requires its pensioners to visit any of its offices for the renewal of their active status to receive their monthly pension.
▪ The Philippine Health Insurance Corporation (PHIC) estimation of the 2011 and 2012 Benefit Delivery Rate (BDR) were disaggregated by national, as well as regional and provincial level. Inpatient (IP) BDR and outpatient (OP) BDR estimates were also provided.
The PhilHealth has stopped using BDR as National Health Insurance Program (NHIP) performance indicator since 2012, but is still monitoring the enrolment, coverage, and utilization rate. The BDR is a composite index. However, one of its components on access, which includes presence of facilities, is not controlled by the PhilHealth. Nonetheless, there is a plan to continue computing for BDR as an indicator of PhilHealth’s performance.
▪ The Unified Results Based Monitoring and Evaluation System (URBMES) - Information System was developed on the First Semester of 2015 and is currently on the process of further enhancement. This system encodes the quantifiable outcomes of various Social Protection Programs of the DSWD, inputs are commonly coming from the local level.
▪ For the Second NHTS-PR / Listahanan Assessment (2015), Listahanan made use of both Paper-and-Pen and Mobile Data Collection methods. The Mobile Data Collection option is intended for areas with good internet connectivity and eliminates the encoding process in data input/collection stage.
▪ The development of the SWDI - Information System (SWDI-IS) took place in June 2015. The
SWDI-IS hosts the 2015 SWDI Baseline Assessment results.
The DSWD Monthly Legislator Report provides timely updates on the DSWD programs and services by regional/provincial/ district/city/municipality and shared to legislators in the Senate and House of Representative. On the other hand, the Statistical Bulletin is a handy reference reflecting the major accomplishments of the Department along its Major Final Outputs (MFOs).
The DSWD also prepared the 2011-2014 Compendium of DSWD and SWD Statistics. The compendium is a compilation of secondary and administrative data on social development -gathered from national statistical bodies (i.e. PSA). It covers relevant statistics for plans and policy development for various vulnerable and disadvantaged sectors served by the Department (e.g. Women, Children, Senior Citizens, Youth, Persons with Disabilities and Family). It also includes annual summary data on the clients served by the agency.
Activities undertaken in 2011-2014 to
generate an indicator related to social protection. The PHIC produced data on the
percentage of poor families covered by PhilHealth under the Indigent membership category as identified under the NHTS-PR, including poor families enrolled by the LGUs under the sponsored program.
The coverage rate of Indigents (NHTS-PR Poor) has been part of the Major Final Outputs/Performance Indicators of the Department of Health under the General Appropriations Act FY 2016, 2015, 2014.
Statistical capacity building of social
protection statistics producers. The following trainings and workshops were successfully conducted: ▪ 2011 to 2014: Capacity Building on Monitoring
and Evaluation Operations for DSWD Central Office and Field Office personnel.
▪ 2011: Training of Monitoring and Evaluation Unit; National and Regional Training on Risk and Vulnerability Assessment; and National and Regional Training on Impact Evaluation.
▪ 2012: Training on Monitoring and Evaluation, Impact Evaluation Training and Log Frame Training.
▪ 2013: Harmonization Workshop and Impact Evaluation Training.
▪ 2014: Training of Trainers on the Unified Results-based Monitoring and Evaluation System, Technical Assistance to Field Offices and Offices, Bureaus and Services on URBME

85
System (Roll-out) and Cascading of URBME System to Field Offices (Workshops).
▪ 2015:
- Training of trainers on the use of the SWDI, and the SWDI-IS, cascaded down to city/municipal level.
- Series of trainings on the use of Social Protection (SP) Handbook in 2015. The accompanying volume of the SP handbook, which is the Vulnerability and Adaptation Manual, contains tool in assessing risks and vulnerabilities.
The following Capacity Building and Workshops on BIA were successfully implemented in coming up with the BIA study along Pantawid Pamilya and KALAHI-CIDSS.
▪ 2012: Benefit Incidence Analysis Training and Writeshop.
▪ 2013: Benefit Incidence Analysis Technical Working Group (TWG) Workshop.
▪ 2014: Benefit Incidence Analysis Writeshop
Participation and hosting of international conferences, training, workshops, and expert
group meetings on social protection and other related statistics.
Participation in international cooperation and capacity building programs/projects, and
standards and methodological development
activities on social protection and other related statistics.
Capacity building programs for social protection agencies/institutions at the
national and local levels on using statistics in media, policy and delivery of services.
Strengthening of coordination of
intra/interagency statistical activities on social protection. The Interagency Committee on
Social Protection Statistics (IACSPS) was created in 2015. It serves as forum for the exchange of views and expertise to resolve technical issues and problems arising from the production, dissemination and use of social protection statistics.
❖ Issues and Concerns
Lack of information to assess adequacy of
data to measure effectiveness and efficiency of government social protection programs.
Lack of social protection outcome-level
indicators that would show the level/status of social protection in the country such as social
protection index, vulnerability incidence, among others.
Need to put interagency mechanisms in place
to develop the statistical framework,
formulate standards and policies, and discuss data issues towards the regular production of
social protection statistics at the national and local levels.
Low investment of government and little statistical workforce in social protection
statistics.
Low compliance of reports from local
government units.
Lack of suitable manpower (focal persons, field enumerators, among others).
Lack of financial resources to support the capacity-building of local government units
on production, use and analysis of local-level data.
Need for a comprehensive and updated profile of workers in the informal sector.
Statistical Programs for 2016 and 2017
❖ Summary The following programs/activities are proposed
to be conducted to address persistent issues and problems in the production and dissemination of
timely, reliable and relevant social protection
statistics:
Completion of the final phase of the SP statistical framework towards the regular
production of social protection statistics.
Formulation of concepts and definitions (including metadata) for statistical purposes
for the SPS sector will also be undertaken to
adopt standardize statistical terms.
Development of social protection outcome-
level indicators such as the social protection index (SPI) and vulnerability incidence,
among others.
Implementation of the Business Analytics
(BA) framework by the SSS to further improve the generation and preparation of
reports. Business Analytics is a set of solutions
that help organization of all sizes make sense of huge information in the context of their business. This can be used by the organization to provide complete decision support through data warehousing, data analysis and trending. With

86
the implementation of this project, the SSS will be provided with the following: ▪ Comprehensive information and insights on SSS
operations for planning and decision-making;
▪ Performance monitoring tool; and
▪ Faster report preparation and generation.
Formulation of policy/standards on the
dissemination of information from the NHTS-PR database/registry.
Enhancement of the URBMES Information System.
Improvement of the civil registration system as input for estimating NHIP coverage rate.
Generation of statistics from the recent Profiling of Workers in the Informal Sector.
Updating of profile of workers in the informal
sector.
Continuous improvement and updating of the DOLE Kabuhayan Information Support
System (DKISS).
Tracer Study on the Sustainability of
Livelihood Projects.
Development and use of effective statistical
tools for monitoring and evaluation of the impacts of social protection programs.
Purchase of STATA software including conduct of corresponding training.
Policy Use
Table 16. Policy uses of social protection statistical development programs.
Statistical Development Programs Policy Use
Enhancement of the URBMES Information System Strengthened internal operations and communications within DSWD
Continuous improvement and updating of the DOLE Kabuhayan Information Support System (DKISS)
Monitoring and evaluation tool for livelihood program managers and implementers and other stakeholders
Generation of statistics from the recent Profiling of Workers in the Informal Sector
Input to program development and policy formulation
Development of social protection outcome indicators Basis for policy directions on social protection for the next administration’s PDP, Results Matrix and Philippine Investment Program.

87
Chapter 20 – Statistics on children and gender and development
Introduction
Children are among the most vulnerable population groups in society. Their survival and living
conditions, health and education are of utmost
importance to society; hence, their rights, welfare, and development are always at the core of the
country’s social development goals.
Women belong to the same paradigm. But while significant strides have been made in improving
gender balance in the country, there are considerable barriers that have yet to be hurdled
and challenges looming ahead as homes, schools, and workplace continue to bear witness to
unresolved gender inequalities.
Achieving child development and gender equality are therefore society’s moral obligation, one that
transcends political, economic, and social
boundaries. The Millennium Development Goals (MDGs) rightly emphasized the need for concerted
efforts to improve the plight of children and to address gender inequalities towards reducing
poverty and the worst forms of human deprivation. Specific targets and milestones for children and
gender and development (GAD) include universal
primary education, reduced child mortality, and improved maternal health.
The PDP 2011-2016 accords significant focus on
children by increasing access to improved basic education and health care services, caring for
abandoned and neglected children and children with special needs, and ensuring rights, freedoms
and protection of youth and promoting youth
empowerment.
Statistics on children and gender become inputs in crafting policies and interventions that facilitate
results-based and rights-based human
development and sustainable social progress.
Situational Analysis
❖ Key developments in 2011 – 2015
Conduct of key surveys on children and GAD. ▪ 2011 Updating of Nutritional Status on Filipino
Children
▪ 2011 Survey on Children (SOC)
▪ 2011 Family Health Survey (FHS)
▪ 2012 Multiple Indicator Survey (MIS)
▪ 2013 National Nutrition Survey (NNS)
▪ 2013 National Demographic and Health Survey (NDHS). The conduct of the 2013 NDHS retained the module collecting data on violence against women, as well as reproductive health.
▪ 2013 Young Adult Fertility Survey (YAFS).
The approval of the 2013 Master Sample (MS)
for Household Surveys.
Compilation and dissemination of statistics on
children and GAD. ▪ Annual Factsheet on Women and Men in the
Philippines
▪ Gender QuickStat
▪ Release of the 2012 Poverty Statistics for the Basic Sectors including women, children and youth
▪ Statistics on Labor and Employment

88
▪ Gender-Based Indicator of Labor and Employment in Agriculture
▪ Handbook on Women and Men in the Regions for Regions I, V, VIII, IX, XI, XII and CAR
▪ Women’s Safety Module and Women’s Empowerment Chapter in the 2013 NDHS
▪ Data updates on the MDG indicators to monitor Goal 3 such as ratio of girls and boys in primary, secondary and tertiary education, ratio of girls and boys in elementary and secondary participation rates, share of women in wage employment in the non-agricultural sector, proportion of seats held by women in the national parliament
Establishment of the Interagency Committee on Gender Statistics (IACGS) of the PSA.
Development of the National Violence AgainstWomen (VAW) Documentation
System (NVAWDocSys) for monitoring violence against women. In 2009, the Philippine
Commission on Women (PCW) initiated the development of the NVAWDocSys, a secure web-based documentation system that facilitates and integrates the collection of standardized data on VAW from concerned government agencies, local government units and other service providers handling VAW cases. The system was piloted in nine sites with funding from the United Nations Population Fund (UNFPA). The result demonstrated that administrative data from various sources could be integrated, and in the process, remove duplication or double-counting of victims.
In 2012, taking off from the results of the initial piloting of the NVAWDocSys, the PCW spearheaded the province-wide rollout of the use of the system in the Province of Aklan. System enhancement to suit the data needs of the local government units is currently being undertaken with funding support from the Spanish Agency for International Development Cooperation (AECID).
Development and improvement of archiving
systems/documentation of actual policy uses of statistics on children and gender. The PCW
regularly monitors laws that are amended or passed which utilized data/information on gender statistics to support their enactment. These laws that were amended or passed since 2010 are as follows: Republic Act 10354, “The Responsible Parenthood and Reproductive Health Act; RA 10361, “Domestic Workers Act”; and RA 10364, “Expanded Anti-Trafficking in Persons Act.”
Strengthening of advocacy/communication
strategies for more rational use of statistics on children and gender and development and
participation in and hosting of international conferences, training, workshops, and expert
group meetings on statistics on children and gender and development. ▪ The PCW includes gender statistics in their
advocacy campaigns such as inclusion of the 2008 and 2013 NDHS results in crafting core messages on VAW during the 18-Day Campaign to End VAW, Gender Statistics in crafting National Women’s Month Celebration core messages, gender statistics in PCW press releases, speeches, and talking points for media, and infographics which were being disseminated in social media and media kits, gender statistics during the crafting of the “Estado ni Juana”: The State of Filipino Women Report, and production of info sheets on the 12 areas of concern in the Beijing Platform for Action (BPfA)+20, which were distributed during the UN CSW in New York and 2015 Women’s Month Celebration.
▪ Participation in the 4th and 5th Global Forum on Gender Statistics.
▪ Membership in the UN Interagency and Expert Group on Gender Statistics (IAEGGS).
▪ Participation in various international seminars, trainings and workshops such as International Seminar on Gender Statistics and Asia Pacific Economic Cooperation (APEC) Policy Partnership on Women and the Economy (PPWE) Measuring Change: Creating a Data Framework for the PPWE Workshop.
Conduct of Evidence and Data for Gender Equality (EDGE) Project. The United Nations
Women (UN Women) and United Nations Statistics Division (UNSD), in collaboration with the Organization for Economic Cooperation and Development (OECD), World Bank and Asian Development Bank (ADB), are supporting the conduct of the EDGE Project, which aims to develop methods/guidelines to collect sex-disaggregated asset ownership data. It is expected to improve integration of gender issues into the regular production of statistics for better evidence-based polices. A pilot survey on this will be conducted in a number of countries. The ADB is currently supporting the conduct of this pilot survey in the Philippines together with Mongolia and Georgia. The pilot survey in the Philippines
was conducted in September 2015 with the report to be released in 2016.
Conduct of National Baseline Survey on Violence Against Children. The Council for the
Welfare of Children (CWC) conducted the National Baseline Survey on Violence against Children in August 2015. This is the first time that a survey was conducted to measure violence against children. The results of the survey will be released in 2016.
89
❖ Issues and Concerns
Data gaps have remained despite the increasing demand for better quality and
more disaggregated indicators/statistics on children and GAD. ▪ Despite the conduct of the SOC in 2011, this is
still irregular and yet to be institutionalized.
▪ Demand for the conduct of a national time use survey to define/update the parameters needed for the estimation of the contribution of unpaid work.
▪ Local-level data on children and GAD have generally remained inadequate.
▪ Absence of national baseline data on violence against children.
▪ The Core GAD Framework needs to be revisited to review the indicators which were not yet generated/produced and to include the emerging concerns.
▪ Regular generation of critical indicators on children and GAD needs to be prioritized such as maternal mortality ratio, among others.
▪ Generation of indicators for the Sustainable Development Goals.
Need for continuous research towards the creation of new or improvement of existing
approaches in generating better and quality
data/statistics on children and GAD. ▪ Methodological studies to review and
develop/improve the compilation of indicators on children and GAD.
▪ Statistical researches on emerging concerns of women.
Need to enhance coordination mechanisms for more coherent statistics on children and
GAD ▪ The statistical indicator framework on children
serving as reference for government and non-government organizations in the formulation of indicators for monitoring and assessment of outputs and impact of programs for children has yet to be established.
▪ Agencies focusing on statistics on children should be included in the Interagency Committee on Gender Statistics (IACGS).
▪ Need to rationalize PSA outputs on gender statistics given the merging of the four major statistical agencies.
Existing information systems for the statistics
on children and GAD, such as the children and gender databases/portal, should be
improved and updated to increase
relevance/accessibility of the statistics to key users and stakeholders.
Resources for generating pertinent statistics
have been inadequate. Despite the rising
demand for critical indicators on children and GAD, lack of human resources as well as statistical units in various offices/agencies persists. This affects the regular production and dissemination of the existing statistics and hinders the development and improvement of critical indicators on children and GAD.
Statistical Programs for 2016 and 2017
❖ Summary
Development and expansion of coverage of
the NVAWDocSys
Review of existing local and international
indicator systems by IACGS. The indicator systems include the following: ▪ Core Gender and Development Indicator System
(Core GAD).
▪ Minimum Set of Gender Indicators by the UNSD has 52 indicators covering five domains: (1) economic structures, participation in productive activities and access to resources; (2) education; (3) health and related services; (4) human rights of women and the girl child; and (5) public life and decision-making.
▪ Regional Core Set of Gender Indicators and Ministerial Declaration mandated by United Nations Economic and Social Commission for Asia and the Pacific (UN ESCAP) aims to develop a core set of gender indicators for Asia and the Pacific which serves as a response to the clamor for new and improved data.
▪ APEC Women and Economy (WE) Dashboard is an initiative that seeks to provide the status of women in APEC allowing measurement of progress of women’s participation in economic related activities and women’s inclusion in several aspects of life. The Dashboard is comprised of 80 indicators under five areas: 1) access to capital and assets; 2) access to markets; 3) skills, capacity-building and health; 4) leadership, voice and agency; and 5) innovation and technology. The list of indicators needs assessment on their availability and relevance.
▪ UNICEF’s Child Poverty and Disparities
▪ SDGs
Updating of the child poverty indicators through the existing database on children.
Development of an Equity Profile of Children by United Nations Children’s Fund (UNICEF).

90
Improvement and updating of existing
gender databases.
Formulation of guidelines in the generation of
gender statistics as identified in the Magna Carta of Women (MCW).
Rationalization of gender-related outputs of
PSA.
Expansion of IACGS to include the agencies
focusing on statistics on children.
❖ SDPs supporting the generation of the RRM indicators
Table 17. SDPs supporting the generation of RRM Indicators on Children and Gender and Development
Statistical Development
Programs
RRM Indicators PSDP
Disaggregated Data
Development of the National VAW Documentation System for monitoring violence against women and children (PCW)
Gender-responsive and conflict-sensitive policies / programs / support services for women and children in conflict situations identified and mainstreamed in national government agencies and LGUs in PAMANA provinces
National level
Conduct of the National Baseline Survey on Violence Against Children (CWC)
Policy Uses Table 18. Policy uses of children and gender and development statistical programs.
Statistical Development Programs Policy Uses
Advocating the creation of statistical units/positions for the continuous improvement and regular compilation of statistics on children and gender and development
Quality statistics produced can be used in monitoring the welfare of children, women and men and in formulating policies on empowering women such as in business (entrepreneurship), among others.
Development of the National VAW Documentation System for monitoring violence against women and children
Monitoring of the following laws: RA 9262 - The Anti-Violence against Women and their Children Act of 2004; RA 7877 - The Anti-Sexual Harassment Act of 1995; among others.
Development of the National VAW Documentation System for monitoring violence against women and children
Basis for the establishment/ creation of women's desk
Conduct of the Pilot Study on Evidence and Data on Gender Equality (EDGE) Project
For providing insights on women's empowerment and decision-making, understanding livelihoods including entrepreneurship, and reducing poverty and vulnerability.
Conduct of the National Baseline Survey on Violence Against Children
Monitoring of RA 9262 and other related laws and policies on violence against children
Conduct of the 2016 Multiple Indicators Survey (MIS)
For monitoring of the welfare of children Updating of Child Poverty Indicators
Release of infographics on the Equity Profile of Children covering four pillars
Review of the following indicators systems: 1. Core GAD Indicators; 2. Global Minimum set of GAD indicators (UN Statistical
Commission); 3. Regional Core Set Gender Indicators for Asia and the Pacific
(ESCAP); and 4. APEC Women and Economy Dashboard 5. UNICEF’s Child Poverty and Disparities Indicator
For monitoring of gender statistics and formulation of policies towards empowering women
Review of Sustainable Development Goals (SDGs), specifically on SDG 5 Gender equality
For monitoring of the SDGs
Development of Guidelines for establishment of GAD database for all agencies as identified in the Magna Carta of Women
Monitoring of the MCW and the status of women
Enhancement of existing children and gender statistical databases
For monitoring of the welfare women and children

91
Study on the compilation of poverty statistics for the basic sectors with lower levels of disaggregation using Small Area Estimation (SAE) technique
For anti-poverty reduction policies and programs specifically for marginalized sectors of the Philippine society at the provincial level
Study on valuation of unpaid work of women and men To serve as basis for crafting policies in recognition of the contribution of unpaid work to the economy
Review of the objectives and questionnaires of the different household surveys such as the Time Use Survey (TUS) and Women’s Safety Module of the NDHS
For crafting of policies to recognize the contribution of unpaid work to the economy and for monitoring of the incidence of violence against women
Institutionalization of the Survey on Children (SOC) For monitoring the status/welfare of children
92
Chapter 21 – Civil registration and vital statistics
Introduction
Civil registration in the Philippines was instituted and made compulsory by the enactment of the Civil
Registry Law (Act No. 3753) in 1930. The Director of the National Library was the Civil Registrar
General (CRG) and he has the duty to enforce the
provisions of Act 3753.
Civil registration is an ideal source of vital statistics
such as births, deaths, fetal deaths and marriages
which are important inputs for monitoring the country’s population growth.
This chapter highlights the developments in the civil
registration and vital statistics from 2011 – 2015, the issues encountered in this sector and
summarizes the key programs for the improvement of the civil registration and vital statistics in 2016
and 2017.
Situational Analysis
❖ Key developments in 2011 – 2015
Conduct of Customer Satisfaction Surveys
(CSS). The CSS were conducted quarterly in the
Metro Manila outlets primarily to know how the
PSA fared in its delivery of civil registry services to the public and also serve as guide in enhancing and improvement of services. In 2011, the overall customer satisfaction rating for Census Serbilis Outlets in Metro Manila was placed at 75.1% with slight improvement in 2012 and 2013 at 76.3% and 76.6%, respectively. In 2014, the customer satisfactory rating declined to 75.9%.
Enhancement of Civil Registry System (CRS). The computerization of the civil registry system
through the Build-Operate-Transfer (BOT) scheme with the Unisys Philippines contributed to a streamlined and enhanced processing, storing, and retrieval of civil registry documents. As a result, the delivery capability of the frontline services of the then NSO, was enhanced.
Improvement of Service Time Performance. Overall, 93.7% of the total 44,151,587 converted requests were released within the 2-hour period. The processing time for the unconverted and
annotation requests were also reduced from 15 working days in 2011 and 2012 to 10 working days in 2013 and 2014. In 2011 and 2012, about 85% of the total 1,360,499 unconverted and annotation requests were released within 15 working days. Meanwhile, the CRS operation statistics for 2013 and 2014 showed that 82.7% of the total 833,211 annotation requests were released within 10 working days while 92.3% of the total 662,797 unconverted requests were released within 10 working days in the same period. The processing time for request of Certificate of No Marriage (CENOMAR) was also reduced from 5 working days in 2011 and 2012 to 4 working days in 2013 and 2014.
Issuance of Guidelines and Procedures on Civil Registration. ▪ Memorandum Circular 2011-3, Implementation/
Effectivity of Republic Act No. 9858 or the Act Providing for the Legitimation of Children Born to Parents Below Marrying Age, Amending for the Purpose of the Family Code of the Philippines, as amended.
▪ New Rules in the Registration of Foundling issued through Civil Registrar General (CRG) Memorandum Circular 2011-5.

93
▪ Republic Act No. 10172 authorizing the City/Municipal Civil Registrar or the Consul General to correct clerical of typographical errors in the day and month in the date of birth or sex of a person appearing in the civil register without need of judicial order.
▪ Pantawid Pamilya Pilipino Program (4Ps).
Launch of the Philippine Civil Registry
Information System (PhilCRIS). The use of
PhilCRIS, the windows version of the old Civil Registry Information System (CRIS) was launched by then NSO on 2011. The PhilCRIS was developed primarily for use of the local civil registry offices, solemnizing officers, hospitals/lying-in institutions, and other stakeholders on civil registration.
Training on PhilCRIS. In 2011, batches of
training for the implementation of PhilCRIS were conducted. As of 2014, a total of 1,151 LGUs and 177 hospitals or other health institutions have entered into Memorandum of Agreements (MOAs) with the PSA, on the use of PhilCRIS.
Enhancement of Decentralized Vital Statistics System (DVSS). An enhanced DVSS for the
processing of civil registry documents at the provincial level and at the Central Office was done by the former NSO. The revised system, DVSS2011 is the enhanced version of DVSS2K for use of provincial offices and the Central Office. The development of the DVSS2011 and the finalization of the User’s Manual were done in 2011 and early
part of 2012. Implementation started in July 2012 and the updated version was released in the latter part of 2014.
Innovation of Barangay Civil Registry System
(BCRS). The PSA has brought civil registration
services to the barangay where the barangay officials and the community take active roles in monitoring vital events and facilitating subsequent registration through BCRS. The BRCS also provides a community based information system that will generate indicators and useful local statistics as inputs to community and barangay development programs. The BCRS later evolved into the Civil Registration Information System for Barangay (CRISB) for use of the LGUs particularly the barangay and the Local Civil Registry Offices
(LCROs). The establishment of BCRS at the barangay level is seen as an effective solution in addressing the complexity and barriers in civil registration.
Philippine Monitoring of Vital Events (MoVE-
IT). The MoVE-IT is a collaborative project
between the DOH and the PSA aimed at enhancing the BCRS by providing a user-friendly program using the present technology, redesigning the data gathering tools to facilitate data processing, and
creating an online database at the national level ready for hosting authorized BCRS implementers.
Enhancement of Electronic Annotation System (EAS) of CRS. In January 2014, an
enhanced version of EAS was implemented, allowing the processed annotated civil registry records in the database to be automatically printed in the Special Request Outlet. The auto-printing feature of the EAS is applicable only to paid transactions encoded by the SRU Outlets. Similar to electronic endorsement, the annotated copy in the CRS database is made available for copy issuance in Census Serbilis Outlets nationwide, threedays after it is processed at the Central Office. There is no need to wait for the scanning of the annotated record and the supporting
documents by the Data Capture Center (DCC) to be available online for copy issuance in the CRS Serbilis Outlets.
Value Added Service (VAS). The pilot areas for
this innovative project are clients who were issued negative results by the PSA and whose place of birth is from CARAGA region, specifically, the cities/municipalities from the provinces of Agusan del Sur, Agusan del Norte, Surigao del Sur, and Surigao del Norte. The implementation of VAS was expanded to two provinces: Laguna and Cavite in April 2014. The project was launched on 16 January 2016.
Maintenance and archiving of civil registry documents. A total of 17,460,804 civil registry
documents received by the CRG were processed over the period. These include regular reports submitted for births, marriages, deaths, application for marriage licenses, foreign registration of vital events forwarded by the DFA, Sharia Courts registration (marriages and divorces of Muslim Filipinos, and conversion to Islam) and other registrable documents affected by court decrees, legal instruments, Republic Act No. 9048 and Republic Act No. 10172, and supplemental reports.
Capability Building for civil registration stakeholders. The PSA has continued to enhance
capability and coordination with the Local Civil Registrars through various conventions and local
seminars and trainings. These include the 7th and 8th National Convention of Solemnizing Officers, 6th and 7th National Workshop on Civil Registration, and the conduct of regular trainings on International Classification of Diseases Version 10 (ICD) in collaboration with the DOH.
Generation of Vital Statistics. The PSA
continued to produce statistical tables, Special Releases for births, deaths, marriages, as well as Fact Sheets on common names for years 2011 and partly for 2012. The consolidated Vital Statistics

94
Report (VSR) for 2006 to 2012 will be released in the latter part of 2015.
Registration of Authority of Solemnizing Officers. Additional records maintained in the
main archives of the PSA are the records of issued Certification of Registration of Authority to Solemnize Marriage (CRASM) of all solemnizing officers in the Philippines prior to the decentralization of the processing of application for registration of authority to solemnize marriages in the PSA Field Offices. The PSA issued 33,591 CRASMs in 2011-2014.
Mobile Registration. Mobile registration is an
outreach registration activity usually conducted by the Local Civil Registry Office in coordination with the PSA during special events such as Civil Registration Month in February. This activity is very useful for mass registration especially in areas/communities that were known to have high numbers of unregistered vital events. A total of 962 mobile registrations were completed in 2011 to 2014.
Special Projects for Improving Registration in
the Country. ▪ Assessment of Civil Registration and Vital
Statistics (CRVS) at the sub-national level and completeness study of death registration in the country
▪ Conduct of Special Operation for Civil Registration of Undocumented Filipinos in Malaysia
▪ Free birth registration
▪ Development of the Vital Registration Framework for Health Workers (Handbook)
▪ CRVS Case Study and Investment Plan
❖ Issues and Concerns
Lack of appointed permanent local civil registrars for some municipalities hampers
the improvement in the quality of data from the civil registration system. ▪ Non-compliance of some LCROs in the timely
submission of monthly reports of vital events which affects the completeness of registration.
▪ Longer duration in the processing of death statistics from vital registration as compared to birth and marriage statistics due to 100% review on the codes of the causes of deaths and other coded items in the Certificate of Death. This resulted to untimely release of annual reports on vital statistics.
▪ Some local government units have not implemented the PhilCRIS affecting the timeliness in the submission of monthly reports from the PSA Field Offices.
Some local government units have no
established LCRO.
Act No. 3753 or the Civil Registry Law is an
old law, with some obsolete provisions.
Lack of appreciation on the generation of
vital statistics by LCROs.
Need to further improve the level of birth
registration.
Low level of death registration especially in
some special sectors of the society- Muslims, Indigenous Peoples, and poor sectors.
Despite established protocols on the registration of indigenous peoples (IPs),
there is lack of indicators from the generated
vital statistics.
Lack of standard procedures for special cases
such as DOA cases, concepts on fetal deaths and live births for health workers (to
establish vital registration protocols, guidelines, and procedures for each sector
including private and public hospitals,
Municipal Health Offices and other institutions).
Inaccessibility of report of vital events for the copy issuance purposes resulting also to
undercount vital events that occurred abroad.
Un-registration of vital events of Filipinos residing abroad which results in cases of
undocumented Filipinos and stateless
persons.
Statistical Programs for 2016 and 2017
❖ Summary
Production and dissemination of accurate, complete and timely vital statistics based on
registration records.
Increased utilization of vital statistics data for
in-depth studies.
Provision of legal documentation to all
Filipinos, local or abroad, in claiming identity,
civil status and ensuing rights.
Increased level of registration of all vital
events (birth, marriage and death).

95
Amendment of Act No. 3753 or the Civil
Registry Law (1931).
Adoption of new technologies to improve civil
registration services and facilities.
Provision of world-class CRS building.
Upgrading of Service Outlets.
Standardized implementation of rules and
regulations on civil registration.
Improved archiving system for physical
documents and microfilms.
Strengthened linkages with stakeholders and
development partners.
Continuous capability building of CRS
personnel(s).
Continuous capability building (retooling) of
personnel(s) involved in the registration process.
Policy Uses
Table 18. Policy uses of civil registration and vital statistical development programs.
Statistical Programs Policy Uses
Massive Information Campaign to increase awareness of the birth registration (e.g. Marginalized sectors)
Increased number of registration of all vital events
Continuous capability building of Civil Registration Service personnel(s) Number of trainings conducted, number of participants
Revision and amendment of the Civil Registry Law (RA 3753) to include free registration of vital events as National Policy and deputizing barangay chairman and secretaries in facilitating registration of births and deaths
Revised Civil Registry Law

96

97
6 – Environment and
technology
98
Chapter 22 – Environment and natural resources statistics
Introduction
The Philippines is widely acknowledged to have an outstanding endowment of natural resources. It is
identified as one of the world’s 17 “mega-diverse”
countries as well as a biodiversity hotspot.
By 2016, the Philippine government envisions the
country as “an environment that is healthy,
ecologically balanced, sustainably productive, climate change resilient, and one that provides for
the present and future generations of Filipinos.”
Concerns on the environment have evolved rapidly,
not only due to the alarming changes in climatic
conditions, but also due to the favorable potentials and opportunities of social and economic
significance.
This chapter aims to enhance the framework and the system for the generation and dissemination of
environment and natural resources (ENR) statistics in support of the country’s social and economic
development goals.
Situational Analysis
❖ Key developments in 2011 – 2015
Majority of ENR Statistics are generated by the Department of Environment and Natural
Resources (DENR), Department of Agriculture (DA), Department of Energy (DOE), and the
Department of Public Works and Highways
(DPWH). The statistics are generated through administrative-based data reporting systems,
statistical surveys, field assessments, etc. The major achievements of the Philippine Statistical
System (PSS) in the ENR sector during the 2011-2015 periods include the following activities:
Generation of updated ENR data with
more area-specific disaggregation through
surveys, assessments, inventory, and environmental monitoring stations. ▪ Vulnerability assessment of selected watersheds
and coastal areas in the Philippines to climate change. The Ecosystems Research and Development Bureau (ERDB) has completed as of December 2014, the assessment of 87 watersheds. The project was created to come up with adaptation measures to be included in the Integrated Watershed Management Plan and to ensure adequate protection from environmental hazards. It paved the way in standardizing the method used by DENR researchers in conducting vulnerability assessment studies. The standardized method has included the climate change concept as part of its new framework. The ERDB also formulated a new vulnerability index.
▪ Monitoring and assessment of air quality under the “Clean Air Program.” The Environment Management Bureau – National Capital Region (EMB-NCR) operated 13 ambient air quality monitoring stations in 2013. The stations are
capable of measuring Total Suspended Particles (TSP), Particulate Matter10 (PM10), and PM2.5 levels. Construction activities, unpaved roads, and motor vehicles were identified as dominant sources of TSP in Metro Manila.
▪ Monitoring and assessment of principal rivers and water bodies nationwide under the “Clean Water Program.” The objective of the EMB’s Sagip-Ilog Program is to improve water quality of 19 identified priority rivers in terms of Biochemical Oxygen Demand (BOD) and

99
Dissolved Oxygen (DO) levels and comply with the DENR Administrative Order No. 34 or the Revised Water Quality Criteria by year 2016. Out of 19 priority rivers monitored in 2013, five (or 26 percent) passed in terms of BOD and nine (or 56 percent) in terms of DO.
▪ Classification of water bodies under the Clean Water Program. The EMB created Water Quality Management Areas (WQMA) in order to protect through stakeholders’ collaboration, water bodies and their corresponding tributaries. Strategies include keeping water quality within the Water Quality Guidelines or Criteria conforming to the water body’s classification (e.g., Class C or Class SC) or improving water quality classification (e.g., from C to B or SC to SB). Corollary to that, an action plan was prepared in order to address water quality issues and problems in the area, which could result in the improvement or better water quality of the said water body. As of December 2013, there were 18 officially-designated WQMAs, which included areas within the jurisdiction of the Laguna Lake Development Authority (LLDA).
▪ Monitoring of hazardous waste generation under the Hazardous Waste Management Program. The EMB issued permits to 7,657 firms (hospitals among applicants) in 2013. A total of 974 and 6,683 permits were issued at the Central Office and at the regional offices, respectively.
▪ Monitoring of sanitary landfill under the Ecological Solid Waste Management Program. The EMB confirmed that 72 operational sanitary landfills and 53 sanitary landfills with environmental compliance certificate underwent construction in 2013. Materials Recovery Facilities (MRF) were built to reduce the amount of greenhouse gases (GHGs) (especially methane) produced from domestic and commercial biodegradable wastes disposed to landfills. As of December 2015, there are 8,486 MRFs servicing 9,624 barangays nationwide.
Generation of data from administrative based
information systems such as Environmental Impact Assessment (EIA), temperature,
typhoon, etc. ▪ Updating/generation of occupants/beneficiaries
of community based sustainable resource use under the Establishment and Management of Community Based Program (CBP). The Protected Areas and Wildlife Bureau (PAWB) completed in 2013 the analysis of the eight-year CBP implementation, which was based on the recommendations of the project, a capsule proposal, "Social Enterprise Hub for Protected Area Community Based Resource Management Agreement Holders."
Development and compilation of ENR
indicators relating to MDGs, climate change, including Philippine Economic-Environmental
and Natural Resources Accounting (PEENRA) and wealth accounts. ▪ Measurement of biophysical attributes of both
main island coastal and small island ecosystems under the adaptation strategies to climate change impacts to main island coastlines and small island foreshore areas project. The ERDB conducted a study to determine biophysical and social adaptation strategies of communities in main and small island ecosystems and to establish baseline information regarding the affected coastal communities’ local coping
mechanisms to climate change. A survey and assessment of mangrove vegetation was implemented in 11 regions.
▪ Development of indicators on water quality and productivity under the project “Riparian zone assessment for rehabilitation protocol to minimize erosion/sedimentation and enhance water quality.” This ERDB-led project, completed in 2013, evaluated the effectiveness of riparian zone or steam bank rehabilitation measures in minimizing erosion and sedimentation of watersheds. Six regions were identified as project sites. In 2011, the ERDB conducted photo documentation on the uses of surface water; land use verification; stream channel measurements; riparian zonation; and gathering of secondary data. Interviews with
water authorities and stakeholders and procurement of climatic data were done in three regions. Buffer strip crop planted along riparian zone, a rehabilitation measure, was found to reduce soil erosion rate by 67 percent.
Development and improvement of an ENR
statistics web portal as means for data
sharing among ENR data producers and stakeholders, improved information
validation and diffusion. ▪ Adoption and implementation of the Forest
Information System (FIS) under the Data Management including System Development and Maintenance Program. The Forest
Management Bureau (FMB) adopted the Forest Information System in an effort to promote and enhance the sustainable management of forest in the Philippines through improved data collection and information processes. The FMB conducted the following activities: Management, update, and validation of FIS datasets; development, management, update, validation, and generation of FIS-GIS; monitoring, assessment, and review of implementation of FIS in its field offices; management and maintenance of its local area network, internet
100
access facilities and website; capacity building for data managers; and handling of FIS assessment workshop.
Development of statistical reports,
publications and analytical papers on ENR and related concerns. ▪ Development of Philippine invasive alien species
database under the project “Biosecurity Measures for the Protection of Biodiversity from Invasive Alien Species (IAS).” The ERDB led a project that will help assess and update the status of IAS in the Philippines. Corollary to this, an IAS database will be developed that will be used as a basis for control and management strategies to protect biodiversity.
The IAS profiled in 16 Protected Areas in the Philippines revealed a total of 70 species classified under 40 families. A nationwide awareness survey conducted in 2013, with 766 respondents (66 percent of which were males), revealed that only 51 percent of the respondents were knowledgeable and aware of the IAS. Around 80 species of IAS were identified by the respondents in the area with about 25 percent animals; and the rest, plant species.
Conduct of methodological studies to
enhance / develop frameworks and methodologies for analyzing impacts of
climate change in different ecosystems, researches/studies on valuation and
vulnerability. ▪ Survey of bamboo stands and establishment of
a national database of economically important bamboo species in the Philippines. The ERDB led a national bamboo survey that determined the extent and distribution of economically important bamboo species in the country such as kawayan tinik (Bambusa blumeana), giant bamboo (Dendrocalamus asper), bolo (Gigantochloa levis), and buho (Schizostachyum lumampao). The survey, completed in 2013, used a combination of classical techniques and cutting-edge technologies like remote sensing, geographical information system, and global
positioning system. The total estimated area of the four economically important bamboo species surveyed was 8,479.88 hectares with 888,411 clumps and 29,992,108 culms. Kawayan tinik has the highest total coverage in terms of area (6,679 hectares), number of clumps (580,480) and culms (16,617,991), respectively. Giant bamboo ranked second in terms of area with 740.91 hectares followed by bolo with 548.34 hectares and buho with 511.63 hectares.
▪ Economic pricing of raw water to ensure the efficiency in water use and allocation. This project, completed in 2012, was designed to determine the willingness to pay (WTP) of domestic water users for improved watershed management. Contingent valuation method, among other methods, was used to evaluate the values of nonmarket goods provided by watersheds. A survey questionnaire was administered to households in four project sites, namely, Caniaw Watershed in Ilocos Sur; Barobbob Watershed in Nueva Vizcaya; Busol Forest Reserve in Baguio City; and Mt. Malarayat Forest Reserve in Lipa City.
▪ Hydro-meteorological assessment of rivers being utilized as source of hydropower, irrigation and domestic water supply. Three watersheds, namely, Ambalanga (Cordillera Administrative Region or CAR), Buaya (Region 2), and Buhi (Region 5) were monitored in 2011. These watersheds were profiled for land use validation, collation of climatic and hydrologic data, and other secondary information. Meanwhile, four river systems were monitored in 2012. Gathering of secondary data, land use validation, and cross-sectional profiling were conducted. The ERDB installed a database system for rainfall, stream flow, and other hydro-meteorological parameters in four regions for better storage and easier data retrieval.
▪ Development of indicators in biosafety assessment under the project Biosafety measures for the protection of biodiversity against the potential impacts of products of modern biotechnology or Genetically Modified Organisms (GMOs). The biosafety project, completed in 2013, was intended to address issues associated with the potential adverse impacts of GMOs. Field experiments to compare the effects of planting genetically modified and conventional corn on soil arthropods and weeds profile were undertaken in regions 6, 10, and 12. The project resulted in the preparation of “The Guidelines on the Conduct of Environmental Risk Assessment and Monitoring of Plants Derived from the use of Modern Biotechnology for Release into the Environment.” The formulation of the guidelines was based on Executive Order No. 514, “Establishing the National Biosafety Framework Prescribing Guidelines for its Implementation, Strengthening the National Committee on Biosafety of the Philippines, and for other purposes.”
▪ Develop baseline information on a holistic basis for resolving land use conflicts including foreshore areas, competing land uses; socioeconomic assessment on impact of land distribution. The ERDB together with 10 Ecosystems Research and Development Services (ERDS) completed in 2012 a technical report that will serve as basis of policy review on
101
foreshore area management for environmental protection and revenue generation. Recommendations therein were forwarded to Land Management Bureau (LMB) while finalization of the terminal report is still pending.
▪ Baseline information on areas adversely affected by mining activities under the project “Improved rehabilitation strategies, schemes and technologies for areas adversely affected by mining activities and highly vulnerable and severely eroded areas in watersheds.” This ERDB-project, completed in 2014, aimed to verify the effectiveness and efficiency of rehabilitation measures in watersheds and mined-out areas. The project resulted in the identification of the most effective rehabilitation activities. Use of coconet technology was identified as the most effective rehabilitation technology in both watershed and mined-out areas. An information, education and communication material that will feature lessons learned, experiences, and best practices on the rehabilitation of mined-out areas is being prepared.
▪ Development of baseline information on small-scale mining in CAR and Region 5. This ERDB project, completed in 2012, assessed the operations of small-scale mining in the Cordillera Administrative Region and Regions 5 and 11. The ERDB interviewed one-on-one 360 target respondents using a devised survey questionnaire. Focus Group Discussions (FGD) among small scale gold miners, local government units, and local communities in the mining area were also conducted. A total of 106 participants were involved in the FGDs; 43 were from Maragusan, Compostela Valley; 30 from Itogon, Benguet; 33 from Ampucao, Benguet; and 15 from Jose Panganiban, Camarines Sur.
▪ Development of database on rare and endangered species in selected protected areas in the Philippines under the project: In-situ conservation of rare and endangered species in selected protected areas in the Philippines. The project, completed in 2013, was conducted in three protected areas, Mt. Arayat National Park in Pampanga, Mt. Kanlaon Natural Park in Negros Occidental, and Mt. Kitanglad Natural Range Park in Bukidnon. Permanent sample plots within the strict protection zone in each protected area have been delineated and assessed using belt transect method for the vegetation component and flushing method for the faunal component. Premium, rare, and endangered species within the strict protection zone were identified.
Other activities. ▪ Re-establishment of the Interagency Committee
on Environment and Natural Resources Statistics
(IACENRS). The IACENRS was re-established in 23 December 2014 through Philippine Statistics Authority (PSA) Memorandum Order No. 2, series of 2014 to serve as venue for discussion and resolution of issues, review current techniques and methodologies, and recommend policies and workable schemes towards the improvement of environment and natural resources and other related statistics. Five technical working groups are expected to be created starting 2015: Land and Soil Resources Statistics, Energy Resources Statistics, Disaster Statistics, Water Resources Statistics, and Mineral Resources Statistics.
▪ 2014 PEENRA project. The PSA re-established in 2014 its PEENRA unit to organize the compilation of environmental accounts based on the 2012 System of Environmental-Economic Accounting (2012 SEEA) and the compilation of environmental statistics based on the 2013 Framework for the Development of Environment Statistics (2013 FDES). The creation of the PEENRA unit was mandated by Executive Order No. 406 “Institutionalizing the PEENRA System and Creating the PEENRA Units in the DENR, National Economic and Development Authority (NEDA) and National Statistical Coordination Board (NSCB),” which was signed in 1997 by President Fidel V. Ramos. The PEENRA system was established as a satellite account to the Philippine System of National Accounts (PSNA) to generate macro-indicators that shall reflect the relationships and interactions between the natural environment and the economy.
▪ Philippine Wealth Accounting and Valuation of Ecosystem Services (PhilWAVES). The Philippines was identified as one of the pilot countries for the WAVES Global Partnership Program. The project activities, among others, will generate the data and indicators necessary to inform development planning and policy analysis on the sustainable use of mineral resources, services of different ecosystems and will support institutionalization of the 2012 SEEA. The WAVES project in the Philippines kicked off with a series of public consultations with various stakeholders in August 2013. Preliminary physical accounts for minerals resources (focusing on gold, copper, nickel and chromium) have been compiled. Likewise, the DENR have started work on the valuation of ecosystem services in Laguna Lake basin and Southern Palawan. The data gap and availability assessment is ongoing in close collaboration between key government agencies.
Through the WAVES project, trainings on the 2012 SEEA and the Experimental Ecosystem Accounting were also conducted.

102
▪ Compilation of environmental statistics based on FDES 2013. The 2014 Compendium of Philippine Environment Statistics (CPES) is the compilation of environment statistics and other related indicators that follows the Framework for the Development of Environment Statistics 2013. Developed by the United Nations Statistics Division, FDES 2013 is a multipurpose conceptual and statistical framework that covers aspects of the environment that are relevant for planning, policy formulation, and decision making. It organizes its Basic Set of Environment Statistics into six components, namely, (1) Environmental conditions and quality, (2) Environmental resources and their use, (3) Residuals, (4) Extreme events and disasters, (5) Human settlements and environmental health, and (6) Environment protection, management and engagement.
In 2014, the PSA, through the PEENRA Project, compiled the FDES 2013 Core Set of Environment Statistics or the Tier 1 of the Basic Set of Environment Statistics. The Core Set of Environment Statistics is a limited set of environment statistics that are identified as high priority and are relevant to most countries. Of the 107 statistics that were identified in the Core Set, only 105 are applicable to the Philippines. Out of the 105 applicable statistics, only 71 were compiled based on data availability. The tally of compiled statistics consists of the following: 22 out of the 35 core statistics for Component 1, 25 out of the 35 core statistics for Component 2, 10 out of the 19 core statistics for Component 3, three out of the four core statistics for Component 4, nine out of the 11 core statistics for Component 5, and two out of the three core statistics for Component 6.
▪ Compendium of ENR Statistics for Operations and Management. The DENR released two editions (2012 and 2013) of the Compendium of ENR statistics for Operations and Management. The compendiums comprised statistics on the following topics: forest management; biodiversity management; mines and geosciences; land management; environmental management; water resource; and gender and development.
❖ Issues and Concerns Although the ENR sector completed activities for
the improvement and development of ENR statistics, the persistent issues and challenges
hereunder hinder the sector’s full potential to
generate and disseminate statistics:
There is a need to: ▪ Modernize data collection on infrastructure and
technology to address users’ demand for timely, relevant and accurate ENR data.
▪ Construct mechanisms to assess and review data quality and methodologies.
▪ Strengthen communication tools and strategies in order to facilitate data usage of stakeholders.
▪ Increase human and financial resources in order to address the demand for more and improved ENR statistics.
▪ Strengthen the skills and capabilities of personnel producing ENR data.
Generation and production of ENR data remain fragmented and uncoordinated.
Statistical Programs for 2016 and 2017
During the transition period from 2015 to 2017, ENR sector will deliver the following activities for the
improvement and development of ENR statistics:
Generation of updated ENR data with more
area-specific disaggregation through surveys, assessments, inventory, and environmental
monitoring stations. ▪ Land classification survey and mapping under the
Management of Forestland and Forest Resources.
▪ Completion of the project “Vulnerability assessment of selected watersheds and coastal areas in the Philippines to climate change.”
▪ National survey and Integrated Pest Management development of important forest tree pests.
▪ Completion of the establishment of remaining groundwater monitoring stations and groundwater assessment under the Development of Groundwater Management Plan for Water Constraints.
▪ Update/generation of forest resource product statistics, volume and prices under the Data Management including System Development and Maintenance Program.
Generation of data from administrative based
information systems. ▪ Enhancement of local-level data collection systems
and databases.
▪ Review and standardization of administrative reporting forms.
▪ Database on land records and surveys.
▪ Trend-system based on ENR statistical data.
▪ Enhancement of DENR’s National Biodiversity
Monitoring System.
Development and compilation of ENR indicators
relating to Millennium Development Goals
(MDGs), climate change, including PEENRA and wealth accounts. ▪ Valuation of Ecosystems Services of a CBFM Area.

103
▪ Compilation of forest, land cover, and water asset accounts.
▪ Assessment of applicability of Sustainable Development Goal (SDG) indicators and compilation of SDG indicators.
▪ Development of data and indicators on disaster risk reduction and management and vulnerability.
▪ Generation of local-level and sectoral statistics on disaster and vulnerability.
Application of GIS/GIM / remote sensing and other appropriate ICT tools in aid of ENR data
generation. ▪ Determination of biomass and carbon sequestration
using Remote Sensing.
▪ Development of a geospatial database management system for completed vulnerability assessment projects.
▪ Update and mapping of forest cover under the Data Management including System Development and Maintenance Program.
Development and improvement of an ENR
statistics web portal for data sharing among ENR data producers and stakeholders, improved
information validation and diffusion. ▪ Enhancement of Management Information System
(MIS) (Network, Website and LAN) for ERDB.
▪ ENR statistical data for the stakeholders (academe, government organizations, students, researchers, among others).
▪ Statistical Service Information System (SSIS) for the FMB.
▪ Updating of Foreshore Area Management Information System (FAMIS) of LMB.
▪ Enhancement/Upgrading of National Water Information Network and maintenance thereafter.
▪ Development of online systems for the EMB.
▪ Forest resource assessment under the Data Management including System Development and Maintenance Program.
Development of statistical reports, publications and analytical papers on ENR and related
concerns. ▪ Compilation, production and distribution of
Protected Areas and Wildlife Resources Statistical Yearbook.
▪ Compilation and publication of the Compendium of Philippine Environment Statistics (CPES).
▪ Data verification and publication of results of the cadastral survey program of the LMB.
Training for and consultation fora with
environmental and local development planners,
policy makers, ENR program implementers/law enforcers, academe, environmental advocacy
groups, local communities, among others. ▪ Fora on PhilWAVES and its outputs.
Adoption of updated/new international ENR statistical frameworks, standards and
classification systems. ▪ Development of Philippine Disaster Statistics
Framework.
❖ SDPs supporting the generation of the RRM indicators
Table 19. SDPs supporting the generation of RRM Indicators on Environment and Natural Resources.
Statistical Development Programs
RRM Indicators PSDP Disaggregated
Data
Update/generation of forest resource product statistics; Land classification survey and mapping under the Management of Forestland and Forest Resources (FMB, NAMRIA, LMB)
Open and denuded forest land area reduced by 1.5 million ha (including 2012)
National, Regional levels
Conduct/updating of survey and registration of protected area occupants under Protected Area Management Program (PAWB)
Protected forest land/area increased by 1.1 million ha
National, Regional levels
Installation and implementation of Biodiversity Monitoring System (BMS) under the Protected Area Management Program (PAWB)
Biodiversity protection and conservation improved: • Extinction of threatened species of wild
fauna prevented
• Extinction of threated species of wild flora prevented
• Population of Philippine Eagle increased
• Population of Philippine Tamaraw increased
• Population of Philippine Cockatoo
National Level
Land classification survey and mapping under the Management of Forestland and Forest Resources (FMB)
Coastal and marine resources management enhanced: Terrestrial protected areas
National Level

104
Conduct of assessment/inventory of coastal and marine habitat and resources (DENR)
Marine protected areas National Level
Monitoring of hazardous waste generation under the Ecological Solid Waste Management Program (EMB) Database on land records and surveys (LMB)
Land administration and management improved: Land degradation hotspots with developed sustainable land management (SLM) practices (in ha)
National Level
Database on land records and surveys (LMB)
Number of beneficiaries with secured land tenure in public agricultural A&D lands Number of beneficiaries with secured land tenure in residential lands zoned as residential areas
National Level
Monitoring/evaluation of mineral statistics (MGB)
Rehabilitation of abandoned mines improved
Selected areas: Bagacay Mine rehabilitated
Antamok Mine risk assessment Black Mountain risk
assessment Consolidated Mine Inc. risk
assessment Dizon Mine risk assessment Basay Mine risk assessment
Monitoring and assessment of air quality under Clean Air Program (EMB)
Air pollution in Metro Manila and other major urban centers reduced
Selected areas: NCR
Alaminos City San Fernando City
Saluysoy Cabanatuan
San Fernando, Pampanga Iriga City
Panganiban Drive Mandaue City (Baricuatro Res)
Zamboanga City: Stn. II Zamboanga City: Stn. IV Zamboanga City: Stn. VII
Davao City Stn. 8
Monitoring and assessment of principal rivers and water bodies nationwide under the Clean Water Program (EMB)
Water quality of priority river systems improved (by BOD water criteria: Class C <= 7mg/L; Class D.7mg/L &>=10mg/L
Selected areas: Meycauayan River
Marilao River Bocaue River
Ylang - ylang River Imus River
Calapan River Iloilo River Balili River
Parañaque River Pasig River
Marikina River San Juan River
Monitoring and assessment of principal rivers and water bodies nationwide under the Clean Water Program (EMB)
BOD level of other priority rivers already within the water quality criteria sustained (in mg/L)
Selected areas: Anayan River Malaguit River Paniqui River Luyang River
Sapangdaku River Cagayan de Oro Pampanga River
Angat River
Policy Uses
❖ Assessing the ecosystem’s vulnerability to hazards due to climate change, forms important
decision tools towards better management of
natural resources as well as minimize risk to environmental disasters.
❖ Will enable the development of a Groundwater Management Plan to formulate adaptive
groundwater regulation policies and
groundwater management program/strategies to ensure sustainable use of groundwater for
present and future needs of water without compromising the health of the environment.

105
Chapter 23 – Science and technology and innovation statistics
Introduction
Science and Technology and Innovation (STI) are
key to the country’s economic and social progress. Traditionally, STI are viewed as sources of new
knowledge, products, and services that benefit the economy and society. In recent years, STI is
increasingly viewed as key solution providers
towards addressing many of society’s challenges, such as speeding up industrial development,
slowing down, if not combating, environmental degradation and resource depletion, promoting
sustainable agriculture, developing renewable energy, reducing and managing disaster risks,
addressing impact of climate change, and
narrowing social and economic gaps.
In line with the goals of the PDP 2011-2016, the STI
sector commits to contribute a higher share to GDP
through investments in S&T education and health, improvement in governance, research and
development (R&D), and S&T policies. It shall implement the National Science and Technology
Innovation Plan (NSTIP) to address challenges in
key result areas of R&D, technology transfer, human resource development, S&T innovation and
promotion, information dissemination and advocacy, and networking.
This chapter aims to strengthen the STI statistical
data system to address information needs for the monitoring and evaluation of STI goals and targets
in the NSTIP, PDP, and emerging development concerns.
Situational Analysis
❖ Key developments in 2011 – 2015
Survey on Research and Development
Expenditures and Human Resources. The
Survey on Research and Development Expenditures and Human Resources is conducted every two years by the Department of Science and Technology (DOST) to collect data on R&D activities that will serve as evidence for R&D policymaking, to update R&D indicators and to enable benchmarking against other countries. The sectors covered in the survey are the government, higher education institutions, private sector, and non-profit institutions. The former National Statistics Office (NSO) implemented the survey covering the private sector.
During the period under review, the 2011 and 2013 surveys on R&D were conducted. Aside from national level estimates, regional level data were also generated in partnership with the DOST regional offices.
Enhancement of the generation of STI statistics/indicators. ▪ Estimation of the stock human resources in
science and technology in the Philippines was undertaken as a benchmark study of the Science Education Institute (SEI) from 2011 to 2014. The resulting estimates were based on secondary/census data of the former NSO.
▪ The Intellectual Property Office of the Philippines (IPOPHL) generated and posted on its website, statistics concerning Intellectual Property (IP) Enforcement.

106
Conduct of studies for the development/
improvement of STI indicators. ▪ The Tracer Study of DOST-Scholar Graduates
was implemented starting in 2011 by the DOST-SEI and the Philippine Council for Agriculture, Forestry and Natural Resources Research and Development (PCARRD). This study is aimed at tracking the scholar-graduates of the various scholarship programs being implemented by the DOST-SEI with the ultimate objective of determining the impact of these programs to individual and/or national development. It seeks to assess the effectiveness of the scholarship programs being implemented by the DOST-SEI.
▪ The Migration of Science and Technology (S&T) Manpower was a project completed in 2011 by
DOST-SEI with the Philippine Overseas Employment Administration (POEA) and the Commission on Filipinos Overseas (CFO).
▪ The establishment of the Philippine Journal Citation Index Database (PJCID) was undertaken by the Ateneo de Naga University from 2011 to 2012 with funding from the Commission on Higher Education (CHED). The PJCID is a database that indexes the citations of research articles published in Philippine journals.
Updating and publication of the Compendium
of Philippine S&T Statistics and Indicators. The Compendium of Philippine S&T statistics and indicators was updated by the DOST in 2012, in cooperation with all knowledge and S&T institutions. It is a compilation of the latest statistics on R&D expenditures and human resources in the country based on the results of the Survey on R&D Expenditures and Human Resources. It also contains Intellectual Property Rights (IPR) statistics and competitiveness and innovation rankings of the Philippines taken from the International Institute for Management Development (IMD)'s World Competitiveness Report and the World Economic Forum (WEF)'s Global Competitiveness Report. The Compendium is updated regularly according to the latest data available from the most recent surveys.
Conduct of fora on the results of the Survey on Innovation Activities. The Survey on
Innovation Activities (SIA) was conducted in 2010 by the former NSO for DOST in order to establish baseline information on innovative activities of establishments for the mainstreaming of innovation-system approach into the center stage of national policymaking. The survey gathered information on innovative behavior of establishments in selected Philippine areas and industries to determine the factors that drive their innovation performance. Fora on SIA results were held in 2012 in the following areas: National Capital Region (NCR) for Luzon, Cebu for Visayas, and Davao for Mindanao.
Development and improvement of statistics
web portal for STI statistics. In order to
consolidate all relevant data and information resources on STI, the DOST in partnership with the concerned agencies, implemented the following activities: (a) development of S & T and innovation statistics portal, (b) design/ conceptualization of a prototype S&T data archives/warehouse, (c) development of website for the Innovation Survey Project, and (d) inclusion of basic statistics/data in websites of institutions.
Conduct of training and capacity building programs. The DOST implemented the following
activities: (a) human resources development program, (b) provision of scholarship grants on
statistics including non-degree training courses, and (c) attendance to statistical courses/training.
❖ Issues and Concerns
Delayed/low returns of data collection instruments, such as R&D surveys, CHED
forms for higher education institutions (HEIs) and Tracer Survey of DOST-Scholar
graduates.
Need to assess data from other sources,
particularly from administrative-based records.
Need to explore the generation of other relevant STI statistics and indicators.
Lack of statistical positions in some S&T-related agencies.
Need to improve business processes in statistics of IPOPHL in terms of effectiveness
and efficiency to address key quality issues.
Statistical Programs for 2016 and 2017
Major activities in the sector include the conduct of the 2015 Survey on Research and Development
Expenditures and Human Resources and the SIA. Another major activity is the Business Intelligence
(BI) Systems Development Phase 2 for data on
intellectual property enforcement, products expenditures, etc.
Other activities to be undertaken:
Improvement of STI-related surveys and conduct of new ones. ▪ Revision of forms used in the Tracer Study of
the DOST-SEI.
Maximized use of administrative reporting
forms for the generation of STI statistics/indicators. ▪ Compilation of data on Government Budget
Allocation for R & D (GBOARD) based on

107
Department of Budget and Management’s (DBM) Unified Accounts Code Structure (UACS).
▪ Updating of Pre-Industrial Property Automation System (IPAS) Patent Database.
▪ Updating of the Research Management Information System (RMIS).
▪ Development and implementation of the CHECKS.
Conduct of studies for the
improvement/development of STI indicators. ▪ Tracer Study of the DOST – Scholar Graduates:
An Initial Report.
Support for automation of collection,
processing and dissemination of STI statistics.
▪ Improvement of S&T and innovation statistics portal.
▪ Upgrading of ICT resources with new and modern web-based applications, hardware and software requirements.
Strengthening of statistical capacities of S&T
manpower. ▪ Provision of scholarship grants on statistics
including non-degree training courses by the DOST-SEI.
▪ Attendance to statistical courses/training in partnership with the Philippine Statistical Research and Training Institute (PSRTI).
❖ SDPs supporting the generation of the RRM indicators
Table 20. SDPs supporting the generation of RRM Indicators on STI statistics.
Statistical Development Programs RRM Indicators PSDP
Disaggregated Data Conduct of Perception Survey of Executives on Innovation Activities (MBC in coordination with NEDA)
Philippine innovation index in the WEF Global Competitiveness report improved
National, selected areas; major sectors; type of
establishment
Development of Business Intelligence (BI) Systems Phase 2 (IPOPHIL)
Intellectual property products expenditures increased
National level
Policy Uses
The STI statistics generated from the various programs will be essential in the formulation of
policies and programs for science, technology and
innovation toward improving productivity in the country.

108

109
7 – Governance, peace, and
security

110
Chapter 24 – Governance statistics
Introduction
Good governance is widely regarded as the
collective responsibility of the government, civil
society, and the private sector in improving the lives of the people, especially the poor. It has long been
recognized that good governance is key to attaining society’s development goals.
The PDP 2011-2016 acknowledges that good
governance should set the normative standards of development as it fosters participation, ensures
transparency, demands accountability, promotes efficiency, and upholds the rule of law in economic,
political, and administrative institutions and
processes.
As the need for governance and development
intensifies, the demand for comprehensive, objective, reliable and up-to-date governance
statistics increases and becomes more urgent.
This chapter identifies the priority statistical programs and activities in the medium-term, which
are geared towards mainstreaming the generation
of governance statistics in the Philippine Statistical System (PSS) to promote social accountability and
good governance through more evidence-based policy and decision-making in the country.
Situational Analysis
❖ Key developments in 2011 – 2015
Training on Local Governance Performance Management System (LGPMS). Conducted by
the Bureau of Local Government Supervision – Department of Interior and Local Government (BLGS-DILG), the LGPMS is an assessment and a
web-based development management tool for provinces, cities and municipalities capable of providing information on the capacities and limitations of local government units (LGUs) in the delivery of essential public services. It aims to provide results-oriented information concerning levels of LGU management capacity, service delivery and state of development from which may evolve decisions or actions to optimize investments or resources; establish LGU performance benchmarks; and generate strategic
data for local and national policy development and serves as the operational platform on the Seal of Good Governance (SGLG).
Conduct of the assessment and performance evaluation of provinces, cities and
municipalities relative to compliance to Full Disclosure Policy of the Government.
Conduct of Citizen Satisfaction Index Survey.
Conduct of Satellite Registration of Voters and Document Management System for the
Digitization Project of the Commission on
Elections (COMELEC).
Implementation of the Complaint and Case
Monitoring System (CCMS). The CCMS is a new
system that runs on a centralized environment and provides an integrated online facility for tracking case status. The system also automates the processing, generation, and consolidation of statistical and ad-hoc reports based on encoded data.

111
Inclusion of rider questions on actual
experience with corruption in the 2013 Annual Poverty Indicators Survey (APIS). Questions on actual experience with corruption were incorporated in the 2013 APIS conducted by the former National Statistics Office (NSO) as requested by the Office of the Ombudsman. Unlike most domestic and international surveys on corruption conducted in the Philippines, the Ombudsman questions sought to measure the extent or pervasiveness of petty or bureaucratic corruption, in particular, bribery or facilitation payment, in the public sector in the Philippines based on respondents’ actual experience.
Launching of the 5-Year National Anti-
Corruption Framework. December 2015 marked
the launching of the 5-Year National Anti-Corruption Framework (NACF), developed by the Office of the Ombudsman in cooperation with the Constitutional Commissions, Civil Society Organizations, Civil Servants, Private Sector, and Citizens of the Philippines. Through this multi-year national anti-corruption framework initiative, a common vision was set to have:
“A Corruption-Intolerant Philippine Society A Culture of Disclosure in State Agencies and the
Private Sector A Non-Partisan Civics Campaign of Citizens, Civil
Servants, and Oversight Agencies for Integrity, Accountability, and Good
Governance”
Monitoring of the disposed cases of the Sandiganbayan.
Implementation of the Performance Based Incentive System for Government Employees
under Executive Order No. 80 series of 2012 which includes good governance conditions
among the pillars of the system.
Offering of academic courses where
governance and governance metrics and
statistics were discussed, analyzed and researched in the University of the Philippines
National College of Public Administration and Governance (UP-NCPAG).
Conduct of ten sessions of NCPAG Research Colloquium. The research colloquium serves as a
venue for students of the College to present their research to and receive feedback from experts and peers which involves the use and analysis of governance and socio-economic statistics and indicators.
Maintenance of UP-NCPAG Library Collection
of Government Statistical Reports for use of
the students and other researchers.
Establishment of the Interagency Committee
on Governance Statistics (IACGS).
❖ Issues and Concerns
The key issues and challenges identified regarding the governance statistics are as
follows:
Poor dissemination of the few available statistics.
Very limited utilization of data, both at the national and local levels.
Lack of statistical coordination and weak
interagency linkages.
No official recognition of delineation of
responsibilities in generating governance statistics.
Need to improve and develop systems for data generation and bridge data gaps among
government agencies producing governance statistics.
Weak appreciation of governance statistics by policymakers, including local chief executives.
No official statistical framework and appropriate statistical standards and policies
to guide the development of governance
statistics.
Need to develop technical knowledge/
skills/competencies of personnel concerned in government agencies (statistical research
and capacity building).
Need to convert statistical data generated to knowledge products for use of relevant
stakeholders.
Need to optimize the use of ICT resources
to support data retrieval/exchange,
dissemination and provide access to users of data.
Statistical Programs for 2016 and 2017
❖ Summary
To address persistent issues and problems in the
production and dissemination of timely, reliable and relevant governance statistics, the following
statistical programs are proposed to be conducted:
Conduct of household-based and
establishment-based Survey on Actual
Experience with Corruption in the Philippines.

112
Zero Backlog Program and the Prioritization
of High-Profile Cases. The Zero Backlog
program seeks to end a culture of delay that erodes public trust and credibility of the Ombudsman process; under the law, the Ombudsman shall give priority to complaints filed against high-ranking government officials and/or those occupying supervisory positions, complaints involving grave offenses as well as complaints involving large sums of money and/or properties.
Regular updating of COMELEC website for publication of official election statistics.
Proposed inclusion of governance indicators such as conviction rate, bribery incidence,
number of newly docketed and pending
criminal, administrative and forfeiture cases disaggregated by Ombudsman area/sectoral
offices, etc. as part of the Philippine Statistics Authority’s (PSA) official statistics on
corruption.
Inclusion of good governance condition
statistics of agencies availing of the
Performance Based Incentive System, particularly the Performance Based Bonus
Scheme.
Resumption of the roll-out of enhanced e-
NGAs and e-Budget Systems by the Commission on Audit (COA) to all
government agencies.
Strengthened implementation and
institutionalization of the Citizen Participatory
Audit.
Continuous conduct of the Training on
LGPMS for LGUs by the BLGS-DILG.
Research on Good Governance Index.
Regular conduct of UP-NCPAG’s Research Congress.
Continuous offering by the UP-NCPAG of academic courses where governance and
governance metrics and statistics are discussed, analyzed and researched on.
Conduct of fora and roundtable discussions
to communicate or draw assessments and
other researches on governance policy reforms and initiatives of the current
administration.
Conduct of appreciation seminar on
governance statistics.
Conduct of capacity building activities that
will further enhance the data generation/ gathering function of the governance-related
agencies as well as to capacitate their
respective staff in statistics.
❖ SDPs supporting the generation of the RRM indicators
Table 21. SDPs supporting the generation of RRM Indicators on Governance Statistics
Statistical Development Programs
RRM Indicators PSDP Disaggregated Data
Support to Open Data Initiative (DBM) Conduct of various campaign activities by the DBM to encourage all Procuring Entities to fully use the Philippine Government Electronic System (PhilGEPS) (DBM) Citizen Satisfaction Index Survey Continued conduct of the Training on LGPMS for local government units (LGUs) (DILG)
Datasets contributed by NGAs to the Open Data Portal (ODP) increased
Proportion of NGAs and GOCCs, and LGUs registered in the PhilGEPS increased (in %)
Cities with Citizen Satisfaction Survey
increased
PCMs conferred with the Seal of Good Local Governance (SGLG) increased
National level
National level
Regional, Provincial levels
Regional, Provincial levels
Full Implementation of the Report Card Survey (RCS) Anti-Red Tape Act (ARTA) (CSC)
High-density service offices passing the Anti-Red Tape Act (ARTA) Report Card
Survey (RCS) increased (in %)
National level

113
Policy Uses Table 22. Policy uses of governance statistical development programs.
Statistical Development Programs Policy Use Conduct of household-based and establishment-based Survey on Actual Experience with Corruption in the Philippines
Measurement of transparency and honesty in government transactions and absence of graft and corruption
Resumption of the roll-out of enhanced e-NGAs and e-Budget Systems by the COA to all government agencies
Monitoring and assessment of transparency and accountability in government accounting and budgeting
Regular conduct of UP-NCPAG’s Research Congress Measurement of the technical knowledge/ skills/competencies on governance and socio-economic statistics/indicators of students
Capture good governance condition statistics of agencies availing of Performance Based Bonus under the Performance Based Incentive System (Executive Order No. 80 series of 2012)
Measurement and monitoring of adherence of government agencies to good governance criteria
Conduct of capacity building activities that will further enhance the data generation/gathering function of the governance-related agencies as well as to capacitate their respective staff in statistics
Measurement of the technical knowledge/ skills/competencies on statistics of government staff

114
Chapter 25 – Peace and security statistics
Introduction
Peace and security, and good governance are important requisites to ensuring the political, social,
and economic growth and stability in the country.
The state of peace and security in the homes, neighborhoods, and communities affects all
individuals and institutions in the society.
The Philippine Development Plan (PDP) 2011-2016 recognizes that a stable national security
environment is crucial in achieving the country’s development, human security, and general welfare
goals. The Plan also emphasizes the national goal to achieve national stability through an appropriate
and adequate response to internal conflicts and
external threats, and for the Philippines to become a responsible partner in promoting peace and good
relations among other nations within a framework of national sovereignty and territorial integrity.
This chapter outlines the major statistical programs
and activities needed to develop and generate peace and security statistics in aid of evidence-
based policy and decisions.
Situational Analysis
❖ Key developments in 2011 – 2015
Accomplishment of the Interagency
Committee (IAC) on Security Sector Statistics (IACSSS) / IAC on Peace and Security
Statistics (IACPSS). The IACSSS, now known as
the IACPSS as per Philippine Statistics Authority (PSA) Memorandum Order No. 02, s. 2016 issued on 22 February 2016, served as forum for the discussion and resolution of statistical issues on
peace and security sector, specifically on the improvement of the generation, dissemination and use of statistics. Some of its significant outputs were as follows: ▪ Approved definition and statistical framework
for the security sector thru National Statistical Coordination Board (NSCB) Resolution No. 006, Series of 2013 issued on 15 May 2013;
▪ Approved concepts and definitions for statistical purposes for the security sector – Batch 1, thru NSCB Resolution No. 009, Series of 2013 issued on 23 August 2013;
▪ Inputs to the review and analysis of Sustainable Development Goals (SDGs), particularly Goal 16 – Peace and Justice, and its corresponding targets and proposed indicators; and
▪ Inputs to the following statistical activities spearheaded by the United Nations Office on Drugs and Crime (UNODC): - United Nations Survey on Crime Trends and
Operations of Criminal Justice Systems (UN-CTS). The UN-CTS is an annual undertaking conducted by the UNODC aimed at collecting data on the incidence of reported crime and operations of criminal justice systems with a view to improving the
knowledge of global trends on crime and criminal justice.
The Philippines, thru the IACPSS, is one of the regular participants of the survey. Concerned IAC member agencies and other relevant institutions compiling crime and criminal justice statistics were requested to accomplish the regular sections as well as special modules of the UN-CTS questionnaire.
The former NSCB was appointed as the UN-CTS Focal Point for the Philippines to

115
coordinate the timely, consistent and accurate response of survey respondents.
- International Classification of Crime for Statistical Purposes (ICCS). The ICCS is a hierarchical classification where criminal offenses are allocated into categories that have certain degree of similarity in relation to conceptual, analytical and policy areas. Its purpose is to enhance consistency and international comparability of crime statistics and improve analytical capabilities at both the national and international levels. Likewise, the ICCS aims to provide a common classification framework for data sources (administrative records and statistical surveys). It also serves as an essential tool for harmonizing the collection and dissemination of crime statistics; thereby, presenting a better understanding of crime patterns and trends worldwide.
The Philippines, thru the IACPSS, participated in the following ICCS-related activities, namely: (a) drafting and final testing of the ICCS which aimed at reviewing global applicability of the proposed crime classification for all national statistical systems; and (b) development of a manual for the implementation of the international crime classification.
Conduct of the 2012 Crime Victimization Survey (CVS). The 2012 CVS was conducted as
a rider to the October 2012 round of the Labor Force Survey (LFS) by the former National Statistics Office, with funding assistance from the UNODC. The demographic and socio-economic characteristics of the households and the crime victims were taken from the LFS. Using a structured questionnaire, a face-to-face interview with all household members aged 15 years old and over who were victims of crime during the period of study was undertaken.
The survey was designed to measure the prevalence of six selected types of crimes commonly experienced by the victims: vehicle theft, burglary, robbery, personal theft, sexual incidents, and assault/threat. Likewise, it aimed at providing data on the nature of crimes that are not reported to the police and
reasons for non-reporting, as well as identify problem areas to serve as bases in the formulation of policies to improve crime prevention, protection of victims, and police services.
The research study found that the measured offenses is relatively low in the Philippines; and people generally feel safe both walking unaccompanied in their area or when at home alone at night. It also revealed that a very small percentage of victims cited mistrust of the police as a reason for not reporting crime victimization,
indicating that people trust law enforcement most of the time.
Development of the Philippine National Police
(PNP) Electronic Crime Incident Reporting System (e-CIRS). To establish a uniform
procedure for crime recording, the PNP developed the e-CIRS to be adopted by all police units throughout the country in treating reports of crime incidents, arrests and any other events or activities. The e-CIRS is a stand-alone system capable of real-time monitoring and mapping of crime incidents nationwide designed to facilitate documentation and modernize data storage by presenting a quick, tamper-free and reliable transmission of crime report from the precinct to the police station, to the regional police office, and to the PNP national headquarters. It focuses on the statistics side and categorizes a crime according to its nature while the old police blotter done manually is more of an initial report on the facts of the case.
The e-CIRS Project was launched in September 2011 with National Capital Region (NCR) as pilot area. A 100% full implementation of the system by 2016 is expected.
Improvement of the Philippine judiciary
through court automation. Philippine courts are
burdened with lengthy litigation processes causing docket congestion and delay. To address the problem, the Supreme Court has embarked on a program, with the help of modern technology, designed to replace time-consuming manual record-keeping and case management practices. Funded by the United States Agency for International Development (USAID), the Electronic Court System or e-Courts Project was launched at the Quezon City Regional Trial Court in June 2013, the pilot effort towards the eventual automation of the operations of all courts in the country. The e-Courts is a computer-based system designed to enable trial judges and court personnel to digitally organize, plan and control the flow of cases from filing of complaints to resolution and enforcement.
The e-Court system allows the capture of basic case information as well as tracking and monitoring of cases, down to the issuance of notices of decision and writs of execution. It allows automatic computation of court fees and issues official receipts, corresponding to a generated docket number for new cases. It also allows electronic raffling or assigning of cases which removes human intervention and prevents assumptions of rigging of cases. A calendar of hearings is also a feature of the system that allows judges to view happenings on a daily, weekly, up to an annual basis. Furthermore, the public can also search for cases according to case number, category, or title, and allows monitoring of cases in terms of history or status. The e-Courts can

116
show the status of active and pending cases as well as a notice of overstaying detainees that efficiently reminds the concerned judge or legal entity.
Rationalization and codification of penal laws
and statuses. In line with His Excellency
President Benigno S. Aquino III’s directive to review existing laws to ensure consistency, the Department of Justice (DOJ) constituted the Criminal Code Committee (CCC) thru DOJ Department Circular No. 019 (s. 2011) issued on 20 April 2011.
The Committee was tasked to draft a simplified, responsive and truly Filipino and modern criminal code that consolidates and harmonizes the penal laws and statutes for an effective and efficient administration of criminal justice in the Philippines.
Through regular meetings, focus group discussions (FGDs) / consultations with stakeholders from various sectors, in-depth research and international exchanges, the CCC has completed Book I of the New Criminal Code in October 2012. It contains innovative provisions that address the chronic problems that have beleaguered the criminal justice system since the founding of the Republic.
In December 2013, the Committee has also completed Book II of the New Criminal Code. It deals with specific crimes consisting of three parts, namely: (a) crimes against persons; (b) crimes against property; and (c) crimes against the State.
Establishment of the Monitoring, Reporting and Response System for Grave Child Rights
Violations in Situations of Armed Conflict (MRRS-GCRVSAC). The MRRS-GCRVSAC has
been established thru Executive Order No. 138 (s.2013) issued on 2 August 2013 to act as the monitoring arm within the Interagency Committee on Children in Armed Conflict (CIAC) Program Framework with the primary objective of protecting children in situations of armed conflict by preventing the occurrence of grave child rights violations and ensuring the provision of appropriate and timely response in the event of such violations. The MRRS-GCRVSAC shall likewise generate standard data and information that will serve as the primary source on all matters pertaining to such violations.
The Council for the Welfare of Children (CWC), as focal agency for the MRRS-GCRVSAC, is directed to establish the appropriate coordinative network at the national and local levels.
The MRRS-GCRVSAC shall function as part of the enhanced CIAC Program Framework, specifically: ▪ Gather, validate and monitor reports of
incidences of grave child rights violations (GCRVs) from national government agencies (NGAs), non-government organizations (NGOs),
local government units (LGUs), peoples’ organizations (POs) and faith-based organizations (FBOs);
▪ Ensure provision of appropriate and timely interagency response to GCRVs, through coordination and efficient referral system;
▪ Develop and implement an interagency communication plan on the prevention and response to GCRVs;
▪ Provide reports/updates on the incidence of GCRVs to the CWC Board for policy issuances and program development; and
▪ Generate standard data and information that will serve as a primary government source on all matters pertaining to such GCRVs.
❖ Issues and Concerns The Philippine Statistical System (PSS) is
confronted with various issues and concerns that hinder the implementation of important
statistical programs and activities affecting the
timeliness, accuracy, reliability and relevance of statistics generated. Thus, the key challenges in
the peace and security sector that need to be addressed are as follows:
Weak feedback mechanism within the agency
resulting in discrepancies between data
generated at the provincial, regional and national levels;
Raw data from admin-based records remain unprocessed and are not tabulated;
Most data gathering and processing mechanisms are manual; absence of
validation and audit, and may, therefore, have issues on accuracy, integrity and
redundancy;
Data are available but are not timely or are
not accessible as frequently as required;
Data are available but are not disaggregated
in the desired form;
Concepts and definitions used by crime
reporting agencies vary;
Agencies tasked to collect peace and security
statistics do not have statistical units and/or positions to undertake statistical activities;
and
Personnel involved in the generation, analysis
and dissemination of peace and security statistics need skills development training and
other capacity building programs to enhance
their statistical capabilities.
117
Statistical Programs for 2016 and 2017
❖ Summary Below are the priority statistical programs and
activities that will be pursued to resolve/address the various issues and concerns in the peace and
security sector:
Refinement of initial assessment of statistics being generated by criminal justice agencies. With the initial data assessment done, a more in-depth analysis of the statistical capability of each agency vis-à-vis the generation of statistics will be undertaken. Data collected will be assessed in terms of frequency of availability, level of disaggregation, mode of dissemination, and data source. An evaluation of the existing administrative reporting system will help determine where problems exist relative to data generation and be able to recommend appropriate strategies to improve the current data collection processes of criminal justice agencies.
Formulation of official concepts and
definitions for statistical purposes for peace and security sector – Batch 2 and succeeding
batches. Commonly used terms in statistical work
adopted by crime reporting agencies vary according to their operational usage resulting in data inconsistencies.
The adoption of official concepts and definitions for statistical purposes for peace and security sector aims to achieve the following objectives: (a)
harmonize and standardize terminologies used for comparability and consistency in the generation of official statistics across national and international boundaries; and (b) contribute to the improvement in the generation and dissemination of quality peace and security statistics in aid of policy formulation, program planning and decision making.
Considering its vast scope and coverage, the formulation of official concepts and definitions for statistical purposes for peace and security sector will be done by batch based on the approved statistical framework.
As part of its expected outputs, the IACPSS will come up with a Glossary of Terms on Peace and Security Statistics upon completion of the standardization of concepts and definitions used by criminal justice agencies.
Development of Philippine Standards
Classification of Crime for Statistical Purposes (PSCCS). Pursuant to Republic Act No. 10625,
otherwise known as the “Philippine Statistical Act of 2013”, the PSA is mandated to prescribe uniform statistical classifications and standards in the generation of official statistics for adoption and use by concerned government offices, agencies and instrumentalities. Specifically, it is tasked to
develop, update and maintain statistical classifications to ensure harmonization and comparability of statistics at the local, national and international levels.
To enable the Philippines to obtain a detailed and reliable crime statistics comparable with other countries, mapping of all criminal laws and matching them vis-à-vis the international crime classification or the ICCS, will be undertaken. Upon completion, the development of the PSCCS will follow.
Institutionalization of crime victimization
surveys. Statistical data from police records are
generally considered as the primary source of information on the number of crimes committed in a locality. However, official crime statistical reports do not capture or reflect all crime incidents since these represent only the documented cases brought to the attention of the police authorities; therefore, they do not depict the real crime situation in the country.
Several factors can be attributed for not arriving at an accurate prevalence of crime in the Philippines. One is the fragmented system of crime reporting since victims of crime may report to the barangay, police or to other law enforcement agencies, i.e., the National Bureau of Investigation (NBI), Philippine Drug Enforcement Agency (PDEA), etc. Another factor that contributes to underreporting of crime is non-reporting of victimization. A victim may choose not to report the violation due to personal reasons such as fear for life, fear of reprisal, stigmatization, humiliation, a domestic/family affair, high cost of litigation, and lack of trust in the police/criminal justice system.
To augment and validate data from police records, the institutionalization of crime victimization survey is therefore recommended. This statistical activity and priority statistics/indicators generated from it shall be proposed for designation to ensure government budget allocation for its regular conduct. In this regard, the PSA as the agency mandated to prepare and conduct statistical sample surveys on all aspects of socio-economic life shall include the conduct of CVS in its budget to guarantee availability of statistics that will complement police records.
Enhancement and full implementation of PNP
e-CIRS. The PNP is currently working on the
enhancement of e-CIRS so that it can interface with geographic information system (GIS) application capable of geospatial time series analysis and include multi-functionalities like data visualization, incorporate more modalities of crimes, and generate data/report more quickly and accurately. The enhanced e-CIRS will also be able to incorporate and/or access data from other e-projects of the PNP, i.e., the e-Warrant and e-Rogues Gallery Systems.
118
Amendment of the current Revised Penal
Code (RPC) of 1932 to new PCC. As the final
output of the CCC, Congressman Niel C. Tupas, Jr. filed in Congress on 06 August 2013 endorsing the enactment of the new Philippine Code of Crimes, envisioned to totally replace the outdated Revised Penal Code (RPC) of 1932.
The passage into law of House Bill No. 2300 is expected on or before 2016.
Development of National Justice Information
System (NJIS). In support of broader national
development goal of improved peace and order situation in the country, the NJIS focuses on systems that enhance government capacity to
deter crimes, track down criminals, monitor criminality, and administer justice. Spearheaded by the DOJ, the NJIS is specifically designed to facilitate data sharing/collaboration mechanism among justice sector agencies harnessing the full potentials of information and communications technology towards a holistic approach to crime prevention and resolution.
The NJIS will be implemented through the following three clusters in the justice system: (a) corrections; (b) law enforcement, prosecution and defense; and (c) judiciary, which will be done in phases. Phase 1 of the Project will cover the corrections cluster, composed of the Board of Pardons and Parole (BPP); Bureau of Corrections (BuCor); Bureau of Jail Management and Penology (BJMP); and the Parole and Probation
Administration (PPA). The second phase involves the law enforcement, prosecution and defense cluster, covering the Bureau of Immigration (BI); Dangerous Drugs Board (DDB); National Bureau of Investigation (NBI); National Prosecution Service (NPS); Philippine Drug Enforcement Agency (PDEA); Philippine National Police (PNP); and the Public Attorneys’ Office (PAO). Meanwhile, Phase 3 of the NJIS Project aims for connectivity with the judiciary cluster, consisting of the Court of Appeals (CA); Sandiganbayan; Supreme Court; and all the lower courts.
With the operationalization of the NJIS, it is hoped that the timely, accurate and complete crime information generated from the system can be used in the formulation of crime prevention strategies, policy making and sectoral planning to better address crime and lawlessness.
Linking of development, conflict, and peace
information systems to support the
implementation of the comprehensive peace process. Recognizing the vital role of winning the
peace in attaining holistic national development, the Philippine government is committed in achieving just and lasting peace through a comprehensive peace process geared towards
bringing all armed conflicts to a permanent and peaceful closure. To this end, a two-pronged strategy spearheaded by the Office of the Presidential Assistant on the Peace Process (OPAPP), in close collaboration with different agencies and institutions is laid down as follows: ▪ Negotiated political settlement of all armed
conflicts. OPAPP pursues peace negotiations as the first track in the attainment of a just, comprehensive and enduring peace under the rule of law. Negotiated political settlement is viewed as the primary vehicle to resolve internal armed conflict and social unrest. The Government Peace Negotiating Panels (GPNPs) for negotiations with different rebel groups were established to conduct dialogues and face-to-face discussions with armed groups aimed at putting a peaceful end to the decades-old communist insurgency in the country; addressing the roots of conflict; administering socio-economic reforms; and pushing for an enduring political settlement and cessation of hostilities.
▪ A complementary track to create a conducive environment for peace thru the PAyapa at MAsaganang PamayaNAn (PAMANA) Project. To complement the negotiations of the peace tables, the Philippine government recognizes the need to address the roots of conflict by pursuing a complementary track – the PAMANA Project, its flagship program and framework for peace and development. PAMANA is anchored on the strategy of winning the peace by forging strategic partnerships with national agencies in promoting convergent delivery of goods and services, and addressing regional development challenges in conflict-affected and vulnerable areas. It aims to extend development interventions to isolated, hard-to-reach, conflict-affected communities to ensure that they are not left behind.
The PAMANA Project beneficiaries are identified and selected by geographical zones as follows: Cordillera, Bicol-Quezon-Mindoro, Negros-Panay, Samar Island, Davao-ComVal-Caraga, Central Mindanao, and ZamBaSulTa. Under PAMANA, the situation of an area is studied and analyzed to determine the appropriate interventions to be undertaken because it would depend on what the people exactly need in the community.
OPAPP is mandated to oversee, coordinate and integrate the implementation of the comprehensive peace process. As such, OPAPP performs oversight functions in the operationalization of the PAMANA Project.
In support of the implementation of the comprehensive peace process, initiatives towards the linking of development, conflict and peace information systems shall be undertaken. This integration of development, conflict and peace

119
information systems is integral to enabling conflict-sensitive and peace-promoting planning, programming, implementation, and monitoring and evaluation of interventions in conflict-affected and conflict-vulnerable areas. These initiatives include the following: ▪ Advocating for the disaggregation of
development, conflict and peace datasets up to the municipal and barangay levels to enable more specific analysis of conditions in conflict-affected and conflict-vulnerable areas;
▪ Advocating for the disaggregation and analysis of development, conflict and peace datasets to help protect the rights and promote the interests of members of Most Vulnerable Groups (MVGs), especially women, children, indigenous peoples
(IPs), senior citizens, and persons with disability (PWDs);
▪ Formulating and building a comprehensive database on local development, conflict and peace indicators towards the establishment of a context monitoring system in conflict-affected and conflict-vulnerable areas;
▪ Consolidating datasets on the implementation, monitoring and evaluation of PAMANA across program implementing agencies and local government units; and Consolidating datasets on the implementation, monitoring and evaluation of the NAP-WPS.
❖ SDPs supporting the generation of the RRM indicators
Table 23. SDPs supporting the generation of RRM Indicators on Peace and Security Statistics
RRM Indicators Statistical Development Programs Disaggregation of
Data
Crime volume Electronic Crime Information Reporting System
(e-CIRS) - PNP National, regional,
provincial, by type of crime
Crime solution efficiency rate Electronic Crime Information Reporting System
(e-CIRS) - PNP National, regional,
provincial, by type of crime
Re-offender rate in national prisons National Justice Information System (NJIS) -
DOJ National, regional, by type
of prison facility
Percentage of agency programs related to the peace process capacitated
PAyapa at MAsaganang PamayaNAn (PAMANA) Project - OPAPP
National, regional, by type of program
Number of fully operational monitoring, reporting and response system to address grave child rights violations in situations of armed conflict
Monitoring, Reporting and Response System for Grave Child Rights Violations in Situations of
Armed Conflict (MRRS-GCRVSAC) - CWC
National, regional, by type of assistance provided
Policy Uses
Table 24. Policy uses of peace and security statistical development programs.
Statistical Development Programs Policy Use Electronic Crime Information Reporting System (e-CIRS) – PNP
To facilitate documentation and modernize data storage by presenting a quick, tamper-free and reliable transmission of crime report
National Justice Information System (NJIS) - DOJ To facilitate data sharing/collaboration mechanism among justice sector agencies harnessing the full potentials of information and communications technology towards a holistic approach to crime prevention and resolution
PAyapa at MAsaganang PamayaNAn (PAMANA) Project - OPAPP
To improve socio-economic condition of people in conflict-affected areas by providing infrastructure development and focused delivery of basic social services
Monitoring, Reporting and Response System for Grave Child Rights Violations in Situations of Armed Conflict (MRRS-GCRVSAC) - CWC
To promote and protect child rights against abuses committed in situations of armed conflict; and To fulfill international commitment of the Philippines as a State Party to the United Nations Convention on the Rights of the Child (UN-CRC)

120
Appendix
Planning Committees
PSA Executive Board
Chairperson Undersecretary Laura Q. del Rosario, DFA Undersecretary Cerefino S. Rodolfo, DTI Secretary Manuel F. Esguerra, Director Undersecretary Lilibeth U. David, DOH Undersecretary Angela E. Ignacio, GCG General (DG), NEDA (starting Feb. 2016) Undersecretary Austere A. Panadero, Deputy Governor Diwa C. Guinigundo, Former Secretary Arsenio M. Balisacan, DILG BSP NEDA (May 2012 - January 2016) Undersecretary Zabedin M. Azis, DOJ Exec. Director Marissa G. Legaspi, TESDA Members Undersecretary Pio Lorenzo F. Batino, Exec. Director Zita VJ. Albacea, PSRTI Undersecretary Segfredo R. Serrano, DA DND Director Maria Teresita M. Semana, CHED Undersecretary Felix Perry A. Villanueva, Undersecretary Maria Catalina E. Cabral, Dr. Dennis S. Mapa, PSAI DAR DPWH Asst. Secretary Katherine B. Brimon, Undersecretary Reynaldo Antonio D. Undersecretary Rowena Cristina L. DOLE Laguda, DepEd Guevara, DOST Asst. Secretary Rolando Cañizal, DOT Undersecretary Raul B. Aguilos, DOE Undersecretary Florita R. Villar, DSWD Gov. Alfonso V. Umali, Jr., ULAP Undersecretary Ernesto D. Adobo, Jr., Undersecretary Catherine Jennifer P. Dr. Ana Maria L. Tabunda, Pulse Asia DENR Gonzales, DOTC Research, Inc. Undersecretary Gil S. Beltran, DOF
Technical Committee on Population and Housing Statistics
Chairperson Members Sector Specialists/Coordinators Dr. Mercedes B. Concepcion, NAST Dr. Nimfa B. Ogena, UPPI ANS Minerva Eloisa P. Esquivias, PSA Vice-Chairpersons Dr. Maria Midea M. Kabamalan, UPPI Mr. Guillermo N. Lipio, PSA Dr. Grace T. Cruz, UPPI Dr. Socorro D. Abejo, Consultant Ms. Nelia R. Marquez, Consultant Ms. Jeanette E. Cruz, HUDCC
Technical Committee on Poverty Statistics
Chairperson Dr. Jose Ramon G. Albert, PIDS Sector Specialists/Coordinators Dr. Celia M. Reyes, PIDS Dr. Rosemarie G. Edillon, NEDA Ms. Bernadette B. Balamban, PSA Co-Chairperson Mr. Patrocinio Jude H. Esguerra III, NAPC Ms. Mildred B. Addawe, PSA Dr. Lisa Grace S. Bersales, PSA Dr. Arturo Y. Pacificador, Jr., DLSU Members Undersecretary Florita R. Villar, DSWD Exec. Director Zita VJ. Albacea, PSRTI Dr. Romulo A. Virola, Consultant
Technical Committee on Macroeconomic Accounts
Chairperson Acting Deputy Director Marriel M. Ms. Corazon R. Buenaventura, Consultant Asst. Secretary Maria Teresa S. Habitan, Remulla, BSP ANS Vivian R. Ilarina, PSA DOF Dr. Dennis S. Mapa, UPSS Vice-Chairperson President Michael M. Alba, FEU Sector Specialists/Coordinators Deputy DG Rosemarie G. Edillon, NEDA Dr. Romulo A. Virola, Consultant Mr. Mark C. Pascasio, PSA Members Mr. Tomas P. Africa, Consultant Mr. Raymundo J. Talento, Consultant Dir. Rosabel B. Guerrero, BSP
Technical Committee on Price Statistics
Chairperson Mr. Raymundo J. Talento, Consultant Ms. Maura S. Lizarondo, Consultant Dr. Ma. Cyd Tuaño-Amador,Consultant Mr. Josephine C. Palima, DTI Ms. Rosie B. Sta. Ana, Consultant Members DDG Rosemarie G. Edillon, NEDA Sector Specialists/Coordinators Dr. Romulo A. Virola, Consultant Ms. Jamie-Lyn D. Jamias-Garcia, NWPC Ms. Ermina V. Tepora, PSA Dir. Rosabel B. Guerrero, BSP Chairman Bansan C. Choa, SHDA
Technical Committee on Statistical Standards and Classifications
Chairperson Secretary Ismael D. Sueno, DILG Mr. Vicente M. Querol, TC DNS Josie B. Perez, PSA Secretary Vitaliano N. Aguirre II, DOJ Ms. Adeline T. De Castro, DOLE Vice-Chairperson Chairman Marilou P. Mendoza, TC Sector Specialists/Coordinator Secretary Ramon M. Lopez, DTI Secretary Silvestre H. Bello III, DOLE ANS Candido J. Astrologo, Jr., PSA Mr. Senen M. Perlada, EMB Mr. Reynaldo R. Cancio, NEDA Ms. Severa B. De Costo, PSA Members Mr. Francisco R. Cruz, DILG Deputy General Ernesto M. Pernia, NEDA Mr. Ryan C. Thomas, DOJ

121
Interagency Committee on Agriculture Statistics
Dir. Mercedita A. Sombilla, NEDA Mr. Zaldy P. Perez, BFAR Sector Specialists/Coordinators Dir. Asis G. Perez, BFAR Engr. Francia M. Macalintal, PCAF Ms. Ermina V. Tepora, PSA Exec. Director Ariel T. Cayanan, PCAF Ms. Sarah Bales, PCAF Ms. Elizabeth B. Cabrera, PSA Ms. Leonisa J. Manippon, DA-PRS Ms. Grace F. Pastores, DA-PRS Ms. Reinelda P. Adriano, PSA DG Ronald R. Golding, SEPO Mr. Peter Anthony S. Turingan, SEPO Ms. Maria Carol G. Duran, PSA Mr. Nheden Amiel D. Sarne, NEDA Mr. Paolo Neil S. Navata, SEPO
Interagency Committee on Education and Culture Statistics
Chairperson Members Ms. Marichu G. Tellano, NCCA Asst. Secretary Jesus Lorenzo R. Mateo, Exec. Director Marissa G. Legaspi, TESDA Ms. Sheryl Ann Usares, NCCA DepEd Mr. Gregorio Atienza, CHED Mr. Anthony V. Coloma, COCOPEA/CEAP Ms. Lourdes F. Castante, TESDA ANS Wilma A. Guillen, PSA Vice-Chairpersons Ms. Ursula A. Mendoza, TESDA Sector Specialists/Coordinators Dir. Maria Teresita M. Semana, CHED Mr. Edgardo S. Aranjuez II, NEDA Ms. Carmelita H. Destreza, PSA Ms. Marietta C. Atienza, DepEd Ms. Susan M. Carandang, NEDA Mr. Anthony B. Abalos, PSA
Interagency Committee on Environment and Natural Resources Statistics
Chairperson Members Undersecretary Alexander P. Pama, Undersecretary Ernesto D. Adobo, Jr., ANS Vivian R. Ilarina, PSA NDRRMC DENR Asst. Secretary Joyceline A. Goco, CCC
Co-Chairperson Dir. Merecedita A. Sombilla, NEDA Sector Specialists/Coordinators Exec. Director Alfredo Mahar A. Lagmay, Dr. Flaviana D. Hilario, PAGASA Mr. Edward Eugenio P. Lopez-Dee, PSA Project NOAH Dir. Anna Liza F. Bonagua, CSEE, DILG
Interagency Committee on Gender Statistics
Chairperson Members Ms. Gemma Macatangay, DTI Exec. Director Emmeline L. Verzosa, DNS Josie B. Perez, PSA PC Supt. Rosauro V. Acio, PNP TESDA ANS Wilma A. Guillen, PSA Co-Chairperson Dir. Rhodora G. Alday, DSWD Sector Specialists/Coordinators Dir. Erlinda M. Capones, NEDA Mr. John William R. Lucero, DTI Ms. Anna Jean G. Casañas, PSA
Interagency Committee on Health and Nutrition Statistics
Chairperson Dir. Crispinita A. Valdez, DOH Dr. Enrique A. Tayag, DOH Undersecretary Lilibeth C. David, DOH Dir. Irma L. Asuncion, DOH Ms. Frances Rose Elgo-Mamaril, DOH Co-Chairperson Ms. Hygeia Ceres Catalina B. Gawe, NNC Dr. Agnes B. Segarra, DOH Dr. Cecilia Cristina Santos-Acuin, FNRI Exec. Director Juan Antonio A. Perez III, Members POPCOM Sector Specialists/Coordinators ANS Wilma A. Guillen, PSA Prof. Ofelia Saniel, UPCPH Ms. Racquel Dolores V. Sabeñano, PSA
Interagency Committee on Information and Communications Technology Statistics
Chairperson Ms. Maria Crispina S. Reodica, DTI Sector Specialist/Coordinators Mr. Philip A. Varilla Mr. Efren R. Cabanlig, NTC Ms. Simonette A. Nisperos, PSA Co-Chairperson Ms. Geraldine Marcial, IBPAP Ms. Maria Lourdes A. Yaptinchay, DTI Ms. Brenda Joyce R. Mendoza, NEDA Members Ms. Anna Lee M. Fos, TUCP Ms. Rosabel Guerrero, BSP
Interagency Committee on Investments Statistics
Chairperson Ms. Lorna Alden, PEZA Ms. Matilde Lim, SEC DNS Romeo S. Recide, PSA Exec. Director Efren Leaño, BOI Sector Specialist/Coordinators Vice-Chairperson Ms. Brenda Joyce R. Mendoza, NEDA Mr. Eduardo Sanguyo, PSA Dr. Rosabel B. Guerrero, BSP Mr. Virgilio Salentes, SEC Ms. Cynthia A. Regalado, Consultant Members Mr. Antonio Balneg, BSP Ms. Alma A. Bello, PSA ANS Vivian R. Ilarina, PSA Ms. Ma. Theresa Bersabal, SEC
Interagency Committee on Peace and Security Statistics
Chairperson OIC-Asst. Dir. Cynthia A. Villena, NEDA Mr. Erwin D. Ocson, SC Asst. Secretary Roy O. Deveraturda, DND Ms. Ana Francesca M. Villareal, NEDA ANS Wilma A. Guillen, PSA Vice-Chairperson Ms. Ma. Monica P. Pagunsan, DOJ
Ms. Fresita S. Araneta, NEDA Ms. Donna Lynn A. Caparas, NAPOLCOM
Sector Specialist/Coordinators Ms. Rosalinda A. Garcia, PSA
Members Ms. Teresita A. Lorenzo, NAPOLCOM Ms. Marietta V. Gumela, PSA Dir. Francisco R. Cruz, DILG Dir. Randee C. Cabaces, OPAPP Ms. Luzviminda S. Mitra, Consultant Ms. Maria Racquel A. Martinez, DILG P/Dir. Benjamin B. Magalong, PNP Dir. Christine June P. Cariño, DND Ms. Amelia A. Nieda, PNP Mr. Ryan C. Thomas, DOJ Ms. Susana M. Luber, SC

122
Interagency Committee on Science and Technology Statistics
Chairperson Ms. Josette T. Biyo, DOST Sector Specialist/Coordinators Undersecretary Rowena Cristina L. Guevara, DOST
Ms. Carmen G. Peralta, IPOPHIL Mr. Eric T. Lanado, IPOPHIL
Ms. Alma A. Bello, PSA Ms. Cynthia A. Regalado, Consultant
Vice-Chairperson Mr. Nepoleon K. Juanillo, Jr., CHED ANS Vivian R. Ilarina, PSA Mr. Arnel D. Abanto, DAP Members Ms. Therese T. Estella, DOST Mr. Bernie S. Justimbaste, DOST
Interagency Committee on Social Protection Statistics
Chairperson Mr. Lemuel T. Untalan, PHIC Ms. Emmalyn L. Baylon, BWSC Undersecretary Florita R. Villar, DSWD Ms. Eleonora Y. Cinco, SSS Ms. Mylene H. Lorica, SSS Co-Chairperson Ms. Severina L. Resurreccion, GSIS Ms. Racquel G. De Leon, OCD Dir. Erlinda M. Capones, NEDA Mr. Edgardo J. Ollet, OCD Ms. Maria Luz R. Anigan, SWP Members Mr. Rene A. Raya, SWP Sector Specialist/Coordinators ANS Wilma A. Guillen, PSA Ms. Cynthia B. Lagasca, DSWD Ms. Rosalinda A. Garcia, PSA Dir. Nikkin L. Beronilla, NAPC Ms. Girlie Grace J. Casimiro, NEDA Mr. Charles Van T. Miraflores Dir. Ahmma Charisma L. Satumba, BWSC Mr. Patrocinio Jude H. Esguerra III, NAPC Mr. Michael Leon F. Taningco, PSA
Interagency Committee on Tourism Statistics
Chairperson Dir. Milagros Y. Say, DOT Sector Specialists/Coordinators Dir. Manuel Gotis, BLGS-DILG Mr. Eduardo Sanguyo, PSA Co-Chairperson Dir. Brenda Joyce R. Mendoza, NEDA Ms. Cynthia A. Regalado, Consultant ANS Vivian R. Ilarina, PSA Ms. Rosanna Fores, Tourism Congress Ms. Stephanie Rose Moscoso, PSA Members Ms. Cherry Lyn S. Rodolfo, REID Dir. Rosabel B. Guerrero, BSP
Interagency Committee on Trade and Industry Statistics
Chairperson ANS Vivian R. Ilarina, PSA Sector Specialists/ Coordinators DDG Rosemarie G. Edillion, NEDA Dir. Jaime Taborda, BOC Ms. Julieta P. Soliven, PSA Co-Chairperson Exec. Dir. Emmarita Z. Mijares, EDC Dir. Rosabel B. Guerrero, BSP Ms. Ma. Veronica F. Magsino, PEZA Members Dir. Senen M. Perlada, DTI ANS Dulce A. Regala, PSA Asst. Dir. Amelia A. Menardo, NEDA
Resource Persons in PSDP Consultative Workshops
ADG Rosemarie G. Edillon, NEDA Ms. Victoria N. Navida, DSWD Asec. Bresilda M. Gervacio, DENR Ms. Virginia N. Gañac, PSRTI Dr. Maria Fe M. Mendoza, UP NCPAG Asec. Jesus Lorenzo R. Mateo, DepEd Exec. Dir. Philip A. Varilla, ICTO DNS Romeo S. Recide, PSA Dr. Lilibeth C. David, DOH Ms. Rosabel B. Guerrero, BSP Asec. Rolando Cañizal, DOT Dr. Mercedes B. Concepcion Atty. Jamie-Lyn D. Jamias, NWPC Dir. Bernie Justimbaste, DOST DNS Estela T. De Guzman, PSA Ms. Celia M. Reyes, Ph. D., PIDS Ms. Ermina V. Tepora, PSA Exec. Dir. Emmeline L. Verzosa, PCW Mr. Manuel L. Laopao, Consultant Dir. Emma E. Hizon, DOTC Dir. Ma. Monica P. Pagunsan, DOJ Dir. Jesus L. Tamang, DOE
PSDP Consultants and Advisers
Consultant PSA Adviser Ms. Lina V. Castro NS Lisa Grace S. Bersales Ms. Regina S. Reyes DNS Josie B. Perez Ms. Rosario Manasan, MTEF Adviser ANS Candido J. Astrologo, Jr.
PSDP Secretariat and Support Lead Ms. Sardis M. Catalan Ms. Willi Krizzia May G. Oracion Ms. Lotis I. Ira Ms. Gean Obvidenci B. Ceñidoza Mr. Dennis E. San Diego Staff Member Ms. Rubelyn Q. Atienza Ms. Carmelita C. Quitos Ms. Patricia Anne L. Rivera-San Buenaventura
Mr. Elijah Joy S. Alonzo

123

124


![[MS-PSDP]: Proximity Service Discovery Protocol](https://static.fdocuments.net/doc/165x107/6238aaa8e4670f2fd5332d72/ms-psdp-proximity-service-discovery-protocol.jpg)