PhD THESIS UNIVERSITY OF KAPOSVÁR FACULTY OF …
30
PhD THESIS UNIVERSITY OF KAPOSVÁR FACULTY OF ECONOMICS INSTITUTE OF ECONOMICS AND ORGANIZATION DEPARTMENT OF MARKETING AND QUALITY MANAGEMENT Head of programme: Dr. Gyula Széles Doctor of the Hungarian Academy of Sciences University professor Supervisor: Dr. habil. Zoltán Szakály Candidate of agricultural sciences Assistant professor The structural change of dairy products consumption plotted against customers’ behaviour Author: Péter Huszka Kaposvár 2005
Transcript of PhD THESIS UNIVERSITY OF KAPOSVÁR FACULTY OF …

PhD THESIS
UNIVERSITY OF KAPOSVÁRFACULTY OF ECONOMICS
INSTITUTE OF ECONOMICS AND ORGANIZATIONDEPARTMENT OF MARKETING AND QUALITY
MANAGEMENT
Head of programme:Dr. Gyula Széles
Doctor of the Hungarian Academy of SciencesUniversity professor
Supervisor:Dr. habil. Zoltán Szakály
Candidate of agricultural sciencesAssistant professor
The structural change of dairy products consumption plottedagainst customers’ behaviour
Author:Péter Huszka
Kaposvár2005

2
1. THE ANTECEDENTS OF THE RESEARCH, AIMS
Factors affecting food consumption came into the limelight of thescientific researches in the last decades of the 20th century. The participants ofthe agricultural market, from the primary producers to the leaders of thegovernment offices, face the fact that the carefully worked-out and adoptedmarketing for the production process can establish the efficient work of the foodindustry. According to KOTLER (2000): “Marketing is too important to entrustit to one department.” Marketing accompanies the life of the product, putsforward a proposal for the improvement of the products’ characteristics andattraction evaluates the turnover of the product and points out the experiences ofthe distribution.
The experiences of the developed countries verify that that kind of marketstrategy can be successful which can handle the product improvement, the pricestrategy and the claims of the consumers accordingly and can be guided by thechanging home market.
As a consequence it is important for the marketing strategies to know thecharacteristics and the processes of the home food market which leads to thescientific establishment of the marketing work of the companies.
The manufacturers have to get to know the consumption and buying habitsof the inhabitants, different target groups have to be determined for the differentproducts and they have to adjust to the newest nutrition habits and trends toincrease the sales.
It is supported by the fact that the market shares of the dairy products withlow fat content and high content mineral substances are increasing significantly,and the consumption of the fruit yoghurts is increasing, too.
On the other hand, it can be experienced that the consumption of basicdairy products like liquid milk stagnates at low level, and it looks impossible toreach the 240-250 kg per capita dairy product consumption of the developedcountries (SZAKÁLY S., 2000).
Some of food companies still think that if they spend enough money onmarketing, their investment will cover quickly. The managers think thatmarketing is the same as the sale, and they think it is more important to get anew consumer than to keep an old one. Instead of trying to satisfy their realclaims, they put in the centre of the strategy the sale of the product (SZAKÁLYZ., 2001).
It is necessary to examine the buying and consumption habits to get toknow the opinions of the Hungarian consumers about dairy products. Somesurveys have already been made in the last years. They examined some fields ofthe consumption habits, but these did not concern the whole dairy market. To
3
my knowledge no scientific research in the field of the buying and consumptionhabits in the dairy market has been done yet. So the research behind this thesisfills a long-felt gap.
The most important aims of the research are the following:
1. The working-up of the relevant Hungarian and foreign technicalliterature.
2. Analysis of the consumers’ and buyers’ behaviour with primary researchmethod in Hungary.
3. The analysis of the result of the effective demand and prices on theHungarian food – within this the dairy product - consumption habits.
4. The demonstration of the changing consumption habits of the dairyproducts and revealing the future trends.
5. Making a proposal for the dairy companies about how to develop auseful marketing strategy.
The following tasks were set to reach the mentioned aims:
– The demonstration of the Hungarian milk and dairy product consumptioncircumstances and volume.
– The examination of the different factors which have influence on the buyers’and consumers’ decisions.
– To get to know the characteristics of the milk and dairy productconsumption frequency, the consumed quantity in the course of the differentmeals, the popularity of the different kinds of dairy products.
– How often are milk and dairy products consumed in the course of differentmeals and what kind of dairy products are the most characteristic.
– To get to know the consumption frequency of the dairy products, whatquantities are bought in the different kinds of groceries.
– Make a comparison between the buying and consumption frequencies.– What kind of factors affect the consumers during their choice of the
products.
The given answers may include important information about the buyingand consumption habits for the experts who work in the field of food industry,mainly in the dairy industry. We can get some other important informationabout the separation of the different target groups, the popularity of the differentdairy products and some anomalies (etc.: butter, margarine).
4
2. MATERIALS AND METHODS
During my research the two basically methods of the marketing research,the secondary (so called ecoscopic) and the primary (so called demoscopic)methods were applied. Secondary market research means the systematiccollection, processing and analysis of existing information. Primary researchmeans an original data recording about the behaviour and opinion of the actorsof the market.
2.1. Applied methods of the secondary researchIn case of the ecoscopic examination I viewed with using of domestic
and internationally specialist literature the characterise of food consumerbehaviour, and the main factors, which influence the consumer behaviour. Alsowith this method I examined the human health and food consumption ofdifferent nations. I focused on the role of milk and dairy products in foodconsumption and in healthy nutrition.
The data regarding the consumption of dairy products, milk, butter andcheese were provided by the FAO internet database and the IDF BULLETIN.
2.2. Applied methods of the primary researchAccording to the interpretation of the modern marketing the primary
market research can be divided into two main groups: qualitative andquantitative researches. The first is an unstructured, revealing method, which isbased on a small, not representative sample, the results are informative and ingenerally are followed by further researches. The qualitative research is a“revealing“ survey, which tries to recognise the reasons behind the consumers’behaviour, because it focuses on the “why”-s.
The fundamental goal of quantitative research is to give as reliablenumerical answers as possible on the questions. During my work I applied themethod of quantitative research.
In majority the research was based on quantitative survey within it onpersonal interviews. At setting up the samples was the basis the last nationalcensus of KSH in 2001. The preparation and the national representativeinterviews were carried out according to the following plan of sampling.
During the sampling a thousand individuals were chosen. This size of thesample provided on the one hand that the subgroups formed by differentbackground variables will provide sufficient members to receive statisticallyreliable results, on the other hand that this number is general in the internationaland in the national market research and public opinion poll.
5
The personal interviews were carried out between October 2003 andDecember 2004, the incorrect data were supplied in summer 2004.
At setting up the samples the primary aim was to ensure therepresentativeness of the sample. A many-stage sampling method was created toprovide multiple representativeness. Its steps are the followings:
• The ground crowd was divided according to the seven region of thecountry.
• It was determined according to the population data of each region, thatout of the 1000 how many consumers should be made to fill out thequestionnaire in the given region.
• In every region a county was chosen, then with the help of the latestpublications of KSH the number, respectively the ratio of the inhabitantsliving in the county seat, in the cities and in the villages was calculated.
• Besides this, we examined the three types of settlements concerning thedistribution of the inhabitants by sex, by age and by school qualification.
• Finally, a quote system was worked out, and the questionnaire wasdistributed according to this.
The basis of the reliable results – over the representativeness – is, thatpossibility of chance choice has to be provided. To this was applied the methodof “random walking”, which has characterise, that all people has the samechance, to came into the sample. The method “random walking” I combinedwith the method “birthday key” in home, so providing the chance in the secondstep, too. The essence of the method is, that those family member has to fill inthe questionnaire, whose birthday is the nearest to the day of question.
For the easier processing the questionnaire made by me contains closedquestions. In the most case the responders had to write their answers on a five-graded scale. This was easy to understand, and the results show good theopinion of the responders.
The questionnaire deal basically with two area, they are the followings:
The examination of the consumption habits, where I analysed, how oftenand in what quantity the responders consume the products. I also examined thelikely of the products, the changes in the past 5 years, and that during meals howoften and what quantity we consumed from the different products.
During the examination of the purchasing habits I analysed, how oftenthe responders buy dairy products. It was also important, what quantity from thedifferent dairy products and margarine the responders buy in the certain case. Ialso examined, in what kind of shop type the responders buy, as well as thequality of dairy products, and the choosing considerations during the shopping.
The responders had to mark their answers on the mentioned scaleregarding 16 dairy products and the margarine.
6
At the questions about the quantity of the purchase and consumption Iapplied open questions. The responders had to write the values with number intothe tables. Then I recoded the answers, and wrote this codenumbers into thestatistic program.
The processing of numerous data happened with the SPSS for Windows9.0 mathematical-statistical program. The software calculated the distribution offrequency, cross tables were used to analyse the connections of all the variableswith the background variables and the relations among the variables. Besidescalculating the averages, significance testes were conducted with Chi-squaretest, and for multiple analyses ANOVA, cluster and factor analyses were used.
With the rework of the method created by SZAKÁLY Z. (1994) wasshown the frequency of the consumption of dairy products. The frequency of theconsumption had to marked on an eight-graded frequency scale. With using ofthe method was shown also the annually frequency of the products, that is howmany times a given product is consumed annually in Hungary. If we divide thenumber of days in a year with the number of consumption cases in a year wecan get, on which day we consume a given product.
In this form the values of the frequency scale can be summarized in onenumber so the measure of the purchase and consumption can be expressedgraphic.

7
3. RESULTSDuring the statement of our current results we present at first on the basis
of the domestic and international statistical data the change of milk and dairyproduct consumption. We found important the detailed presentation andtreatment of a consistent international database. The consumption data in theliterary outlines complete with the price and income relations each other. Theresults and connections are summarized on basis of new organizing principlesand completed with new ideas.
3.1. Change of milk and dairy products consumption
The milk and dairy consumption worldwide similar to many other foodswas characterised by stagnating and also in the next few years can be expectedonly a little increase. Considering longer time is the production more or lesssame with the consumption, too. But in the different region in the world is thepicture not so unified. While the consumption of some product increasedconsiderably, the demand to other products reduced.
In my thesis I present just the dairy product consumption in liquid milk(here was increase) and the change of cheese consumption in the table 1 and 2.
The consumption in liquid milk reduced between 1961 and 2002internationally with 15%, but this passed off in the certain countries not unified.Basically can be found, that in the case of developed countries was bigconsumption increase, but from a low level, as can be seen in the table 1. Itmeans, that in the developing countries was the average liquid milkconsumption in 1961 19,6 litre, which increased to 2002 with 58,1% andreached 31 litre. In the developed countries in the same time the 120,9 litreconsumption per person per year reduced to 92,9 litre (www.fao.org., 2002).

8
Table 1
The liquid milk consumption in different countries in decreasing order in 2002
Liquid milk kg/year 1961 1970 1980 1990 2000 2001 2002 IndexHungary =1
1. Ireland 241,8 266,5 310,8 226,1 170,0 183,4 188,2 2,32. Romania 90,0 82,5 113,0 52,4 173,9 179,8 181,7 2,23. Sweden 159,9 116,9 104,6 75,8 149,0 149,7 150,6 1,84. Denmark 125,3 86,3 104,7 61,4 133,0 134,5 135,7 1,75. Spain 73,8 103,1 129,3 95,8 123,8 129,5 129,2 1,66. Finland 300,9 229,7 212,4 153,0 132,4 120,4 128,8 1,67. Netherlands 144,6 141,2 133,9 116,7 105,3 118,3 122,2 1,57. Norway 175,6 170,4 172,8 79,2 123,4 121,9 121,3 1,59. Croatia .. .. .. .. .. 106,6 119,5 1,510 Bulgaria 19,6 28,9 54,8 54,8 131,7 118,1 119,4 1,511. Portugal 31,6 50,6 57,7 69,7 112,0 111,0 113,6 1,412. UK 161,9 153,0 139,6 132,9 114,8 111,8 111,4 1,413. Russia .. .. .. .. 120,3 113,1 107,2 1,314. Switzerland 197,0 150,3 135,5 117,3 96,4 93,0 100,9 1,215. Australia 160,5 156,2 122,1 135,7 102,3 100,1 99,7 1,216. France 121,7 108,8 80,5 82,9 92,5 92,6 99,7 1,217. New Zealand 112,1 163,4 145,2 163,8 99,0 98,7 97,0 1,218. Iceland 330,2 280,3 246,8 181,6 109,6 83,4 96,4 1,219. Germany 79,7 74,8 62,3 68,2 89,9 90,2 90,8 1,120. Slovakia 81,5 81,8 84,9 1,021. Austria .. .. .. .. 82,4 81,1 83,2 1,022. Slovenia .. .. .. .. 73,3 74,0 83,0 1,023. Malta 114,6 118,3 120,8 83,6 .. 85,8 81,5 1,024. Hungary 83,6 70,8 75,5 84,3 85,0 78,8 79,7 1,025. Israel 79,0 96,6 65,7 67,4 55,6 79,6 77,5 1,026. Czech Republic .. .. .. .. 73,2 75,0 76,0 0,927. Turkey 130,3 111,6 131,4 104,7 92,2 86,4 75,5 0,928. Greece 34,7 56,7 73,4 65,6 78,6 74,4 71,4 0,929. Italy 62,2 67,0 68,2 47,1 63,7 63,1 70,6 0,930. Argentina 70,4 84,9 91,8 83,1 69,8 70,9 62,2 0,831. Poland 155,7 170,6 110,1 97,3 51,2 55,0 60,8 0,732. Lithuania .. .. .. .. 30,8. 35,8 54,4 0,733. Japan 16,6 33,2 40,8 47,9 37,0 35,6 35,9 0,434. South Africa 73,9 82,3 72,2 48,5 30,3 29,4 29,4 0,4
EU-15 .. .. .. .. 94,6 93,1 96,0 1,2 World 52,0 47,3 43,0 42,0 46,3 44,3 44,2 0,5
9
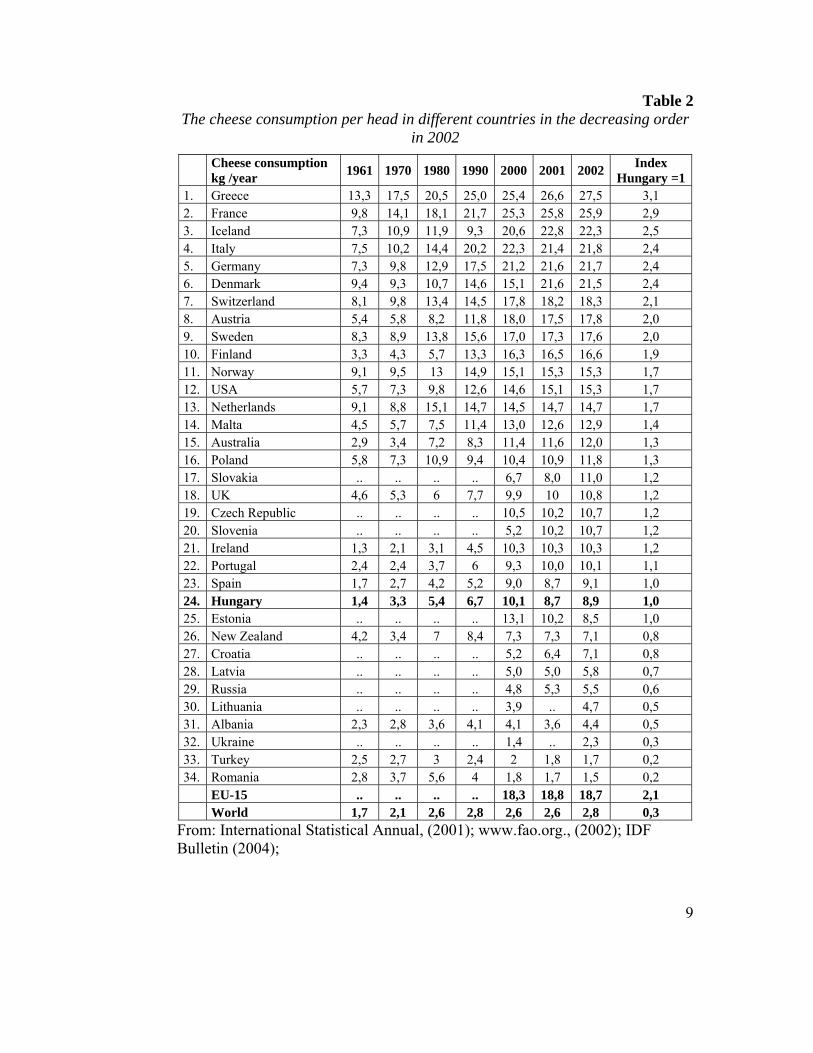
Table 2The cheese consumption per head in different countries in the decreasing order
in 2002
Cheese consumptionkg /year 1961 1970 1980 1990 2000 2001 2002 Index
Hungary =11. Greece 13,3 17,5 20,5 25,0 25,4 26,6 27,5 3,12. France 9,8 14,1 18,1 21,7 25,3 25,8 25,9 2,93. Iceland 7,3 10,9 11,9 9,3 20,6 22,8 22,3 2,54. Italy 7,5 10,2 14,4 20,2 22,3 21,4 21,8 2,45. Germany 7,3 9,8 12,9 17,5 21,2 21,6 21,7 2,46. Denmark 9,4 9,3 10,7 14,6 15,1 21,6 21,5 2,47. Switzerland 8,1 9,8 13,4 14,5 17,8 18,2 18,3 2,18. Austria 5,4 5,8 8,2 11,8 18,0 17,5 17,8 2,09. Sweden 8,3 8,9 13,8 15,6 17,0 17,3 17,6 2,010. Finland 3,3 4,3 5,7 13,3 16,3 16,5 16,6 1,911. Norway 9,1 9,5 13 14,9 15,1 15,3 15,3 1,712. USA 5,7 7,3 9,8 12,6 14,6 15,1 15,3 1,713. Netherlands 9,1 8,8 15,1 14,7 14,5 14,7 14,7 1,714. Malta 4,5 5,7 7,5 11,4 13,0 12,6 12,9 1,415. Australia 2,9 3,4 7,2 8,3 11,4 11,6 12,0 1,316. Poland 5,8 7,3 10,9 9,4 10,4 10,9 11,8 1,317. Slovakia .. .. .. .. 6,7 8,0 11,0 1,218. UK 4,6 5,3 6 7,7 9,9 10 10,8 1,219. Czech Republic .. .. .. .. 10,5 10,2 10,7 1,220. Slovenia .. .. .. .. 5,2 10,2 10,7 1,221. Ireland 1,3 2,1 3,1 4,5 10,3 10,3 10,3 1,222. Portugal 2,4 2,4 3,7 6 9,3 10,0 10,1 1,123. Spain 1,7 2,7 4,2 5,2 9,0 8,7 9,1 1,024. Hungary 1,4 3,3 5,4 6,7 10,1 8,7 8,9 1,025. Estonia .. .. .. .. 13,1 10,2 8,5 1,026. New Zealand 4,2 3,4 7 8,4 7,3 7,3 7,1 0,827. Croatia .. .. .. .. 5,2 6,4 7,1 0,828. Latvia .. .. .. .. 5,0 5,0 5,8 0,729. Russia .. .. .. .. 4,8 5,3 5,5 0,630. Lithuania .. .. .. .. 3,9 .. 4,7 0,531. Albania 2,3 2,8 3,6 4,1 4,1 3,6 4,4 0,532. Ukraine .. .. .. .. 1,4 .. 2,3 0,333. Turkey 2,5 2,7 3 2,4 2 1,8 1,7 0,234. Romania 2,8 3,7 5,6 4 1,8 1,7 1,5 0,2
EU-15 .. .. .. .. 18,3 18,8 18,7 2,1 World 1,7 2,1 2,6 2,8 2,6 2,6 2,8 0,3
From: International Statistical Annual, (2001); www.fao.org., (2002); IDFBulletin (2004);
10
Seeing the total milk consumption of Hungary, the country is on the 24thplace from the 34 countries. So we are in the last third part. On the 1st place isIreland with a 2,3 times greater consumption. On the 2nd place stands Rumaniawith a 181,7 liter consumption, before some well developed countries. The hightotal milk consumption is probably based on the culture and knowed theeconomic state of development this is maybe the only product, which they canafford to buy or to produce at home. Turned back to the domestic consumption,it is very spectacular, that the increase of milk consumption stopped in 2001.For example we consumed in 2002 with 6,2% less than on turn of themillennium. Its cause mainly was, that the increase of price was much greaterthan the inflation.
If we see only the statistical data, it can seem favourable, that an averageconsumer in the EU consumes only with 20% more liquid milk than in Hungary,and there are some Union country, where is the liquid milk consumption with 5-10% less. It is also important, that in these countries –similar to developedregion of the world– the liquid milk consumption reduced in the examinedperiod in big measure, sometimes with 50%. Parallel wit this the milk“infiltrate” more and more in other foods and so it comes to consumers as dairyproducts with bigger additional value. This is shown by data of table 2.
In case of cheese the consumption grown overall the world, but in a verydifferent rate. The greatest change happened in the well-developed countries,where the consumption doubled, while in the developing countries theconsumption grown only with 50% from a very low level (0,4 kg)(www.fao.org., 2002).
In the last few years the tendency of consumption changed and a newrule will stand out, that the higher is the consumption the smaller is the growing.
The cheese consumption of Hungary similar to the other milk products isnot sayable to satisfactory, sith we take place out of the 34 countries the 24thplace. At the same time we can experience slow increase. The tempo of theincrease is hopeful. But the volume of domestic consumption is even so underthe average of EU and on macro level is the same with the developed countries.And in the leader Greece eat the people 3,1 times much cheese than in Hungary.

11
3.2. Examination of the frequency of the consumption of milk, dairyproducts and margarine
The responders had to mark the frequency of consumption of the certainproducts on an eight-part scale as in the abovementioned. The results in theFigure 1 show, that the certain dairy products and the margarine in which daycome to the table of the consumers, which is the measure number of thefrequency of the consumption.
1,9 2,1 2,4 2,5 3,0 3,5 3,7 4,0 4,56,6 7,2 7,9 8,1
9,711,0
13,6 14,2
02468
10121416
Mar
garin
e
Milk
in p
lasti
c ba
g
Butte
r
Milk
car
ton
Ripe
d ch
eese
Butte
rcre
am
Frui
t yog
urt
Sour
cre
am
Milk
des
serts
Proc
esse
d ch
eese
Milk
pow
der
Kef
ir
Flav
oure
d m
ilk
Crea
m
Curd
s
Yog
urt o
f nat
ural
taste
Ice
crea
m
Figure 1: Consumption frequency of different diary products and margarineyearly, in terms of days (n=1000)
Our results show, that we consume the cheaper milk in a plastic bagaverage per two days, which stands nearest to the consumption of margarine.
The butter and the more expensive, but best quality founded canned milkwe take on our table per two and a half days. It follow the more and more likedripened cheeses, butter creams, fruit yoghurts and sour cream.
This means consumption per thee-four days. We consume the milkdesserts, processed cheeses and milk powder minimum once a week. The lastone use the responders fast only to coffee.
The row end curds, nature yoghurt and ice lolly. The last one weconsumed per two weeks.
12
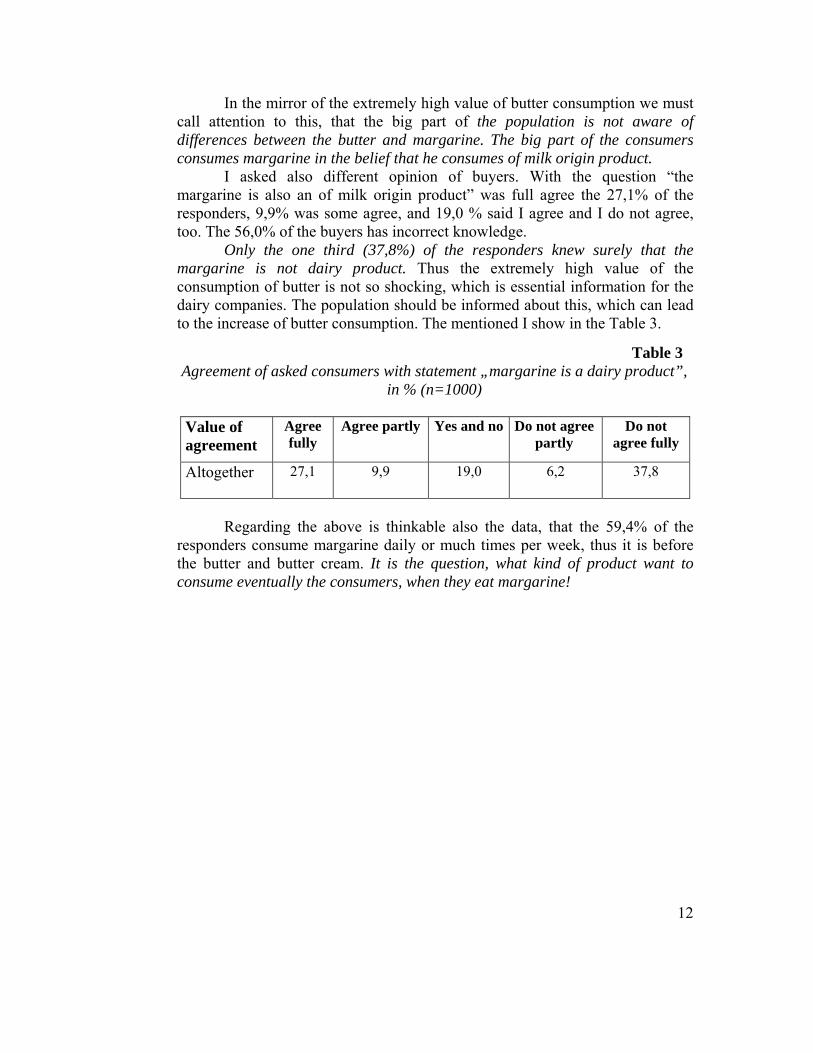
In the mirror of the extremely high value of butter consumption we mustcall attention to this, that the big part of the population is not aware ofdifferences between the butter and margarine. The big part of the consumersconsumes margarine in the belief that he consumes of milk origin product.
I asked also different opinion of buyers. With the question “themargarine is also an of milk origin product” was full agree the 27,1% of theresponders, 9,9% was some agree, and 19,0 % said I agree and I do not agree,too. The 56,0% of the buyers has incorrect knowledge.
Only the one third (37,8%) of the responders knew surely that themargarine is not dairy product. Thus the extremely high value of theconsumption of butter is not so shocking, which is essential information for thedairy companies. The population should be informed about this, which can leadto the increase of butter consumption. The mentioned I show in the Table 3.
Table 3Agreement of asked consumers with statement „margarine is a dairy product”,
in % (n=1000)
Value ofagreement
Agreefully
Agree partly Yes and no Do not agreepartly
Do notagree fully
Altogether 27,1 9,9 19,0 6,2 37,8
Regarding the above is thinkable also the data, that the 59,4% of theresponders consume margarine daily or much times per week, thus it is beforethe butter and butter cream. It is the question, what kind of product want toconsume eventually the consumers, when they eat margarine!

13
The rate of non-consumers of different products in case of mostimportant dairy products shows the Figure 2.
2,55,7 6,5
26,4 26,5 26,9 27,730,4
42,1
56,3
0
10
20
30
40
50
60
Sour cream
Curds
Riped cheese
Butter
Fruit yogurt
Milk in plastic
bag
Milk carton
Milk desserts
Flavoured milk
Yogurt of
natural taste
Figure 2: Percentage of non-consumers plotted against frequency (n=1000)
I can be found, that 56,3 percent of the answerers said they neverconsume any yogurt of natural taste and 42,1 percent was the non-consumptionof flavoured milk from the most frequent diary products, as can be seen inFigure 1. It is in harmony with the popularity value of these two products. At theother end of the pole there are the sour cream with a value of 2,5%, the curds of5,7%, riped cheese of 6,7%. This goes to show that the rate of non-consumers incase of these products is low, that we can explain with a Hungarian nationaldish, noodles with cottage cheese as well as the Hungarian nutrition habits.
The rate of those who do not consume butter and liquid dairy products is26,9% in case of milk in plastic bag, 27,7% milk carton, 26,4% butter.
The reason for this is Hungarian nutrition habits, because plenty ofconsumers eat these much liked dairy products for breakfast or supper.
If milk and diary products are examined together, and we want to knowhow many people do not consume any diary products, we practise that thisnumber is 25,9%. However, it can be proved that the overwhelming majority ofthe population consumes some kind of diary product.

14
3.2.1. Examination of consumed quantity of milk and dairy products
The next question of my survey concerned the quantity of dairy productsand margarine consumed during each meal. To become acquainted with thedairy product consumption habit is not enough just to know, how often weconsume the products, but we have to know the consumed quantities, too. Fromthe table 4 can be read some important results.
Table 4
Percentage division of quantity of some products consumed during mealsNever 1dl 2-3 dl 4-5 dl 6 dl +
%
Milk in plastic bag 26,9 6,9 41,9 18,5 5,8Milk in carton 27,7 6,1 44,3 15,4 6,5Flavoured milk 42,1 4,7 35,7 16,4 1,1
Never 1/2packaging 1 packaging 2 packaging 3 packaging +Fruit yogurt 26,5 5,6 60,1 5,6 2,2
Never 1-4 dkg 5-10 dkg 11-15 dkg 16 dkg +Riped cheese 6,5 13,3 60,3 6,4 13,5Processed cheese 16,9 32,2 41,4 3,5 6,0
From the data of table can be seen, that the consumed quantity if liquidmilks and flavoured milks is decisively 2-3 dl. 40% of the population consumethis quantity. Regarding that only the 7,5% of the population consume the liquidmilks several times a day, we can find: that milk quantity, which we consume, isnot enough nutrition biological.
In connection with fruit yoghurts we can observe, that the big part ofpopulation likes it, so the big part of population consumes it, too. The share ofnot consumer is little.
From the table 4 can we also find, that the big part of cheese consumerseat between 5 and 10 dkg.
Quantity ofConsumption
Name of product

15
3.3. Popularity of milk and dairy production
The next question of my survey was aimed at popularity of the dairyproducts. The responders had to mark on a scale 1-5, how they like the products(1: I like it at all, 3: I also like, and also do not like it, 5: I like it expressly).
On the basis of the answers formed the following order (Figure 3).
4,494,16 4,03 4,03 4,02 3,97 3,90 3,70 3,69 3,60 3,57 3,56 3,54
3,25 3,13
2,562,06
0,0
1,0
2,0
3,0
4,0
5,0
Riped cheese
Cream
Ice cream
Milk desserts
Fruit yogurt
Curds
Processed cheese
Margarine
Buttercream
Milk in carton
Butter
Sour cream
Milk in plastic bag
Flavoured milk
Kefir
Yogurt of natural taste
Milk pow
der
Figure 3: Popularity of various dairy products, in decreasing order of popularity(n=987)
Our results partly support, partly oppose respectively complete theresults of BERKE (2003). On the basis of the data of diagram the popularity ofriped cheese can said proper, as it reach the low limit of category “I like itexpressly” (4,5). We think important, that the dispersion 0,8 is the lowest underthe products, which indicates us, that the consumers are the least dividedregarding the popularity of product.
It is worth remarking, that the main part of products belong to category“liked”, if we the value of category explain between 4,5 and 3,5. To this yetacceptable category belong our most important basis dairy foods and themargarine, too.
4 out of the 17 products came to the category ‘I like it and do not like it,too’, which fall behind the required level: the flavoured milk product, the kefir,the nature yoghurt and the milk powder. The popularity of kefir and nature

16
yoghurt is low belike because of the acidulated taste. The one part of flavouredproducts – for example cocoa - can be made also at home a la gusto of theconsumer. This can give explanation to the low popularity of the productavailable in trade. In some responders opinion is the cocoa available in shop notenough sweet.
We get clearer picture (Figure 4) if we compare the frequency ofconsumption and the popularity of the products.
Riped cheese
Cream
KefírFlavoured milk
Sour cream
Curds
Margarine
Milk in plast ic bag
But ter
Fruit yogurtMilk dessert s
Milk powder
Yogurt of natural t aste
Ice cream
2,0
2,5
3,0
3,5
4,0
4,5
5,0
0 1 2 3 4 5 6 7 8 9 10 11 12 13 14 15
Big popularity, acceptabele frequency of consupt ion
Lower popularity, most often
Big popularity, rare consupt ion
Low popularity, rare consupt ion
Figure 4: The consumption/popularity map of certain products according tofrequency of consumption and rate of (n=987)
It can be found generally, that it can be considerable differences betweenthe popularity and the effective consumption. The first group is characterised bylarge popularity and relatively frequent consumption. In the second group arethe most frequent consumed products (for example the butter and liquid milks),which are consumed per two days, but its popularity is not satisfactory. Thethird and fourth group is very different from each other. To the former belongthe products with big popularity, but rarely consumption (e.g. ice lollies), whilethe letter is represented by products with low popularity and low frequency ofconsumption (e.g. flavoured milk).

17
3.4. Change of the frequency of the consumption of milk, dairy productsand margarine
It has been found the research that 48% of the population felt that certainchanges have occurred in their consumption. Analyzing the data, the productscan be divided into two groups. In the first group consumption has changed intoa negative direction, i.e. the product was consumed more rarely. In the othergroup the consumption of the products was more frequent. Eight of theseventeen products have been consumed more rarely recently, and sevenproducts –including margarine- have been consumed more often. Examiningkefir and processed cheese I have found, that the rate difference between themore and less frequent consumers has not reached 5% thus I have not put theminto either of the groups.
In Figure 5 those most important dairy products can be seen which areconsumed more rarely. Thus recently the structure of consumption has changedinto an unfavourable direction.
Figure 5: The changes in the frequency of consumption of certain dairyproducts given in percentage (n=480)
It can be seen in the figure, that the rate of the more and less rarelyconsumed dairy product is negative. This means that consumption in all has
-45,1-49
-44
-33,6 -35,3
-44,1
-30,6
8,6
22,9 23 24,5 26,9
36,2
24,2
-36,5
-26,1-21
-9,1 -8,4 -7,9 -6,4
-60
-50
-40
-30
-20
-10
0
10
20
30
40
50 Milk powder Flavoured milkYogurt ofnatural taste Curds Ice cream
Milkin plastic bag Butter
Rarer consumption More frequentconsumption Difference

18
decreased. This decrease and the increase (which was calculated whit the samemethod in Figure 6) are marked as the ‘difference’.
From Figure 5 it can be deducted that 49% of the consumers whoconsume flavoured dairy products have consumed the product quite or morerarely in the past five years. This value is above 40% in the case of unflavouredyoghurt, liquid milk in a plastic bag and milk powder. With other dairy productsit changes between 30-35%.
In the case of unflavoured yoghurt a significant difference has beenfound in the income. In the frequency of consumption the change has not beenoutstanding with those who have higher income, while with people with lowerincome there has been a decrease in the frequency of consumption.
In the case of milk in a plastic bag the effective consumption frequencydecrease was 7,9%. I have found significant differences while examining thequalification, region and income. Together with the higher qualification andincome the number of those who have refused to consume the product in thepast five years has grown.
The frequency of ice cream consumption has decreased according tothe survey but considerable differences could only be noticed in particularsegments. Notable decrease could not be detected with people with lowerincome but those earning 26.000-40.000 HUF the recession in the frequency ofice cream consumption is significant. The poorer segment most probably used toconsume ice cream more rarely anyway. People with average or somewhat lessthan average income – as their income has changed only slightly – have reducedthe consumption of the product as an answer to the unfavourable effects
In figure 6 products of more frequent consumption can be seen. Whitthese products the consumption structure has gone into a favourable direction,i.e. we consume them more often.

19
Figure 6: The changes in the frequency of consumption of certain dairyproducts given in percentage (n=428)
Analysing the data of Figure 6 it has turned out that the ‘winners’ of thechanges in the past five years considering the frequency of consumption arefruit yoghurts and the ripened cheeses. These products have been consumedmore often by 35% of the population. Similarly, more frequent consumption canbe detected in the case of sour cream and milk desserts, the growth of whichreaches 20%. It is harmony with the favourable tendency in the consumption ofthe product in the recent years.
At the milk carton examining the age we found signification. At the age-class 30-39 was the rate of rarely consumer 20,5%, at the elder then 60 year-olds40,3%.
Also at the riped cheeses there is significant difference between the age-classes regarding to the change of consumption.
The reason of the decrease of frequency of consumption is not the lowpopularity, but rather the incoming status, where we found also significantdifference.
57,654,2
46,4
35,4
45
3531,6
-22 -19,1-25,5
-15,3
-32,5-26,8 -24,5
35,6 35,1
20,9 20,112,5
8,2 7,1
-40
-30
-20
-10
0
10
20
30
40
50
60
70Fruit yogurt Riped cheese Milk desserts Cream Milk in carton Buttercream Margarine
More frequentconsumption Rarer consumption Difference

20
3.5. Consumption frequency of the milk and dairy products and of dairyproducts consumed in the course of different meals
We focused on the consumption frequency of the consumed diary productsand the products consumed at the different meals - breakfast, lunch, supper. Weconsidered important how the diary products are divided between meals or howoften consumers consume them.
It can be stated that dairy products are consumed for breakfast mostfrequently (average per 1,5 days), any rarely (per 2 days) we eat they for supper. For lunch we eat only every 6th day milk products.
We finish demonstrating our consumption habits by showing theconsumed dairy products for different meals. We considered important to askconsumers of what kind of products are consumed in the course of differentmeals. The question ran as follows: „Please, specify what kind of dairy productsyou consume most frequently.” There are two reasons for this question beinghighlighted. One is because some answerers named more than one product, sothe sample volume is more than 1000. The other reason is that margarine andimitated dairy products were identified as dairy products (morning drink ismentioned 51 times, the fresh cream 6 times). The percentage division of theconsumed dairy products for breakfast and lunch is demonstrated on Figure 7and 8.
3,2
46,3
9,9
8,3
8,1
7,2
7,0
3,1
2,4
2,4
1,1
0 5 10 15 20 25 30 35 40 45 50
Do not consume
Liquid milk
Cheese
Flavoured milk p roduct
Butter
M argarine
Yogurt
Butter cream
M ilk dessert
Kefir
Curds
Figure 7: Percentage distribution of products consumed for breakfast (n=1218)
21
19,0
31,2
18,4
11,8
7,7
3,7
3,5
1,2
1,0
0 5 10 15 20 25 30 35
Do not consume
Sour cream
Curds
Cheese
Liquid milk
Milk dessert
Yogurt
Butter
Kefir
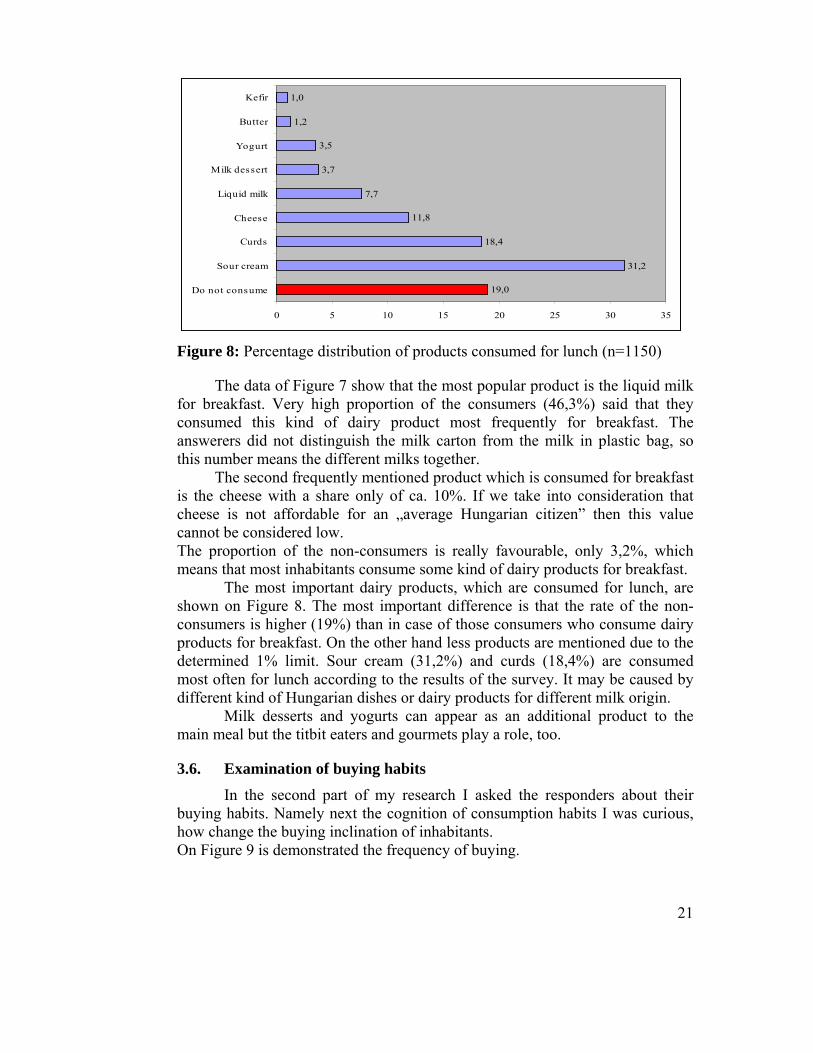
Figure 8: Percentage distribution of products consumed for lunch (n=1150)
The data of Figure 7 show that the most popular product is the liquid milkfor breakfast. Very high proportion of the consumers (46,3%) said that theyconsumed this kind of dairy product most frequently for breakfast. Theanswerers did not distinguish the milk carton from the milk in plastic bag, sothis number means the different milks together.
The second frequently mentioned product which is consumed for breakfastis the cheese with a share only of ca. 10%. If we take into consideration thatcheese is not affordable for an „average Hungarian citizen” then this valuecannot be considered low.The proportion of the non-consumers is really favourable, only 3,2%, whichmeans that most inhabitants consume some kind of dairy products for breakfast.
The most important dairy products, which are consumed for lunch, areshown on Figure 8. The most important difference is that the rate of the non-consumers is higher (19%) than in case of those consumers who consume dairyproducts for breakfast. On the other hand less products are mentioned due to thedetermined 1% limit. Sour cream (31,2%) and curds (18,4%) are consumedmost often for lunch according to the results of the survey. It may be caused bydifferent kind of Hungarian dishes or dairy products for different milk origin.
Milk desserts and yogurts can appear as an additional product to themain meal but the titbit eaters and gourmets play a role, too.
3.6. Examination of buying habitsIn the second part of my research I asked the responders about their
buying habits. Namely next the cognition of consumption habits I was curious,how change the buying inclination of inhabitants.On Figure 9 is demonstrated the frequency of buying.
22
3 4 4 4 5 6 7 8 8 8 9 10 12 12 1418
43
05
101520253035404550
Milk
in p
last
ic b
ag
Frui
t yog
urt
Milk
in c
arto
n
Cre
am
Milk
des
serts
Rip
ed c
hees
e
Kefír
Mar
garin
e
Butte
r
Flav
oure
d m
ilk
Proc
esse
d ch
eese
Butte
rcre
am
Yogu
rt of
nat
ural
tast
e
Cur
ds
Ice
crea
m
Sour
cre
am
Milk
pow
der
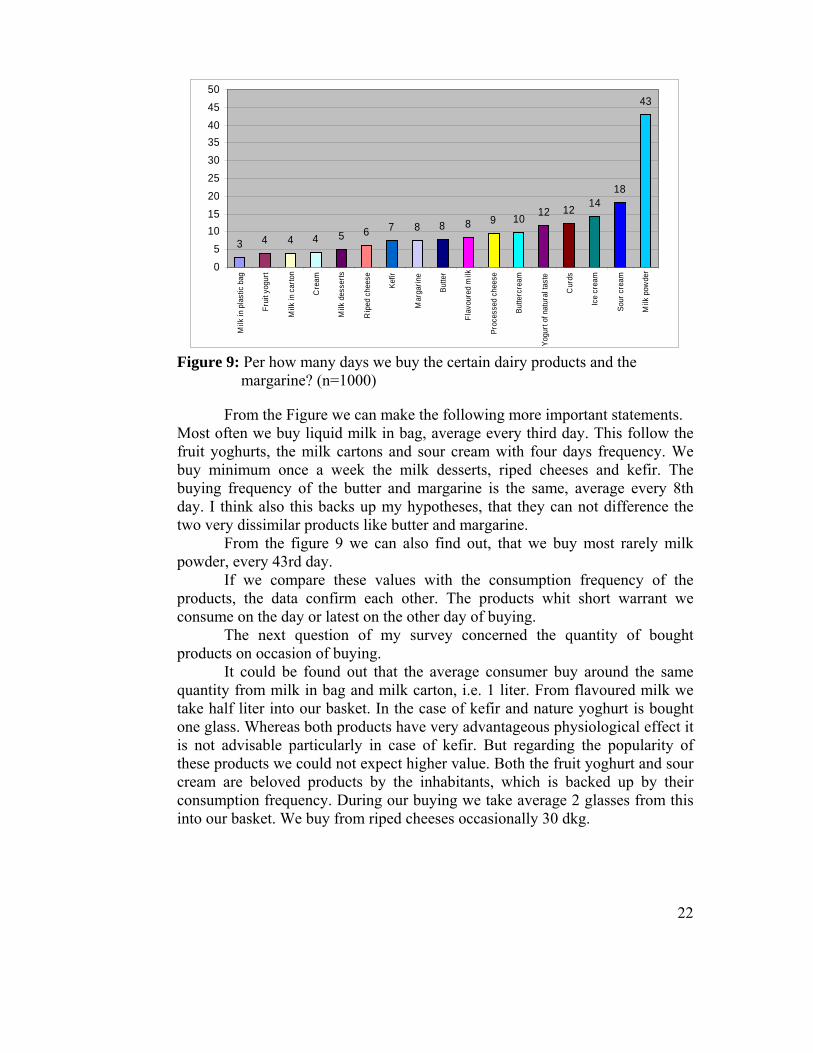
Figure 9: Per how many days we buy the certain dairy products and themargarine? (n=1000)
From the Figure we can make the following more important statements.Most often we buy liquid milk in bag, average every third day. This follow thefruit yoghurts, the milk cartons and sour cream with four days frequency. Webuy minimum once a week the milk desserts, riped cheeses and kefir. Thebuying frequency of the butter and margarine is the same, average every 8thday. I think also this backs up my hypotheses, that they can not difference thetwo very dissimilar products like butter and margarine.
From the figure 9 we can also find out, that we buy most rarely milkpowder, every 43rd day.
If we compare these values with the consumption frequency of theproducts, the data confirm each other. The products whit short warrant weconsume on the day or latest on the other day of buying.
The next question of my survey concerned the quantity of boughtproducts on occasion of buying.
It could be found out that the average consumer buy around the samequantity from milk in bag and milk carton, i.e. 1 liter. From flavoured milk wetake half liter into our basket. In the case of kefir and nature yoghurt is boughtone glass. Whereas both products have very advantageous physiological effect itis not advisable particularly in case of kefir. But regarding the popularity ofthese products we could not expect higher value. Both the fruit yoghurt and sourcream are beloved products by the inhabitants, which is backed up by theirconsumption frequency. During our buying we take average 2 glasses from thisinto our basket. We buy from riped cheeses occasionally 30 dkg.

23
3.6.1. Influential factors of choice of dairy products
During my survey the answerers had to mark on an five-graded scale,how much they are influenced by the difference aspects at the choice of dairyproducts. I found important to examine, by what product characteristics and/orexternal und internal impression the buyer makes decision, when he take aproduct in his basket.
On Figure 10 I demonstrate the influential factors in decreasing order. Icomplete my results with certain more important statements of the backgroundvariables.
4,5 4,4 4,3
3,9 3,83,6 3,5
3,23,0 2,9 2,9
2,4 2,3
0
1
2
3
4
5
Flavour of product
Constant quality
Medical aspect
Price of product
Aspect view of product
Habituation
All family care
Currency of product
Packaging of product
Mindenhol kapható
Mark of product
Manufacturer firm
Promotion of product
Figure 10: Order of the factors which influence the choice of dairy products inaverage of opinions of answerers (n=1000)
From the results can be found, that the most important influential factorfor the responders is the flavour (on five-grade scale 4,5) and quality (4,4) ofproducts. The buyer chooses firstly the product, which has good taste and ischaracterised by constant good quality. In the order follow the healthiness (4,3)and the price (3,9) of product. For the buyers are more important the factorsbelong to quality than to price. This means, that the healthy nutrition becomesfor the inhabitants more and more important factor.
It is regrettable at the same time, that the function of the image factorsinfluence the buying (name of manufacturer, advertising, trade name) is thelowest.

24
In the middle of the order stand the subjective attributions as the lookingof the product (3,8), if the family like it (3,5), or the packaging (3,0). If we couldenhance the image of the dairy products, would change the consumptionpositive, too.
3.7. The segmentation of milk consumers by factor and cluster analysisFor planning a more effective marketing strategy in the milk sector, it
was found to be important to segment the consumers asked on another way, too.The traditional segmentation methods (age, sex, qualification etc.) give in manycases not to the demands of the modern age proper results (TÖRŐCSIK, 2003).I carried out the segmentation of consumers with factor and cluster analysis.With this we can to class the responders not only by consumption, butpsychological characteristics.
Based on the selected 25 variables 6 very different factors were created.After the cluster analysis of the 6 factors, finally four clusters were created, with938 censurers. These 938 consumers gave 100 percent, leaving out those whodid not belong to any clusters.
“Consumers with traditional thinking” is considered as “Group A”.28,3% of the participants in the questioner belong to this group, most of themare women and older people. (over 60 years of age). This group could bedescribed as average income families, with average education from villages andsmall towns. On a daily base this group consume the most from the milk in bag(33,9%). The consumption of curd and sour cream of “Group A” is somewhathigher than the consumption of these products by the other groups. On the otherhand their consumption of cheese, milk powder, ice lolly and milk dessert is thelowest among all the other groups. The member of “Group A” prefer milk inbag, kefir and sour cream over the average of the other groups. During the lastcouple of years the regularity of other consumption habit could be consideredthe most stable.
“Group B” is the group with “consumers who are sensitive to theprice” of the products. Mostly single or divorced, young or middle age maleswith smoking habits from the lower income segment of society. This group doesnot emphasize healthy eating habits as well. In this group prices of the productsare the most important and they are the most likely to buy products on sale notshowing any consistent preference fro any brand names. They consume almostequal amount from milk in bag and milk carton. Their consumption of cheese islower than the average. The consumption of milk powder is the lower in thisgroup. In regards of the quantity of the milk consumption, it shows similarity tothe other groups, from milk 2-3 dl and from fruit yoghurt 1 packaging per day.
25
The third, “Group C” could be described as the “segment of societywith low social-economist status”. Only 7% of the participants in the surveybelonged to this group. Most of them are divorced and unemployment rate is thehighest in this group (68,1%). Their undesirable place in society reflects theirconsumer habits. The selection of milk products is highly influenced by thepackaging and advertisement of items. According to 32,7% of the participants inthis group do not think that there is any relation between healthy eating and theamount of milk they consume. They strongly believe that the bacterial culture inyoghurt is not healthy for human consumption. The members of this group donot like kefir, curd and sour cream, prefer to buy milk 1 or 2 times a weekmostly half a liter packaging.
32,1% of the participants in the questioner belong to “Group D”. Thisgroup could be described as a “people open for new concepts, and peoplewith progressive thinking”. Most often they are women from younger (16-25years old) and older age (40-59 Years old) category. Their income is aboveaverage mostly from Budapest or from cities. 16,2% of them are with universitydegrees. For this group the most important is the continuous quality of theproducts and the least important the price of the products. 67,3% of them think:Milk consumption will enhance the quality of health. The members of this groupare open to try any new products and we could conclude that this is exceptionalamong the other groups. More than 70% of them consume fruit yogurt. Theirconsumption of nature yoghurt , riped cheese, ice lolly, milk dessert, cream andbutter is higher than any of the other groups.

26
4. CONCLUSIONS, SUGGESTIONSThe processing of the secondary data and evaluation of primary data
results the following conclusions and suggestions. The conclusions can beapplied on the one hand to cognise deeper the consumption and buying habits ofdomestic dairy products, helped to plan the marketing strategic of dairycompanies.
1) During my work I examined, what kind of effect have the factors influentialthe food consumption on the construction of dairy product consumption. Ifound out, that the globalisation more and more appear in Europe and in thedeveloped region of the world, the nutrition becomes homogeneous, at thesame time the traditional differences between the countries influence thenutrition often stronger, than the economic stand of the country.
2) During the comparative statistical analyse of the price of dairy products andmargarine I found out , that the price of margarine increased between 1989and 2002 only 5,9-fold, in the case of physiological advantageous butter theprice increase exceeded the 11-fold.
3) The results of my dissertation show regarding the domestic dairy productprices, that in the conscience of big part of consumers the milk and dairyproducts are still such basis foods that should be aided by the state,therefore everybody can they buy.
4) The dairy companies must achieve with more intensive marketing work andmeans of market segmentation the increase of domestic consumption ofdairy products. They have to do this so, that in the following 2-3 years cannot be expected considerable increase of measure of domestic market.Regarding the domestic consumption can be expected rather restructuringtowards higher processed products.
5) The buyers would like to get during their buying the possible best quality atthe possible favouring price. In a long time will be those productscompetitive, which have excellent quality, particularly in the globalisedEuropean markets.
6) The big part of the population is not aware of differences between the butterand margarine. The big part of the consumers consumes margarine in thebelief that he consumes of milk origin product. It is right similarly in thecase of breakfast drinks, too.

27
7) We can be witness of change of consumption habits more and more. Thedemand increases for the products in smaller packaging because of theeconomization, at one part of buyers come more and more higher processedproducts in the centre of buying, the demand increases for the commercialbrands, too. Parallel with this becomes the enviromentconsciousness moreand more determining.
8) In the consumption of some dairy products can be experienced considerabledecrease in the last time because of the change of nutrition habits, so at themilk powder and cream. The milk imitations as the breakfast beverages,“frissföl”, “cream” from vegetable oil deceive the buyers in great measure.These products appear in the market as substitutive products, influenced theconsumption frequency of the true dairy products.
9) In case of some dairy products can be observed great differences inconsumption frequencies and quantities regarding mainly the sexes, age andqualification. For example the younger generation likes expressly theflavoured milk products, while the elders not yet. If the marketing expertssize up these differences, they can cognise better the consumer groups, andthereby increase the consumption.
10) In case of many milk products is high the rate of non consumers. If we couldthese consumer groups with marketing work, advertisement, enlightenmentactuate to consume, would increase the frequency and quantity ofconsumption of dairy products.
On the grounds of the results of my research could be outlined the marketingstrategic elements, which can offer effective means to the increase of marketsharing of dairy products. They are the followings:

28
The possible implements of product- and price strategic
The domestic dairy industry has the basic role to increase theconsumption frequency of the different milk products. The prices of the dairyproducts in the near future prospectively rather increase, therefore the increaseof the real income can give a basic to the advance of the consumption frequency.Some consumer groups are ready to pay more, if their additional outgoingappears in the attribution of the product. In this aspect is the first the healthcarefunction. The survey shows, that the name of producer and the brad name do notinfluence the buyer’s attitude. It was also found, that the effect on the health ofthe product is an important factor at the buying. The companies can connecttherefore their brand strategy with the healthy of milk product, so they can makematerially better the consumption level and also the acceptance of brands withthe intensification of the health consciousness.
The possible implements of distribution strategic
It was found, that from the distribution channels of dairy products havethe hipermarkets and the bigger groceries prominent importance. In these can befound the dairy products in deep and wide choice. Parallel with this the smallergroceries and „ABC”-s have importnat role –mainly in the country.
The possible implements of marketing communication
The careful planning of the integrated communication can be a key factorin the increase of the consumption frequency of the milk products. Actuallymeans the biggest care, that the consumers do not know the nutrition biologicaladvantage of the dairy products. It is the bigger problem that they are not clearalso about that, which products are really from milk and which are only milkimitate. In this situation is the most important communication task the objectiveinformation and training. It can be also important, that not products, but lifestyle shall be advertised so, that it shall be realized already in youth: It is a goodthing to consume milk and dairy products, and this is a model to be followed foreverybody!
Finailly it can be stated that in case of some product groups theconsumption frequency increased, while in case of others it decreased. Inthe structure of dairy product consumption a change can be foreseen.
29
5. NEW SCIENTIFIC RESULTS1. On secondary data based comparative examination, during it were presented
samenesses and differences between the domestic milk and dairy productconsumption tendencies.
2. The detailed examination and evaluation of the quality and frequency of thenational buying and consuming milk and dairy products (total andoccasional), moreover analysing the structural characteristics ofconsumption (and purchase) by general and basic variables, according to anown primary data collection.
3. Separation of buyer and consumer segments characterised by product marketwith application of factor and cluster analysis, hereby working out of thebasis of a differentiated marketing strategy is guided by the demand of thecertain segments.

30
6. PUBLICATIONS
1. Berke Sz., Pósa O., Huszka P., Szakály Z.: Az élelmiszer-kiskereskedelemhelyzete Magyarországon nemzetközi összehasonlításban I.Élelmiszermarketing-tudomány 1 (3) 11-24 (2000)
2. Pósa O., Berke Sz., Huszka P., Szakály Z.: A Marketingcsatorna elemeikecsketej-alapú termékek esetében. XXVIII. Óvári Tudományos Napok - Azélelmiszergazdaság fejlesztésének lehetőségei, Nyugat-MagyarországiEgyetem, Mezőgazdaságtudományi Kar, Mosonmagyaróvár, 101-106 2000
3. Berke Sz., Szilvási M., Huszka P., Szakály Z.: Marketing gyakorlat afunkcionális élelmiszerek piacán. XXVIII. Óvári Tudományos Napok - Azélelmiszergazdaság fejlesztésének lehetőségei, Nyugat-MagyarországiEgyetem, Mezőgazdaságtudományi Kar, Mosonmagyaróvár, 152-157 2000
4. Pósa O., Szilvási M., Huszka P., Szakály Z.: Kvalitatív piackutatás akecsketej-termékek fogyasztói preferenciáinak elemzésére. XXVIII. ÓváriTudományos Napok - Az élelmiszergazdaság fejlesztésének lehetőségei,Nyugat-Magyarországi Egyetem, Mezőgazdaságtudományi Kar,Mosonmagyaróvár, 200-205 2000
5. Huszka P.: Magyarország tejelő állatállományának és a tehénállománylaktációs hozamainak alakulása. Előadás, XXIX: Óvári Tudományos NapokMosonmagyaróvár, 2002, 46
6. Szakály Z., Tápler H., Huszka P., Berke Sz.: Sajtfogyasztási szokások,preferenciák és attitűdök vizsgálata primer piackutatás alkalmazásával II.Tejgazdaság, 62 (1) 40-49 (2002)
7. Huszka P., Polereczki Zs.: Analysis of the consumption frequency of dairyproduts in Hungary. Acta Agraria Kaposváriensis, (1) 2005
8. Huszka P., Polereczki Zs.: The consumption frequency of consumed dairy.Acta Agraria Kaposváriensis, (2) 2005 (under edition)
9. Huszka P.: Faktor-és klaszterelemzés a hazai tejtermékpiacon Élelmiszer,táplálkozás, marketing. 2 (1-2) 39-44 2005
10. Huszka P., Polereczki Zs., Szakály Z.: A tej és tejtermékek, valamint amargarin vásárlási gyakoriságának vizsgálata Magyarországon. Tejgazdaság,65 (1) 8-14 (2005)