
Ph.D Day presentation
53
Agenda Methodology procedure Lee Carter Model theory Lee Carter Model theory Lee Carter Model theory Theory of Multi-Population Longevity Risk A. Ntamjokouen, Università degli Studi di Bergamo, Italy Ph.D thesis in Economics, Applied Mathematics and Operational Research Bergamo, 13 rd February 2014
-
Upload
ntamjokouen-sobgni-achille -
Category
Documents
-
view
39 -
download
0
Transcript of Ph.D Day presentation

Agenda Methodology procedure Lee Carter Model theory Lee Carter Model theory Lee Carter Model theory Theory of VAR and VECM models Cointegration rank from Canadian provincial mortality Diagnostics of residuals VAR and VECM out of sample Backtesting VAR and VECM out of sample Historical volatility of out-of-sample beyond 25 years Projection of VAR model for each Males Projection VAR models for each province Projection of VECM model for singular Male group Projection of VECM model for singular female group Pricing of annuities Pricing of annuities Agenda Literature ARIMA Model Fitting results with VECM Diagnostic residuals of VECM models Backtesting results of the three models Theory of VAR and VECM models Projection models for each province Projection models for each province Projection models for each province Projection models for each province Projection models for each province Projection models for each province Forecasting results from VECM model Applications Agenda Literature Review Statistics on the Evolution of demography in the USA Preliminary analysis with PCA on the life expectancy by races Projection models for each race group Projection models for each race group Projection models for each race group Projection models for each race group Projection models for each race group Projection models for each race group Conclusions
Multi-Population Longevity Risk
A. Ntamjokouen, Università degli Studi di Bergamo, Italy
Ph.D thesis in Economics, Applied Mathematics andOperational Research
Bergamo, 13rd February 2014

Agenda Methodology procedure Lee Carter Model theory Lee Carter Model theory Lee Carter Model theory Theory of VAR and VECM models Cointegration rank from Canadian provincial mortality Diagnostics of residuals VAR and VECM out of sample Backtesting VAR and VECM out of sample Historical volatility of out-of-sample beyond 25 years Projection of VAR model for each Males Projection VAR models for each province Projection of VECM model for singular Male group Projection of VECM model for singular female group Pricing of annuities Pricing of annuities Agenda Literature ARIMA Model Fitting results with VECM Diagnostic residuals of VECM models Backtesting results of the three models Theory of VAR and VECM models Projection models for each province Projection models for each province Projection models for each province Projection models for each province Projection models for each province Projection models for each province Forecasting results from VECM model Applications Agenda Literature Review Statistics on the Evolution of demography in the USA Preliminary analysis with PCA on the life expectancy by races Projection models for each race group Projection models for each race group Projection models for each race group Projection models for each race group Projection models for each race group Projection models for each race group Conclusions
Outline
Chapter 1: Literature review on muti-population longevityriskChapter 2: Multi-population Longevity risk acrossCanadian provincesChapter 3: Multi-population longevity risk life expectancyacross Canadian provincesChapter 4: Modeling Multi-population life expectancy byraces

Agenda Methodology procedure Lee Carter Model theory Lee Carter Model theory Lee Carter Model theory Theory of VAR and VECM models Cointegration rank from Canadian provincial mortality Diagnostics of residuals VAR and VECM out of sample Backtesting VAR and VECM out of sample Historical volatility of out-of-sample beyond 25 years Projection of VAR model for each Males Projection VAR models for each province Projection of VECM model for singular Male group Projection of VECM model for singular female group Pricing of annuities Pricing of annuities Agenda Literature ARIMA Model Fitting results with VECM Diagnostic residuals of VECM models Backtesting results of the three models Theory of VAR and VECM models Projection models for each province Projection models for each province Projection models for each province Projection models for each province Projection models for each province Projection models for each province Forecasting results from VECM model Applications Agenda Literature Review Statistics on the Evolution of demography in the USA Preliminary analysis with PCA on the life expectancy by races Projection models for each race group Projection models for each race group Projection models for each race group Projection models for each race group Projection models for each race group Projection models for each race group Conclusions
Outline
Introduction of the context on longevity riskLiterature review on single and multi-populationFinancial applicationsMeasuring multi-population longevity risk across mortalityindices in Canada

Agenda Methodology procedure Lee Carter Model theory Lee Carter Model theory Lee Carter Model theory Theory of VAR and VECM models Cointegration rank from Canadian provincial mortality Diagnostics of residuals VAR and VECM out of sample Backtesting VAR and VECM out of sample Historical volatility of out-of-sample beyond 25 years Projection of VAR model for each Males Projection VAR models for each province Projection of VECM model for singular Male group Projection of VECM model for singular female group Pricing of annuities Pricing of annuities Agenda Literature ARIMA Model Fitting results with VECM Diagnostic residuals of VECM models Backtesting results of the three models Theory of VAR and VECM models Projection models for each province Projection models for each province Projection models for each province Projection models for each province Projection models for each province Projection models for each province Forecasting results from VECM model Applications Agenda Literature Review Statistics on the Evolution of demography in the USA Preliminary analysis with PCA on the life expectancy by races Projection models for each race group Projection models for each race group Projection models for each race group Projection models for each race group Projection models for each race group Projection models for each race group Conclusions
Literature
Lee Carter Model(1992), Lee Miller(2001), BoothMaindonal Smith Variant(2002), Hyndman andUllah(2005), De Jong and Tickle(2006), RenshawHaberman(2006) with cohort effect, Currie(2004) withP-Splines, and Currie(2006) with Age period Cohort,Cairns-Blake-Dowd(2009).Darkiewicz(2004): Lee Carter validity as a cointegrationapproach; Lazar and Denuit(2009): common trendsbetween 5 age groups mortality; Njenga and sherris(2011):cointegration among Heligman Pollard parameters;D’Amato(2013): Multi-Population longevity risk amongcountries; Sharon S. Yang et al. (2009) pricing of longevitybonds derivatives among 4 countriesSalhi and Loisel(2010) and Zhou et al(2012) on the basisrisk; Jarner and Kryger(2011).

Agenda Methodology procedure Lee Carter Model theory Lee Carter Model theory Lee Carter Model theory Theory of VAR and VECM models Cointegration rank from Canadian provincial mortality Diagnostics of residuals VAR and VECM out of sample Backtesting VAR and VECM out of sample Historical volatility of out-of-sample beyond 25 years Projection of VAR model for each Males Projection VAR models for each province Projection of VECM model for singular Male group Projection of VECM model for singular female group Pricing of annuities Pricing of annuities Agenda Literature ARIMA Model Fitting results with VECM Diagnostic residuals of VECM models Backtesting results of the three models Theory of VAR and VECM models Projection models for each province Projection models for each province Projection models for each province Projection models for each province Projection models for each province Projection models for each province Forecasting results from VECM model Applications Agenda Literature Review Statistics on the Evolution of demography in the USA Preliminary analysis with PCA on the life expectancy by races Projection models for each race group Projection models for each race group Projection models for each race group Projection models for each race group Projection models for each race group Projection models for each race group Conclusions
Motivations
Here, we contribute to the modeling of multi-populationsmortality indices with applications of annuities by cohorts. Wemodel multi-population life expectancy with applications on theengineering of new type longevity bond. This work is based onmulti-population rather than 1 as in the existing literature.Why multi-provinces longevity risk in general?
Pricing of life insurance annuities accross countries orregions within a countryEngineering of longevity bonds derivatives: EIB & BNPParis and Swiss Re longevity bond based on mortalityindicesSurvivor bond proposed by Burrow(2001) based on theage of the last survivor in the portfolioHedging variations of life expectancy pattern

Agenda Methodology procedure Lee Carter Model theory Lee Carter Model theory Lee Carter Model theory Theory of VAR and VECM models Cointegration rank from Canadian provincial mortality Diagnostics of residuals VAR and VECM out of sample Backtesting VAR and VECM out of sample Historical volatility of out-of-sample beyond 25 years Projection of VAR model for each Males Projection VAR models for each province Projection of VECM model for singular Male group Projection of VECM model for singular female group Pricing of annuities Pricing of annuities Agenda Literature ARIMA Model Fitting results with VECM Diagnostic residuals of VECM models Backtesting results of the three models Theory of VAR and VECM models Projection models for each province Projection models for each province Projection models for each province Projection models for each province Projection models for each province Projection models for each province Forecasting results from VECM model Applications Agenda Literature Review Statistics on the Evolution of demography in the USA Preliminary analysis with PCA on the life expectancy by races Projection models for each race group Projection models for each race group Projection models for each race group Projection models for each race group Projection models for each race group Projection models for each race group Conclusions
Methodology
We retrieve the mortality indices produced by the LeeCarter model for the 9 mortality ratesThe determination of order of integration for each of the 9mortality indices using the Augmented Dickey Fuller,Philips-Perron as well as KPSS TestThe computation of the optimal value of lag of the vector ofautoregressive modelthe Johansen cointegration test which test thecointegration rank and specify which variable will enter inthe cointegrated equations and in the Vector of Errorcorrection modelThe estimation of VECM and the VAR models and theforecasting of derived model.

Agenda Methodology procedure Lee Carter Model theory Lee Carter Model theory Lee Carter Model theory Theory of VAR and VECM models Cointegration rank from Canadian provincial mortality Diagnostics of residuals VAR and VECM out of sample Backtesting VAR and VECM out of sample Historical volatility of out-of-sample beyond 25 years Projection of VAR model for each Males Projection VAR models for each province Projection of VECM model for singular Male group Projection of VECM model for singular female group Pricing of annuities Pricing of annuities Agenda Literature ARIMA Model Fitting results with VECM Diagnostic residuals of VECM models Backtesting results of the three models Theory of VAR and VECM models Projection models for each province Projection models for each province Projection models for each province Projection models for each province Projection models for each province Projection models for each province Forecasting results from VECM model Applications Agenda Literature Review Statistics on the Evolution of demography in the USA Preliminary analysis with PCA on the life expectancy by races Projection models for each race group Projection models for each race group Projection models for each race group Projection models for each race group Projection models for each race group Projection models for each race group Conclusions
Lee Carter Model for each of 9 mortality rates groups
We retrieved the singular mortality indice from the 9 provincesthrough Lee Carter model.The Lee carter Model is described as followed:
ln(m1(t, 1)) = a1,x + bxk1,t + e1,t (1)
where:ax describes the shape of age profile of mortality;bx coefficient describes the variation of death rates to variation in thelevel of mortality;kt is the mortality index;ex,t is the error term with ex,t ∼ N(0, σ2
u) is white noise which is theage feature mortality not captured by the model.

Agenda Methodology procedure Lee Carter Model theory Lee Carter Model theory Lee Carter Model theory Theory of VAR and VECM models Cointegration rank from Canadian provincial mortality Diagnostics of residuals VAR and VECM out of sample Backtesting VAR and VECM out of sample Historical volatility of out-of-sample beyond 25 years Projection of VAR model for each Males Projection VAR models for each province Projection of VECM model for singular Male group Projection of VECM model for singular female group Pricing of annuities Pricing of annuities Agenda Literature ARIMA Model Fitting results with VECM Diagnostic residuals of VECM models Backtesting results of the three models Theory of VAR and VECM models Projection models for each province Projection models for each province Projection models for each province Projection models for each province Projection models for each province Projection models for each province Forecasting results from VECM model Applications Agenda Literature Review Statistics on the Evolution of demography in the USA Preliminary analysis with PCA on the life expectancy by races Projection models for each race group Projection models for each race group Projection models for each race group Projection models for each race group Projection models for each race group Projection models for each race group Conclusions
Males Mortality indices for each province in Canada

Agenda Methodology procedure Lee Carter Model theory Lee Carter Model theory Lee Carter Model theory Theory of VAR and VECM models Cointegration rank from Canadian provincial mortality Diagnostics of residuals VAR and VECM out of sample Backtesting VAR and VECM out of sample Historical volatility of out-of-sample beyond 25 years Projection of VAR model for each Males Projection VAR models for each province Projection of VECM model for singular Male group Projection of VECM model for singular female group Pricing of annuities Pricing of annuities Agenda Literature ARIMA Model Fitting results with VECM Diagnostic residuals of VECM models Backtesting results of the three models Theory of VAR and VECM models Projection models for each province Projection models for each province Projection models for each province Projection models for each province Projection models for each province Projection models for each province Forecasting results from VECM model Applications Agenda Literature Review Statistics on the Evolution of demography in the USA Preliminary analysis with PCA on the life expectancy by races Projection models for each race group Projection models for each race group Projection models for each race group Projection models for each race group Projection models for each race group Projection models for each race group Conclusions
Females Mortality indices for each province in Canada

Agenda Methodology procedure Lee Carter Model theory Lee Carter Model theory Lee Carter Model theory Theory of VAR and VECM models Cointegration rank from Canadian provincial mortality Diagnostics of residuals VAR and VECM out of sample Backtesting VAR and VECM out of sample Historical volatility of out-of-sample beyond 25 years Projection of VAR model for each Males Projection VAR models for each province Projection of VECM model for singular Male group Projection of VECM model for singular female group Pricing of annuities Pricing of annuities Agenda Literature ARIMA Model Fitting results with VECM Diagnostic residuals of VECM models Backtesting results of the three models Theory of VAR and VECM models Projection models for each province Projection models for each province Projection models for each province Projection models for each province Projection models for each province Projection models for each province Forecasting results from VECM model Applications Agenda Literature Review Statistics on the Evolution of demography in the USA Preliminary analysis with PCA on the life expectancy by races Projection models for each race group Projection models for each race group Projection models for each race group Projection models for each race group Projection models for each race group Projection models for each race group Conclusions
VAR and VECM models
The VAR model is derived as described below: The vectorautoregression for p lags is written in Lutkepohl(2005) as:
kt = ν + η1kt−1 + η2kt−2 + ......ηpkt−p + et (2)
where kt = (k1,t, k2,t, .....kN,t)′
is a N-dimentional time series,ηi are matrices with the coefficient parameters (S ∗ S) ,ν = (ν1, ν2, .....νp)
′is the intercept term, et is the residuals part
with white noise and t = 0, 1, ....T and p the last lag order..
According to Pfaff(2008), the VAR (p) can be converted into VECM asfollows:
∆kt = Γ1∆kt−1 + Γ2∆kt−2 + ...+ Γp−1∆kt−p+1 + Πkt−p + ν + εt (3)
where Γi = −(I − η1 + .....− ηi), for i = 1, ...p− 1 andΠ = −(I − η1 − ......− ηp).

Agenda Methodology procedure Lee Carter Model theory Lee Carter Model theory Lee Carter Model theory Theory of VAR and VECM models Cointegration rank from Canadian provincial mortality Diagnostics of residuals VAR and VECM out of sample Backtesting VAR and VECM out of sample Historical volatility of out-of-sample beyond 25 years Projection of VAR model for each Males Projection VAR models for each province Projection of VECM model for singular Male group Projection of VECM model for singular female group Pricing of annuities Pricing of annuities Agenda Literature ARIMA Model Fitting results with VECM Diagnostic residuals of VECM models Backtesting results of the three models Theory of VAR and VECM models Projection models for each province Projection models for each province Projection models for each province Projection models for each province Projection models for each province Projection models for each province Forecasting results from VECM model Applications Agenda Literature Review Statistics on the Evolution of demography in the USA Preliminary analysis with PCA on the life expectancy by races Projection models for each race group Projection models for each race group Projection models for each race group Projection models for each race group Projection models for each race group Projection models for each race group Conclusions
Evidence of the cointegrated equations for Canadianprovincial mortality level with critical values at 5%,10% and 1%
Information Crtieria: HQ, SC and FPE indicate 1 optimal lagswhile AIC is 6. According to Lutkepohl(2005), the preferencewill be given to SC which is 1.
r test value 5% 10% 1%r <= 8 3.34 9.24 7.52 12.97r <= 7 11.38 19.96 17.85 24.6r <= 6 25.50 34.91 32 41.07r <= 5 46.40 53.12 49.65 60.16r <= 4 84.23 76.07 71.86 84.45r <= 3 127.73 102.14 97.18 111.01r <= 2 175.99 131.7 126.58 143.09r <= 1 229.25 165.58 159.48 117.2r = 0 300.68 202.92 196.37 215.74
Table 1: Evidence of the cointegrated equations for Canadianprovincial Mortality level with critical values at 5%, 10% and 1%
.

Agenda Methodology procedure Lee Carter Model theory Lee Carter Model theory Lee Carter Model theory Theory of VAR and VECM models Cointegration rank from Canadian provincial mortality Diagnostics of residuals VAR and VECM out of sample Backtesting VAR and VECM out of sample Historical volatility of out-of-sample beyond 25 years Projection of VAR model for each Males Projection VAR models for each province Projection of VECM model for singular Male group Projection of VECM model for singular female group Pricing of annuities Pricing of annuities Agenda Literature ARIMA Model Fitting results with VECM Diagnostic residuals of VECM models Backtesting results of the three models Theory of VAR and VECM models Projection models for each province Projection models for each province Projection models for each province Projection models for each province Projection models for each province Projection models for each province Forecasting results from VECM model Applications Agenda Literature Review Statistics on the Evolution of demography in the USA Preliminary analysis with PCA on the life expectancy by races Projection models for each race group Projection models for each race group Projection models for each race group Projection models for each race group Projection models for each race group Projection models for each race group Conclusions
Backtesting of the two models VAR and VECM
Out-of-samples VAR(M) VAR(F) VECM(M) VECM(F)Portmanteau test 0.81 0.68 0.97 0.75JB Multivariate 0.18 0.31 0.04 0.16
Skewness 0.88 0.17 0.17 0.062Kurtosis 0.02 0.56 0.0507 0.59
Table 2: Diagnostics of residuals for VAR and VECM models in bothgenders cases

Agenda Methodology procedure Lee Carter Model theory Lee Carter Model theory Lee Carter Model theory Theory of VAR and VECM models Cointegration rank from Canadian provincial mortality Diagnostics of residuals VAR and VECM out of sample Backtesting VAR and VECM out of sample Historical volatility of out-of-sample beyond 25 years Projection of VAR model for each Males Projection VAR models for each province Projection of VECM model for singular Male group Projection of VECM model for singular female group Pricing of annuities Pricing of annuities Agenda Literature ARIMA Model Fitting results with VECM Diagnostic residuals of VECM models Backtesting results of the three models Theory of VAR and VECM models Projection models for each province Projection models for each province Projection models for each province Projection models for each province Projection models for each province Projection models for each province Forecasting results from VECM model Applications Agenda Literature Review Statistics on the Evolution of demography in the USA Preliminary analysis with PCA on the life expectancy by races Projection models for each race group Projection models for each race group Projection models for each race group Projection models for each race group Projection models for each race group Projection models for each race group Conclusions
Backtesting of the two models VAR and VECM
Sex group Females MalesOut-of-samples VAR | VECM VAR | VECMh=2005-2009 5.63% | 5.13% 6.85%| 5.73%h=2002-2009 6.66% | 6.52% 9.47%|10.96%h=2000-2009 12.89%|7.43% 8.42%|22.91%h=1995-2009 16.38%|9.79% 10.66%|2.45%h=1990-2009 19.36%|15.14% 29.67%|24.51%h=1984-2009 21.77%|16.80% 39.80%|30.01%
Table 3: The average MAPE for models VAR and VECM for the 9provinces

Agenda Methodology procedure Lee Carter Model theory Lee Carter Model theory Lee Carter Model theory Theory of VAR and VECM models Cointegration rank from Canadian provincial mortality Diagnostics of residuals VAR and VECM out of sample Backtesting VAR and VECM out of sample Historical volatility of out-of-sample beyond 25 years Projection of VAR model for each Males Projection VAR models for each province Projection of VECM model for singular Male group Projection of VECM model for singular female group Pricing of annuities Pricing of annuities Agenda Literature ARIMA Model Fitting results with VECM Diagnostic residuals of VECM models Backtesting results of the three models Theory of VAR and VECM models Projection models for each province Projection models for each province Projection models for each province Projection models for each province Projection models for each province Projection models for each province Forecasting results from VECM model Applications Agenda Literature Review Statistics on the Evolution of demography in the USA Preliminary analysis with PCA on the life expectancy by races Projection models for each race group Projection models for each race group Projection models for each race group Projection models for each race group Projection models for each race group Projection models for each race group Conclusions
Volatility of the two models VAR and VECM
Out-of-samples Sex Historic VAR VECMh=1995-2009 Males 166.31 37.23 48.10
Females 98.16 91.19 78.51h=1990-2009 Males 172.9 52.17 59.75
Females 107.77 114.88 107.72h=1984-2009 Males 213.93 67.46 69.44
Females 124.45 139.94 136.18
Table 4: Comparison of volatility of historical mortality without-of-sample forecasts produced by models VAR and VECM with insample

Agenda Methodology procedure Lee Carter Model theory Lee Carter Model theory Lee Carter Model theory Theory of VAR and VECM models Cointegration rank from Canadian provincial mortality Diagnostics of residuals VAR and VECM out of sample Backtesting VAR and VECM out of sample Historical volatility of out-of-sample beyond 25 years Projection of VAR model for each Males Projection VAR models for each province Projection of VECM model for singular Male group Projection of VECM model for singular female group Pricing of annuities Pricing of annuities Agenda Literature ARIMA Model Fitting results with VECM Diagnostic residuals of VECM models Backtesting results of the three models Theory of VAR and VECM models Projection models for each province Projection models for each province Projection models for each province Projection models for each province Projection models for each province Projection models for each province Forecasting results from VECM model Applications Agenda Literature Review Statistics on the Evolution of demography in the USA Preliminary analysis with PCA on the life expectancy by races Projection models for each race group Projection models for each race group Projection models for each race group Projection models for each race group Projection models for each race group Projection models for each race group Conclusions
Projecting Males mortality indices for all otherprovinces with VAR models

Agenda Methodology procedure Lee Carter Model theory Lee Carter Model theory Lee Carter Model theory Theory of VAR and VECM models Cointegration rank from Canadian provincial mortality Diagnostics of residuals VAR and VECM out of sample Backtesting VAR and VECM out of sample Historical volatility of out-of-sample beyond 25 years Projection of VAR model for each Males Projection VAR models for each province Projection of VECM model for singular Male group Projection of VECM model for singular female group Pricing of annuities Pricing of annuities Agenda Literature ARIMA Model Fitting results with VECM Diagnostic residuals of VECM models Backtesting results of the three models Theory of VAR and VECM models Projection models for each province Projection models for each province Projection models for each province Projection models for each province Projection models for each province Projection models for each province Forecasting results from VECM model Applications Agenda Literature Review Statistics on the Evolution of demography in the USA Preliminary analysis with PCA on the life expectancy by races Projection models for each race group Projection models for each race group Projection models for each race group Projection models for each race group Projection models for each race group Projection models for each race group Conclusions
Projecting Females mortality indices for all otherprovinces with VAR models

Agenda Methodology procedure Lee Carter Model theory Lee Carter Model theory Lee Carter Model theory Theory of VAR and VECM models Cointegration rank from Canadian provincial mortality Diagnostics of residuals VAR and VECM out of sample Backtesting VAR and VECM out of sample Historical volatility of out-of-sample beyond 25 years Projection of VAR model for each Males Projection VAR models for each province Projection of VECM model for singular Male group Projection of VECM model for singular female group Pricing of annuities Pricing of annuities Agenda Literature ARIMA Model Fitting results with VECM Diagnostic residuals of VECM models Backtesting results of the three models Theory of VAR and VECM models Projection models for each province Projection models for each province Projection models for each province Projection models for each province Projection models for each province Projection models for each province Forecasting results from VECM model Applications Agenda Literature Review Statistics on the Evolution of demography in the USA Preliminary analysis with PCA on the life expectancy by races Projection models for each race group Projection models for each race group Projection models for each race group Projection models for each race group Projection models for each race group Projection models for each race group Conclusions
Forecasting Canadian Males Mortality indices from theVector of Error Correction model

Agenda Methodology procedure Lee Carter Model theory Lee Carter Model theory Lee Carter Model theory Theory of VAR and VECM models Cointegration rank from Canadian provincial mortality Diagnostics of residuals VAR and VECM out of sample Backtesting VAR and VECM out of sample Historical volatility of out-of-sample beyond 25 years Projection of VAR model for each Males Projection VAR models for each province Projection of VECM model for singular Male group Projection of VECM model for singular female group Pricing of annuities Pricing of annuities Agenda Literature ARIMA Model Fitting results with VECM Diagnostic residuals of VECM models Backtesting results of the three models Theory of VAR and VECM models Projection models for each province Projection models for each province Projection models for each province Projection models for each province Projection models for each province Projection models for each province Forecasting results from VECM model Applications Agenda Literature Review Statistics on the Evolution of demography in the USA Preliminary analysis with PCA on the life expectancy by races Projection models for each race group Projection models for each race group Projection models for each race group Projection models for each race group Projection models for each race group Projection models for each race group Conclusions
Forecasting Canadian females Mortality indices fromthe Vector of Error Correction model

Agenda Methodology procedure Lee Carter Model theory Lee Carter Model theory Lee Carter Model theory Theory of VAR and VECM models Cointegration rank from Canadian provincial mortality Diagnostics of residuals VAR and VECM out of sample Backtesting VAR and VECM out of sample Historical volatility of out-of-sample beyond 25 years Projection of VAR model for each Males Projection VAR models for each province Projection of VECM model for singular Male group Projection of VECM model for singular female group Pricing of annuities Pricing of annuities Agenda Literature ARIMA Model Fitting results with VECM Diagnostic residuals of VECM models Backtesting results of the three models Theory of VAR and VECM models Projection models for each province Projection models for each province Projection models for each province Projection models for each province Projection models for each province Projection models for each province Forecasting results from VECM model Applications Agenda Literature Review Statistics on the Evolution of demography in the USA Preliminary analysis with PCA on the life expectancy by races Projection models for each race group Projection models for each race group Projection models for each race group Projection models for each race group Projection models for each race group Projection models for each race group Conclusions
Pricing annuities of females cohorts 1960,1970,1980,1990 and 2000
Here we present results from Alberta, but we have found similarconclusions as in Alberta for the other 8 involved in theanalysis.
Females ARIMA VAR VECMCohorts Life time | APV Life time | APV Life time | APV
1960 16.65 | 7.85 16.73| 7.91 17.81| 8.381970 18.25 | 8.16 18.42| 8.23 19.5| 8.791980 19.56 | 8.45 19.67| 8.52 20.96| 9.141990 20.68 | 8.72 20.86| 8.79 22.29| 9.452000 21.54 | 8.97 21.7| 9.03 23.21| 9.71
Table 5: Price of annuity and life time after 65 years old from Albertaprovinces cohorts 1960, 1970,1980,1990 and 2000

Agenda Methodology procedure Lee Carter Model theory Lee Carter Model theory Lee Carter Model theory Theory of VAR and VECM models Cointegration rank from Canadian provincial mortality Diagnostics of residuals VAR and VECM out of sample Backtesting VAR and VECM out of sample Historical volatility of out-of-sample beyond 25 years Projection of VAR model for each Males Projection VAR models for each province Projection of VECM model for singular Male group Projection of VECM model for singular female group Pricing of annuities Pricing of annuities Agenda Literature ARIMA Model Fitting results with VECM Diagnostic residuals of VECM models Backtesting results of the three models Theory of VAR and VECM models Projection models for each province Projection models for each province Projection models for each province Projection models for each province Projection models for each province Projection models for each province Forecasting results from VECM model Applications Agenda Literature Review Statistics on the Evolution of demography in the USA Preliminary analysis with PCA on the life expectancy by races Projection models for each race group Projection models for each race group Projection models for each race group Projection models for each race group Projection models for each race group Projection models for each race group Conclusions
Pricing annuities of Males cohorts 1960,1970,1980,1990 and 2000
Here we present results from Alberta, but we have found similarconclusions as in Alberta for the other 8 involved in theanalysis.
Males ARIMA VAR VECMCohorts Life time | APV Life time | APV Life time | APV
1960 11.39 | 6.65 12.34| 7.29 12.58| 7.431970 13.63 |7.08 15.26 | 8.02 15.54 | 8.151980 15.62 | 7.49 17.89 | 8.7 18.15 | 8.811990 17.91 | 7.87 20.9 | 9.33 21.11| 9.42000 19.53 | 8.22 23.08| 9.88 23.22 | 9.91
Table 6: Pricing annuities and life time after 65 years old fromAlberta province of male cohorts 1960, 1970,1980,1990 and 2000

Agenda Methodology procedure Lee Carter Model theory Lee Carter Model theory Lee Carter Model theory Theory of VAR and VECM models Cointegration rank from Canadian provincial mortality Diagnostics of residuals VAR and VECM out of sample Backtesting VAR and VECM out of sample Historical volatility of out-of-sample beyond 25 years Projection of VAR model for each Males Projection VAR models for each province Projection of VECM model for singular Male group Projection of VECM model for singular female group Pricing of annuities Pricing of annuities Agenda Literature ARIMA Model Fitting results with VECM Diagnostic residuals of VECM models Backtesting results of the three models Theory of VAR and VECM models Projection models for each province Projection models for each province Projection models for each province Projection models for each province Projection models for each province Projection models for each province Forecasting results from VECM model Applications Agenda Literature Review Statistics on the Evolution of demography in the USA Preliminary analysis with PCA on the life expectancy by races Projection models for each race group Projection models for each race group Projection models for each race group Projection models for each race group Projection models for each race group Projection models for each race group Conclusions
Outline
Introduction and context on life expectancy longevity riskMethodologyResults with applications on Canadian provincesIntroduction of new longevity bond based on province lifeexpectancy

Agenda Methodology procedure Lee Carter Model theory Lee Carter Model theory Lee Carter Model theory Theory of VAR and VECM models Cointegration rank from Canadian provincial mortality Diagnostics of residuals VAR and VECM out of sample Backtesting VAR and VECM out of sample Historical volatility of out-of-sample beyond 25 years Projection of VAR model for each Males Projection VAR models for each province Projection of VECM model for singular Male group Projection of VECM model for singular female group Pricing of annuities Pricing of annuities Agenda Literature ARIMA Model Fitting results with VECM Diagnostic residuals of VECM models Backtesting results of the three models Theory of VAR and VECM models Projection models for each province Projection models for each province Projection models for each province Projection models for each province Projection models for each province Projection models for each province Forecasting results from VECM model Applications Agenda Literature Review Statistics on the Evolution of demography in the USA Preliminary analysis with PCA on the life expectancy by races Projection models for each race group Projection models for each race group Projection models for each race group Projection models for each race group Projection models for each race group Projection models for each race group Conclusions
Literature reviewThe Biological techniques such as Oeppen andVaupel(2002)Extrapolative method such as Lee Carter(1992),Whitehouse(2007), Rusolillo(2005), De Beer and Alders(1999), Keilman, Pham and Hetland (2001), AldersKeilman and Cruijsen (2007)Torri(2011) focuses analysis on countries

Agenda Methodology procedure Lee Carter Model theory Lee Carter Model theory Lee Carter Model theory Theory of VAR and VECM models Cointegration rank from Canadian provincial mortality Diagnostics of residuals VAR and VECM out of sample Backtesting VAR and VECM out of sample Historical volatility of out-of-sample beyond 25 years Projection of VAR model for each Males Projection VAR models for each province Projection of VECM model for singular Male group Projection of VECM model for singular female group Pricing of annuities Pricing of annuities Agenda Literature ARIMA Model Fitting results with VECM Diagnostic residuals of VECM models Backtesting results of the three models Theory of VAR and VECM models Projection models for each province Projection models for each province Projection models for each province Projection models for each province Projection models for each province Projection models for each province Forecasting results from VECM model Applications Agenda Literature Review Statistics on the Evolution of demography in the USA Preliminary analysis with PCA on the life expectancy by races Projection models for each race group Projection models for each race group Projection models for each race group Projection models for each race group Projection models for each race group Projection models for each race group Conclusions
In general ARIMA is described as:
Lt = a0 + a1Lt−1 + εt (4)
where a0 is the drift term , Lt−1 is the time series, εt is the error
term distributed with ε ∼ (0, σ2)The 3 steps of the process are:Identification: This consists of plotting data and identifying thepattern of the time series.Order Estimation of the model: combinations of p, d, q wherep is the number of autoregressive parameters d is the drift, q isthe moving average parameters (q) to obtain the best modelModel Validation: checking the diagnostics of residuals fromthe chosen models by plotting the autocorrelation residuals andexperimenting a Portmanteau test of the residuals

Agenda Methodology procedure Lee Carter Model theory Lee Carter Model theory Lee Carter Model theory Theory of VAR and VECM models Cointegration rank from Canadian provincial mortality Diagnostics of residuals VAR and VECM out of sample Backtesting VAR and VECM out of sample Historical volatility of out-of-sample beyond 25 years Projection of VAR model for each Males Projection VAR models for each province Projection of VECM model for singular Male group Projection of VECM model for singular female group Pricing of annuities Pricing of annuities Agenda Literature ARIMA Model Fitting results with VECM Diagnostic residuals of VECM models Backtesting results of the three models Theory of VAR and VECM models Projection models for each province Projection models for each province Projection models for each province Projection models for each province Projection models for each province Projection models for each province Forecasting results from VECM model Applications Agenda Literature Review Statistics on the Evolution of demography in the USA Preliminary analysis with PCA on the life expectancy by races Projection models for each race group Projection models for each race group Projection models for each race group Projection models for each race group Projection models for each race group Projection models for each race group Conclusions
Model Validation ARIMA: Evaluation of the models for theforecasting uses
lags AL BC NB NS ON QC4 ags 0.83 0.57 0.63 0.23 0.19 0.91
10 lags 0.55 0.54 0.39 0.092 0.55 0.9115 lags 0.67 0.52 0.57 0.11 0.67 0.2620 lags 0.83 0.67 0.76 0.83 0.83 0.35
Table 7: P-values results of Portmanteau test resulted from ARIMAmodels over the period 1921-2009

Agenda Methodology procedure Lee Carter Model theory Lee Carter Model theory Lee Carter Model theory Theory of VAR and VECM models Cointegration rank from Canadian provincial mortality Diagnostics of residuals VAR and VECM out of sample Backtesting VAR and VECM out of sample Historical volatility of out-of-sample beyond 25 years Projection of VAR model for each Males Projection VAR models for each province Projection of VECM model for singular Male group Projection of VECM model for singular female group Pricing of annuities Pricing of annuities Agenda Literature ARIMA Model Fitting results with VECM Diagnostic residuals of VECM models Backtesting results of the three models Theory of VAR and VECM models Projection models for each province Projection models for each province Projection models for each province Projection models for each province Projection models for each province Projection models for each province Forecasting results from VECM model Applications Agenda Literature Review Statistics on the Evolution of demography in the USA Preliminary analysis with PCA on the life expectancy by races Projection models for each race group Projection models for each race group Projection models for each race group Projection models for each race group Projection models for each race group Projection models for each race group Conclusions
VAR and VECM models
We analyse the optimal lag length of the VAR model.Information criteria shows contradictory results: AIC and FPEindicate 3 optimal lags while HQ indicate a lag order of 2 andfinally SC of only 1. Since they differ, Lutkepohl(2005), showsthat the preference will be given to SC. Consequently, the laglength is 1.
Cointegrating relationship critical values 5pct 1pct5 3.09 9.24 12.974 10.29 19.96 24.603 32.45 34.91 41.072 71.31 53.12 60.161 118.49 76.07 84.450 193.08 102.14 111.01
Table 8: The cointegration relations under trace test

Agenda Methodology procedure Lee Carter Model theory Lee Carter Model theory Lee Carter Model theory Theory of VAR and VECM models Cointegration rank from Canadian provincial mortality Diagnostics of residuals VAR and VECM out of sample Backtesting VAR and VECM out of sample Historical volatility of out-of-sample beyond 25 years Projection of VAR model for each Males Projection VAR models for each province Projection of VECM model for singular Male group Projection of VECM model for singular female group Pricing of annuities Pricing of annuities Agenda Literature ARIMA Model Fitting results with VECM Diagnostic residuals of VECM models Backtesting results of the three models Theory of VAR and VECM models Projection models for each province Projection models for each province Projection models for each province Projection models for each province Projection models for each province Projection models for each province Forecasting results from VECM model Applications Agenda Literature Review Statistics on the Evolution of demography in the USA Preliminary analysis with PCA on the life expectancy by races Projection models for each race group Projection models for each race group Projection models for each race group Projection models for each race group Projection models for each race group Projection models for each race group Conclusions
VAR and VECM models
Type of test Specific name p-valuesAutocorrelation Portmanteau(4 lags) 0.0009
Normality Both 0.23Kurtosis 0.195
Skewness 0.36
Table 9: The diagnostics tests of residuals under VAR model
Type of test Autocorrelation p-valuesAutocorrelation Portmanteau(4 lags) 0.0018
Normality Both 0.0675Kurtosis 0.07
Skewness 0.195
Table 10: The diagnostics tests of residuals of VECM

Agenda Methodology procedure Lee Carter Model theory Lee Carter Model theory Lee Carter Model theory Theory of VAR and VECM models Cointegration rank from Canadian provincial mortality Diagnostics of residuals VAR and VECM out of sample Backtesting VAR and VECM out of sample Historical volatility of out-of-sample beyond 25 years Projection of VAR model for each Males Projection VAR models for each province Projection of VECM model for singular Male group Projection of VECM model for singular female group Pricing of annuities Pricing of annuities Agenda Literature ARIMA Model Fitting results with VECM Diagnostic residuals of VECM models Backtesting results of the three models Theory of VAR and VECM models Projection models for each province Projection models for each province Projection models for each province Projection models for each province Projection models for each province Projection models for each province Forecasting results from VECM model Applications Agenda Literature Review Statistics on the Evolution of demography in the USA Preliminary analysis with PCA on the life expectancy by races Projection models for each race group Projection models for each race group Projection models for each race group Projection models for each race group Projection models for each race group Projection models for each race group Conclusions
ARIMA, VAR and VECM models
Out-Of-Sample VECM VAR ARIMAh=2001-2009 0.29% 0.31% 5.51%h=2002-2009 0.27% 0.40% 5.53%h= 2003-2009 0.34% 0.26% 5.60%h=2004-2009 0.28% 0.44% 5.62%h=2005-2009 0.30% 0.23% 5.72%h=2006-2009 0.28% 0.37% 5.86%
Table 11: The average MAPE for models, ARIMA VAR and VECM forthe 6 provinces

Agenda Methodology procedure Lee Carter Model theory Lee Carter Model theory Lee Carter Model theory Theory of VAR and VECM models Cointegration rank from Canadian provincial mortality Diagnostics of residuals VAR and VECM out of sample Backtesting VAR and VECM out of sample Historical volatility of out-of-sample beyond 25 years Projection of VAR model for each Males Projection VAR models for each province Projection of VECM model for singular Male group Projection of VECM model for singular female group Pricing of annuities Pricing of annuities Agenda Literature ARIMA Model Fitting results with VECM Diagnostic residuals of VECM models Backtesting results of the three models Theory of VAR and VECM models Projection models for each province Projection models for each province Projection models for each province Projection models for each province Projection models for each province Projection models for each province Forecasting results from VECM model Applications Agenda Literature Review Statistics on the Evolution of demography in the USA Preliminary analysis with PCA on the life expectancy by races Projection models for each race group Projection models for each race group Projection models for each race group Projection models for each race group Projection models for each race group Projection models for each race group Conclusions
VAR and VECM models
Provinces VECM VAR ARIMAAlberta (1.04-4.58) (1.19-1.73) (1.20-3.44)
British Columbia (1.07-7.06) (1.04-1.49) 1.34-2.32New Brunswick (1.05-6.52) (1.18-2.20) (1.36-5.65)
Nova Scotia (1.11-6.73) (1.27-2.09) (1.32-6.21)Ontario (0.65-6.40) (0.75-1.57) (0.83-5.88)Quebec (1.08-6.33) (1.24-2.64) ( 1.30-6.07)
Table 12: The Confidence Interval of models VAR, VECM andARIMA for the 6 provinces derived from predictions 50 years ahead

Agenda Methodology procedure Lee Carter Model theory Lee Carter Model theory Lee Carter Model theory Theory of VAR and VECM models Cointegration rank from Canadian provincial mortality Diagnostics of residuals VAR and VECM out of sample Backtesting VAR and VECM out of sample Historical volatility of out-of-sample beyond 25 years Projection of VAR model for each Males Projection VAR models for each province Projection of VECM model for singular Male group Projection of VECM model for singular female group Pricing of annuities Pricing of annuities Agenda Literature ARIMA Model Fitting results with VECM Diagnostic residuals of VECM models Backtesting results of the three models Theory of VAR and VECM models Projection models for each province Projection models for each province Projection models for each province Projection models for each province Projection models for each province Projection models for each province Forecasting results from VECM model Applications Agenda Literature Review Statistics on the Evolution of demography in the USA Preliminary analysis with PCA on the life expectancy by races Projection models for each race group Projection models for each race group Projection models for each race group Projection models for each race group Projection models for each race group Projection models for each race group Conclusions
Projecting Females mortality indices for all otherprovinces with VAR models
The Alberta’s Confidence Interval for VECM is Greater than forVAR and ARIMA
Agenda Methodology procedure Lee Carter Model theory Lee Carter Model theory Lee Carter Model theory Theory of VAR and VECM models Cointegration rank from Canadian provincial mortality Diagnostics of residuals VAR and VECM out of sample Backtesting VAR and VECM out of sample Historical volatility of out-of-sample beyond 25 years Projection of VAR model for each Males Projection VAR models for each province Projection of VECM model for singular Male group Projection of VECM model for singular female group Pricing of annuities Pricing of annuities Agenda Literature ARIMA Model Fitting results with VECM Diagnostic residuals of VECM models Backtesting results of the three models Theory of VAR and VECM models Projection models for each province Projection models for each province Projection models for each province Projection models for each province Projection models for each province Projection models for each province Forecasting results from VECM model Applications Agenda Literature Review Statistics on the Evolution of demography in the USA Preliminary analysis with PCA on the life expectancy by races Projection models for each race group Projection models for each race group Projection models for each race group Projection models for each race group Projection models for each race group Projection models for each race group Conclusions
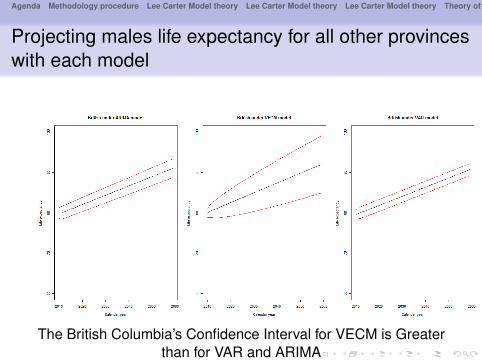
Projecting males life expectancy for all other provinceswith each model
The British Columbia’s Confidence Interval for VECM is Greaterthan for VAR and ARIMA

Agenda Methodology procedure Lee Carter Model theory Lee Carter Model theory Lee Carter Model theory Theory of VAR and VECM models Cointegration rank from Canadian provincial mortality Diagnostics of residuals VAR and VECM out of sample Backtesting VAR and VECM out of sample Historical volatility of out-of-sample beyond 25 years Projection of VAR model for each Males Projection VAR models for each province Projection of VECM model for singular Male group Projection of VECM model for singular female group Pricing of annuities Pricing of annuities Agenda Literature ARIMA Model Fitting results with VECM Diagnostic residuals of VECM models Backtesting results of the three models Theory of VAR and VECM models Projection models for each province Projection models for each province Projection models for each province Projection models for each province Projection models for each province Projection models for each province Forecasting results from VECM model Applications Agenda Literature Review Statistics on the Evolution of demography in the USA Preliminary analysis with PCA on the life expectancy by races Projection models for each race group Projection models for each race group Projection models for each race group Projection models for each race group Projection models for each race group Projection models for each race group Conclusions
Projecting males life expectancy for all other provinceswith each model
The New Brunswick’s Confidence Interval for VECM is Greaterthan for VAR and ARIMA
Agenda Methodology procedure Lee Carter Model theory Lee Carter Model theory Lee Carter Model theory Theory of VAR and VECM models Cointegration rank from Canadian provincial mortality Diagnostics of residuals VAR and VECM out of sample Backtesting VAR and VECM out of sample Historical volatility of out-of-sample beyond 25 years Projection of VAR model for each Males Projection VAR models for each province Projection of VECM model for singular Male group Projection of VECM model for singular female group Pricing of annuities Pricing of annuities Agenda Literature ARIMA Model Fitting results with VECM Diagnostic residuals of VECM models Backtesting results of the three models Theory of VAR and VECM models Projection models for each province Projection models for each province Projection models for each province Projection models for each province Projection models for each province Projection models for each province Forecasting results from VECM model Applications Agenda Literature Review Statistics on the Evolution of demography in the USA Preliminary analysis with PCA on the life expectancy by races Projection models for each race group Projection models for each race group Projection models for each race group Projection models for each race group Projection models for each race group Projection models for each race group Conclusions
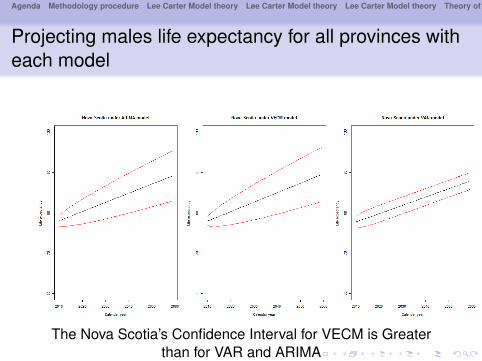
Projecting males life expectancy for all provinces witheach model
The Nova Scotia’s Confidence Interval for VECM is Greaterthan for VAR and ARIMA

Agenda Methodology procedure Lee Carter Model theory Lee Carter Model theory Lee Carter Model theory Theory of VAR and VECM models Cointegration rank from Canadian provincial mortality Diagnostics of residuals VAR and VECM out of sample Backtesting VAR and VECM out of sample Historical volatility of out-of-sample beyond 25 years Projection of VAR model for each Males Projection VAR models for each province Projection of VECM model for singular Male group Projection of VECM model for singular female group Pricing of annuities Pricing of annuities Agenda Literature ARIMA Model Fitting results with VECM Diagnostic residuals of VECM models Backtesting results of the three models Theory of VAR and VECM models Projection models for each province Projection models for each province Projection models for each province Projection models for each province Projection models for each province Projection models for each province Forecasting results from VECM model Applications Agenda Literature Review Statistics on the Evolution of demography in the USA Preliminary analysis with PCA on the life expectancy by races Projection models for each race group Projection models for each race group Projection models for each race group Projection models for each race group Projection models for each race group Projection models for each race group Conclusions
Projecting males life expectancy for all provinces witheach model
The Ontario’s Confidence Interval for VECM is Greater than forVAR and ARIMA
Agenda Methodology procedure Lee Carter Model theory Lee Carter Model theory Lee Carter Model theory Theory of VAR and VECM models Cointegration rank from Canadian provincial mortality Diagnostics of residuals VAR and VECM out of sample Backtesting VAR and VECM out of sample Historical volatility of out-of-sample beyond 25 years Projection of VAR model for each Males Projection VAR models for each province Projection of VECM model for singular Male group Projection of VECM model for singular female group Pricing of annuities Pricing of annuities Agenda Literature ARIMA Model Fitting results with VECM Diagnostic residuals of VECM models Backtesting results of the three models Theory of VAR and VECM models Projection models for each province Projection models for each province Projection models for each province Projection models for each province Projection models for each province Projection models for each province Forecasting results from VECM model Applications Agenda Literature Review Statistics on the Evolution of demography in the USA Preliminary analysis with PCA on the life expectancy by races Projection models for each race group Projection models for each race group Projection models for each race group Projection models for each race group Projection models for each race group Projection models for each race group Conclusions
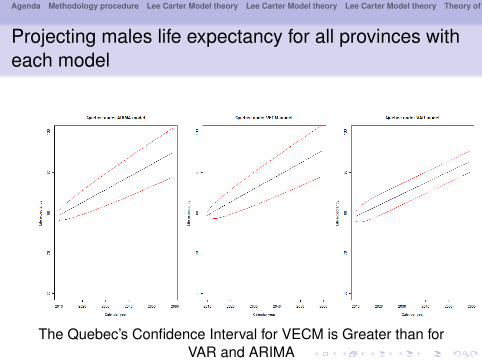
Projecting males life expectancy for all provinces witheach model
The Quebec’s Confidence Interval for VECM is Greater than forVAR and ARIMA

Agenda Methodology procedure Lee Carter Model theory Lee Carter Model theory Lee Carter Model theory Theory of VAR and VECM models Cointegration rank from Canadian provincial mortality Diagnostics of residuals VAR and VECM out of sample Backtesting VAR and VECM out of sample Historical volatility of out-of-sample beyond 25 years Projection of VAR model for each Males Projection VAR models for each province Projection of VECM model for singular Male group Projection of VECM model for singular female group Pricing of annuities Pricing of annuities Agenda Literature ARIMA Model Fitting results with VECM Diagnostic residuals of VECM models Backtesting results of the three models Theory of VAR and VECM models Projection models for each province Projection models for each province Projection models for each province Projection models for each province Projection models for each province Projection models for each province Forecasting results from VECM model Applications Agenda Literature Review Statistics on the Evolution of demography in the USA Preliminary analysis with PCA on the life expectancy by races Projection models for each race group Projection models for each race group Projection models for each race group Projection models for each race group Projection models for each race group Projection models for each race group Conclusions
VAR and VECM models
Year A BC NB NS ON Q2010 79.28 78.12 78.02 79.74 79.74 79.302020 81.26 82.29 80.67 80.06 82.18 82.362030 83.57 84.71 83.23 82.41 84.72 85.592040 85.89 87.13 85.79 84.75 87.26 88.822050 88.21 89.55 88.35 87.10 89.79 92.052060 90.63 91.97 90.92 89.45 92.33 95.27
Table 13: Future forecast of life expectancy with model VECM for the6 provinces

Agenda Methodology procedure Lee Carter Model theory Lee Carter Model theory Lee Carter Model theory Theory of VAR and VECM models Cointegration rank from Canadian provincial mortality Diagnostics of residuals VAR and VECM out of sample Backtesting VAR and VECM out of sample Historical volatility of out-of-sample beyond 25 years Projection of VAR model for each Males Projection VAR models for each province Projection of VECM model for singular Male group Projection of VECM model for singular female group Pricing of annuities Pricing of annuities Agenda Literature ARIMA Model Fitting results with VECM Diagnostic residuals of VECM models Backtesting results of the three models Theory of VAR and VECM models Projection models for each province Projection models for each province Projection models for each province Projection models for each province Projection models for each province Projection models for each province Forecasting results from VECM model Applications Agenda Literature Review Statistics on the Evolution of demography in the USA Preliminary analysis with PCA on the life expectancy by races Projection models for each race group Projection models for each race group Projection models for each race group Projection models for each race group Projection models for each race group Projection models for each race group Conclusions
New product based on the dynamics of life expectancy may beissued.
No credit risk from both parties involvesFinancial markets are liquid and no basis risk
It consists of an initial payment of X with successivepayment coupon C(depending on the dynamic evolution oflife expectancy) with frequency of 10 on a maturity periodof 50 years to correspond to potential investors.We compute the variation of life expectancy of theconsidered regions between the period 2000-2009 which isequal to 2.2. Accordingly, pension plan would pay a certainamount C to the investors if future life expectancy isgreater than 2.2.Coupons are discounted at rate linked to Libor. We build abond with maturity of 50 years since shorter period do notprovide effective hedging( see Dowd et al., 2006b).

Agenda Methodology procedure Lee Carter Model theory Lee Carter Model theory Lee Carter Model theory Theory of VAR and VECM models Cointegration rank from Canadian provincial mortality Diagnostics of residuals VAR and VECM out of sample Backtesting VAR and VECM out of sample Historical volatility of out-of-sample beyond 25 years Projection of VAR model for each Males Projection VAR models for each province Projection of VECM model for singular Male group Projection of VECM model for singular female group Pricing of annuities Pricing of annuities Agenda Literature ARIMA Model Fitting results with VECM Diagnostic residuals of VECM models Backtesting results of the three models Theory of VAR and VECM models Projection models for each province Projection models for each province Projection models for each province Projection models for each province Projection models for each province Projection models for each province Forecasting results from VECM model Applications Agenda Literature Review Statistics on the Evolution of demography in the USA Preliminary analysis with PCA on the life expectancy by races Projection models for each race group Projection models for each race group Projection models for each race group Projection models for each race group Projection models for each race group Projection models for each race group Conclusions
Outline
Introduction of the context on longevity risk by races in theUSAReview on the existing literatureMeasuring multi-population longevity risk of life expectancyPrincipal component analysis to measure multi-populationlife expectancyApplications of autoregressive and multiregressive modelson life expectancyEstimation of Vector Autoregressive model(VAR)The estimation of VECM the forecasting of derivedmodel(VECM).Computations on future life expectancy by races in theUSA.

Agenda Methodology procedure Lee Carter Model theory Lee Carter Model theory Lee Carter Model theory Theory of VAR and VECM models Cointegration rank from Canadian provincial mortality Diagnostics of residuals VAR and VECM out of sample Backtesting VAR and VECM out of sample Historical volatility of out-of-sample beyond 25 years Projection of VAR model for each Males Projection VAR models for each province Projection of VECM model for singular Male group Projection of VECM model for singular female group Pricing of annuities Pricing of annuities Agenda Literature ARIMA Model Fitting results with VECM Diagnostic residuals of VECM models Backtesting results of the three models Theory of VAR and VECM models Projection models for each province Projection models for each province Projection models for each province Projection models for each province Projection models for each province Projection models for each province Forecasting results from VECM model Applications Agenda Literature Review Statistics on the Evolution of demography in the USA Preliminary analysis with PCA on the life expectancy by races Projection models for each race group Projection models for each race group Projection models for each race group Projection models for each race group Projection models for each race group Projection models for each race group Conclusions
Literature
Life expectancy is getting improved, across developpedcountries, as several studies such as Tulgapurkar et.al(2007) and Oeppen(2002) have shown. The UnitedStates of America are not an exception since they havehighlighted also signs of improvements within their nationalpopulation as well as in different races groups living in thecountry.Most work done on this topic have focused on predictingthe pair black-white death rates such as Rives 1977;NCHS (1975), Manton(1980, 1982), Manton et. al(1979)Philipps and Burch(1960), Woodbury et. al(1981), Mantonet. al(1979), Carter(2010).We will focus not only on two but on more races groupswhich include life expectancy from asian and latinoamericans.

Agenda Methodology procedure Lee Carter Model theory Lee Carter Model theory Lee Carter Model theory Theory of VAR and VECM models Cointegration rank from Canadian provincial mortality Diagnostics of residuals VAR and VECM out of sample Backtesting VAR and VECM out of sample Historical volatility of out-of-sample beyond 25 years Projection of VAR model for each Males Projection VAR models for each province Projection of VECM model for singular Male group Projection of VECM model for singular female group Pricing of annuities Pricing of annuities Agenda Literature ARIMA Model Fitting results with VECM Diagnostic residuals of VECM models Backtesting results of the three models Theory of VAR and VECM models Projection models for each province Projection models for each province Projection models for each province Projection models for each province Projection models for each province Projection models for each province Forecasting results from VECM model Applications Agenda Literature Review Statistics on the Evolution of demography in the USA Preliminary analysis with PCA on the life expectancy by races Projection models for each race group Projection models for each race group Projection models for each race group Projection models for each race group Projection models for each race group Projection models for each race group Conclusions
Historical Evolution of race in the USA
Races 1910 1950 1970 2000 2010White 88.9% 89.5% 87.7% 75.1% 72.4%Black 10.7% 10% 11.1% 12.3% 12.6%
American/Indian -0.3% 0.2% 0.8% 3.8% 4.9%Asian 0.2% 0.2% 0.8% 3.8% 4.9%
Hispanic 0.9% 0.8% 0.1% 12.5% 16.3%
Table 14: Statistics census of American population

Agenda Methodology procedure Lee Carter Model theory Lee Carter Model theory Lee Carter Model theory Theory of VAR and VECM models Cointegration rank from Canadian provincial mortality Diagnostics of residuals VAR and VECM out of sample Backtesting VAR and VECM out of sample Historical volatility of out-of-sample beyond 25 years Projection of VAR model for each Males Projection VAR models for each province Projection of VECM model for singular Male group Projection of VECM model for singular female group Pricing of annuities Pricing of annuities Agenda Literature ARIMA Model Fitting results with VECM Diagnostic residuals of VECM models Backtesting results of the three models Theory of VAR and VECM models Projection models for each province Projection models for each province Projection models for each province Projection models for each province Projection models for each province Projection models for each province Forecasting results from VECM model Applications Agenda Literature Review Statistics on the Evolution of demography in the USA Preliminary analysis with PCA on the life expectancy by races Projection models for each race group Projection models for each race group Projection models for each race group Projection models for each race group Projection models for each race group Projection models for each race group Conclusions
Projecting males life expectancy for all provinces witheach model
Principal Component analysis

Agenda Methodology procedure Lee Carter Model theory Lee Carter Model theory Lee Carter Model theory Theory of VAR and VECM models Cointegration rank from Canadian provincial mortality Diagnostics of residuals VAR and VECM out of sample Backtesting VAR and VECM out of sample Historical volatility of out-of-sample beyond 25 years Projection of VAR model for each Males Projection VAR models for each province Projection of VECM model for singular Male group Projection of VECM model for singular female group Pricing of annuities Pricing of annuities Agenda Literature ARIMA Model Fitting results with VECM Diagnostic residuals of VECM models Backtesting results of the three models Theory of VAR and VECM models Projection models for each province Projection models for each province Projection models for each province Projection models for each province Projection models for each province Projection models for each province Forecasting results from VECM model Applications Agenda Literature Review Statistics on the Evolution of demography in the USA Preliminary analysis with PCA on the life expectancy by races Projection models for each race group Projection models for each race group Projection models for each race group Projection models for each race group Projection models for each race group Projection models for each race group Conclusions
with estimations of models ARIMA(p,d,q) All Sex Males(ASM),All Sex Females(ASF), White Females(WF), Black Males(BM),Black Females(BF)
lags ASM ASF WM WF BM BM4 ags 0.63 0.77 0.09 0.53 0.63 0.57
10 lags 0.66 0.87 0.24 0.91 0.66 0.9415 lags 0.10 0.66 0.08 0.45 0.10 0.9320 lags 0.11 0.59 0.13 0.11 0.11 0.75
Table 15: P-values of Portmanteau test resulted from ARIMA modelsover the period 1921-2009

Agenda Methodology procedure Lee Carter Model theory Lee Carter Model theory Lee Carter Model theory Theory of VAR and VECM models Cointegration rank from Canadian provincial mortality Diagnostics of residuals VAR and VECM out of sample Backtesting VAR and VECM out of sample Historical volatility of out-of-sample beyond 25 years Projection of VAR model for each Males Projection VAR models for each province Projection of VECM model for singular Male group Projection of VECM model for singular female group Pricing of annuities Pricing of annuities Agenda Literature ARIMA Model Fitting results with VECM Diagnostic residuals of VECM models Backtesting results of the three models Theory of VAR and VECM models Projection models for each province Projection models for each province Projection models for each province Projection models for each province Projection models for each province Projection models for each province Forecasting results from VECM model Applications Agenda Literature Review Statistics on the Evolution of demography in the USA Preliminary analysis with PCA on the life expectancy by races Projection models for each race group Projection models for each race group Projection models for each race group Projection models for each race group Projection models for each race group Projection models for each race group Conclusions
Cointegrating relationship critical values 5pct 1pct5 0.64 8.18 11.654 8.02 14.90 19.193 13.19 21.07 25.752 19.65 27.14 32.141 23.58 33.32 38.780 57.79 39.43 46.82
Table 16: The cointegration relations under trace test
Agenda Methodology procedure Lee Carter Model theory Lee Carter Model theory Lee Carter Model theory Theory of VAR and VECM models Cointegration rank from Canadian provincial mortality Diagnostics of residuals VAR and VECM out of sample Backtesting VAR and VECM out of sample Historical volatility of out-of-sample beyond 25 years Projection of VAR model for each Males Projection VAR models for each province Projection of VECM model for singular Male group Projection of VECM model for singular female group Pricing of annuities Pricing of annuities Agenda Literature ARIMA Model Fitting results with VECM Diagnostic residuals of VECM models Backtesting results of the three models Theory of VAR and VECM models Projection models for each province Projection models for each province Projection models for each province Projection models for each province Projection models for each province Projection models for each province Forecasting results from VECM model Applications Agenda Literature Review Statistics on the Evolution of demography in the USA Preliminary analysis with PCA on the life expectancy by races Projection models for each race group Projection models for each race group Projection models for each race group Projection models for each race group Projection models for each race group Projection models for each race group Conclusions
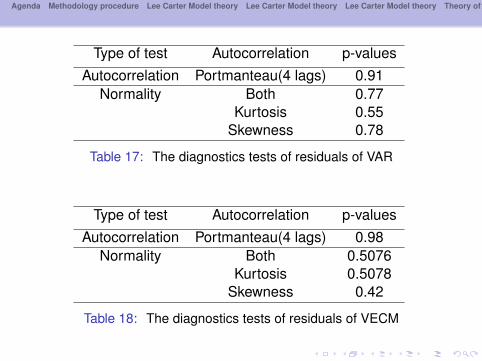
Type of test Autocorrelation p-valuesAutocorrelation Portmanteau(4 lags) 0.91
Normality Both 0.77Kurtosis 0.55
Skewness 0.78
Table 17: The diagnostics tests of residuals of VAR
Type of test Autocorrelation p-valuesAutocorrelation Portmanteau(4 lags) 0.98
Normality Both 0.5076Kurtosis 0.5078
Skewness 0.42
Table 18: The diagnostics tests of residuals of VECM

Agenda Methodology procedure Lee Carter Model theory Lee Carter Model theory Lee Carter Model theory Theory of VAR and VECM models Cointegration rank from Canadian provincial mortality Diagnostics of residuals VAR and VECM out of sample Backtesting VAR and VECM out of sample Historical volatility of out-of-sample beyond 25 years Projection of VAR model for each Males Projection VAR models for each province Projection of VECM model for singular Male group Projection of VECM model for singular female group Pricing of annuities Pricing of annuities Agenda Literature ARIMA Model Fitting results with VECM Diagnostic residuals of VECM models Backtesting results of the three models Theory of VAR and VECM models Projection models for each province Projection models for each province Projection models for each province Projection models for each province Projection models for each province Projection models for each province Forecasting results from VECM model Applications Agenda Literature Review Statistics on the Evolution of demography in the USA Preliminary analysis with PCA on the life expectancy by races Projection models for each race group Projection models for each race group Projection models for each race group Projection models for each race group Projection models for each race group Projection models for each race group Conclusions
OO-Sample VECM VAR ARIMAh=2000-2010 0.5% 2.31% 5.1%h=2001-2010 0.55% 2.3% 5.8%h=2002-2010 0.4% 0.62% 6.2%h= 2003-2010 1.02% 0.77% 6.41%h=2004-2010 1.1% 0.60% 6.69%h=2005-2010 1.39% 0.48% 7.37%h=2006-2010 0.280% 0.62% 7.34%h=2007-2010 0.29% 0.32% 7.9%h=2008-2010 0.19% 0.42% 8.39%
Table 19: The average MAPE for models, ARIMA VAR and VECM forthe 6 provinces

Agenda Methodology procedure Lee Carter Model theory Lee Carter Model theory Lee Carter Model theory Theory of VAR and VECM models Cointegration rank from Canadian provincial mortality Diagnostics of residuals VAR and VECM out of sample Backtesting VAR and VECM out of sample Historical volatility of out-of-sample beyond 25 years Projection of VAR model for each Males Projection VAR models for each province Projection of VECM model for singular Male group Projection of VECM model for singular female group Pricing of annuities Pricing of annuities Agenda Literature ARIMA Model Fitting results with VECM Diagnostic residuals of VECM models Backtesting results of the three models Theory of VAR and VECM models Projection models for each province Projection models for each province Projection models for each province Projection models for each province Projection models for each province Projection models for each province Forecasting results from VECM model Applications Agenda Literature Review Statistics on the Evolution of demography in the USA Preliminary analysis with PCA on the life expectancy by races Projection models for each race group Projection models for each race group Projection models for each race group Projection models for each race group Projection models for each race group Projection models for each race group Conclusions
Races VECM VAR ARIMAAll sexes Males (0.23-2.13) (0.24-0.46) (0.31-2.24)
All sex Fem (0.23-1.82) (0.26-0.72) ( 0.35-1.89)White fem (0.21-9.21) (0.23-0.31) (0.28-2.04)White Mal (0.35-5.21) (0.23-0.62) (0.31-3.12)
Black Femal (0.35-7.66) (0.80-2.17) (0.9-6.35)Black Mal (1.08-6.33) (0.40-1.68) ( 0.47-4.72)
Table 20: Confidence interval of models VAR, VECM and ARIMA forthe 6 provinces derived from predictions 50 years ahead

Agenda Methodology procedure Lee Carter Model theory Lee Carter Model theory Lee Carter Model theory Theory of VAR and VECM models Cointegration rank from Canadian provincial mortality Diagnostics of residuals VAR and VECM out of sample Backtesting VAR and VECM out of sample Historical volatility of out-of-sample beyond 25 years Projection of VAR model for each Males Projection VAR models for each province Projection of VECM model for singular Male group Projection of VECM model for singular female group Pricing of annuities Pricing of annuities Agenda Literature ARIMA Model Fitting results with VECM Diagnostic residuals of VECM models Backtesting results of the three models Theory of VAR and VECM models Projection models for each province Projection models for each province Projection models for each province Projection models for each province Projection models for each province Projection models for each province Forecasting results from VECM model Applications Agenda Literature Review Statistics on the Evolution of demography in the USA Preliminary analysis with PCA on the life expectancy by races Projection models for each race group Projection models for each race group Projection models for each race group Projection models for each race group Projection models for each race group Projection models for each race group Conclusions
Projecting males life expectancy for each race group

Agenda Methodology procedure Lee Carter Model theory Lee Carter Model theory Lee Carter Model theory Theory of VAR and VECM models Cointegration rank from Canadian provincial mortality Diagnostics of residuals VAR and VECM out of sample Backtesting VAR and VECM out of sample Historical volatility of out-of-sample beyond 25 years Projection of VAR model for each Males Projection VAR models for each province Projection of VECM model for singular Male group Projection of VECM model for singular female group Pricing of annuities Pricing of annuities Agenda Literature ARIMA Model Fitting results with VECM Diagnostic residuals of VECM models Backtesting results of the three models Theory of VAR and VECM models Projection models for each province Projection models for each province Projection models for each province Projection models for each province Projection models for each province Projection models for each province Forecasting results from VECM model Applications Agenda Literature Review Statistics on the Evolution of demography in the USA Preliminary analysis with PCA on the life expectancy by races Projection models for each race group Projection models for each race group Projection models for each race group Projection models for each race group Projection models for each race group Projection models for each race group Conclusions
Projecting males life expectancy for all provinces witheach model

Agenda Methodology procedure Lee Carter Model theory Lee Carter Model theory Lee Carter Model theory Theory of VAR and VECM models Cointegration rank from Canadian provincial mortality Diagnostics of residuals VAR and VECM out of sample Backtesting VAR and VECM out of sample Historical volatility of out-of-sample beyond 25 years Projection of VAR model for each Males Projection VAR models for each province Projection of VECM model for singular Male group Projection of VECM model for singular female group Pricing of annuities Pricing of annuities Agenda Literature ARIMA Model Fitting results with VECM Diagnostic residuals of VECM models Backtesting results of the three models Theory of VAR and VECM models Projection models for each province Projection models for each province Projection models for each province Projection models for each province Projection models for each province Projection models for each province Forecasting results from VECM model Applications Agenda Literature Review Statistics on the Evolution of demography in the USA Preliminary analysis with PCA on the life expectancy by races Projection models for each race group Projection models for each race group Projection models for each race group Projection models for each race group Projection models for each race group Projection models for each race group Conclusions
Projecting males life expectancy for all races with eachmodel

Agenda Methodology procedure Lee Carter Model theory Lee Carter Model theory Lee Carter Model theory Theory of VAR and VECM models Cointegration rank from Canadian provincial mortality Diagnostics of residuals VAR and VECM out of sample Backtesting VAR and VECM out of sample Historical volatility of out-of-sample beyond 25 years Projection of VAR model for each Males Projection VAR models for each province Projection of VECM model for singular Male group Projection of VECM model for singular female group Pricing of annuities Pricing of annuities Agenda Literature ARIMA Model Fitting results with VECM Diagnostic residuals of VECM models Backtesting results of the three models Theory of VAR and VECM models Projection models for each province Projection models for each province Projection models for each province Projection models for each province Projection models for each province Projection models for each province Forecasting results from VECM model Applications Agenda Literature Review Statistics on the Evolution of demography in the USA Preliminary analysis with PCA on the life expectancy by races Projection models for each race group Projection models for each race group Projection models for each race group Projection models for each race group Projection models for each race group Projection models for each race group Conclusions
Year ASM ASF WM WF BM BF10 78.43 82.25 78.42 82.32 75.27 80.4620 80.59 83.46 80.34 83.35 78.18 82.5930 82.73 84.65 82.27 84.39 80.39 84.6740 84.87 85.85 84.20 85.43 83.77 86.7350 87.01 87.05 86.112 86.47 86.56 88.79
Table 21: Future forecast of life expectancy with model VECM for the6 provinces

Agenda Methodology procedure Lee Carter Model theory Lee Carter Model theory Lee Carter Model theory Theory of VAR and VECM models Cointegration rank from Canadian provincial mortality Diagnostics of residuals VAR and VECM out of sample Backtesting VAR and VECM out of sample Historical volatility of out-of-sample beyond 25 years Projection of VAR model for each Males Projection VAR models for each province Projection of VECM model for singular Male group Projection of VECM model for singular female group Pricing of annuities Pricing of annuities Agenda Literature ARIMA Model Fitting results with VECM Diagnostic residuals of VECM models Backtesting results of the three models Theory of VAR and VECM models Projection models for each province Projection models for each province Projection models for each province Projection models for each province Projection models for each province Projection models for each province Forecasting results from VECM model Applications Agenda Literature Review Statistics on the Evolution of demography in the USA Preliminary analysis with PCA on the life expectancy by races Projection models for each race group Projection models for each race group Projection models for each race group Projection models for each race group Projection models for each race group Projection models for each race group Conclusions
Conclusion
We show dependence in mortality between mortality indexthrough the cointegration analysis. We apply also thepricing of annuity by cohort. This study was published asconference proceedings and submitted to NAAJ.VECM have shown better performance over ARIMA modelin backtesting samples as well as in the evaluation of errorcomponents in explaining life expectancy at birth. It waspublished in Insurance Markets and Companies: Analysesand Actuarial Computations.We take into account the emergence of new ethnic groupssuch as hispanic and asians rather than only white andblack. In SSRN platform.Measuring Basis risk between Canada national data andeach province. Joint work with Severine Arnold.


