Phase Transformations
61
Chapter 11 Phase Transformatio ns Fe 3 C (cementite)- orthorhombic Martensite - BCT Austenite - FCC Ferrite - BCC
-
Upload
rajesh-autorajesh -
Category
Documents
-
view
20 -
download
2
description
Phase transformation of metals
Transcript of Phase Transformations

Chapter 11
Phase Transformations
Fe3C (cementite)- orthorhombic
Martensite - BCT
Austenite - FCC
Ferrite - BCC

Phase Transformations• Transformation rate• Kinetics of Phase Transformation
–Nucleation: homogeneous, heterogeneous
–Free Energy, Growth• Isothermal Transformations (TTT diagrams)• Pearlite, Martensite, Spheroidite, Bainite• Continuous Cooling• Mechanical Behavior• Precipitation Hardening

Phase Transformations
Phase transformations – change in the number or character of phases.
Simple diffusion-dependent No change in # of phases No change in composition Example: solidification of a pure metal, allotropic transformation,
recrystallization, grain growth
More complicated diffusion-dependent Change in # of phases Change in composition Example: eutectoid reaction
Diffusionless Example: metastable phase - martensite

Phase Transformations Most phase transformations begin with the formation of
numerous small particles of the new phase that increase in size until the transformation is complete.
• Nucleation is the process whereby nuclei (seeds) act as templates for crystal growth.
• Homogeneous nucleation - nuclei form uniformly throughout the parent phase; requires considerable supercooling (typically 80-300°C).
• Heterogeneous nucleation - form at structural inhomogeneities (container surfaces, impurities, grain boundaries, dislocations) in liquid phase much easier since stable “nucleating surface” is already present; requires slight supercooling (0.1-10ºC).

Supercooling During the cooling of a liquid, solidification
(nucleation) will begin only after the temperature has been lowered below the equilibrium solidification (or melting) temperature Tm. This phenomenon is termed supercooling (or undercooling.
The driving force to nucleate increases as T increases
Small supercooling slow nucleation rate - few nuclei - large crystals
Large supercooling rapid nucleation rate - many nuclei - small crystals

c11tf01

• Rate is a result of nucleation and growth of crystals.
• Examples:
% Pearlite
0
50
100
Nucleation regime
Growth regime
log (time)t50
Nucleation rate increases w/ T
Growth rate increases w/ T
Nucleation rate high
T just below TE T moderately below TE T way below TENucleation rate low
Growth rate high
pearlite colony
Nucleation rate med Growth rate med. Growth rate low
Nucleation and Growth

Nucleation of a spherical solid particle in a liquidc11f01
Liquid
The change in free energy DG (a function of the internal energy and enthalpy of the system) must be negative for a transformation to occur.
Assume that nuclei of the solid phase form in the interior of the liquid as atoms cluster together-similar to the packing in the solid phase.
Also, each nucleus is spherical and has a radius r.
Free energy changes as a result of a transformation: 1) the difference between the solid and liquid phases (volume free energy, DGV); and 2) the solid-liquid phase boundary (surface free energy, DGS).
Transforming one phase into another takes time.
DG = DGS + DGV
Feg
(Austenite)
Eutectoid transformation
C FCC
Fe3C(cementite)
a (ferrite)
+(BCC)

r* = critical nucleus: for r < r* nuclei shrink; for r >r* nuclei grow (to reduce energy)
Homogeneous Nucleation & Energy Effects
DGT = Total Free Energy = DGS + DGV
Surface Free Energy- destabilizes the nuclei (it takes energy to make an interface)
24 rGS
g = surface tension
Volume (Bulk) Free Energy – stabilizes the nuclei (releases energy)
GrGV3
3
4
volume unit
energy free volume G

Solidification
TH
Tr
f
m
2
*
Note: Hf and are weakly dependent on T
r* decreases as T increases
For typical T r* ~ 10 nm
Hf = latent heat of solidification (fusion)
Tm = melting temperature
g = surface free energy
DT = Tm - T = supercooling
r* = critical radius

Transformations & Undercooling
• For transformation to occur, must cool to below 727°C
• Eutectoid transformation (Fe-Fe3C system): g Þ a + Fe3C
0.76 wt% C0.022 wt% C
6.7 wt% C
Fe
3C
(ce
men
tite
)
1600
1400
1200
1000
800
600
4000 1 2 3 4 5 6 6.7
L
g(austenite)
g+L
g +Fe3C
a +Fe3C
L+Fe3C
d
(Fe) C, wt% C
1148°C
T(°C)
aferrite
727°C
Eutectoid:Equil. Cooling: Ttransf. = 727ºC
DT
Undercooling by Ttransf. < 727C
0.7
6
0.0
22

12
Rate of Phase Transformation
Avrami equation => y = 1- exp (-kt n)
transformation complete
log tFra
ctio
n tr
an
sfo
rme
d, y
Fixed T
fraction transformed
time
0.5
By convention rate = 1 / t0.5
Fraction transformed depends on time
maximum rate reached – now amount unconverted decreases so rate slows
t0.5
rate increases as surface area increases & nuclei grow
Avrami relationship - the rate is defined as the inverse of the time to complete half of the transformation. This describes most solid-state transformations that involve diffusion.

• In general, rate increases as T
r = 1/t0.5 = A e -Q/RT
– R = gas constant– T = temperature (K)– A = ‘preexponential’ rate factor– Q = activation energy
• r is often small so equilibrium is not possible.
Arrhenius expression
Adapted from Fig. 10.11, Callister 7e. (Fig. 10.11 adapted from B.F. Decker and D. Harker, "Recrystallization in Rolled Copper", Trans AIME, 188, 1950, p. 888.)
135C 119C 113C 102C 88C 43C
1 10 102 104
Temperature Dependence of Transformation Rate

Generation of Isothermal Transformation Diagrams
• The Fe-Fe3C system, for Co = 0.76 wt% C• A transformation temperature of 675°C.
100
50
01 102 104
T = 675°C
% tr
ansf
orm
ed
time (s)
400
500
600
700
1 10 102 103 104 105
0%pearlite
100%
50%
Austenite (stable) TE (727C)Austenite (unstable)
Pearlite
T(°C)
time (s)
isothermal transformation at 675°C
Consider:

Coarse pearlite formed at higher temperatures – relatively soft
Fine pearlite formed at lower temperatures – relatively hard
• Transformation of austenite to pearlite:
gaaaa
a
a
pearlite growth direction
Austenite (g)grain boundary
cementite (Fe3C)
Ferrite (a)
g
• For this transformation, rate increases with ( DT) [Teutectoid – T ].
675°C (DT smaller)
0
50
% p
earli
te600°C
(DT larger)650°C
100
Diffusion of C during transformation
a
ag g
aCarbon diffusion
Eutectoid Transformation Rate ~ DT

c11f13Isothermal Transformation Diagrams2 solid curves are plotted:
one represents the time required at each temperature for the start of the transformation;
the other is for transformation completion.
The dashed curve corresponds to 50% completion.
The austenite to pearlite transformation will occur only if the alloy is supercooled to below the eutectoid temperature (727˚C).
Time for process to complete depends on the temperature.

c11f14• Eutectoid iron-carbon alloy; composition, Co = 0.76 wt% C• Begin at T > 727˚C• Rapidly cool to 625˚C and hold isothermally.
Isothermal Transformation Diagram
Austenite-to-Pearlite

Transformations Involving Noneutectoid Compositions
Hypereutectoid composition – proeutectoid cementite
Consider C0 = 1.13 wt% C
Fe 3
C (
cem
entit
e)
1600
1400
1200
1000
800
600
4000 1 2 3 4 5 6 6.7
L
g(austenite)
g+L
g +Fe3C
a +Fe3C
L+Fe3C
d
(Fe) C, wt%C
T(°C)
727°CDT
0.7
6
0.0
22
1.13

19
Transformations Involving Noneutectoid Compositions
Hypereutectoid composition – proeutectoid cementite
Consider C0 = 1.13 wt% C
a
TE (727°C)
T(°C)
time (s)
A
A
A+
C
P
1 10 102 103 104
500
700
900
600
800
A+
P
Adapted from Fig. 11.16, Callister & Rethwisch 3e.
Adapted from Fig. 10.28, Callister & Rethwisch 3e.
Fe 3
C (
cem
entit
e)
1600
1400
1200
1000
800
600
4000 1 2 3 4 5 6 6.7
L
g(austenite)
g+L
g +Fe3C
a +Fe3C
L+Fe3C
d
(Fe) C, wt%C
T(°C)
727°CDT
0.7
6
0.0
22
1.13


c11f37
Str
engt
h
Duc
tility
Martensite T Martensite
bainite fine pearlite
coarse pearlite spheroidite
General Trends
Possible Transformations

Coarse pearlite (high diffusion rate) and (b) fine pearlitec11f15
- Smaller T: colonies are larger
- Larger T: colonies are smaller

10 103 105
time (s)10-1
400
600
800
T(°C)Austenite (stable)
200
P
B
TE
0%
100%
50%
A
A
Bainite: Non-Equil Transformation Products elongated Fe3C particles in a-ferrite matrix diffusion controlled a lathes (strips) with long rods of Fe3C
100% bainite
100% pearlite
Martensite
Cementite
Ferrite

Bainite Microstructure
• Bainite consists of acicular (needle-like) ferrite with very small cementite particles dispersed throughout.
• The carbon content is typically greater than 0.1%.
• Bainite transforms to iron and cementite with sufficient time and temperature (considered semi-stable below 150°C).

10
Fe3C particles within an a-ferrite matrix diffusion dependent heat bainite or pearlite at temperature just below eutectoid for long times driving force – reduction of a-ferrite/Fe3C interfacial area
Spheroidite: Nonequilibrium Transformation
10 103 105time (s)10-1
400
600
800
T(°C)Austenite (stable)
200
P
B
TE
0%
100%
50%
A
A
Spheroidite100% spheroidite
100% spheroidite

c11f20Pearlitic Steel partially transformed to Spheroidite

single phase body centered tetragonal (BCT) crystal structure BCT if C0 > 0.15 wt% C
Diffusionless transformation BCT few slip planes hard, brittle % transformation depends only on T of rapid cooling
Martensite Formation
• Isothermal Transformation Diagram
10 103 105 time (s)10-1
400
600
800
T(°C)Austenite (stable)
200
P
B
TE
0%
100%50%
A
A
M + AM + A
M + A
0%50%90%
Martensite needlesAustenite

An micrograph of austenite that was polished flat and then allowed to transform into martensite. The different colors indicate the displacements caused when martensite forms.

Isothermal Transformation Diagram
Iron-carbon alloy with eutectoid composition.
A: AusteniteP: PearliteB: BainiteM: Martensite

c11f24
Other elements (Cr, Ni, Mo, Si and W) may cause significant changes in the positions and shapes of the TTT curves:
Change transition temperature; Shift the nose of the austenite-to-
pearlite transformation to longer times;
Shift the pearlite and bainite noses to longer times (decrease critical cooling rate);
Form a separate bainite nose;
Effect of Adding Other Elements
4340 Steel
plain carbonsteel
nose
Plain carbon steel: primary alloying element is carbon.

c11f23Example 11.2: Iron-carbon alloy with
eutectoid composition. Specify the nature of the
final microstructure (% bainite, martensite, pearlite etc) for the alloy that is subjected to the following time–temperature treatments:
Alloy begins at 760˚C and has been held long enough to achieve a complete and homogeneous austenitic structure.
Treatment (a) Rapidly cool to 350 ˚C Hold for 104 seconds Quench to room temperature
Bainite, 100%

c11f23
Martensite, 100%
Example 11.2: Iron-carbon alloy with
eutectoid composition. Specify the nature of the
final microstructure (% bainite, martensite, pearlite etc) for the alloy that is subjected to the following time–temperature treatments:
Alloy begins at 760˚C and has been held long enough to achieve a complete and homogeneous austenitic structure.
Treatment (b) Rapidly cool to 250 ˚C Hold for 100 seconds Quench to room temperature
Austenite, 100%

c11f23
Bainite, 50%
Example 11.2: Iron-carbon alloy with
eutectoid composition. Specify the nature of the
final microstructure (% bainite, martensite, pearlite etc) for the alloy that is subjected to the following time–temperature treatments:
Alloy begins at 760˚C and has been held long enough to achieve a complete and homogeneous austenitic structure.
Treatment (c) Rapidly cool to 650˚C Hold for 20 seconds Rapidly cool to 400˚C Hold for 103 seconds Quench to room temperature
Austenite, 100%
Almost 50% Pearlite, 50% Austenite
Final: 50% Bainite, 50% Pearlite

c11f26Continuous Cooling
Transformation Diagrams Isothermal heat treatments are
not the most practical due to rapidly cooling and constant maintenance at an elevated temperature.
Most heat treatments for steels involve the continuous cooling of a specimen to room temperature.
TTT diagram (dashed curve) is modified for a CCT diagram (solid curve).
For continuous cooling, the time required for a reaction to begin and end is delayed.
The isothermal curves are shifted to longer times and lower temperatures.

c11f27 Moderately rapid and slow cooling curves are superimposed on a continuous cooling transformation diagram of a eutectoid iron-carbon alloy.
The transformation starts after a time period corresponding to the intersection of the cooling curve with the beginning reaction curve and ends upon crossing the completion transformation curve.
Normally bainite does not form when an alloy is continuously cooled to room temperature; austenite transforms to pearlite before bainite has become possible.

c11f28
For continuous cooling of a steel alloy there exists a critical quenching rate that represents the minimum rate of quenching that will produce a totally martensitic structure.
This curve will just miss the nose where pearlite transformation begins

c11f29 Continuous cooling
diagram for a 4340 steel alloy and several cooling curves superimposed.
This demonstrates the dependence of the final microstructure on the transformations that occur during cooling.
Alloying elements used to modify the critical cooling rate for martensite are chromium, nickel, molybdenum, manganese, silicon and tungsten.

Mechanical Properties
• Hardness• Brinell, Rockwell• Yield Strength• Tensile Strength• Ductility• % Elongation• Effect of Carbon Content

c11f30Mechanical Properties: Influence of Carbon Content
C0 > 0.76 wt% C
Hypereutectoid
Pearlite (med)
Cementite(hard)
C0 < 0.76 wt% CHypoeutectoid
Pearlite (med)
ferrite (soft)

c11f31Mechanical Properties: Fe-C System

Tempered martensite is less brittle than martensite; tempered at 594 °C. Tempering reduces internal stresses caused by quenching. The small particles are cementite; the matrix is a-ferrite. US Steel Corp.
c11f34Tempered Martensite
4340 steel

c11f33Hardness as a function of carbon
concentration for steels

Hardness versus tempering time for a water-quenched eutectoid plain carbon steel (1080) that has been rapidly quenched to form martensite.
c11f36Rockwell C and Brinell Hardness

c11tf02

Precipitation Hardening• The strength and hardness of some metal
alloys may be improved by the formation of extremely small, uniformly dispersed particles (precipitates) of a second phase within the original phase matrix.
• Alloys that can be precipitation hardened or age hardened:
Copper-beryllium (Cu-Be) Copper-tin (Cu-Sn) Magnesium-aluminum (Mg-Al) Aluminum-copper (Al-Cu) High-strength aluminum alloys

c11f40Criteria: Maximum solubility of 1
component in the other (M); Solubility limit that rapidly
decreases with decrease in temperature (M→N).
Process: Solution Heat Treatment – first
heat treatment where all solute atoms are dissolved to form a single-phase solid solution.
Heat to T0 and dissolve B phase. Rapidly quench to T1
Nonequilibrium state (a phase solid solution supersaturated with B atoms; alloy is soft, weak-no ppts).
Phase Diagram for Precipitation Hardened Alloy

c11f43 The supersaturated a solid
solution is usually heated to an intermediate temperature T2 within the +a b region (diffusion rates increase).
The b precipitates (PPT) begin to form as finely dispersed particles. This process is referred to as aging.
After aging at T2, the alloy is cooled to room temperature.
Strength and hardness of the alloy depend on the ppt temperature (T2) and the aging time at this temperature.
Precipitation Heat Treatment
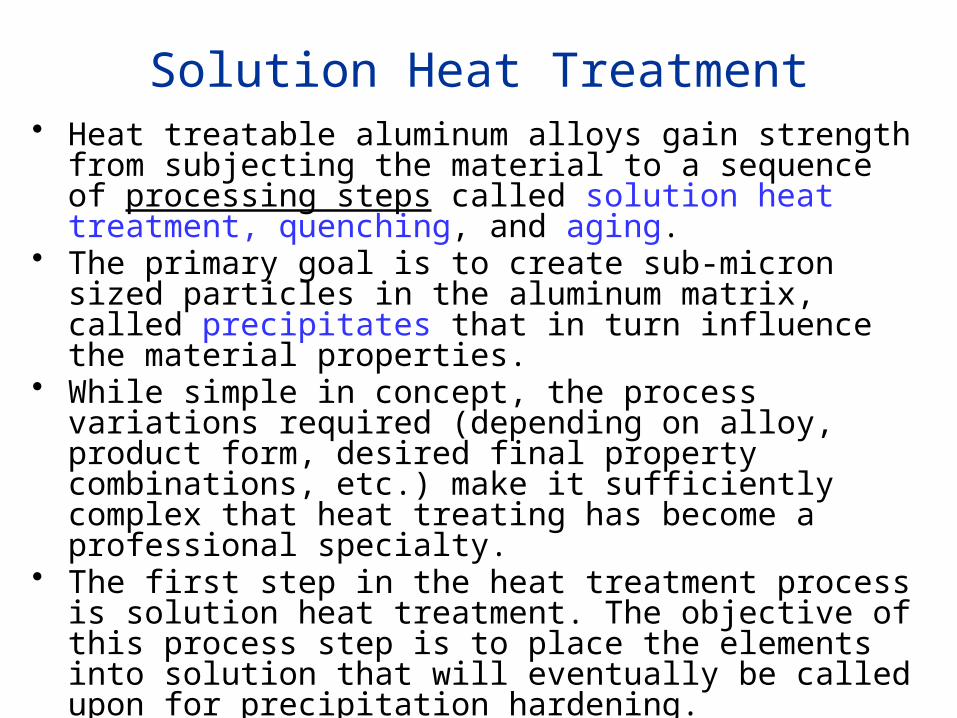
Solution Heat Treatment• Heat treatable aluminum alloys gain strength from
subjecting the material to a sequence of processing steps called solution heat treatment, quenching, and aging.
• The primary goal is to create sub-micron sized particles in the aluminum matrix, called precipitates that in turn influence the material properties.
• While simple in concept, the process variations required (depending on alloy, product form, desired final property combinations, etc.) make it sufficiently complex that heat treating has become a professional specialty.
• The first step in the heat treatment process is solution heat treatment. The objective of this process step is to place the elements into solution that will eventually be called upon for precipitation hardening.
• Developing solution heat treatment times and temperatures has typically involved extensive trial and error, partially due to the lack of accurate process models.

Aging-microstructure
• The supersaturated solid solution is unstable and if, left alone, the excess q will precipitate out of the a phase. This process is called aging.
• Types of aging: –Natural aging process occurs at room
temperature–Artificial aging If solution heat treated,
requires heating to speed up the precipitation
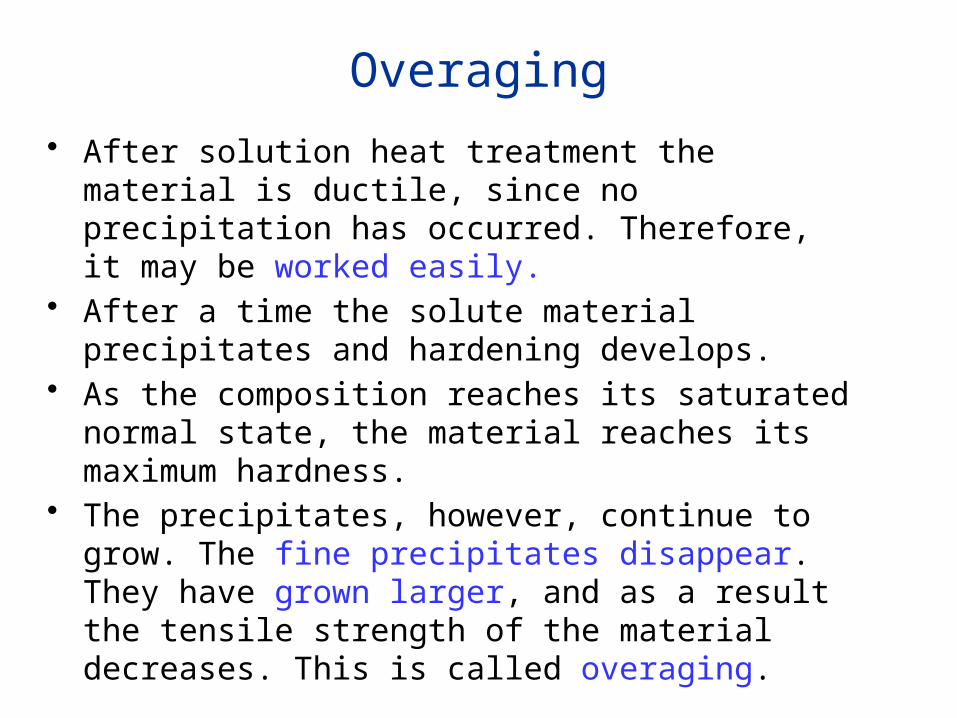
Overaging
• After solution heat treatment the material is ductile, since no precipitation has occurred. Therefore, it may be worked easily.
• After a time the solute material precipitates and hardening develops.
• As the composition reaches its saturated normal state, the material reaches its maximum hardness.
• The precipitates, however, continue to grow. The fine precipitates disappear. They have grown larger, and as a result the tensile strength of the material decreases. This is called overaging.

c11f43Precipitation Heat Treatment
PPT behavior is represented in the diagram:
With increasing time, the hardness increases, reaching a maximum (peak), then decreasing in strength.
The reduction in strength and hardness after long periods is overaging (continued particle growth).
Small solute-enriched regions in a solid solution where the lattice is identical or somewhat perturbed from that of the solid solution are called Guinier-Preston zones. Guinier-Preston (GP) zones - Tiny clusters of atoms that precipitate from the matrix in the early stages of the age-hardening process.

Hardness vs. Time
The hardness and tensile strength vary during aging and overaging.
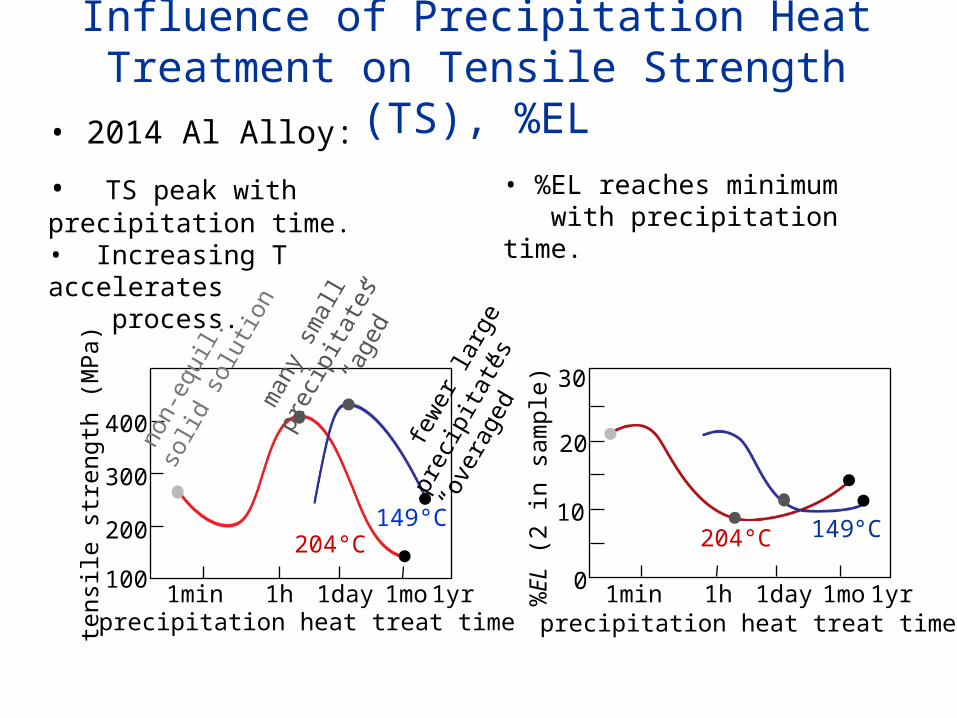
• 2014 Al Alloy:
• TS peak with precipitation time.• Increasing T accelerates process.
Influence of Precipitation Heat Treatment on Tensile Strength (TS), %EL
precipitation heat treat time
tens
ile s
tren
gth
(MP
a)
200
300
400
1001min 1h 1day 1mo 1yr
204°C
non-
equi
l. so
lid s
olut
ion
man
y sm
all
prec
ipita
tes
“age
d”
few
er la
rge
prec
ipita
tes
“ove
rage
d”149°C
• %EL reaches minimum with precipitation time.
%E
L (2
in s
ampl
e)10
20
30
0 1min 1h 1day 1mo 1yr
204°C 149°C
precipitation heat treat time

c11f45Effects of Temperature
Characteristics of a 2014 aluminum alloy (0.9 wt% Si, 4.4 wt% Cu, 0.8 wt% Mn, 0.5 wt% Mg) at 4 different aging temperatures.

Aluminum rivets
Alloys that experience significant precipitation hardening at room temp, after short periods must be quenched to and stored under refrigerated conditions.
Several aluminum alloys that are used for rivets exhibit this behavior. They are driven while still soft, then allowed to age harden at the normal room temperature.

Several stages in the formation of the equilibrium PPT (q) phase. (a) supersaturated a solid solution; (b) transition (q”) PPT phase; (c) equilibrium q phase within the a matrix phase.
c11f44

0 10 20 30 40 50wt% Cu
L+La
+a q q
+L
300
400
500
600
700
(Al)
T(°C)
composition range available for precipitation hardening
CuAl2
A
Precipitation Hardening• Particles impede dislocation motion.• Ex: Al-Cu system• Procedure:
-- Pt B: quench to room temp. (retain a solid solution)-- Pt C: reheat to nucleate small q particles within a phase.
Temp.
Time
-- Pt A: solution heat treat (get a solid solution)
Pt A (solution heat treat)
B
Pt B
C
Pt C (precipitate )
At room temperature the stable state of an aluminum-copper alloy is an aluminum-rich solid solution (α) and an intermetallic phase with a tetragonal crystal structure having nominal composition CuAl2 (θ).

24
• Hard precipitates are difficult to shear. Ex: Ceramics in metals (SiC in Iron or Aluminum).
Large shear stress needed to move dislocation toward precipitate and shear it.
Side View
Top View
Slipped part of slip plane
Unslipped part of slip plane
S
Dislocation “advances” but precipitates act as “pinning” sites with spacing S.
precipitate
• Result: y ~
1S
PRECIPITATION STRENGTHENING

Aging• Aging either at room or moderately elevated
temperature after the quenching process is used to produce the desired final product property combinations.
• The underlying metallurgical phenomenon in the aging process is precipitation hardening. Due to the small size of the precipitate particles, early understanding was hampered by the lack of sufficiently powerful microscopes to actually see them.
• With the availability of the transmission electron microscope (TEM) with nanometer-scale resolution, researchers were able to actually image many precipitate phases and build on this knowledge to develop improved aluminum alloy products.

Aluminum• Aluminum is light weight,
but engineers want to improve the strength for high performance applications in automobiles and aerospace.
• To improve strength, they use precipitation hardening.
Age-hardening heat treatment phase diagram

Quenching
• Quenching is the second step in the process.
• Its purpose is to retain the dissolved alloying elements in solution for subsequent precipitation hardening.
• Generally the more rapid the quench the better, from a properties standpoint, but this must be balanced against the concerns of part distortion and residual stress if the quench is non-uniform.
Changes in Microstructure due to quenching