Phase Equilibria Lectures GIK Institute Pakistan.
33
The Gibbs free energy of a system is defined by the equation G=H-TS Thermodynamic Function Enthalpy is a measure of the heat content of the system and is given H=E+PV The internal energy arises from the total kinetic and potential energies of the atoms within the system. Kinetic energy can arise from atomic vibration in solids or liquids and from translational and rotational energies for the atoms and molecules within a liquid or gas whereas potential energy arises from the interactions, or bonds. between the atoms within the system.
description
Phase Equilibria Lectures GIK Institute Pakistan.
Transcript of Phase Equilibria Lectures GIK Institute Pakistan.
The Gibbs free energy of a system is defined by the equation
G=H-TS
Thermodynamic Function
Enthalpy is a measure of the heat content of the system and is given
H=E+PV
The internal energy arises from the total kinetic and potential energies of the atoms within the system.
Kinetic energy can arise from atomic vibration in solids or liquids and from translational and rotational energies for the atoms and molecules within a liquid or gas whereas potential energy arises from the interactions, or bonds. between the atoms within the system.
If a transformation or reaction occurs the heat that is absorbed or evolved will depend on
the change in the internal energy of the system.
However it will also depend on changes in the volume of the system and the term PV
takes this into account, so at constant pressure the heat absorbed or evolved is given by
the change in H
Thermodynamic Function
When dealing with condensed phases (solids
and liquids) the PV term is usually very small in
comparison to E, that is H = E.
G includes entropy (S) which is a measure of the randomness/disorder of the system.
A system is said to be in equilibrium when it is in the most stable state. i.e. shows no
desire to change. An important consequence of the laws of classical thermodynamics is
that at constant temperature and pressure a closed system (i.e. one of fixed mass and
composition) will be in stable equilibrium if it has the lowest possible value of the Gibbs
free energy, or in mathematical terms
dG=0
G, that the state with the highest stability will be that with the best compromise
between low enthalpy and high entropy.
Equilibrium and Free Energy
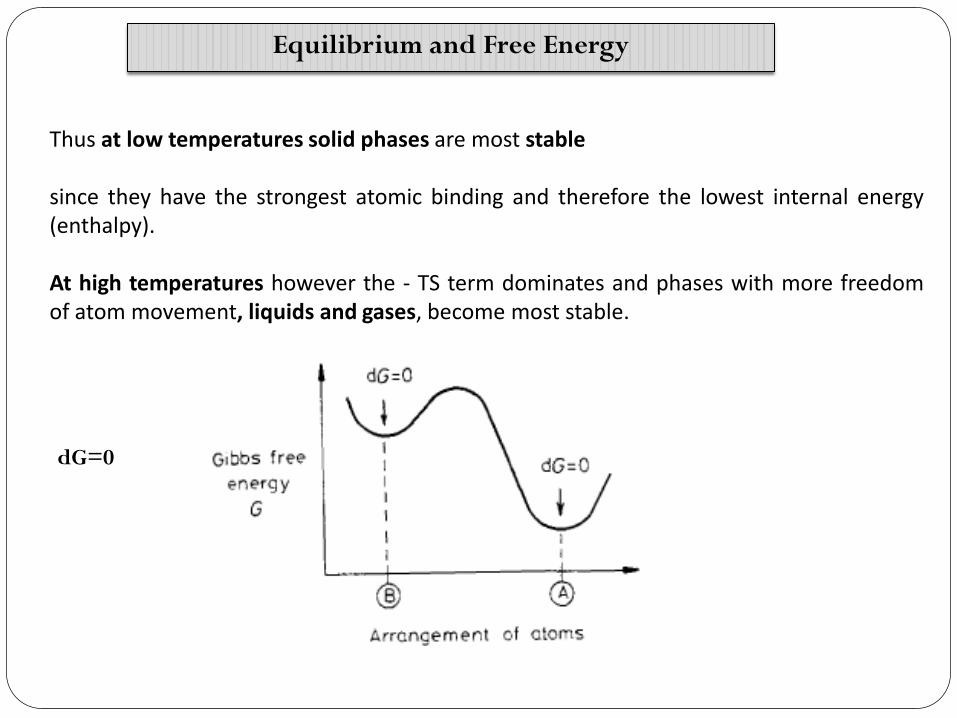
Thus at low temperatures solid phases are most stable since they have the strongest atomic binding and therefore the lowest internal energy (enthalpy). At high temperatures however the - TS term dominates and phases with more freedom of atom movement, liquids and gases, become most stable.
Equilibrium and Free Energy
dG=0
Graphite and diamond at room temperature and pressure are examples of stable and
metastable equilibrium states. Given time. therefore. all diamond under these conditions
will transform to graphite.
Equilibrium and Free Energy
Any transformation that results in a decrease in Gibbs free energy is possible. Therefore
a necessary criterion for any phase transformation is
ΔG=G2-G1 <0
The question" How fast does phase transformation occur?"
Intensive & Extensive Properties
All thermodynamics function can be divided into two types of properties:
Intensive and Extensive Properties
Intensive Properties
Independent of size of system
Example : T and P
Extensive Properties Are directly proportion to the quantity of material in a system Example: E,H,V,G and S
Single Component System
Phase changes can be induced in a single component system by changes in temperature
at a fixed pressure, say 1 atm.
A single component system could be one containing a pure element or one type of
molecule that does not dissociate over the range of temperature of interest.
To predict the phases that are stable or mixtures that are in equilibrium at different
temperatures ,It is necessary to be able to calculate the variation of G with T
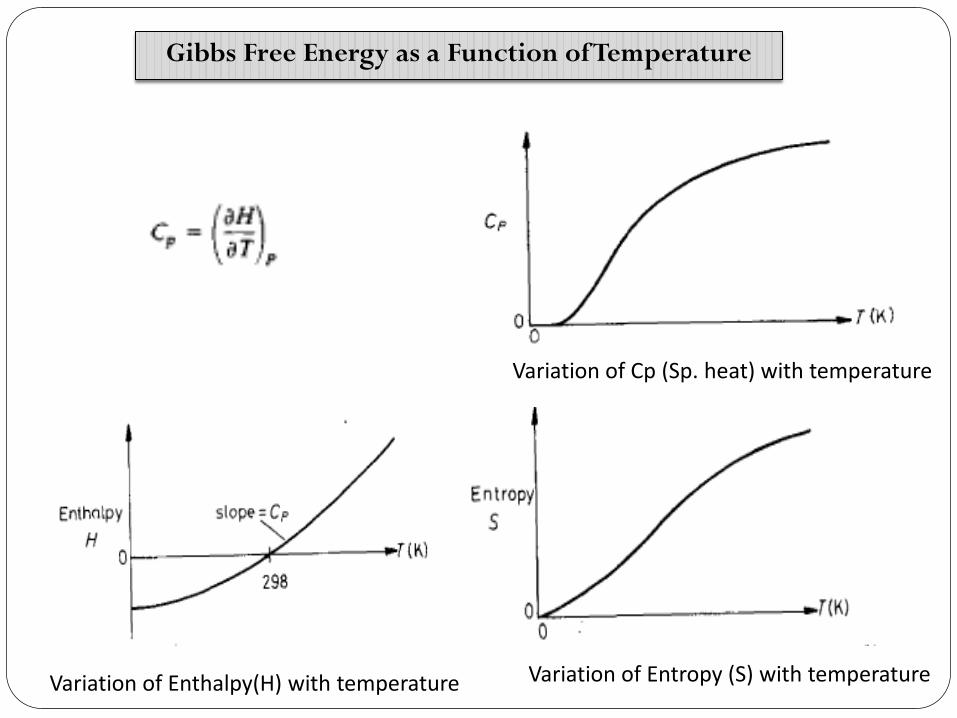
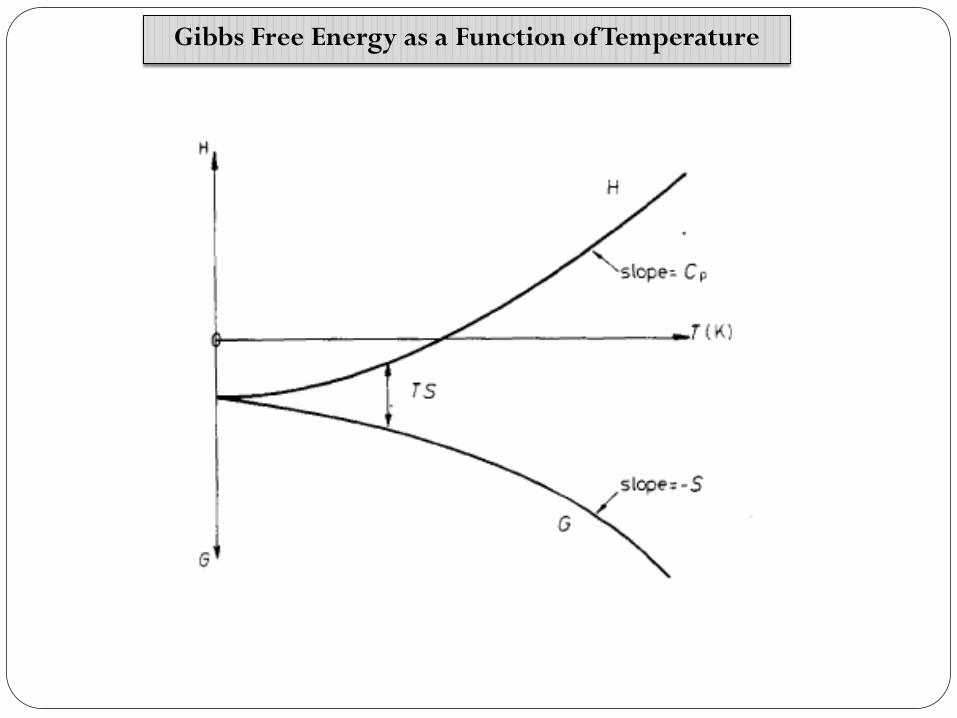
Gibbs Free Energy as a Function of Temperature
Variation of Cp (Sp. heat) with temperature
Variation of Enthalpy(H) with temperature Variation of Entropy (S) with temperature
Gibbs Free Energy as a Function of Temperature
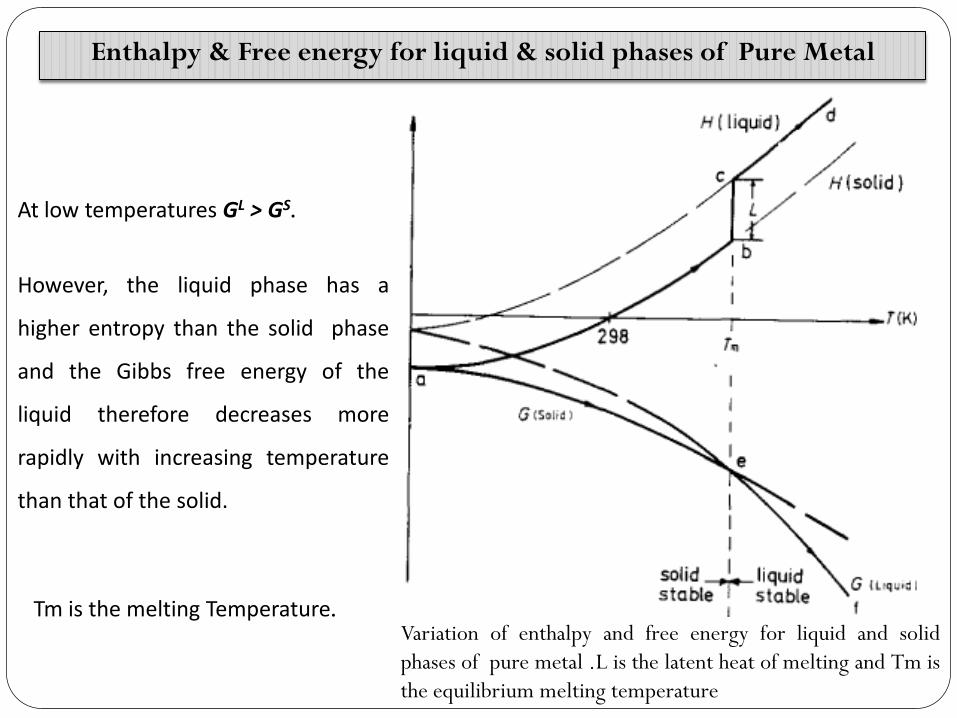
Variation of enthalpy and free energy for liquid and solid
phases of pure metal .L is the latent heat of melting and Tm is
the equilibrium melting temperature
At low temperatures GL > GS.
However, the liquid phase has a
higher entropy than the solid phase
and the Gibbs free energy of the
liquid therefore decreases more
rapidly with increasing temperature
than that of the solid.
Enthalpy & Free energy for liquid & solid phases of Pure Metal
Tm is the melting Temperature.
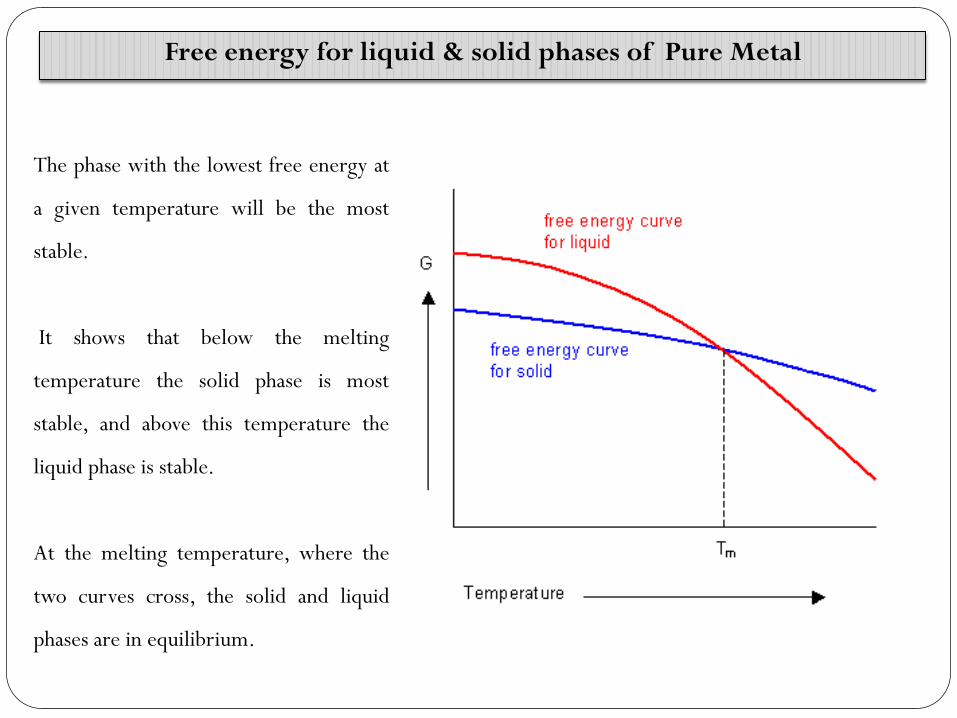
Free energy for liquid & solid phases of Pure Metal
The phase with the lowest free energy at
a given temperature will be the most
stable.
It shows that below the melting
temperature the solid phase is most
stable, and above this temperature the
liquid phase is stable.
At the melting temperature, where the
two curves cross, the solid and liquid
phases are in equilibrium.
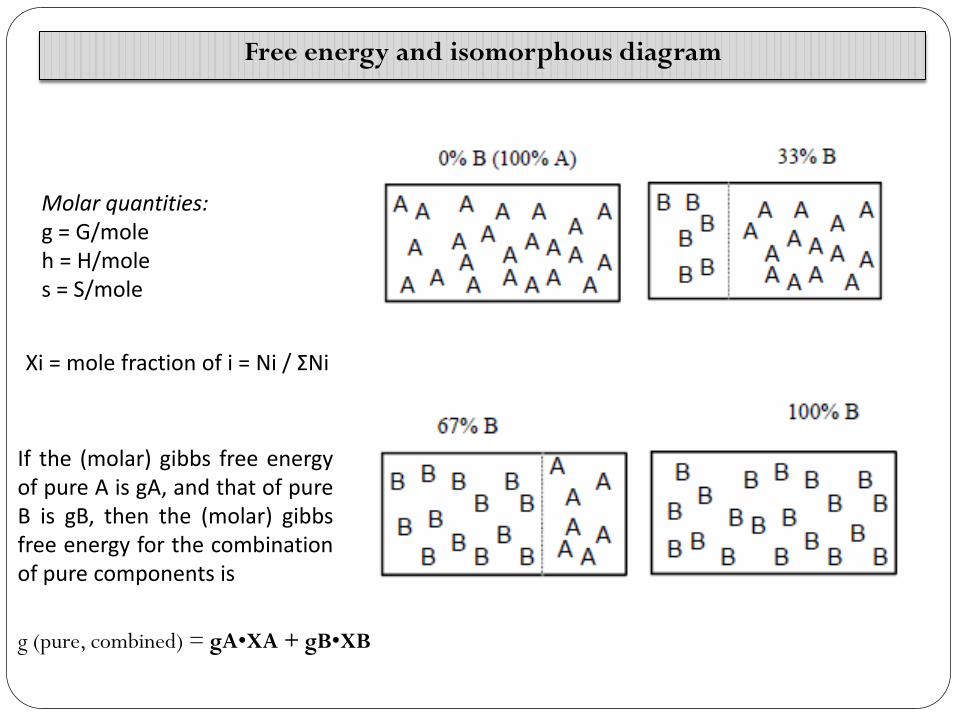
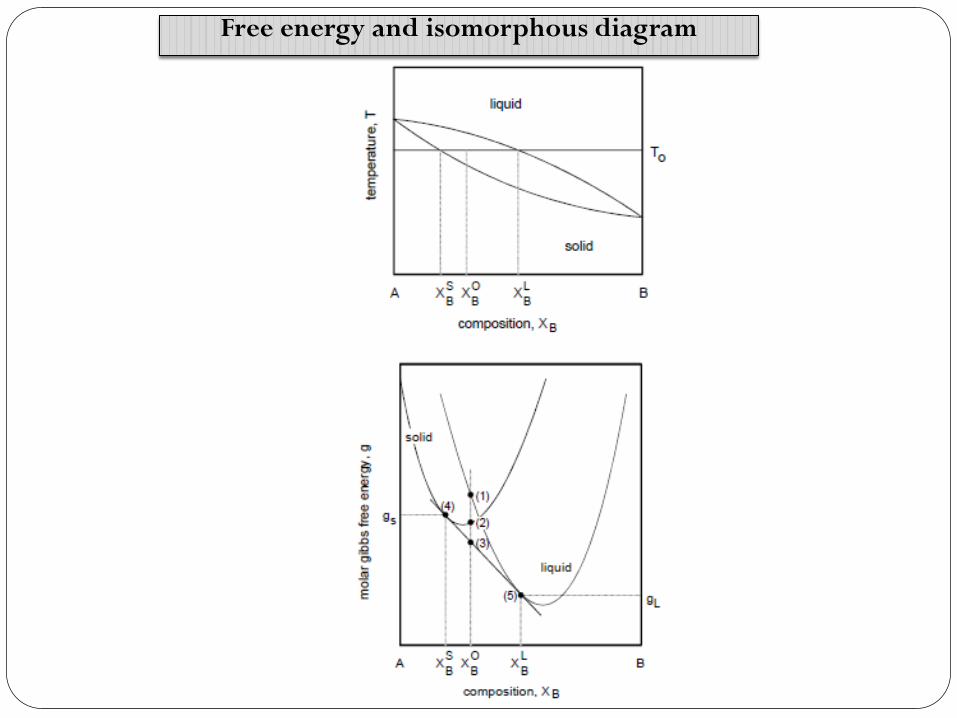
Free energy and isomorphous diagram
Molar quantities: g = G/mole h = H/mole s = S/mole
Xi = mole fraction of i = Ni / ΣNi
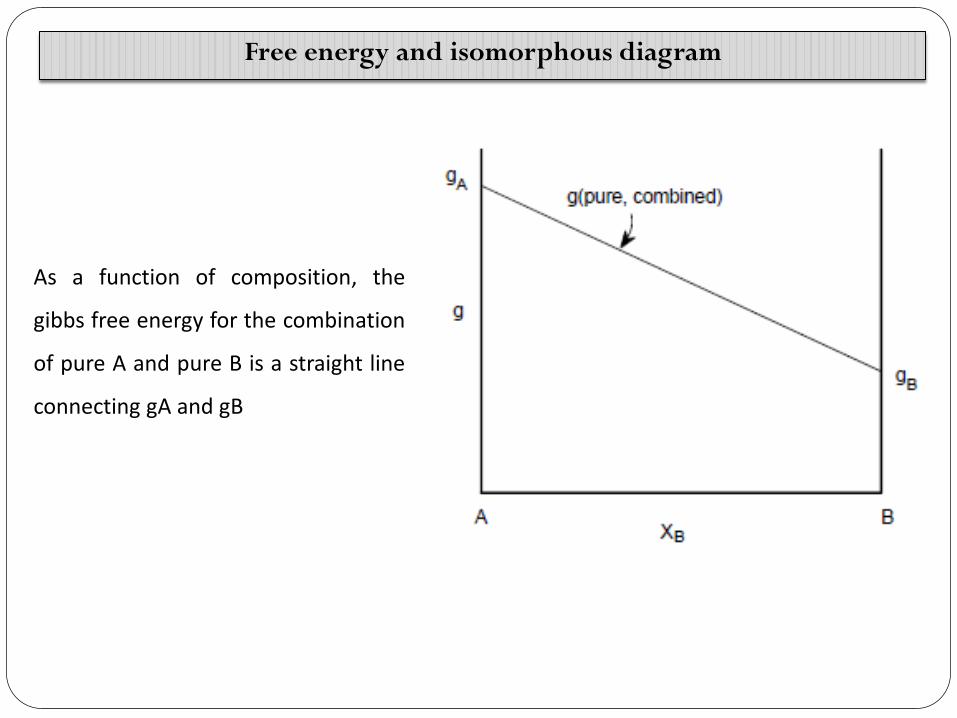
If the (molar) gibbs free energy of pure A is gA, and that of pure B is gB, then the (molar) gibbs free energy for the combination of pure components is
g (pure, combined) = gA•XA + gB•XB
Free energy and isomorphous diagram
As a function of composition, the
gibbs free energy for the combination
of pure A and pure B is a straight line
connecting gA and gB
Free energy and isomorphous diagram
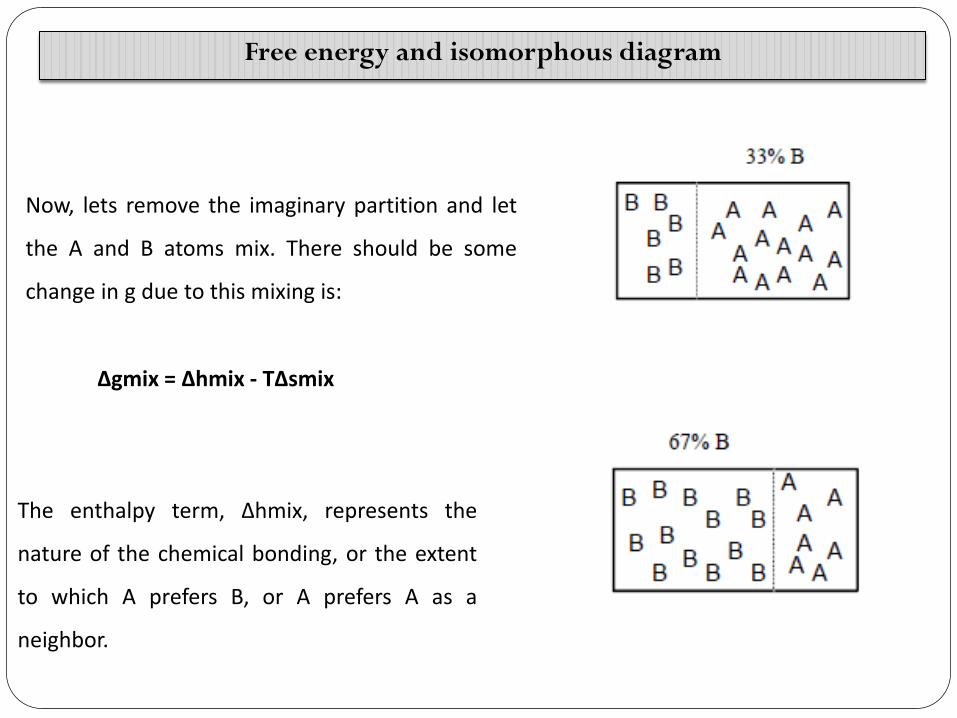
Now, lets remove the imaginary partition and let
the A and B atoms mix. There should be some
change in g due to this mixing is:
Δgmix = Δhmix - TΔsmix
The enthalpy term, Δhmix, represents the
nature of the chemical bonding, or the extent
to which A prefers B, or A prefers A as a
neighbor.
Free energy and isomorphous diagram
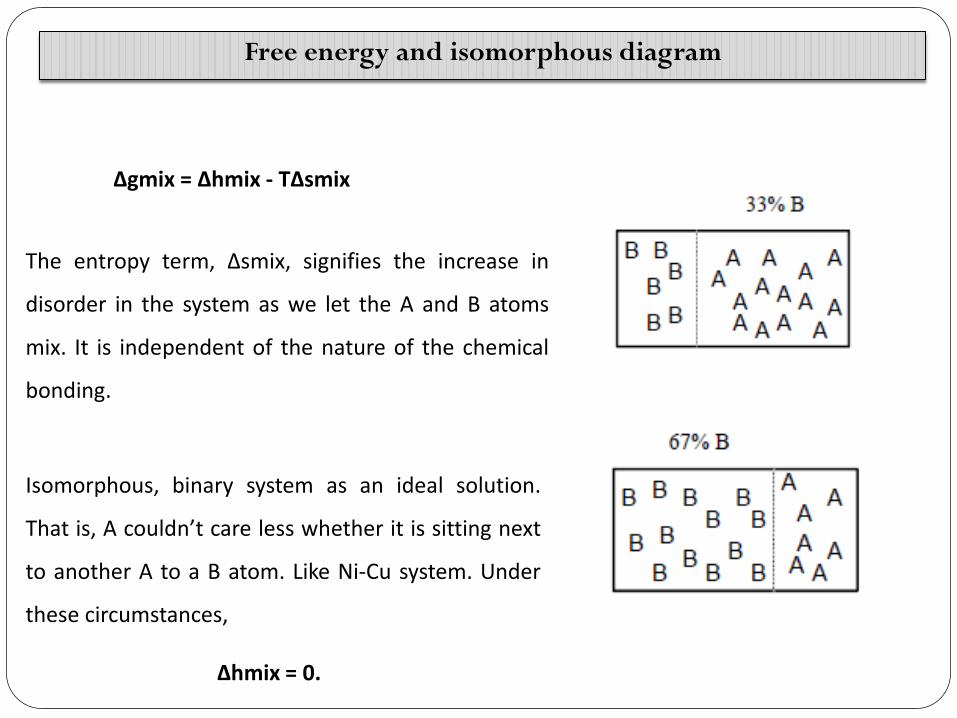
Δgmix = Δhmix - TΔsmix
The entropy term, Δsmix, signifies the increase in
disorder in the system as we let the A and B atoms
mix. It is independent of the nature of the chemical
bonding.
Isomorphous, binary system as an ideal solution.
That is, A couldn’t care less whether it is sitting next
to another A to a B atom. Like Ni-Cu system. Under
these circumstances,
Δhmix = 0.
Free energy and isomorphous diagram
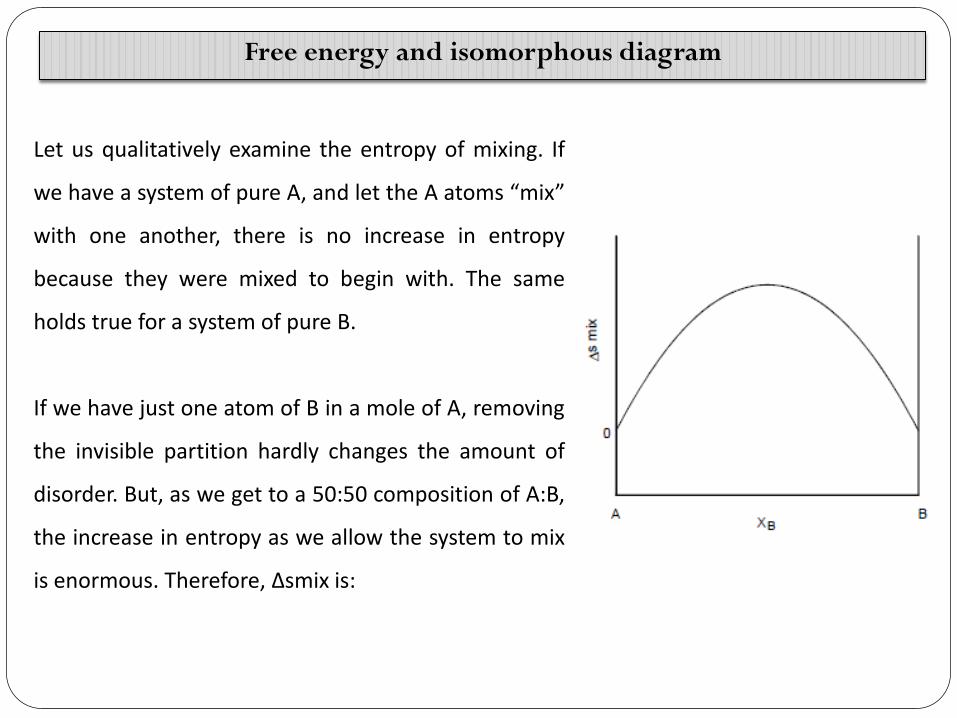
Let us qualitatively examine the entropy of mixing. If
we have a system of pure A, and let the A atoms “mix”
with one another, there is no increase in entropy
because they were mixed to begin with. The same
holds true for a system of pure B.
If we have just one atom of B in a mole of A, removing
the invisible partition hardly changes the amount of
disorder. But, as we get to a 50:50 composition of A:B,
the increase in entropy as we allow the system to mix
is enormous. Therefore, Δsmix is:
Free energy and isomorphous diagram
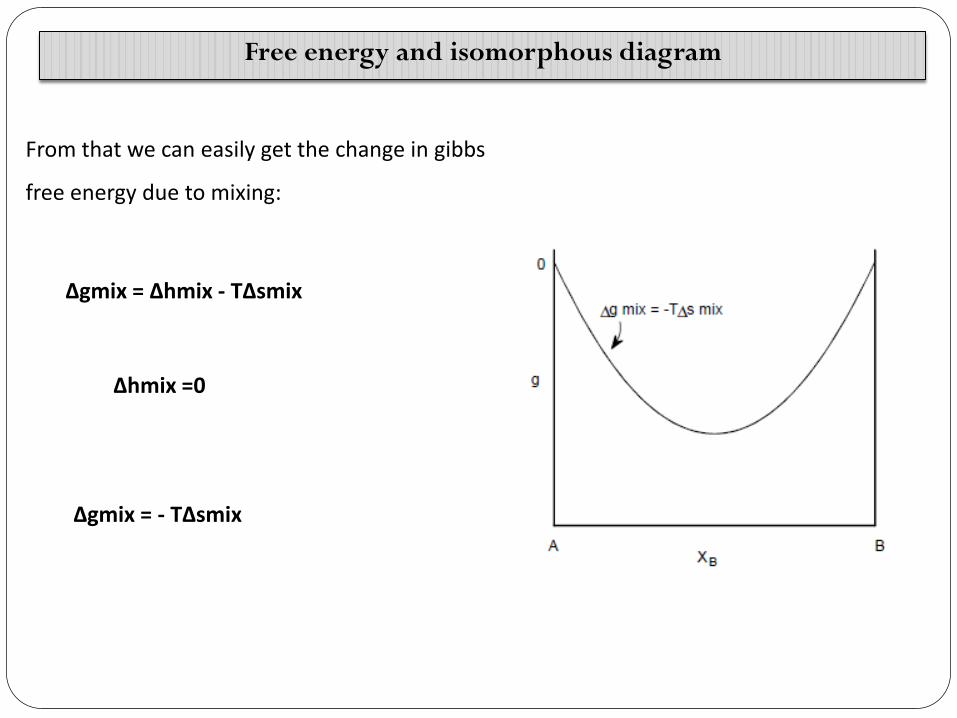
From that we can easily get the change in gibbs
free energy due to mixing:
Δgmix = Δhmix - TΔsmix
Δhmix =0
Δgmix = - TΔsmix
Free energy and isomorphous diagram
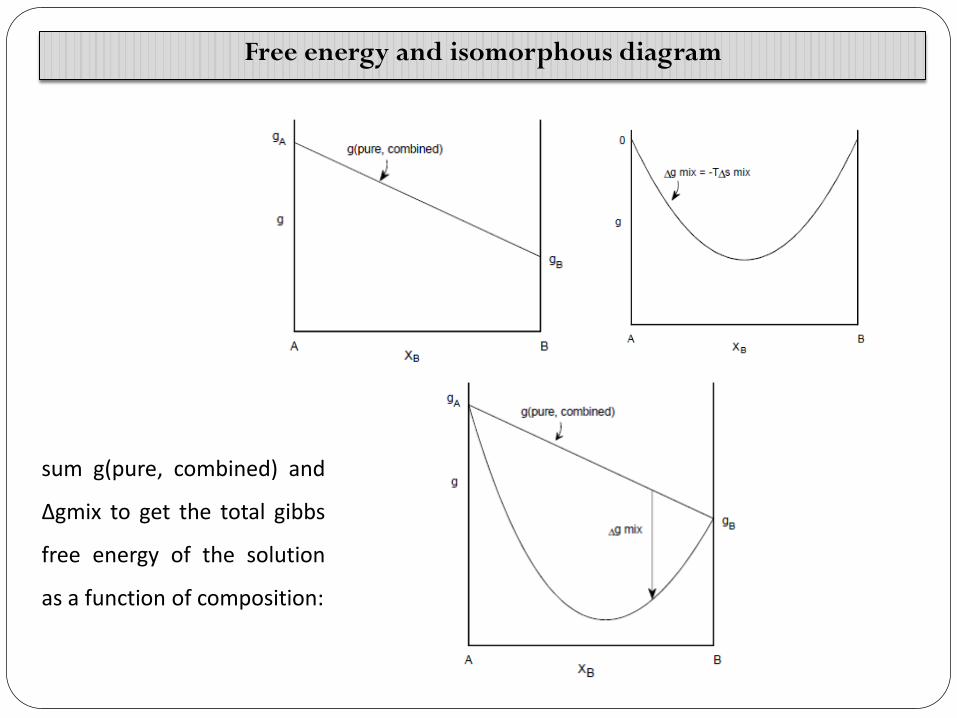
sum g(pure, combined) and
Δgmix to get the total gibbs
free energy of the solution
as a function of composition:
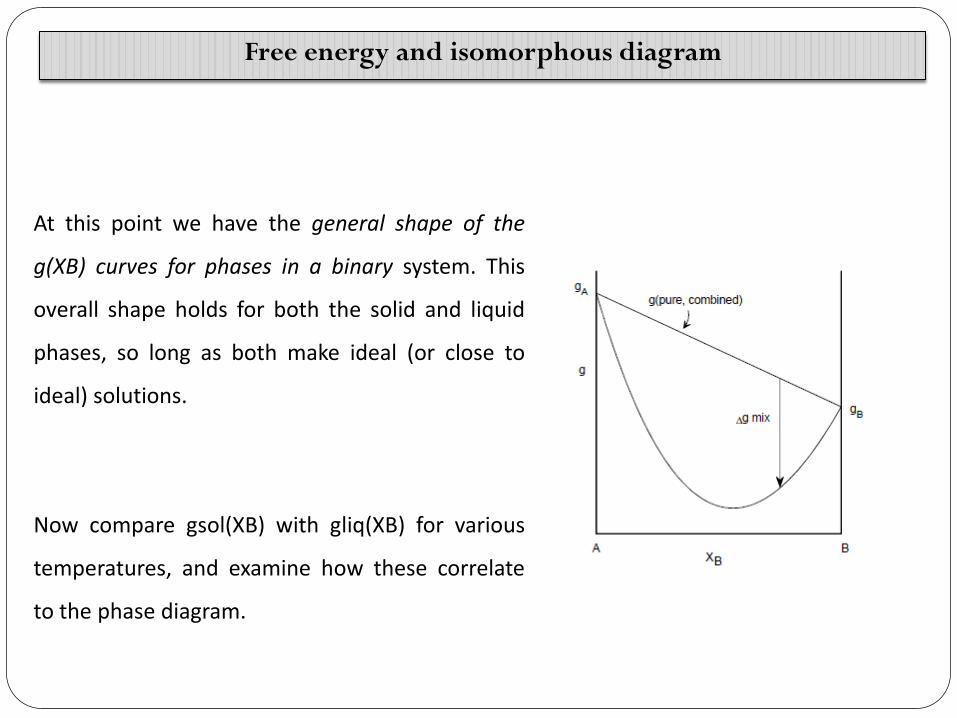
At this point we have the general shape of the
g(XB) curves for phases in a binary system. This
overall shape holds for both the solid and liquid
phases, so long as both make ideal (or close to
ideal) solutions.
Now compare gsol(XB) with gliq(XB) for various
temperatures, and examine how these correlate
to the phase diagram.
Free energy and isomorphous diagram
Free energy and isomorphous diagram
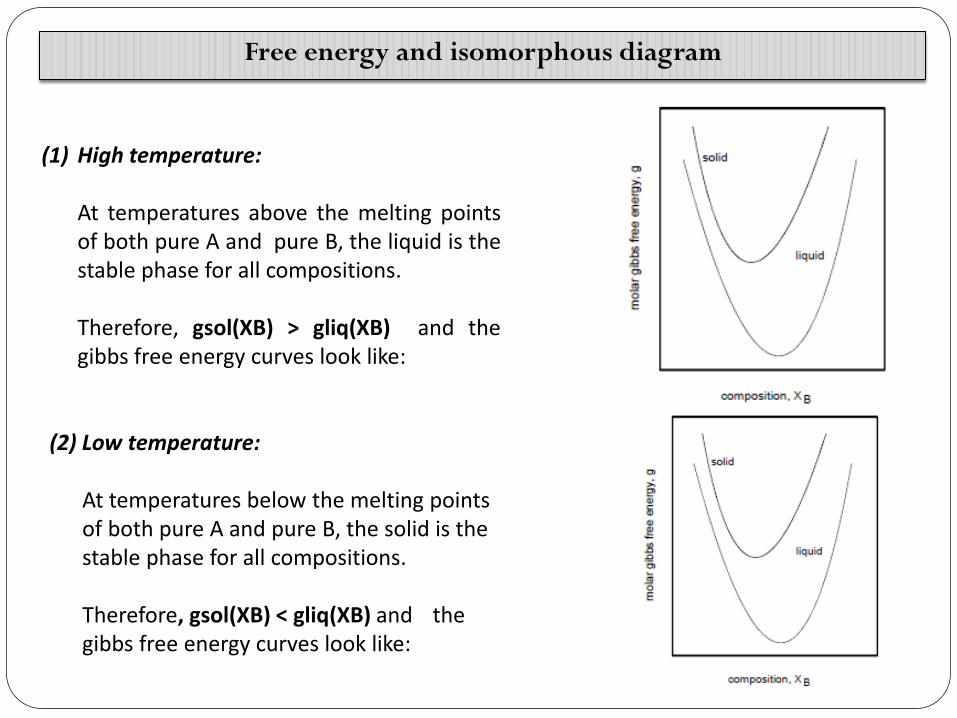
(1) High temperature:
At temperatures above the melting points of both pure A and pure B, the liquid is the stable phase for all compositions.
Therefore, gsol(XB) > gliq(XB) and the
gibbs free energy curves look like:
(2) Low temperature:
At temperatures below the melting points of both pure A and pure B, the solid is the stable phase for all compositions. Therefore, gsol(XB) < gliq(XB) and the gibbs free energy curves look like:
Free energy and isomorphous diagram
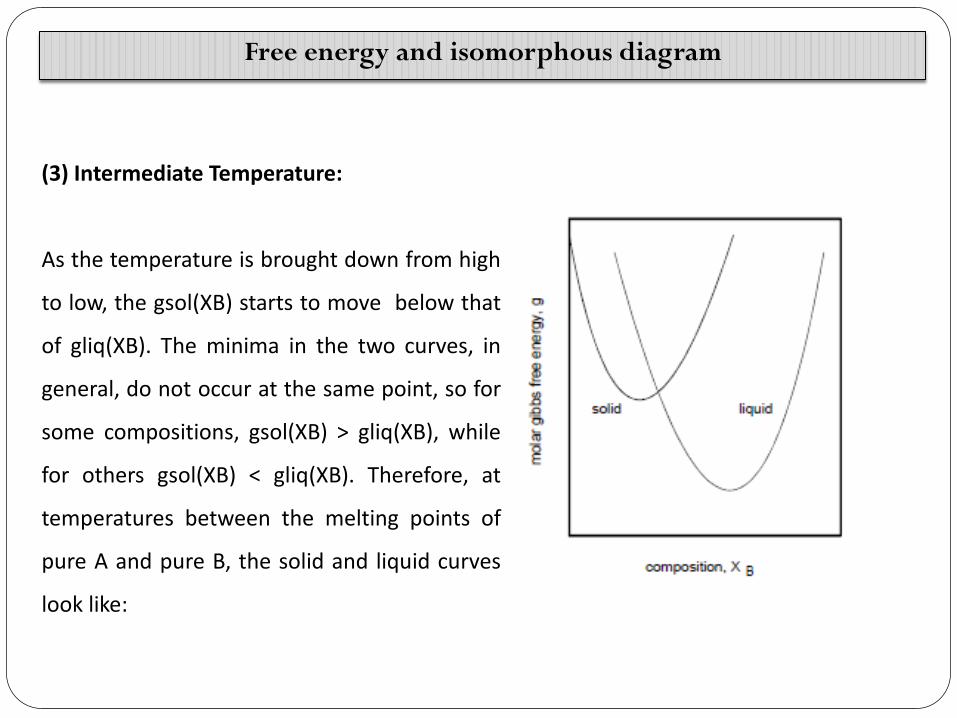
(3) Intermediate Temperature:
As the temperature is brought down from high
to low, the gsol(XB) starts to move below that
of gliq(XB). The minima in the two curves, in
general, do not occur at the same point, so for
some compositions, gsol(XB) > gliq(XB), while
for others gsol(XB) < gliq(XB). Therefore, at
temperatures between the melting points of
pure A and pure B, the solid and liquid curves
look like:
Free energy and isomorphous diagram
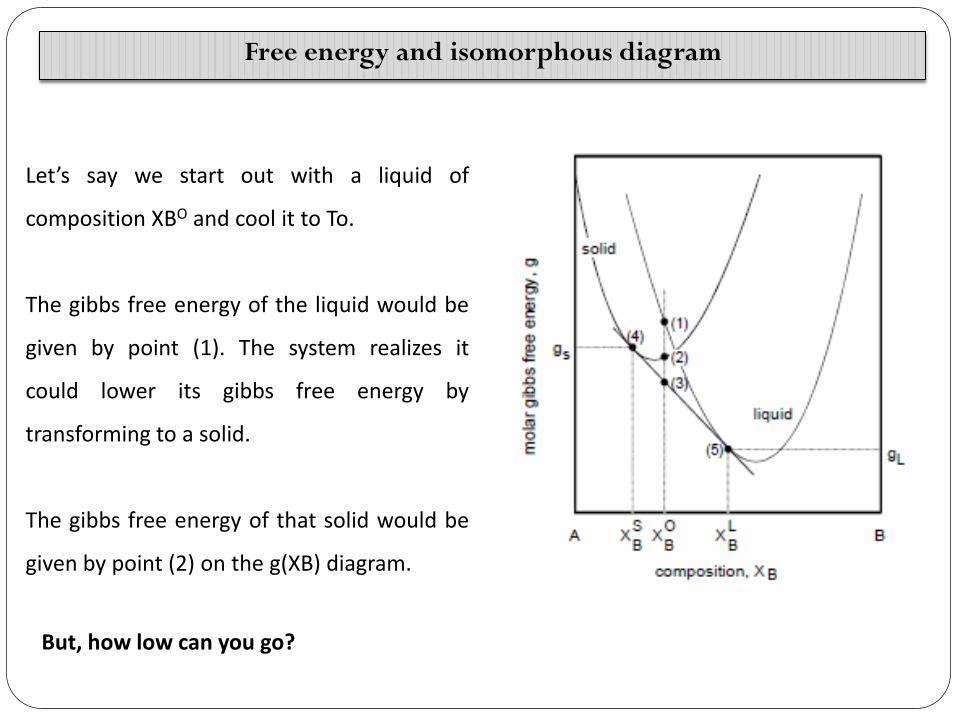
Let’s say we start out with a liquid of
composition XBO and cool it to To.
The gibbs free energy of the liquid would be
given by point (1). The system realizes it
could lower its gibbs free energy by
transforming to a solid.
The gibbs free energy of that solid would be
given by point (2) on the g(XB) diagram.
But, how low can you go?
Free energy and isomorphous diagram
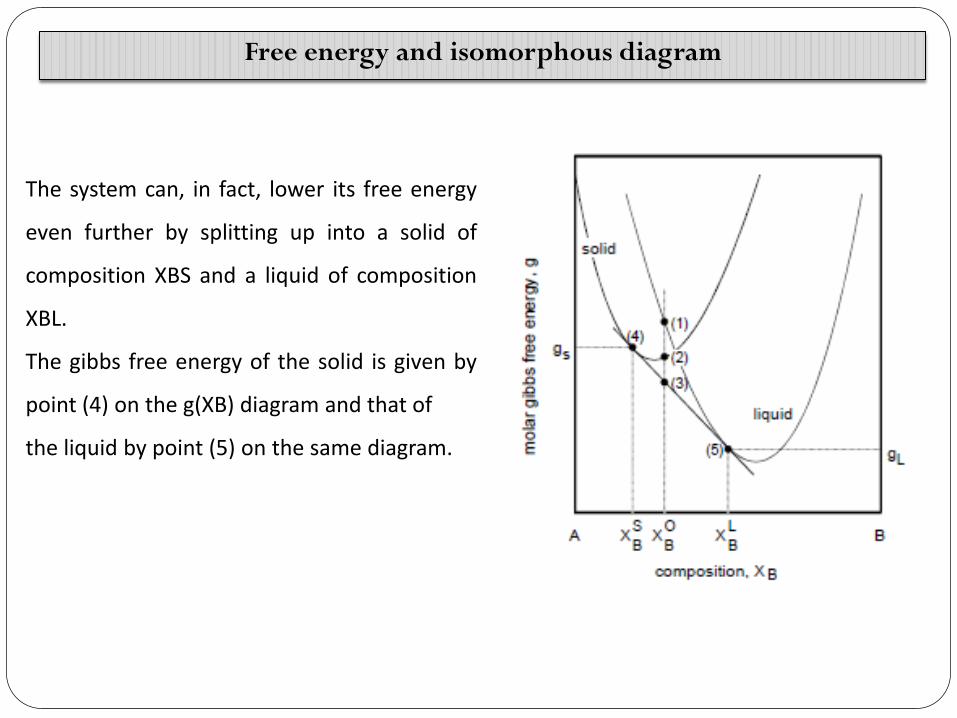
The system can, in fact, lower its free energy
even further by splitting up into a solid of
composition XBS and a liquid of composition
XBL.
The gibbs free energy of the solid is given by
point (4) on the g(XB) diagram and that of
the liquid by point (5) on the same diagram.
Free energy and isomorphous diagram
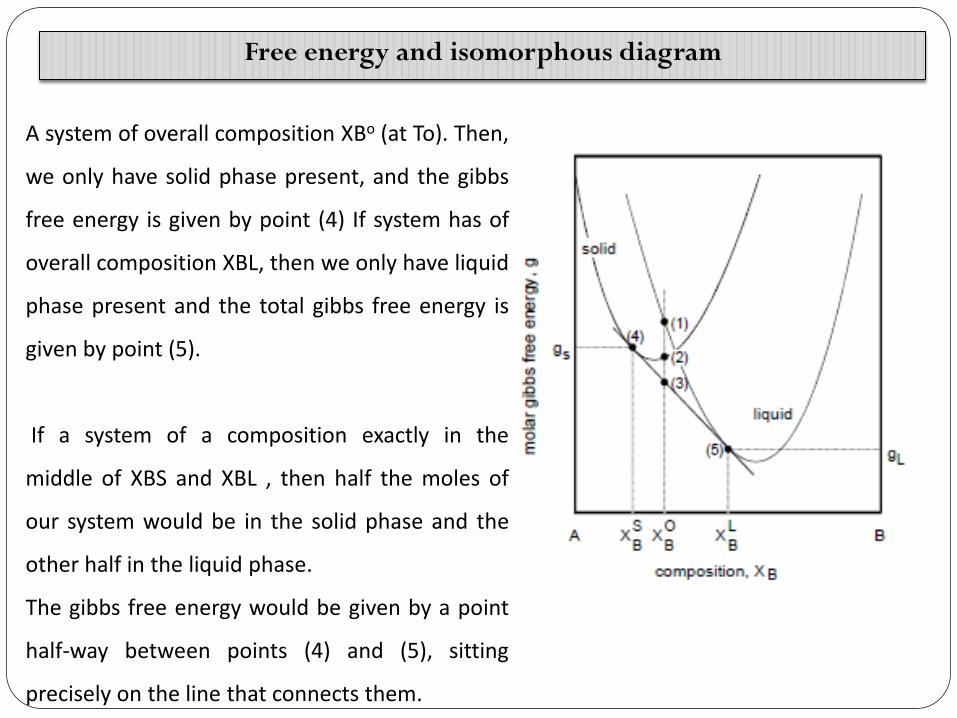
A system of overall composition XBo (at To). Then,
we only have solid phase present, and the gibbs
free energy is given by point (4) If system has of
overall composition XBL, then we only have liquid
phase present and the total gibbs free energy is
given by point (5).
If a system of a composition exactly in the
middle of XBS and XBL , then half the moles of
our system would be in the solid phase and the
other half in the liquid phase.
The gibbs free energy would be given by a point
half-way between points (4) and (5), sitting
precisely on the line that connects them.
Free energy and isomorphous diagram
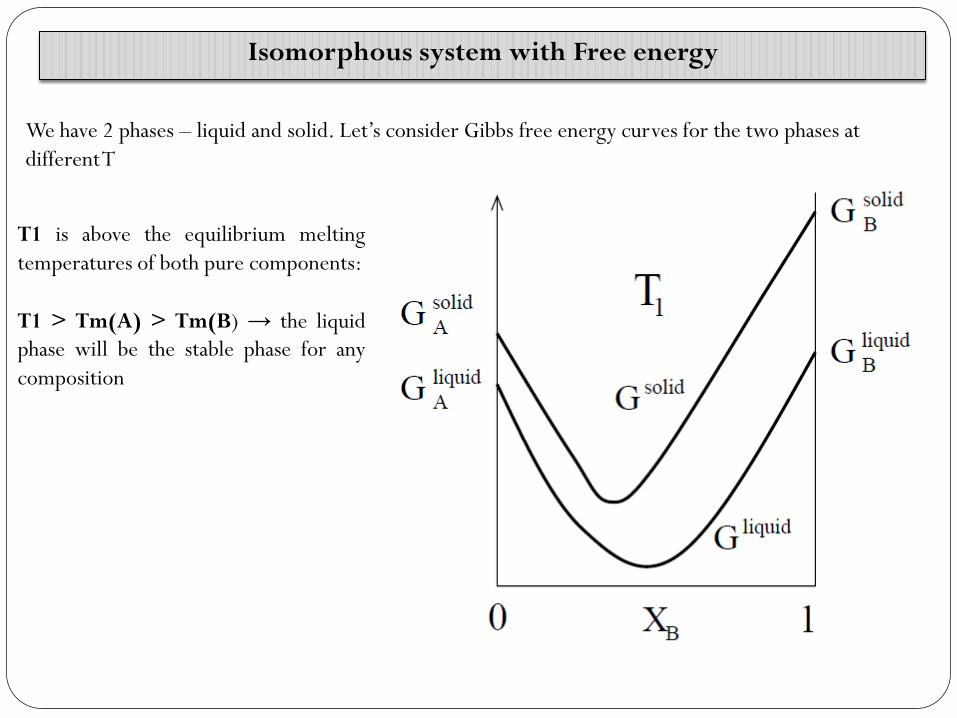
Isomorphous system with Free energy
We have 2 phases – liquid and solid. Let’s consider Gibbs free energy curves for the two phases at
different T
T1 is above the equilibrium melting
temperatures of both pure components:
T1 > Tm(A) > Tm(B) → the liquid
phase will be the stable phase for any
composition
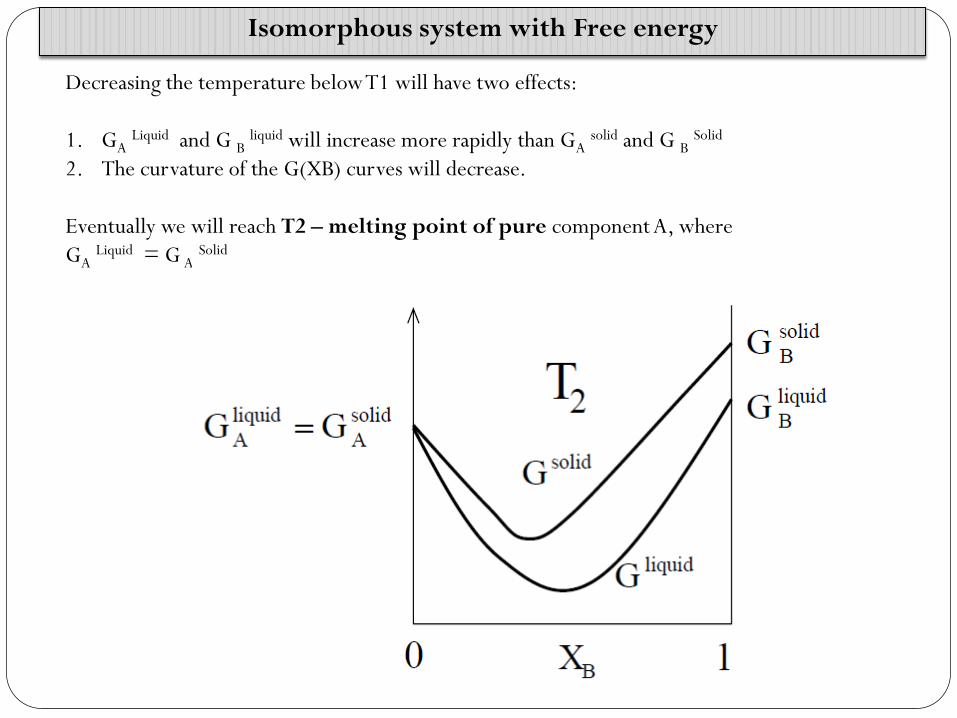
Isomorphous system with Free energy
Decreasing the temperature below T1 will have two effects:
1. GA Liquid and G B liquid will increase more rapidly than GA solid and G B Solid
2. The curvature of the G(XB) curves will decrease.
Eventually we will reach T2 – melting point of pure component A, where
GA Liquid = G A Solid
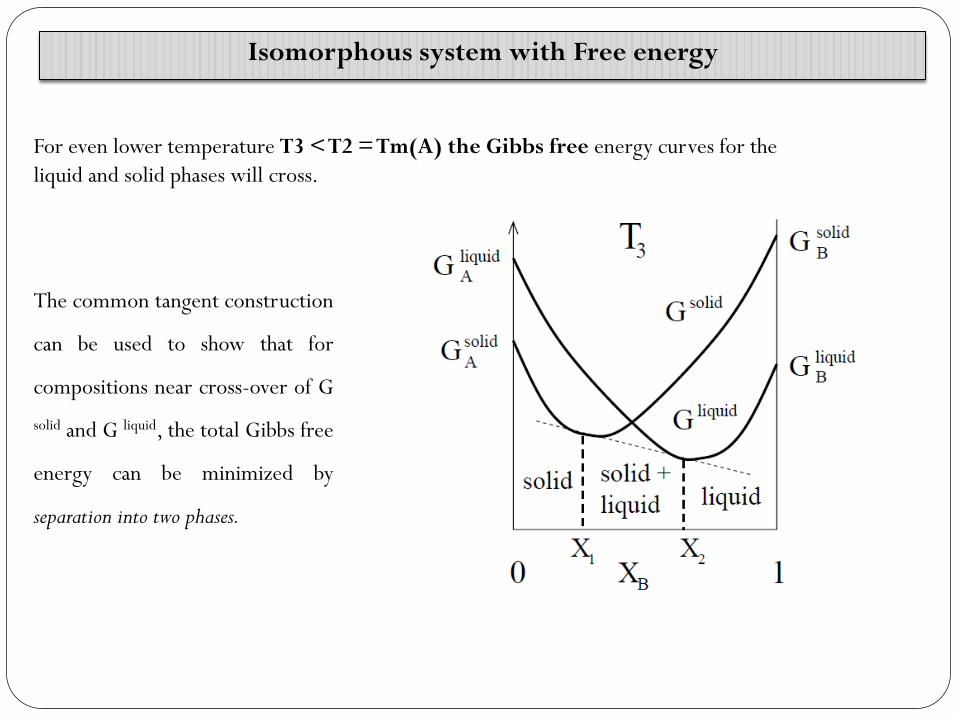
Isomorphous system with Free energy
For even lower temperature T3 < T2 = Tm(A) the Gibbs free energy curves for the
liquid and solid phases will cross.
The common tangent construction
can be used to show that for
compositions near cross-over of G
solid and G liquid, the total Gibbs free
energy can be minimized by
separation into two phases.
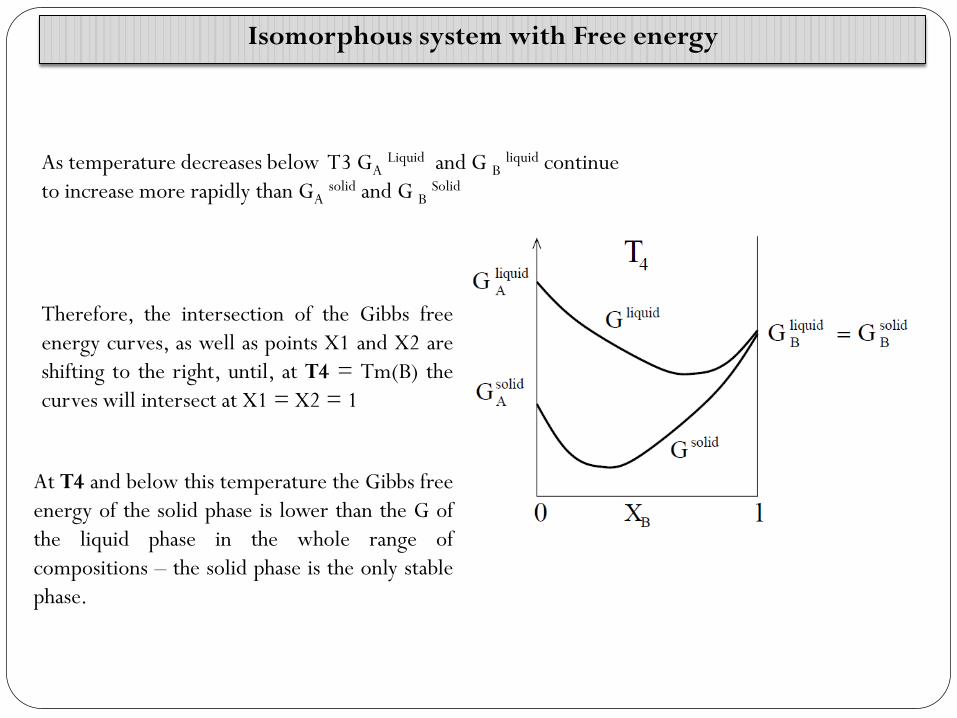
As temperature decreases below T3 GA Liquid and G B liquid continue
to increase more rapidly than GA solid and G B Solid
Therefore, the intersection of the Gibbs free
energy curves, as well as points X1 and X2 are
shifting to the right, until, at T4 = Tm(B) the
curves will intersect at X1 = X2 = 1
At T4 and below this temperature the Gibbs free
energy of the solid phase is lower than the G of
the liquid phase in the whole range of
compositions – the solid phase is the only stable
phase.
Isomorphous system with Free energy
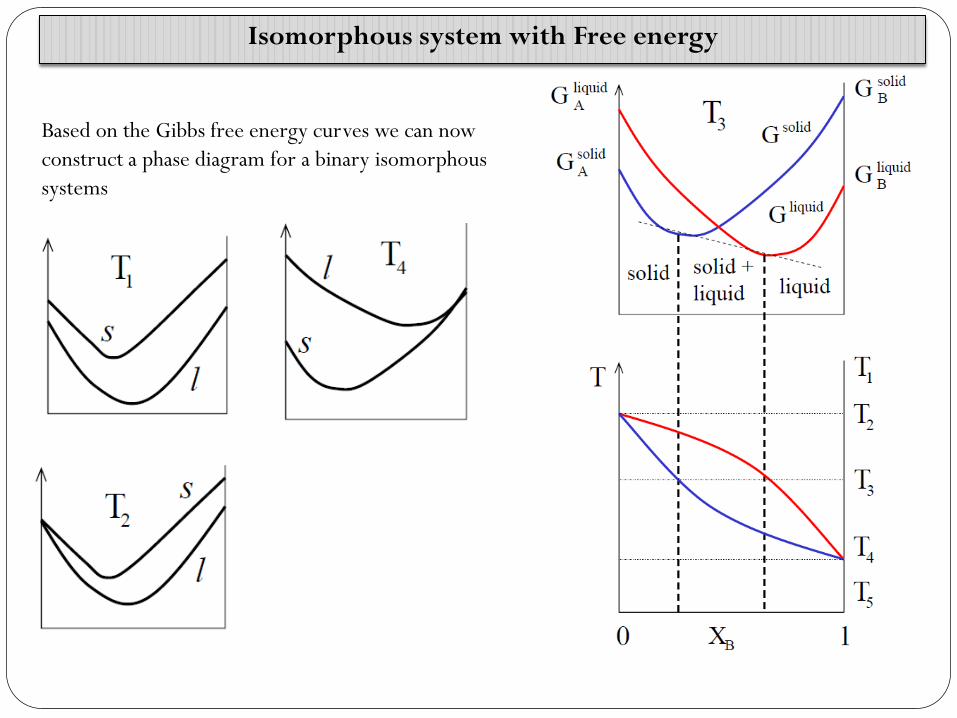
Based on the Gibbs free energy curves we can now
construct a phase diagram for a binary isomorphous
systems
Isomorphous system with Free energy
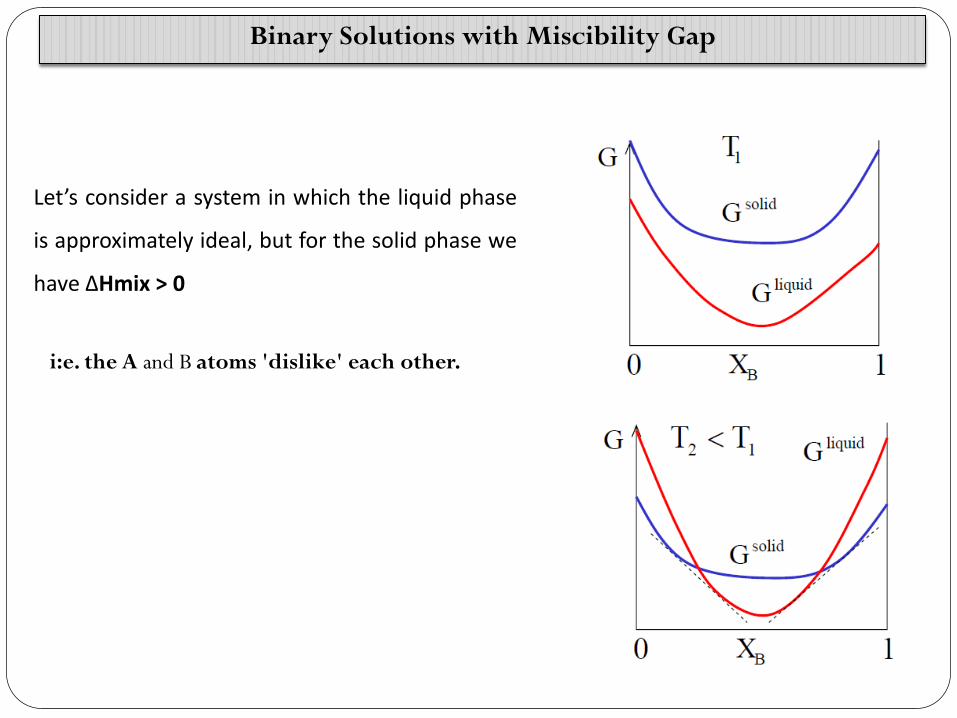
Binary Solutions with Miscibility Gap
Let’s consider a system in which the liquid phase
is approximately ideal, but for the solid phase we
have ΔHmix > 0
i:e. the A and B atoms 'dislike' each other.
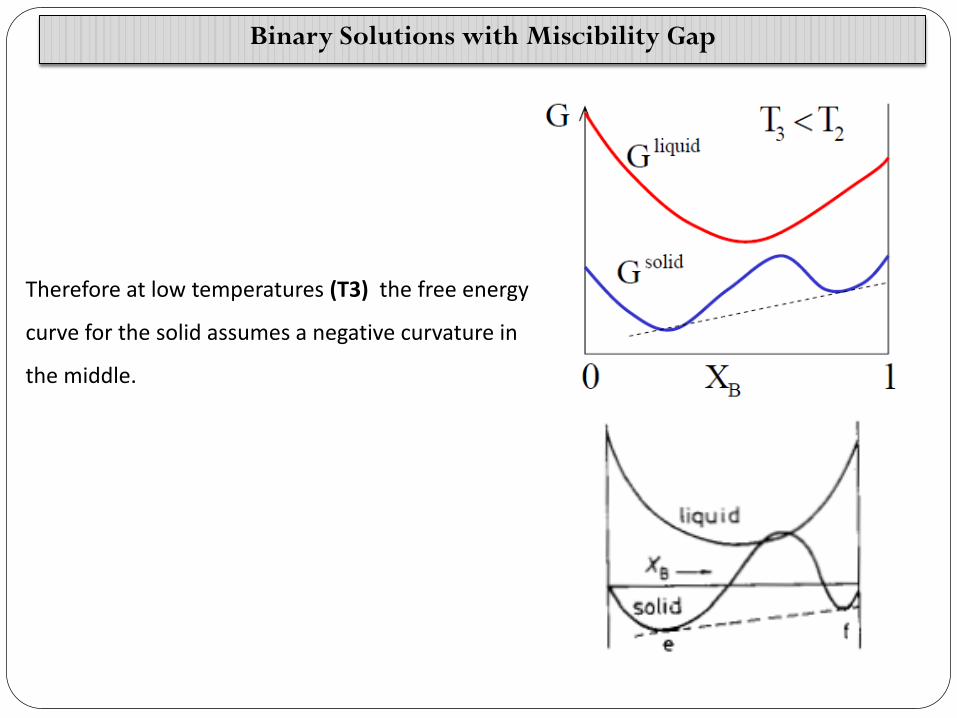
Binary Solutions with Miscibility Gap
Therefore at low temperatures (T3) the free energy
curve for the solid assumes a negative curvature in
the middle.
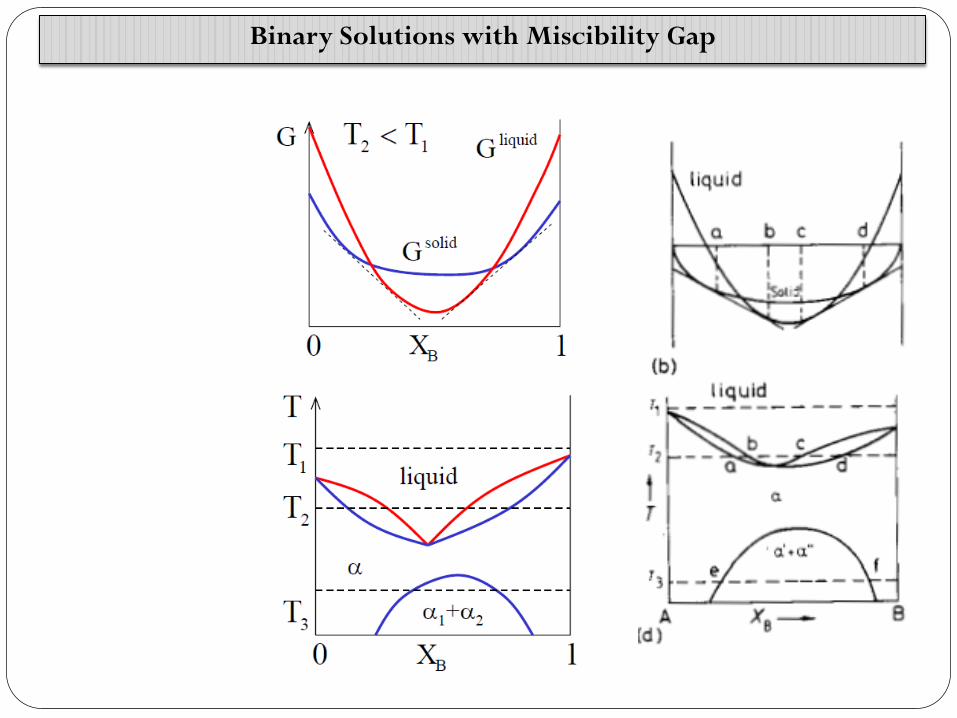
Binary Solutions with Miscibility Gap