PHASE 1 REPORT APPENDIX DRAFT 8/2/06 Sections: III...
21
8/31/06 DWS Item 3 Page 1 of 21 PHASE 1 REPORT APPENDIX DRAFT 8/2/06 Sections: I. Drinking Water 1 II. Toxicity of Unknown Cause 22 III. Mercury Effects on the Ecosystem & Human Health 29 IV. Levee System Integrity 47 V. Water Supply Reliability 54 I. Drinking Water A. Overall questions for subgroup 1. List the criteria for selection of core indicators and associated strategic objectives (SOW #4) The constituents for drinking water were selected based on the analyses and recommendations in the following documents: CALFED ROD and Water Quality Program Plan Water Quality Program Initial Assessment Central Valley Drinking Water Policy work products (prioritized constituents, conceptual model recommendations) CALFED WQP Strategic Planning Draft materials 2. List of strategic objectives for first round (those that will be assembled for the Phase 2 analysis and report) (SOW#4) Four general topics were chosen for indicator development: • Water quality at the Delta intakes • Water quality for the tap (post-treatment/pre-distribution) • Cost • Reliability/Flexibility The first two will be developed in Phase 2. The others will be developed in later phases. 3. List of other efforts relevant to these core indicators and coordination strategy (SOW #3) Regional ELPH Pilot Plans and Regional Planning Framework Franks Tract/Delta Cross Channel/Through Delta Facility projects CALFED Storage Investigations San Joaquin Water Quality Management Group Stockton Dissolved Oxygen Project – nutrient studies Regional WQCB/State WRCB Salinity Strategy Local drinking water utilities master planning for water quality improvements Municipal Water Quality Investigations program
Transcript of PHASE 1 REPORT APPENDIX DRAFT 8/2/06 Sections: III...

8/31/06 DWS Item 3
Page 1 of 21
PHASE 1 REPORT APPENDIX DRAFT 8/2/06
Sections:
I. Drinking Water 1 II. Toxicity of Unknown Cause 22 III. Mercury Effects on the Ecosystem & Human Health 29 IV. Levee System Integrity 47 V. Water Supply Reliability 54
I. Drinking Water A. Overall questions for subgroup
1. List the criteria for selection of core indicators and associated strategic objectives (SOW #4) The constituents for drinking water were selected based on the analyses and recommendations in the following documents:
CALFED ROD and Water Quality Program Plan Water Quality Program Initial Assessment Central Valley Drinking Water Policy work products (prioritized constituents, conceptual model recommendations) CALFED WQP Strategic Planning Draft materials
2. List of strategic objectives for first round (those that will be assembled for the Phase 2 analysis and report) (SOW#4)
Four general topics were chosen for indicator development: • Water quality at the Delta intakes • Water quality for the tap (post-treatment/pre-distribution) • Cost • Reliability/Flexibility The first two will be developed in Phase 2. The others will be developed in later phases.
3. List of other efforts relevant to these core indicators and coordination strategy
(SOW #3) Regional ELPH Pilot Plans and Regional Planning Framework Franks Tract/Delta Cross Channel/Through Delta Facility projects CALFED Storage Investigations San Joaquin Water Quality Management Group Stockton Dissolved Oxygen Project – nutrient studies Regional WQCB/State WRCB Salinity Strategy Local drinking water utilities master planning for water quality improvements Municipal Water Quality Investigations program

8/31/06 DWS Item 3
Page 2 of 21
National research on drinking water treatment, CALFED-funded treatment demonstration studies
4. Develop more detailed questionnaire and table of information for each strategic objective / core indicator. (See section B below)
B.1 Water quality at the Delta intakes B.2 Water quality for the tap
5. Identify which indicators are linked to other CALFED program elements and
other non-CALFED efforts. (SOW #8) (Work with list in #3)
6. Identify which indicators have linkages for environmental justice, working landscapes or citizen involvement and education.
7. Compile information and prioritize information gaps and resource needs to
complete monitoring, data acquisition, data analysis, information organization and presentation. (SOW# 10) Detailed analysis from Section B to be summarized.

8/31/06 DWS Item 3
Page 3 of 21
Conceptual and quantitative models: Upstream and In-Delta
Delta hydrodynamics
Sources & fate of pollutants
Water quality at Delta intakes
Organic Carbon at
intakes
Salinity/
bromide at intakes
Nutrients at intakes
Pathogens at intakes
Sources organic carbon
Sources salinity/ bromide
Sources Nutrients
Sources pathogens
Natural hydrology
Water operations
Delta/Bay bathymetry
Location of intakes
Conceptual and quantitative models: Downstream from Delta intakes – linking source
water quality to tap water quality
Disinfection byproducts
at tap
Salinity at tap
Taste and odor at tap
Disinfection level/ type
Water quality for the tap
RegulationsSocioeconomic considerations Raw water
quality
Treatment plant
characteristics
Other sources
WQ
Storage, conveyance
WQ
WQ1
WQ2
Drivers
Outcomes
Drivers
Outcomes

8/31/06 DWS Item 3
Page 4 of 21
B. 1 Outcome indicator questionnaire and breakout table Water Quality at the Delta intakes
1. Short description or key phrase: Water Quality at the Delta intakes. This will include data for 4 groups of constituents (organic carbon, nutrients, salinity/bromide, pathogens) and from the 5 Delta intakes (State Water Project-Banks Pumping Plant (DWR), Central Valley Project-Tracy Pumping Plant (USBR), Old River and Rock Slough (CCWD), North Bay aqueduct (DWR)).
2. What goal(s) and objective(s) are the outcome indicator related to? What is the
rationale or supporting information for how this indicator relates to the goal and objective. (Please provide a reference in the CALFED documents for specific objectives). The program goal is to provide good water quality for all beneficial uses (CALFED Record of Decision). The strategic objective for drinking water quality is:
CALFED Agencies have adopted a general target of continuously improving Delta water quality for all uses, including in-Delta environmental and agricultural uses. Program actions designed to improve water quality to protect environmental uses are generally included in the Ecosystem Restoration Program (ERP) discussed above. For the drinking water quality program, CALFED Agencies have developed a specific goal based upon extensive stakeholder and agency involvement. CALFED Agencies’ target for providing safe, reliable, and affordable drinking water in a cost-effective way, is to achieve either: (a) average concentrations at Clifton Court Forebay and other southern and central Delta drinking water intakes of 50 µg/L bromide and 3.0 mg/L total organic carbon, or (b) an equivalent level of public health protection using a cost-effective combination of alternative source waters, source control and treatment technologies. (Page 65 CALFED Record of Decision)
3. Documents any long-term performance objectives in the CALFED documents
that related to this goal and indicator. Document any short-term performance goals or targets in the CALFED documents related to this goal and indicator. (provide references) How does this indicator relate to performance goals and targets in the documents?
CALFED ROD only discusses long-term performance objectives, although it does require an end of Stage I evaluation on progress towards the objectives (CALFED ROD). The quantitative long term performance measures listed in the ROD are 50 ug/L Bromide and 3 mg/L Total Organic Carbon at the Delta intakes or an equivalent level of public health protection at the tap. The Water Quality Program Plan (Appendix of the ROD) also includes a table of goals for the drinking water constituents.

8/31/06 DWS Item 3
Page 5 of 21
4. If there is a lack of performance measures or targets in CALFED documents for
this indicator – draft a qualitative (non-numeric) long-term performance objective related to the goal and indicators. The long-term performance objective should describe what success would “look like” for this goal and indicator. Provide any supporting reasoning or rationale. If quantitative targets or performance goals are needed – note in the table.
The Central Valley Drinking Water Policy development will evaluate and provide recommendations for regulatory objectives for the constituents of concern, including re-evaluation of the organic carbon and bromide targets.
5. Document any conceptual or quantitative models that are related to this outcome indicator and describe what factors are or may be influencing the outcome. How complete are they for documenting linkages between the outcome and the controlling factors? Does the conceptual model have references from peer-reviewed literature? Has the conceptual model had independent review? If using a quantitative model, has it been validated and verified? Provide a discussion on the quality and completeness of the conceptual or quantitative model. Provide a graphic (with a reference) of the conceptual model to be included in the appendix.
Yes, there are two conceptual models. Water quality at the intakes is an outcome and a driver in the “Equivalent Level of Public Health” (ELPH) conceptual model. Water quality at the pumps is an outcome in the conceptual model and sub-models being developed for the Central Valley Drinking Water Policy. The ELPH conceptual model was developed by the CALFED Drinking Water Subcommittee. In this conceptual model, water quality at the Delta intakes is an outcome of upstream processes and a driver that affects the water quality at the tap delivered by water utilities using Delta water (see water quality at the tap indicator for information on other drivers and the conceptual model). Because there are specific goals about water quality at the Delta intakes, and it is a major driver affecting delivered water quality, it is important enough to be addressed as an intermediate outcome indicator, even though it is a driver for another outcome indicator (water quality for the tap). The other conceptual model is a collection of quantitative and conceptual models that describe how water quality at the pumps is controlled by tributary inputs (flows and concentrations of pollutants) and the complex hydrodynamics of the Delta that influences which of the tributary and Delta inputs shows up at the intakes. This is complicated by the fact that it will be somewhat different for each of the 5 Delta intakes, and for each of the 4 groups of constituents of concern. The sources, fate and transport of the constituents must each be considered by a separate conceptual model. Hydrodynamic models are used to understand the

8/31/06 DWS Item 3
Page 6 of 21
transport through the Delta and the mix of tributary inputs (or a “fingerprint”) that constitutes the water quality at each intake throughout the year.
6. Provide a list of the major drivers in the conceptual model that are likely to
influence the outcome. Note which ones are uncontrollable factors (by this program) and which are management actions (or potential management actions). For each one, list whether it also has a related conceptual and/or quantitative model related to it. Add to the list any drivers that are identified in the driver conceptual models.
The major drivers for water quality at the intakes include: Delta hydrodynamics, which are influenced by:
o Natural hydrology (uncontrollable factor) o Water operations (management actions include reservoir releases,
conveyance manipulations and pumping rates, all of which have constraints)
o Location of the intake (possible management action) o Delta and bay bathymetry and geometry (possible management
action to modify bathymetry to influence hydrodynamics) Sources, fate and transport of constituents of concern (all have drivers with both uncontrollable factors and potential management actions)
• Organic carbon • Nutrients • Salinity and bromide • Pathogens
7. Document any conceptual or quantitative models associated with the drivers.
Similar to question 5. How complete are the conceptual or quantitative models for documenting linkages between the driver (intermediate outcome) and the controlling factors? Does the conceptual model have references from peer-reviewed literature? Has the conceptual model had independent review? If using a quantitative model, has it been validated and verified? Provide a discussion on the quality and completeness of the conceptual or quantitative model. Provide a graphic (with a reference) of the conceptual model to be included in the appendix. Provide a reference list of key documents or scientific papers that would be useful to managers and decision makers who would like more detailed information about the topic.
Hydrodynamic models: There are several quantitative models currently being used to model Delta hydrodynamics, each with some benefits and limitations. The DSM2 model is a one-dimensional model developed by DWR that can model water movement over long time scales, but it does not work well in modeling areas that are more open water such as Frank’s tract, or where river reaches are wide. DSM2 has some capabilities for modeling some of the water quality

8/31/06 DWS Item 3
Page 7 of 21
constituents, but ____. The DSM2 model has been validated and verified for specific purposes. The RMA model is a proprietary 1 and 2-dimensional model that is being used to understand hydrodynamics at smaller time scales and finer detail. It can be used for modeling areas such as Frank’s tract or other open water areas. The RMA model is not good for analyzing long time scales, as the scale and calculations make it too slow for long time frames. The RMA model has been validated and verified for specific purposes. Multi-dimensional models are needed in some cases to accurately evaluate salinity movement, particularly in areas of the estuary where gravitational circulation of salinity is an important process for salt transport during the tidal cycle. Changes in bathymetry in key areas for salinity gravitational circulation could have dramatic effects on seawater intrusion into the Delta due to tidal dynamics. Water operations models: The CALSIM II model is a general-purpose reservoir-river basin simulation model for the planning and management of the State Water Project and the federal Central Valley Project. It is used by the Department of Water Resources and US Bureau of Reclamation to determine the effects of water operation management actions such as reservoir releases, diversions and conveyance manipulations such as the Delta Cross Channel operations. CALSIM II does not have a lot of capability for modeling water quality constituents. Conceptual and quantitative models for sources, fate and transport of constituents: The Central Valley Drinking Water Quality Policy is developing conceptual models for the constituents of concern: organic carbon, nutrients, salinity and pathogens. The status of these conceptual models is described in the table below. The conceptual models include literature review and identification of key processes in fate and transport, data identification, and load analyses based on export rates and flow regressions. Future refinements of the models would attempt to quantify key processes and controllable sources.
Constituent Model Type Source PR Refs? Reviewed /Validated?
Model status/quality
Organic Carbon
Conceptual CVDWP Yes No Good first step, second step underway, moderate amount of information available
Salinity/ Bromide
Conceptual CVDWP Yes No Just started, lot of information available
Nutrients Conceptual CVDWP Yes No Final in June, good first step, moderate amount of info

8/31/06 DWS Item 3
Page 8 of 21
available, but more complicated than OC
Pathogens Conceptual CVDWP Yes No Draft due in June (?) Don’t expect high level of detail due to monitoring complexity and shortage of data.
Organic Carbon
Quantitative DWR (DSM2)
Yes Yes Based on limited data and substantial assumptions, working to improve
Salinity Quantitative DWR (DSM2, RMA)
Yes Yes RMA expected to improve handling of north delta by end of 2006. Basically good models of Delta, San Joaquin River
Nutrients Quantitative Related to DO effort… Drivers identified in conceptual models: Drivers will be identified in the constituent conceptual models. The first organic carbon conceptual model report has recently been completed and identifies the following list of drivers. Note that the organic carbon conceptual model is focused on drinking water quality, but it is hoped to draw out a discussion on the ecosystem interactions with organic carbon. The following are the sources/drivers identified for organic carbon sources, although analysis is still needed to determine their relative contributions:
• Runoff from Natural sources (controllable but not economically) • Runoff from Anthropogenic sources (controllable to some degree) • Stormwater discharges (can be treated at point of entry) • Wastewater discharges (can be treated at industrial sources and POE) • Primary productivity (limited ability to influence through nutrient
source control and water operations) • Hydrology (effects runoff, not controllable)
8. Do any data exist for the outcome indicator?
a. To the extent possible, determine what data exist in past and current monitoring programs that can be used to evaluate the outcome indicator? Who collects the data and where is it stored? Discuss spatial and temporal extent of data related to this outcome indicator. Discuss data availability.
b. To the extent possible, evaluate the quality of the data to use as an outcome indicator. What field methods are used for sampling, what methods for lab analysis (if applicable). In general, what is known about the Quality Assurance program and the quality of the data to be used?
Data from multiple sources have been compiled into one database for analysis. The
sources of data include CDEC, Department of Water Resources Municipal Water Quality Investigations, Contra Costa Water District, and U.S. Bureau of Reclamation.

8/31/06 DWS Item 3
Page 9 of 21
The organic carbon conceptual model report provides details about these issues for the water quality at Delta intakes. It also identifies fingerprint modeling as a tool to determine the timing of riverine and estuary influences, and identify potential in-Delta influences. There is a fairly good set of data at the Delta intakes and CALFED has funded purchase and installation high-frequency monitoring of organic carbon at Banks and Tracy Pumping Plants.
9. Do any data exist for the driver indicators? (See list generated in number 6). a. To the extent possible, determine what data exist in past and current
monitoring programs that can be used to evaluate the major driver indicators? Who collects the data and where is it stored? Discuss spatial and temporal extent of data related to the driver indicators. Discuss data availability.
b. To the extent possible, evaluate the quality of the data for the major driver indicators. What field methods are used for sampling, what methods for lab analysis (if applicable)? In general, what is known about the Quality Assurance program and quality of the data to be used.
As part of the Central Valley Drinking Water Policy Development, water quality data
from multiple sources have been compiled into one database for analysis. This database includes water quality monitoring data on the constituents of concern throughout the Central Valley watershed. The data sources include: Central Valley Regional Water Quality Control Board, Sacramento River Watershed Program, US Geological Survey, DWR Municipal Water Quality Investigations, Sacramento stormwater data, Sacramento Regional Treatment Plant monitoring, University of California Davis, and agricultural drainage monitoring. Details about the water quality data are described in the Meta Data report and conceptual model reports being developed by the Central Valley Drinking Water Policy Group. The second step of conceptual modeling is attempting to determine where data are robust and where additional data are needed.
It is recognized that there are also extensive data collected to support the Delta modeling efforts, but it is beyond the scope of this effort to adequately survey the data available and data gaps for hydrodynamic and water operations modeling. In general, types of data needed for detailed modeling of hydrodynamic modeling of water quality constituents includes: detailed flow data, bathymetry and elevation data (channels, water elevations and land surfaces), water quality monitoring data, and information about water quality processes and rates. Flow data is available from CDEC and USGS.
10. Review the list of drivers and outcome indicators. Are there linkages for environmental justice concerns, working landscapes, or watershed management (affected by local decisions)? Linkages are defined as affecting the indicator or being affected by the indicator. Discuss the linkages for each of those topics.

8/31/06 DWS Item 3
Page 10 of 21
11. What are the significant data and information gaps? The purpose of this is to help prioritize the monitoring and research needs for gathering and synthesizing the information. Provide a list of significant gaps related to the conceptual or quantitative models or the data and data analysis needed related to the outcome and driver indicators. Rank each item on this list as one of the following:
A: information needed for reporting on outcomes (monitoring data) B: information needed for better understanding of the linkages between
drivers and outcomes and improvements in the conceptual model. (research)
C. information needed for reporting on drivers (monitoring data)
12. Provide a ballpark estimate of how much it would cost (provide a cost basis – per year, or one time) to fill the significant information gaps. Try to provide a separate estimate for each line item and then add them together for each category (A,B,C).
13. With a target date of spring 2007, estimate how much staff time would be
needed to develop a web-based information organization of conceptual models and data related to outcome and driver indicators (including data acquisition and analysis). What staff time is currently available to work on this (break it out by agency)? What are the resource needs to complete this? A great deal of data processing and statistical analysis is still needed to understand these questions. I would estimate approximately .5 PY to complete this task by spring 2007. Currently CVDWP consultant and CBDA staff are undertaking this task, but are not able to devote sufficient time to this task.
8/31/06 DWS Item 3
Page 11 of 21
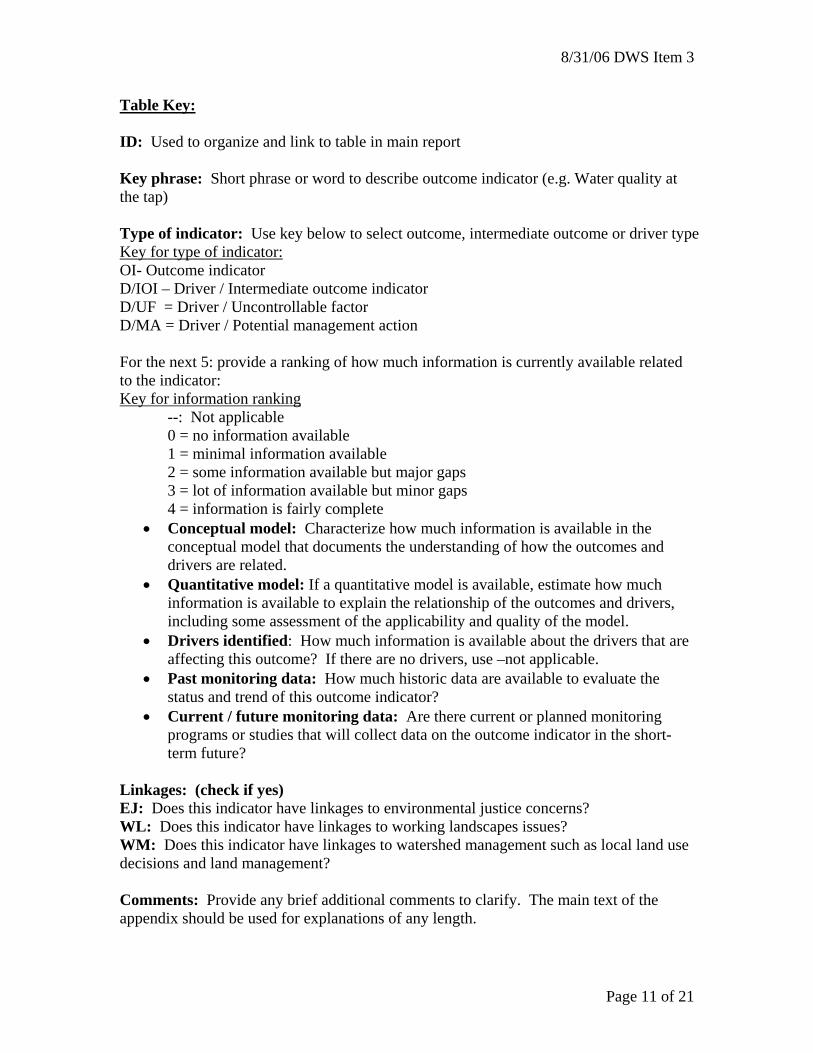
Table Key: ID: Used to organize and link to table in main report Key phrase: Short phrase or word to describe outcome indicator (e.g. Water quality at the tap) Type of indicator: Use key below to select outcome, intermediate outcome or driver type Key for type of indicator: OI- Outcome indicator D/IOI – Driver / Intermediate outcome indicator D/UF = Driver / Uncontrollable factor D/MA = Driver / Potential management action For the next 5: provide a ranking of how much information is currently available related to the indicator: Key for information ranking
--: Not applicable 0 = no information available 1 = minimal information available 2 = some information available but major gaps 3 = lot of information available but minor gaps
4 = information is fairly complete • Conceptual model: Characterize how much information is available in the
conceptual model that documents the understanding of how the outcomes and drivers are related.
• Quantitative model: If a quantitative model is available, estimate how much information is available to explain the relationship of the outcomes and drivers, including some assessment of the applicability and quality of the model.
• Drivers identified: How much information is available about the drivers that are affecting this outcome? If there are no drivers, use –not applicable.
• Past monitoring data: How much historic data are available to evaluate the status and trend of this outcome indicator?
• Current / future monitoring data: Are there current or planned monitoring programs or studies that will collect data on the outcome indicator in the short-term future?
Linkages: (check if yes) EJ: Does this indicator have linkages to environmental justice concerns? WL: Does this indicator have linkages to working landscapes issues? WM: Does this indicator have linkages to watershed management such as local land use decisions and land management? Comments: Provide any brief additional comments to clarify. The main text of the appendix should be used for explanations of any length.

8/31/06 DWS Item 3
Page 12 of 21
Break-out table for indicator: _______________________________________________________________________________ Key for type of indicator: Key for information ranking OI- Outcome indicator --: Not applicable D/IOI – Driver / Intermediate outcome indicator 0 = no information available D/UF = Driver / Uncontrollable factor 1 = minimal information available D/MA = Driver / Potential management action 2 = some information available but major gaps
3 = lot of information available but minor gaps 4 = information is fairly complete
Indicator description Conceptual basis Monitoring data Linkages
ID Key phrase for indicator
Type of indicat
or
Conceptual
Model
Quant. model
Drivers identified
Past indicator
data
Current indicator
data
EJ WL WM Comments
WQ1 Water Quality at intakes
OI 2.5 2 2 2 3 Y Y Y Summarization of the 4 constituent areas
WQ1A Salinity/bromide at intakes
OI 4 4 4 4 4 Y Y Y EJ linkages with agriculture and water mgmt
WQ1B Organic carbon at intakes
OI 3 3 2.5 3 4 __ Y Y Work in progress on conceptual model
WQ1C Nutrients at intakes
OI 2 2 2 2 2 __ Y Y
WQ1D Pathogens at intakes
OI 2 0 2 1 1 __ Y Y Difficult & expensive to monitor at intakes and of limited value
WQ1.a Delta hydrodynamics
D/MA 3.5 3 4 3 3 Y Y Y Summarization of the sub-drivers for hydrodynamics
WQ1.a.1 Natural hydrology
D/UF 3 3 3 4 4 __ __ Y Need future projections for hydrology with climate change
WQ1.a.2 Water operations D/MA 4 4 4 4 4 Y Y Y WQ1.a.3 Location of
intakes D/MA 4 4 4 4 4 Y Y Y

8/31/06 DWS Item 3
Page 13 of 21
ID Key phrase for indicator
Type of indicat
or
Conceptual
Model
Quant. model
Drivers identified
Past indicator
data
Current indicator
data
EJ WL WM Comments
WQ1.a.4 Delta / Bay
bathymetry D/MA 3 2 4 2 2 __ __ __
WQ1.b Sources /fate of pollutants
D/MA 2 1 2 2 2 __ Y Y Summarization of the 4 constituent areas
WQ1.b.1 Salinity/bromide sources and fate
D/MA 3 3 3 3 3 __ Y Y
WQ1.b.2 Organic carbon sources and fate
D/MA 2 1 2 2 2 __ Y Y
WQ1.b.3 Nutrients sources and fate
D/MA 2 1 2 1 1 __ Y Y
WQ1.b.4 Pathogens sources and fate
D/MA 1 0 2 1 1 __ Y Y

8/31/06 DWS Item 3
Page 14 of 21
B.2 Outcome indicator questionnaire and breakout table Water quality for the tap
14. Short description or key phrase:
Water Quality for the drinking water tap (post-treatment, pre-distribution?). This will include data for 4 groups of regulated constituents (bromate/THMs/HAA5, salinity/bromide, disinfection level, taste and odor) and for treatment plants utilizing water from the 5 Delta intakes (State Water Project (DWR), Central Valley Project (USBR), Old River and Rock Slough (CCWD), North Bay aqueduct (DWR). The CALFED ROD does not include implementation of treatment plant upgrades, which is the responsibility of local utilities.
15. What goal(s) and objective(s) is the outcome indicator related to? What is the
rationale or supporting information for how this indicator relates to the goal and objective? (Please provide a reference in the CALFED documents for specific objectives). The program goal is to provide good water quality for all beneficial uses (CALFED Record of Decision). The strategic objective for drinking water quality is:
CALFED Agencies have adopted a general target of continuously improving Delta water quality for all uses, including in-Delta environmental and agricultural uses. Program actions designed to improve water quality to protect environmental uses are generally included in the Ecosystem Restoration Program (ERP) discussed above. For the drinking water quality program, CALFED Agencies have developed a specific goal based upon extensive stakeholder and agency involvement. CALFED Agencies’ target for providing safe, reliable, and affordable drinking water in a cost-effective way, is to achieve either: (a) average concentrations at Clifton Court Forebay and other southern and central Delta drinking water intakes of 50 µg/L bromide and 3.0 mg/L total organic carbon, or (b) an equivalent level of public health protection using a cost-effective combination of alternative source waters, source control and treatment technologies. (Page 65 CALFED Record of Decision) These numeric targets are the result of a California Urban Water Agencies-commissioned expert panel to assess the source water quality requirements to meet certain hypothetical/potential future regulatory standards, such as a 5 µg/L bromate standard and stricter disinfection requirements.
16. Documents any long-term performance objectives in the CALFED documents that related to this goal and indicator. Document any short-term performance goals or targets in the CALFED documents related to this goal and indicator. (provide references) How does this indicator relate to performance goals and targets in the documents?

8/31/06 DWS Item 3
Page 15 of 21
CALFED ROD only discusses long-term performance objectives, although it does require an end of Stage I evaluation on progress towards the objectives (CALFED ROD). The quantitative long term performance measures listed in the ROD are 50 µg/L Bromide and 3 mg/L Total Organic Carbon at the Delta intakes or an equivalent level of public health protection at the tap. The ROD calls for an evaluation of alternative treatment technologies as part of a final program assessment by the Delta Drinking Water Council or its successor. The Water Quality Program Plan (Appendix of the ROD) also includes a table of goals for the drinking water constituents.
17. If there is a lack of performance measures or targets in CALFED documents for
this indicator – draft a qualitative (non-numeric) long-term performance objective related to the goal and indicators. The long-term performance objective should describe what success would “look like” for this goal and indicator. Provide any supporting reasoning or rationale. If quantitative targets or performance goals are needed – note in the table.
Long-term targets are those presented in the expert panel report, which should be periodically reevaluated as technologies advance. A level of reevaluation will be included in the final assessment, by the end of 2007.
18. Document any conceptual or quantitative models that are related to this outcome indicator and describe what factors are or may be influencing the outcome. How complete are they for documenting linkages between the outcome and the controlling factors? Does the conceptual model have references from peer-reviewed literature? Has the conceptual model had independent review? If using a quantitative model, has it been validated and verified? Provide a discussion on the quality and completeness of the conceptual or quantitative model. Provide a graphic (with a reference) of the conceptual model to be included in the appendix.
The ELPH conceptual model was developed by the CALFED Drinking Water Subcommittee. In this conceptual model, water quality at the Delta intakes is an outcome of upstream processes and a driver that affects the water quality at the tap delivered by water utilities using Delta water (see water quality at the tap indicator for information on other drivers and the conceptual model). Because there are specific goals about water quality at the Delta intakes, and it is a major driver affecting delivered water quality, it is important enough to be addressed as an intermediate outcome indicator, even though it is a driver for another outcome indicator (water quality for the tap). There is a need to develop conceptual models that link water quality at the Delta intakes to treated water quality. Both the Central Valley Drinking Water Policy and the final assessment will be working on these.

8/31/06 DWS Item 3
Page 16 of 21
19. Provide a list of the major drivers in the conceptual model that are likely to influence the outcome. Note which ones are uncontrollable factors (by this program) and which are management actions (or potential management actions). For each one, list whether it also has a related conceptual and/or quantitative model related to it. Add to the list any drivers that are identified in the driver conceptual models.
The major drivers for water quality for the tap include:
• Raw water quality (including at intake and through conveyance and storage, both above ground and underground) blending, timing
• Treatment plant facilities/Operational efficiencies • Economic considerations (for choices involved in construction
and/or operations; may include choices made for purposes of economics (e.g., greater efficiencies to save costs), or limitations of choices because of economic constraints (e.g., can’t afford to make changes that would otherwise be desirable))
• Institutional capacity (amount of water, personnel capacity) • Federal and State Regulations (biggest driver—though these aren’t
controllable, they are generally predictable, since there is usually considerable lead time for implementation)
• Disruptions / emergency situations
20. Document any conceptual or quantitative models associated with the drivers. Similar to question 5. How complete are the conceptual or quantitative models for documenting linkages between the driver (intermediate outcome) and the controlling factors? Does the conceptual model have references from peer-reviewed literature? Has the conceptual model had independent review? If using a quantitative model, has it been validated and verified? Provide a discussion on the quality and completeness of the conceptual or quantitative model. Provide a graphic (with a reference) of the conceptual model to be included in the appendix. Provide a reference list of key documents or scientific papers that would be useful to managers and decision makers who would like more detailed information about the topic.
There are a number of numerical models describing treatment processes, which are probably too detailed for this purpose. The CUWA expert panel developed relationships between source water quality and treated water quality. The MWQI group at DWR is working on extending the DSM2 hydrodynamic model down the California Aqueduct (modeling daily water quality). Many local utilities have modeled their conveyance and storage systems. It is too early to describe the additional drivers (beyond those influencing source water quality) for these conceptual models, the may also be dependent on infrastructure and/or water sources.

8/31/06 DWS Item 3
Page 17 of 21
21. Do any data exist for the outcome indicator? a. To the extent possible, determine what data exist in past and current
monitoring programs that can be used to evaluate the outcome indicator? Who collects the data and where is it stored? Discuss spatial and temporal extent of data related to this outcome indicator. Discuss data availability.
b. To the extent possible, evaluate the quality of the data to use as an outcome indicator. What field methods are used for sampling, what methods for lab analysis (if applicable). In general, what is known about the Quality Assurance program and the quality of the data to be used?
The California Department of Health Services (CDHS) collects monitoring data
electronically related to regulatory compliance for drinking water standards; local drinking water utilities collect additional data to support their operations. Data not in the CDHS database that is present at drinking water systems may be in different formats, depending on the system.
22. Do any data exist for the driver indicators? (See list generated in number 6).
a. To the extent possible, determine what data exist in past and current monitoring programs that can be used to evaluate the major driver indicators? Who collects the data and where is it stored? Discuss spatial and temporal extent of data related to the driver indicators. Discuss data availability. Also see answer to 21
b. To the extent possible, evaluate the quality of the data for the major driver indicators. What field methods are used for sampling, what methods for lab analysis (if applicable)? In general, what is known about the Quality Assurance program and quality of the data to be used.
Review the list of drivers and outcome indicators. Are there linkages for environmental justice concerns, working landscapes, or watershed management (affected by local decisions)? Linkages are defined as affecting the indicator or being affected by the indicator. Discuss the linkages for each of those topics. Water systems operate at different levels of sophistication and complexity, depending on the economic situation, which reflects the community they serve. Hence, communities having lower socioeconomic status may have water systems that are smaller and simpler, and that have fewer options for operations improvement, given economic constraints.
23. What are the significant data and information gaps? The purpose of this is to help prioritize the monitoring and research needs for gathering and synthesizing the information. Provide a list of significant gaps related to the conceptual or quantitative models or the data and data analysis needed related to the outcome and driver indicators. Rank each item on this list as one of the following:
A: information needed for reporting on outcomes (monitoring data) B: information needed for better understanding of the linkages between
drivers and outcomes and improvements in the conceptual model. (research)
8/31/06 DWS Item 3
Page 18 of 21
C. information needed for reporting on drivers (monitoring data)
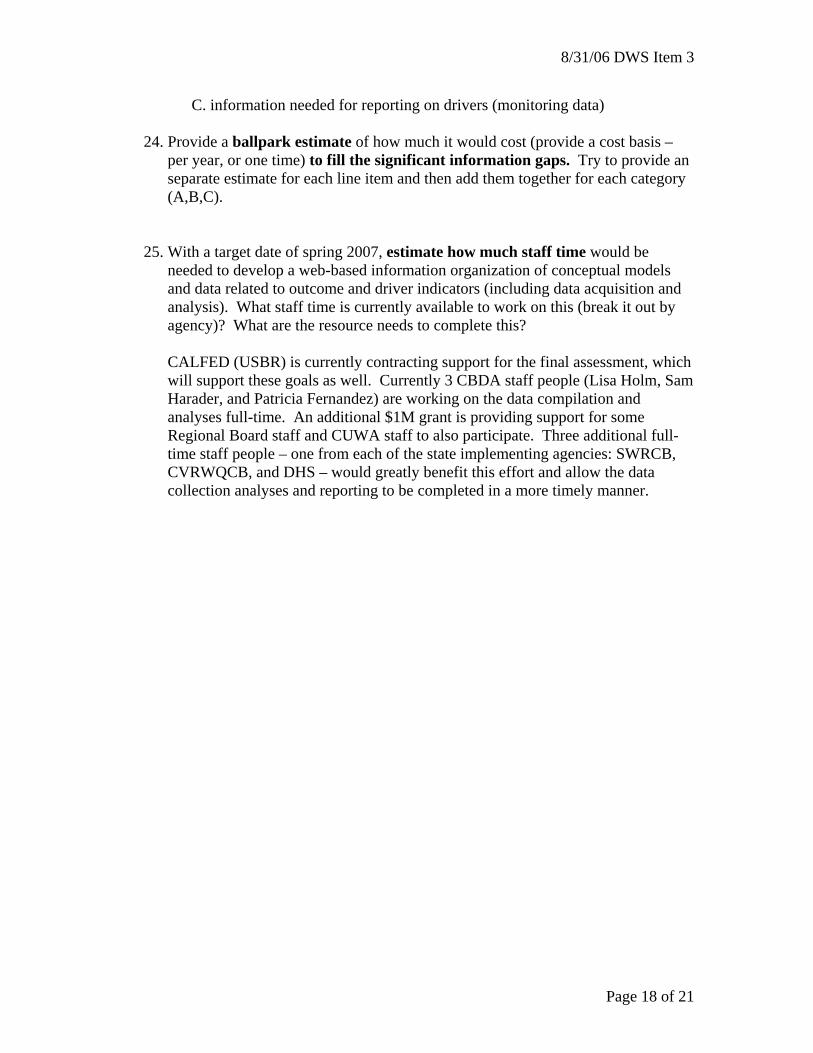
24. Provide a ballpark estimate of how much it would cost (provide a cost basis – per year, or one time) to fill the significant information gaps. Try to provide an separate estimate for each line item and then add them together for each category (A,B,C).
25. With a target date of spring 2007, estimate how much staff time would be needed to develop a web-based information organization of conceptual models and data related to outcome and driver indicators (including data acquisition and analysis). What staff time is currently available to work on this (break it out by agency)? What are the resource needs to complete this? CALFED (USBR) is currently contracting support for the final assessment, which will support these goals as well. Currently 3 CBDA staff people (Lisa Holm, Sam Harader, and Patricia Fernandez) are working on the data compilation and analyses full-time. An additional $1M grant is providing support for some Regional Board staff and CUWA staff to also participate. Three additional full-time staff people – one from each of the state implementing agencies: SWRCB, CVRWQCB, and DHS – would greatly benefit this effort and allow the data collection analyses and reporting to be completed in a more timely manner.

8/31/06 DWS Item 3
Page 19 of 21
Table Key: ID: Used to organize and link to table in main report Key phrase: Short phrase or word to describe outcome indicator (e.g. Water quality at the tap) Type of indicator: Use key below to select outcome, intermediate outcome or driver type Key for type of indicator: OI- Outcome indicator D/IOI – Driver / Intermediate outcome indicator D/UF = Driver / Uncontrollable factor D/MA = Driver / Potential management action For the next 5: provide a ranking of how much information is currently available related to the indicator: Key for information ranking
--: Not applicable 0 = no information available 1 = minimal information available 2 = some information available but major gaps 3 = lot of information available but minor gaps
4 = information is fairly complete • Conceptual model: Characterize how much information is available in the
conceptual model that documents the understanding of how the outcomes and drivers are related.
• Quantitative model: If a quantitative model is available, estimate how much information is available to explain the relationship of the outcomes and drivers, including some assessment of the applicability and quality of the model.
• Drivers identified: How much information is available about the drivers that are affecting this outcome? If there are no drivers, use –not applicable.
• Past monitoring data: How much historic data are available to evaluate the status and trend of this outcome indicator?
• Current / future monitoring data: Are there current or planned monitoring programs or studies that will collect data on the outcome indicator in the short-term future?
Linkages: (check if yes) EJ: Does this indicator have linkages to environmental justice concerns? WL: Does this indicator have linkages to working landscapes issues? WM: Does this indicator have linkages to watershed management such as local land use decisions and land management? Comments: Provide any brief additional comments to clarify. The main text of the appendix should be used for explanations of any length.

8/31/06 DWS Item 3
20
Break-out table for indicator: Water Quality for the tap
Key for type of indicator: Key for information ranking OI- Outcome indicator --: Not applicable D/IOI – Driver / Intermediate outcome indicator 0 = no information available D/UF = Driver / Uncontrollable factor 1 = minimal information available D/MA = Driver / Potential management action 2 = some information available but major gaps
3 = lot of information available but minor gaps 4 = information is fairly complete
Indicator description Conceptual basis Monitoring data Linkages
ID Key phrase for indicator Type of indicat
or
Conceptual
Model
Quant. model
Drivers identifi
ed
Past indicator
data
Current indicator
data
EJ WL WM Comments
WQ2 Water quality for the tap
OI 2 2 2 3.5 3.5 Y __ Y Summarization of water quality for 4 constituent areas
WQ2.A Disinfection byproducts
OI 2 2 2 4 4 Y __ Y Lot of information in some areas, no info for some treatment areas
WQ2.B Salinity OI 2 2 2 4 4 Y __ Y WQ2.C Taste and odor OI 2 2 2 2 2 Y __ Y WQ2.D Level / type of
disinfection OI 2 2 3 4 4 Y __ Y
WQ2.a Raw water quality D/MA 2.5 2.5 3 3 3.5 Y Y Y Summarization of water quality at intakes, other sources, storage and conveyance
WQ2.a.1 Water Quality at intakes (see other indicator)
D/MA 2.5 2 2 2 3 Y Y Y Summarization of the 4 constituent areas
WQ2.a.2 Water quality through conveyance, storage
D/MA 2 2 3 3 3 Y Y Y

8/31/06 DWS Item 3
21
WQ2.a.3 Quality of Other water sources
D/MA 3 3 3 4 4 Y Y Y Data exists, but we don’t have it
WQ2.b Treatment plant characteristics
4 4 4 4 4 Y
WQ2.b.1 Treatment plant technology
D/MA 4 4 4 4 4 Y __ __ Relates to current utilized technologies
WQ2.b.2 Treatment plant operations
D/MA 4 4 4 4 4 Y __ __ Relates to current operated treatment plants
WQ2.c Socioeconomic considerations
2 2 2 2 2
WQ2.c.1 Economics D/MA 2 2 2 2 2 Y __ __ Rating relates to program’s knowledge of local utility decision making processes
WQ2.c.2 Institutional capacity of the water system
D/MA 3 3 3 3 3 Y __ __
WQ2.d regulations D/UF 4 4 4 4 4 __ __ __