PHARMSTANDARD –LEADING RUSSIAN PHARMACEUTICAL COMPANY · 5 H1 2014 Sales Structure (excl....
16
PHARMSTANDARD – LEADING RUSSIAN PHARMACEUTICAL COMPANY Q2/H1 2014 Sales Results Presentation Igor Krylov 1 Conference call: Q2/H1 2014 Sales Results (14.08.14)
Transcript of PHARMSTANDARD –LEADING RUSSIAN PHARMACEUTICAL COMPANY · 5 H1 2014 Sales Structure (excl....
PHARMSTANDARD – LEADING RUSSIAN PHARMACEUTICAL COMPANY
Q2/H1 2014 Sales Results Presentation
Igor Krylov
1Conference call: Q2/H1 2014 Sales Results (14.08.14)

2
Source: IMS Health
Russian Pharma Market Update
Market Structure, H1 2014, RURbn
Russian Pharma market Dynamics
Conference call: Q2/H1 2014 Sales Results (14.08.14)
In H1 2014, the Russian pharmaceutical market showed an 8% y-o-y growth in value terms and 0,2% growth in packs
74%
14%
12% Commercial
Hospital
FRP
257 262 266 265 261 262
260
287
328372
408
441
0
50
100
150
200
250
300
350
400
450
500
H1 2009 H1 2010 H1 2011 H1 2012 H1 2013 H1 2014
0
50
100
150
200
250
300
Rtl.R
UR, bln
Units, m
ln
Units Rtl.RUR
3
Source: Company data
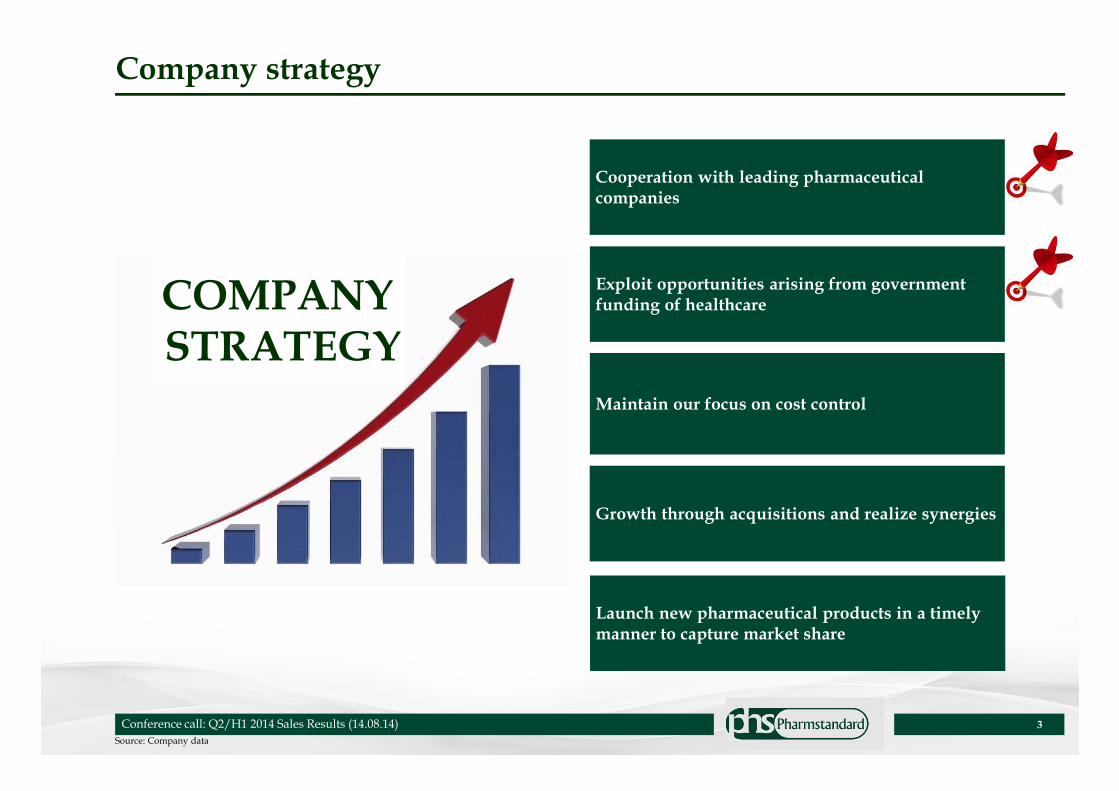
Company strategy
Conference call: Q2/H1 2014 Sales Results (14.08.14)
Exploit opportunities arising from government funding of healthcare
Maintain our focus on cost control
Growth through acquisitions and realize synergies
Launch new pharmaceutical products in a timely manner to capture market share
Cooperation with leading pharmaceutical companies
COMPANYSTRATEGY
H1 2014 SALES H1 2014 (RURm)
H1 2013 (RURm)
Change (%)
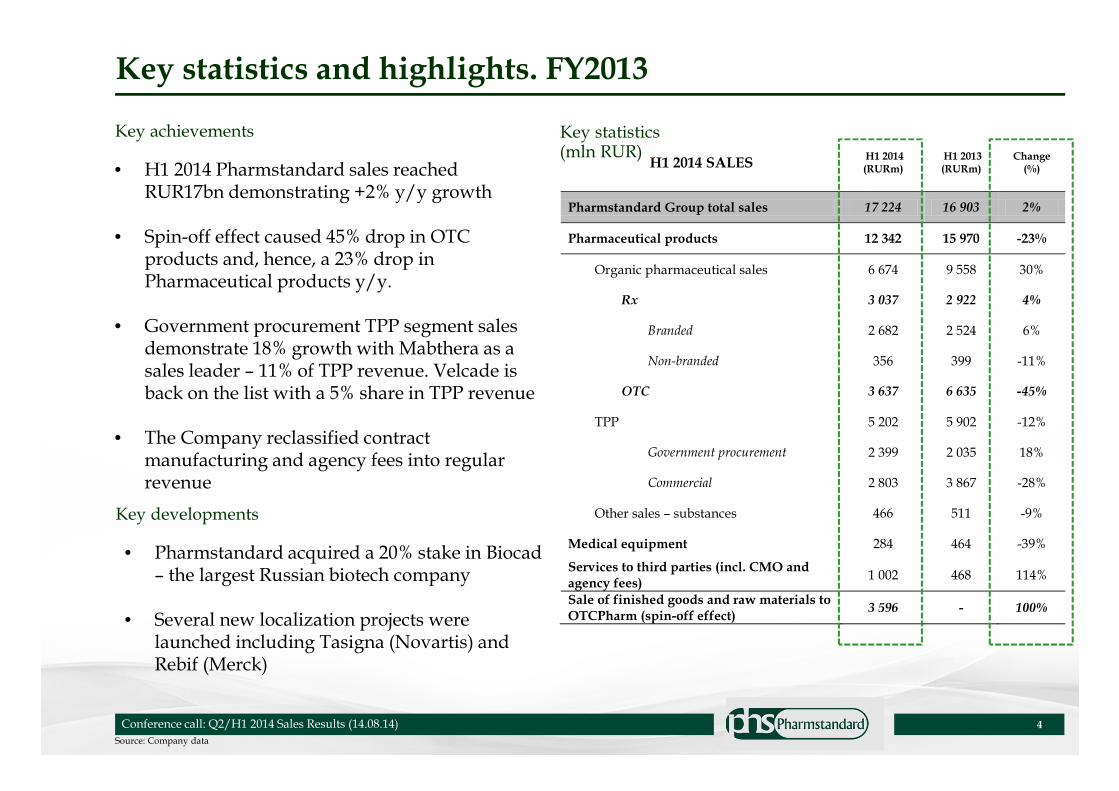
Pharmstandard Group total sales 17 224 16 903 2%
Pharmaceutical products 12 342 15 970 -23%
Organic pharmaceutical sales 6 674 9 558 30%
Rx 3 037 2 922 4%
Branded 2 682 2 524 6%
Non-branded 356 399 -11%
OTC 3 637 6 635 -45%
TPP 5 202 5 902 -12%
Government procurement 2 399 2 035 18%
Commercial 2 803 3 867 -28%
Other sales – substances 466 511 -9%
Medical equipment 284 464 -39%
Services to third parties (incl. CMO and agency fees)
1 002 468 114%
Sale of finished goods and raw materials to OTCPharm (spin-off effect)
3 596 - 100%
4
Source: Company data
Key statistics and highlights. FY2013
Key statistics(mln RUR)
Key achievements
• H1 2014 Pharmstandard sales reached RUR17bn demonstrating +2% y/y growth
• Spin-off effect caused 45% drop in OTC products and, hence, a 23% drop in Pharmaceutical products y/y.
• Government procurement TPP segment sales demonstrate 18% growth with Mabthera as a sales leader – 11% of TPP revenue. Velcade is back on the list with a 5% share in TPP revenue
• The Company reclassified contract manufacturing and agency fees into regular revenue
Conference call: Q2/H1 2014 Sales Results (14.08.14)
Key developments
• Pharmstandard acquired a 20% stake in Biocad– the largest Russian biotech company
• Several new localization projects were launched including Tasigna (Novartis) and Rebif (Merck)
5
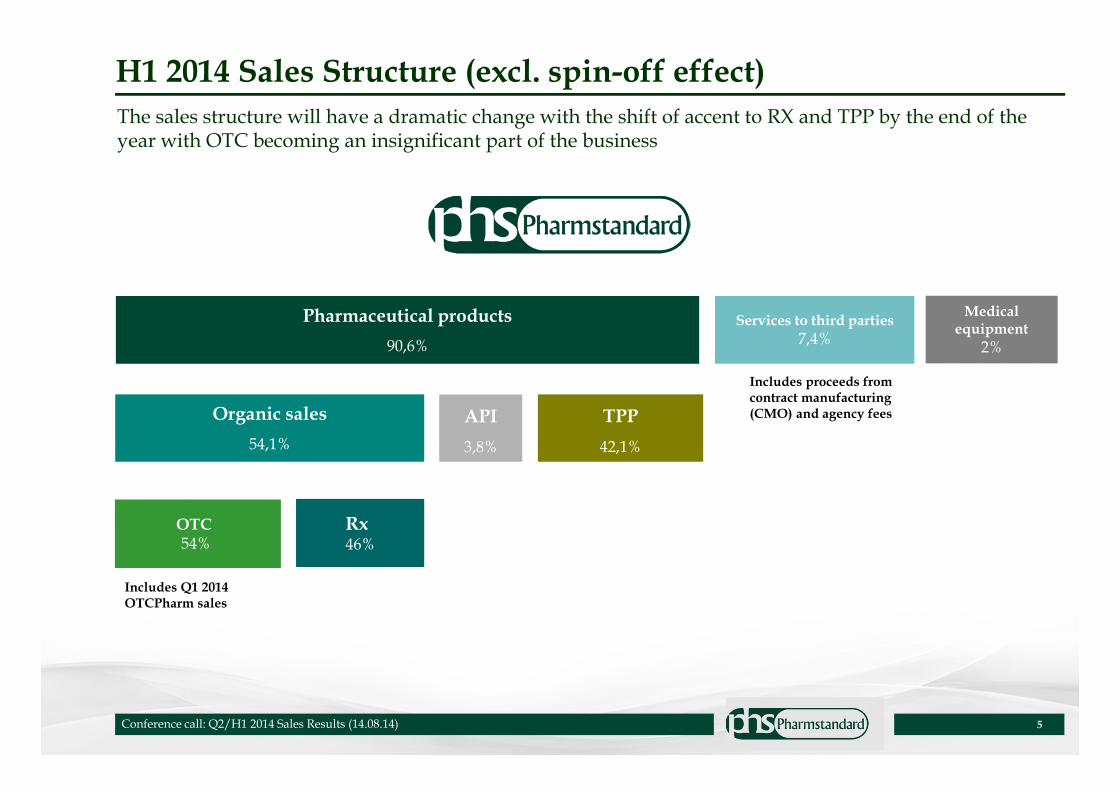
H1 2014 Sales Structure (excl. spin-off effect)
Pharmaceutical products
90,6%
OTC 54%
TPP
42,1%
Rx46%
Medical equipment
2%
Organic sales
54,1%
API
3,8%
Conference call: Q2/H1 2014 Sales Results (14.08.14)
Services to third parties
7,4%
Includes proceeds fromcontract manufacturing(CMO) and agency fees
Includes Q1 2014OTCPharm sales
The sales structure will have a dramatic change with the shift of accent to RX and TPP by the end of the year with OTC becoming an insignificant part of the business

6
Source: Company data
Top Pharmaceutical Product Drivers*, H1 2014
Conference call: Q2/H1 2014 Sales Results (14.08.14)
Brand FY2014 sales H1 2013 sales Sales growth
% growth
Phosphogliv 731 190 525 197 205 993 39,2%
Combilien 326 270 284 704 41 566 14,6%
Octolipen 166 887 134 073 32 814 24,5%
Doxorubicin 29 512 - 29 512 100%
Validol 114 575 89 155 25 420 28,5%
Artrozan 108 185 83 440 24 744 29,7%
Formetine 127 452 106 495 20 956 19,7%
Ferrohematogen 96 016 76 330 19 686 25,8%
Altevir 90 685 71 890 18 794 26,1%
Bloctran 55 025 37 535 17 491 46,6%
*exluding spin-off effect
7
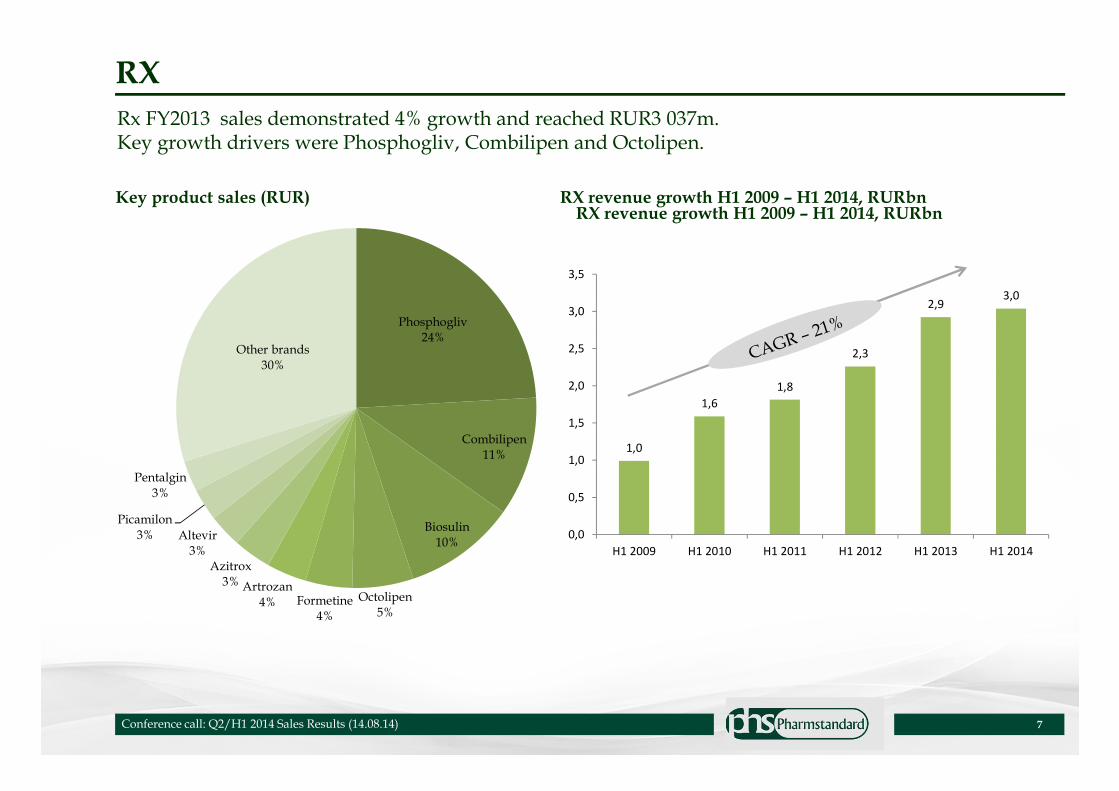
RX
Rx FY2013 sales demonstrated 4% growth and reached RUR3 037m.Key growth drivers were Phosphogliv, Combilipen and Octolipen.
Key product sales (RUR)
Conference call: Q2/H1 2014 Sales Results (14.08.14)
Phosphogliv24%
Combilipen11%
Biosulin10%
Octolipen5%
Formetine4%
Artrozan
4%
Azitrox3%
Altevir3%
Picamilon
3%
Pentalgin
3%
Other brands
30%
1,0
1,6
1,8
2,3
2,93,0
0,0
0,5
1,0
1,5
2,0
2,5
3,0
3,5
H1 2009 H1 2010 H1 2011 H1 2012 H1 2013 H1 2014
RX revenue growth H1 2009 – H1 2014, RURbnRX revenue growth H1 2009 – H1 2014, RURbn
IRS-19, Imudon Reduxin Mildronat Taufon Emoxipine Tamiflu Singleprocurement
contacts
Other Total
Aktemra Velcade Diaskintest Intelence Infibeta Coagil Mabthera Presista Pulmozyme Revlimid Total
8
Source: Company data
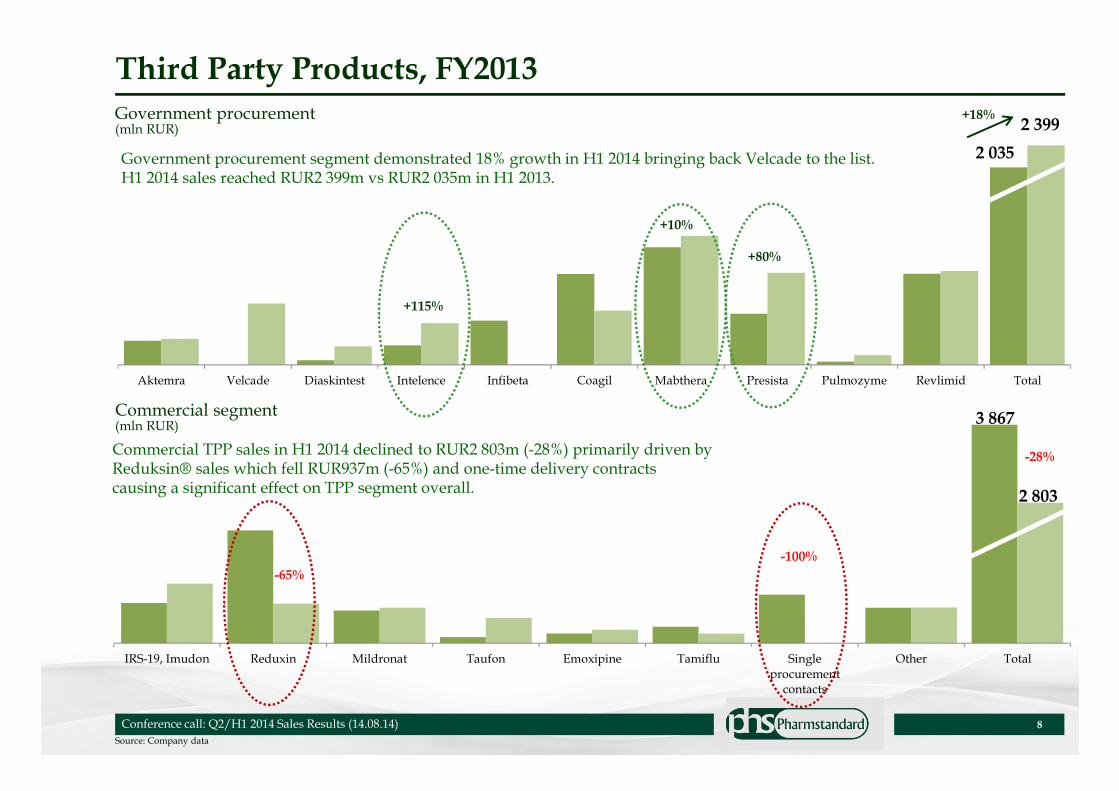
Third Party Products, FY2013
Government procurement(mln RUR)
Commercial segment (mln RUR)
Commercial TPP sales in H1 2014 declined to RUR2 803m (-28%) primarily driven byReduksin® sales which fell RUR937m (-65%) and one-time delivery contractscausing a significant effect on TPP segment overall.
Government procurement segment demonstrated 18% growth in H1 2014 bringing back Velcade to the list.H1 2014 sales reached RUR2 399m vs RUR2 035m in H1 2013.
2 035
Conference call: Q2/H1 2014 Sales Results (14.08.14)
2 399+18%
3 867
2 803
-100%
-65%
-28%
+115%
+80%
+10%
9
Source: IMS Health
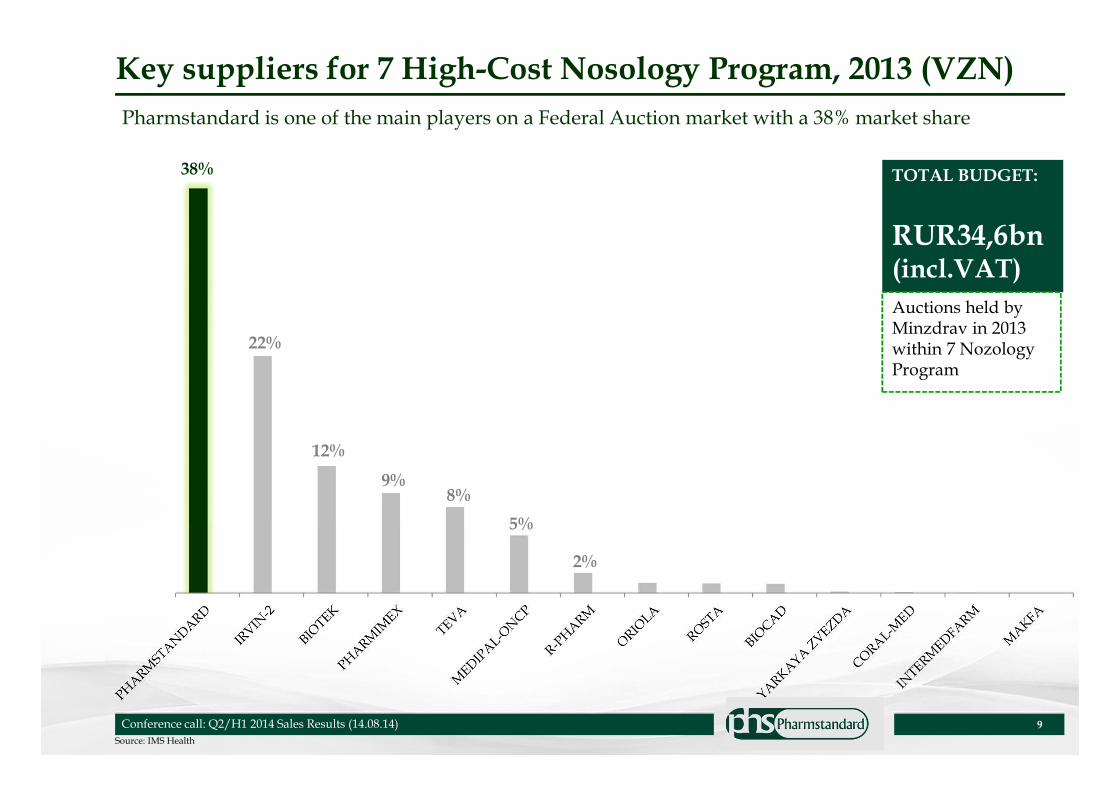
Key suppliers for 7 High-Cost Nosology Program, 2013 (VZN)
Conference call: Q2/H1 2014 Sales Results (14.08.14)
TOTAL BUDGET:
RUR34,6bn(incl.VAT)
Pharmstandard is one of the main players on a Federal Auction market with a 38% market share
Auctions held by Minzdrav in 2013 within 7 NozologyProgram
38%
22%
12%
9%8%
5%
2%
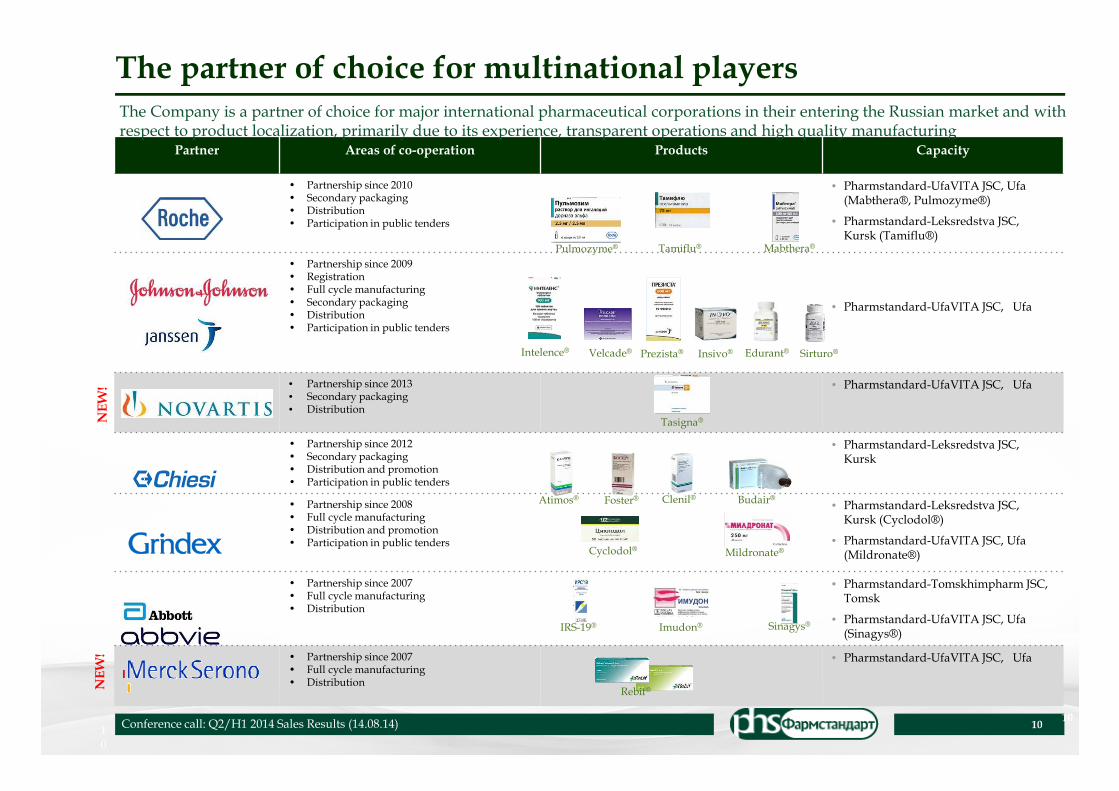
The partner of choice for multinational players
IRS-19® Imudon®
Conference call: Q2/H1 2014 Sales Results (14.08.14)10
10
Partner Areas of co-operation Products Capacity
• Partnership since 2010• Secondary packaging• Distribution• Participation in public tenders
• Pharmstandard-UfaVITA JSC, Ufa(Mabthera®, Pulmozyme®)
• Pharmstandard-Leksredstva JSC,Kursk (Tamiflu®)
• Partnership since 2009• Registration• Full cycle manufacturing• Secondary packaging• Distribution• Participation in public tenders
• Pharmstandard-UfaVITA JSC, Ufa
• Partnership since 2013• Secondary packaging• Distribution
• Pharmstandard-UfaVITA JSC, Ufa
• Partnership since 2012• Secondary packaging• Distribution and promotion• Participation in public tenders
• Pharmstandard-Leksredstva JSC,Kursk
• Partnership since 2008• Full cycle manufacturing• Distribution and promotion• Participation in public tenders
• Pharmstandard-Leksredstva JSC, Kursk (Cyclodol®)
• Pharmstandard-UfaVITA JSC, Ufa (Mildronate®)
• Partnership since 2007• Full cycle manufacturing• Distribution
• Pharmstandard-Tomskhimpharm JSC, Tomsk
• Pharmstandard-UfaVITA JSC, Ufa (Sinagys®)
• Partnership since 2007• Full cycle manufacturing• Distribution
• Pharmstandard-UfaVITA JSC, Ufa
Intelence® Velcade® Prezista® Insivo® Edurant® Sirturo®
Pulmozyme® Tamiflu® Mabthera®
Cyclodol® Mildronate®
IRS-19® Imudon® Sinagys®
Tasigna®
Atimos® Foster® Clenil® Budair®
The Company is a partner of choice for major international pharmaceutical corporations in their entering the Russian market and with respect to product localization, primarily due to its experience, transparent operations and high quality manufacturing
Rebif®
10
NEW
!N
EW
!
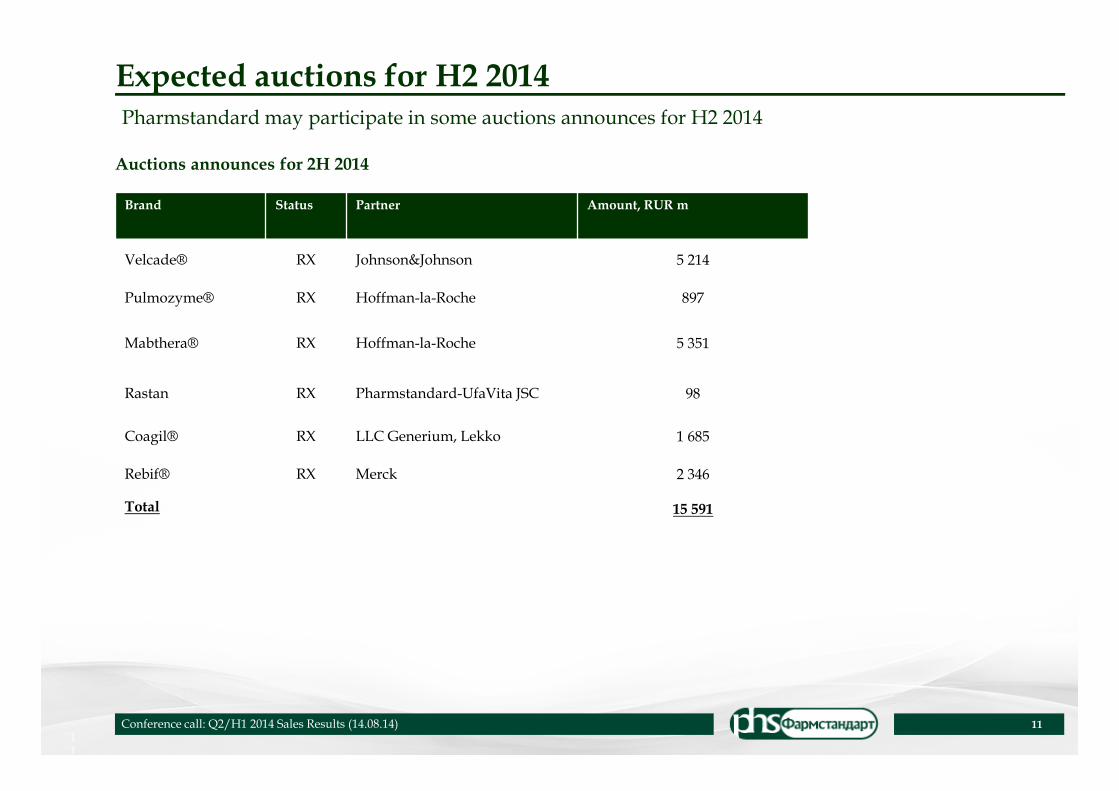
Expected auctions for H2 2014
1111
Brand Status Partner Amount, RUR m
Velcade® RX Johnson&Johnson 5 214
Pulmozyme® RX Hoffman-la-Roche 897
Mabthera® RX Hoffman-la-Roche 5 351
Rastan RX Pharmstandard-UfaVita JSC 98
Coagil® RX LLC Generium, Lekko 1 685
Rebif® RX Merck 2 346
Total 15 591
Pharmstandard may participate in some auctions announces for H2 2014
Auctions announces for 2H 2014
Conference call: Q2/H1 2014 Sales Results (14.08.14)

Appendix I. Top Brands.
INNOVATIONS. AFFORDABILITY. QUALITY
Conference call: Q2/H1 2014 Sales Results (14.08.14)

13
Source: Company data
H1 2014 / Q2 2014 Best Selling Brands
Conference call: Q2/H1 2014 Sales Results (14.08.14)
BRANDVolume (mln
packs)Sales (mln RUR)
% of total
sales
Volume (mln
packs)Sales (mln RUR)
% of total
salesChange % Change %
Phosphogliv 1,705 731,2 11,0% 1,220 525,2 5,5% 0,485 39,8% 206,0 39,2%
Pentalgin 8,863 497,3 7,5% 17,926 1 036,4 10,8% -9,063 -50,6% 539,1- -52,0%
Arbidol 3,580 433,9 6,5% 9,524 1 136,0 11,9% -5,944 -62,4% 702,2- -61,8%
Complivit 16,274 338,9 5,1% 35,930 727,7 7,6% -19,656 -54,7% 388,7- -53,4%
Combilipen 2,916 326,3 4,9% 2,610 284,7 3,0% 0,306 11,7% 41,6 14,6%
Biosulin 0,452 305,2 4,6% 0,463 306,2 3,2% -0,010 -2,2% 1,0- -0,3%
Amixin 0,604 270,3 4,1% 1,031 473,8 5,0% -0,427 -41,4% 203,5- -42,9%
Aphobazolum 1,104 203,2 3,0% 2,586 469,1 4,9% -1,483 -57,3% 265,9- -56,7%
Ingalypt 2,802 181,2 2,7% 2,561 166,7 1,7% 0,241 9,4% 14,5 8,7%
Octolipen 0,711 166,9 2,5% 0,604 134,1 1,4% 0,107 17,7% 32,8 24,5%
TOP 10 total 39,011 3 454,3 52% 74,455 5 259,9 55% -35,444 -48% 1 806- -34%
Other brands 205,001 3 219,7 48% 205,520 4 297,8 45% -0,519 0% 1 078- -25%
TOTAL SALES 244,012 6 674,1 100% 279,975 9 557,6 100% -35,963 -13% 2 884- -30%
2014 2013 Volume 14/13 Sales 14/13
BRANDVolume (mln
packs)
Sales (mln
RUR)
% of total
sales
Volume (mln
packs)Sales (mln RUR)
% of total
salesChange % Change %
Phosphogliv 0,780 337,4 16,3% 0,724 308,5 7,7% 0,056 7,7% 28,9 9,4%
Combilipen 1,759 193,1 9,3% 1,352 145,5 3,6% 0,407 30,1% 47,6 32,7%
Biosulin 0,232 156,8 7,6% 0,218 139,7 3,5% 0,013 6,2% 17,1 12,3%
Ingalypt 1,707 107,9 5,2% 0,946 63,0 1,6% 0,761 80,4% 45,0 71,4%
Octolipen 0,350 81,3 3,9% 0,333 76,3 1,9% 0,018 5,3% 5,0 6,6%
Artrozan 0,412 70,2 3,4% 0,300 47,0 1,2% 0,112 37,4% 23,3 49,6%
Corvalol 10,394 67,6 3,3% 11,179 78,5 2,0% -0,785 -7,0% 10,9- -13,9%
Formetin 0,508 52,4 2,5% 0,510 53,5 1,3% -0,003 -0,6% 1,1- -2,1%
Altevir 0,066 50,0 2,4% 0,040 28,4 0,7% 0,026 64,3% 21,6 76,2%
Picamilon 1,145 48,9 2,4% 1,093 47,4 1,2% 0,052 4,7% 1,4 3,1%
TOP 10 total 17,351 1 165,6 56% 16,695 987,7 25% 0,656 4% 178 18%
Other brands 76,041 905,3 44% 110,816 3 031,0 75% -34,775 -31% 2 126- -70%
TOTAL SALES 93,392 2 070,9 100% 127,511 4 018,7 100% -34,119 -27% 1 948- -48%
2q 2014 2q 2013 Volume 14/13 Sales 14/13
H1 2014
Q2 2014
14
Source: Company data
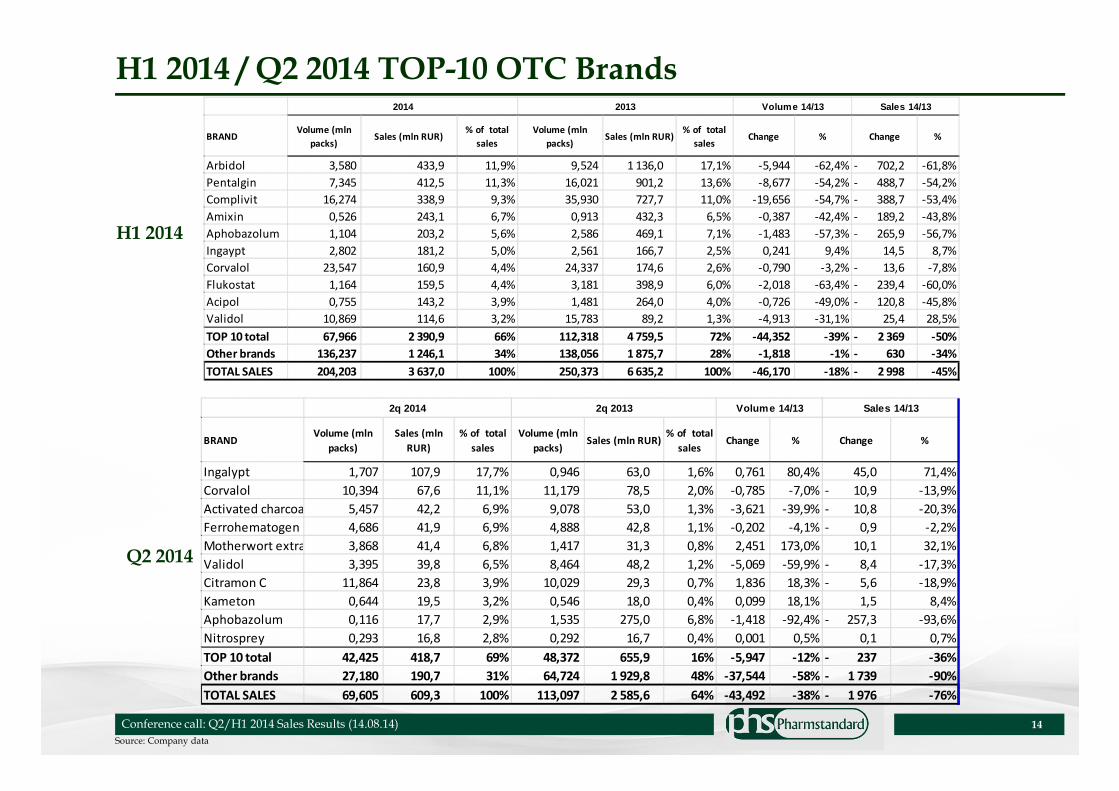
H1 2014 / Q2 2014 TOP-10 OTC Brands
Conference call: Q2/H1 2014 Sales Results (14.08.14)
BRANDVolume (mln
packs)Sales (mln RUR)
% of total
sales
Volume (mln
packs)Sales (mln RUR)
% of total
salesChange % Change %
Arbidol 3,580 433,9 11,9% 9,524 1 136,0 17,1% -5,944 -62,4% 702,2- -61,8%
Pentalgin 7,345 412,5 11,3% 16,021 901,2 13,6% -8,677 -54,2% 488,7- -54,2%
Complivit 16,274 338,9 9,3% 35,930 727,7 11,0% -19,656 -54,7% 388,7- -53,4%
Amixin 0,526 243,1 6,7% 0,913 432,3 6,5% -0,387 -42,4% 189,2- -43,8%
Aphobazolum 1,104 203,2 5,6% 2,586 469,1 7,1% -1,483 -57,3% 265,9- -56,7%
Ingaypt 2,802 181,2 5,0% 2,561 166,7 2,5% 0,241 9,4% 14,5 8,7%
Corvalol 23,547 160,9 4,4% 24,337 174,6 2,6% -0,790 -3,2% 13,6- -7,8%
Flukostat 1,164 159,5 4,4% 3,181 398,9 6,0% -2,018 -63,4% 239,4- -60,0%
Acipol 0,755 143,2 3,9% 1,481 264,0 4,0% -0,726 -49,0% 120,8- -45,8%
Validol 10,869 114,6 3,2% 15,783 89,2 1,3% -4,913 -31,1% 25,4 28,5%
TOP 10 total 67,966 2 390,9 66% 112,318 4 759,5 72% -44,352 -39% 2 369- -50%
Other brands 136,237 1 246,1 34% 138,056 1 875,7 28% -1,818 -1% 630- -34%
TOTAL SALES 204,203 3 637,0 100% 250,373 6 635,2 100% -46,170 -18% 2 998- -45%
2014 2013 Volume 14/13 Sales 14/13
BRANDVolume (mln
packs)
Sales (mln
RUR)
% of total
sales
Volume (mln
packs)Sales (mln RUR)
% of total
salesChange % Change %
Ingalypt 1,707 107,9 17,7% 0,946 63,0 1,6% 0,761 80,4% 45,0 71,4%
Corvalol 10,394 67,6 11,1% 11,179 78,5 2,0% -0,785 -7,0% 10,9- -13,9%
Activated charcoal 5,457 42,2 6,9% 9,078 53,0 1,3% -3,621 -39,9% 10,8- -20,3%
Ferrohematogen 4,686 41,9 6,9% 4,888 42,8 1,1% -0,202 -4,1% 0,9- -2,2%
Motherwort extract 3,868 41,4 6,8% 1,417 31,3 0,8% 2,451 173,0% 10,1 32,1%
Validol 3,395 39,8 6,5% 8,464 48,2 1,2% -5,069 -59,9% 8,4- -17,3%
Citramon C 11,864 23,8 3,9% 10,029 29,3 0,7% 1,836 18,3% 5,6- -18,9%
Kameton 0,644 19,5 3,2% 0,546 18,0 0,4% 0,099 18,1% 1,5 8,4%
Aphobazolum 0,116 17,7 2,9% 1,535 275,0 6,8% -1,418 -92,4% 257,3- -93,6%
Nitrosprey 0,293 16,8 2,8% 0,292 16,7 0,4% 0,001 0,5% 0,1 0,7%
TOP 10 total 42,425 418,7 69% 48,372 655,9 16% -5,947 -12% 237- -36%
Other brands 27,180 190,7 31% 64,724 1 929,8 48% -37,544 -58% 1 739- -90%
TOTAL SALES 69,605 609,3 100% 113,097 2 585,6 64% -43,492 -38% 1 976- -76%
2q 2014 2q 2013 Volume 14/13 Sales 14/13
H1 2014
Q2 2014
15
Source: Company data
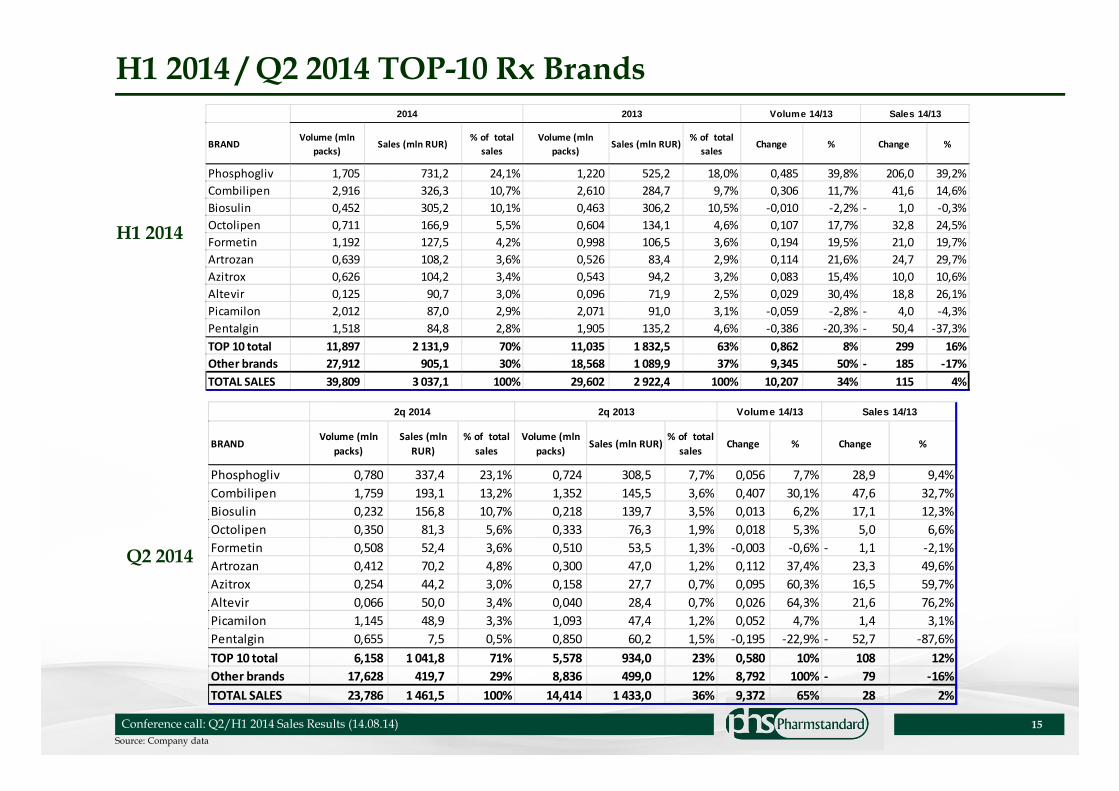
H1 2014 / Q2 2014 TOP-10 Rx Brands
Conference call: Q2/H1 2014 Sales Results (14.08.14)
BRANDVolume (mln
packs)Sales (mln RUR)
% of total
sales
Volume (mln
packs)Sales (mln RUR)
% of total
salesChange % Change %
Phosphogliv 1,705 731,2 24,1% 1,220 525,2 18,0% 0,485 39,8% 206,0 39,2%
Combilipen 2,916 326,3 10,7% 2,610 284,7 9,7% 0,306 11,7% 41,6 14,6%
Biosulin 0,452 305,2 10,1% 0,463 306,2 10,5% -0,010 -2,2% 1,0- -0,3%
Octolipen 0,711 166,9 5,5% 0,604 134,1 4,6% 0,107 17,7% 32,8 24,5%
Formetin 1,192 127,5 4,2% 0,998 106,5 3,6% 0,194 19,5% 21,0 19,7%
Artrozan 0,639 108,2 3,6% 0,526 83,4 2,9% 0,114 21,6% 24,7 29,7%
Azitrox 0,626 104,2 3,4% 0,543 94,2 3,2% 0,083 15,4% 10,0 10,6%
Altevir 0,125 90,7 3,0% 0,096 71,9 2,5% 0,029 30,4% 18,8 26,1%
Picamilon 2,012 87,0 2,9% 2,071 91,0 3,1% -0,059 -2,8% 4,0- -4,3%
Pentalgin 1,518 84,8 2,8% 1,905 135,2 4,6% -0,386 -20,3% 50,4- -37,3%
TOP 10 total 11,897 2 131,9 70% 11,035 1 832,5 63% 0,862 8% 299 16%
Other brands 27,912 905,1 30% 18,568 1 089,9 37% 9,345 50% 185- -17%
TOTAL SALES 39,809 3 037,1 100% 29,602 2 922,4 100% 10,207 34% 115 4%
2014 2013 Volume 14/13 Sales 14/13
BRANDVolume (mln
packs)
Sales (mln
RUR)
% of total
sales
Volume (mln
packs)Sales (mln RUR)
% of total
salesChange % Change %
Phosphogliv 0,780 337,4 23,1% 0,724 308,5 7,7% 0,056 7,7% 28,9 9,4%
Combilipen 1,759 193,1 13,2% 1,352 145,5 3,6% 0,407 30,1% 47,6 32,7%
Biosulin 0,232 156,8 10,7% 0,218 139,7 3,5% 0,013 6,2% 17,1 12,3%
Octolipen 0,350 81,3 5,6% 0,333 76,3 1,9% 0,018 5,3% 5,0 6,6%
Formetin 0,508 52,4 3,6% 0,510 53,5 1,3% -0,003 -0,6% 1,1- -2,1%
Artrozan 0,412 70,2 4,8% 0,300 47,0 1,2% 0,112 37,4% 23,3 49,6%
Azitrox 0,254 44,2 3,0% 0,158 27,7 0,7% 0,095 60,3% 16,5 59,7%
Altevir 0,066 50,0 3,4% 0,040 28,4 0,7% 0,026 64,3% 21,6 76,2%
Picamilon 1,145 48,9 3,3% 1,093 47,4 1,2% 0,052 4,7% 1,4 3,1%
Pentalgin 0,655 7,5 0,5% 0,850 60,2 1,5% -0,195 -22,9% 52,7- -87,6%
TOP 10 total 6,158 1 041,8 71% 5,578 934,0 23% 0,580 10% 108 12%
Other brands 17,628 419,7 29% 8,836 499,0 12% 8,792 100% 79- -16%
TOTAL SALES 23,786 1 461,5 100% 14,414 1 433,0 36% 9,372 65% 28 2%
2q 2014 2q 2013 Volume 14/13 Sales 14/13
H1 2014
Q2 2014
16
Disclaimer and Confidentiality RequirementsThis presentation does not constitute or form part of and should not be construed as, an offer to sell or issue or the solicitation of anoffer to buy or acquire securities of Pharmstandard JSC (the “Company”) or any of its affiliates in any jurisdiction or an inducementto enter into investment activity. No part of this presentation, nor the fact of its distribution, should form the basis of, or be relied onin connection with, any contract or commitment or investment decision whatsoever.
This presentation may contain 'forward-looking statements'. These statements may include the words "anticipate", "believe","intend", "estimate", "expect" and words of similar meaning. All statements other than statements of historical facts, possiblycontained in this presentation, including, without limitation, those regarding the Company’s financial position, business strategy,plans and objectives of management for future operations (including development plans and objectives relating to the Company'sprojects and services) are forward-looking statements. Such forward-looking statements involve known and unknown risks,uncertainties and other important factors that could cause the actual results, performance or achievements of the Company to bematerially different from results, performance or achievements expressed or implied by such forward-looking statements. Risks anduncertainties include, without limitation, general industry conditions and competition; economic conditions, such as interest rateand currency exchange rate fluctuations; technological advances and patents attained by competitors; challenges inherent in newproduct development, including obtaining regulatory approvals; domestic and foreign health care reforms and governmental lawsand regulations; and trends toward health care cost containment. Such forward-looking statements are based on numerousassumptions regarding the Company's present and future business strategies and the environment in which the Company willoperate in the future. These forward-looking statements speak only as at the date of this presentation.
The Company does not undertake to update any forward-looking statements as a result of new information or future events ordevelopments.
The Company will use reasonable efforts to include up-to-date and accurate information in this Internet site, but make norepresentations, warranties, or assurances as to the accuracy, currency, or completeness of the information provided. The Companyshall not be liable for any damages or injury resulting from your access to, or inability to access, this Internet site, or from yourreliance on any information provided at this Internet site.
The information and opinions contained in this document are provided as at the date of this presentation and are subject to changewithout notice.
All information, unless expressly specified herein, is from Company data.
Conference call: Q2/H1 2014 Sales Results (14.08.14)