PHAI Port Granby Newsletter, November 2012
12
Perturbations in Microtubule Mechanics from Tubulin Preparation TAVIARE L. HAWKINS, 1 MATTHEW MIRIGIAN, 2 JINGQIANG LI, 3 M. SELCUK YASAR, 1 DAN L. SACKETT, 2 DAVID SEPT, 4 and JENNIFER L. ROSS 1 1 Department of Physics, University of Massachusetts Amherst, 666 North Pleasant Street, 302 Hasbrouck Lab, Amherst, MA 01003, USA; 2 National Institutes of Health, Bethesda, MD 20892, USA; 3 Department of Physics, Zhejiang University, Hangzhou, Zhejiang Province, People’s Republic of China; and 4 Department of Biomedical Engineering and Center for Computational Medicine and Bioinformatics, University of Michigan, Ann Arbor, MI 48109, USA (Received 19 November 2011; accepted 7 April 2012) Associate Editor William O. Hancock oversaw the review of this article. Abstract—Microtubules are essential structures for cellular organization. They support neuronal processes and cilia, they are the scaffolds for the mitotic spindle, and they are the tracks for intracellular transport that actively organizes material and information within the cell. The mechanical properties of microtubules have been studied for almost 30 years, yet the results from different groups are startlingly disparate, ranging over an order of magnitude. Here we present results demonstrating the effects of purification, associated-protein content, age, and fluorescent labeling on the measured persistence length using the freely fluctuating filament method. We find that small percentages (<1%) of residual microtubule-associated proteins left over in the preparation can cause the persistence length to double, and that these proteins also affect the persistence length over time. Interestingly, we find that the fraction of labeled tubulin dimers does not affect the measured persistence length. Further, we have enhanced the analysis method established by previous groups. We have added a bootstrap- ping with resampling analysis to estimate the error in the variance data used to determine the persistence length. Thus, we are able to perform a weighted fit to the data to more accurately determine the persistence length. Keywords—Flexural rigidity, Bending stiffness, Cytoskeletal network. INTRODUCTION Microtubules are non-covalent polymer tubes made from tubulin protein hetero-dimers. 8 They are essential to a number of vital cellular processes including intracellular transport, mitosis, and cell morphology. Microtubules have a large impact on the interior organization of the cell, and this organization depends on their ability to be long, straight, rigid rods. Further, several recent engineering studies have begun to use microtubules as scaffolding for nano-scale endeav- ors. 3,14 Some have proposed to use them as drug- delivery shuttles with their open lumens loaded with the drug of choice. Microtubules can then be inserted into the cell, and the drugs can be slowly released over time. 32 Microtubules have been demonstrated to be molecular shuttles that can be propelled on a bed of motor proteins and directed with magnetic fields. 7,16,17,24 Thus, the rigidity of microtubule fila- ments is an important question for basic biology, biomedical engineering, and nanoscience disciplines. Microtubule rigidity has been studied for almost 30 years by a variety of biophysical methods (for a review, see Hawkins et al. 15 ). Previous measurements of microtubule persistence length show large variabil- ity and inconsistency in the literature. 15 Even studies of the same parameters and method performed by dif- ferent groups can have discrepancies of up to an order of magnitude (0.5–5 mm). 15 Further, measurements in the same study have a large deviation in the resulting persistence lengths (see for instance Brangwynne et al. 2 and Gittes 13 ), making it difficult to perform accurate statistics to compare between different experimental parameters. These discrepancies could arise from dif- ferences in tubulin source and preparation, tubulin isotype, post-translational modifications, purification and storage, labeling, and the presence and type of contaminating microtubule-associated proteins. To add to the confusion, two studies have reported that microtubules have a persistence length that depends on the contour length. 21,28 These experiments used similar experimental systems, but one found the effect only in the absence of the chemotherapeutic drug Taxol, 20,21 while the other had Taxol present. 28 This is Address correspondence to Jennifer L. Ross, Department of Physics, University of Massachusetts Amherst, 666 North Pleasant Street, 302 Hasbrouck Lab, Amherst, MA 01003, USA. Electronic mail: [email protected] Cellular and Molecular Bioengineering (Ó 2012) DOI: 10.1007/s12195-012-0229-8 Ó 2012 Biomedical Engineering Society
Transcript of PHAI Port Granby Newsletter, November 2012
Perturbations in Microtubule Mechanics from Tubulin Preparation
TAVIARE L. HAWKINS,1 MATTHEW MIRIGIAN,2 JINGQIANG LI,3 M. SELCUK YASAR,1 DAN L. SACKETT,2
DAVID SEPT,4 and JENNIFER L. ROSS1
1Department of Physics, University of Massachusetts Amherst, 666 North Pleasant Street, 302 Hasbrouck Lab, Amherst,MA 01003, USA; 2National Institutes of Health, Bethesda, MD 20892, USA; 3Department of Physics, Zhejiang University,Hangzhou, Zhejiang Province, People’s Republic of China; and 4Department of Biomedical Engineering and Center for
Computational Medicine and Bioinformatics, University of Michigan, Ann Arbor, MI 48109, USA
(Received 19 November 2011; accepted 7 April 2012)
Associate Editor William O. Hancock oversaw the review of this article.
Abstract—Microtubules are essential structures for cellularorganization. They support neuronal processes and cilia, theyare the scaffolds for the mitotic spindle, and they are thetracks for intracellular transport that actively organizesmaterial and information within the cell. The mechanicalproperties of microtubules have been studied for almost30 years, yet the results from different groups are startlinglydisparate, ranging over an order of magnitude. Here wepresent results demonstrating the effects of purification,associated-protein content, age, and fluorescent labeling onthe measured persistence length using the freely fluctuatingfilament method. We find that small percentages (<1%) ofresidual microtubule-associated proteins left over in thepreparation can cause the persistence length to double, andthat these proteins also affect the persistence length overtime. Interestingly, we find that the fraction of labeledtubulin dimers does not affect the measured persistencelength. Further, we have enhanced the analysis methodestablished by previous groups. We have added a bootstrap-ping with resampling analysis to estimate the error in thevariance data used to determine the persistence length. Thus,we are able to perform a weighted fit to the data to moreaccurately determine the persistence length.
Keywords—Flexural rigidity, Bending stiffness, Cytoskeletal
network.
INTRODUCTION
Microtubules are non-covalent polymer tubes madefrom tubulin protein hetero-dimers.8 They are essentialto a number of vital cellular processes includingintracellular transport, mitosis, and cell morphology.Microtubules have a large impact on the interior
organization of the cell, and this organization dependson their ability to be long, straight, rigid rods. Further,several recent engineering studies have begun to usemicrotubules as scaffolding for nano-scale endeav-ors.3,14 Some have proposed to use them as drug-delivery shuttles with their open lumens loaded withthe drug of choice. Microtubules can then be insertedinto the cell, and the drugs can be slowly released overtime.32 Microtubules have been demonstrated to bemolecular shuttles that can be propelled on a bed ofmotor proteins and directed with magneticfields.7,16,17,24 Thus, the rigidity of microtubule fila-ments is an important question for basic biology,biomedical engineering, and nanoscience disciplines.
Microtubule rigidity has been studied for almost30 years by a variety of biophysical methods (for areview, see Hawkins et al.15). Previous measurementsof microtubule persistence length show large variabil-ity and inconsistency in the literature.15 Even studies ofthe same parameters and method performed by dif-ferent groups can have discrepancies of up to an orderof magnitude (0.5–5 mm).15 Further, measurements inthe same study have a large deviation in the resultingpersistence lengths (see for instance Brangwynne et al.2
and Gittes13), making it difficult to perform accuratestatistics to compare between different experimentalparameters. These discrepancies could arise from dif-ferences in tubulin source and preparation, tubulinisotype, post-translational modifications, purificationand storage, labeling, and the presence and type ofcontaminating microtubule-associated proteins.
To add to the confusion, two studies have reportedthat microtubules have a persistence length thatdepends on the contour length.21,28 These experimentsused similar experimental systems, but one found theeffect only in the absence of the chemotherapeutic drugTaxol,20,21 while the other had Taxol present.28 This is
Address correspondence to Jennifer L. Ross, Department of
Physics, University of Massachusetts Amherst, 666 North Pleasant
Street, 302 Hasbrouck Lab, Amherst, MA 01003, USA. Electronic
mail: [email protected]
Cellular and Molecular Bioengineering (� 2012)
DOI: 10.1007/s12195-012-0229-8
� 2012 Biomedical Engineering Society
contrary to polymer theory and continuum mechanics,which assumes that the mechanical properties of amaterial do not depend on the amount of the materialpresent. If these studies are correct, it implies that themechanics of short microtubules are not governed bycontinuum mechanics, and the inter-dimer bonding isimportant.34
Using the thermal fluctuation method with a boot-strapping analysis, we compared the effects of severalparameters: preparation purity, age of stable micro-tubules, and labeling. Many studies take for grantedthat the persistence length will not change much withthese variables. Here, we report that preparation andage can affect the persistence length measurement by afactor of 2, but that labeling does not. Further, we areable to see clear differences by comparing the normaldistributions of persistence length measurements afternatural-log transforming the data. The ability to usenormal distributions gives more statistical strength tothe differences we find.
EXPERIMENTAL METHODS
Fluctuating Filament Method
The most frequently used technique to study fila-ment mechanics was established independently by twogroups.13,26 This technique uses observations of ther-mally induced fluctuations in the filament shape, andhave been used extensively.2,4,13,15,19,21,23,27 The fila-ment is imaged, typically in fluorescence, and theimage is segmented for analysis. For the freely fluctu-ating methods, the shape is approximated by Fouriermode decomposition into sines or cosines. The persis-tence length is inversely proportional to the variance ofthe mode amplitudes. For long-wavelength modes(n< 5), the signal of the filament shape is typicallymuch larger than the noise, but for higher modes, thenoise dominates because the shot and thermal noise ofthe video microscopy technique has fluctuations on thesame spatial wavelength (Eq. (1)).13 Gittes derived anow well-used formula that takes into account that thenoise floor rises at high mode numbers:
var anð Þ ¼Lc
np
� �21
Lpþ 4
Lce2k� �
1þ N� 1ð Þ sin2 np2N
� �h i
ð1Þ
where, var(an) is the variance nth mode amplitude, a,measured from the data, Lc is the contour length of thefilament, and N is the number of segments taken alongthe microtubule to describe its shape.13 The fittingparameters Lp and e2k
� �are the persistence length and
the average of the error due to noise in the positionsquared, respectively.
Previous studies have only fit the first few modes,with low noise, to a form where the variance isinversely proportional to the persistence length, with-out the noise term2,13:
var anð Þ ¼Lc
np
� �21
Lpð2Þ
Others have used Eq. (2) to directly calculate Lp for thefirst few modes and then average them together.19 Inorder to increase the accuracy of our measurements,we wanted to determine the error in the variance esti-mate. Directly doing this would require multiplemeasurements on the same microtubule, but suchexperiments are difficult since the fluorescence signaland the microtubule itself both degrade with prolongedexposure to light.2,13 Instead, we implemented thebootstrap method to resample each data set giving usthe variance as well as its standard error, where theerror can be used to perform a weighted fitting toEq. (1).
Reagents and Experimental Procedures
Unless otherwise stated, all reagents were purchasedfrom Sigma. Tubulin was either purchased from acommercial vendor (Cytoskeleton, Denver, CO) ormade in-house. Commercial tubulin from porcinebrains that was unlabeled (Cytoskeleton catalogue#TL238, lot #053) or labeled with tetramethylrhod-amine to a ratio of 1–2 rhodamine dyes per dimer(Cytoskeleton catalogue #TL590M, lots #003 and#013) were both delivered lyophilized and stored at�80 �C until use. Cytoskeleton tubulin is made bythree cycles of polymerization and depolymerizationfollowed by a phosphocellulose (PC) column toremove excess MAPs, as described.33 All rhodaminetubulin was purchased and not made in-house.
In-house tubulin was purified as previouslydescribed.29 Briefly, three pig brains were homogenizedin PEM-100 (100 mM PIPES, pH 6.8 with KOH,2 mM EGTA, and 1 mM MgSO4) and centrifuged toretain the supernatant with soluble tubulin proteins.Tubulin was purified from the supernatant by poly-merization at 37 �C by adding an equal volume ofGPEM-76 [8 M Glycerol (58% vol:vol), 76 mMPIPES, 2 mM EGTA, 1 mM MgSO4] with 1 mMGuanosine Triphosphate (GTP). The microtubuleswere pelleted at 300,0009g at 37 �C for 45 min, andthe supernatant was removed. Pellets were resuspendedat 4 �C by homogenization to depolymerize microtu-bules. This completed one cycle of polymerization anddepolymerization that was repeated two more times.After three cycles, a fourth cycle was performed in thepresence of 1 M PIPES to remove the remaining
HAWKINS et al.
MAPs. Aliquots of 10 mg/mL tubulin were drop fro-zen in liquid nitrogen and stored at �80 �C until used.We will refer to our in-house tubulin as ‘‘in-house’’throughout the text to distinguish it from the ‘‘com-mercial’’ tubulin.
Lyophilized tubulin (unlabeled or rhodamine-labeled) was hydrated in PEM-100 to 5 mg/mL with-out GTP and allowed to resuspend for 10 min at 4 �C.Rhodamine tubulin was mixed with unlabeled tubulinto desired ratio (7, 10, 16, or 25%). Tubulin was cen-trifuged at 298,0009g at 4 �C to remove any aggre-gated tubulin. GTP was added to 1 mM to thesupernatant and incubated at 37 �C for 20 min topolymerize microtubules. Paclitaxel (Taxol) was addedto 50 lM to stabilize microtubules. Microtubules wereincubated at 37 �C for 20 min to equilibrate the Taxol.Microtubules were centrifuged at 14,0009g for 10 minat 25 �C to remove any unpolymerized tubulin, and thepellet was resuspended in PEM-100 with 50 lM Taxol,but without GTP. We added 7.65 mM Sodium Azideto prevent bacterial growth. The microtubules werestored at 37 �C.
Slides and cover glass (Fisher 1.5 cat #CO406) werecleaned by 70%ethanol anddriedwithKimwipes. Slidesand cover glass were coated withKappa-Casein (10 mg/mL in PEM-100) by pipetting a 10 ll dropof casein ontoParafilm and placing the slide or cover glass onto thedrop so that it spread over the entire cover glass surface.Casein blocks the glass to prevent microtubules fromadhering. The slide and cover glass were allowed to airdry under a Petri dish to keep free of dust.
Microtubules were diluted to 0.05 mg/mL in PEM-100 with 50 lMTaxol, and an oxygen scavenger system(0.45 mg/mL glucose oxidase, 0.134 mg/mL catalase,and 13.6 mg/mL glucose) was added to prevent photo-bleaching and damage. We dropped 0.85 lL of micro-tubule dilutionon the slide, andplaced the cover glass ontop with the casein-coated sides facing the inside of thesample. Samples were firmly pressed to ensure themicrotubule sample spread throughout the entire coverglass area. A Kimwipe was used to wick excess samplefrom the edges while pressing. Chambers were sealed onall four sides using a thin layer of epoxy that was allowedto fully dry before imaging.
Chamber thickness was determined by the cali-brated microscope focus noting the height between thetop and bottom of the chamber. The differencebetween the heights gave the thickness of the sample,which had to be £3 lM to be used in the assay.Microtubules were imaged in epi-fluorescence using aNikon TiE scope with Intenselite illumination, a 609,1.49 NA objective with a 2.59 image expander (Nikon)in front of the Cascade II EM-CDD camera (Roper)cooled to �80 �C. Images were captured to RAM withno delay with a 100 ms exposure time interval for 1000
frames. Microtubules chosen for imaging needed to bewell separated from all other filaments, freely fluctu-ating, and confined within one focal plane. A 2:1 signalto noise ratio of fluorescence images above back-ground was required for analysis. Data were recordedas nd2 files using NIS Elements (Nikon) and exportedas 16-bit gray scale tiff files.
Data Analysis
Data of fluctuating filaments were analyzed usingMATLAB code. Prior to analysis in MATLAB, theimages of the microtubules were cropped and rotatedusing NIS Elements. The images were cropped toremove other filaments and to reduce processing time.The images were rotated so that the microtubules wereclose to horizontal for analysis, since vertical filamentswould cause two values of y for a single x-value, whichwould be difficult to fit to a function in the MATLABcode.
Our MATLAB code read the cropped tiff files,thresholded the images to black and white, dilated theimages to fill holes, and skeletonized each image of thefilament. Skeletonized images that still had holes orhad significant length changes (>10%) were discardedand not included in the analysis. The microtubule wassegmented into 23–25 equally spaced segments thatdefined the position of the filament in either x–ycoordinates or in distance along the filament, s, andangle between the s and s + 1 segment is hs.
13
Next, the MATLAB code used the filament positionto determine the Fourier mode amplitudes for eachimage for the first 25 modes (an, 1< n< 25), as pre-viously described.2,13 The data were analyzed furtherusing either the previously established method byGittes, which we call ‘‘Prior’’, or the new bootstrapmethod we present here.
The MATLAB code calculated the variance of theamplitude for each mode over the entire data set of1000 frames. The data were plotted over the modenumber, to determine which modes were dominated bythe noise regime. The first 2–4 modes were fit with Eq.(2) to find the persistence length Lp, as reported pre-viously,2,13,23 and the fitting error was quoted as theerror in Lp (Fig. 1c, black fit curve). Alternatively, Eq.(2) was used to individually calculate Lp for each of themodes 2–5. These values of Lp were averaged and thestandard deviation was taken as the error in the mea-surement, as previously reported.19 These two methodsrevealed similar results for the persistence length andwere implemented as the ‘‘Prior’’ method. The errordue to noise was calculated by fitting the final 5–25modes to the second term of the sum in Eq. (1) todetermine, and the error in the fit was used for theerror value of e2k
� �:
Perturbations in Microtubule Mechanics
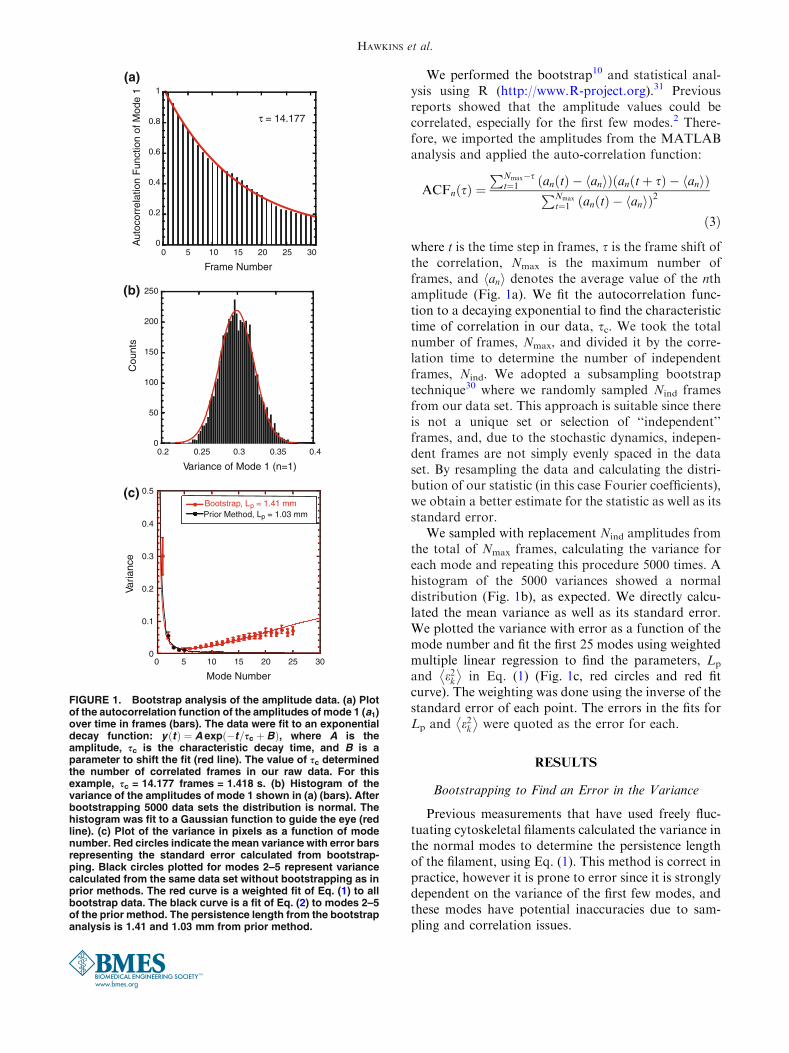
We performed the bootstrap10 and statistical anal-ysis using R (http://www.R-project.org).31 Previousreports showed that the amplitude values could becorrelated, especially for the first few modes.2 There-fore, we imported the amplitudes from the MATLABanalysis and applied the auto-correlation function:
ACFnðsÞ ¼PNmax�s
t¼1 an tð Þ � anh ið Þ an tþ sð Þ � anh ið ÞPNmax
t¼1 an tð Þ � anh ið Þ2
ð3Þ
where t is the time step in frames, s is the frame shift ofthe correlation, Nmax is the maximum number offrames, and anh i denotes the average value of the nthamplitude (Fig. 1a). We fit the autocorrelation func-tion to a decaying exponential to find the characteristictime of correlation in our data, sc. We took the totalnumber of frames, Nmax, and divided it by the corre-lation time to determine the number of independentframes, Nind. We adopted a subsampling bootstraptechnique30 where we randomly sampled Nind framesfrom our data set. This approach is suitable since thereis not a unique set or selection of ‘‘independent’’frames, and, due to the stochastic dynamics, indepen-dent frames are not simply evenly spaced in the dataset. By resampling the data and calculating the distri-bution of our statistic (in this case Fourier coefficients),we obtain a better estimate for the statistic as well as itsstandard error.
We sampled with replacement Nind amplitudes fromthe total of Nmax frames, calculating the variance foreach mode and repeating this procedure 5000 times. Ahistogram of the 5000 variances showed a normaldistribution (Fig. 1b), as expected. We directly calcu-lated the mean variance as well as its standard error.We plotted the variance with error as a function of themode number and fit the first 25 modes using weightedmultiple linear regression to find the parameters, Lp
and e2k� �
in Eq. (1) (Fig. 1c, red circles and red fitcurve). The weighting was done using the inverse of thestandard error of each point. The errors in the fits forLp and e2k
� �were quoted as the error for each.
RESULTS
Bootstrapping to Find an Error in the Variance
Previous measurements that have used freely fluc-tuating cytoskeletal filaments calculated the variance inthe normal modes to determine the persistence lengthof the filament, using Eq. (1). This method is correct inpractice, however it is prone to error since it is stronglydependent on the variance of the first few modes, andthese modes have potential inaccuracies due to sam-pling and correlation issues.
0
0.1
0.2
0.3
0.4
0.5
0 5 10 15 20 25 30
Bootstrap, Lp = 1.41 mmPrior Method, Lp = 1.03 mm
Mode Number
Varia
nce
0
0.2
0.4
0.6
0.8
1
0 5 10 15 20 25 30
τ = 14.177
Aut
ocor
rela
tion
Fun
ctio
n of
Mod
e 1
Frame Number
0
50
100
150
200
250
0.2 0.25 0.3 0.35 0.4
Variance of Mode 1 (n=1)
Cou
nts
(a)
(b)
(c)
FIGURE 1. Bootstrap analysis of the amplitude data. (a) Plotof the autocorrelation function of the amplitudes of mode 1 (a1)over time in frames (bars). The data were fit to an exponentialdecay function: yðtÞ ¼ A exp �t=sc þ Bð Þ, where A is theamplitude, sc is the characteristic decay time, and B is aparameter to shift the fit (red line). The value of sc determinedthe number of correlated frames in our raw data. For thisexample, sc = 14.177 frames = 1.418 s. (b) Histogram of thevariance of the amplitudes of mode 1 shown in (a) (bars). Afterbootstrapping 5000 data sets the distribution is normal. Thehistogram was fit to a Gaussian function to guide the eye (redline). (c) Plot of the variance in pixels as a function of modenumber. Red circles indicate the mean variance with error barsrepresenting the standard error calculated from bootstrap-ping. Black circles plotted for modes 2–5 represent variancecalculated from the same data set without bootstrapping as inprior methods. The red curve is a weighted fit of Eq. (1) to allbootstrap data. The black curve is a fit of Eq. (2) to modes 2–5of the prior method. The persistence length from the bootstrapanalysis is 1.41 and 1.03 mm from prior method.
HAWKINS et al.
To overcome this problem, one could determine theerror in the variance directly by sampling the samemicrotubule multiple times. Unfortunately, the illu-mination causes photobleaching that decreases signal.Further, photodamage will likely alter the microtubuleproperties over the time it would take to collect thedata. Instead, we decided to use bootstrapping toresample the mode amplitudes. We first determined thenumber of independent frames, Nind, by finding theautocorrelation time for the first Fourier mode(Fig. 1a). We then sampled Nind frames out of the fulldata set, with replacement, and then calculated thevariance for each mode. By repeating this resamplingprocedure 5000 times, we recovered a normal distri-bution (Fig. 1b) allowing us to assign a mean varianceas well as a standard error for each mode. These valueswere used to perform a weighted multiple linearregression using Eq. (1) to determine the values for Lp
and e2k� �
(Fig. 1c).Our bootstrapping of the amplitude data gave us
more information about the variance of the data,which allowed us to place error bars and perform aweighted fit of Eq. (1) to the variance as a function ofmode number (Fig. 1c). When the fit to variance datafor all 25 modes was performed without weighting, wefound the noise regime alters the fit of Eq. (1) resultingin a persistence length that is 3 orders of magnitudelower than expected (Supplemental data, Fig. 1A). It isclear from the plot that the fit to the low modes issuffering to accommodate the higher mode fit. Thus, inorder to use Eq. (1) to fit all data, weighting wasrequired. This poor fitting of Eq. (1) to all the modedata is why prior groups used the shorter Eq. (2) to fitto just the lowest few modes.13
We deduced the persistence length from ourunweighted, low mode data using Eq. (2) and com-pared it to the persistence length determined from ourweighted data over all modes using Eq. (1). We noticedthat there was a slight increase in the resulting persis-tence length using the weighted fit (Fig. 1c, Supple-mental Fig. 1B). The bootstrapping did not change thevariance of the mode measurements by very much, sothis cannot account for the differences in measuredpersistence length for the prior and bootstrappingmethods. The difference must be accounted for in thefitting of the data. We believe that the increased per-sistence lengths determined by the weighted fit are abetter estimate of the true persistence lengths becausethey take experimental error into account.
Persistence Length is a Log-Normal Distribution
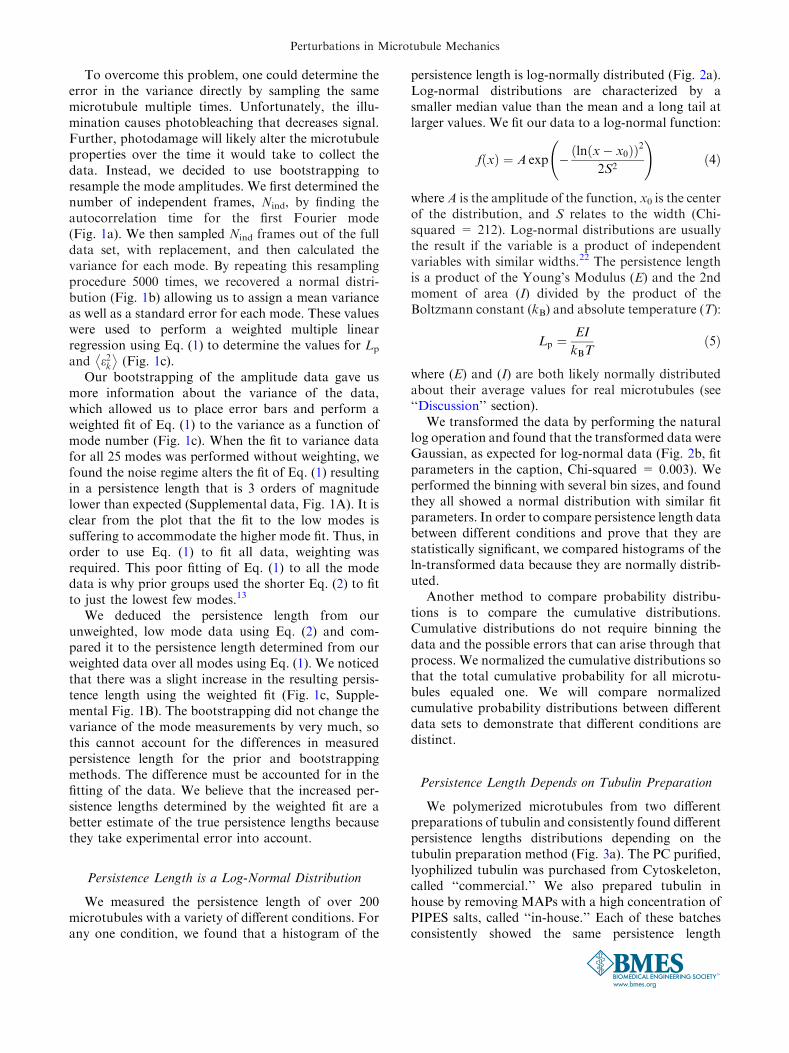
We measured the persistence length of over 200microtubules with a variety of different conditions. Forany one condition, we found that a histogram of the
persistence length is log-normally distributed (Fig. 2a).Log-normal distributions are characterized by asmaller median value than the mean and a long tail atlarger values. We fit our data to a log-normal function:
f xð Þ ¼ A exp � ln x� x0ð Þð Þ2
2S2
!ð4Þ
whereA is the amplitude of the function, x0 is the centerof the distribution, and S relates to the width (Chi-squared = 212). Log-normal distributions are usuallythe result if the variable is a product of independentvariables with similar widths.22 The persistence lengthis a product of the Young’s Modulus (E) and the 2ndmoment of area (I) divided by the product of theBoltzmann constant (kB) and absolute temperature (T):
Lp ¼EI
kBTð5Þ
where (E) and (I) are both likely normally distributedabout their average values for real microtubules (see‘‘Discussion’’ section).
We transformed the data by performing the naturallog operation and found that the transformed data wereGaussian, as expected for log-normal data (Fig. 2b, fitparameters in the caption, Chi-squared = 0.003). Weperformed the binning with several bin sizes, and foundthey all showed a normal distribution with similar fitparameters. In order to compare persistence length databetween different conditions and prove that they arestatistically significant, we compared histograms of theln-transformed data because they are normally distrib-uted.
Another method to compare probability distribu-tions is to compare the cumulative distributions.Cumulative distributions do not require binning thedata and the possible errors that can arise through thatprocess. We normalized the cumulative distributions sothat the total cumulative probability for all microtu-bules equaled one. We will compare normalizedcumulative probability distributions between differentdata sets to demonstrate that different conditions aredistinct.
Persistence Length Depends on Tubulin Preparation
We polymerized microtubules from two differentpreparations of tubulin and consistently found differentpersistence lengths distributions depending on thetubulin preparation method (Fig. 3a). The PC purified,lyophilized tubulin was purchased from Cytoskeleton,called ‘‘commercial.’’ We also prepared tubulin inhouse by removing MAPs with a high concentration ofPIPES salts, called ‘‘in-house.’’ Each of these batchesconsistently showed the same persistence length
Perturbations in Microtubule Mechanics
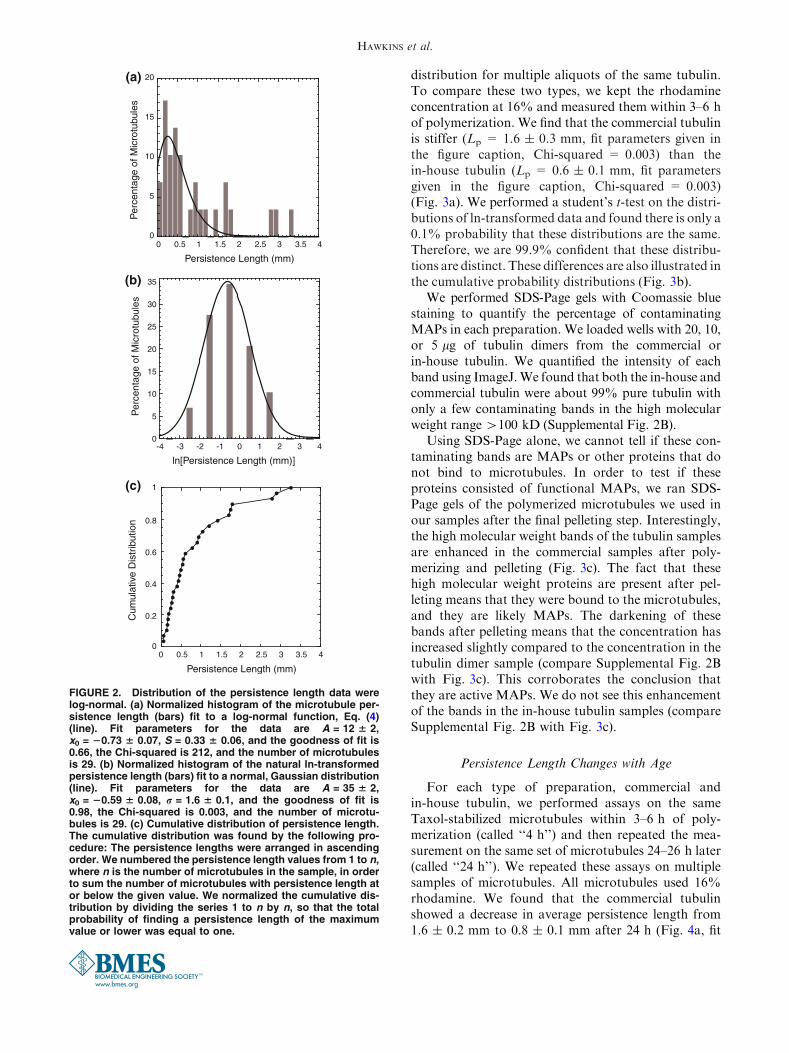
distribution for multiple aliquots of the same tubulin.To compare these two types, we kept the rhodamineconcentration at 16% and measured them within 3–6 hof polymerization. We find that the commercial tubulinis stiffer (Lp = 1.6 ± 0.3 mm, fit parameters given inthe figure caption, Chi-squared = 0.003) than thein-house tubulin (Lp = 0.6 ± 0.1 mm, fit parametersgiven in the figure caption, Chi-squared = 0.003)(Fig. 3a). We performed a student’s t-test on the distri-butions of ln-transformed data and found there is only a0.1% probability that these distributions are the same.Therefore, we are 99.9% confident that these distribu-tions are distinct. These differences are also illustrated inthe cumulative probability distributions (Fig. 3b).
We performed SDS-Page gels with Coomassie bluestaining to quantify the percentage of contaminatingMAPs in each preparation. We loaded wells with 20, 10,or 5 lg of tubulin dimers from the commercial orin-house tubulin. We quantified the intensity of eachband using ImageJ.We found that both the in-house andcommercial tubulin were about 99% pure tubulin withonly a few contaminating bands in the high molecularweight range >100 kD (Supplemental Fig. 2B).
Using SDS-Page alone, we cannot tell if these con-taminating bands are MAPs or other proteins that donot bind to microtubules. In order to test if theseproteins consisted of functional MAPs, we ran SDS-Page gels of the polymerized microtubules we used inour samples after the final pelleting step. Interestingly,the high molecular weight bands of the tubulin samplesare enhanced in the commercial samples after poly-merizing and pelleting (Fig. 3c). The fact that thesehigh molecular weight proteins are present after pel-leting means that they were bound to the microtubules,and they are likely MAPs. The darkening of thesebands after pelleting means that the concentration hasincreased slightly compared to the concentration in thetubulin dimer sample (compare Supplemental Fig. 2Bwith Fig. 3c). This corroborates the conclusion thatthey are active MAPs. We do not see this enhancementof the bands in the in-house tubulin samples (compareSupplemental Fig. 2B with Fig. 3c).
Persistence Length Changes with Age
For each type of preparation, commercial andin-house tubulin, we performed assays on the sameTaxol-stabilized microtubules within 3–6 h of poly-merization (called ‘‘4 h’’) and then repeated the mea-surement on the same set of microtubules 24–26 h later(called ‘‘24 h’’). We repeated these assays on multiplesamples of microtubules. All microtubules used 16%rhodamine. We found that the commercial tubulinshowed a decrease in average persistence length from1.6 ± 0.2 mm to 0.8 ± 0.1 mm after 24 h (Fig. 4a, fit
0
5
10
15
20
0 0.5 1 1.5 2 2.5 3 3.5 4
Per
cent
age
of M
icro
tubu
les
Persistence Length (mm)
0
5
10
15
20
25
30
35
-4 -3 -2 -1 0 1 2 3 4
Per
cent
age
of M
icro
tubu
les
ln[Persistence Length (mm)]
0
0.2
0.4
0.6
0.8
1
0 0.5 1 1.5 2 2.5 3 3.5 4
Persistence Length (mm)
Cum
ulat
ive
Dis
trib
utio
n
(a)
(b)
(c)
FIGURE 2. Distribution of the persistence length data werelog-normal. (a) Normalized histogram of the microtubule per-sistence length (bars) fit to a log-normal function, Eq. (4)(line). Fit parameters for the data are A = 12 6 2,x0 = 20.73 6 0.07, S = 0.33 6 0.06, and the goodness of fit is0.66, the Chi-squared is 212, and the number of microtubulesis 29. (b) Normalized histogram of the natural ln-transformedpersistence length (bars) fit to a normal, Gaussian distribution(line). Fit parameters for the data are A = 35 6 2,x0 = 20.59 6 0.08, r = 1.6 6 0.1, and the goodness of fit is0.98, the Chi-squared is 0.003, and the number of microtu-bules is 29. (c) Cumulative distribution of persistence length.The cumulative distribution was found by the following pro-cedure: The persistence lengths were arranged in ascendingorder. We numbered the persistence length values from 1 to n,where n is the number of microtubules in the sample, in orderto sum the number of microtubules with persistence length ator below the given value. We normalized the cumulative dis-tribution by dividing the series 1 to n by n, so that the totalprobability of finding a persistence length of the maximumvalue or lower was equal to one.
HAWKINS et al.
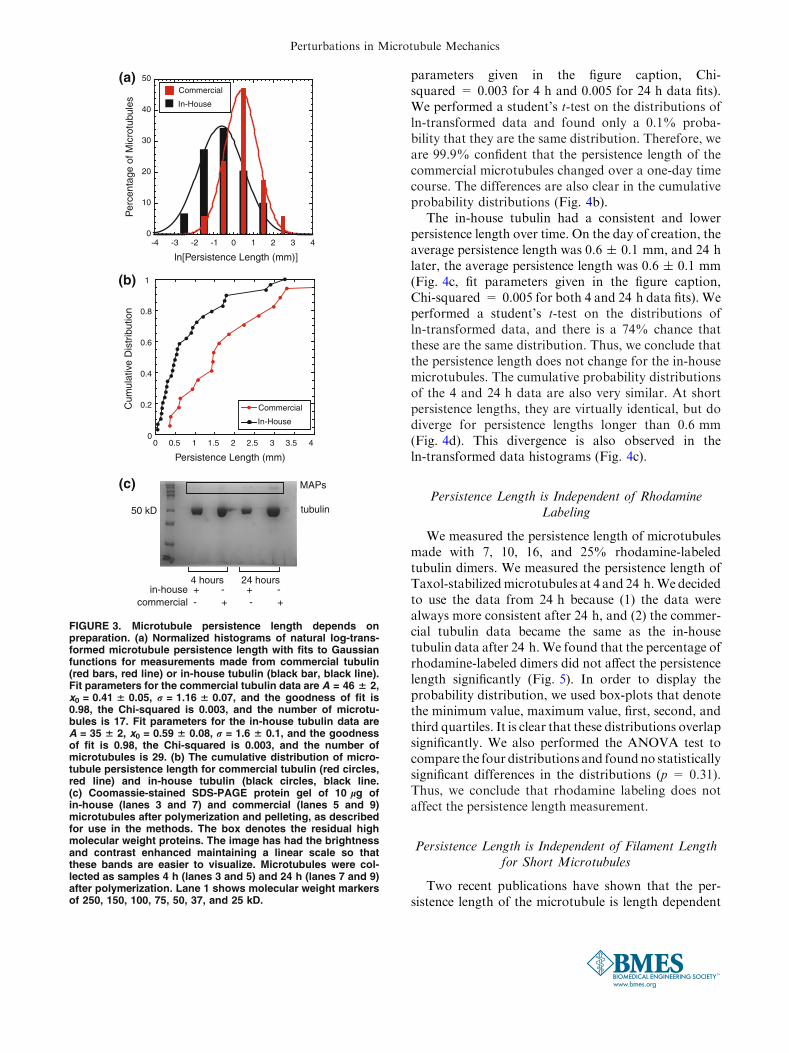
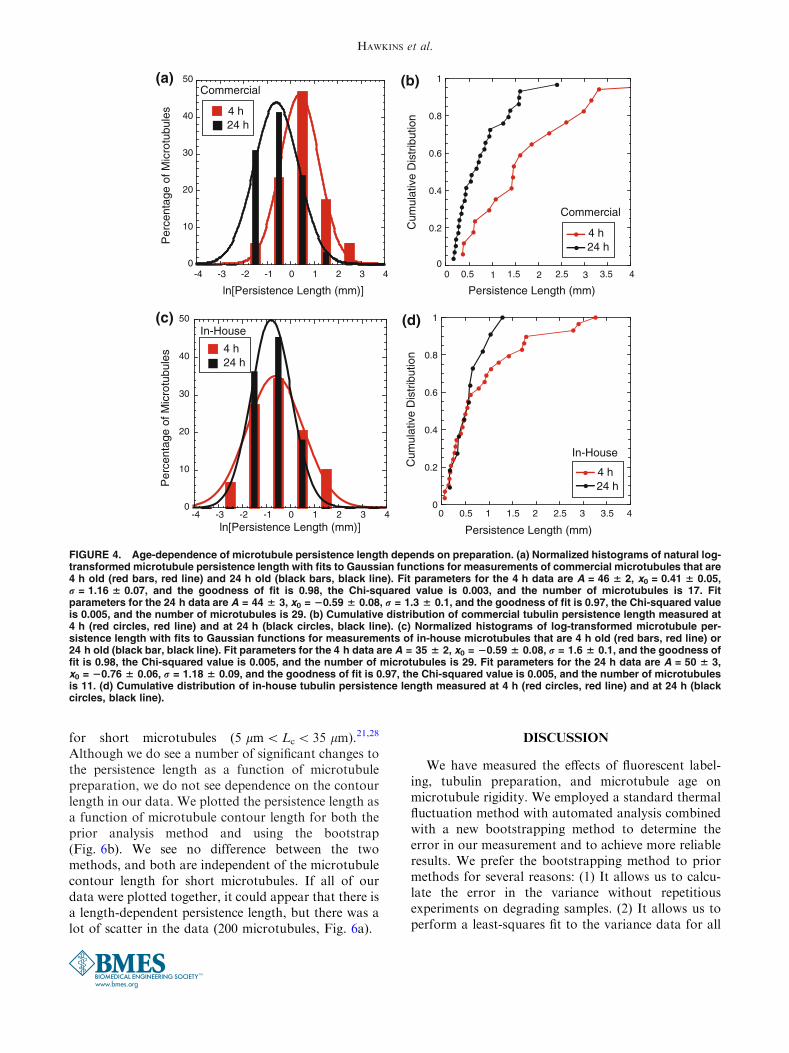
parameters given in the figure caption, Chi-squared = 0.003 for 4 h and 0.005 for 24 h data fits).We performed a student’s t-test on the distributions ofln-transformed data and found only a 0.1% proba-bility that they are the same distribution. Therefore, weare 99.9% confident that the persistence length of thecommercial microtubules changed over a one-day timecourse. The differences are also clear in the cumulativeprobability distributions (Fig. 4b).
The in-house tubulin had a consistent and lowerpersistence length over time. On the day of creation, theaverage persistence length was 0.6 ± 0.1 mm, and 24 hlater, the average persistence length was 0.6 ± 0.1 mm(Fig. 4c, fit parameters given in the figure caption,Chi-squared = 0.005 for both 4 and 24 h data fits). Weperformed a student’s t-test on the distributions ofln-transformed data, and there is a 74% chance thatthese are the same distribution. Thus, we conclude thatthe persistence length does not change for the in-housemicrotubules. The cumulative probability distributionsof the 4 and 24 h data are also very similar. At shortpersistence lengths, they are virtually identical, but dodiverge for persistence lengths longer than 0.6 mm(Fig. 4d). This divergence is also observed in theln-transformed data histograms (Fig. 4c).
Persistence Length is Independent of RhodamineLabeling
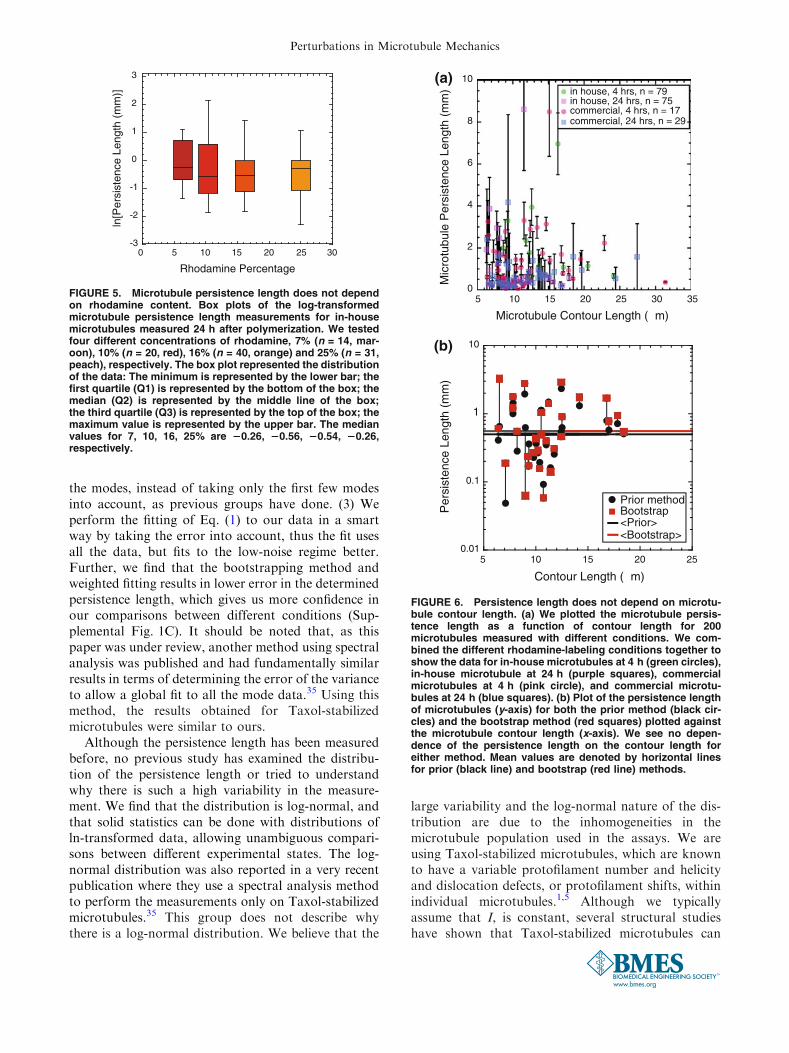
We measured the persistence length of microtubulesmade with 7, 10, 16, and 25% rhodamine-labeledtubulin dimers. We measured the persistence length ofTaxol-stabilizedmicrotubules at 4 and 24 h.We decidedto use the data from 24 h because (1) the data werealways more consistent after 24 h, and (2) the commer-cial tubulin data became the same as the in-housetubulin data after 24 h.We found that the percentage ofrhodamine-labeled dimers did not affect the persistencelength significantly (Fig. 5). In order to display theprobability distribution, we used box-plots that denotethe minimum value, maximum value, first, second, andthird quartiles. It is clear that these distributions overlapsignificantly. We also performed the ANOVA test tocompare the four distributions and foundno statisticallysignificant differences in the distributions (p = 0.31).Thus, we conclude that rhodamine labeling does notaffect the persistence length measurement.
Persistence Length is Independent of Filament Lengthfor Short Microtubules
Two recent publications have shown that the per-sistence length of the microtubule is length dependent
0
10
20
30
40
50
-4 -3 -2 -1 0 1 2 3 4
Per
cent
age
of M
icro
tubu
les
ln[Persistence Length (mm)]
In-House
Commercial
4 hours 24 hours
tubulin50 kD
in-house + - + -commercial - + - +
MAPs
0
0.2
0.4
0.6
0.8
1
0 0.5 1 1.5 2 2.5 3 3.5 4
Persistence Length (mm)
Cum
ulat
ive
Dis
trib
utio
n
In-House
Commercial
(a)
(b)
(c)
FIGURE 3. Microtubule persistence length depends onpreparation. (a) Normalized histograms of natural log-trans-formed microtubule persistence length with fits to Gaussianfunctions for measurements made from commercial tubulin(red bars, red line) or in-house tubulin (black bar, black line).Fit parameters for the commercial tubulin data are A = 46 6 2,x0 = 0.41 6 0.05, r = 1.16 6 0.07, and the goodness of fit is0.98, the Chi-squared is 0.003, and the number of microtu-bules is 17. Fit parameters for the in-house tubulin data areA = 35 6 2, x0 = 0.59 6 0.08, r = 1.6 6 0.1, and the goodnessof fit is 0.98, the Chi-squared is 0.003, and the number ofmicrotubules is 29. (b) The cumulative distribution of micro-tubule persistence length for commercial tubulin (red circles,red line) and in-house tubulin (black circles, black line.(c) Coomassie-stained SDS-PAGE protein gel of 10 lg ofin-house (lanes 3 and 7) and commercial (lanes 5 and 9)microtubules after polymerization and pelleting, as describedfor use in the methods. The box denotes the residual highmolecular weight proteins. The image has had the brightnessand contrast enhanced maintaining a linear scale so thatthese bands are easier to visualize. Microtubules were col-lected as samples 4 h (lanes 3 and 5) and 24 h (lanes 7 and 9)after polymerization. Lane 1 shows molecular weight markersof 250, 150, 100, 75, 50, 37, and 25 kD.
Perturbations in Microtubule Mechanics
for short microtubules (5 lm<Lc < 35 lm).21,28
Although we do see a number of significant changes tothe persistence length as a function of microtubulepreparation, we do not see dependence on the contourlength in our data. We plotted the persistence length asa function of microtubule contour length for both theprior analysis method and using the bootstrap(Fig. 6b). We see no difference between the twomethods, and both are independent of the microtubulecontour length for short microtubules. If all of ourdata were plotted together, it could appear that there isa length-dependent persistence length, but there was alot of scatter in the data (200 microtubules, Fig. 6a).
DISCUSSION
We have measured the effects of fluorescent label-ing, tubulin preparation, and microtubule age onmicrotubule rigidity. We employed a standard thermalfluctuation method with automated analysis combinedwith a new bootstrapping method to determine theerror in our measurement and to achieve more reliableresults. We prefer the bootstrapping method to priormethods for several reasons: (1) It allows us to calcu-late the error in the variance without repetitiousexperiments on degrading samples. (2) It allows us toperform a least-squares fit to the variance data for all
0
10
20
30
40
50
-4 -3 -2 -1 0 1 2 3 4
Per
cent
age
of M
icro
tubu
les
ln[Persistence Length (mm)]
4 h24 h
Commercial
Persistence Length (mm)
Cum
ulat
ive
Dis
trib
utio
n
4 h24 h
Commercial
0
0.2
0.4
0.6
0.8
1
0 0.5 1 1.5 2 2.5 3 3.5 4
0
10
20
30
40
50
-4 -3 -2 -1 0 1 2 3 4
Per
cent
age
of M
icro
tubu
les
ln[Persistence Length (mm)]
4 h24 h
In-House
Persistence Length (mm)
Cum
ulat
ive
Dis
trib
utio
n
In-House
4 h24 h
0
0.2
0.4
0.6
0.8
1
0 0.5 1 1.5 2 2.5 3 3.5 4
(a) (b)
(d)(c)
FIGURE 4. Age-dependence of microtubule persistence length depends on preparation. (a) Normalized histograms of natural log-transformed microtubule persistence length with fits to Gaussian functions for measurements of commercial microtubules that are4 h old (red bars, red line) and 24 h old (black bars, black line). Fit parameters for the 4 h data are A = 46 6 2, x0 = 0.41 6 0.05,r = 1.16 6 0.07, and the goodness of fit is 0.98, the Chi-squared value is 0.003, and the number of microtubules is 17. Fitparameters for the 24 h data are A = 44 6 3, x0 = 20.59 6 0.08, r = 1.3 6 0.1, and the goodness of fit is 0.97, the Chi-squared valueis 0.005, and the number of microtubules is 29. (b) Cumulative distribution of commercial tubulin persistence length measured at4 h (red circles, red line) and at 24 h (black circles, black line). (c) Normalized histograms of log-transformed microtubule per-sistence length with fits to Gaussian functions for measurements of in-house microtubules that are 4 h old (red bars, red line) or24 h old (black bar, black line). Fit parameters for the 4 h data are A = 35 6 2, x0 = 20.59 6 0.08, r = 1.6 6 0.1, and the goodness offit is 0.98, the Chi-squared value is 0.005, and the number of microtubules is 29. Fit parameters for the 24 h data are A = 50 6 3,x0 = 20.76 6 0.06, r = 1.18 6 0.09, and the goodness of fit is 0.97, the Chi-squared value is 0.005, and the number of microtubulesis 11. (d) Cumulative distribution of in-house tubulin persistence length measured at 4 h (red circles, red line) and at 24 h (blackcircles, black line).
HAWKINS et al.
the modes, instead of taking only the first few modesinto account, as previous groups have done. (3) Weperform the fitting of Eq. (1) to our data in a smartway by taking the error into account, thus the fit usesall the data, but fits to the low-noise regime better.Further, we find that the bootstrapping method andweighted fitting results in lower error in the determinedpersistence length, which gives us more confidence inour comparisons between different conditions (Sup-plemental Fig. 1C). It should be noted that, as thispaper was under review, another method using spectralanalysis was published and had fundamentally similarresults in terms of determining the error of the varianceto allow a global fit to all the mode data.35 Using thismethod, the results obtained for Taxol-stabilizedmicrotubules were similar to ours.
Although the persistence length has been measuredbefore, no previous study has examined the distribu-tion of the persistence length or tried to understandwhy there is such a high variability in the measure-ment. We find that the distribution is log-normal, andthat solid statistics can be done with distributions ofln-transformed data, allowing unambiguous compari-sons between different experimental states. The log-normal distribution was also reported in a very recentpublication where they use a spectral analysis methodto perform the measurements only on Taxol-stabilizedmicrotubules.35 This group does not describe whythere is a log-normal distribution. We believe that the
large variability and the log-normal nature of the dis-tribution are due to the inhomogeneities in themicrotubule population used in the assays. We areusing Taxol-stabilized microtubules, which are knownto have a variable protofilament number and helicityand dislocation defects, or protofilament shifts, withinindividual microtubules.1,5 Although we typicallyassume that I, is constant, several structural studieshave shown that Taxol-stabilized microtubules can
-3
-2
-1
0
1
2
3
5 10 15 20 25 300
Rhodamine Percentage
ln[P
ersi
sten
ce L
engt
h (m
m)]
FIGURE 5. Microtubule persistence length does not dependon rhodamine content. Box plots of the log-transformedmicrotubule persistence length measurements for in-housemicrotubules measured 24 h after polymerization. We testedfour different concentrations of rhodamine, 7% (n = 14, mar-oon), 10% (n = 20, red), 16% (n = 40, orange) and 25% (n = 31,peach), respectively. The box plot represented the distributionof the data: The minimum is represented by the lower bar; thefirst quartile (Q1) is represented by the bottom of the box; themedian (Q2) is represented by the middle line of the box;the third quartile (Q3) is represented by the top of the box; themaximum value is represented by the upper bar. The medianvalues for 7, 10, 16, 25% are 20.26, 20.56, 20.54, 20.26,respectively.
in house, 4 hrs, n = 79in house, 24 hrs, n = 75commercial, 4 hrs, n = 17commercial, 24 hrs, n = 29
Microtubule Contour Length (µm)
Mic
rotu
bule
Per
sist
ence
Len
gth
(mm
)
0.01
0.1
1
10
5 10 15 20 25
Per
sist
ence
Len
gth
(mm
)
Contour Length (µm)
Prior methodBootstrap<Prior><Bootstrap>
0
2
4
6
8
10
5 10 15 20 25 30 35
(a)
(b)
FIGURE 6. Persistence length does not depend on microtu-bule contour length. (a) We plotted the microtubule persis-tence length as a function of contour length for 200microtubules measured with different conditions. We com-bined the different rhodamine-labeling conditions together toshow the data for in-house microtubules at 4 h (green circles),in-house microtubule at 24 h (purple squares), commercialmicrotubules at 4 h (pink circle), and commercial microtu-bules at 24 h (blue squares). (b) Plot of the persistence lengthof microtubules (y-axis) for both the prior method (black cir-cles) and the bootstrap method (red squares) plotted againstthe microtubule contour length (x-axis). We see no depen-dence of the persistence length on the contour length foreither method. Mean values are denoted by horizontal linesfor prior (black line) and bootstrap (red line) methods.
Perturbations in Microtubule Mechanics
have protofilament numbers from 12 to 15.6 Fromcross-sectional images of these microtubules, we haveestimated that I ranges from I2 = 6.7 9 103 to I15 =2.8 9 104 nm4. Further, several studies have demon-strated that Taxol-stabilized microtubules (stabilizedwith Taxol 1 day after polymerization) have a proto-filament shift defect along their lengths, at a frequencyof 1 defect per 15–17 lm.1,5 Although we stabilizedwith Taxol immediately after polymerization in theabsence of Taxol, we believe these Taxol-stabilizedmicrotubules will still have more defects than micro-tubules without Taxol. The defects will effectivelybroaden the distribution of I even for a single micro-tubule. Finally, in addition to actual size changes, themicrotubule cross-section has been shown to fluctuatein shape from circular to oval in high-resolutionstructural studies,6 and these fluctuations could alsocontribute to changes in I.
We have shown that there is a difference in thepersistence length by a factor of two depending on thepreparation. We compared commercially available PCtubulin to our in-house tubulin. Both preparationsremove MAPs using ionic strength, but do so by dif-ferent methods. Both preparations result in relativelyclean tubulin 99% pure with a few contaminatingproteins of high molecular weight (Fig. 3c, Supple-mental Fig. 2B). We find that the contaminating bandsof the commercial tubulin represent active MAPs thatcould be binding and enhancing the rigidity of themicrotubules. It has been shown that structural MAPs,such as tau and MAP2, can increase the persistencelength of microtubules.9,11,23 One study examined theeffects of both Taxol and increasing concentrations offull-length tau protein, a MAP that enhances growthand stability of microtubules in axons.11 First, theyestablished that Taxol-stabilized microtubules had apersistence length of 0.2 mm, similar to our measure-ments. Further, they found that tau enhanced thepersistence length proportional to the concentration oftau present. For instance, 2% tau (ratio compared totubulin dimer content) increased the persistence lengthfrom 0.9 ± 0.2 mm (without Taxol) 1.1 ± 0.4 mm,and 18% tau increased the persistence length to2.2 ± 0.3 mm. They also found that MAP2, a den-dritic stabilizing MAP, increased the persistence lengtheven more than tau, and a brain MAP-mix was evenmore potent. Interestingly, Dye et al.9 found thatmicrotubules with MAP2 and Taxol together had thesame flexibility as MAP2 alone, implying that theincreased flexibility of Taxol and the increased rigidityof MAP2 do not cancel each other out. We do notknow exactly which brain MAPs are residual in thecommercial or in-house preparations, but they maycontribute to the increased the persistence length weobserve.
We have presented evidence that seemingly minoralterations to the preparation of microtubules can havea qualitative (factor of 2) effect on the resulting per-sistence length measured. This effect is consistent andstatistically significant, but does not capture the twoorders of magnitude discrepancy in measured values inthe literature (for a comprehensive review with table ofprior measurements, see Hawkins et al.15). If onecompares the measured flexural rigidities for Taxol-stabilized microtubules measured by a variety ofmeans, there is as much variance for the 22 reportedmeasurements as there are in our single set of measuredmicrotubules (n = 200). These measurements havebeen made with different techniques (freely fluctuatingfilaments with one or both ends free, calibrated flow,buckling with optical traps, buckling with kinesinmotors, and forced bending against viscous drag), butthe data have similar results from wildly differenttechniques, and wildly different results from the sametechnique. Perhaps, the variation derives not only fromthe effects we observe in preparation, but also in differentvalues for the second moment of inertia, and the lownumbers of measurements for performing the requiredstatistical analyses needed. Our data sit in the middle ofthe range of data collected from other groups. Given thehigh and asymmetric variance of the data, we proposethat higher number of microtubules need to be measuredand histograms of the results must be used to comparedifferences in future studies.
One might expect that, as the dimers begin todegrade, the microtubules would become more flexibleover time. We kept the same stock preparation ofpolymerized microtubules at 37 �C over 24 h toexamine the same set of microtubules directly afterpolymerization and then 1 day later. We found thatage had large effect for the commercial tubulin prep-aration and not for the in-house preparation (Figs. 4a,4b). We find that after 24 h of incubation, the persis-tence length of the commercial microtubules drops tothe same level as the in-house microtubules, which isconstant over 24 h (Fig. 4c, Supplemental Fig. 2A).One possible explanation for this aging effect could bethat the residual contaminating MAPs present in thecommercial tubulin lose activity after 24 h. Anotherpossible explanation is that the more rigid microtu-bules are less stable and disassemble after 24 h, or thatthe microtubules end-to-end anneal so that the entirepopulation is more homogeneous and flexible.
We tested the effect of increasing the number ofrhodamine-labeled tubulin dimers in the microtubule,and found it has no effect. Rhodamine-labeling con-sists of covalently linking a rhodamine dye to surfacelysine residues of the tubulin dimer. Lysines arefound around the surface, but predominantly at theinter-dimer interfaces. The labeling is performed on
HAWKINS et al.
polymerized microtubules to reduce the labeling on thelysines essential for polymerization. Despite this care,up to 90% of tubulin dimers are lost and unable torepolymerize in the labeling process, implying thatthose lysines are labeled and affect polymerization.18
Our results indicate that the remaining 10% of labeleddimers are probably labeled on lysines outside of theinter-dimer regions, because we see no change in per-sistence length with increasing concentrations oflabeled dimers. This compliments some recent workperformed on the polymerization kinetics of labeledmicrotubules where they also find that high levels oflabeled tubulin dimers do not affect the dynamics ofmicrotubules.12
Measurements of microtubule persistence lengthinside cells are difficult because we cannot quantify theforces acting along the microtubule. Unlike in oursimple, thermally driven in vitro system, the forcesinside cells include active motors and confining forcesdue to other filaments. Microtubules inside cells havebeen observed to create high curvature.25 Sometimesthey break and sometimes they do not. We have shownthat much of the breakage is due specifically to theactivity of microtubule-severing enzymes.37 Afterbreakage, the microtubules can retain their curvature,implying that the forces acting on them persist.36 Onepossible means to determining the persistence length ofcellular microtubules would be to gently extract intactmicrotubules from cells with their bound MAPs, butremoving the crowding and crosslinking active agents.Using these extracted microtubules in a thermalexperimental system would allow for measurements ofnatural microtubules with all the intact isotypes, post-translational modifications, and MAPs. If successful,such experiments could also compare between micro-tubule populations in different cell types and com-partments, such as axons and dendrites.
CONCLUSIONS
Microtubule persistence length has been measurednumerous times over the years with varying results forsimilar experimental systems. Here, we have presentedresults that through meticulous experiments and sta-tistical analysis, clear conclusions can be made aboutthe persistence length of microtubules, and how evensomething as innocuous as different preparations oftubulin can greatly affect the measurement by a factorof 2. The measurements made over the years have thesame variation in the results that a single measurementof many microtubules has, implying that this mea-surement is tricky and requires high repetitions andcareful analysis. Using an improved bootstrappinganalysis to estimate the error of the variance, we can
now begin to compare data for microtubules of dif-ferent conditions, such as tubulin isotype, post-translational modification, or species-dependent effects.Further, MAPs that both increase or decrease therigidity need to be explored.
ELECTRONIC SUPPLEMENTARY MATERIAL
The online version of this article (doi:10.1007/s12195-012-0229-8) contains supplementary material, which isavailable to authorized users.
ACKNOWLEDGMENTS
TLH was supported in part from the North EastAlliance for Graduate Education and Professoriate(NEAGEP) grant from the NSF. TLH, MM, andMSY were supported on an NSF grant #1039403 andsupplement #0928540 to JLR and DS from the Nanoand Bio Mechanics Program, Civil Mechanical, andManufacturing Innovation Directorate. DLS wassupported by funds from the Intramural ResearchProgram of the Eunice Kennedy Shriver NationalInstitute of Child Health and Human Development.We thank Carey Fagerstrom for her preparation of thein-house tubulin and helpful discussions. We thankJohn Crocker for valuable discussions on statistics andlog-normal data sets.
REFERENCES
1Arnal, I., and R. H. Wade. How does taxol stabilizemicrotubules? Curr. Biol. 5:900–908, 1995.2Brangwynne, C. P., G. H. Koenderink, E. Barry, Z. Dogic,F. C. MacKintosh, and D. A. Weitz. Bending dynamicsof fluctuating biopolymers probed by automated high-resolution filament tracking. Biophys. J. 93:346–359, 2007.3Brown, T. B., and W. O. Hancock. A polarized microtu-bule array for kinesin-powered nanoscale assembly andforce generation. Nano Lett. 2:1131–1135, 2002.4Cassimeris, L., D. Gard, P. T. Tran, and H. P. Erickson.XMAP215 is a long thin molecule that does not increasemicrotubule stiffness. J. Cell Sci. 114:3025–3033, 2001.5Chretien, D., F. Metoz, F. Verde, E. Karsenti, and R. H.Wade. Lattice defects in microtubules: protofilamentnumbers vary within individual microtubules. J. Cell Biol.117:1031–1040, 1992.6Chretien, D., and R. H. Wade. New data on the microtu-bule surface lattice. Biol. Cell 71:161–174, 1991.7Clemmens, J., H. Hess, R. Doot, C. M. Matzke, G. D.Bachand, and V. Vogel. Motor-protein ‘‘roundabouts’’:microtubules moving on kinesin-coated tracks throughengineered networks. Lab Chip 4:83–86, 2004.8Desai, A., and T. J. Mitchison. Microtubule polymeriza-tion dynamics. Annu. Rev. Cell Dev. Biol. 13:83–117, 1997.
Perturbations in Microtubule Mechanics
9Dye, R. B., S. P. Fink, and R. C. Williams. Taxol-inducedflexibility of microtubules and its reversal by MAP-2 andTau. J. Biol. Chem. 268:6847–6850, 1993.
10Efron, B., and R. Tibshirani. An Introduction to theBootstrap. New York: Chapman and Hall, 1993.
11Felgner, H., R. Frank, J. Biernat, E. M. Mandelkow,E. Mandelkow, B. Ludin, A. Matus, and M. Schliwa. Do-mains of neuronal microtubule-associated proteins and flex-ural rigidity of microtubules. J. Cell Biol. 138:1067–1075, 1997.
12Gardner, M. K., B. D. Charlebois, I. M. Janosi, J. Howard,A. J. Hunt, and D. J. Odde. Rapid microtubule self-assembly kinetics. Cell 146:582–592, 2011.
13Gittes, F. Flexural rigidity of microtubules and actin fila-ments measured from thermal fluctuations in shape. J. CellBiol. 120:923–934, 1993.
14Goel, A., and V. Vogel. Harnessing biological motors toengineer systems for nanoscale transport and assembly.Nat. Nanotechnol. 3:465–475, 2008.
15Hawkins, T., M. Mirigian, M. Selcuk Yasar, and J. L. Ross.Mechanics of microtubules. J. Biomech. 43:23–30, 2010.
16Hess, S. T., T. P. Girirajan, and M. D. Mason. Ultra-highresolution imaging by fluorescence photoactivationlocalization microscopy. Biophys. J. 91:4258–4272, 2006.
17Hutchins, B. M., M. Platt, W. O. Hancock, and M. E.Williams. Directing transport of CoFe2O4-functionalizedmicrotubules with magnetic fields. Small 3:126–131, 2007.
18Hyman, A., D. Drechsel, D. Kellogg, S. Salser, K. Sawin,P. Steffen, L. Wordeman, and T. Mitchison. Preparation ofmodified tubulins. Methods Enzymol. 196:478–485, 1991.
19Janson, M. E., and M. Dogterom. A bending mode anal-ysis for growing microtubules: evidence for a velocity-dependent rigidity. Biophys. J. 87:2723–2736, 2004.
20Kawaguchi, K., S. Ishiwata, and T. Yamashita. Tempera-ture dependence of the flexural rigidity of single microtu-bules. Biochem. Biophys. Res. Commun. 366:637–642, 2008.
21Kawaguchi, K., and A. Yamaguchi. Temperature depen-dence rigidity of non-taxol stabilized single microtubules.Biochem. Biophys. Res. Commun. 402:66–69, 2010.
22Limpert, E., W. A. Stahel, and M. Abbt. Log-normal dis-tributions across the sciences: keys and clues. Bioscience51:341–352, 2001.
23Mickey, B., and J. Howard. Rigidity of microtubules isincreased by stabilizing agents. J. Cell Biol. 130:909–917, 1995.
24Nitta, T., and H. Hess. Dispersion in active transport bykinesin-powered molecular shuttles. Nano Lett. 5:1337–1342, 2005.
25Odde, D. J., L. Ma, A. H. Briggs, A. DeMarco, and M. W.Kirschner. Microtubule bending and breaking in livingfibroblast cells. J. Cell Sci. 112(Pt 19):3283–3288, 1999.
26Ott, A., M. Magnasco, A. Simon, and A. Libchaber.Measurement of the persistence length of polymerized actinusing fluorescence microscopy. Phys. Rev. E Stat. Phys.Plasmas Fluids Relat. Interdiscip. Topics 48:R1642–R1645,1993.
27Pampaloni, F., and E. L. Florin. Microtubule architecture:inspiration for novel carbon nanotube-based biomimeticmaterials. Trends Biotechnol. 26:302–310, 2008.
28Pampaloni, F., G. Lattanzi, A. Jonas, T. Surrey, E. Frey,and E. L. Florin. Thermal fluctuations of grafted micro-tubules provide evidence of a length-dependent persistencelength. Proc. Natl Acad. Sci. USA 103:10248–10253, 2006.
29Peloquin, J., Y. Komarova, and G. Borisy. Conjugation offluorophores to tubulin. Nat. Methods 2:299–303, 2005.
30Politis, D. N., and J. P. Romano. Subsampling. New York:Springer, 1999.
31R Development Code Team. R Code, 2011.32Raviv, U., T. Nguyen, R. Ghafouri, D. J. Needleman,Y. Li, H. P. Miller, L. Wilson, R. F. Bruinsma, and C. R.Safinya. Microtubule protofilament number is modulatedin a stepwise fashion by the charge density of an envelopinglayer. Biophys. J. 92:278–287, 2007.
33Shelanski, M. L., F. Gaskin, and C. R. Cantor. Microtu-bule assembly in the absence of added nucleotides. Proc.Natl Acad. Sci. USA 70:765–768, 1973.
34Taute, K. M., F. Pampaloni, E. Frey, and E. L. Florin.Microtubule dynamics depart from the wormlike chainmodel. Phys. Rev. Lett. 100:028102, 2008.
35Valdman, D., P. J. Atzberger, D. Yu, S. Kuei, and M. T.Valentine. Spectral analysis methods for the robust mea-surement of the flexural rigidity of biopolymers. Biophys. J.102:1144–1153, 2012.
36Wakida, N. M., C. S. Lee, E. T. Botvinick, L. Z. Shi,A. Dvornikov, and M. W. Berns. Laser nanosurgery ofsingle microtubules reveals location-dependent depoly-merization rates. J. Biomed. Opt. 12:024022, 2007.
37Zhang, D., K. D. Grode, S. F. Stewman, J. D.Diaz-Valencia, E. Liebling, U. Rath, T. Riera, J. D. Currie,D. W. Buster, A. B. Asenjo, H. J. Sosa, J. L. Ross, A. Ma,S. L. Rogers, and D. J. Sharp. Drosophila katanin is amicrotubule depolymerase that regulates cortical-microtu-bule plus-end interactions and cell migration. Nat. CellBiol. 13:361–370, 2011.
HAWKINS et al.