pg 23. INTERVIEW: Dr. Harikishan Koppula Reddy pg 25...
32
1 ST – 15 TH July 2014 . Vol 1 Issue 6 . For Private Circulation Only pg 23. INTERVIEW: Dr. Harikishan Koppula Reddy pg 25. Indian Economy – Trend indicators
Transcript of pg 23. INTERVIEW: Dr. Harikishan Koppula Reddy pg 25...
1ST – 15TH July 2014 . Vol 1 Issue 6 . For Private Circulation Only
pg 23. INTERVIEW: Dr. Harikishan Koppula Reddy
pg 25. Indian Economy – Trend indicators

3GROUND ZERO GROUND ZERO 1 - 15 July 2014 1 - 15 July 2014 2
VOL 1 . ISSUE 5 . 1ST - 15TH JULY 2014
Vineet Bhatnagar- Managing Director and CEO
EDITORIAL BOARD:Naveen Kulkarni Manish AgarwallaKinshuk Bharti Tiwari Dhawal Doshi
COVER & MAGAZINE DESIGN Chaitanya Modak, www.inhousedesign.co.in
FOR EDITORIAL QUERIES:PhillipCapital (India) Private LimitedNo. 1, 2nd Floor, Modern Centre, 101 K.K. Marg, Jacob Circle, Mahalaxmi, Mumbai 400 011
RESEARCH Automobiles Deepak Jain, Priya Ranjan
Banking, NBFCs Manish Agarwalla, Sachit Motwani, Paresh Jain
Consumer, Media, Telecom Naveen Kulkarni, Vivekanand Subbaraman, Manish Pushkar
Cement Vaibhav Agarwal
Economics Anjali Verma
Engineering, Capital Goods Ankur Sharma, Aditya Bahety
Infrastructure & IT Services Vibhor Singhal, Varun Vijayan
Metals Dhawal Doshi, Dharmesh Shah
Mid-caps Vikram Suryavanshi
Oil & Gas, Agri Inputs Gauri Anand, Deepak Pareek
Pharmaceuticals Surya Patra
Retail, Real Estate Abhishek Ranganathan, Neha Garg
Technicals Subodh Gupta
Production Manager Ganesh Deorukhkar
Database Manager Vishal Randive
Sr. Manager – Equities Support Rosie Ferns
SALES & DISTRIBUTION Kinshuk Tiwari, Ashvin Patil, Shubhangi Agrawal, Kishor Binwal, Sidharth Agrawal, Dipesh Sohani, Varun Kumar
GROUND ZERO - PREVIOUS ISSUES
1st June 2014 Issue 4
1st May 2014 Issue 3
16th June 2014 Issue 5

3GROUND ZERO GROUND ZERO 1 - 15 July 2014 1 - 15 July 2014 2
4. COVER STORY: Diesel Gensets - In a sweet spot
Ground Zero explores the dynamics of the Indian diesel genset industry which is entering a sweet spot over the next two years
23. INTERVIEW: Dr. Harikishan Reddy
on the opportunities and challenges in the road sector
25. Indian Economy: Trend indicators
27. PhillipCapital Coverage Universe: Valuation Summary
LETTER FROM THE MANAGING DIRECTORIn his election campaigns, PM Modi promised un-
interrupted electricity supply to millions of house-
holds across India that are currently reeling under
power deficits. This promise is unlikely to be met
over the next two years as significant ramp-up in in
coal production seems remote even as a pickup in
economic activity will lead to higher power deficits.
The industrial power demand deficit will need to
be bridged by alternate sources like diesel-Genset
(DG) based power, which is the most reliable and
time-tested option despite its high per unit costs.
The DG set market in India contracted by 15% in
FY14 and FY15 is likely to be the bottom for this
market.
Our cover story on prognosis for demand of DG
sets written by our capital goods and power sector
analysts Ankur Sharma and Aditya Bahety explores
the changing regulatory environment and its impact
on the industry structure. Further consolidation of
an already concentrated DG set market will have an
incisive impact on profitability, making the segment
more attractive.
This edition also examines the issues and challeng-
es faced by build-operate-transport road develop-
ers, key participants in fulfilling the 30-kilometer/
day road construction target of the transport
ministry.
And finally, the much awaited budget is round the
corner. The government’s reformist agenda will be
put to a stern test as we grapple with a crippling
El Nino and dangerous signals emanating from the
Middle East.
Best Wishes
Vineet
CONTENTS

5GROUND ZERO GROUND ZERO 1 - 15 July 2014 1 - 15 July 2014 4
Cummins genset being used in a remote area
15% - 20% of DG volumes are supplied by the unorganised sector

5GROUND ZERO GROUND ZERO 1 - 15 July 2014 1 - 15 July 2014 4
COVER STORY
After a sharp slowdown in FY14, the Indian diesel genset industry is set for a rebound from
FY16 onwards. This would be lead by a revival in infrastructure spending and get a further
boost as commercial and residential real estate picks up alongside industrial spending.
Stagnant to muted coal production growth is expected to lead to higher power deficits
and increased DG demand. The competitive dynamics of the industry are also set to see
a sea change with the new CPCB II norms – more so in the lower kva (<180kva) where
the unorganized sector has ~15-20% of the market. These players may be forced to exit
the industry and their market share taken by players such as Cummins India, KOEL and
Mahindra.
BY ANKUR SHARMA & ADITYA BAHETY
pg. 6 Diesel Gensets in a sweet spot Increased genset demand amidst short fall in coal production___________________________________________pg.9 Slow down in FY14 a short term blip So what led to the slowdown in demand for DG sets over the last one year?___________________________________________pg.14 Top 5 player have 80% market share Competitive intensity and market share___________________________________________pg.16 New CPCB II norms from July 1, 2014 Are the new CPCB norms really a game changer for the industry in terms of competition?___________________________________________pg.19 Profiles Key players in the Indian Diesel Generator Set market___________________________________________

7GROUND ZERO GROUND ZERO 1 - 15 July 2014 1 - 15 July 2014 6
In 2003, the Indian government had set a
target of “Power for all” by 2012. It was
expected that the Electricity Act would usher
in a new era of private participation in power,
open up access, and cause a sharp reduction in
T&D losses and hence availability of cheap power
to the masses.
While much water has flown under the bridge
since then, India remains a power-starved coun-
try with many states continuing to face severe
power shortages, especially in the summers; this
is particularly true for the Southern states (Tamil
Nadu and Andhra Pradesh — now Telangana and
Seemandhra), Uttar Pradesh, Haryana, and Bihar.
Availability of 24/7 reliable power from the grid
remains a dream in most states even today, and
Increased genset demand amidst short fall in coal production
D I E S E L G E N S E T I N A S W E E T S P O T
Power deficit by region
the poor financial condition of SEBs implies further
power cuts for the consumers and the industry.
This in turn has provided a huge opportunity for
diesel genset manufacturers, who continue to add
around 9GW of capacity every year. To put it in
perspective, over the last three years, India has
added 17-18GW of power capacity every year
(ex-renewables), but a large portion of the new
capacity continues to operate at around 60-65%
utilization levels, not because of lack of demand,
but mainly because there is a shortage of coal
to fire the power plants. We believe that DG
set manufacturers could be in a sweet spot over
the next two years if economic growth revives and
Coal India is unable to ramp up capacity signif-
icantly – this may result in higher power deficits
and increased demand for backup power.
Continued increase in losses has led to higher power cuts by discoms (Rs bn)
7GROUND ZERO GROUND ZERO 1 - 15 July 2014 1 - 15 July 2014 6
Sour
ce: A
mfi
Indi
a, W
orld
Gol
d Co
uncil
, Phi
llipC
apita
l Ind
ia R
esea
rch
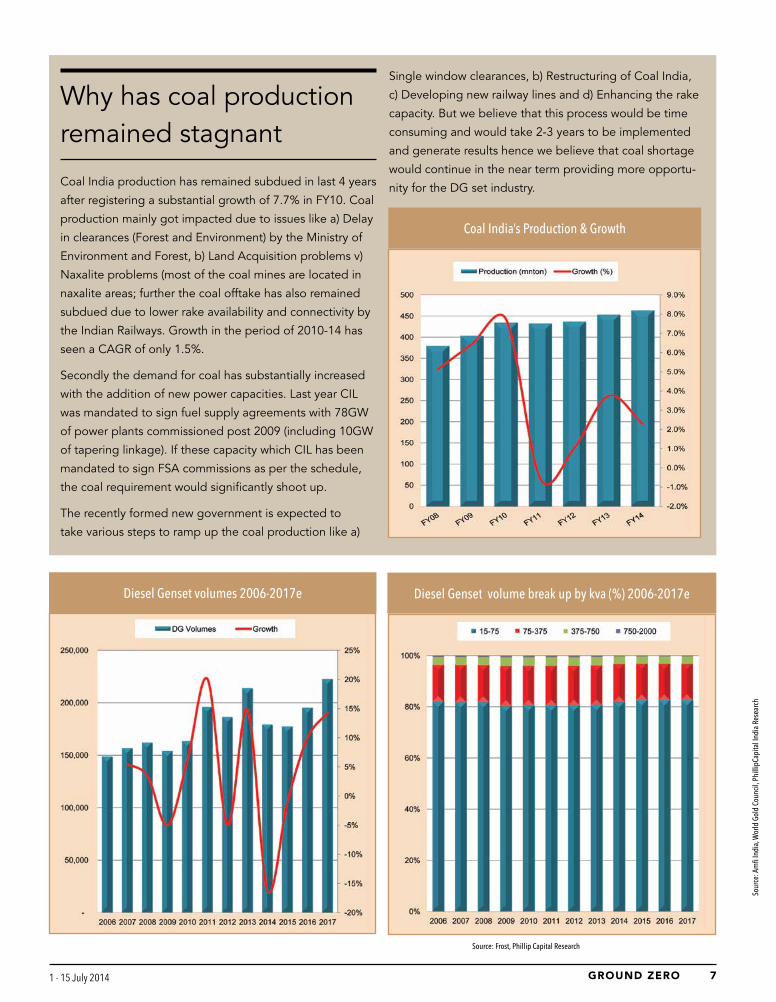
Coal India production has remained subdued in last 4 years
after registering a substantial growth of 7.7% in FY10. Coal
production mainly got impacted due to issues like a) Delay
in clearances (Forest and Environment) by the Ministry of
Environment and Forest, b) Land Acquisition problems v)
Naxalite problems (most of the coal mines are located in
naxalite areas; further the coal offtake has also remained
subdued due to lower rake availability and connectivity by
the Indian Railways. Growth in the period of 2010-14 has
seen a CAGR of only 1.5%.
Secondly the demand for coal has substantially increased
with the addition of new power capacities. Last year CIL
was mandated to sign fuel supply agreements with 78GW
of power plants commissioned post 2009 (including 10GW
of tapering linkage). If these capacity which CIL has been
mandated to sign FSA commissions as per the schedule,
the coal requirement would significantly shoot up.
The recently formed new government is expected to
take various steps to ramp up the coal production like a)
Diesel Genset volumes 2006-2017e
Single window clearances, b) Restructuring of Coal India,
c) Developing new railway lines and d) Enhancing the rake
capacity. But we believe that this process would be time
consuming and would take 2-3 years to be implemented
and generate results hence we believe that coal shortage
would continue in the near term providing more opportu-
nity for the DG set industry.
Coal India’s Production & Growth
Diesel Genset volume break up by kva (%) 2006-2017e
Source: Frost, Phillip Capital Research
Why has coal production remained stagnant

9GROUND ZERO GROUND ZERO 1 - 15 July 2014 1 - 15 July 2014 8
Description Rs per unit
Solar Rs8-9
Domestic Coal Rs3 – 4
Hydro Rs2-3
DG set Rs15-18
Wind Rs5-6
Cost of power generated
Key players operating in the Indian DG industry
include Cummins India, Kirloskar Oil Engines, Ma-
hindra Powerol, Greaves Cotton, Ashok Leyland,
Eicher, and Caterpillar/Perkins. While Cummins
Engine/Generator set supplier 15-75 kVA 75-375 kVA 375-750 kVA Above 750 kVA Brand
Cummins India Ltd u n n n Cummins
Kirloskar Oil Engines Ltd l l l Kirloskar Green
Mahindra n u Mahindra Powerol
Ashok Leyland u l Leypower
Eicher India l Multi-brand
Escorts India u Multi-brand
Greaves Cotton Ltd u l u Greaves Whisper
Kirloskar Electric u u u Kirloskar Bliss
Caterpillar India u l l CAT
MTU India u MTU
l l u nMajor Presence Moderate Presence Low Presence Market Leader Future Focus
Market presence by different nodes of the DG set market
India dominates the mid- to high-kva segments
(ratings >180kva), Kirloskar Oil Engines is a market
leader in the low- to mid-kva segments.
Source: Frost, Phillip Capital Research
With bulk diesel prices linked to the market from
last year, cost of power generation using diesel
gensets has gone up to Rs15-18/unit, which ap-
pears to be quite expensive vs. traditional sources
of power generation such as coal, hydro, wind,
gas, and solar, whose cost of generation is in the
range of Rs3 to Rs9 per unit. However, given the
poor quality of grid power, the dependency on DG
sets for backup power has continued to increase
in India.
High per unit cost not a deterrent for DG set users
9GROUND ZERO GROUND ZERO 1 - 15 July 2014 1 - 15 July 2014 8
S L O W D O W N I N F Y 1 4 A S H O R T T E R M B L I P
So what led to slowdown in demand for DG sets over the last one year?
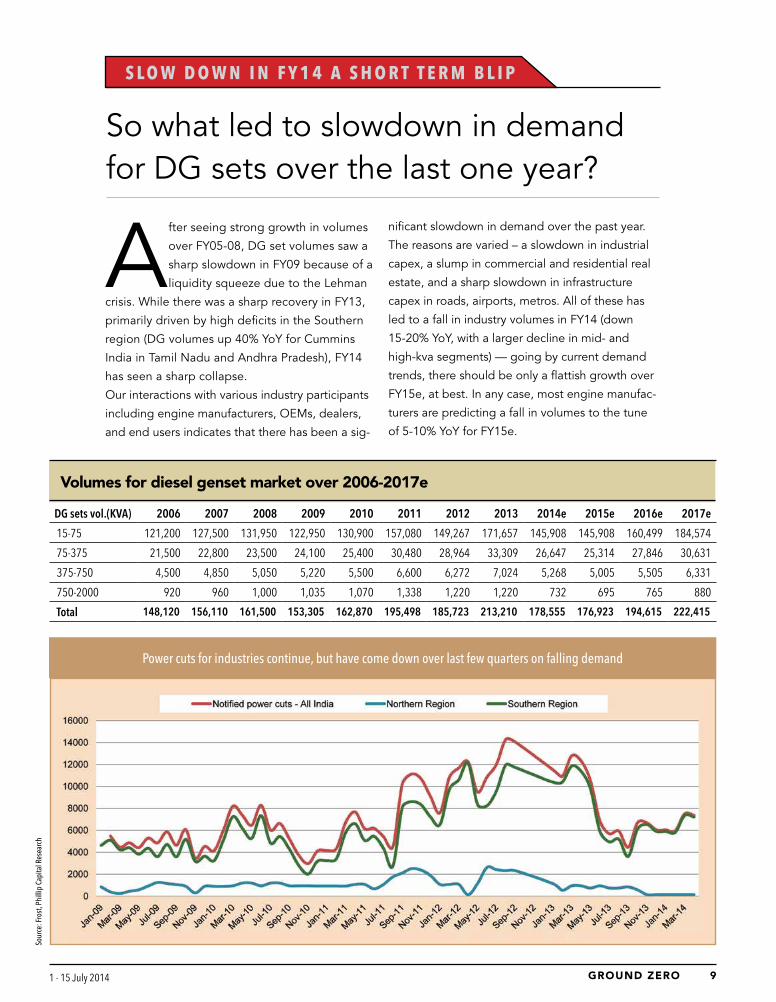
A fter seeing strong growth in volumes
over FY05-08, DG set volumes saw a
sharp slowdown in FY09 because of a
liquidity squeeze due to the Lehman
crisis. While there was a sharp recovery in FY13,
primarily driven by high deficits in the Southern
region (DG volumes up 40% YoY for Cummins
India in Tamil Nadu and Andhra Pradesh), FY14
has seen a sharp collapse.
Our interactions with various industry participants
including engine manufacturers, OEMs, dealers,
and end users indicates that there has been a sig-
nificant slowdown in demand over the past year.
The reasons are varied – a slowdown in industrial
capex, a slump in commercial and residential real
estate, and a sharp slowdown in infrastructure
capex in roads, airports, metros. All of these has
led to a fall in industry volumes in FY14 (down
15-20% YoY, with a larger decline in mid- and
high-kva segments) — going by current demand
trends, there should be only a flattish growth over
FY15e, at best. In any case, most engine manufac-
turers are predicting a fall in volumes to the tune
of 5-10% YoY for FY15e.
Power cuts for industries continue, but have come down over last few quarters on falling demand
DG sets vol.(KVA) 2006 2007 2008 2009 2010 2011 2012 2013 2014e 2015e 2016e 2017e
15-75 121,200 127,500 131,950 122,950 130,900 157,080 149,267 171,657 145,908 145,908 160,499 184,574
75-375 21,500 22,800 23,500 24,100 25,400 30,480 28,964 33,309 26,647 25,314 27,846 30,631
375-750 4,500 4,850 5,050 5,220 5,500 6,600 6,272 7,024 5,268 5,005 5,505 6,331
750-2000 920 960 1,000 1,035 1,070 1,338 1,220 1,220 732 695 765 880
Total 148,120 156,110 161,500 153,305 162,870 195,498 185,723 213,210 178,555 176,923 194,615 222,415
Volumes for diesel genset market over 2006-2017e
Sour
ce: F
rost
, Phi
llip
Capi
tal R
esea
rch

11GROUND ZERO GROUND ZERO 1 - 15 July 2014 1 - 15 July 2014 10
Power deficits certainly help revive demand in
the short term (note the current surge in volumes
in North India and the sharp jump in volumes in
Tamil Nadu and Andhra Pradesh in FY13). Howev-
er, a repeat of the sustained growth in volumes (as
seen in 2005-2008) requires a revival of spending
on infrastructure, real estate, and industrial capex.
Ratings Segment End Use Industries
<200 kVA Telecom(15-75kva), Retail sales, Small scale Industries Units
200-375 kVA Real Estate, Healthcare
375-750 kVA Large Industrial Applications, IT, ITES, Hospitals, Hotels, Healthcare
750-3,000 kVA Prime Power
Usage of Diesel Generators by sector and ratings
Segment % share Kva range Main DG suppliers
Telecom 10% 15-75 Mahindra, KOEL, Eicher
Large Industries 20% 375-2000 Cummins, KOEL, CAT, Perkins, Greaves, Leyland
Hospitals 15% 375-750 Cummins, KOEL, CAT, Perkins, Greaves, Leyland
Hotels 15% 75-375 Cummins, KOEL, CAT, Perkins, Greaves,
IT/ITES 12% 375-750 Cummins, KOEL, CAT, Perkins
Residential real Estate 20% 375-750 Cummins, KOEL, CAT, Perkins
Others 13%
Segment-wise end market for diesel gensets
Cummins DG set being used in an industry
Strong correlation between IIP and DG set volumes
Our interaction with various industry participants
indicates that FY15 could be the bottom for
the market and it should revive from FY16. There
is a belief that the new government at the centre
would help revive economic growth via increased
infra spending — this will in turn benefit DG set
manufacturers.
Commercial real estate including hotels, IT/ITES
(amongst the key end-markets for DG players) is
starting to see a fall in vacancy rates and our inter-
action with channel partners indicates that enquiry
levels are starting to improve for developers in
Noida, Bangalore, and parts of Mumbai. The rise
in demand in Bangalore is being led by the IT
sector — Cummins India has a 75-80% share in
the IT/ITES space in Karnataka.
11GROUND ZERO GROUND ZERO 1 - 15 July 2014 1 - 15 July 2014 10
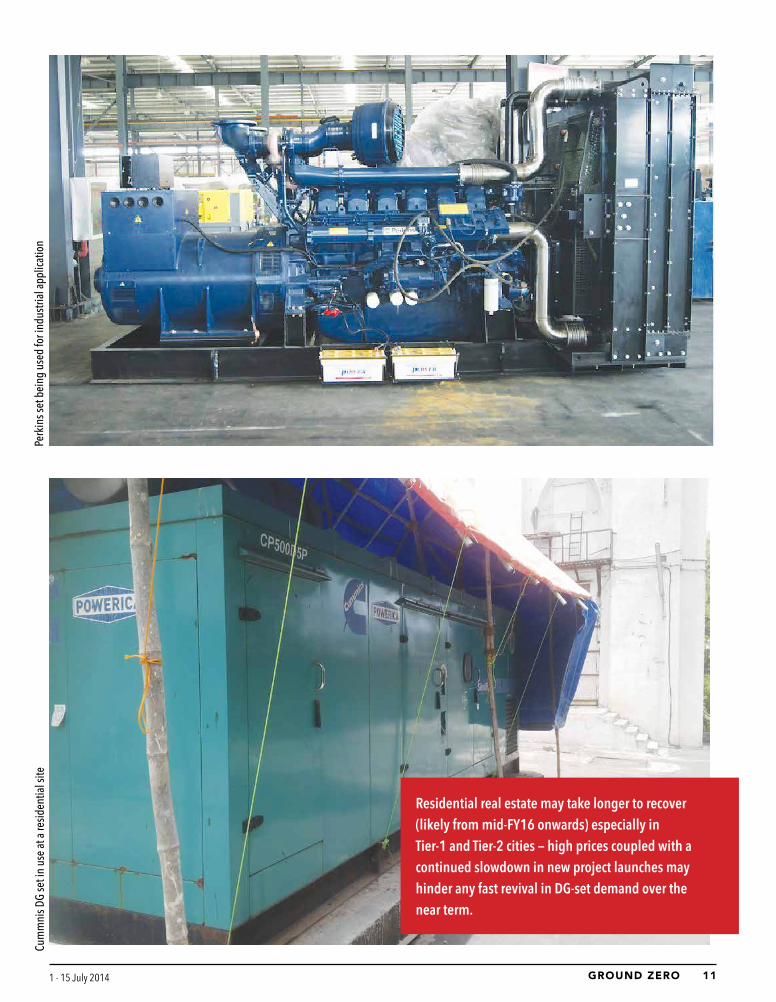
Residential real estate may take longer to recover (likely from mid-FY16 onwards) especially in Tier-1 and Tier-2 cities — high prices coupled with a continued slowdown in new project launches may hinder any fast revival in DG-set demand over the near term.
Perk
ins s
et b
eing
use
d fo
r ind
ustri
al a
pplic
atio
nCu
mm
nis D
G se
t in
use
at a
resid
entia
l site

13GROUND ZERO GROUND ZERO 1 - 15 July 2014 1 - 15 July 2014 12
Cummins DG set being used at the Mumbai monorail site
There is a shift in the nature of the demand for DG sets — while they were previously used as a prime power source, now as much as 70-80% of sets sold in the country are used mainly for standby power. This implies there is a clear shift in usage of DG sets as backup power in case of power failure.
Application-wise usage of DG setsBase Load - 80% of load is usedPrime Load - 100% of load is usedStandby - Once in 12 hrs
A restarting of stalled road projects along with new road projects over the next few quarters coupled with a pickup in metro/mono rail construction could also revive demand for DG sets. Our discussions with NHAI (recently in Delhi) indicated that they have already done a lot of work to bring the road sector back into shape – NHAI is targeting road awards of ~8,500kms in FY15 vs. 1,500kms in FY14. Around 6,000kms of EPC projects are proposed to be awarded — this, along with a restarting of stalled projects will lead to higher spending in road construction.

13GROUND ZERO GROUND ZERO 1 - 15 July 2014 1 - 15 July 2014 12
Description Scale of Ops Sales Model OEM’s Sales to dealers Engine Types
Caterpillar National OEM, Dealer Driven 2 Built Gensets Electronically Controlled
Cummins National OEM Driven, Service is Cummins 5 Engines Mechanically Controlled
Greaves Cotton National Procures engines to make gensets, Service is Greaves 6 Fully Built Gensets Mechanically Controlled
KOEL National OEM Driven, Service is KOEL 13 Engines Mechanically Controlled
MTU National OEM, Dealer driven 5 Engines Electronically Controlled
Perkins National OEM Driven 2 Engines Electronically Controlled
Volvo Penta Regional Direct Selling None Engines Electronically Controlled
Mahindra Powerol South 20 OEM and 3000 Dealer driven Fully Built Gensets Mechanically Controlled
Company-wise scale of operation and distribution channel
Dealer/Distributors End-users3
Diesel Generator SetEngine Manufacturer
Third-party OEMs
GOEM/Own Genset
1
2
1. Engine manufacturers supplies engine to exclusive GOEM, which later integrates engines, alternators and panels and
markets them to end users through its dealer network/distributors (for e.g. Cummins India Ltd, KOEL and Caterpillar.)
2. Engine manufacturers supplies engine to third-party assemblers and OEMs, which later sells the generator sets to
end users through its service dealers/distributor network (for example Mahindra, Eicher, Excorts, Ashok Leyland, and
so on)
3. Engine manufacturers assemble generator sets at their end and sell to the end users either through dealers or direct-
ly to the end-users (for e.g., Greaves Cotton Ltd and also in limited cases suppliers such Mahindra and KOEL)
Distribution channels used for Diesel Gensets
Diesel Generator Set Market (15-2,000 kVA): Distribution Channels (India), 2014
15GROUND ZERO GROUND ZERO 1 - 15 July 2014 1 - 15 July 2014 14
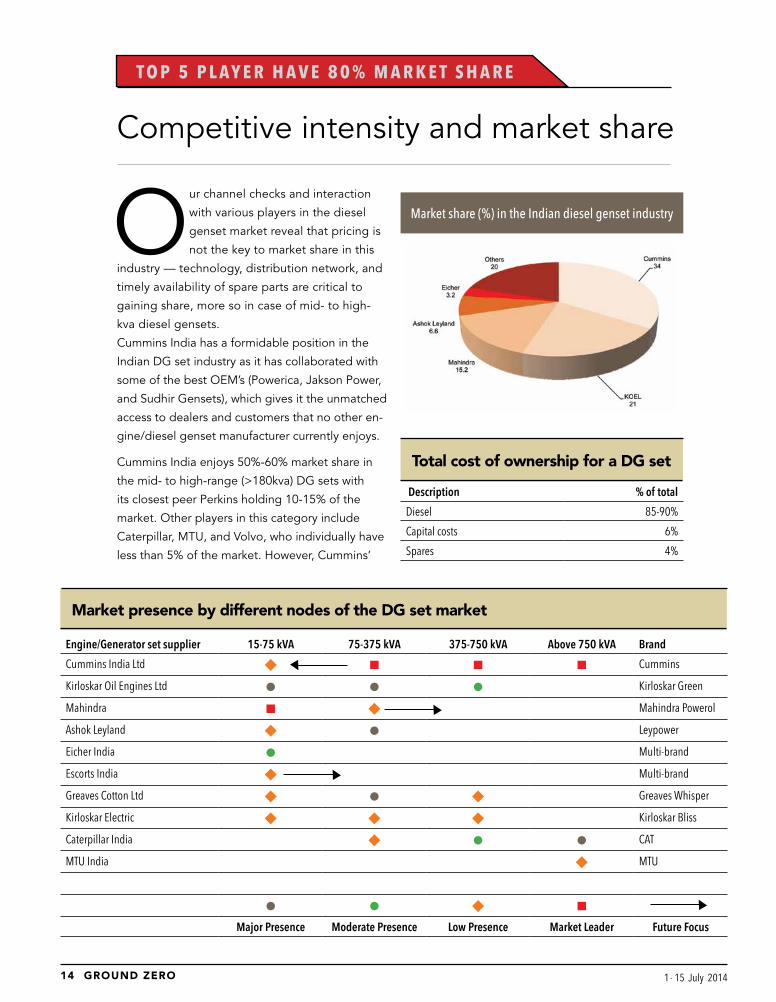
Competitive intensity and market share
T O P 5 P L A Y E R H A V E 8 0 % M A R K E T S H A R E
Our channel checks and interaction
with various players in the diesel
genset market reveal that pricing is
not the key to market share in this
industry — technology, distribution network, and
timely availability of spare parts are critical to
gaining share, more so in case of mid- to high-
kva diesel gensets.
Cummins India has a formidable position in the
Indian DG set industry as it has collaborated with
some of the best OEM’s (Powerica, Jakson Power,
and Sudhir Gensets), which gives it the unmatched
access to dealers and customers that no other en-
gine/diesel genset manufacturer currently enjoys.
Cummins India enjoys 50%-60% market share in
the mid- to high-range (>180kva) DG sets with
its closest peer Perkins holding 10-15% of the
market. Other players in this category include
Caterpillar, MTU, and Volvo, who individually have
less than 5% of the market. However, Cummins’
Market share (%) in the Indian diesel genset industry
Description % of total
Diesel 85-90%
Capital costs 6%
Spares 4%
Total cost of ownership for a DG set
Engine/Generator set supplier 15-75 kVA 75-375 kVA 375-750 kVA Above 750 kVA Brand
Cummins India Ltd u n n n Cummins
Kirloskar Oil Engines Ltd l l l Kirloskar Green
Mahindra n u Mahindra Powerol
Ashok Leyland u l Leypower
Eicher India l Multi-brand
Escorts India u Multi-brand
Greaves Cotton Ltd u l u Greaves Whisper
Kirloskar Electric u u u Kirloskar Bliss
Caterpillar India u l l CAT
MTU India u MTU
l l u nMajor Presence Moderate Presence Low Presence Market Leader Future Focus
Market presence by different nodes of the DG set market

15GROUND ZERO GROUND ZERO 1 - 15 July 2014 1 - 15 July 2014 14
dominance could come under threat with Per-
kins starting a domestic manufacturing plant for
engines in Aurangabad from December2014 —
its aim is to increase its market share to 35-40%
from the current 10-15% it enjoys in the >750kva
segments. Perkins has already started adding to its
dealer network while simultaneously increasing the
indigenized component of its DG sets to suit the
Indian operating environment.
KOEL, along with Mahindra, is amongst the
market leaders in sets below the 75kva range.
Mahindra Powerol is the market leader in the
15-75kva segment with a 40% share followed by
KOEL at 25% share. Within the 75-375kva range,
Cummins India regains its leadership with a 45%
share followed by KOEL at 28%.
In terms of reliability and pricing, Caterpillar, which
operates primarily in 750kva and 1,000kva, is con-
sidered the most reliable and is extensively used
in critical applications in O&G and defense. This
is also the reason that it commands the highest
premium over peers. Next in line are MTU and
Perkins in terms of pricing, followed by Cummins
India whose engines are still mechanical engines
(vs. electronic). KOEL, Mahindra, and Leyland
round off the list of big players in the DG industry
(see table below).
Description Presence Market Share Manufacturing Product Range Distribution & Spares
Caterpillar >20 Year 2% Hosur – Up to 750 KVA 200-3000 KVA 140 Touch points
Cummins >20 Year 34% Pune and Phaltan 7-3000 KVA 400 Touch Points
Greaves Cotton <10 Year NA Aurangabad 30-400 KVA 65 Touch Points
KOEL >15 Year 20% Pune-Up to 750kva Up to 750 KVA 338 Touch Points
MTU <10 Year <5% Imported 200-3000 KVA NA
Perkins >10 Year 10% Imported 200-2500 KVA NA
Volvo Penta >15 Year <5% Imported 200-600 KVA NA
Mahindra Powerol >10 year 15% Domestic 5-500kva 300
Diesel Genset Industry presence and market share
Brand- ranking in the Indian DG set market
l Caterpillar
l MTU / Perkins
l Cummins India
l Kirloskar Oil Engine/ Mahindra/ Leyland
Unorganised player DG set used in fields

17GROUND ZERO GROUND ZERO 1 - 15 July 2014 1 - 15 July 2014 16
Are the new CPCB norms really a game changer for the industry in terms of competition?
N E W C P C B I I N O R M S F R O M J U L Y 1 , 2 0 1 4
The Ministry of Environment and Forests
has notified that the CPCB-2 norms will
be implemented from 1st July 2014
(CPCB stands for Central Pollution
Control Board). These norms have tightened the
existing emission requirements on NOX and HC
(see table).
We are given to understand from our channel
checks that starting from 1st July 2014, engine
manufactures and OEMs will stop shipping and
selling non-compliant engines and DG sets. While
larger players such as Cummins India, KOEL,
Caterpillar/Perkins, MTU, Ashok Leyland, would be
compliant with the new norms, smaller unorgan-
ized players are going to have trouble in achieving
compliance — this should benefit larger players,
more so in the low-kva segments where the unor-
ganized sector has a larger presence. In our view,
Cummins India, which has now started focusing
on the low-kva range (up to 75kva) could be a key
beneficiary as its market share in this segment is
around 10%.
Key changes that need to be made to the ex-
isting mechanical engines would be in terms
of turbochargers, air and fuel filters, and piston
bore — this would increase the cost and price of
the engine by 10-15%. Most engine companies
would not want to convert the existing mechanical
engines to electronic (direct fuel injection) right
away, since it would entail a higher increase in
cost/price, which the market may not be willing to
bear just yet.
Power Category Emission Limits
Description NOx +HC CO PM Smoke Limit
Up to 19 KW 7.5 3.5 0.3 0.7
More than 19 KW up to 75 KW 4.7 3.5 0.3 0.7
More than 75 KW up to 800 KW 4 3.5 0.2 0.7
New emission norms for DG set
Key parts which together constitute an engine

17GROUND ZERO GROUND ZERO 1 - 15 July 2014 1 - 15 July 2014 16
Channel view on ‘pre buying’ and FY15 sales for diesel
gensets
Jakson Power: Our meetings with the top management
of Jakson Power, a Noida-based power solutions company
brought 3 things into focus:
a) Management see Q1FY15 volumes rising as much as 30-
40% QoQ (on very weak volumes in Q3FY14 and Q4FY14),
driven by pre buy and powe r shortages in the North. The
management said they will see the sharp jump not only
because of power shortages, but also pre buying, since
the new CPCB norms are coming into effect from 1st July
2014. Stronger-than-expected pre buying over the past few
months coupled with improvement in demand has led to
lower inventory in the channel (15-30 days) as well. How-
ever, management expects Q2FY15 to be sluggish as most
demand will get pulled in to Q1 because of the pre buying.
b) Management expects volumes for CY14 to be flat (at
best) with the possibility of a single-digit fall. However, they
see CY15 as a far better year, with a recovery in volumes
driven by a pickup in infrastructure and real estate (com-
mercial and residential). With the DG market moving from
continuous-use to standby-use, the need for DG sets is
expected to endure with the industry expected to revive to
a secular growth trend from CY15 onwards.
c) The CPCB-2-compliant engines will be shipped out to
the dealers over the next one month — while the man-
agement did not quantify the price increase, it said it will
continue to maintain the premium it charges over compe-
tition. While Cummins sets are already compliant with the
new norms, some of its peers may not be able to meet the
deadline.
Channel check indicate muted pre buy in South and
West India
We met with the largest distributor of Perkins (key compet-
itor for Cummins India in the >750kva engines segment).
Key takeaways are:
a) Muted prebuy in Q115; inventory now at ~1-1.5 months
in the channel. As per management, DG set volumes
had seen a muted pre buy before the implementation of
the new CPCB II norms which come into effect from 1st
July, 2014. While there had been a rise in enquiries from
customers, the same had not translated into actual sales.
This is in contrast to our recent discussions with one of the
largest OEM’s for Cummins India for North India whose
volumes were up 30% QoQ in Q115 on a strong pre buy
and high power cuts over the past 2 months. Perkins is
present primarily in the >750kva nodes while in our view,
a prebuy is more likely to be evident in the lower and mid
kva nodes which is more price sensitive and where Perkins
has a limited presence. Inventory in the channel had also
come down to a manageable 1-1.5 months from the previ-
ous +2 months seen in Q414.
b) Engines from 400kva -750kva have been certified
compliant; consolidation likely in the lower kva segment.
As per management, Perkins engines in the nodes from
400kva-750kva have been certified compliant for sale in In-
dia; engine prices could increase by 10-15% on the engine
and 6-10% for the diesel genset. These engines would be
electro mechanically controlled and in compliance with the
CPCB II norms. Our discussions with other engines manu-
facturers indicate that engine prices across manufacturers
are expected to see an increase of 10-12%.
c) Perkins plant in Aurangabad to start by Dec’, 2014; fo-
cused on growing market share in >750kva segment. The
Perkins plant for the 4000 series (>750kva) is expected to
be commissioned by Dec’, 2014 (originally to have started
in end CY13). The plant would have an initial capacity of
3,000 engines scalable to 5,000 engines in the second
phase. Note that Perkins already has a plant in China for
lower kva engines (5-200kva, 1100 series) and therefore
there are no plans to set up a lower kva plant in India in
the near future; however, Perkins could look at domestic
manufacturing of the mid range (400-600kva) over the next
few years.
d) Telangana an emerging opportunity for diesel genset
manufacturers on high power cuts. Media reports suggest
strong power cuts across Telangana and Seemandhra over
the past month with full day power cuts for industries since
last week (www.thehindu.com/news/cities/Hyderabad/
power-holidays-for-industries-from-today/article6155974.
ece). We note that the DG market in Andhra Pradesh had
been very muted over the last 1.5 years and could see a
bounce post the recent surge in power cuts. Management
has cited that there was a revival in volumes from the phar-
maceutical sector in Q115 in Andhra Pradesh.

19GROUND ZERO GROUND ZERO 1 - 15 July 2014 1 - 15 July 2014 18
What goes into making a diesel genset? The engine is the heart of the diesel genset
Diesel Engine
Accessories Foundation
Fuel Control
Excitation Control
A.C. Generator Controls Load
5Cs of an Engine: Cylinder block, Cylinder head, Crank shaft, Cam shaft and Connecting rods
Typical layout of a DG set assembly

19GROUND ZERO GROUND ZERO 1 - 15 July 2014 1 - 15 July 2014 18
Key players in the Indian Diesel Generator Set market
P R O F I L E S
Cummins India
Cummins India has an India presence for the past
52 years and has built a very strong reputation
by virtue of its strong dealer network, product
quality, and after-sales support. It supplies engines
to three OEMs — Powerica, Jakson Power, and
Partner Incorporation Areas of Operation Manufacturing
Jaksons 1947 North and North-East India Daman, Jammu
Partner P /Powerica 1984 West and South Daman, Bangalore, Dadra, and Nagar Haveli
Sudhir Gensets 1973 North and North-West India Silvassa, Jammu, Gurgaon
OEMs for Cummins DG sets in India by region
Sudhir Gensets. In turn, the OEMs assemble the
DG sets by adding on alternators, canopies, and
control panels — these are then sent to dealers
across India for sale to customers.
Cummins presence across DG sets

21GROUND ZERO GROUND ZERO 1 - 15 July 2014 1 - 15 July 2014 20
Caterpillar India
In India, Caterpillar sells 200-3,000KVA diesel generator sets,
gas-based generator sets, and also rents out 200-2,000 KVA
gensets. Caterpillar has a manufacturing facility in Hosur,
Tamil Nadu. The unit specializes in the design and manu-
facture of internal combustion engines, genset packages,
and components. The product variants in a wide-ranging
perspective are diesel engines, gas-engine long blocks, and
electric power generator sets. Product ratings range from
200 kVA to 2,000 kVA depending on the various families like
3300, 3400, C series, and 3500. There are more than 300
employees in this facility.
Caterpillar DG set used in industry Factory layout
Hosur currently has an extensive customer base across India,
China, Indonesia, Australia, Europe, and North America. The
unit assembles 200-3000kva engines, makes DG engines
of up to 750kva, and imports/assembles >750kva. It has a
machining shop for marking components that fit into the en-
gine. It produces ~400 engines a month, i.e., ~5000 engines
per annum using a single shift. It has the capacity to double
production by using two shifts.
Perkins India
Starting production in India from October, 2014 onwards.
Perkins is developing manufacturing facility in Aurangabad,
Shendra Industrial Area. The facility will manufacture its 4000
Series engines, with power outputs from 700- to 2000-kVA.
The estimated cost is around Rs 7.5bn with production ca-
pacity of 3,000 units that will be extended to 5,000 units. The
new plant will help meet growing demand for engines from
Asian markets. The 120,000 sq. mt. site (including a 40,000
sq. mt. manufacturing area), will also undertake machining,
assembly and test, paint and packaging.
Channel Partners
In India, Perkins has two distribution partners — GMMCO
Power and Powerparts Private Limited. GMMCO mainly con-
centrates in the Southern and Western states while Power-
parts Pvt Ltd takes care of the Northern and Eastern region.
Gmmco Power
Territories supported — Andaman and Nicobar Islands,
Andhra Pradesh, Chattisgarh, Dadra and Nagar Haveli, Da-
man and Diu, Goa, Gujarat, Karnataka, Kerala, Lakshadweep,
Dealer network

21GROUND ZERO GROUND ZERO 1 - 15 July 2014 1 - 15 July 2014 20
Madhya Pradesh, Maharashtra, Pondicherry, Tamil Nadu.
P owerparts Private Limited
Territories supported — Arunachal Pradesh, Assam, Bihar,
Chandigarh, Delhi, Haryana, Himachal Pradesh, Jammu
and Kashmir, Jharkhand, Manipur, Meghalaya, Mizoram,
Nagaland, Orissa, Punjab, Rajasthan, Sikkim, Tripura, Uttar
Pradesh, Uttarakhand, and West Bengal
Kirloskar Oil Engine (KOEL)
KOEL is one of the major DG set manufacturers in India,
especially in the low- to mid-end segment. It has a presence
in the power generation sector and caters to agriculture and
industrial segments. It also exports engines to the Middle
East and African markets. Kirloskar has four manufacturing
facilities — one each in Nasik, Pune, Rajkot, and Kolhapur.
Agri engines
Power Generation Industrial Engines
Large engines (mainly used in captive power plants)

23GROUND ZERO GROUND ZERO 1 - 15 July 2014 1 - 15 July 2014 22
Mahindra Powerol
Mahindra & Mahindra entered the DG business
under the brand name Mahindra Powerol. It can
produce DG sets from 5kva to 500kva. Mahindra
has a strong presence in the telecom industry
with most of the telecom companies opting for its
gensets. Powerol also has a presence with banks,
buildings, hospitals, hotels, and the manufacturing
segments.
It has OEM’s in major cities of 15 states. Mahindra
diesel gensets are manufactured at two factories
located at Pune and Delhi, with a combined manu-
facturing capacity of over 30,000 sets a year.
Ashok Leyland
It is the genset provider in engines, alternators,
and controllers. Its diesel generating sets meet
latest CPCB norms in India and are made to meet
international norms. AL’s sets are powered by
the compact 4-, 6-, 8-, and 12-cylinder series of
diesel engines. Its DG sets are silent, environ-
ment-friendly, require minimum maintenance, and
are low on operating costs.
Leypower diesel generating sets are manufac-
tured in plants located across six units in the
country. The present range extends from 10-
2,250 kVA with generating sets manufactured to
operate under arduous conditions. It has OEM’s
present across 20+ states in India.
Manufacturing facility
Ashok Leyland DG set
Mahindra Powerol DG set MS Dhoni brand Ambassador

23GROUND ZERO GROUND ZERO 1 - 15 July 2014 1 - 15 July 2014 22
Dr. Harikishan Koppula Reddy,
Dr Harikishan Koppula Reddy is the Managing Director of V R TechNiche Consultants - a leading consulting company in India in the area of travel demand estimation for road projects. It offers advisory services to various stakeholders of a BOT road project (NHAI, developers, lenders and investors) at project conceptualization and planning as well as pre-bid and post-bid stages. Its clientele includes almost all major infrastructure companies in India, along with leading financial institutions. Dr Reddy is a Ph.D. in Trans-portation Systems Engineering from IIT Kanpur, and has over 10 years of experience in the domain.
on the opportunities and challenges in the road sector
BY VIBHOR SINGHALDr Harikishan Koppula Reddy
The advent of the new government at the centre has
created an environment of optimism in the road infra-
structure industry. How do you see this translating, on
the ground, for the road sector? What policy initiatives
would you want to see from the government, in order to
energise the sector?
The new government is definitely trying to create the right
environment for the putting road infrastructure industry,
which has mostly stagnated for the last couple of years, on
the right track. However, a number of policy initiatives and
steps are required to energise as well as sustain the sector:
(i) Creating faster channels in ministries of environment and
railways for timely clearance of road projects and ROBs,
(ii) Bidding only for those projects for which land is available,
(iii) Faster approval of proposals and designs by IEs/NHAI,
(iv) Faster settlement of claims and disputes,
(v) Creating technical groups for faster approval and induc-
tion of new technologies, etc.
An important aspect, which never got any attention, but has
got to be addressed quickly, is toll avoidance by users at
toll plazas. In my opinion, the loss of revenue to developers
on account of toll avoidance at toll plazas ranges anywhere
between 5-10%, which developers never account for while
bidding for projects. Avoiding toll at a toll plaza by a user,
which is increasing by the day, should be treated at par with
avoidance of any other tax, and necessary policies to punish
such offenders should be formulated. Government should
also analyse and assess NHAI’s institutional capacity to han-
dle the amount of workload it is loaded with.
The NHAI fared quite poorly in FY13 and FY14 in terms
of targeted awards to actual achievement. What were
the main reasons?
A large number of projects which were awarded in FY13
never started. It was not NHAI but project developers and
lenders who are largely responsible for this. Developers were
too optimistic about the road sector and therefore they were
very aggressive while bidding for projects. Easier and indis-
criminate financing of road projects before FY13 (to a large
extent) was one of the primary reasons for this optimism.
Is there a chance that the new government can change
the situation and quickly revive the stalled projects?
What does it need to do to achieve that?
To come out of the current situation the government should
first prioritise its decisions. To start with, ongoing projects
with slow or no progress should be sped-up and completed
in a time-bound manner. This requires focussed efforts from

25GROUND ZERO GROUND ZERO 1 - 15 July 2014 1 - 15 July 2014 24
It would be important to learn from mistakes and create
sustainable practices and policies.
Over the last two years, developers have found it
extremely difficult to achieve financial closure for their
projects. Banks now require 100% land acquisition and
clearances, and have started questioning traffic growth
estimates of developers in their bidding. What can NHAI
do (or what is it planning to do / has already done) to ad-
dress these concerns from banks – because if banks don’t
lend, there is no point in NHAI awarding any projects.
In the initial years of PPP lenders were definitely lenient in fi-
nancing and this resulted in too much of optimism. There was
a time when financing a road project was considered a given.
While many of these decisions were based on consultants’
advice, the quality of consulting available in this country has
been very poor. To bring some rationale into the whole pro-
cess, NHAI should review the project costs at which lenders
are financing road projects and lenders should start ranking
consultants based on their previous works.
How would you describe the evolution of the various
players in the sector – in terms of technical capability and
expertise? Are we still quite inferior to the foreign play-
ers like Vinci, Balfour Beatty, and Leighton?
I do not think there are any technical capability issues on de-
velopers’ side. In fact most of the first-generation projects in
India under NHDP Phases 1 and 2 were executed by foreign
players. The space is now mostly crowded by Indian compa-
nies. It is, in fact, faster evolution and stiff competition that
led to the current situation.
Why do you think there hasn’t been much interest in the
road segment from foreign players?
I think red-tape and too much of competition are reasons for
reduced interest from foreign players. The space is already
crowded with too many Indian companies.
Who are the key players in the segment that you feel are
well placed in terms of technical capability and domain
expertise to capture the opportunity in the segment?
Technically, there are a large number of companies that are
capable of implementing road projects efficiently. While it is
quite difficult to comment, with the information that is avail-
able, and the current position, I would say Oriental Structural
Engineers, Sadbhav Engineering, L&T, IRB, and Ashoka Build-
con are doing well (by progressing on projects in hand) and
can take advantage of initiatives by the new government.
the government to obtain all pending clearances and approv-
als, immediately, for such projects. This will increase the cash
flows of the developer and also of the road sector.
To follow up with this, government should decide the fate of
stalled projects quickly, within the parameters of bid doc-
uments/contracts. The path that the government takes will
decide the future course of the road sector. Too much flexibil-
ity from the government could set a bad example and result
in an unrealistically optimistic situation again.
Over and above the stalled projects, how does the pipe-
line for fresh orders look? How can it be ensured that
these projects, if and when awarded, do not meet the
same fate as the ones before?
With expressways and new targets fixed by new government
for implementation of road projects, the future orders should
be good. To avoid FY13 and FY14 situations, it is essential
that the projects come with all approvals and clearances and
lenders need to be rational in financing projects. While lend-
ers were too lenient earlier, they are too pessimistic now.
One of landmark proposals that NHAI took to resolve
the deadlock in the sector was premium rescheduling.
Do you think it was required? Will it not create a moral
hazard with more developers throwing up their hands in
the future?
NHAI should reschedule premiums for only those projects
that are actually feasible. Some of the projects, even af-
ter premium rescheduling, may not be feasible. Premium
rescheduling without a detailed analysis will only shift the
current problems to future. Yes, indiscriminate premium
rescheduling can definitely create moral hazards and set bad
examples. While one-time premium rescheduling may solve
the current situation, continuing with it will not sustain road
sector growth.
NHAI seems to have come full circle, with bulk of the
awards in FY05-08 comprising EPC project, FY09-12
comprising BOT-Toll projects, and now NHAI is looking at
awarding more than 50% of projects on EPC basis. What
is the major reason behind this shift? Does this mean
BOT-Toll project model has been a failure in this country?
No model will be successful unless all stakeholders are ration-
al and responsible. EPC projects might also fail if the NHAI
or ministry does not provide all approvals and clearances in
time or if bidders quote low EPC prices. While the BOT-Toll
model has definitely seen many problems, it has also provid-
ed many opportunities for faster growth of the road sector.

25GROUND ZERO GROUND ZERO 1 - 15 July 2014 1 - 15 July 2014 24
Indian Economy – Trend Indicators
Monthly Economic Indicators
Quarterly Economic Indicators
Growth Rates (%) Apr-13 May-13 Jun-13 Jul-13 Aug-13 Sep-13 Oct-13 Nov-13 Dec-13 Jan-14 Feb-14 Mar-14 Apr-14 May-14
IIP 1.5 (2.5) (1.8) 2.6 0.4 2.7 (1.6) (1.3) 0.1 0.8 (1.8) (0.5) 3.4 3.7
PMI 51.0 50.1 50.3 50.1 48.5 49.6 49.6 51.3 50.7 51.4 52.5 51.3 51.3 51.4
Core sector 2.3 2.3 0.1 3.1 3.7 8.0 (0.6) 1.7 2.1 1.6 4.5 2.5 4.2 2.3
WPI 4.8 4.6 5.2 5.9 7.0 7.0 7.2 7.5 6.4 5.2 5.0 5.7 5.2 6.0
CPI 9.4 9.3 9.9 9.6 9.5 9.8 10.2 11.2 9.9 8.8 8.0 8.3 8.6 8.3
Money Supply 12.4 12.1 12.8 12.5 12.2 12.5 13.0 14.5 14.9 14.5 14.5 14.2 13.9 13.2
Deposit 13.4 13.5 13.8 13.5 13.1 14.1 14.4 16.1 15.8 15.7 15.9 14.6 15.1 13.8
Credit 14.6 14.2 13.7 14.9 17.1 17.8 16.6 15.5 14.5 14.7 14.4 14.3 14.1 12.8
Exports 1.7 (1.1) (4.6) 11.6 13.0 11.2 13.5 5.9 3.5 3.8 (3.7) (3.2) 5.3 12.4
Imports 11.0 7.0 (0.4) (6.2) (0.7) (18.1) (14.5) (16.4) (15.2) (18.1) (17.1) (2.1) (15.0) (11.4)
Trade deficit (USD Bn) (17.8) (20.1) (12.2) (12.3) (10.9) (6.8) (10.6) (9.2) (10.1) (9.9) (8.1) (10.5) (10.1) (11.2)
Net FDI (USD Bn) 2.8 1.9 1.8 1.7 1.7 3.3 1.8 2.4 1.9 0.4 (0.1) 2.9 2.2
FII (USD Bn) 1.6 6.7 (8.7) (4.7) (2.0) 0.2 (0.4) (0.0) 2.9 2.6 1.5 5.4 (0.1)
ECB (USD Bn) 1.1 2.5 2.0 3.7 2.3 3.3 1.9 2.2 4.6 1.8 4.3 3.6 3.2
NRI Deposits (USD Bn) 1.3 1.7 2.5 1.3 1.2 5.9 4.5 14.6 2.0 0.7 0.7 2.5 1.4
Dollar-Rupee 54.4 55.1 58.4 60.6 63.0 63.8 61.6 62.6 61.9 62.1 62.2 61.0 60.4 59.3
FOREX Reserves (USD Bn) 296.4 287.9 284.6 280.2 275.5 276.3 283.0 291.3 295.7 292.2 294.4 303.7 309.9 312.7
Balance of Payment (USD Bn) Q4FY12 Q1FY13 Q2FY13 Q3FY13 Q4FY13 Q1FY14 Q2FY14 Q3FY14 Q4FY14Exports 80.2 75.0 72.6 74.2 84.8 73.9 81.2 79.8 83.7 Imports 131.7 118.9 120.4 132.6 130.4 124.4 114.5 112.9 114.3 Trade deficit (51.5) (43.8) (47.8) (58.4) (45.6) (50.5) (33.3) (33.2) (30.7)Net Invisibles 29.8 26.8 26.7 26.6 27.5 28.7 28.1 29.1 29.3 CAD (21.8) (17.1) (21.1) (31.8) (18.2) (21.8) (5.2) (4.1) (1.3)CAD (% of GDP) 4.4 4.0 5.1 6.5 3.6 4.9 1.2 0.8 0.3 Capital Account 16.6 16.5 20.7 31.5 20.5 20.6 (4.8) 23.8 9.2 BoP (5.7) 0.5 (0.2) 0.8 2.7 (0.3) (10.4) 19.1 7.1
GDP and its Components (YoY, %) Q4FY12 Q1FY13 Q2FY13 Q3FY13 Q4FY13 Q1FY14 Q2FY14 Q3FY14 Q4FY14Agriculture & allied activities 3.9 1.8 1.8 0.8 1.6 4.0 5.0 3.7 6.3 Industry 7.4 (0.6) 0.1 2.0 2.0 (0.9) 1.8 (0.9) (0.5)Mining & Quarrying 6.5 (1.1) (0.1) (2.0) (4.8) (3.9) - (1.2) (0.4)Manufacturing 7.5 (1.1) (0.0) 2.5 3.0 (1.2) 1.3 (1.5) (1.4)Electricity, Gas & Water Supply 7.6 4.2 1.3 2.6 0.9 3.8 7.8 5.0 7.2 Services 6.5 6.7 6.5 6.1 5.8 6.5 6.1 6.4 5.8 Construction 7.6 2.8 (1.9) 1.0 2.4 1.1 4.4 0.6 0.7 Trade, Hotel, Transport and Communications 4.0 4.0 5.6 5.9 4.8 1.6 3.6 2.9 3.9 Finance, Insurance, Real Estate & Business Services 10.9 11.7 10.6 10.2 11.2 12.9 12.1 14.1 12.4 Community, Social & Personal Services 5.5 7.6 7.4 4.0 2.8 10.6 3.6 5.7 3.3 GDP at FC 6.3 4.5 4.6 4.4 4.4 4.7 5.2 4.6 4.6

27GROUND ZERO GROUND ZERO 1 - 15 July 2014 1 - 15 July 2014 26
Annual Economic Indicators and Forecasts Indicators Units FY6 FY7 FY8 FY9 FY10 FY11 FY12 FY13 FY14E FY15E
Real GDP growth % 9.5 9.6 9.3 6.7 8.6 8.9 6.7 4.5 4.6 5.2
Agriculture % 5.1 4.2 5.8 0.1 0.8 8.6 5.0 1.4 4.0 2.4
Industry % 8.5 12.9 9.2 4.1 10.2 8.3 6.7 0.9 0.0 2.9
Services % 11.1 10.1 10.3 9.4 10.0 9.2 7.1 6.2 6.0 6.6
Real GDP Rs Bn 32531 35644 38966 41587 45161 49185 52475 54821 57486 60475
Real GDP US$ Bn 733 787 967 908 953 1079 1096 1008 951 1008
Nominal GDP Rs Bn 36925 42937 49864 56301 64778 77841 90097 101133 113205 126723
Nominal GDP US$ Bn 832 948 1237 1229 1367 1707 1881 1859 1872 2112
Population Mn 1106 1122 1138 1154 1170 1186 1202 1219 1236 1254
Per Capita Income US$ 753 845 1087 1065 1168 1439 1565 1525 1515 1685
WPI (Average) % 4.5 6.6 4.7 8.1 3.8 9.6 8.7 7.4 6.0 5-5.5
CPI (Average) % 4.2 6.8 6.4 9.0 12.4 10.4 8.3 10.2 9.5 7.5-8
Money Supply % 15.5 20.0 22.1 20.5 19.2 16.2 15.8 13.6 13.5 14.0
CRR % 5.0 6.0 7.5 5.0 5.75 6.00 4.75 4.00 4.0 4.0
Repo rate % 6.5 7.50 7.75 5.0 5.00 6.75 8.50 7.50 8.00 8.00
Reverse repo rate % 5.5 6.0 6.0 3.5 3.50 5.75 7.50 6.50 7.00 7.0
Bank Deposit growth % 24.0 23.8 22.4 19.9 17.2 15.9 13.5 14.4 14.6 15.0
Bank Credit growth % 37.0 28.1 22.3 17.5 16.9 21.5 17.0 15.0 14.3 16.0
Centre Fiscal Deficit Rs Bn 1464 1426 1437 3370 4140 3736 5160 5209 5126 5558
Centre Fiscal Deficit % of GDP 4.0 3.3 2.9 6.0 6.4 4.8 5.7 5.2 4.5 4.4
Gross Central Govt Borrowings Rs Bn 1310 1460 1681 2730 4510 4370 5098 5580 5639 6390
Net Central Govt Borrowings Rs Bn 954 1104 1318 2336 3984 3254 4362 4674 4233 4870
State Fiscal Deficit % of GDP 2.4 1.8 1.5 2.4 2.9 2.1 2.3 2.2 2.5 2.5
Consolidted Fiscal Deficit % of GDP 6.4 5.1 4.4 8.4 9.3 6.9 8.1 7.4 7.0 6.9
Exports US$ Bn 105.2 128.9 166.2 189.0 182.4 251.1 309.8 306.6 318.6 328.2
YoY Growth % 23.4 22.6 28.9 13.7 -3.5 37.6 23.4 -1.0 3.9 3.0
Imports US$ Bn 157.1 190.7 257.6 308.5 300.6 381.1 499.5 502.2 466.2 500.2
YoY Growth % 32.1 21.4 35.1 19.7 -2.5 26.7 31.1 0.5 -7.2 7.3
Trade Balance US$ Bn -51.9 -61.8 -91.5 -119.5 -118.2 -129.9 -189.8 -195.6 -147.6 -172.0
Net Invisibles US$ Bn 42.0 52.2 75.7 91.6 80.0 84.6 111.604 107.5 115.2 118.1
Current Account Deficit US$ Bn -9.9 -9.6 -15.7 -27.9 -38.2 -45.3 -78.2 -88.2 -32.4 -54.0
CAD (% of GDP) % -1.2 -1.0 -1.3 -2.3 -2.8 -2.6 -4.2 -4.7 -1.7 -2.6
Capital Account Balance US$ Bn 25.5 45.2 106.6 7.8 51.6 62.0 67.8 89.3 48.8 63.5
Dollar-Rupee (Average) 44.4 45.3 40.3 45.8 47.4 45.6 47.9 54.4 60.5 60.0
Source: RBI, CSO, CGA, Ministry of Agriculture, Ministry of commerce, Bloomberg, PhillipCapital India Research

27GROUND ZERO GROUND ZERO 1 - 15 July 2014 1 - 15 July 2014 26
Note
: For
ban
ks, E
BITD
A is
pre-
prov
ision
pro
fit
Phill
ipC
apita
l Ind
ia C
over
age
Uni
vers
e: V
alua
tio
n Su
mm
ary
CMP
Mkt
Cap
Ne
t Sal
es (R
s mn)
EB
IDTA
(Rs
mn)
PAT (
Rs m
n)EP
S (R
s)
EPS
Grow
th (%
) P
/E (x
) P
/B (x
) EV
/EBI
TDA
(x)
ROE
(%)
ROCE
(%)
Nam
e of
com
pany
Sect
orRs
Rs m
nFY
14E
FY15
EFY
14E
FY15
EFY
14E
FY15
EFY
14E
FY15
EFY
14E
FY15
EFY
14E
FY15
EFY
14E
FY15
EFY
14E
FY15
EFY
14E
FY15
EFY
14E
FY15
E
Cham
bal F
ertil
iser
sAg
ri In
puts
58 2
4,22
1 8
6,90
3 8
7,44
1 6
,120
7
,829
2
,595
3
,260
6.
27.
814
.525
.69.
37.
41.
21.
19.
87.
113
.215
.24.
76.
0
Coro
man
del F
ert
Agri
Inpu
ts26
3 7
5,12
5 1
00,5
32
109
,906
7
,759
9
,899
3
,710
5
,526
13
.019
.5-1
5.1
50.3
20.3
13.5
3.3
2.7
11.3
10.2
16.3
20.0
14.9
19.4
Tata
Che
mica
ls Lt
dAg
ri In
puts
342
87,
127
157
,353
1
53,4
38
18,
094
20,
253
3,8
82
6,0
14
15.2
23.6
-55.
354
.922
.414
.51.
61.
98.
67.
57.
013
.314
.37.
0
Deep
ak Fe
rtilis
ers
Agri
Inpu
ts14
8 1
3,06
3 3
9,20
4 3
2,74
4 5
,636
4
,882
2
,519
2
,309
28
.626
.295
.1-8
.35.
25.
70.
90.
83.
63.
818
.415
.013
.110
.9
Kave
ri Se
eds
Agri
Inpu
ts76
1 5
2,42
0 1
0,11
2 1
2,13
8 2
,213
2
,858
2
,092
2
,681
30
.439
.164
.528
.625
.019
.410
.27.
223
.718
.040
.636
.846
.542
.0
PI In
dust
ries
Agri
Inpu
ts33
3 4
5,32
4 1
5,95
5 1
9,19
4 2
,892
3
,532
1
,884
2
,398
13
.817
.692
.627
.324
.118
.96.
55.
015
.913
.227
.126
.726
.627
.7
Ralli
s Ind
iaAg
ri In
puts
226
43,
960
17,
466
19,
423
2,6
13
3,1
40
1,5
19
1,8
13
7.8
9.3
23.2
19.3
29.0
24.3
6.1
5.2
17.0
14.1
21.2
21.5
20.0
20.5
Unite
d Ph
osph
orus
Agri
Inpu
ts34
1 1
46,1
54
105
,800
1
21,1
45
20,
196
20,
464
10,
145
11,
775
23.7
27.5
29.4
16.1
14.4
12.4
2.8
2.3
8.1
8.0
19.7
19.7
13.1
14.1
Baja
j Aut
oAu
tom
obile
s23
31 6
74,4
57
197
,176
2
14,5
78
41,
057
42,
124
32,
419
34,
242
112.
011
8.3
4.7
5.6
20.8
19.7
7.4
6.2
16.3
15.9
35.4
31.4
35.3
31.7
Bhar
at Fo
rge
Auto
mob
iles
663
154
,378
6
6,43
5 6
7,20
0 1
0,27
1 1
1,46
1 4
,179
5
,444
17
.923
.483
.430
.337
.028
.45.
95.
216
.714
.616
.118
.310
.813
.0
Hero
Mot
oCor
pAu
tom
obile
s26
40 5
27,1
65
251
,249
2
81,9
65
35,
401
40,
708
21,
091
27,
471
105.
613
7.6
-0.4
30.2
25.0
19.2
9.4
7.9
14.8
12.9
37.7
41.0
38.4
43.3
Asho
k Le
ylan
dAu
tom
obile
s37
98,
312
95,
404
107
,936
1
,664
6
,582
(4
,764
) (4
17)
-1.8
-0.2
-431
.2-9
1.2
-20.
6-2
35.8
2.2
2.2
87.1
21.7
-10.
6-0
.9-1
.92.
2
M&M
Auto
mob
iles
1186
730
,140
3
95,9
34
433
,653
4
7,68
0 5
2,26
4 3
6,48
7 3
7,60
9 59
.461
.38.
73.
119
.919
.44.
13.
615
.714
.320
.818
.316
.316
.3
Mar
uti S
uzuk
iAu
tom
obile
s25
17 7
60,3
35
426
,448
4
54,2
13
50,
900
59,
501
27,
831
33,
411
92.1
110.
616
.320
.127
.322
.83.
73.
214
.712
.413
.414
.113
.113
.9
Apol
lo Ty
res
Auto
mob
iles
202
101
,813
1
33,1
27
137
,896
1
7,76
2 1
8,56
1 9
,526
9
,973
18
.919
.864
.84.
710
.710
.22.
31.
96.
86.
124
.520
.616
.715
.9
Tata
Mot
ors
Auto
mob
iles
440
1,3
29,6
69
2,3
06,7
71
2,7
42,0
17
374
,029
4
33,7
13
139
,910
1
80,5
77
43.9
56.6
41.4
29.1
10.0
7.8
2.6
2.0
4.1
3.6
26.1
25.3
16.7
16.2
ABB
Indi
aCa
p Go
ods
1137
240
,908
7
6,31
6 7
8,46
0 4
,036
5
,402
1
,899
3
,228
9.
015
.2-2
8.0
70.0
126.
974
.69.
08.
460
.545
.27.
111
.27.
610
.4
BGR
Ener
gyCa
p Go
ods
214
15,
439
35,
204
40,
640
4,2
81
4,8
20
1,3
29
1,6
22
18.4
22.5
-18.
022
.111
.69.
51.
21.
18.
08.
410
.211
.65.
95.
9
BHEL
Cap
Good
s25
4 6
22,0
58
383
,888
3
41,5
74
47,
064
40,
737
36,
534
31,
809
14.9
13.0
-44.
8-1
2.9
17.0
19.6
1.9
1.8
11.3
11.1
11.1
9.0
8.6
7.0
Alst
om T&
DCa
p Go
ods
346
88,
669
35,
171
41,
100
3,1
02
4,2
35
1,1
42
1,9
27
4.5
7.5
-9.0
68.8
77.7
46.0
7.1
6.4
29.8
21.7
9.1
13.9
10.9
13.3
Crom
pton
Gre
aves
Cap
Good
s20
3 1
27,2
29
134
,806
1
45,3
93
6,8
20
9,3
59
2,4
43
5,1
72
3.9
8.3
195.
711
1.7
52.1
24.6
3.5
3.2
20.7
14.9
6.7
13.0
4.9
8.8
Engi
neer
s Ind
iaCa
p Go
ods
324
109
,218
1
8,23
6 1
7,65
3 3
,766
3
,672
4
,789
4
,670
14
.213
.9-2
3.8
-2.5
22.8
23.4
4.4
4.1
24.3
24.5
19.5
17.3
20.4
18.1
Jyot
i Stru
ctur
esCa
p Go
ods
63 5
,143
3
0,70
3 3
0,85
5 2
,964
2
,947
7
22
641
8.
87.
811
.3-1
1.4
7.1
8.0
0.6
0.6
4.5
4.5
8.9
7.4
10.9
10.9
KEC
Inte
rnat
iona
lCa
p Go
ods
129
33,
190
79,
018
85,
597
4,9
33
6,7
96
849
2
,335
3.
39.
130
.317
5.0
39.1
14.2
2.8
2.4
10.7
7.4
7.1
17.0
7.8
11.0
Lars
en &
Toub
roCa
p Go
ods
1715
1,5
90,5
60
565
,990
6
33,6
86
66,
671
74,
923
49,
047
53,
333
52.9
57.3
18.7
8.2
32.4
29.9
4.7
4.2
24.7
21.8
14.6
14.2
12.6
12.0
Siem
ens
Cap
Good
s95
4 3
39,5
60
111
,452
1
12,3
00
4,8
31
6,7
18
4,3
13
4,4
78
12.1
12.6
-18.
83.
878
.775
.88.
48.
069
.049
.510
.710
.57.
88.
1
Cum
min
s Ind
iaCa
p Go
ods
653
181
,012
3
8,99
1 4
3,58
1 6
,192
7
,297
6
,000
6
,365
21
.623
.0-9
.56.
130
.228
.47.
16.
329
.124
.523
.422
.320
.219
.8
Ther
max
Cap
Good
s94
9 1
13,0
79
51,
000
59,
488
4,1
23
5,3
61
2,8
10
3,5
30
23.6
29.6
-12.
225
.640
.232
.05.
64.
927
.220
.613
.815
.411
.713
.9
VA Te
ch W
abag
Cap
Good
s13
73 3
6,66
7 2
2,30
1 2
8,00
0 1
,800
3
,453
1
,083
2
,438
40
.891
.819
.912
5.1
33.7
15.0
4.3
3.8
18.7
9.9
12.9
25.5
11.7
21.3
Volta
sCa
p Go
ods
221
73,
208
52,
660
54,
241
2,6
56
3,5
46
2,2
43
2,6
06
6.8
7.9
15.0
16.2
32.6
28.1
4.0
3.7
27.5
20.1
12.3
13.0
11.9
13.0
ACC
Cem
ent
1470
275
,986
1
09,0
84
124
,747
1
3,69
0 1
9,90
1 1
0,94
7 1
1,87
6 58
.263
.2-2
1.5
8.5
25.2
23.3
3.5
3.3
18.3
13.6
14.0
14.3
11.7
11.4
Ambu
ja C
emen
tCe
men
t22
3 3
45,4
20
91,
180
231
,471
1
5,68
9 4
3,73
9 1
2,53
8 2
1,58
7 8.
110
.9-2
0.6
34.3
27.5
20.5
3.6
2.4
19.5
7.5
13.3
11.5
11.8
15.7
Indi
a Ce
men
tCe
men
t12
1 3
7,01
5 5
0,84
8 5
7,30
2 5
,914
7
,517
(6
46)
754
-2
.12.
5-1
31.0
-216
.7-5
7.3
49.1
1.0
1.0
11.5
8.6
-1.7
2.0
2.3
4.0
Man
gala
m C
emen
tCe
men
t22
0 5
,859
6
,997
1
0,68
9 5
82
1,4
96
418
6
51
15.7
24.4
-46.
055
.714
.09.
01.
21.
116
.86.
78.
211
.75.
08.
3
Shre
e Ce
men
tCe
men
t72
50 2
52,5
79
61,
817
73,
661
14,
288
19,
555
7,1
02
10,
178
203.
929
2.1
-29.
343
.335
.624
.85.
64.
617
.212
.515
.818
.714
.817
.8
Ultra
tech
Cem
ent
Cem
ent
2632
722
,082
2
14,4
37
268
,219
3
8,26
4 5
6,54
5 2
2,06
0 3
3,94
3 80
.412
3.8
-17.
653
.932
.721
.34.
23.
619
.513
.212
.816
.99.
013
.1

29GROUND ZERO GROUND ZERO 1 - 15 July 2014 1 - 15 July 2014 28
CMP
Mkt
Cap
Ne
t Sal
es (R
s mn)
EB
IDTA
(Rs
mn)
PAT (
Rs m
n)EP
S (R
s)
EPS
Grow
th (%
) P
/E (x
) P
/B (x
) EV
/EBI
TDA
(x)
ROE
(%)
ROCE
(%)
Nam
e of
com
pany
Sect
orRs
Rs m
nFY
14E
FY15
EFY
14E
FY15
EFY
14E
FY15
EFY
14E
FY15
EFY
14E
FY15
EFY
14E
FY15
EFY
14E
FY15
EFY
14E
FY15
EFY
14E
FY15
EFY
14E
FY15
E
OCL I
ndia
Cem
ent
312
17,
750
19,
366
22,
057
2,9
92
3,5
36
1,0
75
1,3
59
18.9
23.9
-32.
626
.416
.513
.11.
51.
47.
56.
09.
410
.98.
89.
2
JK La
kshm
i Cem
ent
Cem
ent
216
25,
358
20,
566
22,
994
3,0
18
4,3
18
1,1
23
2,0
91
9.5
17.8
-41.
386
.222
.612
.11.
91.
711
.78.
88.
614
.46.
19.
6
Heid
elbe
rgCe
men
tCe
men
t65
14,
775
13,
648
17,
256
864
2
,598
(4
07)
591
-1
.82.
6-2
32.1
-245
.0-3
6.3
25.0
1.8
1.7
30.8
10.0
-4.9
6.6
1.3
5.4
JK C
emen
tCe
men
t39
0 2
7,28
9 2
8,17
8 3
8,39
4 3
,449
4
,737
7
58
1,3
63
10.8
19.5
-67.
179
.736
.020
.01.
61.
514
.99.
74.
37.
44.
36.
2
Dalm
ia B
hara
t Ltd
Cem
ent
462
37,
509
28,
670
37,
139
3,2
63
6,0
95
(84)
521
-1
.06.
4-1
04.3
-718
.8-4
45.5
72.0
1.2
1.2
22.2
13.4
-0.3
1.7
2.4
4.4
Andh
ra B
ank
Finan
cials
102
60,
141
37,
373
43,
330
37,
373
43,
330
4,3
56
8,4
59
7.4
14.3
-67.
994
.213
.87.
10.
70.
7NM
NM5.
19.
40.
30.
5
Bank
of B
arod
a Fin
ancia
ls87
9 3
77,6
06
119
,654
1
42,2
89
119
,654
1
42,2
89
46,
033
55,
990
106.
913
0.0
-0.9
21.6
8.2
6.8
1.1
1.0
NMNM
14.0
15.1
0.8
0.8
Bank
of I
ndia
Fin
ancia
ls30
6 1
96,5
32
106
,289
1
28,6
52
106
,289
1
28,6
52
30,
691
37,
211
47.7
57.9
3.6
21.2
6.4
5.3
0.8
0.7
NMNM
12.6
13.6
0.6
0.6
Cana
ra B
ank
Finan
cials
463
213
,471
8
9,44
4 1
08,9
73
89,
444
108
,973
2
4,38
2 3
8,12
5 52
.982
.7-1
8.5
56.4
8.8
5.6
0.9
0.8
NMNM
10.0
14.4
0.5
0.7
Corp
orat
ion
bank
Finan
cials
393
65,
810
38,
502
43,
359
38,
502
43,
359
7,2
90
12,
466
43.5
74.4
-53.
671
.09.
05.
30.
70.
6NM
NM7.
411
.90.
40.
5
HDFC
Ban
kFin
ancia
ls81
8 1
,969
,496
1
84,2
34
222
,367
1
84,2
34
222
,367
8
5,36
4 1
01,9
08
35.9
42.8
26.9
19.4
22.8
19.1
4.5
3.8
NMNM
21.6
21.8
2.0
2.0
ICIC
I Ban
kFin
ancia
ls14
34 1
,657
,721
1
64,7
56
186
,898
1
64,7
56
186
,898
9
8,10
6 1
09,3
57
84.9
94.5
17.7
11.2
16.9
15.2
2.3
2.1
NMNM
14.0
14.3
1.7
1.7
IOB
Finan
cials
81 1
00,0
63
55,
768
64,
783
55,
768
64,
783
6,0
17
6,9
07
5.1
4.9
-16.
5-4
.115
.816
.50.
70.
7NM
NM4.
64.
60.
20.
2
Orie
ntal
Ban
k Fin
ancia
ls32
5 9
7,39
1 5
1,27
1 5
7,71
1 5
1,27
1 5
7,71
1 1
1,39
4 1
4,52
7 38
.048
.4-1
6.5
27.5
8.5
6.7
0.8
0.7
NMNM
9.2
10.9
0.5
0.6
PNB
Finan
cials
996
360
,531
1
61,4
60
179
,825
1
61,4
60
179
,825
3
3,42
6 4
4,72
0 92
.312
3.5
-31.
333
.810
.88.
11.
01.
0NM
NM10
.212
.40.
60.
8
SBI
Finan
cials
2698
2,0
14,3
29
673
,371
7
93,5
49
673
,371
7
93,5
49
136
,339
1
60,7
17
182.
621
5.3
-30.
317
.914
.812
.51.
31.
2NM
NM9.
710
.20.
60.
6
Unio
n Ba
nk
Finan
cials
240
151
,116
7
8,79
4 9
3,14
2 7
8,79
4 9
3,14
2 1
6,96
1 2
1,10
8 26
.933
.5-2
5.6
24.5
8.9
7.2
0.9
0.8
NMNM
10.4
11.9
0.5
0.6
HDFC
Ltd
Finan
cials
985
1,5
43,5
92
70,
030
81,
419
75,
402
87,
013
54,
402
62,
753
34.9
40.2
11.2
15.4
28.3
24.5
5.7
5.0
NMNM
20.5
21.1
2.7
2.7
Indi
an B
ank
Finan
cials
185
85,
997
44,
320
52,
207
44,
320
52,
207
11,
246
13,
504
24.2
31.4
-34.
229
.87.
65.
90.
70.
6NM
NM10
.211
.20.
60.
7
Dev.
Cred
it Ba
nkFin
ancia
ls82
20,
489
3,6
84
4,3
10
3,6
84
4,3
10
1,5
05
1,7
30
6.0
6.9
47.3
15.0
13.6
11.8
1.9
1.6
NMNM
14.7
14.6
1.2
1.2
AXIS
Ban
kFin
ancia
ls19
28 9
08,5
78
119
,516
1
34,9
17
119
,516
1
34,9
17
62,
174
72,
053
132.
315
2.6
19.6
15.3
14.6
12.6
2.4
2.0
NMNM
17.4
17.4
1.7
1.7
Indu
sind
Ban
kFin
ancia
ls57
1 3
00,4
33
28,
907
34,
208
28,
907
34,
208
14,
114
17,
258
26.9
32.8
32.3
22.3
21.3
17.4
3.5
3.0
NMNM
17.6
18.4
1.8
1.8
Shrir
am Tr
ansp
ort
FFin
ancia
ls90
5 2
05,2
27
36,
479
40,
567
28,
574
31,
615
12,
642
14,
377
55.7
63.4
-7.1
13.8
16.2
14.3
2.5
2.3
NMNM
16.3
16.7
2.7
2.7
LIC
Hous
ing
Fina
nce
Finan
cials
326
164
,495
1
8,64
5 2
2,15
8 1
8,25
9 2
1,50
4 1
2,92
7 1
5,40
6 25
.630
.526
.319
.212
.710
.72.
21.
9NM
NM18
.418
.81.
51.
5
Hind
usta
n Un
ileve
rFM
CG61
8 1
,336
,368
2
74,0
83
301
,232
5
0,96
3 5
5,86
0 3
6,98
3 3
8,70
3 17
.117
.910
.54.
736
.134
.540
.828
.125
.823
.411
2.9
81.3
125.
196
.9
Mar
ico In
dust
ries
FMCG
249
160
,831
4
6,76
2 5
5,66
8 7
,480
8
,773
4
,784
5
,420
7.
48.
431
.313
.333
.629
.711
.910
.221
.918
.535
.334
.319
.925
.8
Jubi
lant
Food
wor
ksFM
CG13
13 8
5,94
1 1
7,51
8 2
2,60
0 2
,679
3
,113
1
,346
1
,542
20
.623
.6-0
.414
.663
.755
.615
.011
.832
.127
.423
.621
.326
.323
.2
Godr
ej C
onsu
mer
FMCG
816
277
,647
7
8,13
6 8
9,35
5 1
1,45
1 1
3,52
1 7
,686
9
,132
22
.626
.83.
418
.836
.130
.47.
46.
425
.321
.120
.521
.014
.918
.0
ITC
FMCG
325
2,5
82,7
96
328
,826
3
77,8
92
124
,549
1
42,9
77
87,
852
100
,191
11
.012
.616
.914
.029
.425
.89.
88.
420
.517
.433
.532
.628
.028
.0
Nest
leFM
CG49
30 4
75,3
29
92,
304
106
,565
2
0,65
0 2
3,78
7 1
1,53
6 1
3,69
1 11
9.6
142.
08.
118
.741
.234
.720
.716
.523
.119
.950
.247
.638
.038
.2
Colg
ate
FMCG
1510
205
,349
3
5,44
9 4
0,39
2 6
,645
7
,921
4
,923
5
,630
36
.241
.4-0
.914
.341
.736
.534
.231
.330
.425
.582
.185
.795
.584
.0
Glax
o Sm
ithkl
ine
CFM
CG45
20 1
90,0
95
35,
640
41,
250
5,2
71
6,5
86
5,1
65
6,2
89
122.
814
9.5
18.3
21.8
36.8
30.2
11.8
10.2
33.0
26.2
32.1
33.9
34.6
36.2
Agro
Tech
Food
sFM
CG58
2 1
4,17
1 7
,622
8
,407
6
78
729
4
26
459
17
.518
.82.
27.
633
.330
.95.
04.
421
.019
.315
.114
.316
.214
.6
Dabu
rFM
CG18
7 3
28,8
58
70,
732
82,
186
11,
631
14,
114
9,1
72
10,
919
5.3
6.3
19.1
19.1
35.5
29.8
11.6
9.4
28.5
23.1
32.8
31.7
25.5
25.9
Emam
iFM
CG51
6 1
17,1
83
18,
837
22,
014
4,2
42
4,8
09
3,8
15
4,2
24
16.8
18.6
21.2
10.7
30.7
27.7
12.3
9.7
27.1
23.4
40.0
34.8
38.6
35.0
Brita
nnia
FMCG
1038
124
,483
6
9,89
2 8
0,17
9 5
,969
7
,137
3
,950
5
,011
33
.141
.952
.126
.831
.424
.816
.011
.821
.317
.350
.947
.738
.842
.1
Phill
ipC
apita
l Ind
ia C
over
age
Uni
vers
e: V
alua
tio
n Su
mm
ary
Note
: For
ban
ks, E
BITD
A is
pre-
prov
ision
pro
fit

29GROUND ZERO GROUND ZERO 1 - 15 July 2014 1 - 15 July 2014 28
CMP
Mkt
Cap
Ne
t Sal
es (R
s mn)
EB
IDTA
(Rs
mn)
PAT (
Rs m
n)EP
S (R
s)
EPS
Grow
th (%
) P
/E (x
) P
/B (x
) EV
/EBI
TDA
(x)
ROE
(%)
ROCE
(%)
Nam
e of
com
pany
Sect
orRs
Rs m
nFY
14E
FY15
EFY
14E
FY15
EFY
14E
FY15
EFY
14E
FY15
EFY
14E
FY15
EFY
14E
FY15
EFY
14E
FY15
EFY
14E
FY15
EFY
14E
FY15
EFY
14E
FY15
E
Baja
j Cor
pFM
CG23
6 3
4,76
6 6
,707
7
,799
1
,849
2
,069
1
,770
1
,969
12
.013
.45.
811
.219
.617
.76.
66.
618
.115
.733
.837
.330
.228
.5
Zydu
s Wel
lnes
sFM
CG58
0 2
2,64
4 4
,246
4
,898
1
,057
1
,208
1
,101
1
,232
28
.231
.513
.411
.820
.618
.46.
85.
418
.915
.932
.929
.237
.232
.7
Asia
n Pa
ints
FMCG
583
559
,404
1
24,9
01
145
,719
1
9,23
2 2
2,37
7 1
2,02
6 1
4,11
5 12
.514
.78.
017
.446
.539
.613
.911
.728
.824
.429
.929
.630
.230
.5
Balra
mpu
r Chi
niFM
CG80
19,
679
31,
031
33,
081
2,6
77
3,2
61
374
7
73
1.5
3.2
-76.
810
6.7
52.5
25.4
1.5
1.5
11.6
9.6
2.9
5.7
4.4
6.1
Tila
knag
arFM
CG57
7,0
52
8,2
42
9,3
37
1,6
99
2,0
20
583
6
74
4.7
5.4
-5.3
15.6
12.1
10.4
1.2
1.1
8.5
7.5
9.8
10.4
10.4
10.7
Radi
co K
haita
nFM
CG11
4 1
5,22
6 1
4,18
8 1
6,12
2 2
,217
2
,612
9
57
1,2
04
7.2
9.1
23.8
25.8
15.9
12.6
1.9
1.7
10.4
8.9
11.8
13.1
11.0
11.9
Berg
er P
aint
sFM
CG29
6 1
02,6
14
38,
697
45,
885
4,3
14
5,4
81
2,4
94
3,1
98
7.2
9.2
14.1
28.2
41.1
32.1
9.2
7.6
24.7
19.4
22.4
23.8
19.7
20.4
GMR
Infra
stru
ctur
eIn
frastr
uctu
re34
134
,094
8
7,09
5 9
7,53
5 2
5,65
4 3
7,58
1 (1
1,51
2) (4
,364
)-3
.0-1
.115
2.5
-62.
1-1
1.6
-30.
71.
51.
621
.413
.0-1
3.1
-5.2
3.6
2.5
GVK
Pow
erIn
frastr
uctu
re19
29,
847
28,
209
23,
865
9,4
61
13,
157
(3,6
87)
(7,8
93)
-2.3
-5.0
9.7
114.
1-8
.1-3
.81.
11.
425
.018
.5-1
3.3
-36.
10.
70.
3
IRB
Infra
stru
ctur
eIn
frastr
uctu
re23
0 7
6,32
7 3
7,31
9 3
8,81
1 1
7,53
7 2
0,65
8 4
,591
4
,204
13
.812
.6-1
7.5
-8.4
16.6
18.2
2.1
1.9
9.8
9.3
12.9
10.5
7.0
6.5
Adan
i Por
ts &
SEZ
Infra
struc
ture
245
506
,128
4
3,45
8 4
3,25
9 2
8,00
6 3
1,00
1 2
2,52
7 2
2,74
8 10
.911
.023
.31.
022
.522
.25.
44.
521
.117
.424
.120
.413
.812
.5
HCL T
echn
olog
ies
IT Se
rvice
s14
89 1
,042
,020
2
57,6
94
329
,625
5
7,53
9 8
6,78
7 4
0,14
2 6
2,28
3 56
.988
.163
.354
.826
.216
.97.
35.
518
.412
.228
.132
.826
.333
.0
Info
sys
IT Se
rvice
s32
17 1
,847
,088
5
01,3
30
532
,469
1
34,1
50
143
,356
1
06,4
80
113
,284
18
6.3
198.
313
.06.
417
.316
.23.
93.
311
.610
.522
.420
.424
.422
.0
TCS
IT Se
rvice
s23
93 4
,688
,117
8
18,0
94
944
,007
2
51,3
22
283
,764
1
91,0
87
230
,915
97
.611
7.9
37.0
20.8
24.5
20.3
8.5
6.7
18.6
16.4
34.5
32.8
38.2
35.5
Tech
Mah
indr
aIT
Serv
ices
2155
505
,042
1
88,3
13
218
,077
4
1,83
6 4
8,25
5 2
6,82
1 3
2,30
3 11
2.9
135.
726
.420
.219
.115
.94.
93.
811
.39.
625
.823
.930
.726
.2
Wip
roIT
Serv
ices
539
1,3
29,8
40
434
,269
4
75,4
40
99,
942
106
,211
7
7,96
6 8
8,97
1 31
.736
.127
.014
.117
.014
.93.
93.
312
.811
.922
.722
.223
.722
.8
Pers
iste
nt S
yste
ms
IT Se
rvice
s10
72 4
2,88
0 1
6,69
2 1
9,28
9 4
,303
4
,970
2
,493
3
,200
62
.380
.032
.928
.417
.213
.43.
52.
99.
78.
520
.421
.819
.421
.4
KPIT
Tech
nolo
gies
IT Se
rvice
s17
3 3
3,73
3 2
6,94
0 3
0,05
8 4
,233
4
,750
2
,391
3
,005
12
.816
.318
.527
.013
.510
.72.
52.
18.
67.
518
.819
.417
.317
.2
Zee
Ente
rtain
men
tM
edia
295
283
,476
4
4,21
7 4
8,79
9 1
2,04
3 1
3,04
9 8
,921
8
,024
9.
38.
423
.9-1
0.1
31.8
35.3
7.2
6.0
23.1
21.3
22.8
16.9
23.0
20.3
HT M
edia
Med
ia12
4 2
8,86
1 2
2,00
7 2
4,81
7 3
,125
3
,618
1
,607
2
,383
6.
910
.2-3
.749
.018
.012
.11.
71.
410
.28.
28.
811
.712
.012
.4
Sun
TV N
etw
ork
Med
ia46
0 1
81,2
79
22,
236
25,
675
11,
244
13,
533
7,4
80
8,8
51
19.0
22.5
5.4
18.3
24.2
20.5
5.9
5.2
15.7
12.9
24.2
25.4
24.5
26.0
Jagr
an P
raka
shan
Med
ia13
0 4
2,49
9 1
7,24
3 1
9,08
0 4
,009
4
,331
2
,037
2
,396
6.
47.
6-4
.117
.620
.217
.24.
13.
611
.810
.620
.121
.014
.213
.9
Den
Netw
orks
Med
ia23
7 4
2,23
3 1
0,96
1 1
8,84
0 2
,951
6
,227
4
11
1,9
34
2.8
13.2
-42.
537
0.0
84.4
18.0
1.9
1.7
12.2
6.9
2.3
9.7
6.3
10.8
Dish
TVM
edia
61 6
5,06
6 2
4,06
6 2
6,88
6 5
,565
6
,390
(1
,030
) (2
47)
-1.0
-0.2
56.0
-76.
0-6
3.2
-263
.4-2
5.2
-23.
013
.311
.439
.88.
7-2
.69.
0
Hath
way
Cab
leM
edia
324
49,
187
15,
734
22,
845
3,2
86
6,0
28
(823
) 1
,003
-5
.66.
6-6
.2-2
18.2
-57.
949
.05.
34.
918
.110
.9-9
.210
.01.
07.
7
Hind
alco
Inds
Met
als
175
362
,034
8
39,3
51
942
,250
8
3,02
8 1
03,9
72
24,
848
23,
802
12.0
11.5
-23.
9-4
.214
.615
.20.
90.
911
.29.
26.
45.
84.
04.
3
NALC
O M
etal
s61
157
,727
6
6,48
8 7
3,42
1 9
,342
1
2,36
6 6
,917
9
,091
2.
73.
516
.731
.422
.817
.41.
31.
312
.69.
55.
77.
24.
86.
7
Hind
usta
n Zi
ncM
etal
s17
0 7
17,8
82
134
,590
1
36,6
42
69,
615
67,
705
69,
663
67,
680
16.5
16.0
0.7
-2.8
10.3
10.6
1.9
1.7
6.6
6.2
18.6
15.9
18.6
15.9
Tata
Ste
elM
etal
s54
3 5
27,6
61
1,4
86,1
36
1,5
46,9
08
164
,110
1
76,1
26
36,
225
33,
570
37.3
34.6
990.
3-7
.314
.615
.71.
31.
27.
67.
08.
97.
76.
46.
4
JSW
Ste
elM
etal
s12
76 3
08,3
29
512
,196
5
35,4
82
91,
655
105
,839
2
1,64
7 2
8,70
4 89
.611
9.6
43.4
33.5
14.2
10.7
1.5
1.3
7.2
6.3
10.2
12.1
4.6
7.8
SAIL
Met
als
99 4
06,8
12
463
,345
5
11,9
13
43,
534
59,
861
19,
639
19,
884
4.8
4.8
-16.
71.
220
.720
.50.
90.
914
.311
.44.
64.
54.
63.
8
Sesa
Ste
rlite
Met
als
301
890
,885
6
61,5
24
824
,314
2
03,5
97
278
,912
7
2,62
4 7
8,75
3 24
.526
.6-7
.58.
412
.311
.31.
21.
18.
05.
69.
99.
914
.59.
4
Jind
al S
teel
& P
ower
Met
als
331
302
,370
2
00,0
40
274
,079
5
7,76
4 8
8,00
0 1
9,10
4 2
2,73
5 20
.924
.8-3
2.9
19.0
15.8
13.3
1.3
1.2
11.4
7.5
8.4
9.2
4.8
5.6
Jind
al S
awM
etal
s84
23,
272
65,
531
70,
919
6,4
74
7,7
51
1,5
72
2,2
22
5.7
8.0
-13.
441
.414
.810
.50.
60.
611
.510
.24.
15.
63.
64.
1
ONGC
Oil &
Gas
423
3,6
21,9
67
1,7
32,3
45
1,9
19,5
23
549
,854
6
67,9
80
265
,049
3
14,8
18
31.0
36.8
9.4
18.8
13.7
11.5
2.1
1.9
7.0
5.5
15.4
16.3
11.2
11.4
Petro
net L
NGOi
l & G
as17
6 1
31,6
25
377
,476
4
51,0
57
14,
984
18,
254
7,1
19
7,6
61
9.5
10.2
-38.
17.
618
.517
.22.
62.
410
.18.
414
.313
.810
.510
.5
Note
: For
ban
ks, E
BITD
A is
pre-
prov
ision
pro
fit
Phill
ipC
apita
l Ind
ia C
over
age
Uni
vers
e: V
alua
tio
n Su
mm
ary

31GROUND ZERO GROUND ZERO 1 - 15 July 2014 1 - 15 July 2014 30
CMP
Mkt
Cap
Ne
t Sal
es (R
s mn)
EB
IDTA
(Rs
mn)
PAT (
Rs m
n)EP
S (R
s)
EPS
Grow
th (%
) P
/E (x
) P
/B (x
) EV
/EBI
TDA
(x)
ROE
(%)
ROCE
(%)
Nam
e of
com
pany
Sect
orRs
Rs m
nFY
14E
FY15
EFY
14E
FY15
EFY
14E
FY15
EFY
14E
FY15
EFY
14E
FY15
EFY
14E
FY15
EFY
14E
FY15
EFY
14E
FY15
EFY
14E
FY15
EFY
14E
FY15
E
Cairn
Indi
aOi
l & G
as36
8 7
01,9
12
188
,439
1
81,0
06
141
,607
1
30,1
21
117
,750
1
07,0
13
61.9
56.3
2.0
-9.1
5.9
6.5
1.2
1.1
4.8
4.9
20.5
16.4
21.8
16.0
GAIL
Oil &
Gas
460
583
,626
5
86,3
57
592
,534
7
2,42
0 7
9,47
7 4
8,09
2 4
7,64
9 35
.937
.613
.14.
712
.812
.22.
11.
99.
28.
116
.615
.512
.811
.6
Indr
apra
stha
Gas
Oil &
Gas
357
49,
966
39,
174
45,
929
7,6
14
8,2
37
3,4
40
3,9
46
24.6
28.2
-2.9
14.7
14.5
12.7
2.8
2.5
6.8
6.0
21.1
20.9
15.3
15.4
Guja
rat S
tate
PeT
ROi
l & G
as89
50,
196
10,
473
10,
171
9,2
55
8,8
75
4,1
87
4,0
98
7.4
7.3
-22.
2-2
.112
.012
.21.
51.
46.
36.
312
.711
.310
.09.
4
HSIL
Ltd
Othe
r25
6 1
6,90
8 1
8,58
2 2
1,72
0 2
,533
3
,172
3
40
822
5.
112
.4-4
1.8
141.
849
.820
.61.
61.
610
.78.
33.
37.
61.
73.
7
Gree
nply
Indu
strie
sOt
her
710
17,
137
21,
595
24,
308
2,7
73
3,2
57
1,1
45
1,3
52
47.4
56.0
0.3
18.1
15.0
12.7
2.9
2.4
8.6
7.2
19.6
19.0
12.3
12.7
TRIL
Othe
r21
6 3
,101
6
,659
7
,216
3
30
432
1
32
192
10
.214
.917
8.9
45.3
21.1
14.5
0.8
0.8
12.8
9.8
3.8
5.3
4.4
5.6
Kaja
ria C
eram
icsOt
her
536
40,
513
18,
400
22,
051
2,8
07
3,4
18
1,2
42
1,5
17
16.4
20.1
15.7
22.1
32.6
26.7
7.6
6.5
15.2
12.7
23.5
24.4
26.5
27.9
Have
lls Lt
dOt
her
1181
147
,395
8
1,85
8 9
0,22
9 7
,425
9
,535
4
,463
6
,225
35
.849
.90.
239
.533
.023
.78.
87.
119
.915
.426
.830
.119
.623
.7
Auro
bind
o Ph
arm
aPh
arm
a74
0 2
15,6
64
80,
998
115
,098
2
1,32
8 1
8,53
1 1
3,92
2 1
1,07
5 47
.838
.122
1.9
-20.
515
.519
.45.
74.
411
.813
.531
.322
.723
.818
.5
Bioc
onPh
arm
a53
0 1
06,0
00
27,
979
33,
210
6,8
78
7,9
27
4,3
33
5,1
76
21.7
25.9
24.4
19.5
24.5
20.5
3.5
3.1
15.3
13.5
13.7
15.2
12.0
13.2
Cadi
la H
ealth
care
Phar
ma
1055
216
,010
7
1,15
1 8
1,67
2 1
2,36
0 1
5,47
3 7
,897
9
,886
38
.648
.314
.925
.227
.421
.86.
35.
119
.215
.224
.423
.214
.415
.9
Divi
's La
bora
torie
sPh
arm
a14
58 1
93,4
67
25,
321
30,
054
10,
145
12,
112
7,3
44
9,0
31
55.4
68.1
22.3
23.0
26.3
21.4
6.5
5.4
19.1
15.9
26.1
25.4
0.0
0.0
Dr R
eddy
's La
bs.
Phar
ma
2605
443
,389
1
32,1
70
153
,231
3
2,63
0 3
5,39
6 2
1,51
2 2
2,03
9 12
6.5
129.
627
.22.
520
.620
.14.
83.
914
.613
.223
.519
.414
.813
.0
Glen
mar
k Ph
arm
aPh
arm
a57
5 1
55,8
89
59,
839
70,
372
13,
101
15,
485
7,2
36
8,6
56
26.7
31.9
15.4
19.6
21.5
18.0
5.1
4.1
13.8
11.1
23.8
22.6
10.8
14.4
Ipca
Labo
rato
ries
Phar
ma
875
110
,393
3
1,99
4 3
7,06
4 8
,106
9
,300
5
,274
5
,909
42
.147
.234
.112
.020
.818
.55.
64.
314
.212
.526
.923
.419
.720
.6
Lupi
nPh
arm
a10
56 4
73,6
51
110
,866
1
26,9
97
30,
028
32,
999
18,
364
20,
127
41.0
44.9
38.1
9.6
25.8
23.5
6.8
5.5
15.7
14.1
26.5
23.3
36.4
31.9
Sun
Phar
ma
Phar
ma
683
1,4
14,7
71
160
,372
1
79,1
98
72,
285
76,
001
53,
526
52,
590
25.8
25.4
47.3
-1.7
26.4
26.9
7.5
6.1
18.9
17.8
30.6
22.6
27.7
20.1
Phoe
nix
Mill
s Re
al E
state
326
47,
220
12,
165
15,
674
5,6
34
7,7
98
2,2
04
3,4
70
15.2
24.0
168.
857
.521
.413
.62.
22.
212
.08.
711
.315
.48.
110
.1
DLF
Real
Esta
te21
7 3
85,7
21
83,
499
102
,193
2
8,52
9 3
6,26
2 8
,199
9
,484
4.
85.
67.
015
.745
.139
.01.
31.
320
.416
.22.
83.
25.
15.
4
Unite
ch Lt
dRe
al E
state
34 8
8,63
4 2
9,33
3 3
2,50
5 1
,662
3
,968
6
96
3,3
77
0.3
1.3
-66.
838
5.3
127.
426
.30.
80.
788
.536
.90.
62.
81.
12.
0
Ober
oi R
ealty
Real
Esta
te26
4 8
6,65
4 7
,985
1
6,87
5 4
,348
9
,435
3
,112
5
,749
9.
517
.5-3
8.4
84.8
27.8
15.1
2.0
1.8
19.0
9.8
7.1
12.0
7.1
13.5
Futu
re R
etai
lRe
tail
135
30,
414
116
,051
1
05,2
09
10,
674
9,8
90
(1)
182
0.
00.
8-1
00.2
171.
71.
01.
07.
88.
80.
00.
64.
64.
2
Shop
pers
Sto
pRe
tail
395
32,
883
37,
404
44,
506
737
1
,784
(7
64)
125
-9
.21.
562
9.7
-116
.3-4
2.9
262.
37.
77.
553
.922
.6-1
8.0
2.9
-6.5
2.4
Raym
ond
Ltd
Reta
il40
8 2
5,04
6 4
5,48
0 5
1,17
9 4
,799
5
,681
1
,429
1
,618
23
.326
.414
7.7
13.2
17.5
15.5
1.7
1.6
8.0
6.9
9.7
10.1
7.2
8.3
Bata
Indi
aRe
tail
1300
83,
543
20,
319
23,
404
2,8
87
3,7
21
1,6
77
2,3
58
26.1
36.7
-2.5
40.6
49.8
35.4
9.9
8.2
28.0
20.9
20.0
23.2
20.6
25.4
Tita
n Co
mpa
nyRe
tail
353
313
,078
1
09,2
74
125
,111
1
0,44
3 1
1,88
6 7
,347
8
,792
8.
39.
91.
419
.742
.635
.612
.69.
929
.925
.033
.031
.131
.228
.4
Tren
tRe
tail
1281
42,
570
23,
883
27,
319
95
984
3
19
631
9.
619
.039
.097
.913
3.6
67.5
4.3
4.0
478.
445
.23.
26.
02.
54.
8
Bhar
ti Ai
rtel
Tele
com
340
1,3
60,5
15
862
,528
9
62,6
25
278
,232
3
15,4
23
20,
626
54,
185
5.2
13.5
107.
216
2.7
66.0
25.1
2.5
2.1
7.0
5.8
3.6
8.5
4.7
6.6
Relia
nce
Com
mTe
leco
m14
6 3
01,8
64
218
,800
2
31,5
52
72,
850
76,
172
11,
370
10,
479
5.5
5.1
52.4
-7.8
26.5
28.8
1.1
1.1
9.7
8.6
4.2
3.7
4.3
3.7
Bhar
ti In
frate
lTe
leco
m27
0 5
10,3
11
65,
790
73,
406
43,
929
49,
327
15,
107
17,
791
8.0
9.4
51.0
17.8
33.8
28.7
2.8
2.8
12.9
9.7
8.4
9.8
7.3
8.0
Idea
Cel
lula
rTe
leco
m13
4 4
73,4
86
265
,189
3
05,2
94
83,
336
99,
943
18,
513
18,
821
5.2
5.3
71.7
1.7
25.5
25.1
2.9
2.1
8.0
7.6
11.2
8.5
7.1
6.3
OnM
obile
Glo
bal
Tele
com
38 4
,387
8
,970
1
0,36
1 1
,569
2
,207
2
41
626
2.
05.
1-5
2.1
159.
919
.47.
50.
50.
41.
60.
72.
45.
82.
65.
8
Tata
Com
mun
icatio
nTe
leco
m39
4 1
12,3
47
195
,596
2
13,5
51
30,
036
32,
762
352
2
,491
1.
28.
7-1
04.8
607.
731
9.2
45.1
14.1
-136
.76.
46.
84.
4-3
03.0
3.4
4.7
Note
: For
ban
ks, E
BITD
A is
pre-
prov
ision
pro
fit
Phill
ipC
apita
l Ind
ia C
over
age
Uni
vers
e: V
alua
tio
n Su
mm
ary

31GROUND ZERO GROUND ZERO 1 - 15 July 2014 1 - 15 July 2014 30
Disclosures and Disclaimers
PhillipCapital (India) Pvt. Ltd. has three independent equity research groups: Institutional Equities, Institutional Equity Derivatives and Private Client Group. This report has been prepared by Institutional Equities Group. The views and opinions expressed in this document may or may not match or may be contrary at times with the views, estimates, rating, target price of the other equity research groups of PhillipCapital (India) Pvt. Ltd.
This report is issued by PhillipCapital (India) Pvt. Ltd. which is regulated by SEBI. PhillipCapital (India) Pvt. Ltd. is a subsidiary of Phillip (Mauritius) Pvt. Ltd. References to "PCIPL" in this report shall mean PhillipCapital (India) Pvt. Ltd unless otherwise stated. This report is prepared and distributed by PCIPL for information purposes only and neither the information contained herein nor any opinion expressed should be construed or deemed to be construed as solicitation or as offering advice for the purposes of the purchase or sale of any security, investment or derivatives. The information and opinions contained in the Report were considered by PCIPL to be valid when published. The report also contains information provided to PCIPL by third parties. The source of such information will usually be disclosed in the report. Whilst PCIPL has taken all reasonable steps to ensure that this information is correct, PCIPL does not offer any warranty as to the accuracy or complete-ness of such information. Any person placing reliance on the report to undertake trading does so entirely at his or her own risk and PCIPL does not accept any liability as a result. Securities and Derivatives markets may be subject to rapid and unexpected price movements and past performance is not necessarily an indication to future performance.
This report does not have regard to the specific investment objec-tives, financial situation and the particular needs of any specific person who may receive this report. Investors must undertake independent analysis with their own legal, tax and financial advisors and reach their own regarding the appropriateness of investing in any securities or investment strategies discussed or recommended in this report and should understand that statements regarding future prospects may not be realized. In no circumstances it be used or considered as an offer to sell or a solicitation of any offer to buy or sell the Securities mentioned in it. The information contained in the research reports may have been taken from trade and statistical services and other sources, which we believe are reliable. PhillipCapital (India) Pvt. Ltd. or any of its group/associate/affiliate companies do not guarantee that such information is accurate or complete and it should not be relied upon as such. Any opinions expressed reflect judgments at this date and are subject to change without notice
Important: These disclosures and disclaimers must be read in conjunction with the research report of which it forms part. Receipt and use of the research report is subject to all aspects of these disclosures and disclaimers. Additional information about the issuers and securities discussed in this research report is available on request.
Certifications: The research analyst(s) who prepared this research report hereby certifies that the views expressed in this research report accurately reflect the research analyst’s personal views about all of the subject issuers and/or securities, that the analyst have no known conflict of interest and no part of the research analyst’s compensation was, is or will be, directly or indirectly, related to the specific views or recommen-dations contained in this research report. The Research Analyst certifies that he /she or his / her family members does not own the stock(s) covered in this research report.
Independence: PhillipCapital (India) Pvt. Ltd. has not had an investment banking relationship with, and has not received any compensation for investment banking services from, the subject issuers in the past twelve (12) months, and PhillipCapital (India) Pvt. Ltd does not anticipate receiving or intend to seek compensation for investment banking services from the subject issuers in the next three (3) months.
PhillipCapital (India) Pvt. Ltd is not a market maker in the securities mentioned in this research report, although it or its affiliates may hold either long or short positions in such securities. PhillipCapital (India) Pvt. Ltd does not hold more than 1% of the shares of the company(ies) covered in this report.
Suitability and Risks: This research report is for informational purposes only and is not tailored to the specific investment objectives, financial situation or particular requirements of any individual recipient hereof. Certain securities may give rise to substantial risks and may not be suitable for certain investors. Each investor must make its own deter-mination as to the appropriateness of any securities referred to in this research report based upon the legal, tax and accounting considerations applicable to such investor and its own investment objectives or strate-gy, its financial situation and its investing experience. The value of any security may be positively or adversely affected by changes in foreign exchange or interest rates, as well as by other financial, economic or political factors. Past performance is not necessarily indicative of future performance or results.
Sources, Completeness and Accuracy: The material herein is based upon information obtained from sources that PCIPL and the research analyst believe to be reliable, but neither PCIPL nor the research analyst represents or guarantees that the information contained herein is accurate or complete and it should not be relied upon as such. Opinions expressed herein are current opinions as of the date appearing on this material and are subject to change without notice. Furthermore, PCIPL is under no obligation to update or keep the information current.
Copyright: The copyright in this research report belongs exclusively to PCIPL. All rights are reserved. Any unauthorized use or disclosure is prohibited. No reprinting or reproduction, in whole or in part, is permit-ted without the PCIPL’s prior consent, except that a recipient may reprint it for internal circulation only and only if it is reprinted in its entirety.
Caution: Risk of loss in trading in can be substantial. You should carefully consider whether trading is appropriate for you in light of your experience, objectives, financial resources and other relevant circumstances.
For U.S. persons only: This research report is a product of Phillip-Capital (India) Pvt Ltd. which is the employer of the research analyst(s) who has prepared the research report. The research analyst(s) preparing the research report is/are resident outside the United States (U.S.) and are not associated persons of any U.S. regulated broker-dealer and therefore the analyst(s) is/are not subject to supervision by a U.S. broker-dealer, and is/are not required to satisfy the regulatory licensing requirements of FINRA or required to otherwise comply with U.S. rules or regulations regarding, among other things, communications with a subject company, public appearances and trading securities held by a research analyst account.
This report is intended for distribution by PhillipCapital (India) Pvt Ltd. only to "Major Institutional Investors" as defined by Rule 15a-6(b)(4) of the U.S. Securities andExchange Act, 1934 (the Exchange Act) and interpretations thereof by U.S. Securities and Exchange Commission (SEC) in reliance on Rule 15a 6(a)(2). If the recipient of this report is not a Major Institutional Investor as specified above, then it should not act upon this report and return the same to the sender. Further, this report may not be copied, duplicated and/or transmitted onward to any U.S. person, which is not the Major Institutional Investor.
In reliance on the exemption from registration provided by Rule 15a-6 of the Exchange Act and interpretations thereof by the SEC in order to conduct certain business with Major Institutional Investors, PhillipCapi-tal (India) Pvt Ltd. has entered into an agreement with a U.S. registered broker-dealer, Marco Polo Securities Inc. ("Marco Polo").Transactions in securities discussed in this research report should be effected through Marco Polo or another U.S. registered broker dealer

PBGROUND ZERO GROUND ZERO 1 - 15 July 2014 1 - 15 July 2014 32